the diverse applications of mass - scigig
TRANSCRIPT

THE DIVERSE APPLICATIONS OF MASS SPECTROMETRY
Brought to you by

See what you’ve been missing
AB Sciex is doing business as SCIEX. © 2018 AB Sciex. For research use only. Not for use in diagnostic procedures. The trademarks mentioned herein are the property of the AB Sciex Pte. Ltd. or their respective owners. AB SCIEX™ is being used under license.
Related to RUO-MKT-03-7587-A and RUO-MKT-13-7803-A
The powerful yet straightforward SCIEX Work�ow for MAM in the BioPharmaView™ Software 3.0 offers a single software solution for simpli�ed PQA de�nition, monitoring, quantitation, impurity testing and reporting. • Directly detect and measure biologically relevant attributes
with high-resolution LC-MS• Easily create customized calculations and attribute
acceptance criteria for accelerated data review• Track known variants or impurities
Detect and �ag the presence of unspeci�ed impurities
CESI-MS is used by BioPharma Leaders for the analysis of intact biologics such as monoclonal antibodies (mAbs) and Erythropoietin (EPO), peptide mapping, disulfide mapping, identification of post-translational modifications and antibody drug conjugates (ADCs).• Intact proteins: accurately characterized for product quality
and purity• Peptide mapping: 100% coverage and PTMs from one
digest and one analysis
Streamlined and Complete Work�ow for Multiple Attribute Methodology (MAM) using LC-MS
MAMWORKFLOW
BVTrack Quantify ReportPurity New Peaks
Biologics Analysis by CESI-MS
Learn More >
Learn More >
How Mass Spectrometry Has Changed the Cancer Diagnostics Game 4
How to Test for Heavy Metals in Cannabis 6
Steve Pennington on 10 Years of Proteomic Progress 8
Rapid Detection of Designer Drugs Presents Challenges for Law Enforcement and Forensic Toxicology 10
How Advances in Mass Spectrometry Are Helping the Food and Beverage Industry 12
Measuring How the Brain Metabolizes in Real-time 15
Mass Spectrometry’s Important Role in Identifying Explosives in the Environment 17
Mass Spectrometry in Biopharmaceutical Discovery 20
Helping Analytical Chemistry Embrace Big Data 23
Developing FTICR Mass Spectrometry Instruments with Unique Capabilities 25
Contents
The Diverse Applications of Mass Spectrometry
Foreword
In today’s world, the diversity of mass spectrometry instrumentation and applications thereof is simply mind-boggling. The mid to late 19th century heralded the emergence of the concept that later led to the development of mass spectrometers that could physically ‘weigh’ the mass of a molecule. Over the last 150 years, this analytical instrumentation has developed into the fascinating and remarkably diverse field of mass spectrometry (MS) with practical, modern-day applications covering a myriad of topics.
MS is used in forensics and anti-terrorism to analyze chemical warfare agents and explosives. These not only pose immediate danger to the safety and well-being of people; but can have long-term hazardous implications for humankind, wildlife and the ecosystem. MS also aids in monitoring drug abuse by assisting law enforcement in the rapid detection and identification of designer drugs and narcotics; and plays a key role in maintaining societal health by evaluating and ensuring the safety of food and beverages. Similarly, in the medicinal plant industry, heavy metal levels in cannabis are monitored by MS to guarantee the continued well-being of patients.
MS furthers our access to new, innovative therapeutic approaches to diagnose, monitor and treat disease. Applications include real-time monitoring of brain cell metabolism in animals for toxicological profiling and drug discovery. Other advances in MS not only provide information on higher-order protein structure, contaminating proteins and the in vivo behavior of emerging biotherapeutics; but also, on the efficacy and safety of these drugs. Furthermore, MS is used to understand aberrant signaling pathways for drug development, or to identify molecular signatures from the circulating proteome of a patient that can be exploited to overcome treatment resistance and relapse. Indeed, MS can now even guide surgeons in real-time to precisely resect cancerous tissue.
This eBook highlights the broad spectrum of applications that integrally utilize mass spectrometry. Such a powerful technique now spans diverse fields and has an extensive and far-reaching impact on society.

TechnologyNetworks.com4Technology Networks 2018
The Diverse Applications of Mass Spectrometry
How Mass Spectrometry Has Changed the Cancer Diagnostics GameCharya Wickremasinghe, PhD
With a history that spans one hundred years, mass spectrometry (MS) is one of the most widely used analytical techniques in bioscience and medical
research. Since the development of the first modern mass spectrometer in 19181, the technique has advanced steadily over time and found its way into a range of applications from forensic toxicology to cancer diagnostics. Bulky, expensive equipment that defined historical mass spectrometers are less common now, and have been replaced by faster, more sensitive, and cost-effective workflows. Newer spectrometers are also largely automated and user-friendly, making them more adaptable for clinical use.
Although histopathology is still the gold standard for diagnosing cancer, molecular analysis using MS has gained traction in the recent years for detecting tumors, monitoring progression, and even predicting treatment response.
MasSpec Pen Detects Cancer in Seconds and One-ups the iKnife
A hand-held device that connects to a mass spectrometer and identifies cancerous tissue during surgery hit the headlines last year, claiming to deliver results in ten seconds. Termed MasSpec Pen, the device contains a probe that can soak up molecules from human tissue and send to a mass spectrometer wheeled into the surgery room. Within a matter of seconds, molecular analysis by an ambient ionization MS technique indicates which areas of tissue are cancerous and should be removed by surgery. The device can also sample tissue non-destructively, offering an advantage over a similar device called iKnife that causes tissue damage due to electrocauterization.
In a test of 253 patients with lung, breast, thyroid or ovarian cancer, the MasSpec Pen was able to provide a tissue diagnosis with over 96 percent accuracy. Even in marginal regions that contained mixed tissue and cellular compositions, the device was able to detect cancer.
During development, researchers used a benchtop liquid chromatography-tandem mass spectrometry (LC-MS/MS) system with quadruple precursor ion selection, and high-resolution, accurate-mass (HRAM) Orbitrap detection.2 Since this is a large instrument that takes up considerable space in the surgery room, developers are already looking into getting reliable data from a more compact spectrometer.
Using Quantitative MS to Help Guide Lung Cancer Therapy
A team of researchers at the Virginia Commonwealth University lead by Professors Adam Hawkridge (Department of Pharmaceutics, School of Pharmacy) and David Gewirtz (Department of Pharmacology and Toxicology, School of
The Diverse Applications of Mass Spectrometry

The Diverse Applications of Mass Spectrometry
TechnologyNetworks.com5Technology Networks 2018
Medicine) are utilizing quantitative mass spectrometry to uncover clues related to treatment resistance and relapse of non-small cell lung cancer (NSCLC).
“Mass spectrometry can be used on a number of levels to better understand NSCLC signaling pathways for drug development, or to identify molecular signatures that can be exploited to overcome NSCLC treatment resistance,” says Hawkridge. “For example, in our most recent LC-MS/MS study of treatment resistance, we found that senescence – rather than autophagy – associated proteins were more prominently secreted in the treatment resistant-cells in response to ionizing radiation.”
In a previous study by Hawkridge’s team, LC-MS/MS analysis allowed the identification of 364 secreted proteins that could be further studied for their potential diagnostic value as a function of p53 expression, irradiation, and functional autophagy status in the context of NSCLC.3 The lead author of the study, Dr. Emmanuel Cudjoe, explained that cancer cells respond to stress by activating a process called autophagy in which organelles are recycled and energy production is maintained, leading to tumor growth, therapeutic resistance and relapse.
“Where autophagy contributes to treatment resistance, inhibition can restore tumor sensitivity to chemo/radiotherapy. Our long-term goal is to identify molecular signatures and pathways of autophagy that can be targeted to improve the sensitivity to radiotherapy,” Cudjoe adds.
MS-based Test Helps to Select the Right Patients for the Right Type of Immunotherapy
For treating patients with metastatic melanoma, there are several different types of immunotherapeutic regimens available, including mono-therapies and combinations of immune-checkpoint inhibitors. However, selecting and optimizing the right treatment choice for each patient is challenging. To assist in treatment selection, a new MS-based blood test was developed by Biodesix, Inc. in collaboration with scientists from the NYU Langone Medical Center, New York, Yale University School of Medicine, New Haven, and the Massachusetts General Hospital, Boston.
“We developed an anti-programmed cell death protein-1 (PD-1) melanoma blood test using a machine learning platform with a combination of clinical outcome data and expression data of circulating proteins based on mass spectral analysis,” says Dr. Heinrich Röder, Chief Technology Officer at Biodesix. “We’ve shown this test to predict survival in patients receiving PD-1 inhibitors. It can also identify patients who are resistant to monotherapy, but may in fact benefit from combination immunotherapy instead.”
Scientists at Biodesix input data acquired from Matrix Assisted Laser Desorption/Ionization Time-of-Flight (MALDI-ToF) mass spectrometry into a machine learning platform for multivariate test design.4 “MALDI allows us to take a real-time snapshot of a patient’s circulating proteome, which is derived from the tumor, tumor microenvironment, and normal host tissue. These proteins have direct regulatory effects on the immune system, especially the interplay of the innate and adaptive system,” Röder explains. “We do not need to choose proteins based on pre-conceived notions of relevance, as one has to do in fixed panel approaches, and hence can observe effects that are often missed.”
Biodesix uses a special MALDI-ToF method for protein analysis, termed Deep MALDI™, which is aimed at reducing the noise in mass spectral data by increasing the number of laser shots. “With this method, we can measure more proteins in a robust and reproducible way with a high sample throughput and small sample volume,” says Röder. “We also experience a much wider coverage of reliably detectable proteins and peptides compared to traditional MALDI-ToF.”
Although Deep MALDI can function across an abundance range of 4-5 orders of magnitude, it struggles to pick up very low abundance proteins outside the range of the classical plasma proteome. Other limitations of the method include reduced sensitivity at masses higher than 30kDa, and low resolution of proteins that are very close in mass/charge ratio. Röder’s team is currently working on improving this technology and expanding it to investigate immunotherapy responses in other types of cancer such as NSCLC.
Future of MS-based Proteomics
With the advent of increasingly sophisticated technologies, MS instruments are becoming faster and more sensitive with respect to molecular characterization. Hawkridge believes that advances in analytical figures of merit will drive new molecular insight in areas such as protein post-translational modifications (e.g., glycosylation). He elaborates, “As genomic sequencing becomes more prevalent, these genetic perturbations are being incorporated into the proteomics databases for additional levels of data analysis. That is just a small sampling of the untapped potential of mass spectrometry-based cancer proteomics.”
References1. A. J. Dempster, Phys. Rev. 11, 316–325. (1918) 2. J. Zhang et al., Sci. Transl. Med. 9, (2017) 3. E. K. Cudjoe et al., Cancer Res. 77, 227–227. (2017) 4. J. S. Weber et al., Cancer Immunol. 6, 79–86. (2018)

TechnologyNetworks.com6Technology Networks 2018
The Diverse Applications of Mass Spectrometry
How to Test for Heavy Metals in CannabisMike May, PhD
Cannabis collects heavy metals. It “absorbs heavy metals from the soil, water and air,” says Bob Clifford, general manager at Shimadzu Scientific Instruments. These
elements—arsenic, cadmium, lead, mercury and others—can trigger a range of health problems, including cancer and heart disease. Although cannabis for human consumption or smoking should be as free from heavy metal contamination as possible, that’s not always the case. When Sammy Hagar wrote “sparks fly in the middle of the night,” little did he know that this line could describe not just heavy-metal music, but the concerns of testing of cannabis for these elements.
Today’s ‘sparks’ fly around the need and necessary extent of testing cannabis for heavy metals. “Heavy-metal contamination will vary from farm to farm and different strains will have different uptake rates of metals, thus the importance of testing,” Clifford explains.
Regardless of where cannabis comes from, it can include heavy metals. “All agricultural products, including cannabis, contain some amount of heavy metals,” says GenTech Scientific. “The use of things such as fertilizers and pesticides in agricultural applications increase the abundance of these metals in soils and water.”
Beyond coming from natural sources and agricultural methods, heavy metals can infiltrate cannabis-based products in other
ways. As an example, GenTech Scientific notes: “Contamination can also occur during the processing of cannabis.”
Despite the wide range of potential sources of heavy metals, it is not inevitable that every cannabis sample includes these elements—at least not at high levels. “With the correct atmosphere, clean soil and water, and limited use of pesticides and fertilizers, you can keep your levels below the acceptable safe limit,” according to GenTech Scientific. Nonetheless, this company adds, “It is important for growers to monitor the levels to ensure their products are in compliance with their state’s regulatory guidelines.” And those can vary considerably.
Where regulators do require testing cannabis for heavy metals, the list usually includes arsenic, cadmium, lead and mercury. “Other states, like Maryland, include additional elements to be tested for such as barium, chromium, selenium and silver,” Clifford says.
Testing Tools
Cannabis can be tested for heavy metals in many ways, such as various forms of atomic spectrometry, including atomic absorption (AA), inductively coupled plasma optical emission spectroscopy (ICP-OES) and inductively coupled plasma mass spectrometry (ICP-MS). “For AA, the method used would have to be the more sensitive graphite furnace atomic absorption—GFAA—since the flame AA method would not be sensitive enough for most elements,” Clifford explains. “Also, mercury must be measured by a method called cold vapor atomic absorption spectroscopy—CVAAS—due to poor sensitivity by AA.”
In general, flame techniques can measure elements at low parts per million, and GFAA goes down to low parts per billion. “Also, the AA method usually measures one element at a time,” Clifford says. “ICP and ICP-MS are techniques capable of measuring multiple elements simultaneously.” Nonetheless,
The Diverse Applications of Mass Spectrometry
The Diverse Applications of Mass Spectrometry
TechnologyNetworks.com7Technology Networks 2018
using ICP to test cannabis for heavy metals, often requires a way to enhance its sensitivity, such as introducing the sample with an ultrasonic nebulizer (USN). “The USN can increase sensitivity up to a factor of 10,” Clifford says.
From Aeos Labs, analytical chemist Anya Engen says, “ICP-MS offers the best sensitivity and is the method used in our lab.” She adds, “The FDA and United States Pharmacopeia have standardized methods for heavy-metals analysis, which are very useful resources in the fledgling cannabis-testing industry, where regulation is slow to catch up.”
To test for arsenic, scientists often need special sample preparation, such as liquid chromatography (LC), because arsenic can be in inorganic or organic forms. The inorganic form is more toxic. “If one wants to test for the different forms, LC-ICP-MS is utilized to separate and detect the different compounds,” Clifford says. “States currently only require total arsenic, so speciation of this compound is not required.”
Tomorrow’s Testing
Not all regulators even require heavy-metals testing for cannabis at the moment. “We test for heavy metals in the USA’s food supply system, enforced by FDA and USDA, so why would we
not test for other consumed products like cannabis, especially when involving immune-compromised patients?” Clifford asks. “There needs to be federal oversight of testing for heavy metals, as well as pesticides, residual solvents, mycotoxins and other contaminates so testing is harmonized throughout the United States.”
When asked if any testing improvements would be useful, Engen says, “Measuring heavy-metal levels in the soil and water where cannabis is grown and correlating the data to cannabis-generated data would be helpful in illustrating an overview of possible contamination sources.” She adds, “Being in Hawaii with an active volcano, the heavy metals produced and dispersed by the volcano is a possible source of contamination in Hawaii-grown cannabis.”
Without testing cannabis for heavy metals, sparks could fly from more than guitars as customers insist increasingly on safe, tested products.
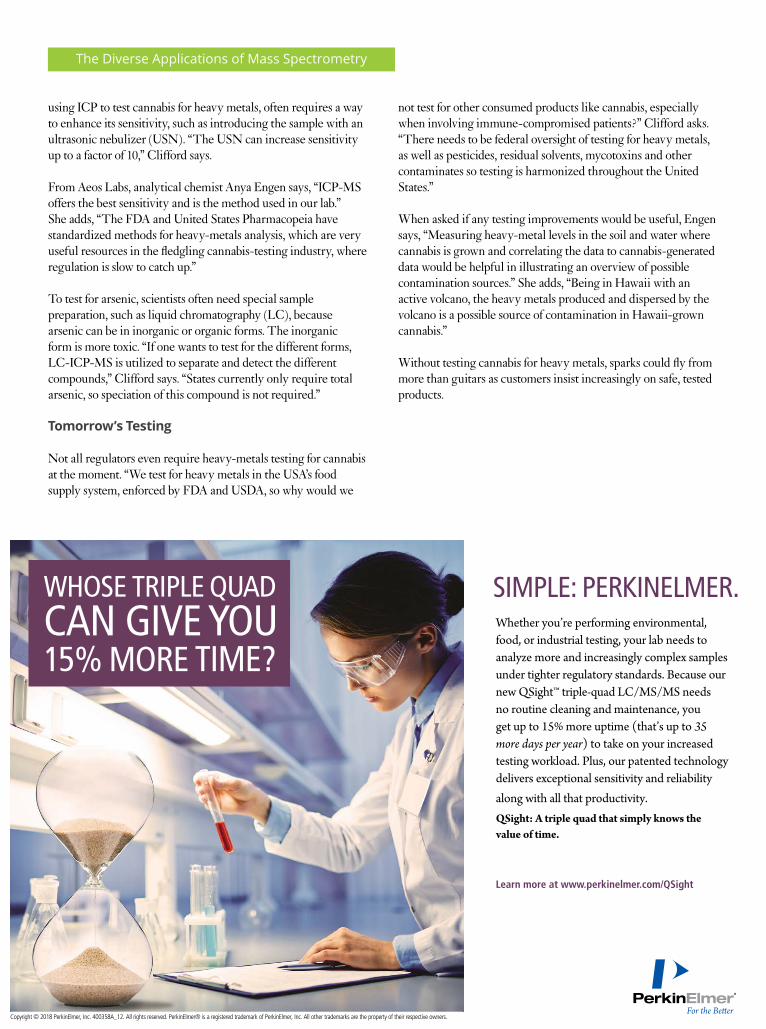
WHOSE TRIPLE QUAD CAN GIVE YOU 15% MORE TIME?
Copyright © 2018 PerkinElmer, Inc. 400358A_12. All rights reserved. PerkinElmer® is a registered trademark of PerkinElmer, Inc. All other trademarks are the property of their respective owners.
SIMPLE: PERKINELMER.Whether you’re performing environmental, food, or industrial testing, your lab needs to analyze more and increasingly complex samples under tighter regulatory standards. Because our new QSight™ triple-quad LC/MS/MS needs no routine cleaning and maintenance, you get up to 15% more uptime (that’s up to 35 more days per year) to take on your increased testing workload. Plus, our patented technology delivers exceptional sensitivity and reliability along with all that productivity. QSight: A triple quad that simply knows the value of time.
Learn more at www.perkinelmer.com/QSight
TechnologyNetworks.com8Technology Networks 2018
The Diverse Applications of Mass Spectrometry
Steve Pennington on 10 Years of Proteomic ProgressRuairi MacKenzie
Steve Pennington, Professor of Proteomics at University College Dublin, has spent over 35 years in research. Focusing on using mass spectrometry to measure and
characterize proteins, Steve has made contributions not only in his 80+ published papers, but also as part of the editorial board of the Journal of Proteomics and other journals, and as the lead organizer of the Human Proteome Organization’s (HUPO) World Congress held in Dublin in 2017. We asked Steve how the field of mass spectrometry has advanced in the last decade of research.
Q: Just over ten years ago you co-authored a paper entitled Guidelines for the Next 10 Years of Proteomics. We’re just about 12 years on from that paper - what predictions did you make back then and how accurate were you?
A: I recently went back and had a careful re-read of the paper and I think rather than attempting to predict the future of proteomics, the paper was reporting a summary of where things had got up to,
as well as where some of the issues and limitations lay, and maybe how those limitations could be addressed by producing some guidelines for the next 10 years. It wasn’t really predicting what might happen in the next 10 years.
And it’s been really interesting to look back to see what has happened because I guess when you’re involved in the developments day by day and always looking forward, it may seem that not a lot is happening. So, when you get the opportunity to review the last 10 years, it’s apparent that there have been remarkable changes. Maybe not as remarkable as we would have liked them to be, but still pretty significant.
I think one of the key things the paper was really trying to push was the development of standards and guidelines for proteomics that would allow greater reproducibility and greater confidence in the data that was coming from proteomics studies. And in the last 10 years there’s been a huge effort in that area, such that we are now at a position where, when proteomics experiments are designed and done properly, which they are in a good proportion of the field, the data that we get from them is really robust and reliable.
The Human Proteome Organization (HUPO) has been instrumental in driving the developments of those guidelines. That’s been supported, and in many instances, accelerated by some of the key journals in the field. And so, we have reached the position now where standards for the design and execution of experiments and also, importantly, the analysis of the data have reached a stage where they do provide reliable, reproducible data.
That may not sound like a major advance, but in terms of being able to build from the proteomics discoveries that have been made, and convert them into useful applications, it’s been fundamentally important.
These developments have been happening in parallel with, I suppose, a general concern about the reproducibility of biological studies and cancer research. In the last 10 years and relatively
The Diverse Applications of Mass Spectrometry
TechnologyNetworks.com9Technology Networks 2018
recently, some high profile publications have reported that fairly large numbers of studies, particularly in the drug discovery arena, have not been very reproducible. Notably, drug discovery and development companies have found it difficult to reproduce studies that are reported in the literature.
So, I think getting to reproducibility has been a very significant step forward and for me one of the take-home messages from the HUPO 2017 meeting was, that over the last 10 years the technology has advanced, and as importantly, the reliability of the data that’s being produced from the technology has also.
Q: I am regularly contacted about publishing content on data integrity, for example, on a new integrity pipeline or project. In that 10-year period, what are the particular projects or advancements that have improved data integrity within proteomics?
A: I think if, as we now do, you have standards that need to be met for publication of data, a checklist of the journal’s requirements for submitting data, that has knock-on effects for the generation of the data. The development of transparent databases, like the PRIDE and PeptideAtlas databases which are large repositories of data, has meant that others are readily able to reanalyze the raw data that’s been produced in adherence to the standards.
I suppose it’s human nature - when you know that your data is potentially going to be scrutinized by others, there becomes a greater emphasis at home in making sure that that data is robust and reliable.
Q: What about quantity, as well as quality? Have technological advances had a big impact on the amount of data produced?
A: Absolutely. So, 10 years ago, one of the bedrock technologies of proteomics was the use of 2D gels, relatively slow-throughput and producing modest amounts of data. This has largely been superseded by doing LC/MS, both bottom-up and top-down, but mainly bottom-up, where very complex protein mixtures are digested into peptides and those peptides (10’s of 1,000’s from a single sample) are analysed in the mass spectrometer. And so, there are very, very large data sets.
In the last few years, there’s been the development of an approach where the data is acquired in the mass spectrometer in a fully comprehensive data-independent acquisition mode. So, whereas in the past, the mass spectrometer would, in real time, make some decisions about what peptides to fragment and get data from, the current trend is to take every peptide that’s put into the mass spectrometer and fragment it and acquire data from it, in a completely unbiased, comprehensive manner.
Obviously, the data sets that come out of this approach are significantly richer in terms of the amount of information produced. They’re also more challenging in terms of the interpretation of the data, but then great tools are being developed for analyzing these complex data sets.
We’ve moved on from situations, I think, where if you put one sample into the mass spectrometer and you did that at least three times, you would get overlapping data but there would be differences in the data obtained from the three separate mass spectrometry runs, and that’s with large amounts of data. Now, there’s greater confidence because you’re doing that comprehensively and the same every time, so there’s a larger amount of data and it’s almost completely overlapping between the runs. And this comprehensive approach can be viewed, if you like, almost as a permanent record of that sample, the proteome of the sample.
Q: If you were going to speculatively write another review looking forward 10 years, do you think you’d be able to do that, or is the field moving too fast now?
A: Yes, I think we could do it and I’m hoping to take that opportunity during the HUPO Congress in 2018. I think it would be really interesting and valuable to have a multi-authored article that looks carefully at what we’ve achieved in the last 10 years and what the future holds; current limitations and future opportunities.
I’m particularly excited about the future. I haven’t really touched on it much, on some of the work that’s being done on taking the now very comprehensive biomarker discovery data sets that have been generated and converting those into multiplex targeted protein assays with the aim that these will become the advanced diagnostic tests of the future to support precision medicine.
We know that diseases are very heterogenous and complex and that there’s a lot of patient heterogeneity, and so the ability in the future to be able, in an analytical robust way, measure multiple (100’s of) proteins, means that we have a great opportunity to develop new, more sophisticated diagnostic tests. More importantly, it is possible that these new diagnostic tests will exploit the developments in targeted mass spectrometry on triple quadrupole mass spectrometers that have been made over the last several years. Together, new tests and instrumentation mean that more sophisticated tests will be delivered to clinical diagnostics for patient benefit. For me that’s exciting and highly motivating.
Steve Pennington was speaking to Ruairi MacKenzie, Science Writer for Technology Networks.
TechnologyNetworks.com10Technology Networks 2018
The Diverse Applications of Mass Spectrometry
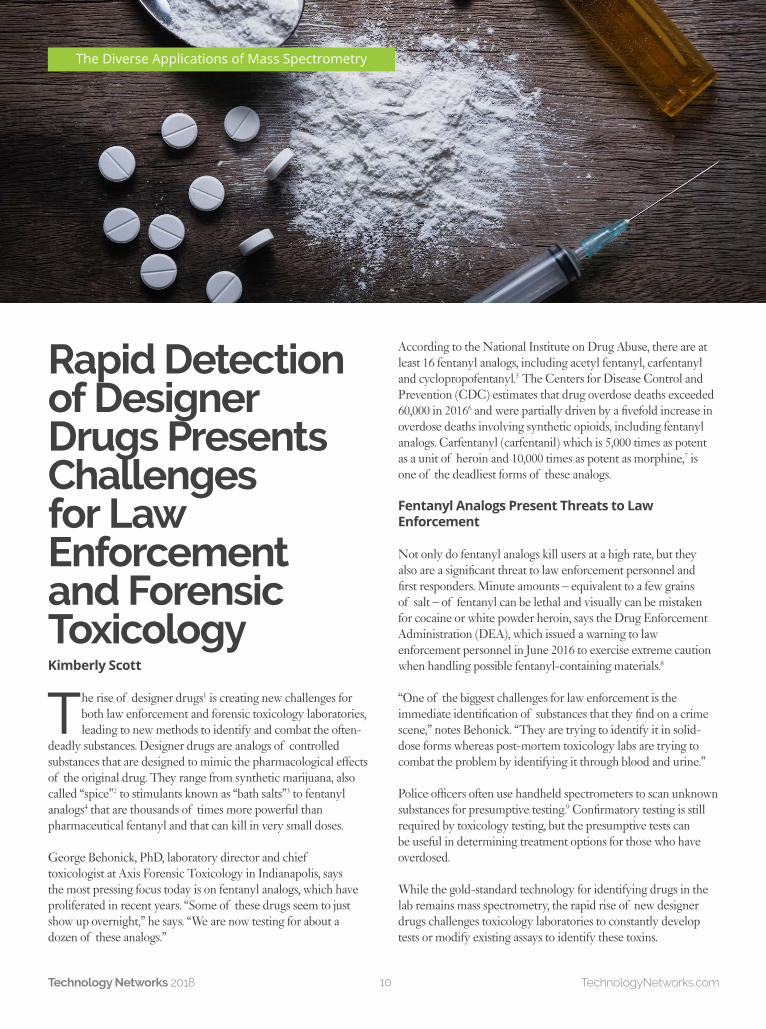
Rapid Detection of Designer Drugs Presents Challenges for Law Enforcement and Forensic ToxicologyKimberly Scott
The rise of designer drugs1 is creating new challenges for both law enforcement and forensic toxicology laboratories, leading to new methods to identify and combat the often-
deadly substances. Designer drugs are analogs of controlled substances that are designed to mimic the pharmacological effects of the original drug. They range from synthetic marijuana, also called “spice”2 to stimulants known as “bath salts”3 to fentanyl analogs4 that are thousands of times more powerful than pharmaceutical fentanyl and that can kill in very small doses.
George Behonick, PhD, laboratory director and chief toxicologist at Axis Forensic Toxicology in Indianapolis, says the most pressing focus today is on fentanyl analogs, which have proliferated in recent years. “Some of these drugs seem to just show up overnight,” he says. “We are now testing for about a dozen of these analogs.”
According to the National Institute on Drug Abuse, there are at least 16 fentanyl analogs, including acetyl fentanyl, carfentanyl and cyclopropofentanyl.5 The Centers for Disease Control and Prevention (CDC) estimates that drug overdose deaths exceeded 60,000 in 20166 and were partially driven by a fivefold increase in overdose deaths involving synthetic opioids, including fentanyl analogs. Carfentanyl (carfentanil) which is 5,000 times as potent as a unit of heroin and 10,000 times as potent as morphine,7 is one of the deadliest forms of these analogs.
Fentanyl Analogs Present Threats to Law Enforcement
Not only do fentanyl analogs kill users at a high rate, but they also are a significant threat to law enforcement personnel and first responders. Minute amounts – equivalent to a few grains of salt – of fentanyl can be lethal and visually can be mistaken for cocaine or white powder heroin, says the Drug Enforcement Administration (DEA), which issued a warning to law enforcement personnel in June 2016 to exercise extreme caution when handling possible fentanyl-containing materials.8
“One of the biggest challenges for law enforcement is the immediate identification of substances that they find on a crime scene,” notes Behonick. “They are trying to identify it in solid-dose forms whereas post-mortem toxicology labs are trying to combat the problem by identifying it through blood and urine.”
Police officers often use handheld spectrometers to scan unknown substances for presumptive testing.9 Confirmatory testing is still required by toxicology testing, but the presumptive tests can be useful in determining treatment options for those who have overdosed.
While the gold-standard technology for identifying drugs in the lab remains mass spectrometry, the rapid rise of new designer drugs challenges toxicology laboratories to constantly develop tests or modify existing assays to identify these toxins.
The Diverse Applications of Mass Spectrometry
The Diverse Applications of Mass Spectrometry
TechnologyNetworks.com11Technology Networks 2018
“The challenge for us is in developing new methods for these emerging drugs in biological matrices which are inclusive of the pre-analytical phase, the analytical phase and the post-analytical management and interpretation of data,” says Behonick.
QTOF Detects Fentanyl Analogs in Minute Quantities
SCIEX’s X500R QTOF (quadrupole time-of-flight) is among the current generation of mass spectrometers that can detect fentanyl analogs in minute quantities. Introduced in 2015, the X500R uses high-resolution MS technology to detect illicit substances down to the picogram level, which can then be cross-referenced through ChemSpider, a chemical structure database.
Phil Taylor, global marketing manager, food, environment and forensics for SCIEX, sees mass spectrometry technology moving from nominal mass instrumentation, such as the triple quadrupole instrumentation, to more advanced platforms that will provide a higher level of detail than previous technology.
“The pursuit in forensic toxicology is accuracy,” says Taylor. “The demand from the judicial system is for accurate and concise results. That’s what’s driving the market.”
Advancements in Rapid Detection of Fentanyl Analogs
According to a study published in Forensic Chemistry in June 2017,10 advancements are also being made in using thermal desorption direct analysis in real time mass spectrometry (TD-DART-MS) and ion mobility spectrometry (IMS) as tools for the rapid and sensitive (nanogram to picograms) detection of fentanyl, 16 fentanyl analogs and five additional opioids (heroin, U-47700, buprenorphine, methadone and naloxone).
TD-DART-MS is sensitive to picogram levels of a wide range of illicit drugs, reports the study by NIST researchers, noting that these instruments have potential applications in mobile laboratories, emergency vehicles and hospitals.
“Current guidelines recommend an enzyme-linked immunosorbent assay (ELISA) screen for fentanyl followed by gas chromatography/mass spectrometry (GC/MS) analysis,” write the study authors. “As NPF concentrations in blood can be quite low, a wipe-based technique, such as TD-DART-MS targeting solid trace contamination on the individual or their belongings, may be a more effective approach. TD-DART-MS may also be useful in emergency medicine, providing a rapid identification of the specific NPF to make informed choices about treatment.”
IMS instruments are commonly used in airports, where a security officer might swab a piece of luggage or a passenger’s hands, and then insert the swab into the instrument to check for traces of explosive residue.
“Currently, police officers have to handle drugs to test them,” says Edward Sisco, a research chemist at NIST and one of the lead authors of the NIST study. “But with these technologies, they can just swab the outside of the bag to test for fentanyl.” If the test comes back positive, they can take extra precautions.
IMS instruments cost around $25,000 and are about the size of a microwave oven, small enough to be transported by a mobile hazmat unit. TD-DART-MS instruments, which are more sensitive but larger and more expensive, could potentially be used for screening incoming material at a forensic lab before it is handled by evidence examiners.
NIST was the first to publish the IMS and TD-DART-MS signatures for the 16 fentnyl analogs tested. According to NIST, Sisco and his co-authors are speaking with IMS manufacturers about adding the newly identified signatures to their product software.11
“We hope this makes a real difference to the people who come into contact with synthetic opioids,” says Sisco. “The opioid epidemic is a huge problem. This might be one small way to try to get a handle on it.”
References1. The New Wave of Designer Drugs: A Review for Criminal Justice
and Forensic Professionals. Link: https://bit.ly/2JtwzWH 2. National Institute on Drug Abuse; Synthetic Cannabinoids (K2/
Spice). Link: https://bit.ly/2uhrZhG 3. National Institute on Drug Abuse; Synthetic Cathinones (“Bath
Salts”). Link: https://bit.ly/22Dcs8e 4. Drug Enforcement Agency; Fentanyl FAQs. Link: https://bit.
ly/2KSidMM 5. National Institute on Drug Abuse; Emerging Trends and Alerts.
Link: https://bit.ly/29J2oFb 6. CDC; Drug Overdose Deaths in the United States, 1999–2016.
Link: https://bit.ly/2pcubtA 7. Comparing the Lethality and Potency of Opioid Drugs. Link:
https://bit.ly/2JrDzDj 8. Drug Enforcement Agency; DEA Warning to Police and Public:
Fentanyl Exposure Kills. Link: https://bit.ly/1rh3kbt 9. Powerful Detection Technology for Powerful New Street Drugs.
Link: https://bit.ly/2iTLqtr 10. E. Sisco et al., Forensic Chemistry. 4, 108–115. (2017)11. Fentanyl Can Sicken First Responders. Here’s a Possible Solution.
Link: https://bit.ly/2Bpo9bj

TechnologyNetworks.com12Technology Networks 2018
How Advances in Mass Spectrometry Are Helping the Food and Beverage IndustryDr Jenny Nelson, Assistant Adjunct Professor of Viticulture & Enology at the University of California, Davis, and Applications Scientist at Agilent Technologies.
Karen Steward, PhD
Mass spectrometry is an important tool for many industries, not least in ensuring the safety of our food and beverages. Hazards ranging from pesticides, to heavy metals and
toxins can be identified using the technology, even if they are only present in minute quantities. Here Jenny Nelson tells us how advances in mass spectrometry (MS) have improved analysis potential and the important role it has played and will continue to play in ensuring the safety of the beverage industry.
Q: What advances in MS have had the biggest impact on your research?
A: Inductively coupled plasma triple quadrupole mass spectrometry (ICP-QQQ ) has been a game changer. ICP-QQQ provides MS/MS capability which means we can remove spectral interferences with increased reliability and effectiveness through more controlled chemical reactions. MS/MS improves detection
limits across the board, as well as providing access to isotopes and elements that we couldn’t measure before with conventional quadrupole ICP-MS instruments.
Q: A lot of your recent work has focused on the beverage industry, could you tell us about some of the projects you have been involved in?
A: Our two most recent projects working on beverages have been with the Food and Drug Administration (FDA) studying arsenic speciation in wine. Arsenic exists in multiple forms in foods and beverages and not all forms have the same toxicity. The inorganic forms of arsenic (As(III) (arsenite) and As(V) (arsenate)), are the most toxic. Inorganic arsenic species are categorized as class 1 carcinogens. The FDA has established an action limit for inorganic arsenic in apple juice of 10 μg/kg (ppb), however, there are no regulations controlling the arsenic content of wine in the US. There are limits however in the EU and Canada. Europe (International Organisation of Vine and Wine, OIV) have set maximum acceptable limits for total arsenic in wine of 100 µg/L (ppb), and Canada (Vintners Quality Alliance VQA, Ontario) have set a limit of 200 µg/L (ppb). The first project was to extend the existing HPLC-ICP-MS method for determination of four arsenic species in fruit juice - US FDA Elemental Analysis Manual (EAM) 4.10 - to include wine. This work was recently published1 in the Journal of Agricultural and Food Chemistry. The second was to develop an arsenic speciation method 10× faster than the current FDA 4.10 regulatory method. The methodology used in this study analyzed the inorganic arsenic species in the As(V) form. As(III) was intentionally oxidized to As(V) with hydrogen peroxide before analysis. By converting As(III) and analyzing all inorganic species as As(V), this method was able to separate from the other arsenic species monomethylarsonic acid (MMA) and dimethylarsinic acid (DMA). The total separation time was less than 2 minutes. This study2 utilized oxygen reaction gas in the collision/reaction cell (CRC) of the ICP-QQQ to resolve the spectral interferences on arsenic. Some of the interesting results to readers would be the data on the market basket study.
The Diverse Applications of Mass Spectrometry
The Diverse Applications of Mass Spectrometry
TechnologyNetworks.com13Technology Networks 2018
Q: What are the biggest challenges you face when applying mass spectrometry to food and beverage analysis?
A: Historically, the perception of ICP-MS has been that it is complicated and difficult to use, presenting its own set of challenges in the application of mass spectrometry to food and beverage analysis. However, modern ICP-MS instruments are much more user-friendly, with built-in auto-optimization and diagnostics capabilities. ICP-MS now provides analytical possibilities that extend the lab’s capability beyond what’s offered by the more traditional techniques we previously used.
In fact, ICP-MS greatly simplifies the analysis of foodstuffs, compared to the traditional analytical approaches. This would typically have involved AAS or ICP-OES for the major and nutrient elements, graphite furnace AAS for the toxic and trace elements, and a dedicated analyzer for mercury. All these analytes can now be measured – at much lower detection limits – in a single, fast, practically interference free ICP-MS measurement. So, the potential sample throughput with ICP-MS is much greater than before, and the cost per analysis is far lower. Plus, the method simplification in terms of sample preparation, calibration strategy, QC overheads, reporting, waste disposal etc., gives concrete benefits especially in commercial food labs.
Q: How do you think developments in mass spectrometry are likely to change the food and beverage industry in the future?
A: The removal of spectral interference provided by the ICP-QQQ system through MS/MS, has really changed things in the
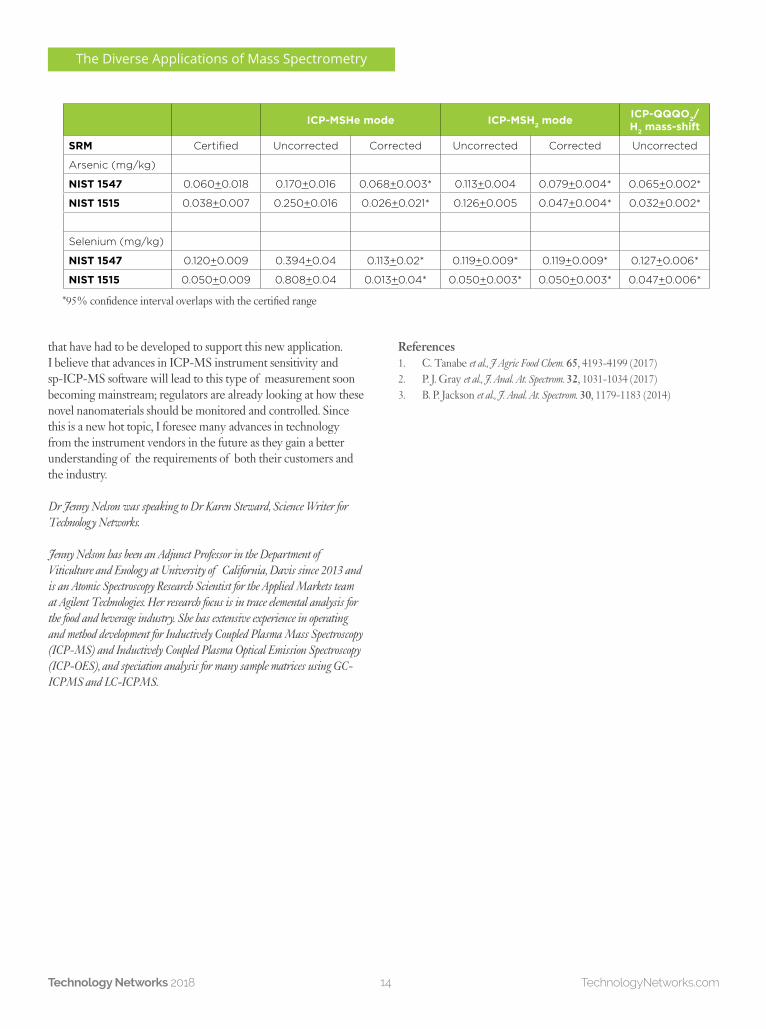
world of ICP-MS, enabling us to now develop methods around elements/metals that used to be challenging. One good example of this was a collaboration where we worked with Brian Jackson at Dartmouth University. The aim of this study3 was to accurately measure arsenic and selenium in foods using Triple Quadrupole ICP-QQQ to remove doubly charged rare earth element (REE) interferences. REE levels in food samples are low, but crops grown in REE-enriched soils have the potential to have higher concentrations of these elements, leading to false positives for arsenic and selenium. It is known that arsenic and selenium can be difficult to quantify accurately by conventional single quadrupole ICP-MS, especially at low levels. This is because isotopes can suffer from multiple spectral interferences, from doubly charged ions of the REE (REE++), as well as polyatomic ions formed from the sample matrix and plasma. A quadrupole mass spectrometer separates ions based on mass-to-charge ratio (m/z), and so the REE++ ions appear at half their true mass, overlapping the singly charged analyte ions of arsenic and selenium. This table shows a comparison of single quadrupole (SQ) and triple quadrupole ICP-MS results for arsenic and selenium in food reference materials. Significant errors in the (uncorrected) single quadrupole results meant that correction equations had to be applied to improve the accuracy. Triple quadrupole ICP-MS provides better accuracy without requiring any correction equations, illustrating an important advantage of ICP-QQQ data vs. traditional SQ ICP-MS for this type of interference.
Additionally, analysis of nanoparticles in food is an emerging application, the development of which has greatly benefited from the advances in single particle inductively coupled plasma-mass spectrometry (sp-ICP-MS). As well as advances in the hardware in the ICP-MS, there have also been new software capabilities
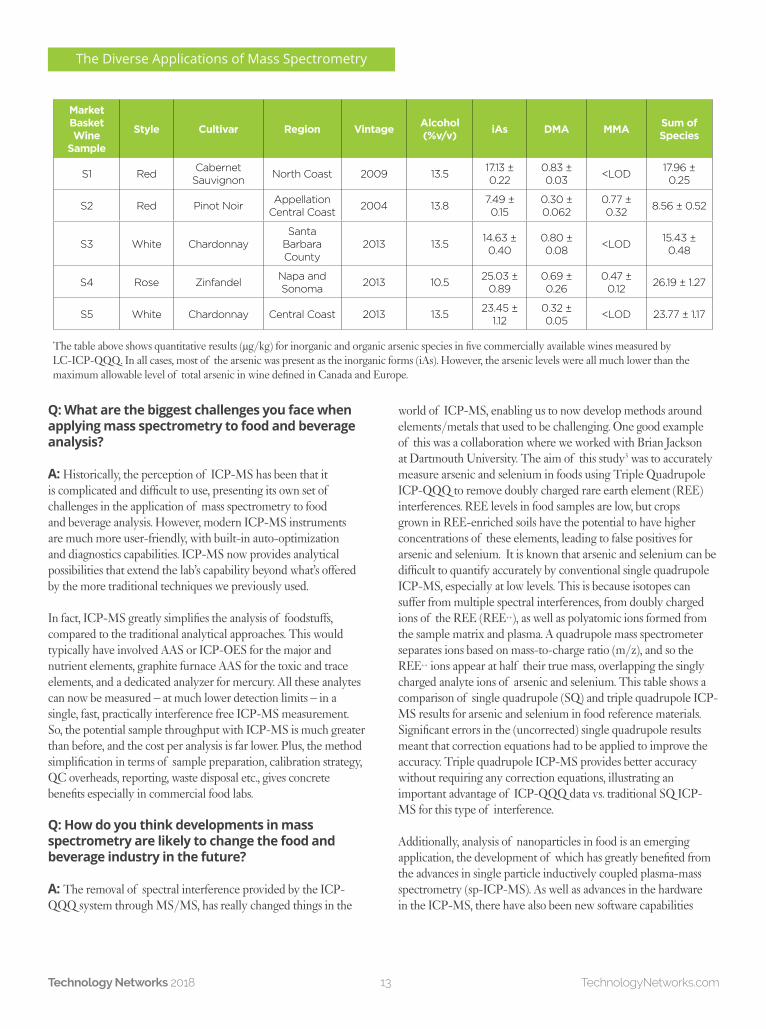
Market Basket Wine
Sample
Style Cultivar Region Vintage Alcohol (%v/v) iAs DMA MMA Sum of
Species
S1 Red Cabernet Sauvignon North Coast 2009 13.5 17.13 ±
0.220.83 ± 0.03 <LOD 17.96 ±
0.25
S2 Red Pinot Noir Appellation Central Coast 2004 13.8 7.49 ±
0.150.30 ± 0.062
0.77 ± 0.32 8.56 ± 0.52
S3 White ChardonnaySanta
Barbara County
2013 13.5 14.63 ± 0.40
0.80 ± 0.08 <LOD 15.43 ±
0.48
S4 Rose Zinfandel Napa and Sonoma 2013 10.5 25.03 ±
0.890.69 ± 0.26
0.47 ± 0.12 26.19 ± 1.27
S5 White Chardonnay Central Coast 2013 13.5 23.45 ± 1.12
0.32 ± 0.05 <LOD 23.77 ± 1.17
The table above shows quantitative results (µg/kg) for inorganic and organic arsenic species in five commercially available wines measured by LC-ICP-QQQ. In all cases, most of the arsenic was present as the inorganic forms (iAs). However, the arsenic levels were all much lower than the maximum allowable level of total arsenic in wine defined in Canada and Europe.
The Diverse Applications of Mass Spectrometry
TechnologyNetworks.com14Technology Networks 2018
that have had to be developed to support this new application. I believe that advances in ICP-MS instrument sensitivity and sp-ICP-MS software will lead to this type of measurement soon becoming mainstream; regulators are already looking at how these novel nanomaterials should be monitored and controlled. Since this is a new hot topic, I foresee many advances in technology from the instrument vendors in the future as they gain a better understanding of the requirements of both their customers and the industry.
Dr Jenny Nelson was speaking to Dr Karen Steward, Science Writer for Technology Networks.
Jenny Nelson has been an Adjunct Professor in the Department of Viticulture and Enology at University of California, Davis since 2013 and is an Atomic Spectroscopy Research Scientist for the Applied Markets team at Agilent Technologies. Her research focus is in trace elemental analysis for the food and beverage industry. She has extensive experience in operating and method development for Inductively Coupled Plasma Mass Spectroscopy (ICP-MS) and Inductively Coupled Plasma Optical Emission Spectroscopy (ICP-OES), and speciation analysis for many sample matrices using GC-ICPMS and LC-ICPMS.
References1. C. Tanabe et al., J Agric Food Chem. 65, 4193-4199 (2017)2. P. J. Gray et al., J. Anal. At. Spectrom. 32, 1031-1034 (2017)3. B. P. Jackson et al., J. Anal. At. Spectrom. 30, 1179-1183 (2014)
ICP-MSHe mode ICP-MSH2 mode ICP-QQQO2/H2 mass-shift
SRM Certified Uncorrected Corrected Uncorrected Corrected Uncorrected
Arsenic (mg/kg)
NIST 1547 0.060+0.018 0.170+0.016 0.068+0.003* 0.113+0.004 0.079+0.004* 0.065+0.002*
NIST 1515 0.038+0.007 0.250+0.016 0.026+0.021* 0.126+0.005 0.047+0.004* 0.032+0.002*
Selenium (mg/kg)
NIST 1547 0.120+0.009 0.394+0.04 0.113+0.02* 0.119+0.009* 0.119+0.009* 0.127+0.006*
NIST 1515 0.050+0.009 0.808+0.04 0.013+0.04* 0.050+0.003* 0.050+0.003* 0.047+0.006*
*95% confidence interval overlaps with the certified range
TechnologyNetworks.com15Technology Networks 2018
The Diverse Applications of Mass Spectrometry
Measuring How the Brain Metabolizes in Real-timeAdam Tozer, PhD
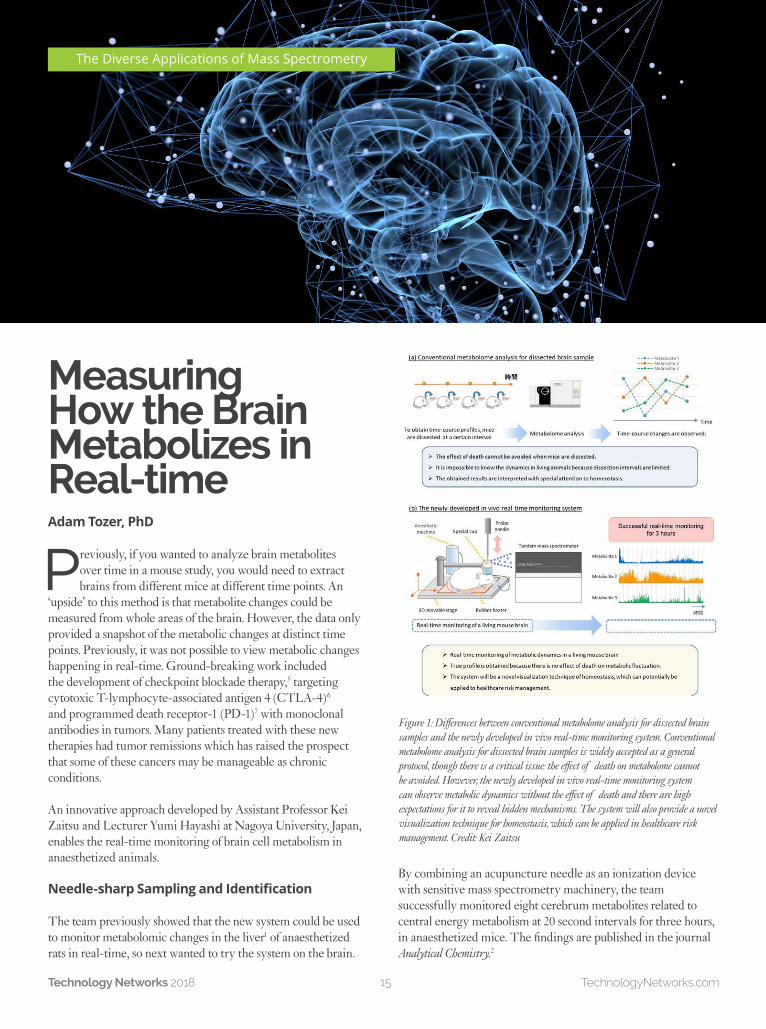
Previously, if you wanted to analyze brain metabolites over time in a mouse study, you would need to extract brains from different mice at different time points. An
‘upside’ to this method is that metabolite changes could be measured from whole areas of the brain. However, the data only provided a snapshot of the metabolic changes at distinct time points. Previously, it was not possible to view metabolic changes happening in real-time. Ground-breaking work included the development of checkpoint blockade therapy,5 targeting cytotoxic T-lymphocyte-associated antigen 4 (CTLA-4)6 and programmed death receptor-1 (PD-1)7 with monoclonal antibodies in tumors. Many patients treated with these new therapies had tumor remissions which has raised the prospect that some of these cancers may be manageable as chronic conditions.
An innovative approach developed by Assistant Professor Kei Zaitsu and Lecturer Yumi Hayashi at Nagoya University, Japan, enables the real-time monitoring of brain cell metabolism in anaesthetized animals.
Needle-sharp Sampling and Identification
The team previously showed that the new system could be used to monitor metabolomic changes in the liver1 of anaesthetized rats in real-time, so next wanted to try the system on the brain.
By combining an acupuncture needle as an ionization device with sensitive mass spectrometry machinery, the team successfully monitored eight cerebrum metabolites related to central energy metabolism at 20 second intervals for three hours, in anaesthetized mice. The findings are published in the journal Analytical Chemistry.2
The Diverse Applications of Mass Spectrometry
Figure 1: Differences between conventional metabolome analysis for dissected brain samples and the newly developed in vivo real-time monitoring system. Conventional metabolome analysis for dissected brain samples is widely accepted as a general protocol, though there is a critical issue: the effect of death on metabolome cannot be avoided. However, the newly developed in vivo real-time monitoring system can observe metabolic dynamics without the effect of death and there are high expectations for it to reveal hidden mechanisms. The system will also provide a novel visualization technique for homeostasis, which can be applied in healthcare risk management. Credit: Kei Zaitsu
The Diverse Applications of Mass Spectrometry
TechnologyNetworks.com16Technology Networks 2018
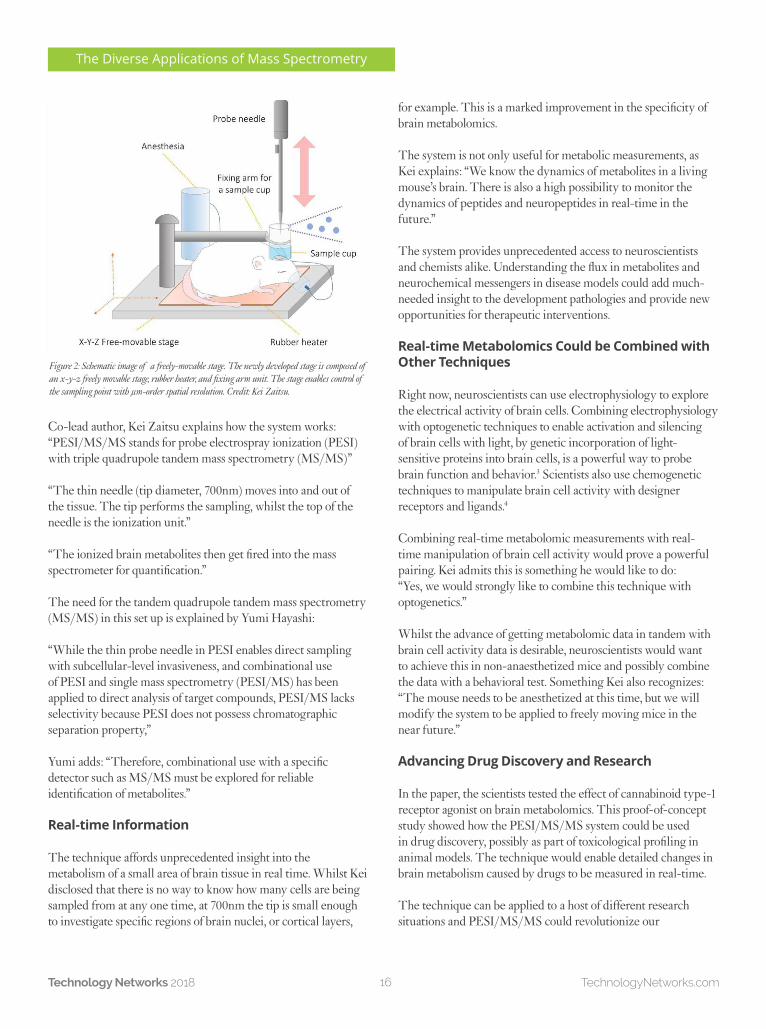
Co-lead author, Kei Zaitsu explains how the system works: “PESI/MS/MS stands for probe electrospray ionization (PESI) with triple quadrupole tandem mass spectrometry (MS/MS)”
“The thin needle (tip diameter, 700nm) moves into and out of the tissue. The tip performs the sampling, whilst the top of the needle is the ionization unit.”
“The ionized brain metabolites then get fired into the mass spectrometer for quantification.”
The need for the tandem quadrupole tandem mass spectrometry (MS/MS) in this set up is explained by Yumi Hayashi:
“While the thin probe needle in PESI enables direct sampling with subcellular-level invasiveness, and combinational use of PESI and single mass spectrometry (PESI/MS) has been applied to direct analysis of target compounds, PESI/MS lacks selectivity because PESI does not possess chromatographic separation property,”
Yumi adds: “Therefore, combinational use with a specific detector such as MS/MS must be explored for reliable identification of metabolites.”
Real-time Information
The technique affords unprecedented insight into the metabolism of a small area of brain tissue in real time. Whilst Kei disclosed that there is no way to know how many cells are being sampled from at any one time, at 700nm the tip is small enough to investigate specific regions of brain nuclei, or cortical layers,
for example. This is a marked improvement in the specificity of brain metabolomics.
The system is not only useful for metabolic measurements, as Kei explains: “We know the dynamics of metabolites in a living mouse’s brain. There is also a high possibility to monitor the dynamics of peptides and neuropeptides in real-time in the future.”
The system provides unprecedented access to neuroscientists and chemists alike. Understanding the flux in metabolites and neurochemical messengers in disease models could add much-needed insight to the development pathologies and provide new opportunities for therapeutic interventions.
Real-time Metabolomics Could be Combined with Other Techniques
Right now, neuroscientists can use electrophysiology to explore the electrical activity of brain cells. Combining electrophysiology with optogenetic techniques to enable activation and silencing of brain cells with light, by genetic incorporation of light-sensitive proteins into brain cells, is a powerful way to probe brain function and behavior.3 Scientists also use chemogenetic techniques to manipulate brain cell activity with designer receptors and ligands.4
Combining real-time metabolomic measurements with real-time manipulation of brain cell activity would prove a powerful pairing. Kei admits this is something he would like to do: “Yes, we would strongly like to combine this technique with optogenetics.”
Whilst the advance of getting metabolomic data in tandem with brain cell activity data is desirable, neuroscientists would want to achieve this in non-anaesthetized mice and possibly combine the data with a behavioral test. Something Kei also recognizes: “The mouse needs to be anesthetized at this time, but we will modify the system to be applied to freely moving mice in the near future.”
Advancing Drug Discovery and Research
In the paper, the scientists tested the effect of cannabinoid type-1 receptor agonist on brain metabolomics. This proof-of-concept study showed how the PESI/MS/MS system could be used in drug discovery, possibly as part of toxicological profiling in animal models. The technique would enable detailed changes in brain metabolism caused by drugs to be measured in real-time.
The technique can be applied to a host of different research situations and PESI/MS/MS could revolutionize our
Figure 2: Schematic image of a freely-movable stage. The newly developed stage is composed of an x-y-z freely movable stage, rubber heater, and fixing arm unit. The stage enables control of the sampling point with μm-order spatial resolution. Credit: Kei Zaitsu.
The Diverse Applications of Mass Spectrometry
TechnologyNetworks.com17Technology Networks 2018
understanding of the function of many tissues in health and disease. As Kei explains: “The demonstrated capabilities of the new PESI/MS/MS system make it a promising tool for the analysis of neurodegenerative diseases, such as Alzheimer’s disease. We can also use it to analyze other tissues such as liver and kidney, suggesting a wide-range applicability of the present system,”
As a pioneer of PESI/MS/MS, Kei is right to be excited about this technique and hopes it will spawn a new field of ‘real-time metabolomics’.
References: 1. K. Zaitsu et al., Anal. Chem. 88, 3556–3561. (2016)2. K. Zaitsu et al., Anal Chem. 90, 4695–4701. (2018) 3. N. Yamawaki et al., Cold Spring Harb Protoc. 10, (2016) 4. K. Berglund et al., Methods Mol Biol. 1408, 207–225. (2016)
TechnologyNetworks.com18Technology Networks 2018
Mass Spectrometry’s Important Role in Identifying Explosives in the EnvironmentProfessor Stanislaw Popiel, Associate Professor of Chemistry at the Military University of Technology, Warsaw, Poland.
Karen Steward, PhD
Explosives, especially when not contained or disposed of correctly, pose a significant hazard to humans, wildlife and the ecosystem. Having the tools to be able to identify
their presence and state are therefore key to combatting the issue. We spoke to Stanislaw Popiel about the game-changing role that mass spectrometry is playing in the process and some of the challenges that still lie ahead.
Q: Could you tell us a bit about the role and importance of mass spectrometry in explosive screening?
A: Explosives screening is very important in a number of situations including terrorism attacks, environmental monitoring (training grounds, factories, ground waters etc.) and dumped munitions. Mass spectrometry gives us a powerful tool for identification and quantification of explosives, vital in forensic analysis.
As well as the explosives themselves, their degradation products can also be detected, which may indicate their use. Tandem mass spectrometry allows us to reduce background signal from the sample matrix and reduce the limit of detection and quantification.
Q: How do the analyses made possible through the application of mass spectrometry compare to previously available methods of detection?
A: Mass spectrometry in combination with gas chromatography and especially liquid chromatography can be used in a very wide research spectrum related to explosives. In comparison to other techniques, mass spectrometry is advantageous because with one detector we can do both qualitative and quantitative analysis of explosives and their degradation products. Also, mass spectrometry, especially high-resolution mass spectrometry, enables us to monitor the degradation and metabolization path of explosives, and identify unknown compounds.
We believe that our work on the development and validation of methods for analysis of all explosives and their degradation products will allow for their practical use in environmental monitoring and forensic science. In addition, the possibility of substance identification gives us the opportunity for more complex analyses of environmental or forensic samples.
Q: What are the biggest challenges that are still to be overcome and how might they be addressed?
A: The biggest challenge is to develop and validate sensitive methods for the detection of explosives and their degradation products in sea water and sediment samples, as large amounts of conventional and chemical munitions are dumped in the oceans and seas. Both chemical warfare agents and explosives undergo very complex transformations under the influence of the marine environment. As a result, after a long time, a lot of substances significantly differ from the starting substances which were dumped in the marine environment. In addition, substances
The Diverse Applications of Mass Spectrometry
The Diverse Applications of Mass Spectrometry
TechnologyNetworks.com19Technology Networks 2018
appearing as a result of chemical or biochemical transformation are on the one hand in very different concentrations, and on the other hand, often have similar properties and therefore it is difficult to distinguish, identify and quantify them. Sea water and sediments are very complex matrices and extraction of analytes with one solvent yielding good recovery is difficult to achieve.
A related significant aspect is to determine the influence of explosives and their degradation products on the marine environment. In both cases, mass spectrometry is a powerful tool and importantly does not limit identification to known metabolites and degradation products. This information is crucial for determining the toxicity of explosives and allows us to trace the path of their metabolism.
Q: Can you tell us about an occasion where this technology has been successfully applied to combat crime?
A: Our laboratory have applied mass spectrometry for the identification and quantification of explosives and their degradations products in sediment samples and actual explosives fished out of the Baltic Sea. These have included trinitrotoluene (TNT) and (cyclotrimethylenetrinitramine) RDX.
Mass spectrometry has crime fighting applications beyond explosives including the analysis of drugs1, 2, herbal medicines3 and dietary supplements3. These applications are very important in forensic analysis because their results are used as evidence in criminal proceedings. Mass spectrometry gives us new possibilities to search for trace substances that can be used as evidence.
Professor Stanislaw Popiel was speaking to Dr Karen Steward, Science Writer for Technology Networks.
Dr. Stanislaw Popiel is an Associate Professor of Chemistry at the Military University of Technology in Warsaw, Poland. Prof. Popiel has over 30 years of experience in analytical chemistry, especially in analysis of dangerous substances, such as chemical warfare agents, explosives and their degradation products. His main task is the
development and validation of analytical methods based on both gas and liquid chromatography especially in combination with mass and tandem mass spectrometry. In his lab, Prof. Popiel has a number of analytical instrumentations with several Master’s & PhD students. He holds numerous publications in his field and notable awards.
References1. P. Lebel et al., J. Chromatogr. A. 1343 134–151. (2014)2. J. Kim et al., Anal. Bioanal. Chem. 408, 251–263. (2016)3. F. Shi et al., J. Chromatogr. A. 1344, 91–98. (2014)
TechnologyNetworks.com20Technology Networks 2018
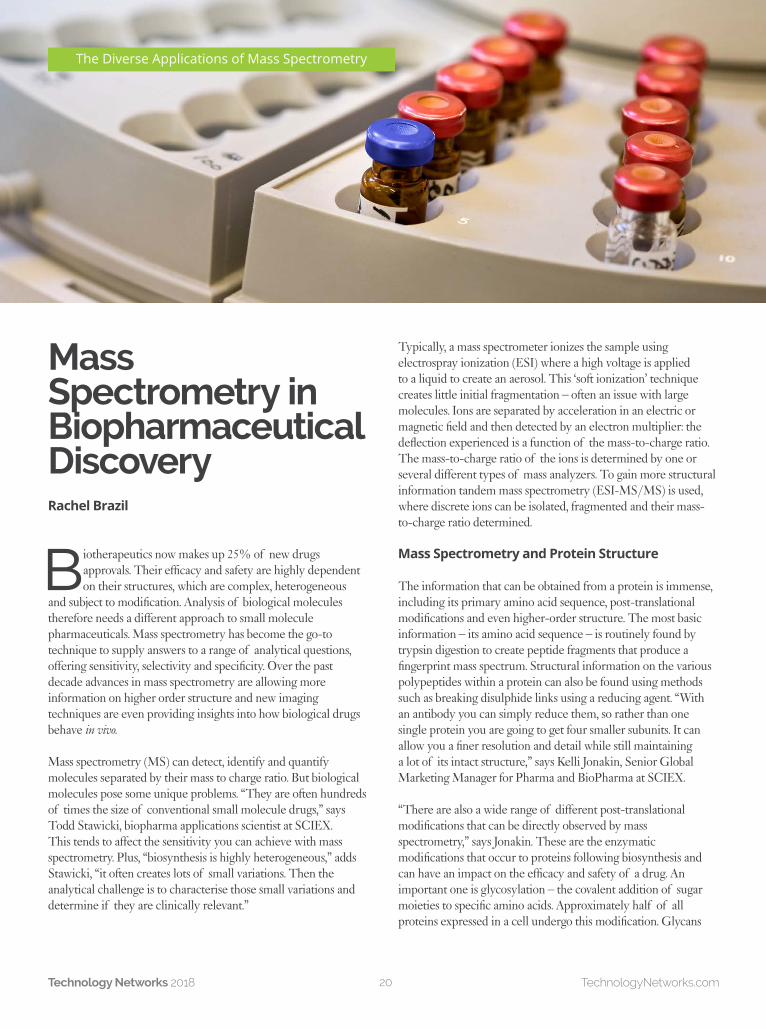
Mass Spectrometry in Biopharmaceutical DiscoveryRachel Brazil
Biotherapeutics now makes up 25% of new drugs approvals. Their efficacy and safety are highly dependent on their structures, which are complex, heterogeneous
and subject to modification. Analysis of biological molecules therefore needs a different approach to small molecule pharmaceuticals. Mass spectrometry has become the go-to technique to supply answers to a range of analytical questions, offering sensitivity, selectivity and specificity. Over the past decade advances in mass spectrometry are allowing more information on higher order structure and new imaging techniques are even providing insights into how biological drugs behave in vivo.
Mass spectrometry (MS) can detect, identify and quantify molecules separated by their mass to charge ratio. But biological molecules pose some unique problems. “They are often hundreds of times the size of conventional small molecule drugs,” says Todd Stawicki, biopharma applications scientist at SCIEX. This tends to affect the sensitivity you can achieve with mass spectrometry. Plus, “biosynthesis is highly heterogeneous,” adds Stawicki, “it often creates lots of small variations. Then the analytical challenge is to characterise those small variations and determine if they are clinically relevant.”
Typically, a mass spectrometer ionizes the sample using electrospray ionization (ESI) where a high voltage is applied to a liquid to create an aerosol. This ‘soft ionization’ technique creates little initial fragmentation – often an issue with large molecules. Ions are separated by acceleration in an electric or magnetic field and then detected by an electron multiplier: the deflection experienced is a function of the mass-to-charge ratio. The mass-to-charge ratio of the ions is determined by one or several different types of mass analyzers. To gain more structural information tandem mass spectrometry (ESI-MS/MS) is used, where discrete ions can be isolated, fragmented and their mass-to-charge ratio determined.
Mass Spectrometry and Protein Structure
The information that can be obtained from a protein is immense, including its primary amino acid sequence, post-translational modifications and even higher-order structure. The most basic information – its amino acid sequence – is routinely found by trypsin digestion to create peptide fragments that produce a fingerprint mass spectrum. Structural information on the various polypeptides within a protein can also be found using methods such as breaking disulphide links using a reducing agent. “With an antibody you can simply reduce them, so rather than one single protein you are going to get four smaller subunits. It can allow you a finer resolution and detail while still maintaining a lot of its intact structure,” says Kelli Jonakin, Senior Global Marketing Manager for Pharma and BioPharma at SCIEX.
“There are also a wide range of different post-translational modifications that can be directly observed by mass spectrometry,” says Jonakin. These are the enzymatic modifications that occur to proteins following biosynthesis and can have an impact on the efficacy and safety of a drug. An important one is glycosylation – the covalent addition of sugar moieties to specific amino acids. Approximately half of all proteins expressed in a cell undergo this modification. Glycans
The Diverse Applications of Mass Spectrometry
The Diverse Applications of Mass Spectrometry
TechnologyNetworks.com21Technology Networks 2018
can be enzymatically separated from the protein before analysis to produce a glycosylation fingerprint. By engineering a protein’s surface glycosylation pattern, drug developers hope to enhance therapeutic performance.
Mass spectrometry also has a crucial role in detecting contaminants from the bioengineering process says Jonakin: “‘When the engineered cells are producing these biotherapeutics they also produce lots of other proteins (host cell proteins, HCPs) and some of these can have undesirable properties.” Mass spectroscopy is able to characterize and quantify these impurities. “In development, if there is a host-cell protein that is particularly immunogenic and represents a high safety risk, scientists could develop an LC-MS assay to quantitatively monitor a unique signature peptide for that host-cell protein, and then monitor for this in the purification and release batch for the biotherapeutics,” explains Jonakin.
Mass Spectrometry and Drug Efficacy
In biopharma mass spectrometry play a role in measuring drug efficacy often by analyzing downstream effects. “We can employ it for looking at the biological consequence of the drug-target binding,” says Stawicki, “for example, we can use mass spectrometry to look at phosphorylation of a messenger protein caused by the binding event.” But, it is also now possible to probe a biotherapeutic’s interactions with its target by performing a native mode analysis.
According to chemist, Igor Kaltashov, from the University of Massachusetts Amherst, the technique is not yet widely established, but he says: “industry is becoming more interested in this aspect of mass spectrometry. I would say in 2–3 years it will become commonplace.” Native mass spectrometry requires protein assemblies to be extracted from solution into the gas phase using ESI. “You have to do it gently, so you don’t break up these complexes.” To assist the move from solution into the gas phase Kaltashov pioneered a technique that uses size exclusion chromatography. This first allows the molecular complexes in solution to be separated from smaller molecules whilst preserving biological activity. “You can inject your complex as it’s formed in a phosphate buffer using a solvent system that isn’t compatible with mass spectrometry and use size exclusion chromatography as an interface,” explains Kaltashov.
Another technique to study conformation and binding is hydrogen-deuterium exchange (HDX) MS. If heavy water is introduced in solution, hydrogen atoms will exchange with deuterium. The rate of exchange is characteristic of the degree to which the hydrogen is protected and that provides conformational information. “The binding epitope (i.e. the interface residues) will be shielded from your labeling agent and
so once the labeling is completed you can interrogate them and by using standard approaches, determine which residues have not been labeled. They are assigned as the residues that are involved in the formation of those binding epitopes,” explains Kaltashov.
The Kit
Many types of studies require highly sensitive instruments and Jonakin says the gold standard for protein quantification is the triple quadrupole mass spectrometer (triple quad, TQMS, QqQ). This is a tandem mass spectrometer consisting of two quadrupole mass analyzers in series. Quadrupole refers to it being constructed from four parallel cylindrical rods which control the voltage and allow only ions of a given mass-to-charge ratio to reach the detector. In between the two mass analyser quadrupoles is a third quadrupole which acts as a cell for collision-induced dissociation. “Triple quads are extraordinarily sensitive and there are many places within the discovery and development pipeline where researchers need extreme sensitivity,” says Jonakin, ‘this can be critical for pre-clinical and clinical studies. But, they do not provide deep MS information, that is what quadrupole time-of-flight MS gives you.’’
Quadrupole time-of-flight MS (Q-Tof MS) is another important high-resolution mass spectrometry method. In a time-of-flight mass analyzer, ions are accelerated in an electric field. The pulsed ions travel in a high vacuum, field-free region and then impact an electron multiplier. Ions travel as a function of their size – small ions travel faster than large ions. “This allows us to detect and characterize proteins and peptides with extremely high accuracy and resolution. That is critically important for confidently distinguishing very small, yet important, differences in very big biotherapeutics,” says Stawicki. These state-of-the-art mass spectrometers can offer a level of detailed information that, for example, enables accurate glycosylation profiling.
For studying biological drugs, Jonakin says Q-Tof MS systems provide a speed advantage: “one of the greater needs for biopharmaceuticals has been speed, pretty much at all levels, because speed equates to depth of coverage and because biologics are so complex you just have so much more going on. The ability to do a lot of experiments in a short time frame allows you to get very deep and very rich mass spectrometry information.”
New data acquisition strategies are also allowing much more comprehensive fragment ion analysis in biological samples using high-resolution Q-Tof mass spectrometry. This can give you detailed information on every detectable analyte in the sample in a single run. For highly complex biotherapeutics this is a great advantage.
The Diverse Applications of Mass Spectrometry
TechnologyNetworks.com22Technology Networks 2018
Mass Spectrometry and Imaging
Another innovation that has proved useful in biopharmaceutical development is imaging mass spectroscopy. One of the earliest methods used for biological imaging was MALDI (Matrix-assisted laser desorption ionization) imaging, first developed in the 1990s by Richard Caprioli at Vanderbilt University. Twenty years later its use is becoming widespread for imaging tissue as part of pharmacokinetic studies. “The thing about MALDI compared to some other imaging MS methods is that it is able to see large biomolecules such as peptide and proteins,” says Adam McMahon, Senior Lecturer in Analytical Chemistry at the University of Manchester.
The method works by covering a thin tissue section with a crystallised matrix material and progressively scanning the surface with a laser. This evaporates the matrix which carries the underlying biomolecules with it. “You generally see intact molecular ions and not their fragments,” says McMahon. “Image files can contain tens of gigabytes of data in which you have peaks at very many masses, each of which will give you an image. So, if you have a drug molecule, you can potentially map its distribution across the tissue sample and can see whether your drug has penetrated into a particular tissue region, which might be important in a tumor, for example.”
Such imaging has been used to explain some unusual off-target drug side effects. For example, MALDI was used to identify the drug metabolite that caused seizures in patients taking an HIV non-nucleoside reverse transcriptase inhibitor. “Drug delivery into the brain can also be examined, where the blood brain barrier can exclude certain molecules,” adds McMahon. Others have been using the technique to determine tumor margins, comparing MALDI MS images to histology data.
Another imaging method, desorption electrospray ionization (DESI), instead of using a laser, uses a stream of fast moving charged solvent droplets in the order of 1 - 5 microns in size, aimed at the sample surface. The droplets extract molecules from the surfaces into the gas phase for analysis. McMahon says there had been scepticism about the spatial resolution the technique could provide, but it can now be as low as 40–50 microns; “You do not see the large proteins extracted in these droplets, you see lipids mainly. But lipids can tell you an awful lot about what is going on in your tissue. You may be comparing a tissue that has and has not been treated with a drug and what you see is the tissue response in terms of the change in the lipid profile.”
Mass spectrometry is a crucial tool in the discovery and development of biological drugs but to many is often still seen as a technique for specialists, with results needing complicated interpretation. Developments and subsequent advancements in mass spectrometry mean that the technique is now a lot more accessible to researchers that are less experienced in using the technique.
The power of mass spectrometry is now something that all researchers in biotherapeutics can harness themselves.
References1. V. Dotz et al., Trends Analyt Chem. 73, 1–9. (2015)2. K. Muneeruddin et al., Anal. Chem. 86, 10692–10699. (2014)3. C. E. Bobst et al., Anal. Chem. 80, 7473–7481. (2008)4. S. Castellino et al., Chem. Res. Toxicol. 26, 241-251. (2013)
TechnologyNetworks.com23Technology Networks 2018
Helping Analytical Chemistry Embrace Big DataRuairi MacKenzie
Many recent advances in research have aimed to maximize the amount of data we can produce. With the cost of data handling storage plummeting, why
wouldn’t you? But as anyone who has spent hours pipetting with an uncalibrated pipette or watched all 29 series of the Simpsons will tell you, quality is more important than quantity. This realization has hit home in many companies that are now buried under a pile of poorly-stored data that can’t be synchronized to other data silos and is occupying many terabytes of storage. In analytical chemistry, that data has more complexity and value than everyday spreadsheets, and tools matching that complexity will be needed to get data back into shape.
“If you don’t have correct data then it’s pretty much unusable by anybody downstream, including yourself, for anything that you originally intended it for,” says Andrew Anderson, Vice President of Innovation and Informatics Strategy at Toronto-based analytical software supplier ACD/Labs. Anderson suggests that this need for correctness is now being recognized at the beginning of the data life cycle – and the end: “Organizations like the Food and Drug Administration require pharmaceutical companies and drug manufacturers to have safe, efficacious and quality drugs and the data that they supply for characterizing those drugs has to meet guidelines according to data integrity. There’s both the pragmatic impetus right from the get-go and at the end. What is the expectation if you’re going to bring a product to market that is supposed to benefit
people? If it’s not what it’s supposed to be, there could be really serious consequences.”
Anderson’s view is that data integrity is important at all stages of the research pipeline, from design to drug. This perspective has become vital as advances in technology enable data to be recorded from more sources in larger volumes: “One of the trends in industrial innovation is utilizing what we would call the secondary or tertiary value that you would get from data. Historically, if you look at how analytical data is leveraged within industry, it’s question and answer, input and output. What people have recognized is that by having data you can infer trends, you can apply and use data for training sets, or things like predictive analytics, machine learning and the like. If I’m using analytical data to release a substance to be used in a pharmacy setting or in a commercial setting, that released data is used to give a green light to say, yes, you can release the batch for its intended use. If you store that data right on every batch that’s ever been released, you can look at trends, and infer operational optimization decision making – do I see any trends in how quality at one site differs from another, for example?”
With these potential benefits available, it’s surprising that analytical chemistry has been slower than other fields to embrace big data techniques, with available datasets and algorithms often not up to the task of analyzing complex chemical data. Andrew’s colleague, and ACD/Labs’ Director of Strategic Partnerships, Graham McGibbon, says that the complexity and volume of data are the biggest obstacles to simply adopting automation techniques: “You have optical spectra across ranges of wavelengths, you have experiments performed not just for the certain sampling frequency but across all frequencies. It takes time to run them – a chromatography run could take half an hour. If you’re acquiring data for that entire half hour and you have a mass spectrometer attached, there could be thousands or millions of data points. Furthermore, you have multiple dimensions of information where you can probe how atoms are attached to each other.
The Diverse Applications of Mass Spectrometry
The Diverse Applications of Mass Spectrometry
TechnologyNetworks.com24Technology Networks 2018
People want to know which peaks represent which atoms or features, and that complexity is really a key thing about chemistry data. I think it’s much more complicated or complex than for some other data that people would choose to store in other fields.”
Andrew notes that labs or companies conducting large-scale chemical analyses could end up with a mind-boggling amount of data: “If we want to do big data analysis, we’re generating a terabyte of data a day, and you’re going to get to a petabyte fairly fast over time. Being able to do the types of analyses we’d like to do is hard if you’re not reducing the data volume somehow.”
Such a deluge of data certainly sounds like a good reason to avoid altering with a company-wide data system, but Andrew firmly believes that even if adopting big data techniques isn’t an easy road to walk, the alternative is far worse: “I’m personally familiar with a situation in food and beverage companies dealing with pesticides that had to respond to a pesticide becoming regulated. They spent 18 months doing the hazard assessment on their commercial products and raw material supply chains. If you have the big data system it’s a query, a simple query as opposed to what they had to do because the big data systems aren’t in play. They had to gather samples, re-analyze and go from there. If you’re going to consider adopting big data techniques in analytical chemistry, consider the value proposition—that’s how they justified a data center investment. If you build this and you house it, and you architect it the right way, it will pay off, you can avoid those 18 months’ worth of cost to solve a problem.”
Whilst the need to advance big data techniques might seem clear, the way in which companies choose to adopt those techniques is less so. Who exactly has to promote more data-centric strategies within a company? “It’s not like any individual department gets saddled with an innovation strategy like this, there has to be all stakeholders at the table,” says Andrew. “You must have a concerted plan to migrate from the current strategic set of capabilities to a new set of capabilities. So, I wouldn’t put any single department under the gun, so to speak, to have a responsibility to build something like this, it has to be an inter-department function.”
Modern informatics solutions clearly have the potential to improve how entire industries treat their data and bring outdated practices to an end. What is also clear is that implementing these solutions requires an intensive, but worthwhile effort. Andrew sums up the task ahead for companies who want to improve how they handle and analyze data: “If somebody can mine data, then I think that’s great but it’s an uncertain additional value compared to what they were doing in the first place. I think that’s really important to
recognize - the nature of where data is assembled and what trade-offs there are in terms of getting complete and accurate data and making it useful.”
Andrew Anderson,Vice President of Innovation and Informatics Strategy, ACD/Labs.
Graham McGibbon,Director of Strategic Partnerships, ACD/Labs

TechnologyNetworks.com25Technology Networks 2018
Developing FTICR Mass Spectrometry Instruments with Unique CapabilitiesPeter B. O’Connor, Professor of Analytical Chemistry, Warwick Centre for Analytical Science (WCAS), Department of Chemistry, University of Warwick, UK
Laura Elizabeth Mason
Peter and his team work collaboratively with other research groups to demonstrate the effectiveness of higher specification fourier-transform ion cyclotron resonance
(FTICR) mass spectrometry in specific applications. Here he discusses the diverse range of projects he is currently working on. He touches on the adaptability of mass spectrometry, enabling researchers to study cancer, neurological disease, petroleum, and biopharmaceuticals.
Q: How did you come to work in this area of research?
A: Once I had completed my undergraduate degree I went on to do my PhD, although I originally planned to focus on computational modelling, once I got to university that didn’t really appeal to me. And so I wandered around attempting to find some other areas of interest, and eventually stumbled into the lab of Fred McLafferty (the American chemist known for his work in mass spectrometry) who was doing very similar research to what we are still doing now –although in a much more preliminary state at that point – I got to know about mass spectrometry, really fell in love with it and stuck with it all these years. It initially piqued my interest in the early ‘90s so roughly 25 years ago.
Q: Could you touch on your work within the area of cancer research?
A: I wouldn’t consider myself an expert in cancer research but my colleague, Peter Sadler, a co-author on one of our latest papers works on anti-cancer metallodrugs. The most famous of them is cisplatin which is probably the most prescribed anti-cancer drug of all.
Cisplatin acts as a sort of template for most of what Peter works on, except that he changes the metal and the ligands on the drug – this, of course, changes the chemistry of the molecule completely. The goal is to find anti-cancer drugs which are more efficacious, that have enhanced targetability, or, in this case, the team wanted to find an anti-cancer drug that was photo-activatable so that they could dose a person with an inert drug at fairly high concentrations and then just activate the molecule with blue light on specific target sites where the cancer is specifically located.
The Diverse Applications of Mass Spectrometry

The Diverse Applications of Mass Spectrometry
TechnologyNetworks.com26Technology Networks 2018
This strategy would mean that it would be possible to limit the damage to healthy cells through controlled positioning of the light, which is an interesting concept that Peter has brought forward. My personal interest was directed at the photo-activatable anti-cancer drugs, in figuring out what these drugs were doing when they became activated. What happens when you put this type of drug into a biological system, how do they actually kill cells, and what are they actually doing? It is a really interesting problem because it’s a mass spectrometry problem. It is also a proteomics problem because most of the drug’s interactions are with proteins in the cells. We started out with cisplatin and found ways to detect the modification sites of proteins in cisplatin, now we’ve extended this to quite a few other metallodrugs. We then performed liquid chromatography combined with mass spectrometry and tandem mass spectrometry – so fragmentation mass spectrometry. We used this approach to try to identify the proteins and the sites of modification. If you do this with a conventional proteomics method, you’ll be able to find something but everything that’s modified with a drug has a very strange isotope pattern because metals have very strange isotope patterns and there’s a metal at the middle of the drug. So we had to find a way to automatically highlight all the peaks that had the metals on them. We were able to build a script that could examine the isotope patterns and identify only the peaks that would have the metals on them and we could then focus on those and perform more extensive mass spectrometry. It is a proteomics challenge, so you have a terrible mish mash of proteins and peptides in there, as usual. These are also human cell lines so they’re quite complicated – they’re not as simple as a yeast cell for example. Then we have the metals which make such a broad isotope distribution that it’s rather challenging to find them and that tends to mess up a lot of the proteomics methodologies that are pretty well established now. So, while we had to develop the tools to do that, the high resolution of FTICR MS was very helpful, although probably not strictly necessary in all cases. Inevitably in biological systems you end up with overlapping isotope distributions and then that very high resolution becomes critical. So some of this could have been done with other proteomic set ups, but the FTICR is clearly going to be the best approach.
Q: What are the benefits of FTICR mass spectrometry and what applications is it particularly suited for?
A: The biggest advantage of FTICR by far, is that it has much higher resolution than any other type of mass spectrometer. It is about 10 times better than the nearest competitor which is the orbitrap. High resolution is very useful, particularly whenever you have particularly complex samples. One of the biggest areas that researchers work on in this area, although I don’t work on this myself, is petroleum. Petroleum is a horrendously complex mixture, hundreds of thousands of components, all
low molecular weight and so they tend to give you just huge signal and you might have hundreds of individual peaks at every one dalton spacing in the spectrum, so it gets really complicated. Another area that we’re working on quite a bit is synthetic polymers, particularly the block copolymers where combinatorial confusion in the spectrum is common because you have distributions of polymers that you tag together in a block copolymer and so they get rather heterogeneous. A more advanced mass spectrometer is necessary to make sense of the spectra.
Both petroleum and polymers can be either not very amenable to chromatographic separation or they can be too complicated for chromatographic separation so you need to be able to handle many different components at the same time in the spectrum, so you absolutely need the resolution. Proteomics is very similar in that sense. In this case, like in many cases, we start by digesting the proteins in the cells down to peptides and work from there. It’s what we call a bottom-up approach to proteomics but that means that you’re turning maybe tens of thousands of proteins into millions of peptides or at least hundreds of thousands of peptides. Then you have to separate out that mixture and process it. Now peptides are very amenable to chromatography, so they usually do separate out pretty well. So you don’t have terribly complex samples but if you have a pretty good chromatography set up you might be able to separate out your mixture into say 1,000 or 2,000 fractions and if you’ve got 100,000 or a million infractions that means that you’ve got quite a few components coming out at any particular time and you still need to have high resolution to be able to deal with the complexity of the sample. For proteomics, the approach is to try to run the experiment and take advantage of the high performance of the mass spectrometer for selection and tandem mass spec. They have to run the mass spectrometer really, really fast and try to select as many peaks as possible in every time slice in order to fragment them and get sequence information. This approach does work, and we do that too, but we have the added advantage of having very high resolution meaning we can separate out the mixtures at the same time. Which helps us process this data. Then there’s all the other elements such as glycomics and genomics that are also amenable to this high-performance mass spectrometry in different contexts.
Q: Your team’s mission is to “develop new FTICR mass spectrometry instruments with unique capabilities.” Could you elaborate on this?
A: Development is most of what we do. We work on developing advanced FTICR mass spectrometry, more specifically, we develop new tools using the high-resolution capabilities of the FTICR.
I’m currently working on building a web app that I intend
The Diverse Applications of Mass Spectrometry
TechnologyNetworks.com27Technology Networks 2018
to use to teach people how to calculate isotope distribution. Isotope distributions are not actually very complicated, but it really is important to get them right if you’re going to be comparing them to real data. A lot of web applications that you find make some pretty simple assumptions that are often fine – but can sometimes cause problems. We have to calculate isotopic distributions for all metals which is not always easy. We also work on different ways of fragmenting molecules. In the mass spectrometer you will typically measure your mass spectrum and get a number of peaks for peptides. You’ll then select one peak using some of the voltages and wave forms that we have in the mass spectrometer, smash it using a tandem mass spectrometry fragmentation method and then measure the masses that you’ve created – which will presumably allow you to get some structural information for peptides. This method usually enables the partial (or sometimes full) sequencing of the peptides. So there’s a lot of tricks to sequencing using tandem mass spectrometry.
How do you break the molecules? Most of the time, we collide them with background gas and break them solely by collisions. We are also working on doing photo dissociation which involves breaking molecules with UV and IR light, and we also do reactions with electrons. There are half a dozen different types of reactions you can perform with electrons that causes the molecules to break in different ways. Each reaction tends to result in slightly different information, so when you combine several of these reactions together you can get a very complete picture of sequence information which is very useful. We’ve actually developed a new fragmentation technique, called two dimensional mass spectrometry, which is very exciting. We’ve got a few papers out on it now and we’re about to submit three or four more.
Two-dimensional mass spectrometry technology is well established. The concepts and methodologies were worked back in the late 80s, but it required too much computational power for the time, we needed modern computers to be able to start to successfully process the data. When it comes to two-dimensional mass spectrometry, you may have one spectrum that equates to 200 Gb of data – your average computer can’t process that, it requires cluster computers, housed here in the university. This enhanced computing power allows us to get it down into a format that we can use. The technology finally enabled us to use this method even though it’s been sitting there for close to 30 years in the literature! It allows us to fragment the molecules.
In two-dimensional mass spectrometry you don’t have to isolate the molecules. What you do instead is you modulate all of the molecules in and out of a fragmentation zone and you basically code each pre-cursor ion with its own modulation frequency and because that is dragging it back and forth to the fragmentation zone the fragments end up carrying the same
modulation frequency as the pre-cursor. This means that you can fragment all the molecules at the same time without doing any isolations and it greatly speeds up the whole process because you don’t have to do them one by one, you just do them all together. It speeds it up and it also gives you much more detail in the information because what inevitably happens with complex samples is you can fragment the first 5 or 10 and then you run out of time to be able to do the next bit so it’s basically a much faster way of doing the whole experiment. It will end up giving us a lot more information about structures and molecules in complex mixtures. It’s an ongoing development project though so stay tuned on that one I guess!
Q: What projects are you currently working on?
A: Two-dimensional mass spectrometry; that’s a big development project for us going forward and we’re working on it in pretty much every avenue that we can think to apply it. We have recently had two scientific papers accepted that outline the technology and its use for the analysis of whole proteins rather than the analysis of smaller peptides that you would typically create by digesting the proteins – top-down proteomics. Of course, we’re using it on proteomics and polymers and we are also making good progress on the use of two-dimensional mass spectrometry for glycomics. There are a few application areas that are particularly interesting.
The first project to mention is in collaboration with a medical school in Beijing. The researchers have scorpion venom and scorpion venom extracts that they are using that have particular anti-coagulant activities. The idea is to try to figure out what is it in the structures of these scorpion venom extracts that is responsible for the anti-coagulant activity. It turns out that most of the molecules in the extract are proteins, not very big ones, pretty small, under 10,000 daltons, but they’re tied up in really tight balls with many disulphide bonds, presumably so that they’ll survive when they’re out in the environment and being in this conformation prevents them from immediately being chopped up by proteases and allows them to maintain their stability. But, first of all, you need to try to figure out what these molecules are. The scorpions aren’t sequenced so we don’t have a database to search against so we have to sequence them ‘de novo’, using just the mass spectrometry data - which is much harder. We also must try to figure out exactly where those disulfide bonds are, you tend to just scramble where the disulfide bonds are (if you even keep that information) so it’s a challenge to try to figure out exactly what these venoms are and how they work. That’s a fun project which is making some nice progress at the moment.
We are also working on analysis of amyloid plaques in Alzheimer’s disease patients, specifically trying to figure out what impact metallic particles have on Alzheimer’s disease.
The Diverse Applications of Mass Spectrometry
TechnologyNetworks.com28Technology Networks 2018
There has been a lot of discussion about aluminium and iron in your diet or that you pick up from environmental pollution and how this might impact Alzheimer’s disease. I have a collaborator who works on that and our part of the project is to try to figure out what modifications we see in the Alzheimer’s disease proteins, the amyloid beta protein, as a function of these metallic nanoparticles. They also then go off to the synchrotrons and try to figure out exactly what the chemical state of the metal is in that particular nanoparticle. Is it actually a metal or is it a metal that is bound to something else? It is an interesting problem from a lot of different directions, technologically as well as in terms of medicine.
We also have a big project on antibodies. This is a collaboration project with a biopharmaceutical company, who manufacture and use a lot of different antibodies. They’re extremely interested in all the post-translational modifications that feature on them. If these antibodies are being produced for pharmaceutical purposes they want to ensure that the antibodies remain stable over time and that they aren’t creating some kind of side reaction that then causes problems with the activity of the drug. Therefore, there is a lot of work currently focused on post-translational modifications of antibodies.
Peter B. O’Connor was speaking to Laura Elizabeth Mason, Science Writer for Technology Networks.