the dividend puzzle: testing the signalling hypothesis · pdf filethe dividend puzzle: testing...
TRANSCRIPT
The Dividend Puzzle: Testing the Signalling
Hypothesis in an European Context
by
Tiago Arede Lajas
Master Dissertation in Finance
Supervised by:
Júlio Fernando Seara Sequeira da Mota Lobão
2016

I
Biographical Sketch
Tiago Arede Lajas is currently in his 2nd year of study in the Master of Finance
programme at Faculdade de Economia da Universidade do Porto. Hopefully, by the end
of 2016 he will have graduated with a Master of Finance degree.
Previous academic achievements that Tiago concluded include a Bachelor in
Management at Faculdade Portucalense Infante D. Henrique and another Bachelor in
Economics at Faculdade Portucalense Infante D. Henrique.
Tiago also concluded with success his studies of the English language by passing the
exams provided by the Cambridge English Language Assessment institute. These exams
include the FCE (First Certificate in English), CAE (Certificate of Advanced English)
and the CPE (Certificate of Proficiency in English).

II
Acknowledgements
I would like to thank my dissertation supervisor Dr. Júlio Fernando Seara Sequeira da
Mota Lobão for his support and advice throughout this project. I was told by my
colleagues that I would find myself in good hands if I chose him as my supervisor and I
can say without a doubt that they were not wrong and his willingness to listen to my
problems and help me find solutions blew my expectations away.
I would also like to thank my family for providing me this chance of obtaining my
Master degree at FEP and their support and patience throughout these last months.
I would also like to thank my friends at FEP Amir Tussupov and Dário Veiga for
sharing their knowledge with me and helping me whenever I asked for their aid.
Finally, last but not least, I would like to thank my best friend Bruno Ferreira do Vale
Quaresma for providing his support and advice throughout this project.

III
Index
Abstract ........................................................................................................................................ IX
1. Introduction ............................................................................................................................... 1
2. Literature Review ...................................................................................................................... 4
2.1. Main theories behind the dividend policy .......................................................................... 4
2.2. Similar studies .................................................................................................................. 10
2.3. Critical analysis of the literature reviewed ....................................................................... 13
3. Methodological considerations ............................................................................................... 14
3.1. Methodological aspects of similar studies ....................................................................... 14
3.2. Methodological considerations used in this dissertation .................................................. 17
4. Data and Summary Statistics .................................................................................................. 25
5. Empirical Results .................................................................................................................... 30
5.1. Dividend changes and future equity-scaled earnings changes ......................................... 30
5.1.1. Univariate Analysis ................................................................................................... 30
5.1.2. Model Specifications ................................................................................................. 31
5.1.3. Regression Results .................................................................................................... 34
5.2. Dividend changes and future asset-scaled earnings changes ........................................... 40
5.2.1. The Model ................................................................................................................. 40
5.2.2. Model Specifications ................................................................................................. 41
5.2.3. Regression Results .................................................................................................... 43
6. Robustness Tests ................................................................................................................. 49
6.1. Dividend changes and ROE levels ................................................................................... 49
6.1.1. The Model ................................................................................................................. 49
6.1.2. Model Specifications ................................................................................................. 49
6.1.2. Regression Results .................................................................................................... 51
6.2. Dividend changes and ROA levels .................................................................................. 55

IV
6.2.1. The Model ................................................................................................................. 55
6.2.2. Model Specifications ................................................................................................. 55
6.2.3. Regression Results .................................................................................................... 57
6.3. Dividend changes and future abnormal earnings ............................................................. 61
6.3.1. The Model ................................................................................................................. 61
6.3.2. Model Specifications ................................................................................................. 62
6.3.3. Regression Results .................................................................................................... 63
7. Conclusions ............................................................................................................................. 69
References ................................................................................................................................... 71
Annexes ....................................................................................................................................... 75

V
Index of tables
Table 1- Comparison between the methodologies of past studies ............................................ 17
Table 2- Country distribution amongst the sample .................................................................... 27
Table 3- Descriptive statistics of key characteristics of the sample firms for dividend-decrease,
dividend-increase and dividend-no-change events .................................................................... 28
Table 4- Univariate analysis of the association between future equity-scaled earnings changes
and dividend changes for the total sample and subsamples of different years ......................... 31
Table 5- Dividend Premium per subsample of country and year alongside the average Dividend
Premium for the study’s sample ................................................................................................. 32
Table 6- Simple OLS Regression of the dividend change equation (Dividend Changes and Future
Equity-Scaled Earnings Changes) ................................................................................................ 34
Table 7- First stage of the 2SLS regression using the future earnings change equation in its
linear form (Dividend Changes and Future Equity-Scaled Earnings Changes) ............................ 36
Table 8- Second stage of the 2SLS regression using the dividend change equation in its linear
form (Dividend Changes and Future Equity-Scaled Earnings Changes) ...................................... 37
Table 9- First stage of the 2SLS regression using the future earnings change equation in its
nonlinear form (Dividend Changes and Future Equity-Scaled Earnings Changes) ..................... 39
Table 10- Second stage of the 2SLS regression using the dividend change equation in its
nonlinear form (Dividend Changes and Future Equity-Scaled Earnings Changes) ..................... 40
Table 11- Simple OLS Regression of the dividend change equation (Dividend Changes and
Future Asset-Scaled Earnings Changes) ...................................................................................... 43
Table 12- First stage of the 2SLS regression using the future earnings change equation in its
linear form (Dividend Changes and Future Equity-Asset Earnings Changes) ............................. 44
Table 13- Second stage of the 2SLS regression using the dividend change equation in its linear
form (Dividend Changes and Future Asset-Scaled Earnings Changes) ....................................... 45
Table 14- First stage of the 2SLS regression using the future earnings change equation in its
nonlinear form (Dividend Changes and Future Asset-Scaled Earnings Changes) ....................... 47
Table 15- Second stage of the 2SLS regression using the dividend change equation in its
nonlinear form (Dividend Changes and Future Asset-Scaled Earnings Changes) ....................... 48
Table 16- Simple OLS Regression of the dividend change equation (Dividend Changes and ROE
levels) .......................................................................................................................................... 51
VI
Table 17- First stage of the 2SLS regression using the future earnings change equation in its
linear form (Dividend Changes and ROE levels) .......................................................................... 52
Table 18- Second stage of the 2SLS regression using the dividend change equation in its linear
form (Dividend Changes and ROE levels) .................................................................................... 53
Table 19- First stage of the 2SLS regression using the future earnings change equation in its
nonlinear form (Dividend Changes and ROE levels) ................................................................... 54
Table 20- Second stage of the 2SLS regression using the dividend change equation in its
nonlinear form (Dividend Changes and ROE levels) ................................................................... 55
Table 21- Simple OLS Regression of the dividend change equation (Dividend Changes and ROA
levels) .......................................................................................................................................... 57
Table 22- First stage of the 2SLS regression using the future earnings change equation in its
linear form (Dividend Changes and ROA levels) ......................................................................... 58
Table 23- Second stage of the 2SLS regression using the dividend change equation in its linear
form (Dividend Changes and ROA levels) ................................................................................... 58
Table 24- First stage of the 2SLS regression using the future earnings change equation in its
nonlinear form (Dividend Changes and ROA levels) ................................................................... 59
Table 25- Second stage of the 2SLS regression using the dividend change equation in its
nonlinear form (Dividend Changes and ROA levels) ................................................................... 60
Table 26- Simple OLS Regression of the dividend change equation (Dividend Changes and
Abnormal Earnings) ..................................................................................................................... 64
Table 27- First stage of the 2SLS regression using the future earnings change equation in its
linear form (Dividend Changes and Abnormal Earnings) ............................................................ 64
Table 28- Second stage of the 2SLS regression using the dividend change equation in its linear
form (Dividend Changes and Abnormal Earnings) ...................................................................... 65
Table 29- First stage of the 2SLS regression using the future earnings change equation in its
nonlinear form (Dividend Changes and Abnormal Earnings) ..................................................... 66
Table 30- Second stage of the 2SLS regression using the dividend change equation in its
nonlinear form (Dividend Changes and Abnormal Earnings) ..................................................... 67
Table 31- Dividend Premium for 10 dividend paying UK firms and 10 non-dividend paying UK
firms ............................................................................................................................................ 75
Table 32- Dividend Premium for 10 dividend paying Germanic firms and 10 non-dividend
paying Germanic firms ................................................................................................................ 76

VII
Table 33- Dividend Premium for 10 dividend paying firms and 10 non-dividend paying firms:
France .......................................................................................................................................... 77
Table 34- Dividend Premium for 10 dividend paying firms and 10 non-dividend paying firms:
Spain ............................................................................................................................................ 78
Table 35- Dividend Premium for 10 dividend paying firms and 10 non-dividend paying firms:
Poland ......................................................................................................................................... 79
Table 36- Dividend Premium for 10 dividend paying firms and 10 non-dividend paying firms:
Ukraine ........................................................................................................................................ 80
Table 37- Dividend Premium for 10 dividend paying firms and 10 non-dividend paying firms:
Greece ......................................................................................................................................... 81
Table 38- Dividend Premium for 10 dividend paying firms and 10 non-dividend paying firms:
Italy .............................................................................................................................................. 82
Table 39- Dividend Premium for 10 dividend paying firms and 10 non-dividend paying firms:
Sweden ........................................................................................................................................ 83
Table 40- Dividend Premium for 10 dividend paying firms and 10 non-dividend paying firms:
Romania ...................................................................................................................................... 84
Table 41- Dividend Premium for 10 dividend paying firms and 10 non-dividend paying firms:
Netherlands ................................................................................................................................. 85
Table 42- Dividend Premium for 10 dividend paying firms and 10 non-dividend paying firms:
Slovenia ....................................................................................................................................... 86
Table 43- Dividend Premium for 10 dividend paying firms and 10 non-dividend paying firms:
Belgium ....................................................................................................................................... 87
Table 44- Dividend Premium for 10 dividend paying firms and 10 non-dividend paying firms:
Croatia ......................................................................................................................................... 88
Table 45- Dividend Premium for 10 dividend paying firms and 10 non-dividend paying firms:
Switzerland .................................................................................................................................. 89
Table 46- Dividend Premium for 10 dividend paying firms and 10 non-dividend paying firms:
Norway ........................................................................................................................................ 90
Table 47- Relevant Data for the application of the models (part 1) ........................................... 91
Table 48- Relevant Data for the application of the models (part 2) ........................................... 92
Table 49- Relevant Data for the application of the models (part 3) ........................................... 93
Table 50- Relevant Data for the application of the models (part 4) ........................................... 94
Table 51- Relevant Data for the application of the models (part 5) ........................................... 95
VIII
Table 52- Relevant Data for the application of the models (part 6) ........................................... 96
Table 53- Relevant Data for the application of the models (part 7) ........................................... 97
Table 54- Relevant Data for the application of the models (part 8) ........................................... 98
Table 55- Relevant Data for the application of the models (part 9) ........................................... 99
Table 56- Relevant Data for the application of the model (part 10) ........................................ 100
Table 57- Relevant Data for the calculation of the Future Abnormal Earnings (part 1) ........... 101
Table 58- Relevant Data for the calculation of the Future Abnormal Earnings (part 2) ........... 102
Table 59- Relevant Data for the calculation of the Future Abnormal Earnings (part 3) ........... 103
Table 60- Relevant Data for the calculation of the Future Abnormal Earnings (part 4) ........... 104
Table 61- Abnormal Future Earnings for each subsample of company (part 1) ....................... 105
Table 62- Abnormal Future Earnings for each subsample of company (part 2) ....................... 106
Table 63-Calculation of DFE0 for the model that compares Dividend Changes with Future
Equity-Scaled Earnings Changes (part 1)................................................................................... 107
Table 64- Calculation of DFE0 for the model that compares Dividend Changes with Future
Equity-Scaled Earnings Changes (part 2)................................................................................... 108
Table 65- Calculation of DFE0 for the model that compares Dividend Changes with Future
Asset-Scaled Earnings Changes (part 1) .................................................................................... 109
Table 66- Calculation of DFE0 for the model that compares Dividend Changes with Future
Asset-Scaled Earnings Changes (part 2) .................................................................................... 110
Table 67- Calculation of CE0 for the model that compares Dividend Changes with Future Asset-
Scaled Earnings Changes (part 1) .............................................................................................. 111
Table 68- Calculation of CE0 for the model that compares Dividend Changes with Future Asset-
Scaled Earnings Changes (part 2) .............................................................................................. 112
Table 69- Calculation of DFE0 for the model that compares Dividend Changes with ROE levels
(part 1) ...................................................................................................................................... 113
Table 70- Calculation of DFE0 for the model that compares Dividend Changes with ROE levels
(part 2) ...................................................................................................................................... 114
Table 71- Calculation of CE0 for the model that compares Dividend Changes with ROE levels
(part 1) ...................................................................................................................................... 115
Table 72- Calculation of CE0 for the model that compares Dividend Changes with ROE levels
(part 2) ...................................................................................................................................... 116
IX
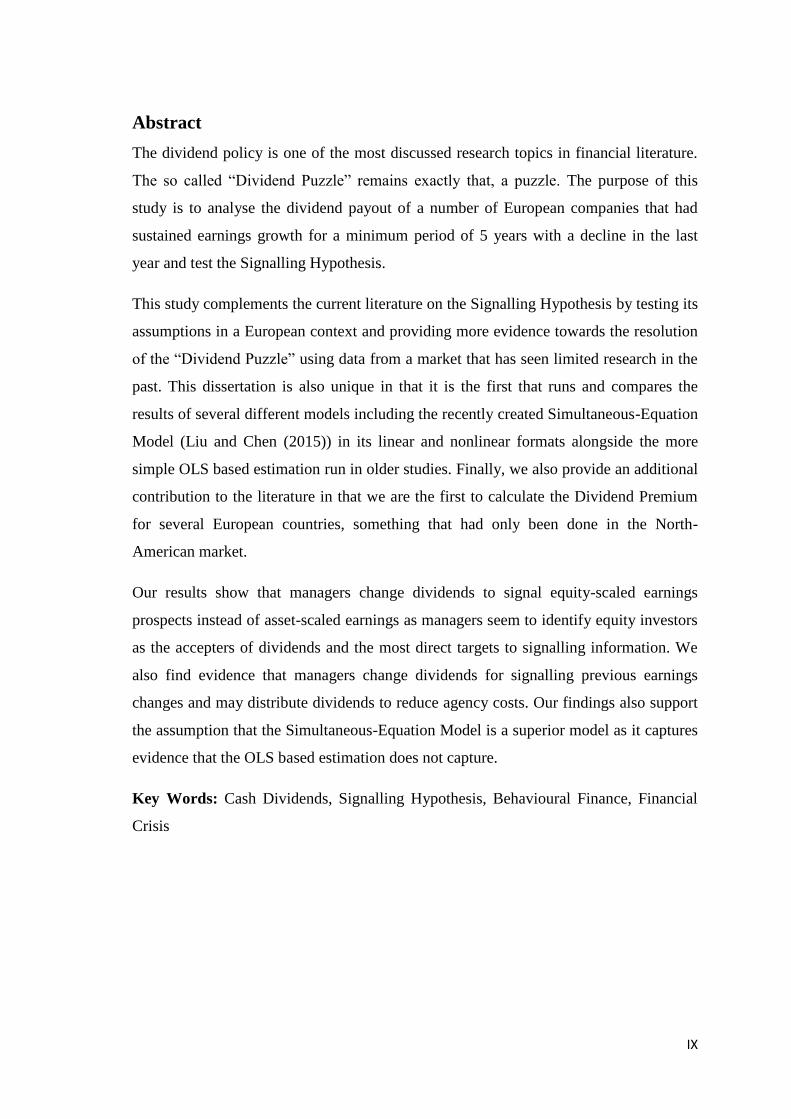
Abstract
The dividend policy is one of the most discussed research topics in financial literature.
The so called “Dividend Puzzle” remains exactly that, a puzzle. The purpose of this
study is to analyse the dividend payout of a number of European companies that had
sustained earnings growth for a minimum period of 5 years with a decline in the last
year and test the Signalling Hypothesis.
This study complements the current literature on the Signalling Hypothesis by testing its
assumptions in a European context and providing more evidence towards the resolution
of the “Dividend Puzzle” using data from a market that has seen limited research in the
past. This dissertation is also unique in that it is the first that runs and compares the
results of several different models including the recently created Simultaneous-Equation
Model (Liu and Chen (2015)) in its linear and nonlinear formats alongside the more
simple OLS based estimation run in older studies. Finally, we also provide an additional
contribution to the literature in that we are the first to calculate the Dividend Premium
for several European countries, something that had only been done in the North-
American market.
Our results show that managers change dividends to signal equity-scaled earnings
prospects instead of asset-scaled earnings as managers seem to identify equity investors
as the accepters of dividends and the most direct targets to signalling information. We
also find evidence that managers change dividends for signalling previous earnings
changes and may distribute dividends to reduce agency costs. Our findings also support
the assumption that the Simultaneous-Equation Model is a superior model as it captures
evidence that the OLS based estimation does not capture.
Key Words: Cash Dividends, Signalling Hypothesis, Behavioural Finance, Financial
Crisis
1
1. Introduction
The dividend policy has been one of the most important themes of study amongst the
financial scholars since the decade of 1950 and because of this the field has grown
considerably with time and the available literature is sizeable. Despite this, when we
look at the results obtained in the majority of the studies we easily conclude that the
dividend decision is the most elusive and controversial in managerial decision making
and that’s why we currently label this subject as the “Dividend Puzzle”.
One specific area of research that this study is going to focus on is the “Dividend
Signalling Hypothesis”, which states that dividends provide signals to the market in
terms of the future prospects of a company. Other studies have been developed in the
past, but the most recent studies used mostly American firms (e.g. DeAngelo et al.
(1996); Grullon et al. (2005)) but also some UK firms (Gwilyn et al. (2004)); Hussainey
et al. (2009)). The majority of the studies concluded with mixed results relative to the
theory of dividend signalling, however the most recent ones seem to point to the
irrelevance of the signalling capacity of dividends.
The scholars that support the theory of dividend signalling theorise that dividends
provide a signalling effect that helps combat the agency problems between managers
and investors who are less informed about the firm’s prospects. Those against the theory
defend that dividends contain no signal to investors and that even if there was some
kind of signal, it would be an erroneous signal since managers suffer from bias (e.g.
over optimism) and some even may have reasons to send false signals to the market.
The purpose of this study is to analyse the dividend policy of a number of European
companies that had sustained earnings growth for a period of at least 5 years with a
decline in the last year. We test the empirical importance of dividend signalling using a
different sample compared to the previous authors who either focused on a completely
different market (US, Korea, South Africa) or used a much smaller sample (UK firms
only). This study also has a wider scope than the previous European ones since we want
to study firms with a longer period of sustained earnings growth and capture the effect
of the financial crisis of 2008 on the dividend policy of these firms.
2
Hence, the objectives of this study are as follows:
a) Study whether the managers use changes in dividends to convey earnings
prospect;
b) Examine the effect of signalling in the subsequent years following the decline in
year 0;
c) Examine if the signalling effect becomes stronger during the transition from a
period of sustained growth to a period of decline on earnings;
d) Examine the effect of behavioural bias in determining the dividend policy;
To achieve the objectives of this study we will be using the same methodology that was
used in past studies such as the Linear Model of Earnings Expectations but also
additional models in order to compare the results and run robustness tests. Specifically
we employ the Simultaneous-Equation Model system developed by Liu and Chen (2015)
that incorporates an equation that allows us to regress current dividend changes on
future earnings changes and at the same time control for additional motives of dividend
changes as well. The reasoning behind the creation of this model is that it addresses the
mutually endogenous problem between dividend changes and future earnings changes
that are not fully controlled in previous studies. Furthermore we also employ the
Simultaneous-Equation Model both in its linear and nonlinear forms as developed by
Nissim and Ziv (2001) and Grullon et al. (2005) respectively.
Besides this chapter, this dissertation is structured as follows: in chapter 2, a literature
review of the topic is made, starting by defining “Dividend Policy” and presenting the
main theories behind the payment of dividends, focusing on the Signalling Hypothesis.
This chapter is concluded after listing a number of past studies similar to this one and
making a critical analysis of all past literature.
Additionally chapter 3 is dedicated to analysing the methodological considerations of
previous studies and the ones used in our own study. Chapter 4 includes a simple
analysis of the sample included in this study as well as details relative to the collection
of data and other criterions or calculations executed. Chapter 5 of this dissertation
contains the empirical results obtained from each model run in the study. Furthermore,

3
chapter 6 of this dissertation is dedicated to robustness tests that serve the purpose of
verifying if the findings from chapter 5 are robust to alternative specifications.
The final chapter of this dissertation is chapter 7 which includes the conclusions
obtained from the study.
4
2. Literature Review
This chapter will be dedicated to the description of past literature on the topic of the
Dividend Policy, starting with a brief definition of “Dividend Policy”. The chapter will
also include the main theories related to the Dividend Policy, giving wider focus to the
Signalling Hypothesis since it is the one that is being explored in this dissertation. The
chapter also includes information about past studies that are similar to the one we have
developed and ends with a critical analysis of the literature reviewed, pointing
weaknesses and holes in these studies that were either explored in this dissertation or
can be explored in future research.
2.1. Main theories behind the dividend policy
A dividend is nothing more than a distribution or payment in either cash or shares to the
shareholders of the company out of the firm’s earnings (Ross et al. (2003)). The
decision on the dividend policy takes a number of factors into consideration prior to the
final release. Some of these factors are the firm’s current net earnings, future CAPEX
needs and stream of cash flows, the investor’s preferences or even the market sentiment.
We can also add competitors to these factors as managers usually look at what is being
done in the competition as they set the policy. Other factors are related to the human
nature like the managerial profile, behavioural bias (e.g. over optimism) and reasons
that may lead the manager to send false information.
The dividend policy depends on how much of the net earnings are available to be used
as dividends and the future investment opportunities since these will require additional
cash flow that can be financed using the firm’s current earnings instead of going for the
more costly alternative: external financing. Because of this we know that high-growth
firms will not pay large dividends because they need net earnings to support their
growth. We also know that the largest and more profitable firms are the ones that
usually pay the highest dividends and are more likely to increase those (Grullon et al.
(2005).
Finally, past studies (DeAngelo and DeAngelo (1990)) have concluded that firms have a
tendency to have stable dividends, so the establishment of dividends in these companies
is in accordance with the level of current earnings as well as dividends in previous years.
Some authors defend that this is done because the dividend policy is a kind of ritual

5
between managers and shareholders and solves some of the agency problems that can be
created with the opposition of interests between managers and investors (Frankfurter
and Lane (1992)).
Next, following Ling (2008), we will list the most important dividend related theories,
focusing on the following ones: dividend irrelevance theory, agency theory, information
asymmetry, Bird-in-Hand fallacy, clientele effect and finally, the most relevant one to
our own study, the dividend signalling theory. We will obviously be focusing on the
Signalling Hypothesis as that is the theory that is being tested in this dissertation.
a) Dividend Irrelevance Theory
This theory was first put forward by Miller and Modigliani (1961) and it states that in a
perfect and efficient market and a world without taxes and transaction costs, dividends
are irrelevant and because of that the value and investment decisions of a company are
indifferent from the dividend policy.
Because of the irrelevance of dividends in such a world, the pattern of cash flows
provided in the dividend policy is also irrelevant as shareholders are free to mould the
pattern to suit their consumption patterns using the capital market (Lumby and Jones
(1981)). The only source of value for shareholders is the investment decision alone.
b) Agency Theory
The Agency Theory is born from the existence of a conflict between managers and
investors. This conflict exists when there are differences in ownership and control of the
company. On one hand managers must make decisions focusing on maximizing the
shareholder’s wealth, on the other hand managers can also make decisions for their own
personal interest.
In order to guarantee that the shareholder’s best interest is safeguarded, they must
impose monitoring actions but doing so creates a trade-off for both parties. For
shareholders the trade-off consists between monitoring costs and the compensation to
motivate the manager to act on the owner’s best interest. For managers the trade-off
consists between maximizing shareholder’s wealth and their own interests.
6
Rozeff (1982) defends that the greater the dividend the better it is for the company
because the agency costs between shareholders and managers will be greatly reduced.
The logic is that a dividend policy with higher dividends means that managers will be
looking for financing outside the company and that leads to higher scrutiny of firm’s
operations.
c) Information asymmetry
This theory is related to the fact that there is a difference between the information that
managers possess and the information that shareholders possess. Managers, as insiders
of the company, naturally possess more information than shareholders since the latter
ones have limited access to information. Knowing this, the dividend policy could be
interpreted as a way, a channel of sorts whose main objective is to signal a firm’s future
prospects to outsiders (Bhattacharya (1979); John and Williams (1985); Miller and
Rock (1985)). Obviously, these problems of asymmetric information become less
important if the ownership of the company is more concentrated (Vieira and Raposo
(2007)).
d) Bird-in-Hand fallacy
The Bird-in-Hand fallacy is based on a behavioural bias from the part of shareholders
who are assumed to be risk-averse and because of that prefer dividends instead of
capital gains because they consider dividends a much more certain source than capital
gains.
The problem with this theory is that when dividend payments are announced the share
price of a firm tends to drop slightly compared to the dividend on the pre-dividend
announcement day so the choice between dividends and share price appreciation is
conditioned. Secondly, when a company increases its dividends without changing their
policy, the payment is financed by issuing new shares and because of that the increase
in dividends is compensated by losing an amount equivalent to the present value of
price appreciation (Damodaran (2001)). The opposite can be said since lower dividends
mean higher investment, higher risk and thus higher share price.

7
e) Clientele effect
This theory presupposes imperfections in the capital market so there are taxes,
transaction costs, limited amount of capital, different interest rates, asymmetric
information which means that it presupposes a world completely different from the
world envisioned by Miller and Modigliani.
In such a world shareholders will be faced with costs every time changes in the dividend
policy are made. Therefore, wealth maximization may not be the only desire for
shareholders and they may appreciate a stable flow of dividends that can be used to
counter the extra costs and match the desired consumption pattern of shareholders
(Lumby and Jones (1981)).
So, the company is faced with a dilemma: increase dividends too much and you are left
with less cash flows to finance new projects and your only alternative is external
financing which is much more costly. Because of this companies tend to prefer stable
dividend policies in order to incur lesser costs.
f) Dividend Signalling Theory
The Dividend Signalling Theory implies that dividends contain information that can be
used to signal the market about a firm’s future prospects, namely its earnings, by
pushing share prices upward and further increasing the returns to shareholders. This is a
theory first presented by Miller and Modigliani (1961), who refer to this as the
“information content of dividends”.
To further this theory we must first state how Miller and Modigliani valued a company:
through its future earnings and not its current earnings. Since the dividend policy
depends on the earnings of a firm it would seem logical to say that its dividends could
contain information about expected future earnings, which means that dividends would
be a kind of surrogate for these earnings. Lintner (1956) conducted studies that suggest
that current dividends are dependant not only on future but also current and past
earnings.
From here on out there are two distinct views about this theory: those that believe
dividends contain signals about future earnings and those that believe earnings that

8
changes in the dividend policy contain no such insight on future prospects. From the
first group of scholars we should note John Lintner (1956) who showed, through studies,
that changes in earnings will impact the dividend policy. Other studies conducted by
Fama and Babiak (1968) achieved similar results, attesting to dividends changes
containing lagged changes in earnings. On the opposite side, the scholars that argue
against this theory state that companies do not want to decrease dividends because such
a movement is viewed very negatively by the market and tends to cause a decrease in
share prices (Damodaran (2001)).
Over the decades, two different hypotheses related to the Dividend Signalling Theory
have come up: the free cash flow hypothesis and the maturity hypothesis. The free cash
flow hypothesis states that the dividend policy of a firm reflects information on the
investment policies of overinvestment firms (Litzenberger and Ramaswamy (1979)). So,
if a firm increases its dividends it could mean that they lack investment opportunities
and are just trying to attract new investors. The maturity hypothesis states that an
increase in dividends means not only less investment opportunities but as well less
returns on assets, less future earnings prospects and less systematic risks (Grullon et al.
(2002)).
Recently, Karpavicius (2014) showed that dividends have a tendency to be stable and
this is directly related with a firm’s value (the more stable the stream of dividends the
more valuable the firm). Also, the author defends that the relationship between
dividends and future firm performance is a statistical artefact driven by dividends
smoothing and that past studies of the Signalling Theory might be misspecified.
Main literature that supports the Signalling Hypothesis
In this section we will mention a number of past studies that found evidence that
managers use changes in dividends as a way to signal information about future earnings
of a company. Bhattacharya (1979), John and Williams (1985), Miller and Rock (1985),
Fama and French (1998) and more recently Harada and Nguyen (2005) and Baker et al.
(2006) suggest that changes in dividends are a tool that managers frequently use to
convey data about unexpected shock in earnings.
9
Furthermore, Kaplan and Roll (1972) specify that dividends contain important
information about future prospects because financial statements only reflect past
information that can be manipulated by managers. Later studies (Brickley (1983), Healy
and Palepu (1988), Aharony and Dotan (1994)) also found that an increase in dividends
tends to lead to the increase in future earnings. These findings propelled further research
in the topic of the Signalling Hypothesis and thus Aharony and Dotan (1994) found that
firms that decrease dividends experience less unexpected changes in earnings in the
following years. Finally Nissim and Ziv (2001) also found evidence of a positive
relationship between current dividend increases and changes in earnings in the
subsequent two years while controlling a linear form of mean reversion in earnings.
Main literature that goes against the Signalling Hypothesis
One of the first studies that obtained evidence against the Signalling Hypothesis is the
study of Miller and Modigliani (1961). In this study both researchers defend the
irrelevance of dividends and support this claim on the market efficiency theory. Miller
and Modigliani suggest that the only way dividends can carry information content is if
there exists insider information. Later studies by Watts (1973) and Gonedes (1978)
showed that there is no relationship between current dividends and future earnings.
Marsh and Merton (1987) initially defended the Signalling Hypothesis but later
considered it unlikely when finding evidence that managers react to the dividend
announcements of their competitors and as such will always be conditioned when
setting their own firm’s dividend policy. Benartzi et al. (1997) researched the
hypothesis but their findings went against the existence of a relationship between
changes in dividends and changes in earnings in subsequent years. In fact, their research
discovered a new phenomenon: the earnings reversal phenomenon which is identified
when changes in dividends reflect changes in earnings in the current year.
Fudenberg and Tirole (1995), Vieira and Raposo (2007) identified a trend amongst
managers which in turn makes dividends sticky. According to these researchers
managers are unwilling to decrease dividends as they fear negative response by the
shareholders and the market. They only decrease dividends as a last resort and if they
are sure the earnings will not grow in the following years. Abeyratna and Power (2002)
10
stated that dividend cuts represent good news for a declining firm as they represent
attempts by managers to solve the firm’s problems and Grullon et al. (2005) found
evidence that changes in dividends are strongly related to concurrent earnings.
Finally a recent study from DeAngelo et al. (2009) identified the influence of
behavioural bias at the managerial level like overconfidence and the idiosyncratic
preferences of controlling stockholders as having a major impact on the dividend policy.
On the other hand these researchers recognise that managerial signalling has at most a
minor influence in the dividend payout.
2.2. Similar studies
In this section we are going to look at relevant papers that have been published in the
past with the main goal of studying the signalling capacity of dividends. Some of these
papers use the same methodology as the one we will be using for our own study
(looking at the dividend pay-out of firms with high past earnings growth with a decline
after a number of years) while others use different methodologies but also study the
relationship between future earnings prospects and dividends. The following list
consists of these studies:
a) “Reversal of fortune: Dividend signalling and the disappearance of sustained
earnings growth” (DeAngelo et al. (1996))
DeAngelo et al. (1996) studied the signalling content of manager’s dividend decisions
for 145 NYSE firms whose annual earnings decline after nine or more consecutive years
of growth. The authors used Compustat as a database for the sample and found no
support for the notion that dividend decisions help identify firms with superior future
earnings. In fact the study found evidence that dividends tend to be unreliable signals
because of: behavioural bias (over optimism) that leads managers to overestimate future
earnings; modest cash commitments when managers do increase dividends; signs that
managers make mistakes when evaluating the future prospects of the firm.
11
b) “Dividend Cuts, Firm Profitability & Financial Characteristics” (Ap Gwilym et
al. (2004)).
This study investigates the dividend decisions of firms in the UK reporting losses after
sustained periods of profitability. The authors concluded that loss-making firms are
more likely to reduce dividends compared to firms that remain profitable, although a
loss is far from a guarantee that the dividend payment will be reduced. Interesting
enough, the study found that due to the stronger culture of dividend payment in the UK
compared to the US, there is a lower propensity to lower dividends in the UK.
The study also found that the size of a loss as well as leverage to be important factors in
a firm’s dividend policy. Higher levels of debt are consistent with a greater likelihood of
a reduction in the distribution whilst also supressing profitability in the future years.
Profit margins before the loss year can also be considered a significant factor in
dividend policy since firms with a lower margin are more likely to reduce dividends.
Finally, some evidence is found that dividend reductions are a sign that future earnings
will be lower than for non-reducing firms, although the statistical significance of these
findings is quite low.
c) “Disclosure and dividend signalling when sustained earnings growth declines”
(Hussainey and Aal-Eisa (2009))
This study’s aim was to examine whether voluntary disclosure and dividends signal
future earnings for decline earnings growth firms. The study’s methodology is very
similar to the study from DeAngelo et al. (1996) in which the authors examine the
behaviour of 33 non-financial UK firms after a decline of their sustained earnings
growth.
The study found that increasing dividends does not convey value relevant information
about future earnings for decline earnings growth firms. However, based on the
disclosure signalling theory, it was also found that increasing levels of forward-looking
information in annual reports can be an important mechanism for signalling future
earnings for firms.

12
d) “Corporate Payout Policy” (DeAngelo et al. (2009))
In this book the authors compiled all academic research on dividend policy grounded on
the foundations of Lintner and Miller and Modigliani’s work. It was found that a simple
asymmetric information framework emphasized on the need to distribute free cash flow
and that embeds agency costs serves as a good explanation for the main features of
dividend policies (size of dividends, timing and form). The authors also concluded that
signalling, clientele, tax benefits, investors’ behavioural heuristic and investor sentiment
are minor influences on the pay-out policy but behavioural biases from managers and
preferences of controlling shareholders have a first order impact.
e) “Dividend Changes do not Signal Changes in Future Profitability” (Grullon and
Michaely (2005))
This study identified all the dividend announcements made between 1963 and 1997 by
firms listed on the NYSE and AMEX stock exchanges. They make the same restrictions
as the ones in DeAngelo et al. (1996).
The authors show that, after controlling for the well-known nonlinear patterns in the
behaviour of earnings, dividend changes contain no information about future earnings
changes. The authors also show that dividend changes are negatively correlated with
future changes in profitability and investigate whether including dividend changes
improves out-of-sample earnings forecasts. They find that models that include dividend
changes do not outperform those that do not include dividend changes
f) “Do firms use dividend changes to signal future profitability? A simultaneous
equation analysis” (Liu and Chen (2015))
In this study the authors retest the signalling hypothesis by examining whether
managers change dividends to signal their expectation of earnings prospects using a
simultaneous-equation approach which allows for more efficient testing and facilitates
the control of alternative motives managers may have on setting the dividend policy.
The results show that managers change dividends to signal equity-scaled rather than
asset-scaled earnings prospects. They also find evidence that managers also change

13
dividends for signalling previous earnings changes and for catering to dividend
clienteles.
2.3. Critical analysis of the literature reviewed
There is an extensive literature on the topic of the dividend policy but still no conclusive
answer about the informativeness of dividends and their connection with future earnings
growth. As mentioned in the beginning of this dissertation the scholars are divided
between those that believe dividends hold signalling information and those that are
completely against it. However, the more recent studies seem to point against the
Signalling Hypothesis and Behavioural Finance has been used more often as a way to
provide an answer to the Dividend Puzzle.
The key seems to be in explaining the biases behind managers and investors that lead to
the establishment of a dividend policy. In fact, another criticism that can be made to
past literature is that it focuses too much on the role of managers, which although
crucial, is only half of the puzzle. Investors have an appetite for dividends that seems
difficult to justify and few studies focus on their role in this puzzle.
One criticism that can be made on past studies of the Signalling Hypothesis is that they
might be misspecified as there is a chance that scholars are trying to find something that
does not exist and reaching conclusions that are not exactly correct because of their own
biases.
Finally, there is the question of the scope of the previous studies, with most limiting
themselves to one country instead of an entire region or at least a wider sample. There
could be differences in the results caused by cultural factors or development reasons.

14
3. Methodological considerations
In this chapter we will be approaching the methodological considerations of the study.
We will briefly review the methodology chosen by other similar studies and explain the
differences amongst them. In the last section we will be focusing on the methodological
considerations for this study, focusing on the specifications and past literature of the
econometric models that were developed.
The methodology is a key component of every research since it can determine the
success or failure of the study. Even if the study is well performed and follows the
proposed methodology by heart it does not mean that it was a successful study if the
methodology that was proposed in the first place is wrong or simply out-dated.
Knowing this, it is important to review every single methodological consideration from
past studies, compile them and understand which aspects can be applicable in the
current study and which aspects have no place in the study either because they are no
longer viable and there are better ones in the present or simply because they do not
serve the goals of the study.
3.1. Methodological aspects of similar studies
In this section we can see a compilation of the main methodological aspects of each of
the similar studies that have been approached in a previous section. One aspect that is
inevitable in these types of studies is the exclusion of the companies with US SIC codes
6000-6999. This happens because the firms with these codes are financial institutions
and it would be illogical to add these institutions to the sample as they have no bearing
for this study.
By looking at the sample size in each study we can see that the ones that restricted their
sample size with a requirement in terms of years of sustained earnings growth had a
much smaller sample size. The original study of DeAngelo et al. (1996) set a
requirement of 9 years of sustained growth for a firm to be qualified for the sample,
while later studies such as the ones performed by Ap Gwilym et al. (2004) and
Hussainey et al. (2009) required 5 and 4 years respectively. Most studies were focused
on the North American market while only 2 focused on the European market, with 1
country in sight: the United Kingdom.
15
In terms of Database, all the studies that focused on United States firms used Compustat
as their main database while the ones in the United Kingdom used the FAME database.
Finally, when it comes to the statistical analysis most studies decided to follow the
methodology from DeAngelo et al. (1996) using an Earnings Growth Model, the only
differences being that the study from Grullon et al. (2005) adapted the original model
slightly in the form of a Linear Model of Earnings Expectations.
Linear and Non-Linear Models of Earnings Expectations:
The Linear Model of Earnings Expectations was developed by Nissim and Ziv (2001)
and is an updated version of the previous model used by DeAngelo et al. (1996) as well
as other researchers that followed them. Nissim and Ziv (2001) found a positive
association between current dividend changes and future earnings changes and argued
that previous studies were unsuccessful in uncovering the this relation because
researches were using the wrong model to control for the expected changes in earnings.
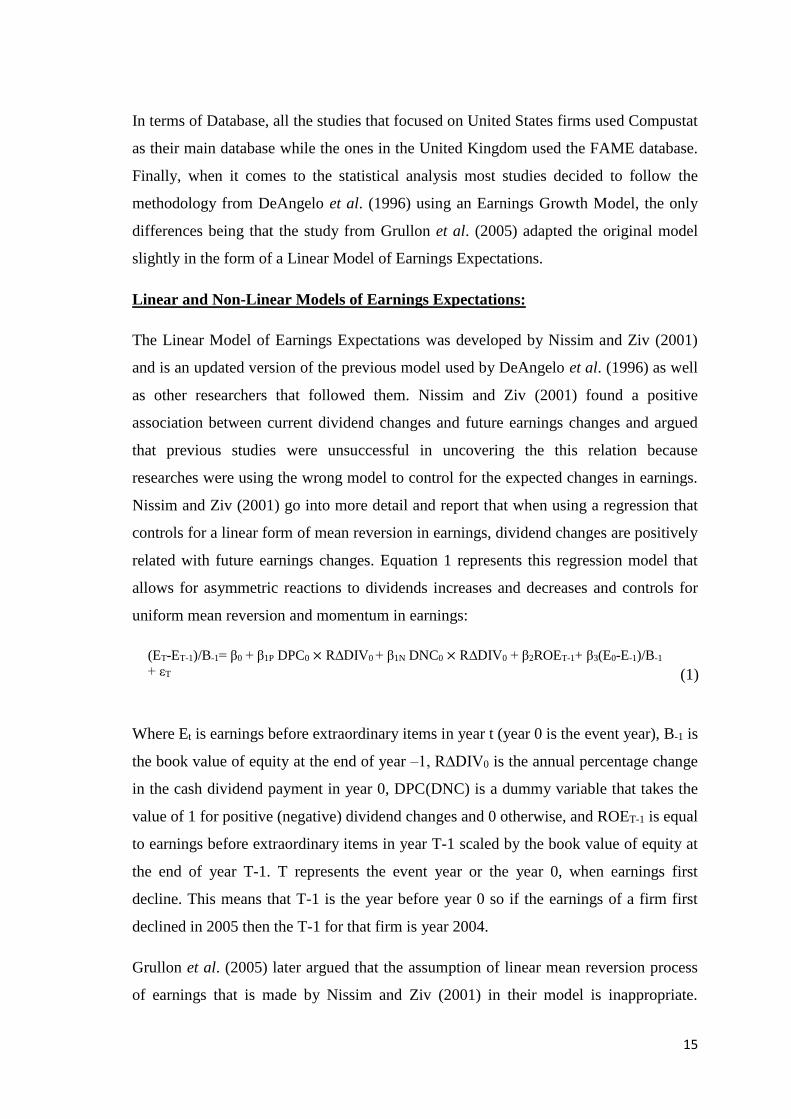
Nissim and Ziv (2001) go into more detail and report that when using a regression that
controls for a linear form of mean reversion in earnings, dividend changes are positively
related with future earnings changes. Equation 1 represents this regression model that
allows for asymmetric reactions to dividends increases and decreases and controls for
uniform mean reversion and momentum in earnings:
(ET-ET-1)/B-1= β0 + β1P DPC0 × R∆DIV0 + β1N DNC0 × R∆DIV0 + β2ROET-1+ β3(E0-E-1)/B-1
+ εT
(1)
Where Et is earnings before extraordinary items in year t (year 0 is the event year), B-1 is
the book value of equity at the end of year –1, R∆DIV0 is the annual percentage change
in the cash dividend payment in year 0, DPC(DNC) is a dummy variable that takes the
value of 1 for positive (negative) dividend changes and 0 otherwise, and ROET-1 is equal
to earnings before extraordinary items in year T-1 scaled by the book value of equity at
the end of year T-1. T represents the event year or the year 0, when earnings first
decline. This means that T-1 is the year before year 0 so if the earnings of a firm first
declined in 2005 then the T-1 for that firm is year 2004.
Grullon et al. (2005) later argued that the assumption of linear mean reversion process
of earnings that is made by Nissim and Ziv (2001) in their model is inappropriate.
16
Grullon et al. (2005) defend that the mean reversion process of earnings is highly non-
linear and thus consider that the positive correlation between dividend changes and
future earnings changes obtained by Nissim and Ziv (2001) is spurious. Grullon et al.
(2005) control the non-linearity by using a model of unexpected earnings that corrects
this problem by assuming the rate of mean reversion and coefficient of autocorrelation
as non-linear. This model also has the advantage of controlling for more factors and
taking advantage of the information contained in the cross-section of earnings. The
Non-Linear Model of Earnings Expectations is represented in equation 2:
(ET-ET-1)/B-1= β0 + β1P DPC0 × R∆DIV0 + β1N DPN0 × R∆DIV0 + (Y1 + Y2NDFED0 +
Y3NDFED0 × DFE0 + Y4PDFED0 × DFE0) × DFE0 + (λ1 + λ2NCED0 + λ3NCED0 × CE0 +
λ4PCED0 × CE0) × CE0 + εT
(2)
where DFE0 = ROE0 – E[ROE0], E[ROE0] is the fitted value from the cross-sectional
regression of ROE0 on the logarithm of total assets in year -1, the logarithm of the
market-to-book ratio of equity in year -1, and ROE-1. PDFED0 (NDFED0) is a dummy
variable that equals to 1 if DFE0 is positive (negative) and 0 otherwise. PCED0 (NCED0)
is a dummy variable that equals 1 if CE0 = (E0 – E-1)/B-1 is positive (negative) and 0
otherwise. In this model β1 can be either positive or negative.
Simultaneous-Equation Model:
The recent study from Liu and Chen (2015) used an updated model that according to the
authors fixed many of the downfalls of the models used in previous literature. The
Simultaneous-Equation Model employs an equation that allows the model to regress
current dividend changes on future earnings changes and at the same time control for
other motives of dividend changes as well. According to the authors this methodology
allows for more accurate testing of the signalling hypothesis because is the signalling
hypothesis is true, meaning that managers possess insider information about firms
earnings prospects and use dividends as a signalling tool, then the implication is that it
should be the forecasted future earnings change that determine current dividend changes
but not the reverse. The Simultaneous-Equation Model is therefore a more efficient
model that examines whether dividends are changed on the basis of manager’s
expectations of earnings prospects.
17
The simultaneous-equation model incorporates a “dividend change equation” and a
“future earnings change equation” where the future earning change equation is the
regression of future earnings changes on dividend changes. The inclusion of the future
earnings change equation together with the dividend change equation addresses the
mutually endogenous problem between dividend changes and future earnings changes
not fully controlled for in previous studies. This means that if a univariate equation is
estimated using the OLS method, the results can be biased and inconsistent and lead to
wrong results. The Simultaneous-Equation Model therefore applies the method of the
two-stage least square (2SLS).
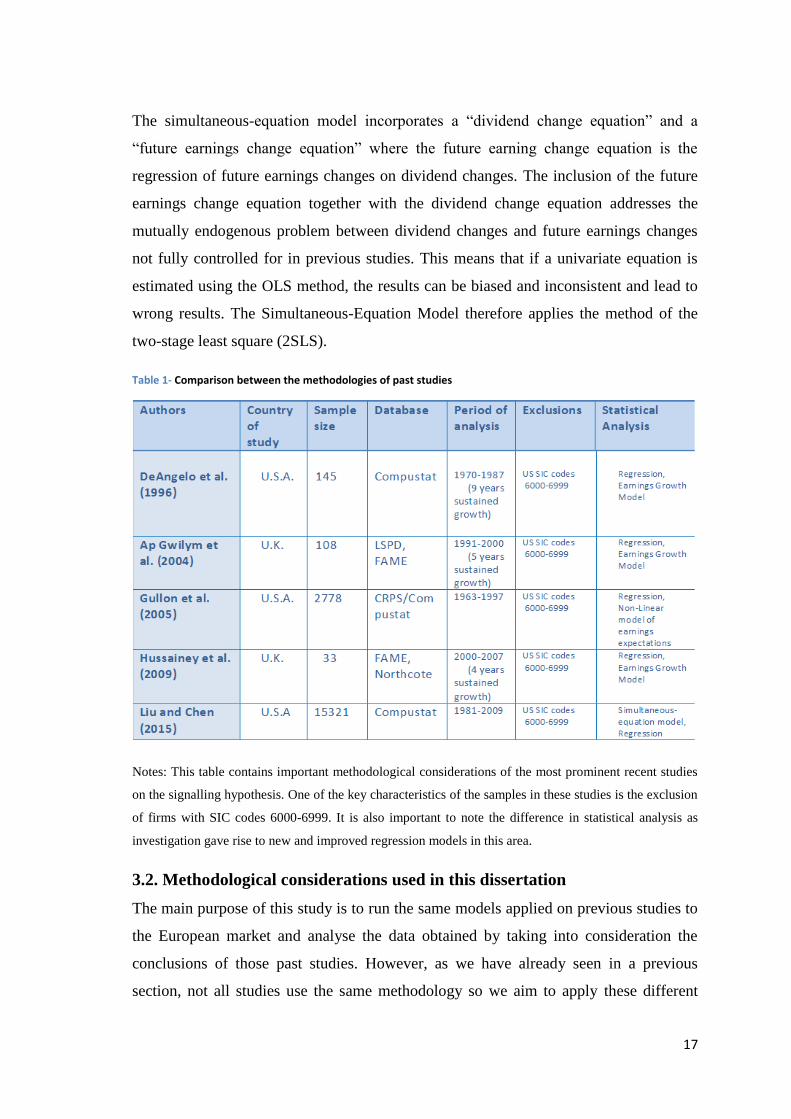
Table 1- Comparison between the methodologies of past studies
Notes: This table contains important methodological considerations of the most prominent recent studies
on the signalling hypothesis. One of the key characteristics of the samples in these studies is the exclusion
of firms with SIC codes 6000-6999. It is also important to note the difference in statistical analysis as
investigation gave rise to new and improved regression models in this area.
3.2. Methodological considerations used in this dissertation
The main purpose of this study is to run the same models applied on previous studies to
the European market and analyse the data obtained by taking into consideration the
conclusions of those past studies. However, as we have already seen in a previous
section, not all studies use the same methodology so we aim to apply these different

18
methodologies used in past studies and by using this approach compare the results
obtained to verify if the simultaneous equation model is indeed superior to the simple
OLS estimation run by the linear model of earnings expectations.
The simultaneous equation model is supposed to be more accurate as it fixes the
mutually endogenous problem between dividend changes and future earnings changes.
If you use a simple OLS estimation the results can be erroneous while a Two-Stage
Least Square regression supposedly leads to better results. The mutually endogenous
problem exists because manager’s expectations of future profitability can influence
dividends and so changes in dividends by result might also influence future profitability
by affecting the capital structure of the companies. The endogenous problem is thus
related to both the dividend changes and future profitability and their relationship so a
stronger and more accurate econometric model is required to test the dividend signalling
theory.
In this study we perform tests of the dividend signalling hypothesis by examining how
current dividend changes are influenced by future earnings changes. By running the
simultaneous-equation model we incorporate an equation that lets us regress current
dividend changes on future earnings changes while controlling for other motives of
dividend changes, as well. This model is based on a principle that we have already
discussed previously: managers change dividends because they know that future
earnings will change. The future earnings do not change because of dividends, it is the
opposite. The models that we implement in our study use actual future earnings changes
as we do not have access to forecasted future earnings changes but considering that
managers have access to insider information, actual future earnings should be positively
related to forecasted earnings.
Chapter 5 of this report will provide the analysis of the results of the model but it is
important to understand exactly the difference between what we are testing. First and
foremost we analyse the results that were obtained by regression using the linear model
of earnings expectations. We begin by examining the relation between dividend changes
and future earnings changes and to do this we estimate the following model:
𝑅∆𝐷𝐼𝑉0 = α0+α1[(ET-ET-1)/B-1]+α2PR∆FCFD-1×R∆FCF-1×NR∆QD-1×R∆Q-1+α3NR∆FCFD-1
×R∆FCF-1×PR∆QD-1×R∆Q-1+α4R∆E-1+α5NDDivP0×R∆DivP0+α6PDDivP0×R∆DivP0+μT (3)

19
Where R∆DIV0 is the annual rate of change in dividend; B-1 is the book value of equity
at the beginning of the dividend-change event year; R∆FCF-1= (FCF-1 – FCF-2)/FCF-2 is
the rate of change in free cash flow in year -1; R∆Q-1 = (Q-1 – Q-2)/Q-2 is the rate of
change in Tobin’s Q in year -1; PR∆FCFD-1(NR∆FCFD-1) is a dummy variable that
equals 1 for positive R∆FCF-1 and 0 otherwise; PR∆QD-1(NR∆QD-1) is a dummy
variable that equals 1 for positive R∆Q-1 and 0 otherwise; R∆E-1 = (E-1 – E-2)/E-2 is the
rate of change in earnings in year -1; R∆DivP0 = (DivP0 – DivP-1)/DivP-1 is the
contemporaneous dividend premium change rate; PDDivP0 (NDDivP0) is a dummy
variable that equals 1 if R∆DivP0 is positive and 0 otherwise. According to the
signalling hypothesis α1 should be positive, α2 and α3 should be positive and negative
respectively.
Equation 3 is also the dividend change equation in the simultaneous-equation model
but we first begin by running the OLS estimation and analysing the results that we
obtained before introducing the Two-Stage Least Square regression and the second
equation, the future earning change equation, both on the linear form and nonlinear
form.
As explained in this section, the dividend-signalling hypothesis states that managers
change dividends in order to signal earnings prospects. This is not the only reason but it
represents the epicentre of the hypothesis. Knowing this, firms that predict higher
(lower) earnings prospects are expected to pay out more (less) dividends and this
implies that dividend changes depends on future earnings changes. Equation 3 is used in
our OLS estimation and represents this hypothesis in that we regress dividend changes
on future equity-scaled earnings changes, thus the name “dividend change equation”. In
order for the theory to prove true the coefficient of future equity—scaled earnings
changes should be positive and significant. But this equation contains other variables
and these variables exist in order to control for the additional motives that lead
managers to change dividends like:
a) Reduction of agency costs- managers may want to increase dividends in order
to reduce the natural costs that exist from the fact that the relation between
managers and investors is not symmetrical. Managers have inside information
20
and their own motivations while investors do not have access to this information
and want to see their investment returned and generating profits.
The free cash flow hypothesis states that managers may increase dividends by
using surplus cash that went unused after all positive NPV projects were
financed in order to reduce these agency costs. In order for this theory to hold
true in the model then dividends must increase (decrease) as free cash flow
increases (decreases) and investment opportunities decrease (increase). Thus the
model adds a variable for positive (negative) changes in preceding free cash
flow and negative (positive) changes in preceding investment opportunity set
and the coefficient must be positive in order to validate the theory. The free cash
flow is calculated using equation 4 from Liu et al. (2015):
FCF = EBITDA – Income Taxes − Changes in Working Capital − Capex
(4)
For measuring the investment opportunity set the variable that is computed in
the equation is Tobin’s Q because Adam and Goyal (2008) show that it has
higher information content with respect to investment opportunities than other
measures such as the market-to-book equity ratio, the earnings-price ratio and
the ratio of capital expenditures over the net book value of plant, property and
equipment. Tobin’s Q is thus calculated using equation 5 from Damodaran
(2006) in “Damodaran on Valuation”:
𝐓𝐨𝐛𝐢𝐧′𝐬 𝐐 =
(𝑀𝑎𝑟𝑘𝑒𝑡 𝐶𝑎𝑝 + 𝐶𝑢𝑟𝑟𝑒𝑛𝑡 𝐿𝑖𝑎𝑏𝑖𝑙𝑖𝑡𝑖𝑒𝑠 + 𝐿𝑜𝑛𝑔 𝑇𝑒𝑟𝑚 𝐷𝑒𝑏𝑡)
(𝑇𝑜𝑡𝑎𝑙 𝐴𝑠𝑠𝑒𝑡𝑠 + 𝐶𝑢𝑟𝑟𝑒𝑛𝑡 𝐿𝑖𝑎𝑏𝑖𝑙𝑖𝑡𝑖𝑒𝑠 + 𝐿𝑜𝑛𝑔 𝑇𝑒𝑟𝑚 𝐷𝑒𝑏𝑡)
(5)
b) Confirming the persistence of previous earnings changes- Managers may
want to manipulate the dividend policy in order to validate their belief that
earnings will continue to increase (decrease) or remain constant with previous
financial exercises. To test this theory the equation includes as an additional
variable the rate of change in earnings one year before the dividend-change
event year in the equation and its coefficient should be positive if the theory is to
hold true.
21
c) Catering to dividend clienteles- Some managers use the dividend policy as a
sort of ritual between themselves and investors. For them it is important to keep
a specific dividend policy constant despite the firm’s future earnings prospects.
Managers may also set a dividend policy that favours investors in order to attract
new investors and gain market benefits as investors naturally pay more for firms
that pay higher cash dividends.
In order to test this hypothesis the equation includes an additional variable, the
contemporaneous changes in the dividend premium (R∆DivP0) which allows for
asymmetric effects of dividend premium increases and decreases. Increasing
(decreasing) the dividend premium should increase (decrease) dividend levels.
Thus the dividend premium (DivP) is a measure used to measure the dividend
preference in the market. According to Baker and Wurgler (2004) the dividend
premium can be calculated as the difference in the logs of the annual market-
value-weighted average market-to-book ratio of dividend paying companies and
dividend non-paying companies:
𝐃𝐢𝐯𝐏 = 𝐿𝑜𝑔 (
𝑀𝑎𝑟𝑘𝑒𝑡
𝐵𝑜𝑜𝑘) 𝑃𝑎𝑦𝑒𝑟 − 𝐿𝑜𝑔 (
𝑀𝑎𝑟𝑘𝑒𝑡
𝐵𝑜𝑜𝑘) 𝑁𝑜𝑛𝑝𝑎𝑦𝑒𝑟
(6)
When the dividend premium is high, this means that non-paying firms try to
cater to the demand of investors by initiating dividends. In the study performed
by Liu and Chen (2015) their sample contained only North-American firms and
because of that they were capable of computing the dividend premium for their
sample simply by collecting those values from Baker and Wurgler’s website
which contains values for the dividend premium until the year of 2010. In the
case of this study we could not collect that information because our sample is
made of European firms and we could not find any study that had already
calculated the dividend premium for European countries.
Another problem that we faced when looking for a way to calculate the dividend
premium for our sample data was that taking into consideration every single
dividend paying company and every non-dividend paying in Europe would lead

22
to an extremely time-consuming exercise that could put at risk the entire study
given the time constraints. In order to solve this we researched past studies on
the dividend premium and came up with a solution from Ferris et al. (2009) who
also calculated the dividend premium for a large number of countries (23) in
their research “Catering effects in corporate dividend policy: The international
evidence”.
Ferris et al. (2009) set a requirement of ten dividend paying companies and ten
non-dividend companies for each country in the sample in order to guarantee
that the dividend premiums are computed based on a minimum number of firms.
We proceeded to do the same calculations in our study and were able to obtain
the values for the dividend premiums for different countries and in different
years with the exception of Estonia, Luxembourg and Czech Republic which
were countries whose companies lacked sufficient financial information in the
database Amadeus. We did not remove them from the sample however since
both Luxembourg and Estonia were represented by only one country each and
Czech Republic only three. The data relative to the dividend premium
calculations will be presented in chapter 5 of this study where we will showcase
the results of the application of the model.
After computing the OLS estimation for the dividend change equation and
presenting the results of the regression we then turn to the simultaneous-
equation model and the Two-Stage Least Square method to compare the results
obtained by both models. As denoted by the name of the method, it is
characterized by two steps or stages of OLS regressions. Stage one is performed
by running the regression of the future earning change equation and obtaining
the fitted values for that regression. Once the software EViews has calculated
the fitted values for that first regression it runs the second step, this is, another
regression using the dividend change equation alongside the previously
calculated fitted values. As we will see just ahead, there are two types of future
earning change equations: linear and nonlinear.
23
Future earning change equation
Most past studies on the dividend signalling hypothesis used a linear model of earnings
expectations to examine the relation between dividend changes and future earnings
changes. This was the case with Nissim and Ziv (2001) who improve the future earning
change equations of past studies which assume that earnings follow a random walk with
drift (DeAngelo et al. (1996)). Their contribution is related to the inclusion of ROE in
the equation, which they consider an important predictor of future earnings changes and
also mean reverting (Fama and French (2000) and Freeman et al. (1982)). Nissim and
Ziv (2001) also make an additional contribution as they believe the relation between
dividend changes and future earnings changes may be due to autocorrelation in the
earnings change series and to test this they include ROET-1 and CE0 = (E0-E-1)/B-1. The
purpose of these variables is to control for the mean reversion and autocorrelation in
earnings while assuming that the rate of mean reversion and the level of autocorrelation
as uniform along the entirety of the observations. The linear model established by
Nissim and Ziv (2001) is the following one:
(ET-ET-1)/B-1 = β0 + β1R∆DIV0 + β2ROET-1 + β3CEO + εT
(7)
Grullon et al. (2005) criticize this linear model exactly because such a regression
assumes that the rate of mean reversion and the level of autocorrelation are uniform
across all observations. This is considered an issue as empirical evidence from past
studies indicates that the mean reversion process of earnings and the level of
autocorrelation are highly non-linear. This means that using the linear model created by
Nissim and Ziv (2001) possibly leads to a spurious positive correlation between
dividend changes and future earnings changes. These findings are based on the studies
by Brook and Buckmaster (1976), Elgers and Lo (1994) and Fama and French (2000).
These authors found out that large changes in earnings revert faster than small changes
and negative changes revert faster than positive changes. Thus assuming a linear model
when the true functional form is nonlinear has the exact same consequences as leaving
out relevant independent variables: the coefficients of the linear model of earnings
expectations are biased.
24
Fama and French (2000) showed in their study that a model with a nonlinear rate of
mean reversion is superior to a model with a uniform rate of mean reversion in
explaining the evolution of earnings. In Grullon et al.’s study they modify Nissim and
Ziv’s model for the nonlinear earnings process by using a modified partial adjustment
model proposed by Fama and French (2000). This model controls for the nonlinearities
in the relation between future earnings changes and lagged earnings levels and changes.
Thus, in our own study we decided to also run the nonlinear regression of Grullon et al.
(2005) and compare the results with those obtained with the linear regression of Nissim
and Ziv (2001). Equation 8 represents the future earnings change equation in its
nonlinear form:
(ET-ET-1)/B-1 = β0 + β1R∆DIV0 + (Y1 + Y2NDFED0 + Y3NDFED0 × DFE0 + Y4PDFED0 ×
DFE0) × DFE0 + (λ1 + λ2NCED0 + λ3NCED0 × CE0 + λ4PCED0 × CE0) × CE0 + εt
(8)
where DFE0 = ROE0 – E[ROE0], E[ROE0] is the fitted value from the cross-sectional
regression of ROE0 on the logarithm of total assets in year -1, the logarithm of the
market-to-book ratio of equity in year -1, and ROE-1. PDFED0 (NDFED0) is a dummy
variable that equals to 1 if DFE0 is positive (negative) and 0 otherwise. PCED0 (NCED0)
is a dummy variable that equals 1 if CE0 = (E0 – E-1)/B-1 is positive (negative) and 0
otherwise. In this model β1 can be either positive or negative.
To conclude, by combining the future earnings change equation with the dividend
change equation in a simultaneous equation framework with the use of a Two-Stage
Least Square regression we should get more accurate results and that is what we have
done, following Liu et al. (2015). In chapter 5 we present the results of these regressions,
analyse and compare the values obtained using the OLS estimation and the 2SLS
estimation. In chapter 6 we also run further regressions as robustness tests, specifically
to gauge the relationship between dividend changes and future asset-scaled earnings
changes, dividend changes and ROE levels, dividend changes and ROA levels and lastly
dividend changes and abnormal earnings.
25
4. Data and Summary Statistics
The methodology of this study follows closely the methodology used in previous studies.
As such the sample contains European firms with a minimum of 5 years of sustained
earnings growth before the first year of decline in earnings. This means that companies
with more than 5 years of sustained earnings growth are also included in the sample.
Amadeus database has information about companies for a period of 10 years, going
from the year of 2005 to the year of 2014 so it would be difficult to find a sample with
considerable size if the restrictions were steeper. There are companies in the sample that
have had earnings growth starting from a period prior to 2005 but these are special cases
of firms that had their financial information available to us in Datastream or through
their annual reports that dated that far back in time.
While using the Database Amadeus, certain restrictions had to be imposed in order to
reflect previous studies. The companies with SIC Codes 6000-6999 were removed
because they are financial institutions and have no part in this study. The sample only
includes firms that are dividend-paying firms so all companies that have had 5 years or
more of sustained growth but don’t pay dividends were removed.
For the gathering of all the data relative to the sample of this study it was also required
the use of the Database Thompson Datastream as Amadeus does not provide
information about the dividends of the firms. Once we had the final list of companies
from Amadeus that met our criterions we had to look for these companies in Datastream
in order to verify if they were in fact dividend-paying companies. To confirm the
accuracy of the databases we inspected each firm’s annual reports for the year that
Amadeus indicates that earnings first decline as well as the previous year. We also
verified the information regarding dividends.
The study follows the rules of an Event study in that it will be divided in 3 stages: pre-
event, on-the-event and post-event. The pre-event represents the 5 years before the first
year of decline and the data relative to these years will be important in calculating the
abnormal future earnings of the sample firms using the growth-adjustment model. The
on-the event represents the first year of decline, the so-called year 0, and data relative to
this year will be important in testing whether the signalling hypothesis holds because it
is the dividend policy set by the managers in this year that could very well reflect what
26
will happen to the sample companies in the following years. Finally, the post-event
represents the 2 years after the first year of decline and the information relative to these
years will be fundamental in testing whether what was predicted by the dividend policy
was in fact correct or not. For this reason companies that had 5 years or more of
consecutive earnings growth with the year 0 being 2014 or 2015 were immediately
deleted from the sample as we did not have sufficient information about the years +1
and +2 and as so we could not run the model including these firms.
Finally we also ended up removing companies that had 5 or more years of sustained
earnings growth that did not have complete information about other key figures in
Amadeus or we couldn’t find their annual reports in the web. This is because in order to
run the models and the respective regressions we needed financial information not only
relative to the dividends and earnings of the company but also the return on assets,
return on equity, book value, liabilities, market capitalization, long term debt, taxes,
Ebitda, changes in working capital, depreciation, Capex, Free Cash Flow to Firm and
total assets.
There were special calculations like the dividend premium, the future abnormal returns
or the DFE0 or CE0 that were required for the estimation of certain equations but the
tables containing the results of these calculations and also the reason behind them will
be discussed further ahead in the chapter related to the application of the model.
Table 2 contains the distribution of countries for the sample of this study. As we can see
most of the firms that have had high earnings growth for a minimum period of 5 years
with a decline afterwards are firms from bigger markets like Great Britain, Germany or
Spain. To eliminate the influence of outliers we truncated two of the top and two of the
bottom firms from the dividend changes distribution. This procedure is consistent with
the study from Grullon et al. (2005) and Liu and Chen (2015). This is done because the
sample size is not big enough to not get majorly influenced by the results of odd
companies that vary from the remaining sample.
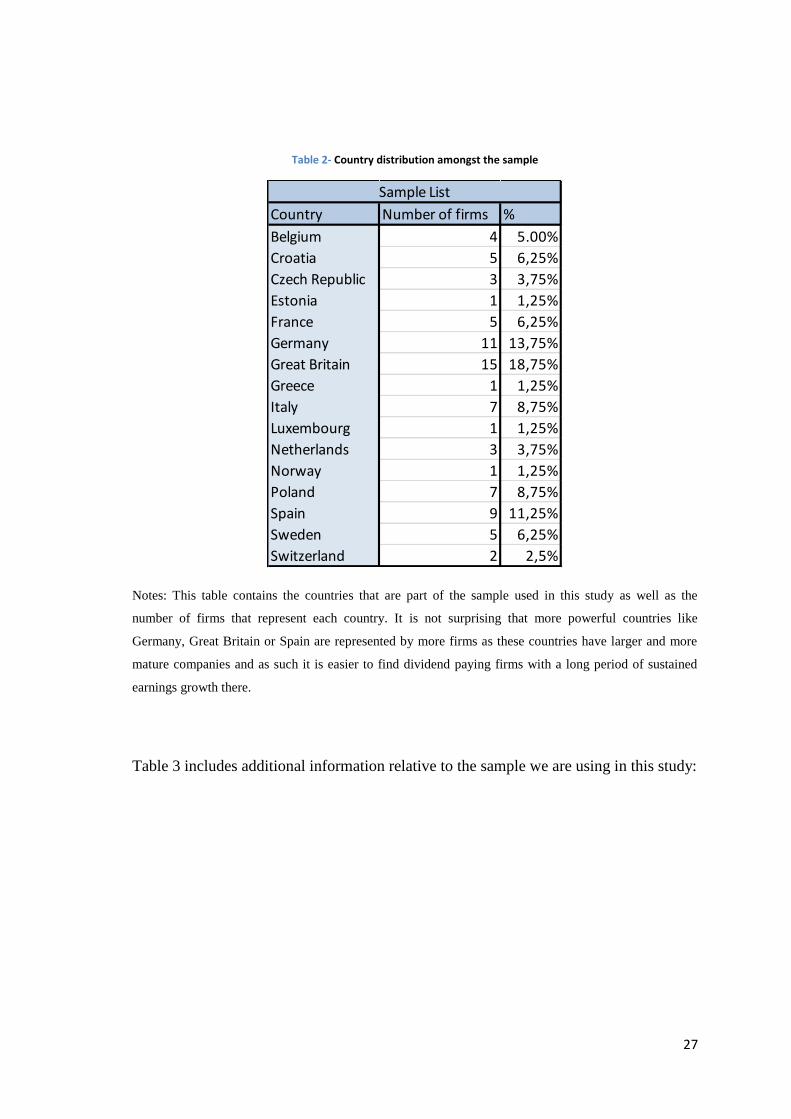
27
Table 2- Country distribution amongst the sample
Notes: This table contains the countries that are part of the sample used in this study as well as the
number of firms that represent each country. It is not surprising that more powerful countries like
Germany, Great Britain or Spain are represented by more firms as these countries have larger and more
mature companies and as such it is easier to find dividend paying firms with a long period of sustained
earnings growth there.
Table 3 includes additional information relative to the sample we are using in this study:
Country Number of firms %
Belgium 4 5.00%
Croatia 5 6,25%
Czech Republic 3 3,75%
Estonia 1 1,25%
France 5 6,25%
Germany 11 13,75%
Great Britain 15 18,75%
Greece 1 1,25%
Italy 7 8,75%
Luxembourg 1 1,25%
Netherlands 3 3,75%
Norway 1 1,25%
Poland 7 8,75%
Spain 9 11,25%
Sweden 5 6,25%
Switzerland 2 2,5%
Sample List
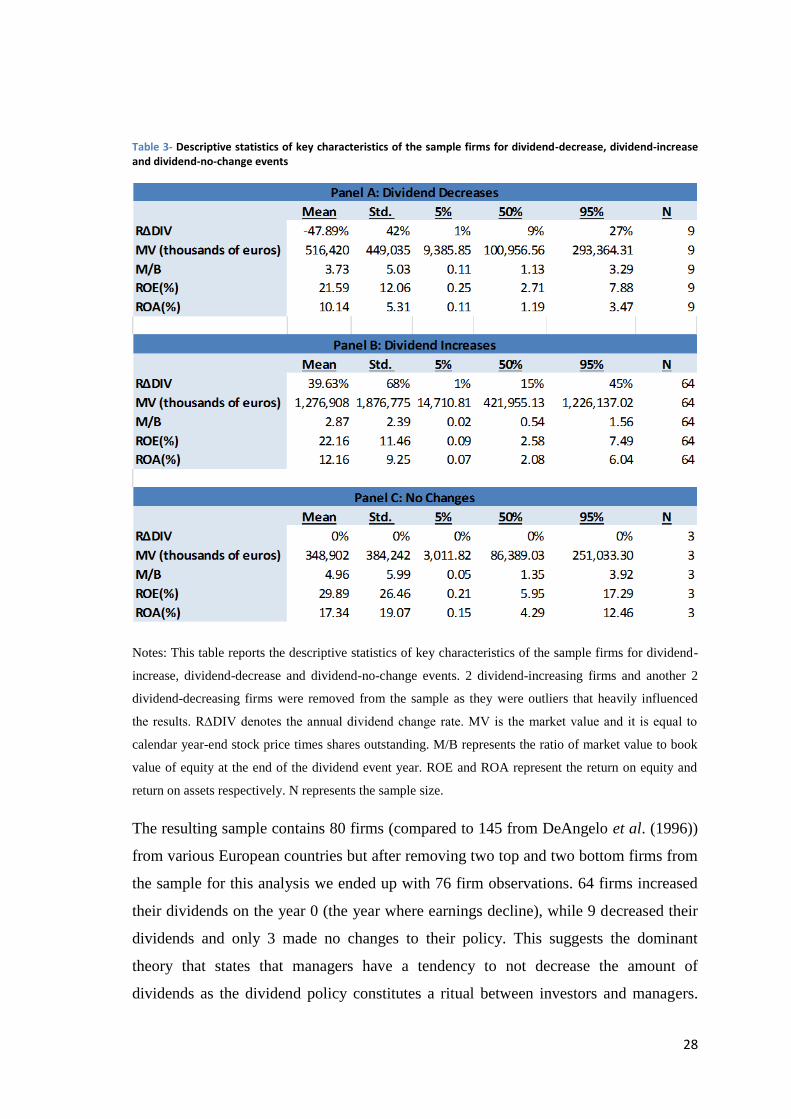
28
Table 3- Descriptive statistics of key characteristics of the sample firms for dividend-decrease, dividend-increase and dividend-no-change events
Notes: This table reports the descriptive statistics of key characteristics of the sample firms for dividend-
increase, dividend-decrease and dividend-no-change events. 2 dividend-increasing firms and another 2
dividend-decreasing firms were removed from the sample as they were outliers that heavily influenced
the results. R∆DIV denotes the annual dividend change rate. MV is the market value and it is equal to
calendar year-end stock price times shares outstanding. M/B represents the ratio of market value to book
value of equity at the end of the dividend event year. ROE and ROA represent the return on equity and
return on assets respectively. N represents the sample size.
The resulting sample contains 80 firms (compared to 145 from DeAngelo et al. (1996))
from various European countries but after removing two top and two bottom firms from
the sample for this analysis we ended up with 76 firm observations. 64 firms increased
their dividends on the year 0 (the year where earnings decline), while 9 decreased their
dividends and only 3 made no changes to their policy. This suggests the dominant
theory that states that managers have a tendency to not decrease the amount of
dividends as the dividend policy constitutes a ritual between investors and managers.
29
Managers are thus reluctant to decrease dividends and the results obtained in this study
are consistent with previous studies.
Table 3 provides descriptive statistics on the annual dividend change rate (R∆DIV),
market value (MV), market to book ratio of equity (M/B), return on equity (ROE) and
return on assets (ROA) for dividend-increasing firms, dividend-decreasing firms and
firms that made no changes to their dividend policy during the event year (the year
when earnings first decline). The average decrease in dividends is 47.89% with a
standard deviation of 42%. The average increase in dividends is 39.63% with a standard
deviation of 68%. After looking at the data in each panel we can come up with an
interesting conclusion: dividend-increasing firms have the highest market value (€1277
million vs. €516 million) which means that they are larger than the dividend-decreasing
firms and those that do not change their dividend policy. This conclusion is also
consistent with previous studies such as Grullon et al. (2005) and Liu and Chen (2015).
Firms that increase dividends are also more profitable than those that do not as their
average ROE and ROA are higher (22.16 vs. 21.59 and 12.16 vs. 10.14) although the
difference in these statistics are not as dramatic as the market value of the companies.
30
5. Empirical Results
5.1. Dividend changes and future equity-scaled earnings changes
5.1.1. Univariate Analysis
The first step before running the simultaneous-equation analysis and the OLS estimation
is to run a univariate analysis of the association between future earning changes and
dividend changes. The results are shown in table 4.
In this analysis we follow the same model as the one used by Nissim and Ziv (2001),
Grullon et al. (2005) and Liu and Chen (2015). As the name of the model indicates, a
univariate analysis includes only 1 independent variable and in this case it is the mean
rate of change in equity-scaled earnings in each of the subsequent two years of the
dividend-change event year [(ET-ET-1)/B-1, T=1 and 2]. The goal is to verify if this
variable is significantly less (more) than zero for the subsamples of dividend decreases
(increases). For the variable, ET denotes income before extraordinary items at the end of
year T after the dividend-change event year and B-1 denotes the book value of equity at
the beginning of the dividend-change event year (year 0).
After conducting the univariate analysis for the entirety of the sample of years and also
for the subsample of different years we came to the conclusion that dividend increases
have positive but insignificant (1%, 5% and 10%) mean rate of change in equity scaled
earnings in both T=1 and T=2. Dividend decreases have positive and insignificant mean
rate of change in equity scaled earnings in T=1 but negative in T=2. If we look at the
subsamples we find that dividend increases have the largest significance rate in T=1 (3
out of 4 compared to 2 out of 4 for dividend decreases). It is interesting to note that in
T=2 the results are mostly insignificant for both dividend increases and decreases at the
1%, 5% and 10% level with just year 2012 proving significant at the 1% level for
dividend decreases.
It seems that the year following the dividend-change event year provides more
significant results for the analysis as both dividend increases and decreases provided
significant results in different years (2011 and 2012 for dividend decreases and 2011,
2012 and 2013 for dividend increases). It is relevant to note however that dividend
increases proved more significant as the results from the years 2011 and 2012 were
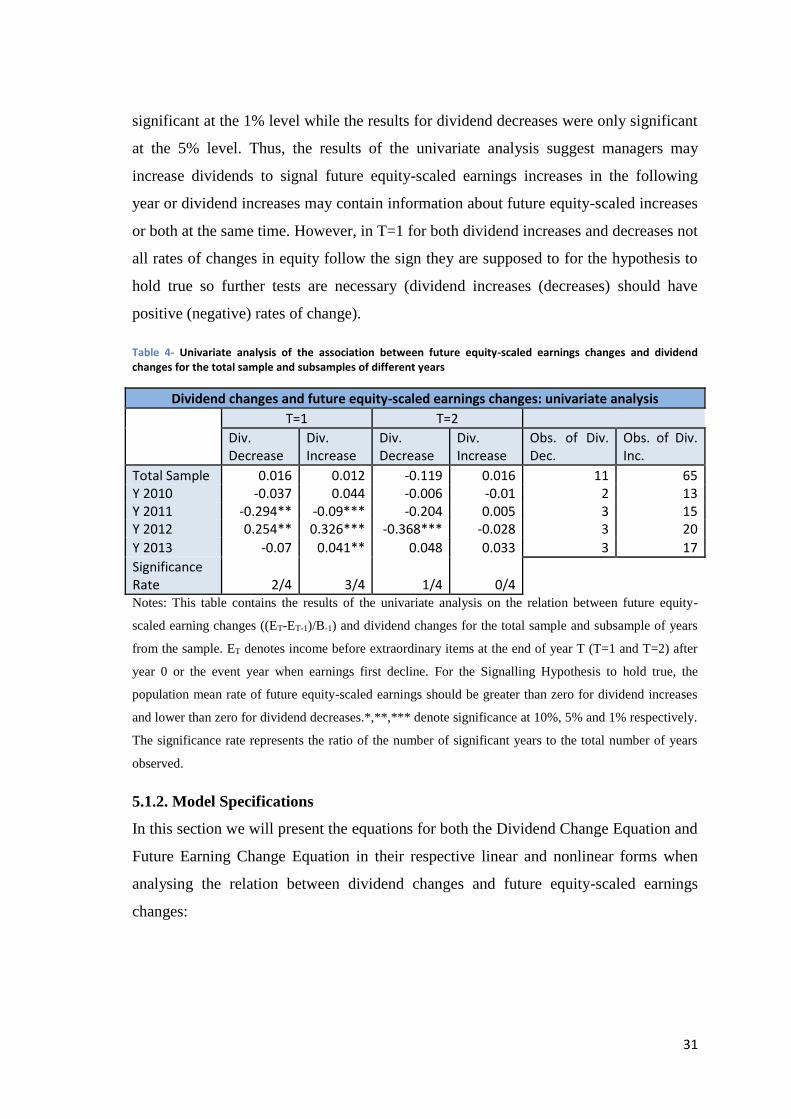
31
significant at the 1% level while the results for dividend decreases were only significant
at the 5% level. Thus, the results of the univariate analysis suggest managers may
increase dividends to signal future equity-scaled earnings increases in the following
year or dividend increases may contain information about future equity-scaled increases
or both at the same time. However, in T=1 for both dividend increases and decreases not
all rates of changes in equity follow the sign they are supposed to for the hypothesis to
hold true so further tests are necessary (dividend increases (decreases) should have
positive (negative) rates of change).
Table 4- Univariate analysis of the association between future equity-scaled earnings changes and dividend changes for the total sample and subsamples of different years
Dividend changes and future equity-scaled earnings changes: univariate analysis
T=1 T=2
Div. Decrease
Div. Increase
Div. Decrease
Div. Increase
Obs. of Div. Dec.
Obs. of Div. Inc.
Total Sample 0.016 0.012 -0.119 0.016 11 65 Y 2010 -0.037 0.044 -0.006 -0.01 2 13 Y 2011 -0.294** -0.09*** -0.204 0.005 3 15 Y 2012 0.254** 0.326*** -0.368*** -0.028 3 20
Y 2013 -0.07 0.041** 0.048 0.033 3 17
Significance Rate 2/4 3/4 1/4 0/4
Notes: This table contains the results of the univariate analysis on the relation between future equity-
scaled earning changes ((ET-ET-1)/B-1) and dividend changes for the total sample and subsample of years
from the sample. ET denotes income before extraordinary items at the end of year T (T=1 and T=2) after
year 0 or the event year when earnings first decline. For the Signalling Hypothesis to hold true, the
population mean rate of future equity-scaled earnings should be greater than zero for dividend increases
and lower than zero for dividend decreases.*,**,*** denote significance at 10%, 5% and 1% respectively.
The significance rate represents the ratio of the number of significant years to the total number of years
observed.
5.1.2. Model Specifications
In this section we will present the equations for both the Dividend Change Equation and
Future Earning Change Equation in their respective linear and nonlinear forms when
analysing the relation between dividend changes and future equity-scaled earnings
changes:
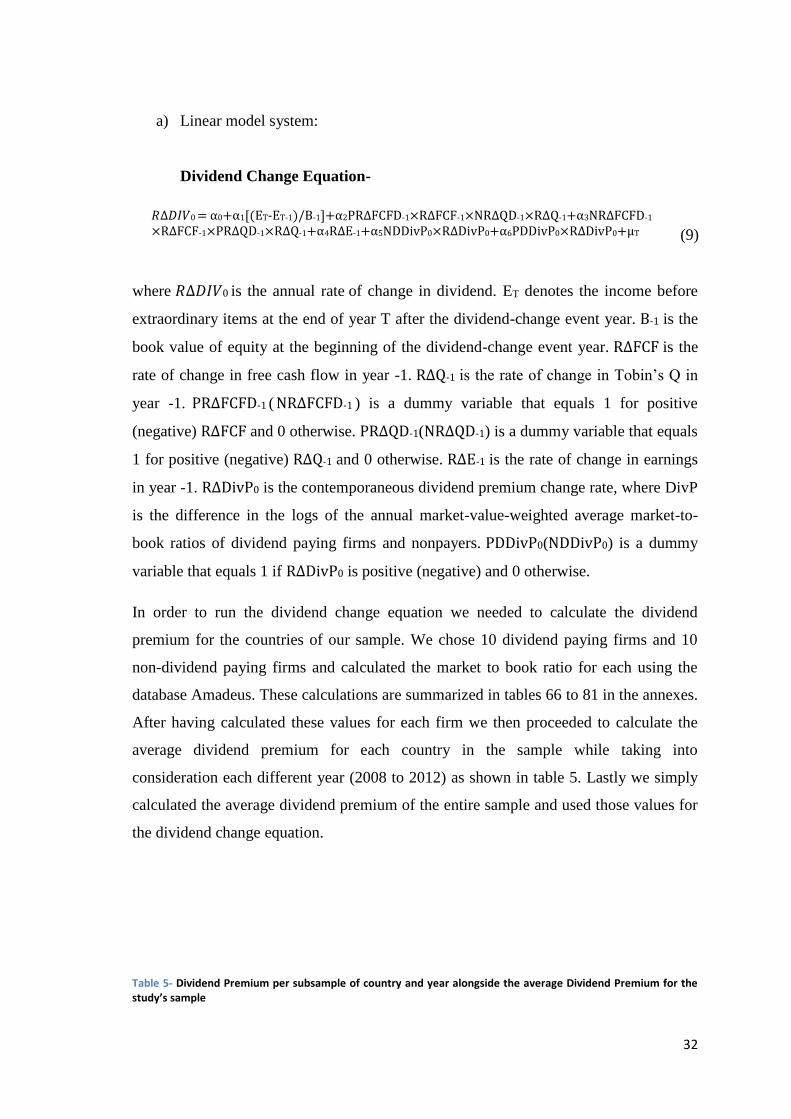
32
a) Linear model system:
Dividend Change Equation-
𝑅∆𝐷𝐼𝑉0 = α0+α1[(ET-ET-1)/B-1]+α2PR∆FCFD-1×R∆FCF-1×NR∆QD-1×R∆Q-1+α3NR∆FCFD-1 ×R∆FCF-1×PR∆QD-1×R∆Q-1+α4R∆E-1+α5NDDivP0×R∆DivP0+α6PDDivP0×R∆DivP0+μT
(9)
where 𝑅∆𝐷𝐼𝑉0 is the annual rate of change in dividend. ET denotes the income before
extraordinary items at the end of year T after the dividend-change event year. B-1 is the
book value of equity at the beginning of the dividend-change event year. R∆FCF is the
rate of change in free cash flow in year -1. R∆Q-1 is the rate of change in Tobin’s Q in
year -1. PR∆FCFD-1 ( NR∆FCFD-1 ) is a dummy variable that equals 1 for positive
(negative) R∆FCF and 0 otherwise. PR∆QD-1(NR∆QD-1) is a dummy variable that equals
1 for positive (negative) R∆Q-1 and 0 otherwise. R∆E-1 is the rate of change in earnings
in year -1. R∆DivP0 is the contemporaneous dividend premium change rate, where DivP
is the difference in the logs of the annual market-value-weighted average market-to-
book ratios of dividend paying firms and nonpayers. PDDivP0(NDDivP0) is a dummy
variable that equals 1 if R∆DivP0 is positive (negative) and 0 otherwise.
In order to run the dividend change equation we needed to calculate the dividend
premium for the countries of our sample. We chose 10 dividend paying firms and 10
non-dividend paying firms and calculated the market to book ratio for each using the
database Amadeus. These calculations are summarized in tables 66 to 81 in the annexes.
After having calculated these values for each firm we then proceeded to calculate the
average dividend premium for each country in the sample while taking into
consideration each different year (2008 to 2012) as shown in table 5. Lastly we simply
calculated the average dividend premium of the entire sample and used those values for
the dividend change equation.
Table 5- Dividend Premium per subsample of country and year alongside the average Dividend Premium for the study’s sample
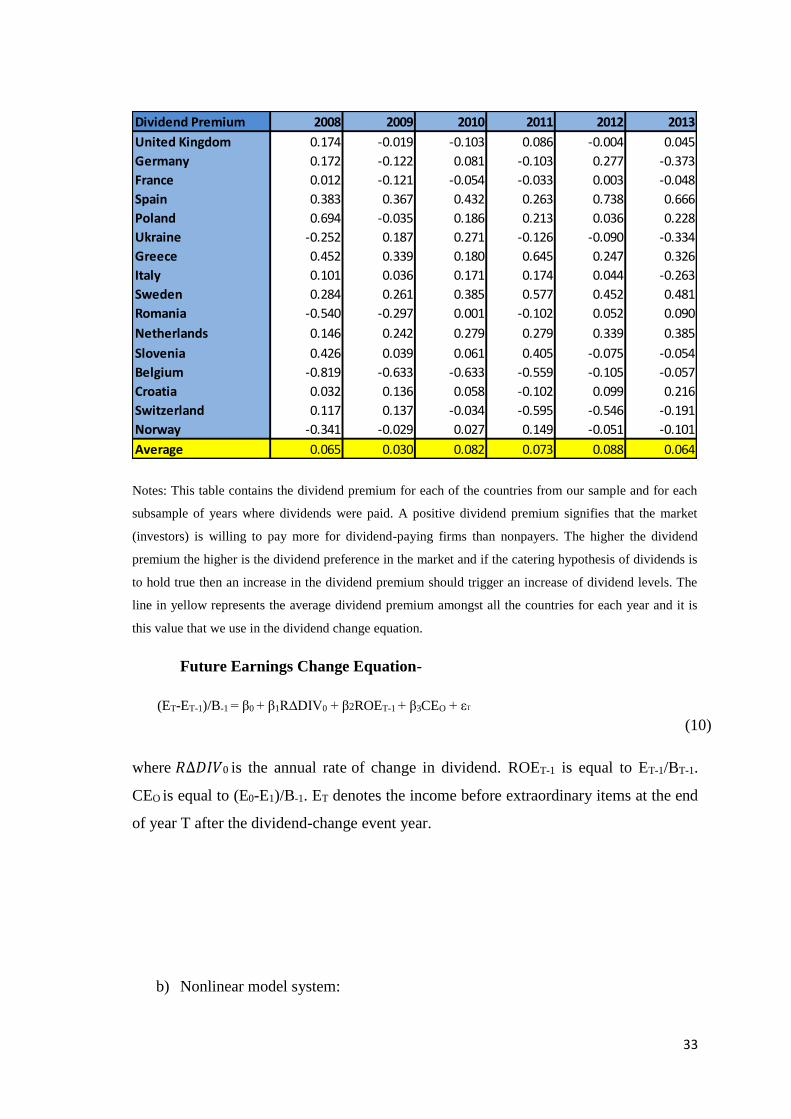
33
Notes: This table contains the dividend premium for each of the countries from our sample and for each
subsample of years where dividends were paid. A positive dividend premium signifies that the market
(investors) is willing to pay more for dividend-paying firms than nonpayers. The higher the dividend
premium the higher is the dividend preference in the market and if the catering hypothesis of dividends is
to hold true then an increase in the dividend premium should trigger an increase of dividend levels. The
line in yellow represents the average dividend premium amongst all the countries for each year and it is
this value that we use in the dividend change equation.
Future Earnings Change Equation-
(ET-ET-1)/B-1 = β0 + β1R∆DIV0 + β2ROET-1 + β3CEO + εT
(10)
where 𝑅∆𝐷𝐼𝑉0 is the annual rate of change in dividend. ROET-1 is equal to ET-1/BT-1.
CEO is equal to (E0-E1)/B-1. ET denotes the income before extraordinary items at the end
of year T after the dividend-change event year.
b) Nonlinear model system:
Dividend Premium 2008 2009 2010 2011 2012 2013
United Kingdom 0.174 -0.019 -0.103 0.086 -0.004 0.045
Germany 0.172 -0.122 0.081 -0.103 0.277 -0.373
France 0.012 -0.121 -0.054 -0.033 0.003 -0.048
Spain 0.383 0.367 0.432 0.263 0.738 0.666
Poland 0.694 -0.035 0.186 0.213 0.036 0.228
Ukraine -0.252 0.187 0.271 -0.126 -0.090 -0.334
Greece 0.452 0.339 0.180 0.645 0.247 0.326
Italy 0.101 0.036 0.171 0.174 0.044 -0.263
Sweden 0.284 0.261 0.385 0.577 0.452 0.481
Romania -0.540 -0.297 0.001 -0.102 0.052 0.090
Netherlands 0.146 0.242 0.279 0.279 0.339 0.385
Slovenia 0.426 0.039 0.061 0.405 -0.075 -0.054
Belgium -0.819 -0.633 -0.633 -0.559 -0.105 -0.057
Croatia 0.032 0.136 0.058 -0.102 0.099 0.216
Switzerland 0.117 0.137 -0.034 -0.595 -0.546 -0.191
Norway -0.341 -0.029 0.027 0.149 -0.051 -0.101
Average 0.065 0.030 0.082 0.073 0.088 0.064
34
Dividend Change Equation-
𝑅∆𝐷𝐼𝑉0 = α0+α1[(ET-ET-1)/B-1]+α2PR∆FCFD-1×R∆FCF-1×NR∆QD-1×R∆Q-1+α3NR∆FCFD-1
×R∆FCF-1×PR∆QD-1×R∆Q-1+α4R∆E-1+α5NDDivP0×R∆DivP0+α6PDDivP0×R∆DivP0+μT
(11)
The dividend change equation is always the same in the linear and nonlinear
formats of each model.
Future Earnings Change Equation-
(ET-ET-1)/B-1 = β0 + β1R∆DIV0 + (Y1 + Y2NDFED0 + Y3NDFED0 × DFE0 + Y4PDFED0 ×
DFE0) × DFE0 + (λ1 + λ2NCED0 + λ3NCED0 × CE0 + λ4PCED0 × CE0) × CE0 + εT
(12)
where DFE0 = ROE0 – E[ROE0], E[ROE0] is the fitted value from the cross-sectional
regression of ROE0 on the logarithm of total assets in year -1, the logarithm of the
market-to-book ratio of equity in year -1, and ROE-1. PDFED0 (NDFED0) is a dummy
variable that equals to 1 if DFE0 is positive (negative) and 0 otherwise. PCED0 (NCED0)
is a dummy variable that equals 1 if CE0 = (E0 – E-1)/B-1 is positive (negative) and 0
otherwise. In this model β1 can be either positive or negative.
We can find the tables with the calculations related to DFE0 in the annexes (table 63 and
table 63).
5.1.3. Regression Results
In this section we will present the results of the OLS and the Two-Stage Least Square
estimations that analyse the relationship between dividend changes and future equity-
scaled earnings changes.
OLS Regression of the dividend change equation
We begin our regressions with the OLS estimation of the dividend change equation
(equation 9). All the values that were used to run the regression in EViews are presented
in tables 47 to 56 in the annexes. Table 6 contains the results for the OLS estimation of
this equation:
Table 6- Simple OLS Regression of the dividend change equation (Dividend Changes and Future Equity-Scaled Earnings Changes)
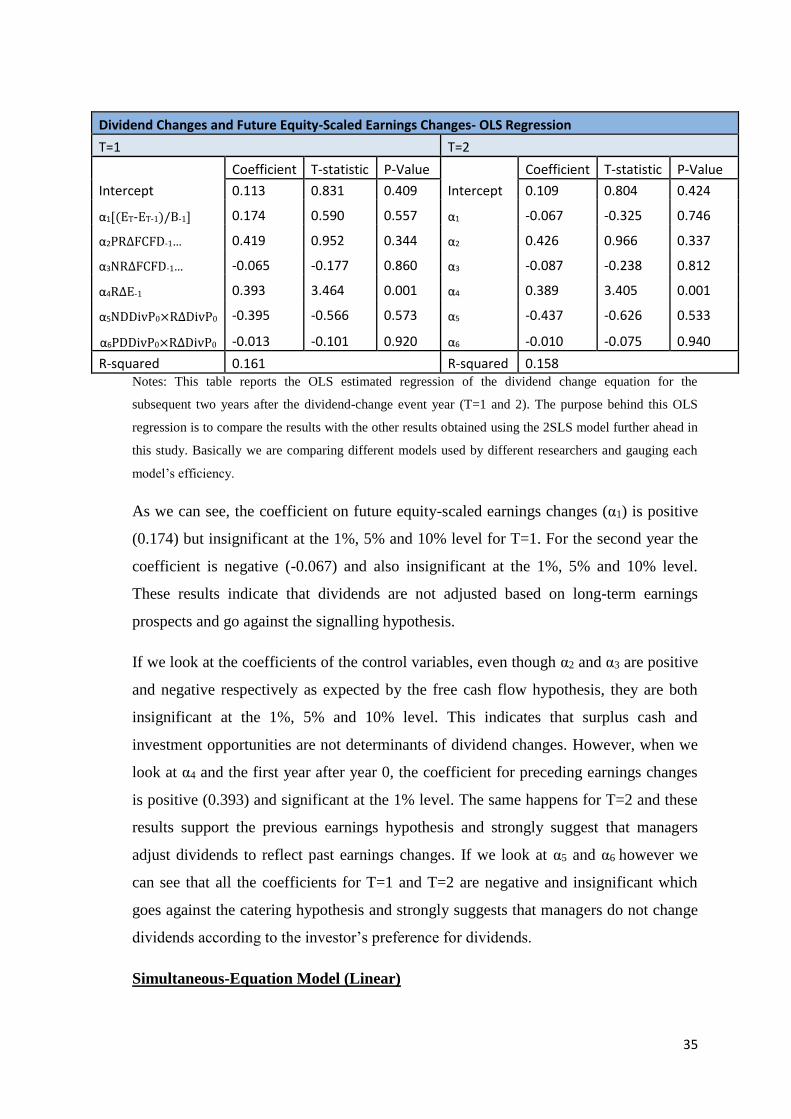
35
Dividend Changes and Future Equity-Scaled Earnings Changes- OLS Regression
T=1 T=2
Coefficient T-statistic P-Value Coefficient T-statistic P-Value
Intercept 0.113 0.831 0.409 Intercept 0.109 0.804 0.424
α1[(ET-ET-1)/B-1] 0.174 0.590 0.557 α1 -0.067 -0.325 0.746
α2PR∆FCFD-1… 0.419 0.952 0.344 α2 0.426 0.966 0.337
α3NR∆FCFD-1… -0.065 -0.177 0.860 α3 -0.087 -0.238 0.812
α4R∆E-1 0.393 3.464 0.001 α4 0.389 3.405 0.001
α5NDDivP0×R∆DivP0 -0.395 -0.566 0.573 α5 -0.437 -0.626 0.533
α6PDDivP0×R∆DivP0 -0.013 -0.101 0.920 α6 -0.010 -0.075 0.940
R-squared 0.161 R-squared 0.158 Notes: This table reports the OLS estimated regression of the dividend change equation for the
subsequent two years after the dividend-change event year (T=1 and 2). The purpose behind this OLS
regression is to compare the results with the other results obtained using the 2SLS model further ahead in
this study. Basically we are comparing different models used by different researchers and gauging each
model’s efficiency.
As we can see, the coefficient on future equity-scaled earnings changes (α1) is positive
(0.174) but insignificant at the 1%, 5% and 10% level for T=1. For the second year the
coefficient is negative (-0.067) and also insignificant at the 1%, 5% and 10% level.
These results indicate that dividends are not adjusted based on long-term earnings
prospects and go against the signalling hypothesis.
If we look at the coefficients of the control variables, even though α2 and α3 are positive
and negative respectively as expected by the free cash flow hypothesis, they are both
insignificant at the 1%, 5% and 10% level. This indicates that surplus cash and
investment opportunities are not determinants of dividend changes. However, when we
look at α4 and the first year after year 0, the coefficient for preceding earnings changes
is positive (0.393) and significant at the 1% level. The same happens for T=2 and these
results support the previous earnings hypothesis and strongly suggest that managers
adjust dividends to reflect past earnings changes. If we look at α5 and α6 however we
can see that all the coefficients for T=1 and T=2 are negative and insignificant which
goes against the catering hypothesis and strongly suggests that managers do not change
dividends according to the investor’s preference for dividends.
Simultaneous-Equation Model (Linear)
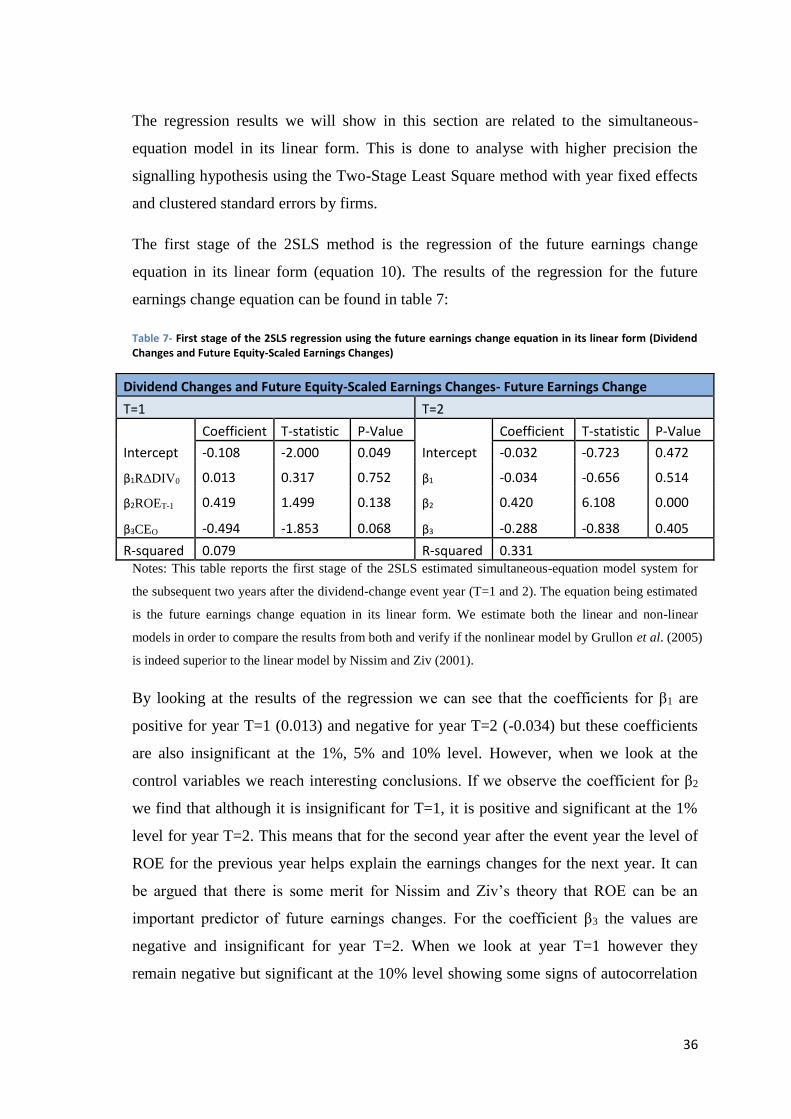
36
The regression results we will show in this section are related to the simultaneous-
equation model in its linear form. This is done to analyse with higher precision the
signalling hypothesis using the Two-Stage Least Square method with year fixed effects
and clustered standard errors by firms.
The first stage of the 2SLS method is the regression of the future earnings change
equation in its linear form (equation 10). The results of the regression for the future
earnings change equation can be found in table 7:
Table 7- First stage of the 2SLS regression using the future earnings change equation in its linear form (Dividend Changes and Future Equity-Scaled Earnings Changes)
Dividend Changes and Future Equity-Scaled Earnings Changes- Future Earnings Change
T=1 T=2
Coefficient T-statistic P-Value Coefficient T-statistic P-Value
Intercept -0.108 -2.000 0.049 Intercept -0.032 -0.723 0.472
β1R∆DIV0 0.013 0.317 0.752 β1 -0.034 -0.656 0.514
β2ROET-1 0.419 1.499 0.138 β2 0.420 6.108 0.000
β3CEO -0.494 -1.853 0.068 β3 -0.288 -0.838 0.405
R-squared 0.079 R-squared 0.331 Notes: This table reports the first stage of the 2SLS estimated simultaneous-equation model system for
the subsequent two years after the dividend-change event year (T=1 and 2). The equation being estimated
is the future earnings change equation in its linear form. We estimate both the linear and non-linear
models in order to compare the results from both and verify if the nonlinear model by Grullon et al. (2005)
is indeed superior to the linear model by Nissim and Ziv (2001).
By looking at the results of the regression we can see that the coefficients for β1 are
positive for year T=1 (0.013) and negative for year T=2 (-0.034) but these coefficients
are also insignificant at the 1%, 5% and 10% level. However, when we look at the
control variables we reach interesting conclusions. If we observe the coefficient for β2
we find that although it is insignificant for T=1, it is positive and significant at the 1%
level for year T=2. This means that for the second year after the event year the level of
ROE for the previous year helps explain the earnings changes for the next year. It can
be argued that there is some merit for Nissim and Ziv’s theory that ROE can be an
important predictor of future earnings changes. For the coefficient β3 the values are
negative and insignificant for year T=2. When we look at year T=1 however they
remain negative but significant at the 10% level showing some signs of autocorrelation

37
between the earnings of year 1 and those of year 0. Since the p-value is not that high
and the same does not happen in year T=2 we must take these conclusions with a grain
of salt.
Having run the regression for the future earnings change equation it is time for the
second stage of the 2SLS regression which focuses on the dividend change equation
(equation 9). Eviews takes the fitted values from the first regression and automatically
uses them for this second stage. Table 8 presents the results for this step of the
simultaneous-equation model:
Table 8- Second stage of the 2SLS regression using the dividend change equation in its linear form (Dividend Changes and Future Equity-Scaled Earnings Changes)
Dividend Changes and Future Equity-Scaled Earnings Changes- Dividend Change Equation
T=1 T=2
Coefficient T-statistic P-Value Coefficient T-statistic P-Value
Intercept 0.173 1.364 0.177 Intercept 0.117 0.845 0.401
α1[(ET-ET-1)/B-1] 4.233 3.442 0.001 α1 -0.152 -0.409 0.684
α2PR∆FCFD-1… 0.849 1.998 0.050 α2 0.378 0.818 0.416
α3NR∆FCFD-1… 0.115 0.333 0.740 α3 -0.087 -0.238 0.812
α4R∆E-1 0.258 2.289 0.025 α4 0.383 3.303 0.002
α5NDDivP0×R∆DivP0 -0.485 -0.749 0.456 α5 -0.415 -0.595 0.554
α6PDDivP0×R∆DivP0 0.066 0.528 0.599 α6 -0.011 -0.082 0.935
R-squared 0.275 R-squared 0.159 Notes: This table reports the second stage of the 2SLS estimated simultaneous-equation model system for
the subsequent two years after the dividend-change event year (T=1 and 2). The equation being estimated
is the Dividend Change Equation in its linear form.
In the dividend change equation the coefficient on future equity-scaled changes (α1) in
the linear model system is positive and significant at the 1% level for T=1. If we look at
T=2 the coefficient is negative and insignificant. These results indicate that the dividend
policy is changed based on future earnings prospects. When managers forecast earning
levels for one year from now they signal this information to investors by changing the
dividend policy. This is strong evidence in favour of the dividend signalling hypothesis.
If we look at the control variables only α2 and α4 provide significant results. The
coefficient α2 is positive and significant at the 5% level in year T=1. This result
indicates that surplus cash was an important factor in determining the dividend policy

38
and supports the free cash flow hypothesis. The same does not happen for year T=2 as
the coefficient is indeed positive but insignificant. The coefficient on the preceding
earnings changes (α4) is also significant and positive but this time this happens for both
T=1 and T=2. For T=1 the coefficient is significant at the 5% level (0.025) and for T=2
the coefficient is strongly significant at the 1% level (0.002). This result supports the
previous earnings hypothesis and tells us that managers change dividends not only to
signal future earnings prospects but also to reflect past earnings changes.
Overall, the results of the 2SLS regression shows us that dividend changes cannot serve
as a tool to predict firm equity-scaled earnings prospects even if dividend changes can
be used by managers as a signalling tool.
Simultaneous-Equation Model (Nonlinear)
In this section we perform the exact same regressions using the 2SLS model with the
difference being the usage of the nonlinear form of the future earnings change equation
(equation 12). In table 9 we can find the results of the first stage of the 2SLS regression,
where we estimate the future earnings change equation:
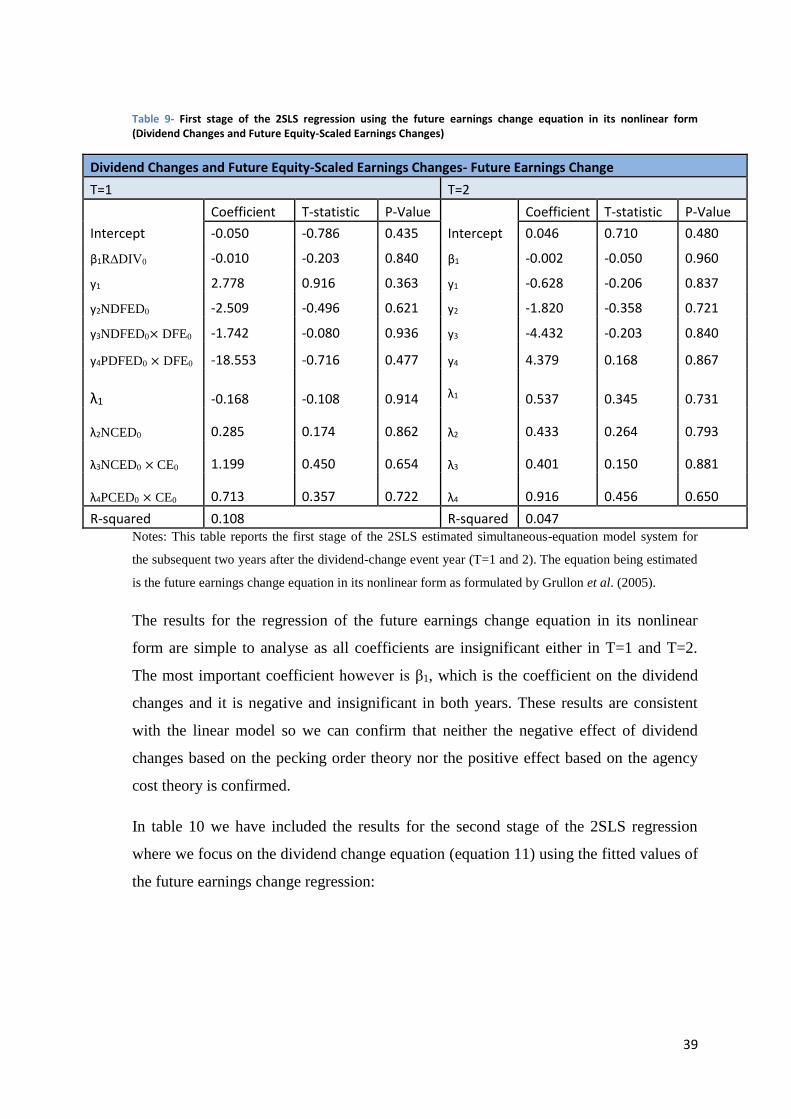
39
Table 9- First stage of the 2SLS regression using the future earnings change equation in its nonlinear form (Dividend Changes and Future Equity-Scaled Earnings Changes)
Dividend Changes and Future Equity-Scaled Earnings Changes- Future Earnings Change
T=1 T=2
Coefficient T-statistic P-Value Coefficient T-statistic P-Value
Intercept -0.050 -0.786 0.435 Intercept 0.046 0.710 0.480
β1R∆DIV0 -0.010 -0.203 0.840 β1 -0.002 -0.050 0.960
y1 2.778 0.916 0.363 y1 -0.628 -0.206 0.837
y2NDFED0 -2.509 -0.496 0.621 y2 -1.820 -0.358 0.721
y3NDFED0× DFE0 -1.742 -0.080 0.936 y3 -4.432 -0.203 0.840
y4PDFED0 × DFE0 -18.553 -0.716 0.477 y4 4.379 0.168 0.867
λ1 -0.168 -0.108 0.914
λ1 0.537 0.345 0.731
λ2NCED0 0.285 0.174 0.862
λ2 0.433 0.264 0.793
λ3NCED0 × CE0 1.199 0.450 0.654
λ3 0.401 0.150 0.881
λ4PCED0 × CE0 0.713 0.357 0.722
λ4 0.916 0.456 0.650
R-squared 0.108 R-squared 0.047 Notes: This table reports the first stage of the 2SLS estimated simultaneous-equation model system for
the subsequent two years after the dividend-change event year (T=1 and 2). The equation being estimated
is the future earnings change equation in its nonlinear form as formulated by Grullon et al. (2005).
The results for the regression of the future earnings change equation in its nonlinear
form are simple to analyse as all coefficients are insignificant either in T=1 and T=2.
The most important coefficient however is β1, which is the coefficient on the dividend
changes and it is negative and insignificant in both years. These results are consistent
with the linear model so we can confirm that neither the negative effect of dividend
changes based on the pecking order theory nor the positive effect based on the agency
cost theory is confirmed.
In table 10 we have included the results for the second stage of the 2SLS regression
where we focus on the dividend change equation (equation 11) using the fitted values of
the future earnings change regression:
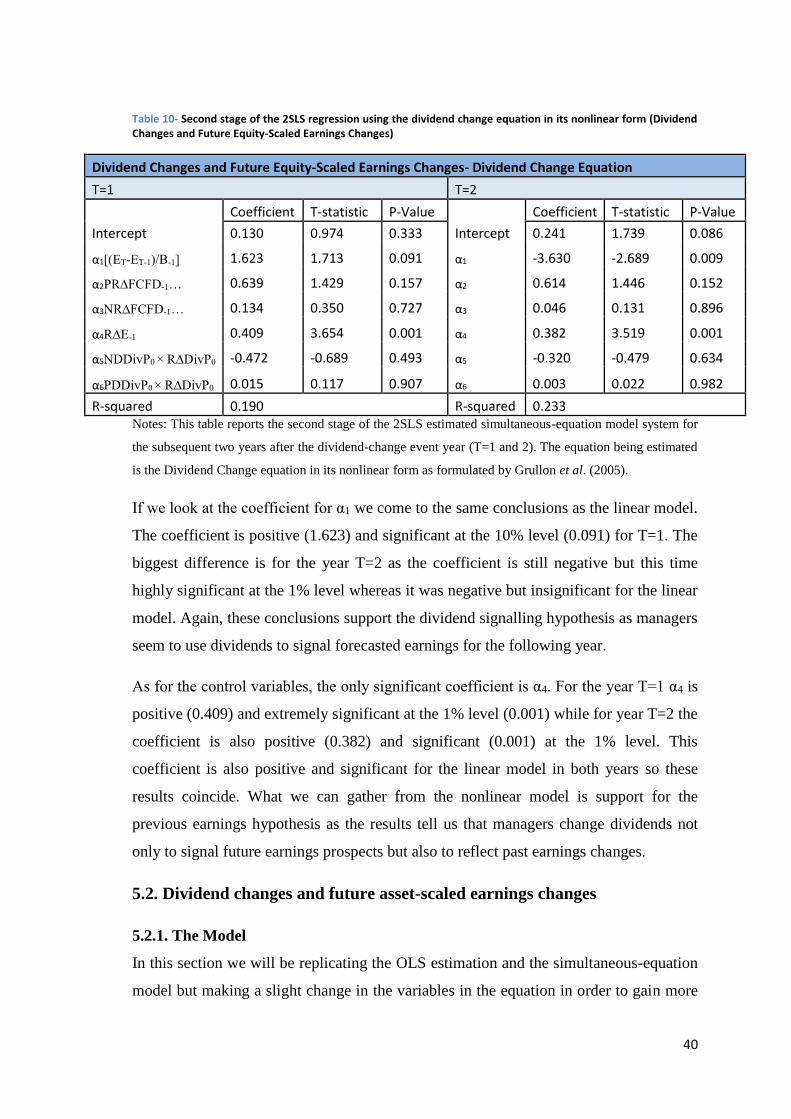
40
Table 10- Second stage of the 2SLS regression using the dividend change equation in its nonlinear form (Dividend Changes and Future Equity-Scaled Earnings Changes)
Dividend Changes and Future Equity-Scaled Earnings Changes- Dividend Change Equation
T=1 T=2
Coefficient T-statistic P-Value Coefficient T-statistic P-Value
Intercept 0.130 0.974 0.333 Intercept 0.241 1.739 0.086
α1[(ET-ET-1)/B-1] 1.623 1.713 0.091 α1 -3.630 -2.689 0.009
α2PR∆FCFD-1… 0.639 1.429 0.157 α2 0.614 1.446 0.152
α3NR∆FCFD-1… 0.134 0.350 0.727 α3 0.046 0.131 0.896
α4R∆E-1 0.409 3.654 0.001 α4 0.382 3.519 0.001
α5NDDivP0 × R∆DivP0 -0.472 -0.689 0.493 α5 -0.320 -0.479 0.634
α6PDDivP0 × R∆DivP0 0.015 0.117 0.907 α6 0.003 0.022 0.982
R-squared 0.190 R-squared 0.233 Notes: This table reports the second stage of the 2SLS estimated simultaneous-equation model system for
the subsequent two years after the dividend-change event year (T=1 and 2). The equation being estimated
is the Dividend Change equation in its nonlinear form as formulated by Grullon et al. (2005).
If we look at the coefficient for α1 we come to the same conclusions as the linear model.
The coefficient is positive (1.623) and significant at the 10% level (0.091) for T=1. The
biggest difference is for the year T=2 as the coefficient is still negative but this time
highly significant at the 1% level whereas it was negative but insignificant for the linear
model. Again, these conclusions support the dividend signalling hypothesis as managers
seem to use dividends to signal forecasted earnings for the following year.
As for the control variables, the only significant coefficient is α4. For the year T=1 α4 is
positive (0.409) and extremely significant at the 1% level (0.001) while for year T=2 the
coefficient is also positive (0.382) and significant (0.001) at the 1% level. This
coefficient is also positive and significant for the linear model in both years so these
results coincide. What we can gather from the nonlinear model is support for the
previous earnings hypothesis as the results tell us that managers change dividends not
only to signal future earnings prospects but also to reflect past earnings changes.
5.2. Dividend changes and future asset-scaled earnings changes
5.2.1. The Model
In this section we will be replicating the OLS estimation and the simultaneous-equation
model but making a slight change in the variables in the equation in order to gain more
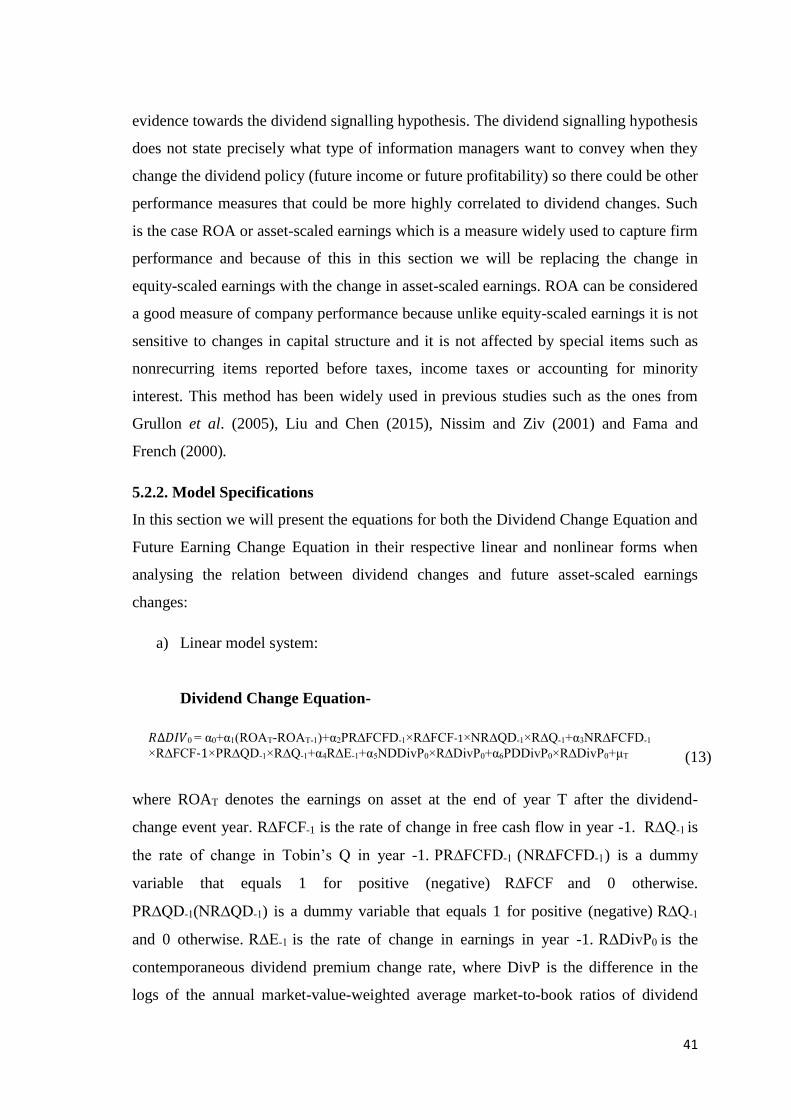
41
evidence towards the dividend signalling hypothesis. The dividend signalling hypothesis
does not state precisely what type of information managers want to convey when they
change the dividend policy (future income or future profitability) so there could be other
performance measures that could be more highly correlated to dividend changes. Such
is the case ROA or asset-scaled earnings which is a measure widely used to capture firm
performance and because of this in this section we will be replacing the change in
equity-scaled earnings with the change in asset-scaled earnings. ROA can be considered
a good measure of company performance because unlike equity-scaled earnings it is not
sensitive to changes in capital structure and it is not affected by special items such as
nonrecurring items reported before taxes, income taxes or accounting for minority
interest. This method has been widely used in previous studies such as the ones from
Grullon et al. (2005), Liu and Chen (2015), Nissim and Ziv (2001) and Fama and
French (2000).
5.2.2. Model Specifications
In this section we will present the equations for both the Dividend Change Equation and
Future Earning Change Equation in their respective linear and nonlinear forms when
analysing the relation between dividend changes and future asset-scaled earnings
changes:
a) Linear model system:
Dividend Change Equation-
𝑅∆𝐷𝐼𝑉0 = α0+α1(ROAT-ROAT-1)+α2PR∆FCFD-1×R∆FCF-1×NR∆QD-1×R∆Q-1+α3NR∆FCFD-1
×R∆FCF-1×PR∆QD-1×R∆Q-1+α4R∆E-1+α5NDDivP0×R∆DivP0+α6PDDivP0×R∆DivP0+μT
(13)
where ROAT denotes the earnings on asset at the end of year T after the dividend-
change event year. R∆FCF-1 is the rate of change in free cash flow in year -1. R∆Q-1 is
the rate of change in Tobin’s Q in year -1. PR∆FCFD-1 (NR∆FCFD-1) is a dummy
variable that equals 1 for positive (negative) R∆FCF and 0 otherwise.
PR∆QD-1(NR∆QD-1) is a dummy variable that equals 1 for positive (negative) R∆Q-1
and 0 otherwise. R∆E-1 is the rate of change in earnings in year -1. R∆DivP0 is the
contemporaneous dividend premium change rate, where DivP is the difference in the
logs of the annual market-value-weighted average market-to-book ratios of dividend
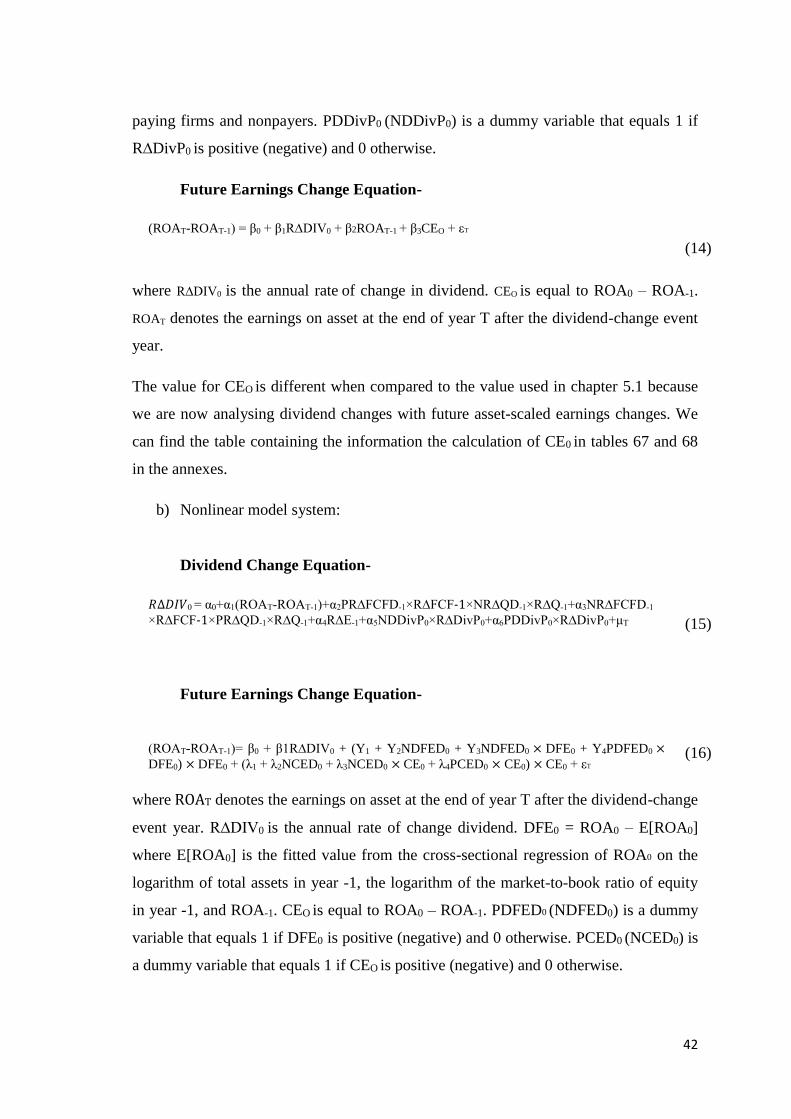
42
paying firms and nonpayers. PDDivP0 (NDDivP0) is a dummy variable that equals 1 if
R∆DivP0 is positive (negative) and 0 otherwise.
Future Earnings Change Equation-
(ROAT-ROAT-1) = β0 + β1R∆DIV0 + β2ROAT-1 + β3CEO + εT
(14)
where R∆DIV0 is the annual rate of change in dividend. CEO is equal to ROA0 – ROA-1.
ROAT denotes the earnings on asset at the end of year T after the dividend-change event
year.
The value for CEO is different when compared to the value used in chapter 5.1 because
we are now analysing dividend changes with future asset-scaled earnings changes. We
can find the table containing the information the calculation of CE0 in tables 67 and 68
in the annexes.
b) Nonlinear model system:
Dividend Change Equation-
𝑅∆𝐷𝐼𝑉0 = α0+α1(ROAT-ROAT-1)+α2PR∆FCFD-1×R∆FCF-1×NR∆QD-1×R∆Q-1+α3NR∆FCFD-1
×R∆FCF-1×PR∆QD-1×R∆Q-1+α4R∆E-1+α5NDDivP0×R∆DivP0+α6PDDivP0×R∆DivP0+μT
(15)
Future Earnings Change Equation-
(ROAT-ROAT-1)= β0 + β1R∆DIV0 + (Y1 + Y2NDFED0 + Y3NDFED0 × DFE0 + Y4PDFED0 ×
DFE0) × DFE0 + (λ1 + λ2NCED0 + λ3NCED0 × CE0 + λ4PCED0 × CE0) × CE0 + εT
(16)
where ROAT denotes the earnings on asset at the end of year T after the dividend-change
event year. R∆DIV0 is the annual rate of change dividend. DFE0 = ROA0 – E[ROA0]
where E[ROA0] is the fitted value from the cross-sectional regression of ROA0 on the
logarithm of total assets in year -1, the logarithm of the market-to-book ratio of equity
in year -1, and ROA-1. CEO is equal to ROA0 – ROA-1. PDFED0 (NDFED0) is a dummy
variable that equals 1 if DFE0 is positive (negative) and 0 otherwise. PCED0 (NCED0) is
a dummy variable that equals 1 if CEO is positive (negative) and 0 otherwise.
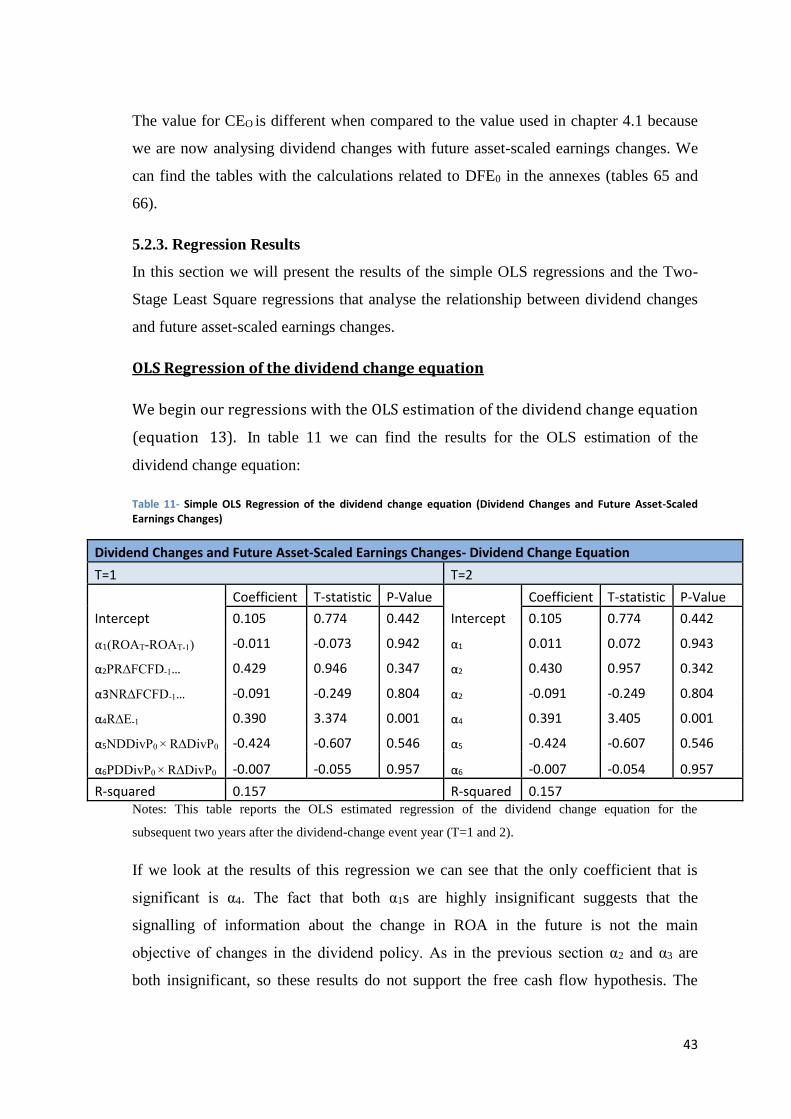
43
The value for CEO is different when compared to the value used in chapter 4.1 because
we are now analysing dividend changes with future asset-scaled earnings changes. We
can find the tables with the calculations related to DFE0 in the annexes (tables 65 and
66).
5.2.3. Regression Results
In this section we will present the results of the simple OLS regressions and the Two-
Stage Least Square regressions that analyse the relationship between dividend changes
and future asset-scaled earnings changes.
OLS Regression of the dividend change equation
We begin our regressions with the OLS estimation of the dividend change equation
(equation 13). In table 11 we can find the results for the OLS estimation of the
dividend change equation:
Table 11- Simple OLS Regression of the dividend change equation (Dividend Changes and Future Asset-Scaled Earnings Changes)
Dividend Changes and Future Asset-Scaled Earnings Changes- Dividend Change Equation
T=1 T=2
Coefficient T-statistic P-Value Coefficient T-statistic P-Value
Intercept 0.105 0.774 0.442 Intercept 0.105 0.774 0.442
α1(ROAT-ROAT-1) -0.011 -0.073 0.942 α1 0.011 0.072 0.943
α2PR∆FCFD-1… 0.429 0.946 0.347 α2 0.430 0.957 0.342
α3NR∆FCFD-1… -0.091 -0.249 0.804 α2 -0.091 -0.249 0.804
α4R∆E-1 0.390 3.374 0.001 α4 0.391 3.405 0.001
α5NDDivP0 × R∆DivP0 -0.424 -0.607 0.546 α5 -0.424 -0.607 0.546
α6PDDivP0 × R∆DivP0 -0.007 -0.055 0.957 α6 -0.007 -0.054 0.957
R-squared 0.157 R-squared 0.157 Notes: This table reports the OLS estimated regression of the dividend change equation for the
subsequent two years after the dividend-change event year (T=1 and 2).
If we look at the results of this regression we can see that the only coefficient that is
significant is α4. The fact that both α1s are highly insignificant suggests that the
signalling of information about the change in ROA in the future is not the main
objective of changes in the dividend policy. As in the previous section α2 and α3 are
both insignificant, so these results do not support the free cash flow hypothesis. The
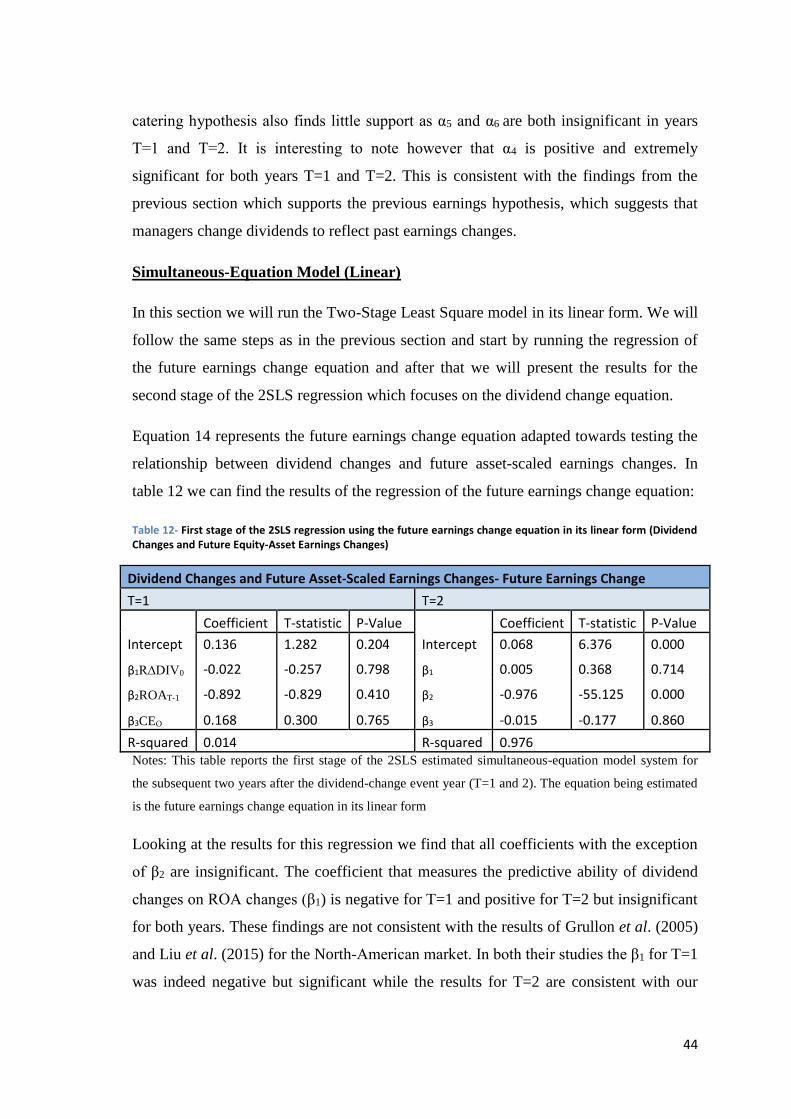
44
catering hypothesis also finds little support as α5 and α6 are both insignificant in years
T=1 and T=2. It is interesting to note however that α4 is positive and extremely
significant for both years T=1 and T=2. This is consistent with the findings from the
previous section which supports the previous earnings hypothesis, which suggests that
managers change dividends to reflect past earnings changes.
Simultaneous-Equation Model (Linear)
In this section we will run the Two-Stage Least Square model in its linear form. We will
follow the same steps as in the previous section and start by running the regression of
the future earnings change equation and after that we will present the results for the
second stage of the 2SLS regression which focuses on the dividend change equation.
Equation 14 represents the future earnings change equation adapted towards testing the
relationship between dividend changes and future asset-scaled earnings changes. In
table 12 we can find the results of the regression of the future earnings change equation:
Table 12- First stage of the 2SLS regression using the future earnings change equation in its linear form (Dividend Changes and Future Equity-Asset Earnings Changes)
Dividend Changes and Future Asset-Scaled Earnings Changes- Future Earnings Change
T=1 T=2
Coefficient T-statistic P-Value Coefficient T-statistic P-Value
Intercept 0.136 1.282 0.204 Intercept 0.068 6.376 0.000
β1R∆DIV0 -0.022 -0.257 0.798 β1 0.005 0.368 0.714
β2ROAT-1 -0.892 -0.829 0.410 β2 -0.976 -55.125 0.000
β3CEO 0.168 0.300 0.765 β3 -0.015 -0.177 0.860
R-squared 0.014 R-squared 0.976 Notes: This table reports the first stage of the 2SLS estimated simultaneous-equation model system for
the subsequent two years after the dividend-change event year (T=1 and 2). The equation being estimated
is the future earnings change equation in its linear form
Looking at the results for this regression we find that all coefficients with the exception
of β2 are insignificant. The coefficient that measures the predictive ability of dividend
changes on ROA changes (β1) is negative for T=1 and positive for T=2 but insignificant
for both years. These findings are not consistent with the results of Grullon et al. (2005)
and Liu et al. (2015) for the North-American market. In both their studies the β1 for T=1
was indeed negative but significant while the results for T=2 are consistent with our
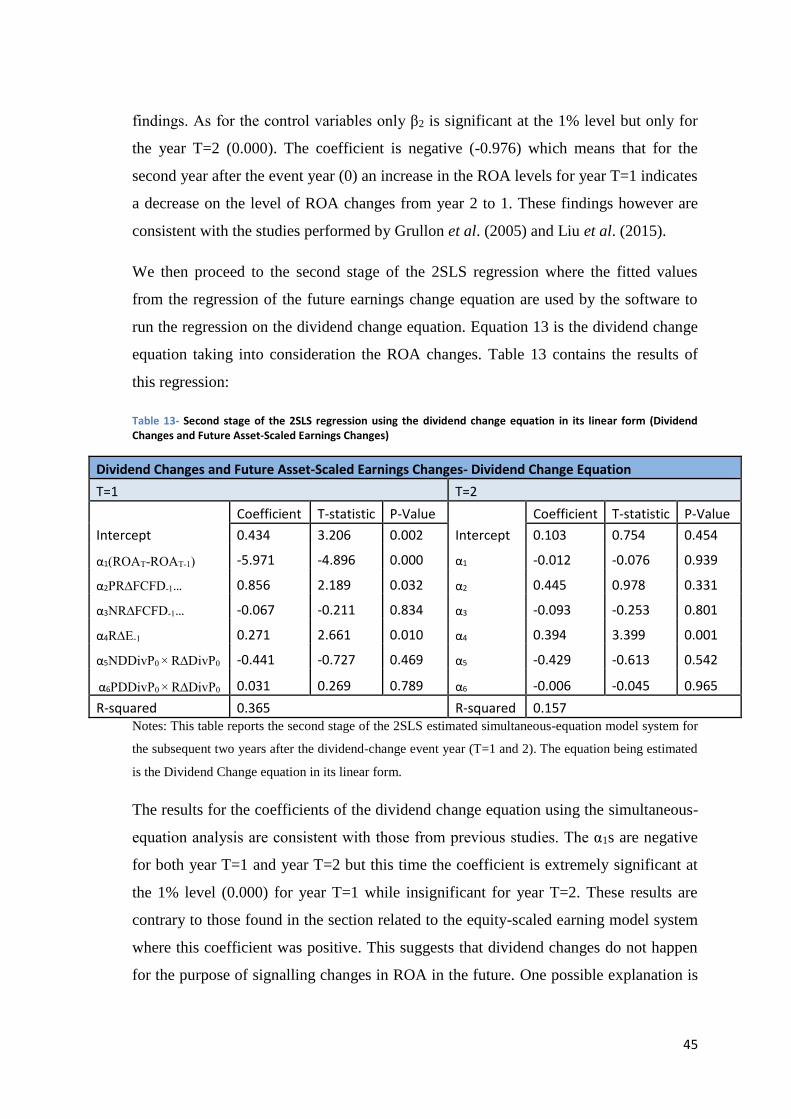
45
findings. As for the control variables only β2 is significant at the 1% level but only for
the year T=2 (0.000). The coefficient is negative (-0.976) which means that for the
second year after the event year (0) an increase in the ROA levels for year T=1 indicates
a decrease on the level of ROA changes from year 2 to 1. These findings however are
consistent with the studies performed by Grullon et al. (2005) and Liu et al. (2015).
We then proceed to the second stage of the 2SLS regression where the fitted values
from the regression of the future earnings change equation are used by the software to
run the regression on the dividend change equation. Equation 13 is the dividend change
equation taking into consideration the ROA changes. Table 13 contains the results of
this regression:
Table 13- Second stage of the 2SLS regression using the dividend change equation in its linear form (Dividend Changes and Future Asset-Scaled Earnings Changes)
Dividend Changes and Future Asset-Scaled Earnings Changes- Dividend Change Equation
T=1 T=2
Coefficient T-statistic P-Value Coefficient T-statistic P-Value
Intercept 0.434 3.206 0.002 Intercept 0.103 0.754 0.454
α1(ROAT-ROAT-1) -5.971 -4.896 0.000 α1 -0.012 -0.076 0.939
α2PR∆FCFD-1… 0.856 2.189 0.032 α2 0.445 0.978 0.331
α3NR∆FCFD-1… -0.067 -0.211 0.834 α3 -0.093 -0.253 0.801
α4R∆E-1 0.271 2.661 0.010 α4 0.394 3.399 0.001
α5NDDivP0 × R∆DivP0 -0.441 -0.727 0.469 α5 -0.429 -0.613 0.542
α6PDDivP0 × R∆DivP0 0.031 0.269 0.789 α6 -0.006 -0.045 0.965
R-squared 0.365 R-squared 0.157 Notes: This table reports the second stage of the 2SLS estimated simultaneous-equation model system for
the subsequent two years after the dividend-change event year (T=1 and 2). The equation being estimated
is the Dividend Change equation in its linear form.
The results for the coefficients of the dividend change equation using the simultaneous-
equation analysis are consistent with those from previous studies. The α1s are negative
for both year T=1 and year T=2 but this time the coefficient is extremely significant at
the 1% level (0.000) for year T=1 while insignificant for year T=2. These results are
contrary to those found in the section related to the equity-scaled earning model system
where this coefficient was positive. This suggests that dividend changes do not happen
for the purpose of signalling changes in ROA in the future. One possible explanation is

46
provided by Liu et al. (2015) where they state that equity investors as accepters of
dividends and direct signalling targets to managers are more concerned about equity-
scaled earnings changes than asset-scaled earnings changes and are willing to pay more
for stocks of companies with better asset-scaled earnings prospects. As such it makes
sense that when setting the dividend policy managers are more preoccupied with
signalling information relative to equity-scaled earnings changes than asset-scaled
earnings changes.
Looking at the control variables we can identify two coefficients as significant which
are α2 and α4. The coefficient for α2 is positive (0.856) and significant (0.032) on the 5%
level for T=1. For the free cash flow hypothesis to be true the coefficient α2 must be
positive and significant, thus this is evidence in favour of that hypothesis. As for
coefficient α4, it is positive (0.271) and heavily significant on the 1% level (0.010) for
year T=1 and also positive (0.394) and extremely significant for the year T=2 (0.001).
This supports the previous earnings changes hypothesis, coinciding with the findings for
the equity-scaled earning changes model.
Simultaneous-Equation Model (Nonlinear)
In this section we perform the exact same regressions using the 2SLS model with the
difference being the usage of the nonlinear form of the future earnings change equation
(equation 16). We can find the results of the first stage of the 2SLS regression in table
14, where we perform the regression of the future earnings change equation:
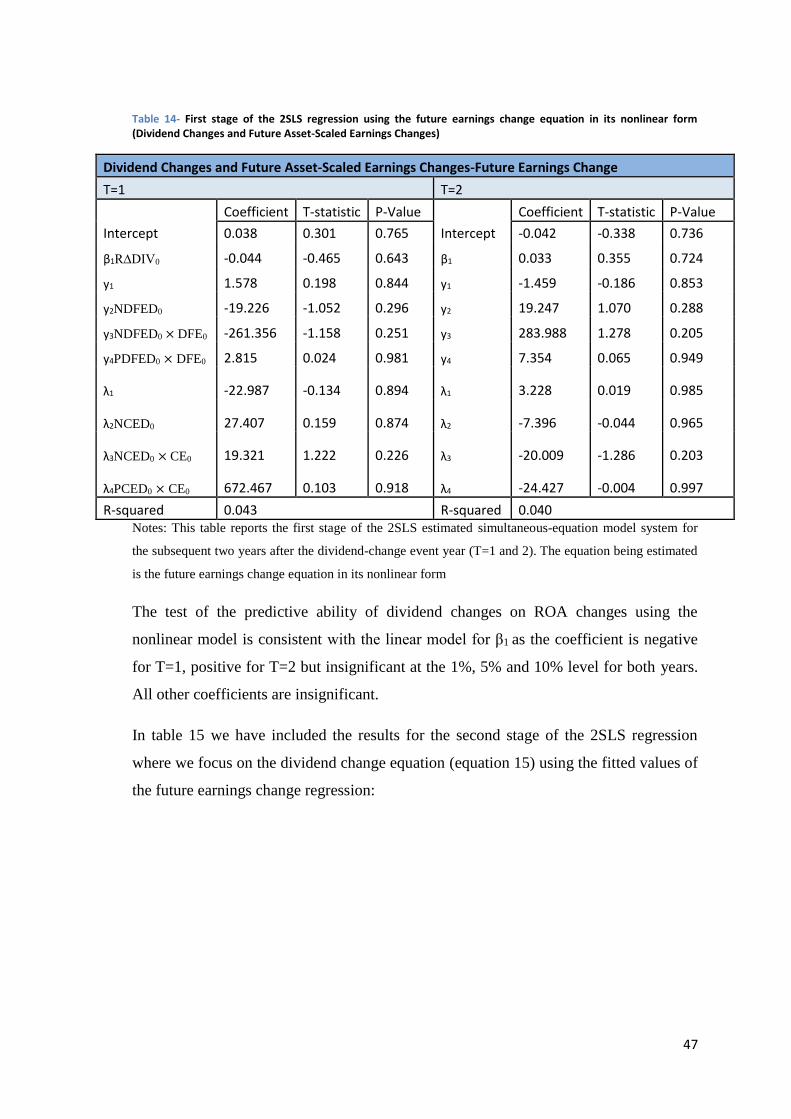
47
Table 14- First stage of the 2SLS regression using the future earnings change equation in its nonlinear form (Dividend Changes and Future Asset-Scaled Earnings Changes)
Dividend Changes and Future Asset-Scaled Earnings Changes-Future Earnings Change
T=1 T=2
Coefficient T-statistic P-Value Coefficient T-statistic P-Value
Intercept 0.038 0.301 0.765 Intercept -0.042 -0.338 0.736
β1R∆DIV0 -0.044 -0.465 0.643 β1 0.033 0.355 0.724
y1 1.578 0.198 0.844 y1 -1.459 -0.186 0.853
y2NDFED0 -19.226 -1.052 0.296 y2 19.247 1.070 0.288
y3NDFED0 × DFE0 -261.356 -1.158 0.251 y3 283.988 1.278 0.205
y4PDFED0 × DFE0 2.815 0.024 0.981 y4 7.354 0.065 0.949 λ1 -22.987 -0.134 0.894
λ1 3.228 0.019 0.985
λ2NCED0 27.407 0.159 0.874
λ2 -7.396 -0.044 0.965
λ3NCED0 × CE0 19.321 1.222 0.226
λ3 -20.009 -1.286 0.203
λ4PCED0 × CE0 672.467 0.103 0.918
λ4 -24.427 -0.004 0.997
R-squared 0.043 R-squared 0.040 Notes: This table reports the first stage of the 2SLS estimated simultaneous-equation model system for
the subsequent two years after the dividend-change event year (T=1 and 2). The equation being estimated
is the future earnings change equation in its nonlinear form
The test of the predictive ability of dividend changes on ROA changes using the
nonlinear model is consistent with the linear model for β1 as the coefficient is negative
for T=1, positive for T=2 but insignificant at the 1%, 5% and 10% level for both years.
All other coefficients are insignificant.
In table 15 we have included the results for the second stage of the 2SLS regression
where we focus on the dividend change equation (equation 15) using the fitted values of
the future earnings change regression:

48
Table 15- Second stage of the 2SLS regression using the dividend change equation in its nonlinear form (Dividend Changes and Future Asset-Scaled Earnings Changes)
Dividend Changes and Future Asset-Scaled Earnings Changes- Dividend Change Equation
T=1 T=2
Coefficient T-statistic P-Value Coefficient T-statistic P-Value
Intercept 0.269 1.934 0.057 Intercept 0.246 1.713 0.091
α1(ROAT-ROAT-1) -2.090 -2.970 0.004 α1 1.759 2.356 0.021
α2PR∆FCFD-1… 0.343 0.824 0.413 α2 0.474 1.118 0.267
α3NR∆FCFD-1… 0.030 0.086 0.931 α3 0.010 0.028 0.978
α4R∆E-1 0.384 3.571 0.001 α4 0.405 3.686 0.000
α5NDDivP0 × R∆DivP0 -0.157 -0.237 0.814 α5 -0.218 -0.321 0.750
α6PDDivP0 × R∆DivP0 -0.084 -0.656 0.514 α6 -0.061 -0.469 0.641
R-squared 0.248 R-squared 0.217 Notes: This table reports the second stage of the 2SLS estimated simultaneous-equation model system for
the subsequent two years after the dividend-change event year (T=1 and 2). The equation being estimated
is the Dividend Change equation in its nonlinear form.
The results for second stage of the 2SLS regression using the nonlinear model are
similar to those of the second stage of the 2SLS regression using the linear model. The
coefficient α1 is negative (-2.090) for year T=1 and extremely significant at the 1% level
(0.004). This coincides with the results for the linear model and provides further
evidence that the purpose behind dividend changes is not to signal changes in ROA in
the future. Although the results for T=2 are different (positive) the coefficient is only
significant at the 5% level.
As for the control variables, again the nonlinear model coincides with the results from
the linear model as only α4 is significant for both years T=1 (0.001) and T=2 (0.000).
This provides more proof that managers take into consideration previous earning
changes when they set the dividend policy of their company.

49
6. Robustness Tests
6.1. Dividend changes and ROE levels
6.1.1. The Model
On this chapter we will be presenting robustness tests to verify the findings from our
previous models and see if they hold up to alternate specifications. Other authors have
been known to perform the same robustness tests such as Nissim and Ziv (2001),
Grullon et al. (2005) and Liu and Chen (2015). These tests require us to replicate the
simple OLS regression of the dividend change equation and the simultaneous-equation
model replacing the change in earnings with earnings levels to ensure the robustness of
the findings.
6.1.2. Model Specifications
For our first robustness test we will be estimating the following ROE linear and
nonlinear model systems:
a) ROE linear model system:
Dividend Change Equation-
𝑅∆𝐷𝐼𝑉0 = α0 + α1ROET + α2PR∆FCFD-1 × R∆FCF-1× NR∆QD-1 × R∆Q-1 + α3NR∆FCFD-1
× R∆FCF-1 × PR∆QD-1 × R∆Q-1 + α4R∆E-1 + α5NDDivP0 × R∆DivP0 + α6PDDivP0 × R∆DivP0 + μT
(17)
where 𝑅∆𝐷𝐼𝑉0 is the annual rate of change in dividend. R∆FCF is the rate of
change in free cash flow in year -1. R∆Q-1 is the rate of change in Tobin’s Q in
year -1. PR∆FCFD-1 ( NR∆FCFD-1 ) is a dummy variable that equals 1 for
positive (negative) R∆FCF and 0 otherwise. PR∆QD-1(NR∆QD-1) is a dummy
variable that equals 1 for positive (negative) R∆Q-1 and 0 otherwise. R∆E-1 is the
rate of change in earnings in year -1. R∆DivP0 is the contemporaneous dividend
premium change rate, where DivP is the difference in the logs of the annual
market-value-weighted average market-to-book ratios of dividend paying firms
and nonpayers. PDDivP0 ( NDDivP0 ) is a dummy variable that equals 1 if
R∆DivP0 is positive (negative) and 0 otherwise. ROET denotes the earnings on
equity at the end of year T after the dividend-change event year.
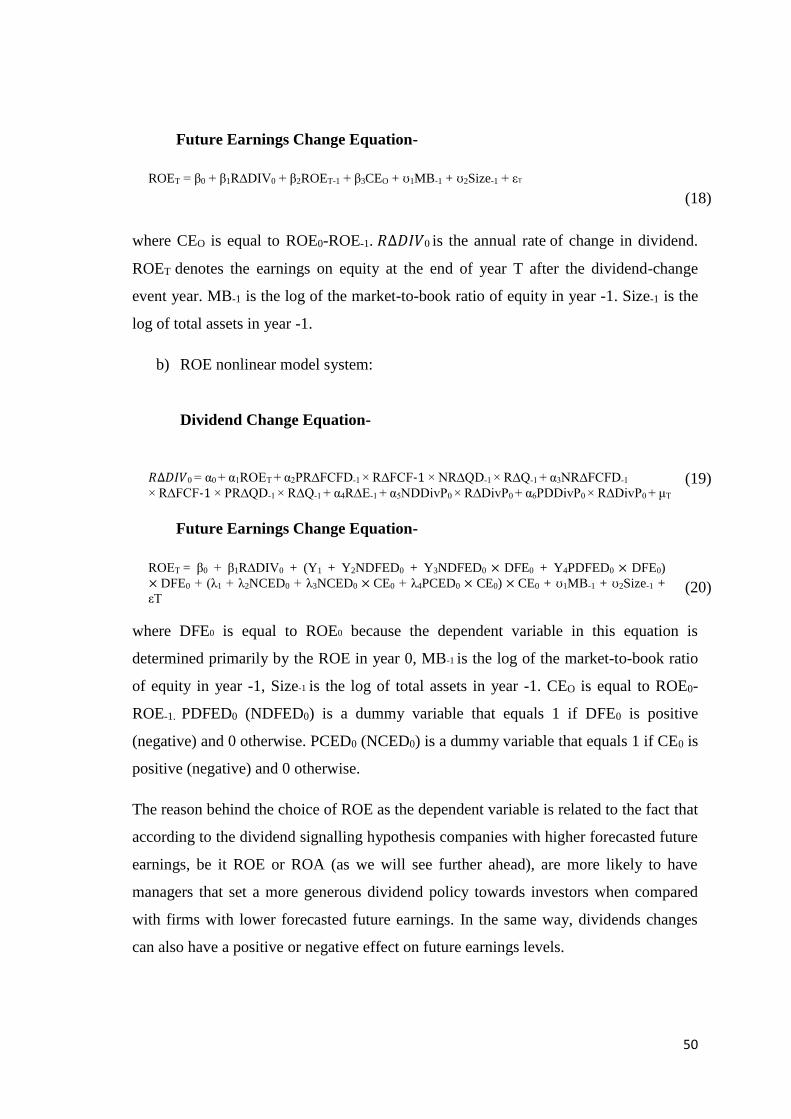
50
Future Earnings Change Equation-
ROET = β0 + β1R∆DIV0 + β2ROET-1 + β3CEO + ʊ1MB-1 + ʊ2Size-1 + εT
(18)
where CEO is equal to ROE0-ROE-1. 𝑅∆𝐷𝐼𝑉0 is the annual rate of change in dividend.
ROET denotes the earnings on equity at the end of year T after the dividend-change
event year. MB-1 is the log of the market-to-book ratio of equity in year -1. Size-1 is the
log of total assets in year -1.
b) ROE nonlinear model system:
Dividend Change Equation-
𝑅∆𝐷𝐼𝑉0 = α0 + α1ROET + α2PR∆FCFD-1 × R∆FCF-1 × NR∆QD-1 × R∆Q-1 + α3NR∆FCFD-1
× R∆FCF-1 × PR∆QD-1 × R∆Q-1 + α4R∆E-1 + α5NDDivP0 × R∆DivP0 + α6PDDivP0 × R∆DivP0 + μT
(19)
Future Earnings Change Equation-
ROET = β0 + β1R∆DIV0 + (Y1 + Y2NDFED0 + Y3NDFED0 × DFE0 + Y4PDFED0 × DFE0)
× DFE0 + (λ1 + λ2NCED0 + λ3NCED0 × CE0 + λ4PCED0 × CE0) × CE0 + ʊ1MB-1 + ʊ2Size-1 +
εT
(20)
where DFE0 is equal to ROE0 because the dependent variable in this equation is
determined primarily by the ROE in year 0, MB-1 is the log of the market-to-book ratio
of equity in year -1, Size-1 is the log of total assets in year -1. CEO is equal to ROE0-
ROE-1. PDFED0 (NDFED0) is a dummy variable that equals 1 if DFE0 is positive
(negative) and 0 otherwise. PCED0 (NCED0) is a dummy variable that equals 1 if CE0 is
positive (negative) and 0 otherwise.
The reason behind the choice of ROE as the dependent variable is related to the fact that
according to the dividend signalling hypothesis companies with higher forecasted future
earnings, be it ROE or ROA (as we will see further ahead), are more likely to have
managers that set a more generous dividend policy towards investors when compared
with firms with lower forecasted future earnings. In the same way, dividends changes
can also have a positive or negative effect on future earnings levels.
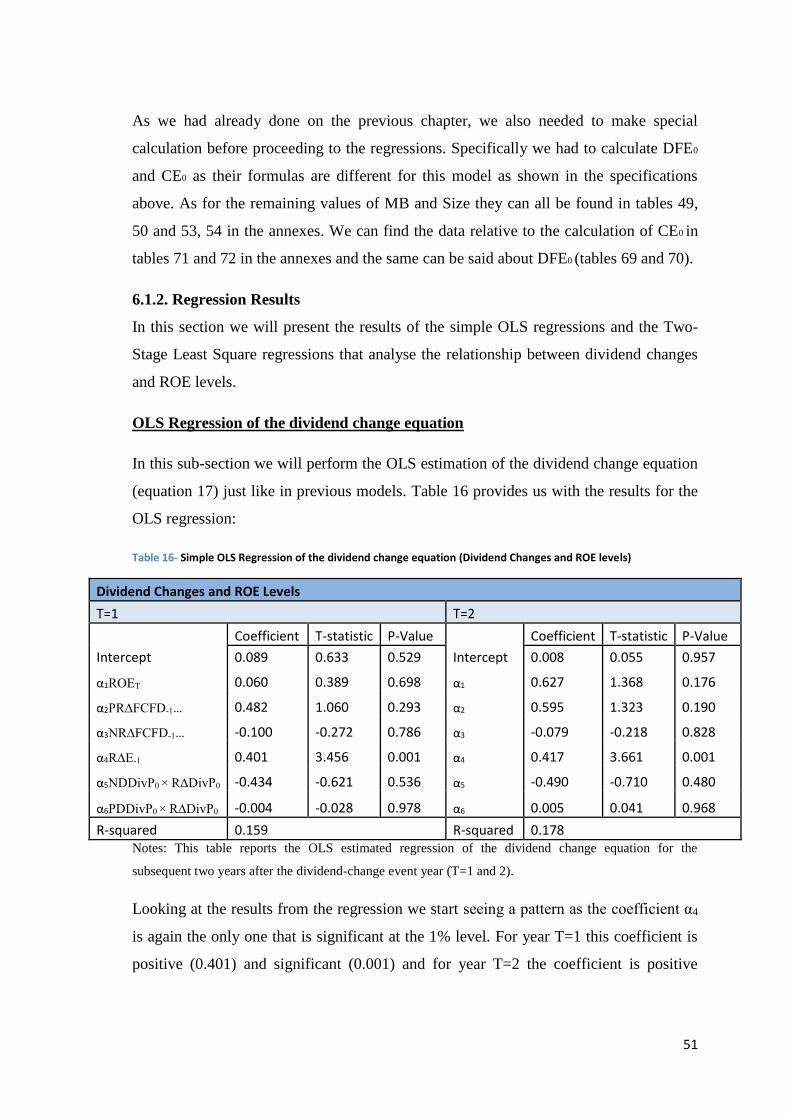
51
As we had already done on the previous chapter, we also needed to make special
calculation before proceeding to the regressions. Specifically we had to calculate DFE0
and CE0 as their formulas are different for this model as shown in the specifications
above. As for the remaining values of MB and Size they can all be found in tables 49,
50 and 53, 54 in the annexes. We can find the data relative to the calculation of CE0 in
tables 71 and 72 in the annexes and the same can be said about DFE0 (tables 69 and 70).
6.1.2. Regression Results
In this section we will present the results of the simple OLS regressions and the Two-
Stage Least Square regressions that analyse the relationship between dividend changes
and ROE levels.
OLS Regression of the dividend change equation
In this sub-section we will perform the OLS estimation of the dividend change equation
(equation 17) just like in previous models. Table 16 provides us with the results for the
OLS regression:
Table 16- Simple OLS Regression of the dividend change equation (Dividend Changes and ROE levels)
Dividend Changes and ROE Levels
T=1 T=2
Coefficient T-statistic P-Value Coefficient T-statistic P-Value
Intercept 0.089 0.633 0.529 Intercept 0.008 0.055 0.957
α1ROET 0.060 0.389 0.698 α1 0.627 1.368 0.176
α2PR∆FCFD-1… 0.482 1.060 0.293 α2 0.595 1.323 0.190
α3NR∆FCFD-1… -0.100 -0.272 0.786 α3 -0.079 -0.218 0.828
α4R∆E-1 0.401 3.456 0.001 α4 0.417 3.661 0.001
α5NDDivP0 × R∆DivP0 -0.434 -0.621 0.536 α5 -0.490 -0.710 0.480
α6PDDivP0 × R∆DivP0 -0.004 -0.028 0.978 α6 0.005 0.041 0.968
R-squared 0.159 R-squared 0.178 Notes: This table reports the OLS estimated regression of the dividend change equation for the
subsequent two years after the dividend-change event year (T=1 and 2).
Looking at the results from the regression we start seeing a pattern as the coefficient α4
is again the only one that is significant at the 1% level. For year T=1 this coefficient is
positive (0.401) and significant (0.001) and for year T=2 the coefficient is positive
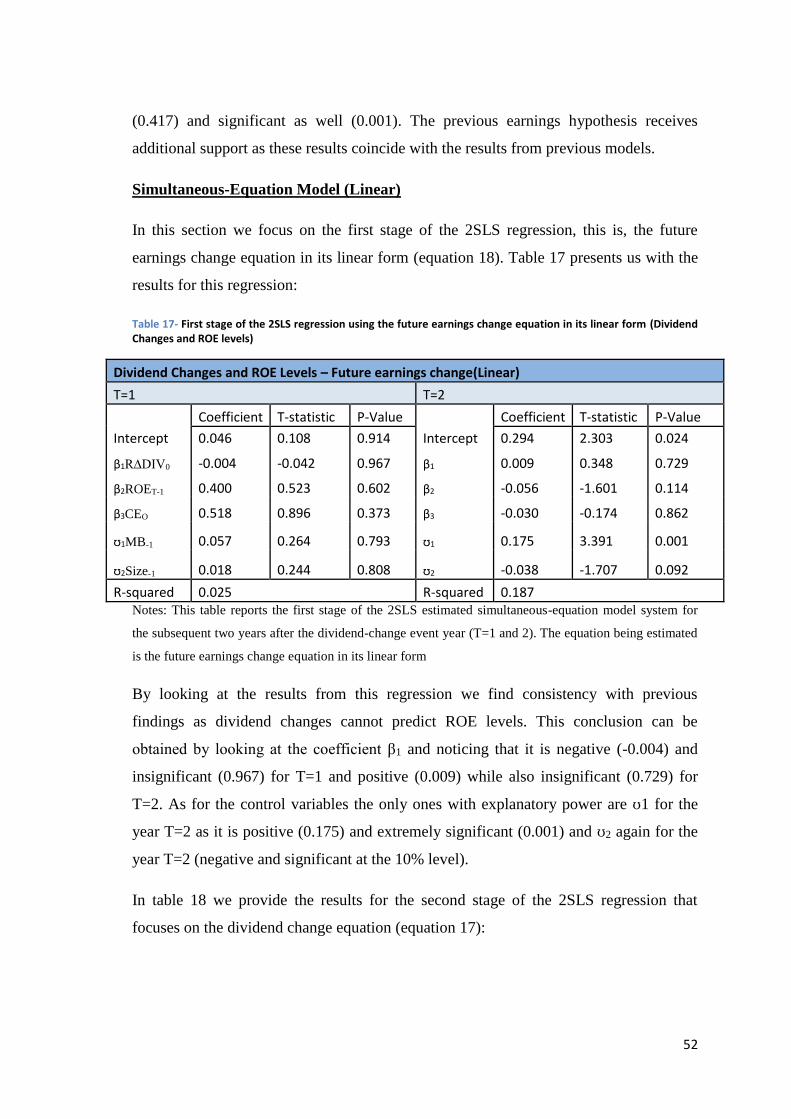
52
(0.417) and significant as well (0.001). The previous earnings hypothesis receives
additional support as these results coincide with the results from previous models.
Simultaneous-Equation Model (Linear)
In this section we focus on the first stage of the 2SLS regression, this is, the future
earnings change equation in its linear form (equation 18). Table 17 presents us with the
results for this regression:
Table 17- First stage of the 2SLS regression using the future earnings change equation in its linear form (Dividend Changes and ROE levels)
Dividend Changes and ROE Levels – Future earnings change(Linear)
T=1 T=2
Coefficient T-statistic P-Value Coefficient T-statistic P-Value
Intercept 0.046 0.108 0.914 Intercept 0.294 2.303 0.024
β1R∆DIV0 -0.004 -0.042 0.967 β1 0.009 0.348 0.729
β2ROET-1 0.400 0.523 0.602 β2 -0.056 -1.601 0.114
β3CEO 0.518 0.896 0.373 β3 -0.030 -0.174 0.862
ʊ1MB-1 0.057 0.264 0.793 ʊ1 0.175 3.391 0.001
ʊ2Size-1 0.018 0.244 0.808 ʊ2 -0.038 -1.707 0.092
R-squared 0.025 R-squared 0.187 Notes: This table reports the first stage of the 2SLS estimated simultaneous-equation model system for
the subsequent two years after the dividend-change event year (T=1 and 2). The equation being estimated
is the future earnings change equation in its linear form
By looking at the results from this regression we find consistency with previous
findings as dividend changes cannot predict ROE levels. This conclusion can be
obtained by looking at the coefficient β1 and noticing that it is negative (-0.004) and
insignificant (0.967) for T=1 and positive (0.009) while also insignificant (0.729) for
T=2. As for the control variables the only ones with explanatory power are ʊ1 for the
year T=2 as it is positive (0.175) and extremely significant (0.001) and ʊ2 again for the
year T=2 (negative and significant at the 10% level).
In table 18 we provide the results for the second stage of the 2SLS regression that
focuses on the dividend change equation (equation 17):
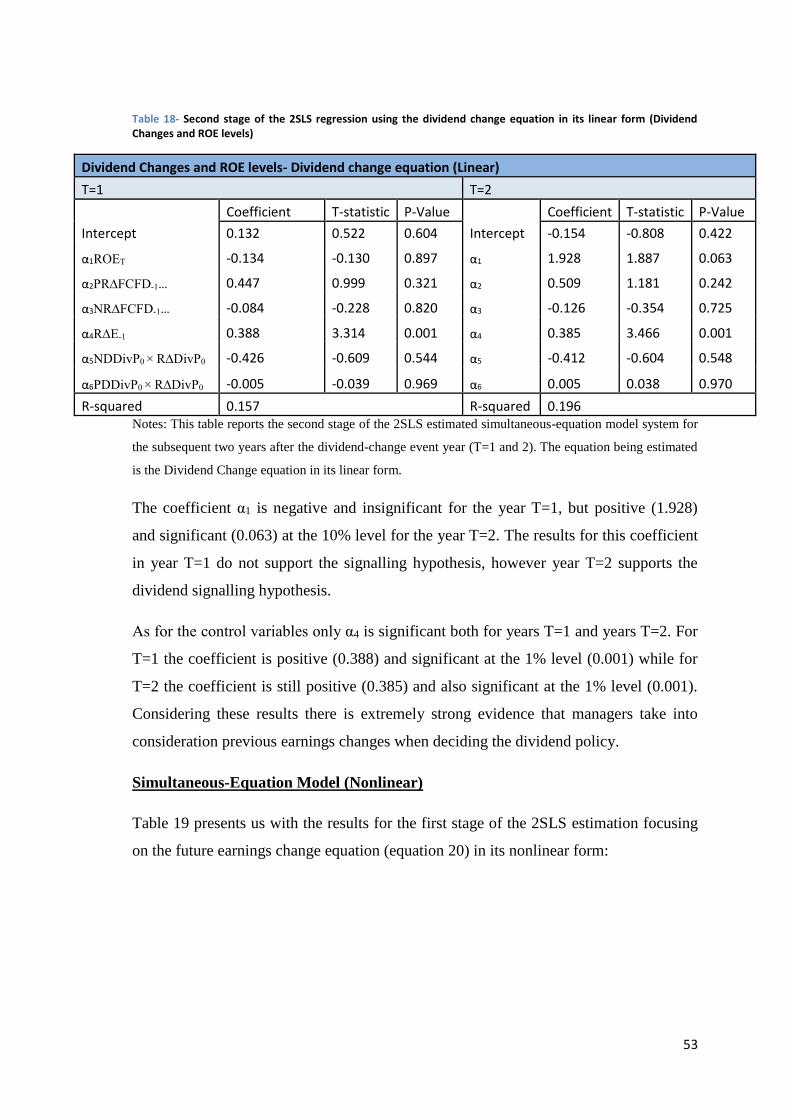
53
Table 18- Second stage of the 2SLS regression using the dividend change equation in its linear form (Dividend Changes and ROE levels)
Dividend Changes and ROE levels- Dividend change equation (Linear)
T=1 T=2
Coefficient T-statistic P-Value Coefficient T-statistic P-Value
Intercept 0.132 0.522 0.604 Intercept -0.154 -0.808 0.422
α1ROET -0.134 -0.130 0.897 α1 1.928 1.887 0.063
α2PR∆FCFD-1… 0.447 0.999 0.321 α2 0.509 1.181 0.242
α3NR∆FCFD-1… -0.084 -0.228 0.820 α3 -0.126 -0.354 0.725
α4R∆E-1 0.388 3.314 0.001 α4 0.385 3.466 0.001
α5NDDivP0 × R∆DivP0 -0.426 -0.609 0.544 α5 -0.412 -0.604 0.548
α6PDDivP0 × R∆DivP0 -0.005 -0.039 0.969 α6 0.005 0.038 0.970
R-squared 0.157 R-squared 0.196 Notes: This table reports the second stage of the 2SLS estimated simultaneous-equation model system for
the subsequent two years after the dividend-change event year (T=1 and 2). The equation being estimated
is the Dividend Change equation in its linear form.
The coefficient α1 is negative and insignificant for the year T=1, but positive (1.928)
and significant (0.063) at the 10% level for the year T=2. The results for this coefficient
in year T=1 do not support the signalling hypothesis, however year T=2 supports the
dividend signalling hypothesis.
As for the control variables only α4 is significant both for years T=1 and years T=2. For
T=1 the coefficient is positive (0.388) and significant at the 1% level (0.001) while for
T=2 the coefficient is still positive (0.385) and also significant at the 1% level (0.001).
Considering these results there is extremely strong evidence that managers take into
consideration previous earnings changes when deciding the dividend policy.
Simultaneous-Equation Model (Nonlinear)
Table 19 presents us with the results for the first stage of the 2SLS estimation focusing
on the future earnings change equation (equation 20) in its nonlinear form:
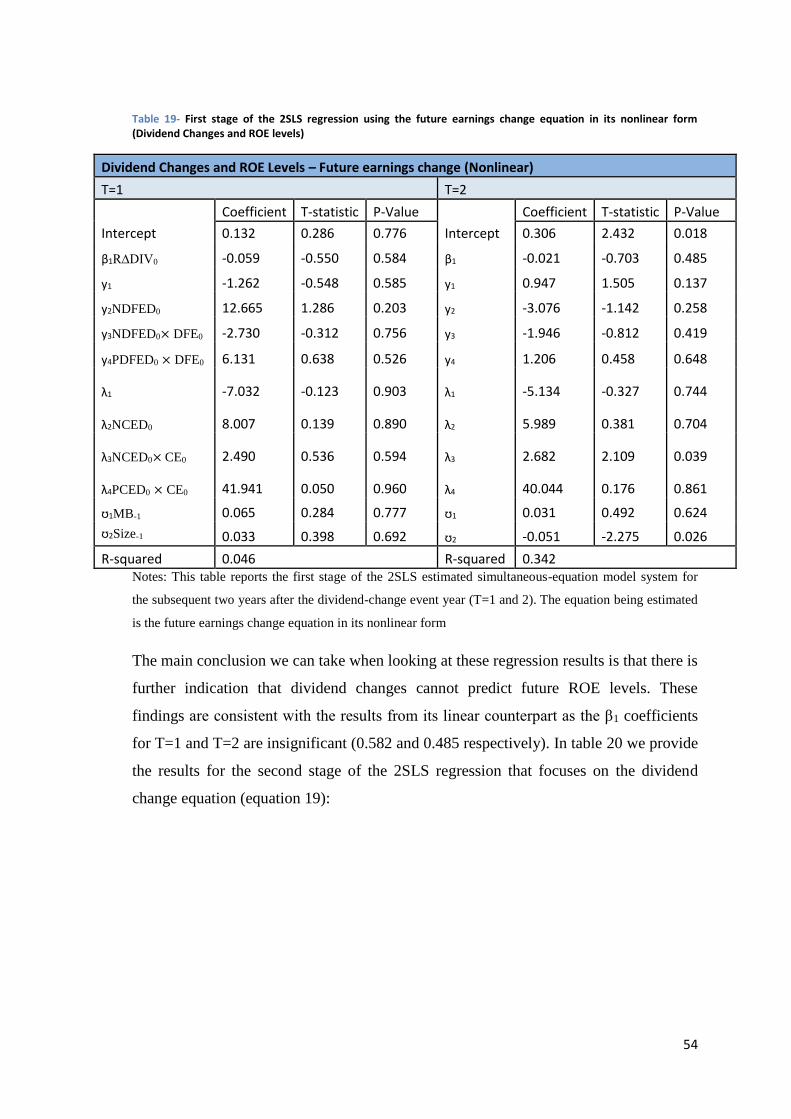
54
Table 19- First stage of the 2SLS regression using the future earnings change equation in its nonlinear form (Dividend Changes and ROE levels)
Dividend Changes and ROE Levels – Future earnings change (Nonlinear)
T=1 T=2
Coefficient T-statistic P-Value Coefficient T-statistic P-Value
Intercept 0.132 0.286 0.776 Intercept 0.306 2.432 0.018
β1R∆DIV0 -0.059 -0.550 0.584 β1 -0.021 -0.703 0.485
y1 -1.262 -0.548 0.585 y1 0.947 1.505 0.137
y2NDFED0 12.665 1.286 0.203 y2 -3.076 -1.142 0.258
y3NDFED0× DFE0 -2.730 -0.312 0.756 y3 -1.946 -0.812 0.419
y4PDFED0 × DFE0 6.131 0.638 0.526 y4 1.206 0.458 0.648 λ1 -7.032 -0.123 0.903
λ1 -5.134 -0.327 0.744
λ2NCED0 8.007 0.139 0.890
λ2 5.989 0.381 0.704
λ3NCED0× CE0 2.490 0.536 0.594
λ3 2.682 2.109 0.039
λ4PCED0 × CE0 41.941 0.050 0.960
λ4 40.044 0.176 0.861
ʊ1MB-1 0.065 0.284 0.777 ʊ1 0.031 0.492 0.624
ʊ2Size-1 0.033 0.398 0.692 ʊ2 -0.051 -2.275 0.026
R-squared 0.046 R-squared 0.342 Notes: This table reports the first stage of the 2SLS estimated simultaneous-equation model system for
the subsequent two years after the dividend-change event year (T=1 and 2). The equation being estimated
is the future earnings change equation in its nonlinear form
The main conclusion we can take when looking at these regression results is that there is
further indication that dividend changes cannot predict future ROE levels. These
findings are consistent with the results from its linear counterpart as the β1 coefficients
for T=1 and T=2 are insignificant (0.582 and 0.485 respectively). In table 20 we provide
the results for the second stage of the 2SLS regression that focuses on the dividend
change equation (equation 19):
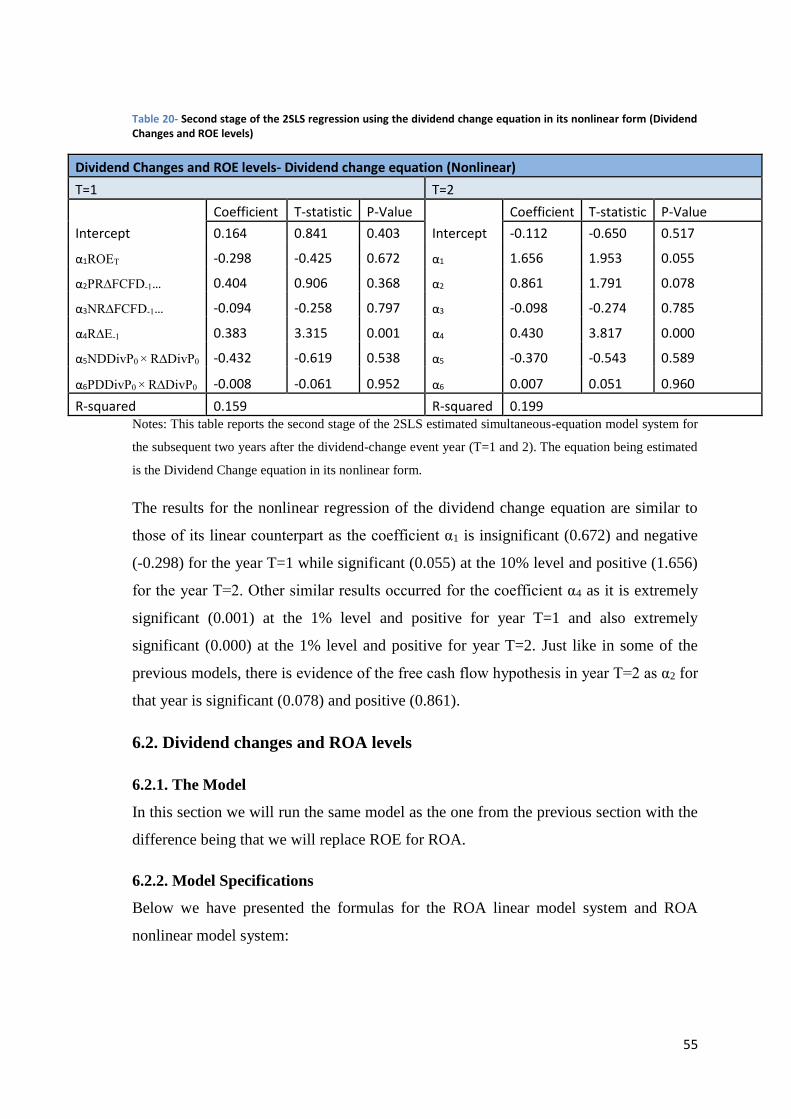
55
Table 20- Second stage of the 2SLS regression using the dividend change equation in its nonlinear form (Dividend Changes and ROE levels)
Dividend Changes and ROE levels- Dividend change equation (Nonlinear)
T=1 T=2
Coefficient T-statistic P-Value Coefficient T-statistic P-Value
Intercept 0.164 0.841 0.403 Intercept -0.112 -0.650 0.517
α1ROET -0.298 -0.425 0.672 α1 1.656 1.953 0.055
α2PR∆FCFD-1… 0.404 0.906 0.368 α2 0.861 1.791 0.078
α3NR∆FCFD-1… -0.094 -0.258 0.797 α3 -0.098 -0.274 0.785
α4R∆E-1 0.383 3.315 0.001 α4 0.430 3.817 0.000
α5NDDivP0 × R∆DivP0 -0.432 -0.619 0.538 α5 -0.370 -0.543 0.589
α6PDDivP0 × R∆DivP0 -0.008 -0.061 0.952 α6 0.007 0.051 0.960
R-squared 0.159 R-squared 0.199 Notes: This table reports the second stage of the 2SLS estimated simultaneous-equation model system for
the subsequent two years after the dividend-change event year (T=1 and 2). The equation being estimated
is the Dividend Change equation in its nonlinear form.
The results for the nonlinear regression of the dividend change equation are similar to
those of its linear counterpart as the coefficient α1 is insignificant (0.672) and negative
(-0.298) for the year T=1 while significant (0.055) at the 10% level and positive (1.656)
for the year T=2. Other similar results occurred for the coefficient α4 as it is extremely
significant (0.001) at the 1% level and positive for year T=1 and also extremely
significant (0.000) at the 1% level and positive for year T=2. Just like in some of the
previous models, there is evidence of the free cash flow hypothesis in year T=2 as α2 for
that year is significant (0.078) and positive (0.861).
6.2. Dividend changes and ROA levels
6.2.1. The Model
In this section we will run the same model as the one from the previous section with the
difference being that we will replace ROE for ROA.
6.2.2. Model Specifications
Below we have presented the formulas for the ROA linear model system and ROA
nonlinear model system:
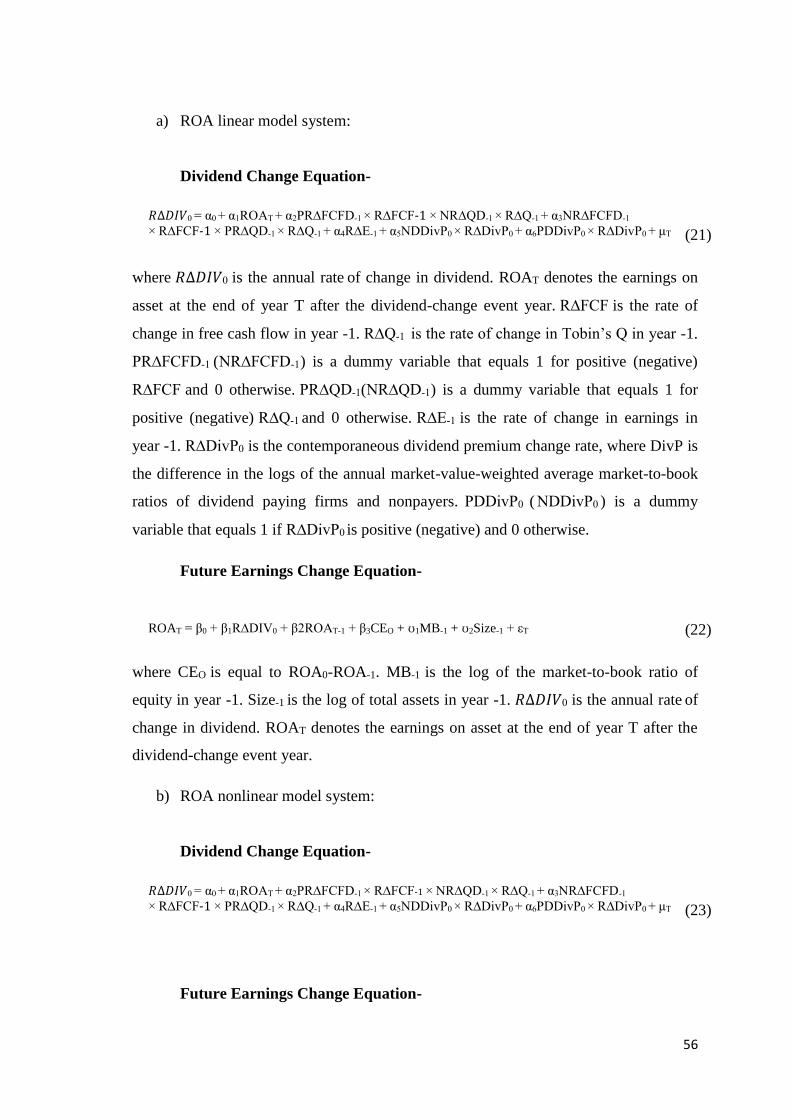
56
a) ROA linear model system:
Dividend Change Equation-
𝑅∆𝐷𝐼𝑉0 = α0 + α1ROAT + α2PR∆FCFD-1 × R∆FCF-1 × NR∆QD-1 × R∆Q-1 + α3NR∆FCFD-1
× R∆FCF-1 × PR∆QD-1 × R∆Q-1 + α4R∆E-1 + α5NDDivP0 × R∆DivP0 + α6PDDivP0 × R∆DivP0 + μT
(21)
where 𝑅∆𝐷𝐼𝑉0 is the annual rate of change in dividend. ROAT denotes the earnings on
asset at the end of year T after the dividend-change event year. R∆FCF is the rate of
change in free cash flow in year -1. R∆Q-1 is the rate of change in Tobin’s Q in year -1.
PR∆FCFD-1 (NR∆FCFD-1) is a dummy variable that equals 1 for positive (negative)
R∆FCF and 0 otherwise. PR∆QD-1(NR∆QD-1) is a dummy variable that equals 1 for
positive (negative) R∆Q-1 and 0 otherwise. R∆E-1 is the rate of change in earnings in
year -1. R∆DivP0 is the contemporaneous dividend premium change rate, where DivP is
the difference in the logs of the annual market-value-weighted average market-to-book
ratios of dividend paying firms and nonpayers. PDDivP0 ( NDDivP0 ) is a dummy
variable that equals 1 if R∆DivP0 is positive (negative) and 0 otherwise.
Future Earnings Change Equation-
ROAT = β0 + β1R∆DIV0 + β2ROAT-1 + β3CEO + ʊ1MB-1 + ʊ2Size-1 + εT
(22)
where CEO is equal to ROA0-ROA-1. MB-1 is the log of the market-to-book ratio of
equity in year -1. Size-1 is the log of total assets in year -1. 𝑅∆𝐷𝐼𝑉0 is the annual rate of
change in dividend. ROAT denotes the earnings on asset at the end of year T after the
dividend-change event year.
b) ROA nonlinear model system:
Dividend Change Equation-
𝑅∆𝐷𝐼𝑉0 = α0 + α1ROAT + α2PR∆FCFD-1 × R∆FCF-1 × NR∆QD-1 × R∆Q-1 + α3NR∆FCFD-1
× R∆FCF-1 × PR∆QD-1 × R∆Q-1 + α4R∆E-1 + α5NDDivP0 × R∆DivP0 + α6PDDivP0 × R∆DivP0 + μT
(23)
Future Earnings Change Equation-
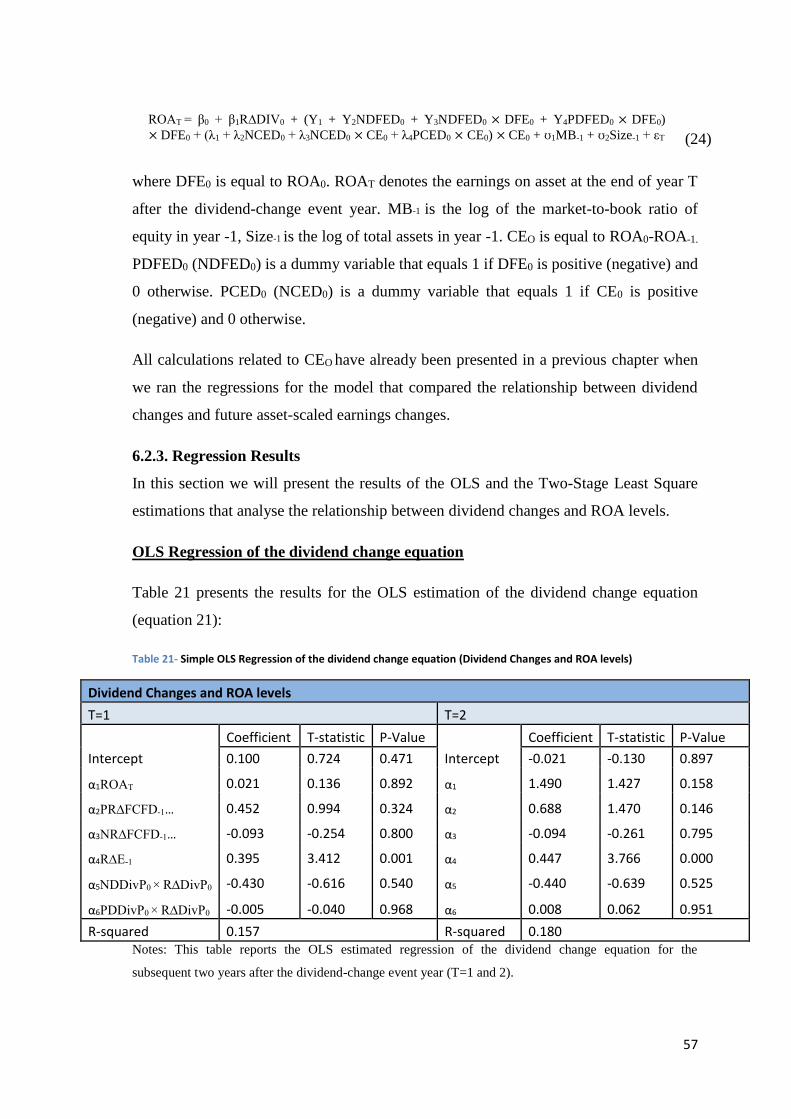
57
ROAT = β0 + β1R∆DIV0 + (Y1 + Y2NDFED0 + Y3NDFED0 × DFE0 + Y4PDFED0 × DFE0)
× DFE0 + (λ1 + λ2NCED0 + λ3NCED0 × CE0 + λ4PCED0 × CE0) × CE0 + ʊ1MB-1 + ʊ2Size-1 + εT
(24)
where DFE0 is equal to ROA0. ROAT denotes the earnings on asset at the end of year T
after the dividend-change event year. MB-1 is the log of the market-to-book ratio of
equity in year -1, Size-1 is the log of total assets in year -1. CEO is equal to ROA0-ROA-1.
PDFED0 (NDFED0) is a dummy variable that equals 1 if DFE0 is positive (negative) and
0 otherwise. PCED0 (NCED0) is a dummy variable that equals 1 if CE0 is positive
(negative) and 0 otherwise.
All calculations related to CEO have already been presented in a previous chapter when
we ran the regressions for the model that compared the relationship between dividend
changes and future asset-scaled earnings changes.
6.2.3. Regression Results
In this section we will present the results of the OLS and the Two-Stage Least Square
estimations that analyse the relationship between dividend changes and ROA levels.
OLS Regression of the dividend change equation
Table 21 presents the results for the OLS estimation of the dividend change equation
(equation 21):
Table 21- Simple OLS Regression of the dividend change equation (Dividend Changes and ROA levels)
Dividend Changes and ROA levels
T=1 T=2
Coefficient T-statistic P-Value Coefficient T-statistic P-Value
Intercept 0.100 0.724 0.471 Intercept -0.021 -0.130 0.897
α1ROAT 0.021 0.136 0.892 α1 1.490 1.427 0.158
α2PR∆FCFD-1… 0.452 0.994 0.324 α2 0.688 1.470 0.146
α3NR∆FCFD-1… -0.093 -0.254 0.800 α3 -0.094 -0.261 0.795
α4R∆E-1 0.395 3.412 0.001 α4 0.447 3.766 0.000
α5NDDivP0 × R∆DivP0 -0.430 -0.616 0.540 α5 -0.440 -0.639 0.525
α6PDDivP0 × R∆DivP0 -0.005 -0.040 0.968 α6 0.008 0.062 0.951
R-squared 0.157 R-squared 0.180 Notes: This table reports the OLS estimated regression of the dividend change equation for the
subsequent two years after the dividend-change event year (T=1 and 2).

58
Running the OLS estimation provides us with only one significant coefficient, α4. The
coefficient α4 is positive (0.395) and significant (0.001) at the 1% level for T=1 and also
positive (0.447) and significant (0.000) at the 1% level for T=2. These results support
the previous earnings hypothesis.
Simultaneous-Equation Model (Linear)
Table 22 provides the results for the regression of the future earnings change equation in
its linear form (equation 22):
Table 22- First stage of the 2SLS regression using the future earnings change equation in its linear form (Dividend Changes and ROA levels)
Dividend Changes and ROA levels- Future Earnings Change (Linear)
T=1 T=2
Coefficient T-statistic P-Value Coefficient T-statistic P-Value
Intercept 0.041 0.094 0.925 Intercept 0.234 4.154 0.000
β1R∆DIV0 -0.020 -0.226 0.822 β1 -0.002 -0.167 0.868
β2ROAT-1 0.011 0.008 0.994 β2 0.024 1.536 0.129
β3CEO 0.168 0.295 0.769 β3 0.000 0.002 0.999
ʊ1MB-1 0.033 0.161 0.873 ʊ1 0.083 3.691 0.000
ʊ2Size-1 0.016 0.218 0.828 ʊ2 -0.034 -3.475 0.001
R-squared 0.004 R-squared 0.271 Notes: This table reports the first stage of the 2SLS estimated simultaneous-equation model system for
the subsequent two years after the dividend-change event year (T=1 and 2). The equation being estimated
is the future earnings change equation in its linear form
The findings from this regression are consistent with previous results. The coefficient β1
is negative (-0.020) and insignificant (0.822) for T=1 and also negative (-0.002) and
insignificant (0.868) for T=2. These results coincide with the results from section 5.2.3.
that suggested dividend changes cannot predict future ROA levels. In terms of control
variables only ʊ1 is significant and for the year T=2.
Table 23 provides the data related to the second stage of the 2SLS regression (equation
21):
Table 23- Second stage of the 2SLS regression using the dividend change equation in its linear form (Dividend Changes and ROA levels)
Dividend Changes and ROA levels- Dividend Change Equation (Linear)
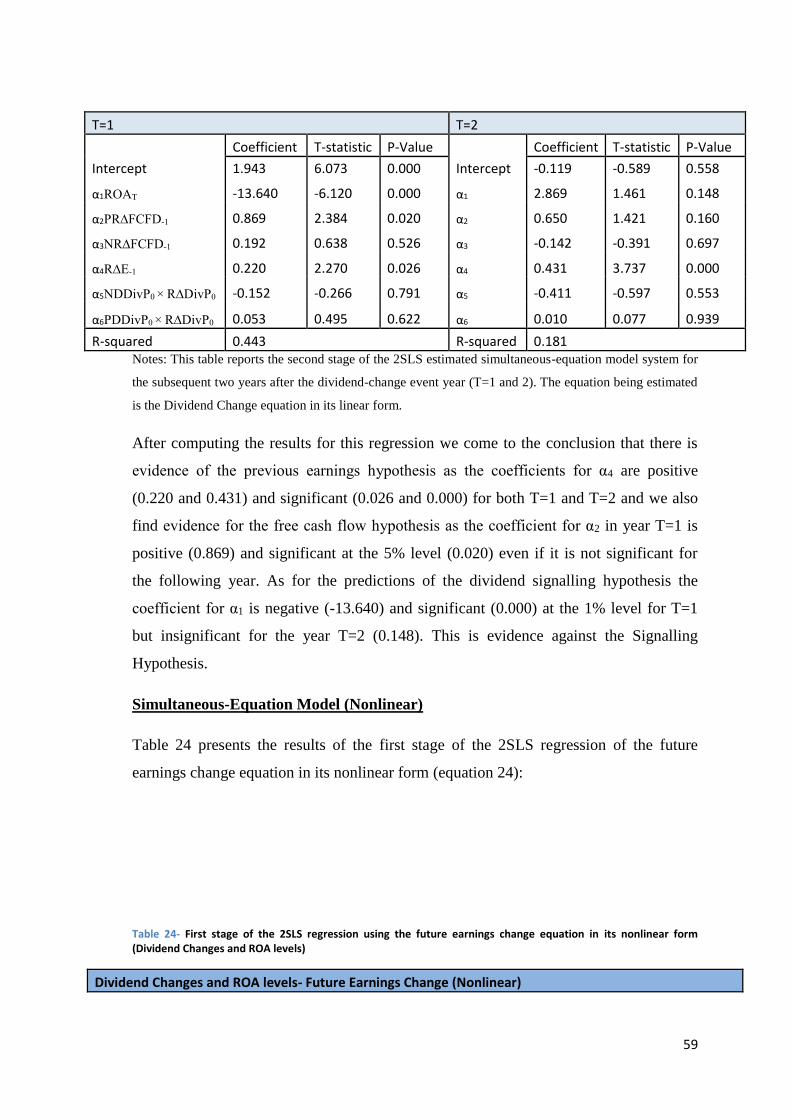
59
T=1 T=2
Coefficient T-statistic P-Value Coefficient T-statistic P-Value
Intercept 1.943 6.073 0.000 Intercept -0.119 -0.589 0.558
α1ROAT -13.640 -6.120 0.000 α1 2.869 1.461 0.148
α2PR∆FCFD-1 0.869 2.384 0.020 α2 0.650 1.421 0.160
α3NR∆FCFD-1 0.192 0.638 0.526 α3 -0.142 -0.391 0.697
α4R∆E-1 0.220 2.270 0.026 α4 0.431 3.737 0.000
α5NDDivP0 × R∆DivP0 -0.152 -0.266 0.791 α5 -0.411 -0.597 0.553
α6PDDivP0 × R∆DivP0 0.053 0.495 0.622 α6 0.010 0.077 0.939
R-squared 0.443 R-squared 0.181 Notes: This table reports the second stage of the 2SLS estimated simultaneous-equation model system for
the subsequent two years after the dividend-change event year (T=1 and 2). The equation being estimated
is the Dividend Change equation in its linear form.
After computing the results for this regression we come to the conclusion that there is
evidence of the previous earnings hypothesis as the coefficients for α4 are positive
(0.220 and 0.431) and significant (0.026 and 0.000) for both T=1 and T=2 and we also
find evidence for the free cash flow hypothesis as the coefficient for α2 in year T=1 is
positive (0.869) and significant at the 5% level (0.020) even if it is not significant for
the following year. As for the predictions of the dividend signalling hypothesis the
coefficient for α1 is negative (-13.640) and significant (0.000) at the 1% level for T=1
but insignificant for the year T=2 (0.148). This is evidence against the Signalling
Hypothesis.
Simultaneous-Equation Model (Nonlinear)
Table 24 presents the results of the first stage of the 2SLS regression of the future
earnings change equation in its nonlinear form (equation 24):
Table 24- First stage of the 2SLS regression using the future earnings change equation in its nonlinear form (Dividend Changes and ROA levels)
Dividend Changes and ROA levels- Future Earnings Change (Nonlinear)
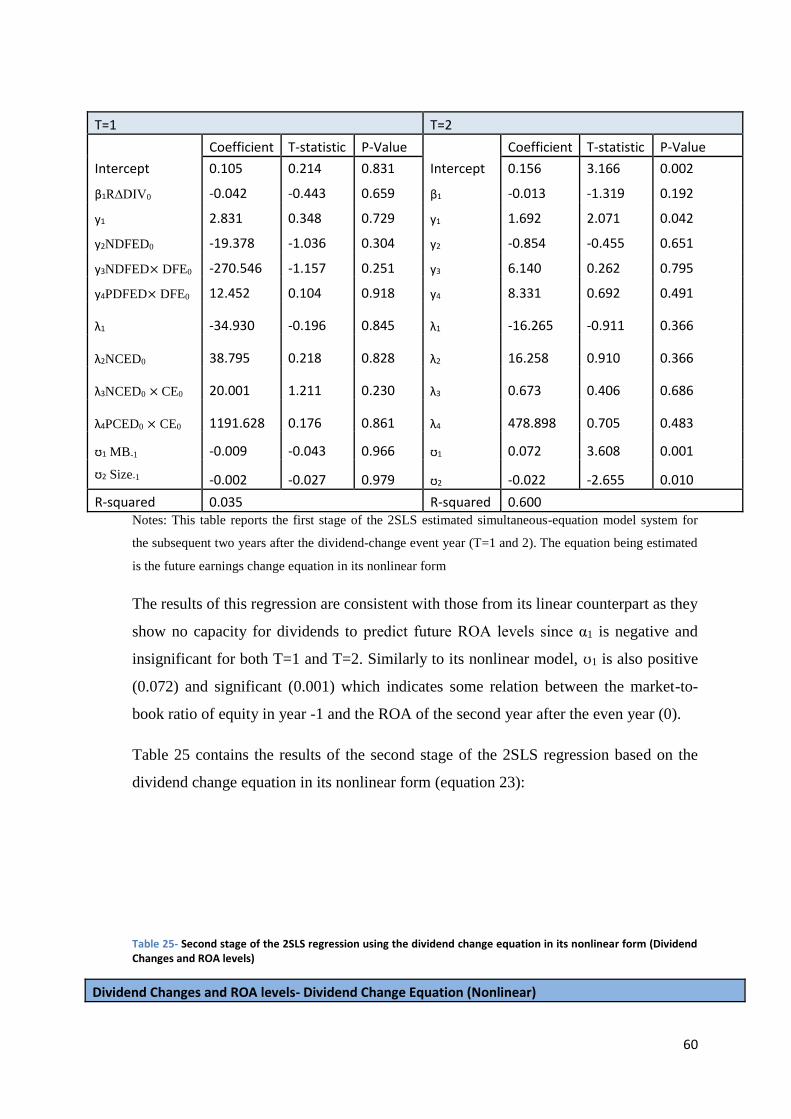
60
T=1 T=2
Coefficient T-statistic P-Value Coefficient T-statistic P-Value
Intercept 0.105 0.214 0.831 Intercept 0.156 3.166 0.002
β1R∆DIV0 -0.042 -0.443 0.659 β1 -0.013 -1.319 0.192
y1 2.831 0.348 0.729 y1 1.692 2.071 0.042
y2NDFED0 -19.378 -1.036 0.304 y2 -0.854 -0.455 0.651
y3NDFED× DFE0 -270.546 -1.157 0.251 y3 6.140 0.262 0.795
y4PDFED× DFE0 12.452 0.104 0.918 y4 8.331 0.692 0.491 λ1 -34.930 -0.196 0.845
λ1 -16.265 -0.911 0.366
λ2NCED0 38.795 0.218 0.828
λ2 16.258 0.910 0.366
λ3NCED0 × CE0 20.001 1.211 0.230
λ3 0.673 0.406 0.686
λ4PCED0 × CE0 1191.628 0.176 0.861
λ4 478.898 0.705 0.483
ʊ1 MB-1 -0.009 -0.043 0.966 ʊ1 0.072 3.608 0.001
ʊ2 Size-1 -0.002 -0.027 0.979 ʊ2 -0.022 -2.655 0.010
R-squared 0.035 R-squared 0.600 Notes: This table reports the first stage of the 2SLS estimated simultaneous-equation model system for
the subsequent two years after the dividend-change event year (T=1 and 2). The equation being estimated
is the future earnings change equation in its nonlinear form
The results of this regression are consistent with those from its linear counterpart as they
show no capacity for dividends to predict future ROA levels since α1 is negative and
insignificant for both T=1 and T=2. Similarly to its nonlinear model, ʊ1 is also positive
(0.072) and significant (0.001) which indicates some relation between the market-to-
book ratio of equity in year -1 and the ROA of the second year after the even year (0).
Table 25 contains the results of the second stage of the 2SLS regression based on the
dividend change equation in its nonlinear form (equation 23):
Table 25- Second stage of the 2SLS regression using the dividend change equation in its nonlinear form (Dividend Changes and ROA levels)
Dividend Changes and ROA levels- Dividend Change Equation (Nonlinear)
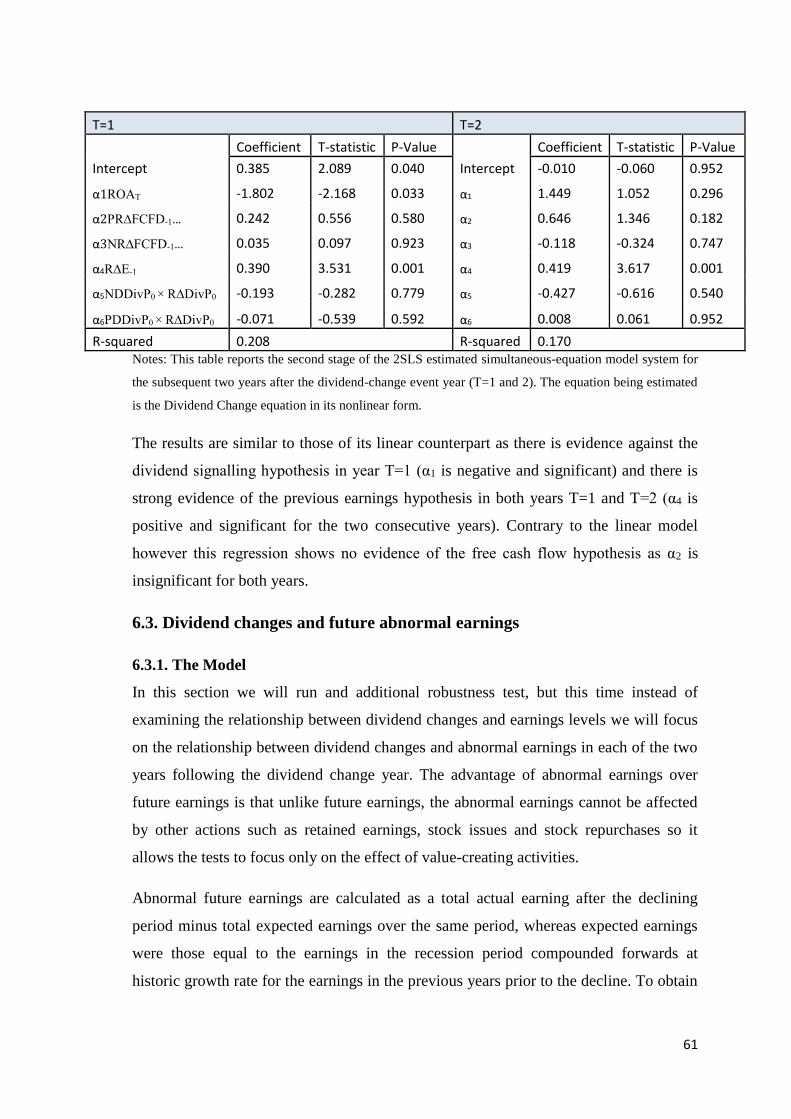
61
T=1 T=2
Coefficient T-statistic P-Value Coefficient T-statistic P-Value
Intercept 0.385 2.089 0.040 Intercept -0.010 -0.060 0.952
α1ROAT -1.802 -2.168 0.033 α1 1.449 1.052 0.296
α2PR∆FCFD-1… 0.242 0.556 0.580 α2 0.646 1.346 0.182
α3NR∆FCFD-1… 0.035 0.097 0.923 α3 -0.118 -0.324 0.747
α4R∆E-1 0.390 3.531 0.001 α4 0.419 3.617 0.001
α5NDDivP0 × R∆DivP0 -0.193 -0.282 0.779 α5 -0.427 -0.616 0.540
α6PDDivP0 × R∆DivP0 -0.071 -0.539 0.592 α6 0.008 0.061 0.952
R-squared 0.208 R-squared 0.170 Notes: This table reports the second stage of the 2SLS estimated simultaneous-equation model system for
the subsequent two years after the dividend-change event year (T=1 and 2). The equation being estimated
is the Dividend Change equation in its nonlinear form.
The results are similar to those of its linear counterpart as there is evidence against the
dividend signalling hypothesis in year T=1 (α1 is negative and significant) and there is
strong evidence of the previous earnings hypothesis in both years T=1 and T=2 (α4 is
positive and significant for the two consecutive years). Contrary to the linear model
however this regression shows no evidence of the free cash flow hypothesis as α2 is
insignificant for both years.
6.3. Dividend changes and future abnormal earnings
6.3.1. The Model
In this section we will run and additional robustness test, but this time instead of
examining the relationship between dividend changes and earnings levels we will focus
on the relationship between dividend changes and abnormal earnings in each of the two
years following the dividend change year. The advantage of abnormal earnings over
future earnings is that unlike future earnings, the abnormal earnings cannot be affected
by other actions such as retained earnings, stock issues and stock repurchases so it
allows the tests to focus only on the effect of value-creating activities.
Abnormal future earnings are calculated as a total actual earning after the declining
period minus total expected earnings over the same period, whereas expected earnings
were those equal to the earnings in the recession period compounded forwards at
historic growth rate for the earnings in the previous years prior to the decline. To obtain
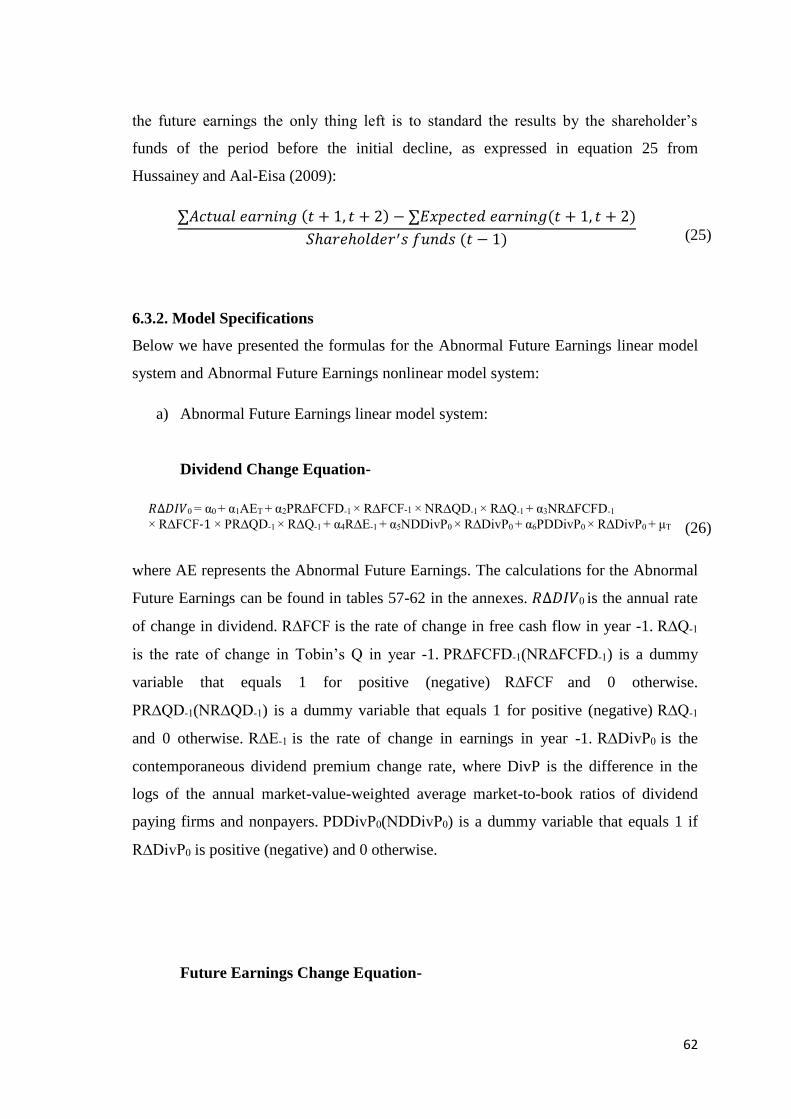
62
the future earnings the only thing left is to standard the results by the shareholder’s
funds of the period before the initial decline, as expressed in equation 25 from
Hussainey and Aal-Eisa (2009):
∑𝐴𝑐𝑡𝑢𝑎𝑙 𝑒𝑎𝑟𝑛𝑖𝑛𝑔 (𝑡 + 1, 𝑡 + 2) − ∑𝐸𝑥𝑝𝑒𝑐𝑡𝑒𝑑 𝑒𝑎𝑟𝑛𝑖𝑛𝑔(𝑡 + 1, 𝑡 + 2)
𝑆ℎ𝑎𝑟𝑒ℎ𝑜𝑙𝑑𝑒𝑟′𝑠 𝑓𝑢𝑛𝑑𝑠 (𝑡 − 1)
(25)
6.3.2. Model Specifications
Below we have presented the formulas for the Abnormal Future Earnings linear model
system and Abnormal Future Earnings nonlinear model system:
a) Abnormal Future Earnings linear model system:
Dividend Change Equation-
𝑅∆𝐷𝐼𝑉0 = α0 + α1AET + α2PR∆FCFD-1 × R∆FCF-1 × NR∆QD-1 × R∆Q-1 + α3NR∆FCFD-1
× R∆FCF-1 × PR∆QD-1 × R∆Q-1 + α4R∆E-1 + α5NDDivP0 × R∆DivP0 + α6PDDivP0 × R∆DivP0 + μT
(26)
where AE represents the Abnormal Future Earnings. The calculations for the Abnormal
Future Earnings can be found in tables 57-62 in the annexes. 𝑅∆𝐷𝐼𝑉0 is the annual rate
of change in dividend. R∆FCF is the rate of change in free cash flow in year -1. R∆Q-1
is the rate of change in Tobin’s Q in year -1. PR∆FCFD-1(NR∆FCFD-1) is a dummy
variable that equals 1 for positive (negative) R∆FCF and 0 otherwise.
PR∆QD-1(NR∆QD-1) is a dummy variable that equals 1 for positive (negative) R∆Q-1
and 0 otherwise. R∆E-1 is the rate of change in earnings in year -1. R∆DivP0 is the
contemporaneous dividend premium change rate, where DivP is the difference in the
logs of the annual market-value-weighted average market-to-book ratios of dividend
paying firms and nonpayers. PDDivP0(NDDivP0) is a dummy variable that equals 1 if
R∆DivP0 is positive (negative) and 0 otherwise.
Future Earnings Change Equation-
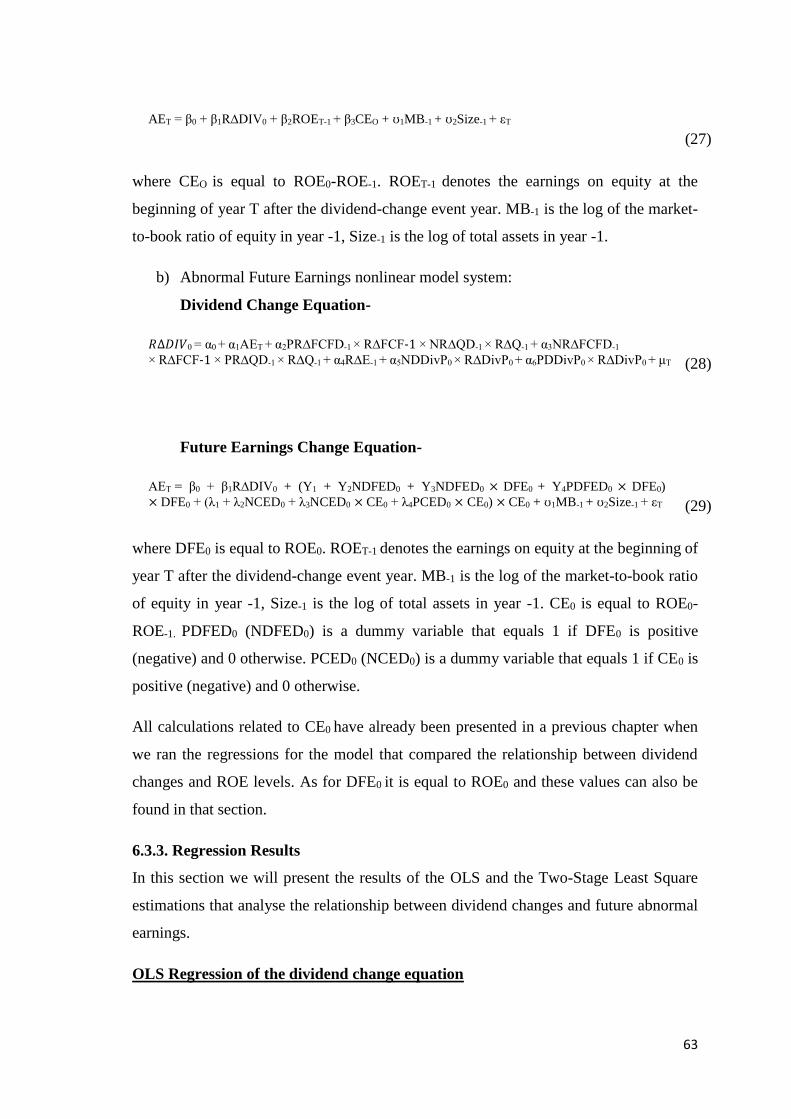
63
AET = β0 + β1R∆DIV0 + β2ROET-1 + β3CEO + ʊ1MB-1 + ʊ2Size-1 + εT
(27)
where CEO is equal to ROE0-ROE-1. ROET-1 denotes the earnings on equity at the
beginning of year T after the dividend-change event year. MB-1 is the log of the market-
to-book ratio of equity in year -1, Size-1 is the log of total assets in year -1.
b) Abnormal Future Earnings nonlinear model system:
Dividend Change Equation-
𝑅∆𝐷𝐼𝑉0 = α0 + α1AET + α2PR∆FCFD-1 × R∆FCF-1 × NR∆QD-1 × R∆Q-1 + α3NR∆FCFD-1
× R∆FCF-1 × PR∆QD-1 × R∆Q-1 + α4R∆E-1 + α5NDDivP0 × R∆DivP0 + α6PDDivP0 × R∆DivP0 + μT
(28)
Future Earnings Change Equation-
AET = β0 + β1R∆DIV0 + (Y1 + Y2NDFED0 + Y3NDFED0 × DFE0 + Y4PDFED0 × DFE0)
× DFE0 + (λ1 + λ2NCED0 + λ3NCED0 × CE0 + λ4PCED0 × CE0) × CE0 + ʊ1MB-1 + ʊ2Size-1 + εT
(29)
where DFE0 is equal to ROE0. ROET-1 denotes the earnings on equity at the beginning of
year T after the dividend-change event year. MB-1 is the log of the market-to-book ratio
of equity in year -1, Size-1 is the log of total assets in year -1. CE0 is equal to ROE0-
ROE-1. PDFED0 (NDFED0) is a dummy variable that equals 1 if DFE0 is positive
(negative) and 0 otherwise. PCED0 (NCED0) is a dummy variable that equals 1 if CE0 is
positive (negative) and 0 otherwise.
All calculations related to CE0 have already been presented in a previous chapter when
we ran the regressions for the model that compared the relationship between dividend
changes and ROE levels. As for DFE0 it is equal to ROE0 and these values can also be
found in that section.
6.3.3. Regression Results
In this section we will present the results of the OLS and the Two-Stage Least Square
estimations that analyse the relationship between dividend changes and future abnormal
earnings.
OLS Regression of the dividend change equation

64
Table 26 presents the results of the OLS estimation of the dividend change equation
(equation 26):
Table 26- Simple OLS Regression of the dividend change equation (Dividend Changes and Abnormal Earnings)
Dividend Changes and Future Abnormal Earnings
T=1 T=2
Coefficient T-statistic P-Value Coefficient T-statistic P-Value
Intercept 0.119 0.865 0.390 Intercept 0.108 0.792 0.431
α1AET 0.157 0.570 0.570 α1 0.050 0.194 0.847
α2PR∆FCFD-1… 0.420 0.955 0.343 α2 0.444 1.006 0.318
α3NR∆FCFD-1… -0.066 -0.180 0.858 α3 -0.088 -0.239 0.812
α4R∆E-1 0.396 3.482 0.001 α4 0.398 3.377 0.001
α5NDDivP0 × R∆DivP0 -0.397 -0.569 0.571 α5 -0.426 -0.609 0.544
α6PDDivP0 × R∆DivP0 -0.013 -0.100 0.921 α6 -0.007 -0.055 0.956
R-squared 0.161 R-squared 0.157 Notes: This table reports the OLS estimated regression of the dividend change equation for the
subsequent two years after the dividend-change event year (T=1 and 2).
The OLS estimation provides similar results to those from previous models. None of the
coefficients are significant with the exception of α4, which as always provides support
to the previous earnings hypothesis. Both α4s for year T=1 and year T=2 are positive
(0.396 and 0.398) and extremely significant at the 1% level (0.001 and 0.001). On the
other hand the coefficient α1 provides no support for the dividend signalling hypothesis
as it is insignificant for both years T=1 and T=2.
Simultaneous-Equation Model (Linear)
Moving on to the first stage of the simultaneous equation model, we can find in table 27
the results of the regression of the future earnings change equation in its linear form
(equation 27):
Table 27- First stage of the 2SLS regression using the future earnings change equation in its linear form (Dividend Changes and Abnormal Earnings)
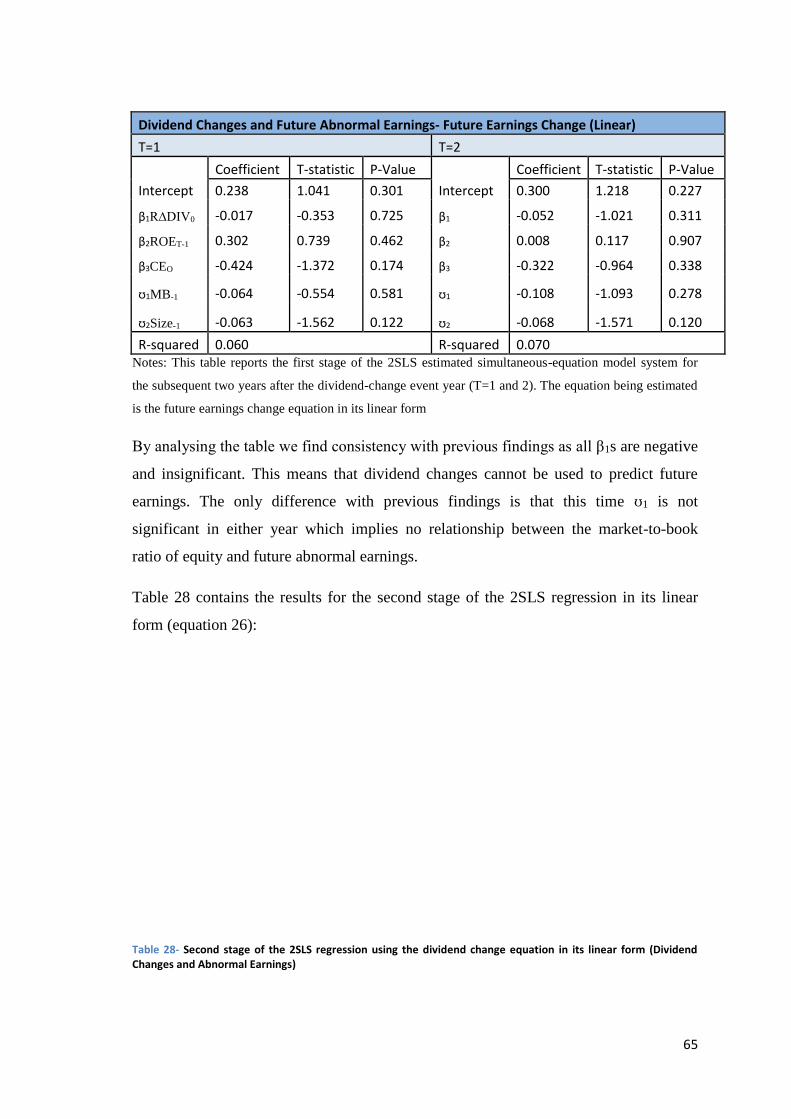
65
Dividend Changes and Future Abnormal Earnings- Future Earnings Change (Linear)
T=1 T=2
Coefficient T-statistic P-Value Coefficient T-statistic P-Value
Intercept 0.238 1.041 0.301 Intercept 0.300 1.218 0.227
β1R∆DIV0 -0.017 -0.353 0.725 β1 -0.052 -1.021 0.311
β2ROET-1 0.302 0.739 0.462 β2 0.008 0.117 0.907
β3CEO -0.424 -1.372 0.174 β3 -0.322 -0.964 0.338
ʊ1MB-1 -0.064 -0.554 0.581 ʊ1 -0.108 -1.093 0.278
ʊ2Size-1 -0.063 -1.562 0.122 ʊ2 -0.068 -1.571 0.120
R-squared 0.060 R-squared 0.070 Notes: This table reports the first stage of the 2SLS estimated simultaneous-equation model system for
the subsequent two years after the dividend-change event year (T=1 and 2). The equation being estimated
is the future earnings change equation in its linear form
By analysing the table we find consistency with previous findings as all β1s are negative
and insignificant. This means that dividend changes cannot be used to predict future
earnings. The only difference with previous findings is that this time ʊ1 is not
significant in either year which implies no relationship between the market-to-book
ratio of equity and future abnormal earnings.
Table 28 contains the results for the second stage of the 2SLS regression in its linear
form (equation 26):
Table 28- Second stage of the 2SLS regression using the dividend change equation in its linear form (Dividend Changes and Abnormal Earnings)
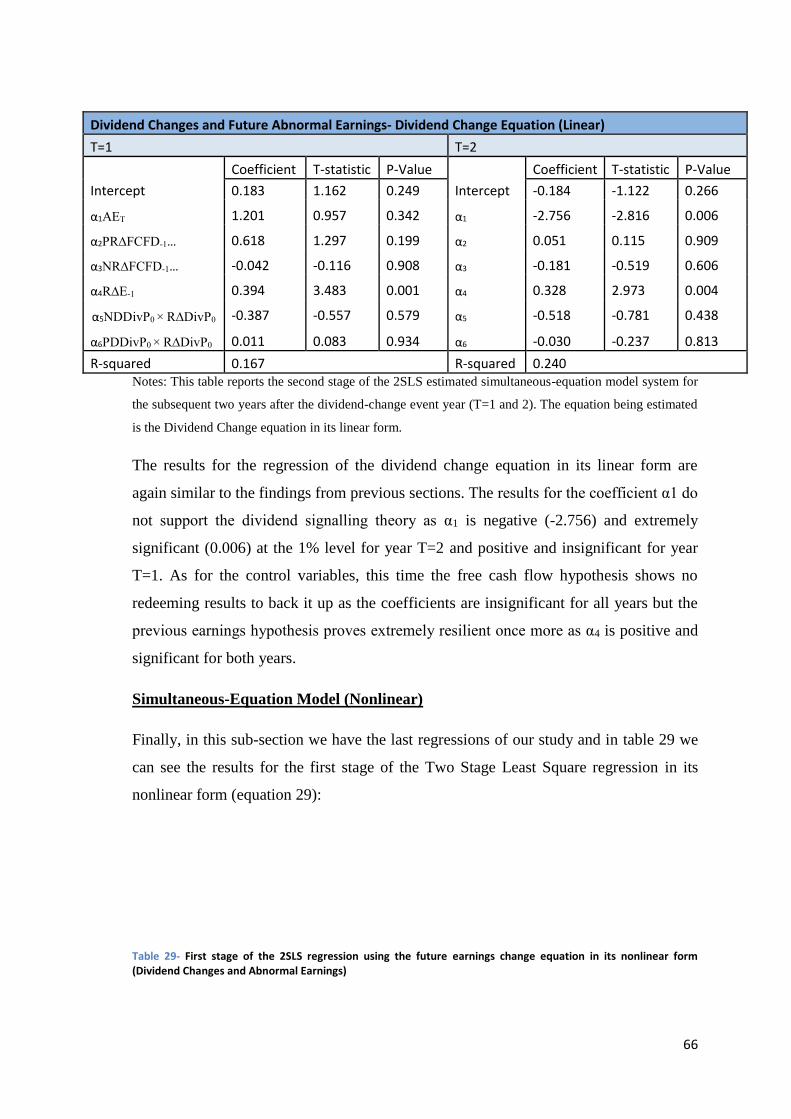
66
Dividend Changes and Future Abnormal Earnings- Dividend Change Equation (Linear)
T=1 T=2
Coefficient T-statistic P-Value Coefficient T-statistic P-Value
Intercept 0.183 1.162 0.249 Intercept -0.184 -1.122 0.266
α1AET 1.201 0.957 0.342 α1 -2.756 -2.816 0.006
α2PR∆FCFD-1… 0.618 1.297 0.199 α2 0.051 0.115 0.909
α3NR∆FCFD-1… -0.042 -0.116 0.908 α3 -0.181 -0.519 0.606
α4R∆E-1 0.394 3.483 0.001 α4 0.328 2.973 0.004
α5NDDivP0 × R∆DivP0 -0.387 -0.557 0.579 α5 -0.518 -0.781 0.438
α6PDDivP0 × R∆DivP0 0.011 0.083 0.934 α6 -0.030 -0.237 0.813
R-squared 0.167 R-squared 0.240 Notes: This table reports the second stage of the 2SLS estimated simultaneous-equation model system for
the subsequent two years after the dividend-change event year (T=1 and 2). The equation being estimated
is the Dividend Change equation in its linear form.
The results for the regression of the dividend change equation in its linear form are
again similar to the findings from previous sections. The results for the coefficient α1 do
not support the dividend signalling theory as α1 is negative (-2.756) and extremely
significant (0.006) at the 1% level for year T=2 and positive and insignificant for year
T=1. As for the control variables, this time the free cash flow hypothesis shows no
redeeming results to back it up as the coefficients are insignificant for all years but the
previous earnings hypothesis proves extremely resilient once more as α4 is positive and
significant for both years.
Simultaneous-Equation Model (Nonlinear)
Finally, in this sub-section we have the last regressions of our study and in table 29 we
can see the results for the first stage of the Two Stage Least Square regression in its
nonlinear form (equation 29):
Table 29- First stage of the 2SLS regression using the future earnings change equation in its nonlinear form (Dividend Changes and Abnormal Earnings)
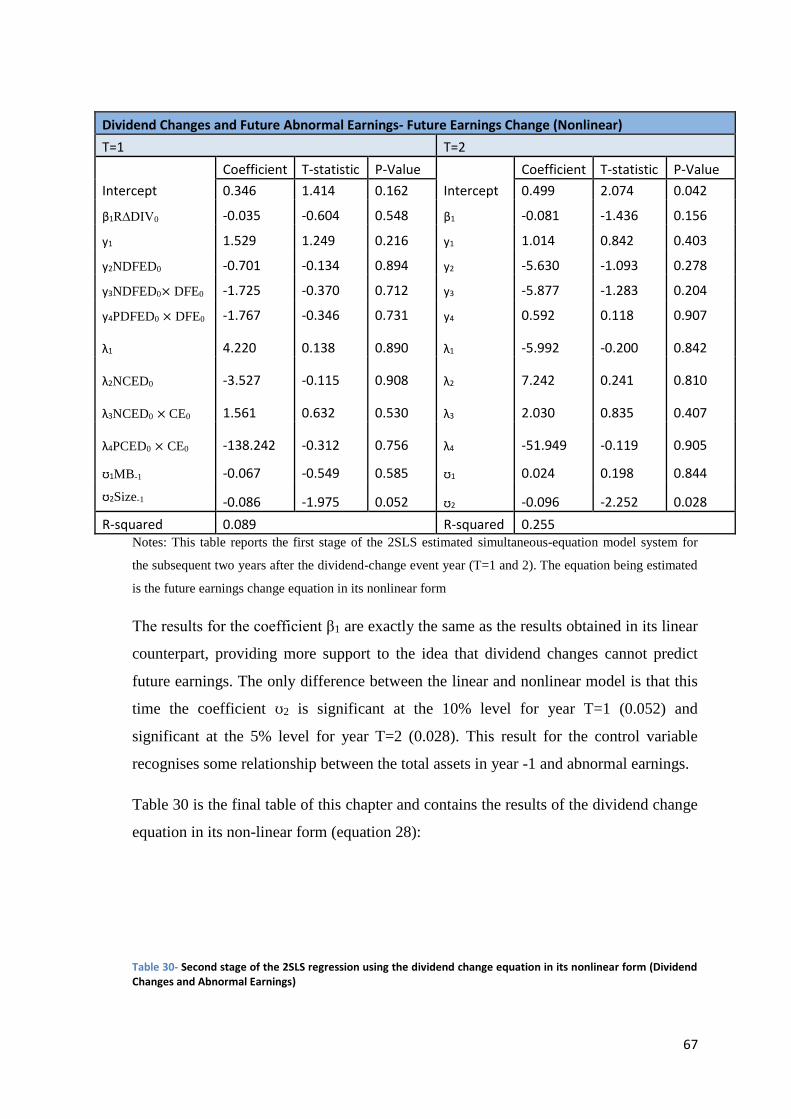
67
Dividend Changes and Future Abnormal Earnings- Future Earnings Change (Nonlinear)
T=1 T=2
Coefficient T-statistic P-Value Coefficient T-statistic P-Value
Intercept 0.346 1.414 0.162 Intercept 0.499 2.074 0.042
β1R∆DIV0 -0.035 -0.604 0.548 β1 -0.081 -1.436 0.156
y1 1.529 1.249 0.216 y1 1.014 0.842 0.403
y2NDFED0 -0.701 -0.134 0.894 y2 -5.630 -1.093 0.278
y3NDFED0× DFE0 -1.725 -0.370 0.712 y3 -5.877 -1.283 0.204
y4PDFED0 × DFE0 -1.767 -0.346 0.731 y4 0.592 0.118 0.907 λ1 4.220 0.138 0.890
λ1 -5.992 -0.200 0.842
λ2NCED0 -3.527 -0.115 0.908
λ2 7.242 0.241 0.810
λ3NCED0 × CE0 1.561 0.632 0.530
λ3 2.030 0.835 0.407
λ4PCED0 × CE0 -138.242 -0.312 0.756
λ4 -51.949 -0.119 0.905
ʊ1MB-1 -0.067 -0.549 0.585 ʊ1 0.024 0.198 0.844
ʊ2Size-1 -0.086 -1.975 0.052 ʊ2 -0.096 -2.252 0.028
R-squared 0.089 R-squared 0.255 Notes: This table reports the first stage of the 2SLS estimated simultaneous-equation model system for
the subsequent two years after the dividend-change event year (T=1 and 2). The equation being estimated
is the future earnings change equation in its nonlinear form
The results for the coefficient β1 are exactly the same as the results obtained in its linear
counterpart, providing more support to the idea that dividend changes cannot predict
future earnings. The only difference between the linear and nonlinear model is that this
time the coefficient ʊ2 is significant at the 10% level for year T=1 (0.052) and
significant at the 5% level for year T=2 (0.028). This result for the control variable
recognises some relationship between the total assets in year -1 and abnormal earnings.
Table 30 is the final table of this chapter and contains the results of the dividend change
equation in its non-linear form (equation 28):
Table 30- Second stage of the 2SLS regression using the dividend change equation in its nonlinear form (Dividend Changes and Abnormal Earnings)
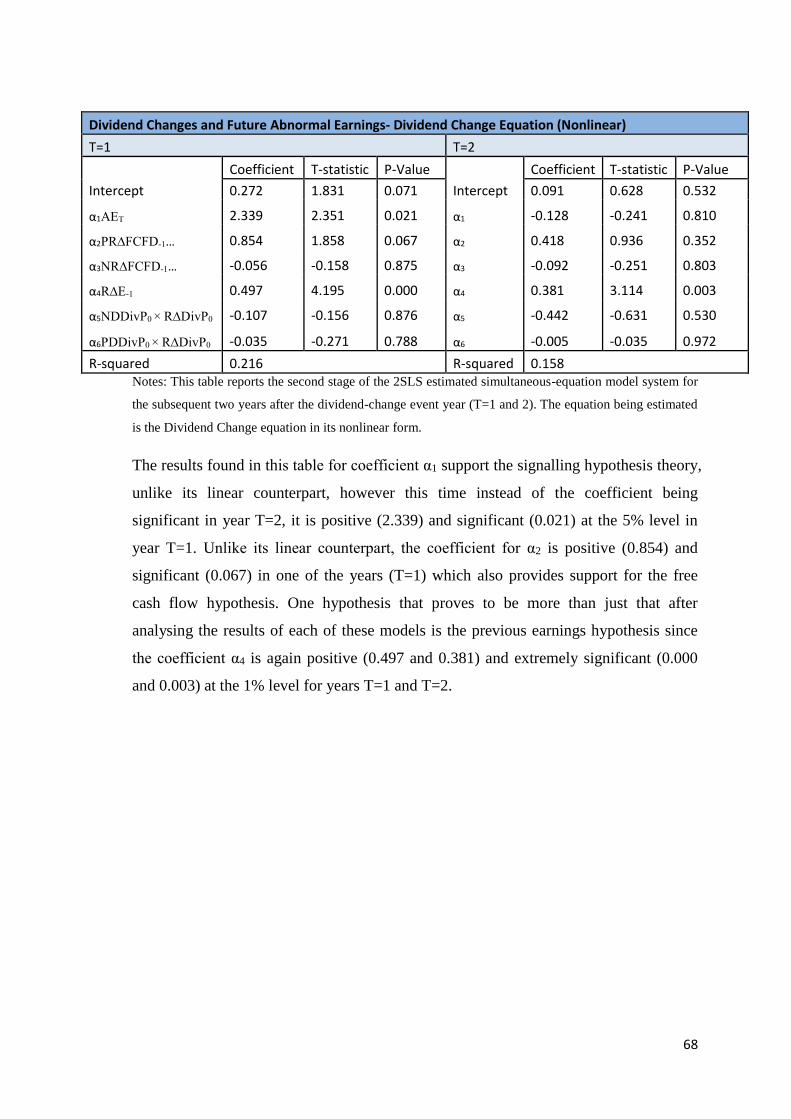
68
Dividend Changes and Future Abnormal Earnings- Dividend Change Equation (Nonlinear)
T=1 T=2
Coefficient T-statistic P-Value Coefficient T-statistic P-Value
Intercept 0.272 1.831 0.071 Intercept 0.091 0.628 0.532
α1AET 2.339 2.351 0.021 α1 -0.128 -0.241 0.810
α2PR∆FCFD-1… 0.854 1.858 0.067 α2 0.418 0.936 0.352
α3NR∆FCFD-1… -0.056 -0.158 0.875 α3 -0.092 -0.251 0.803
α4R∆E-1 0.497 4.195 0.000 α4 0.381 3.114 0.003
α5NDDivP0 × R∆DivP0 -0.107 -0.156 0.876 α5 -0.442 -0.631 0.530
α6PDDivP0 × R∆DivP0 -0.035 -0.271 0.788 α6 -0.005 -0.035 0.972
R-squared 0.216 R-squared 0.158 Notes: This table reports the second stage of the 2SLS estimated simultaneous-equation model system for
the subsequent two years after the dividend-change event year (T=1 and 2). The equation being estimated
is the Dividend Change equation in its nonlinear form.
The results found in this table for coefficient α1 support the signalling hypothesis theory,
unlike its linear counterpart, however this time instead of the coefficient being
significant in year T=2, it is positive (2.339) and significant (0.021) at the 5% level in
year T=1. Unlike its linear counterpart, the coefficient for α2 is positive (0.854) and
significant (0.067) in one of the years (T=1) which also provides support for the free
cash flow hypothesis. One hypothesis that proves to be more than just that after
analysing the results of each of these models is the previous earnings hypothesis since
the coefficient α4 is again positive (0.497 and 0.381) and extremely significant (0.000
and 0.003) at the 1% level for years T=1 and T=2.
69
7. Conclusions
The study that was performed in this dissertation tests the signalling hypothesis using
models with control variables to more accurately test the validity of this theory as these
variables control for other motives that may lead managers to change dividends other
than signalling information to investors. Our study builds upon recent models that take
into consideration other hypothesis that might explain dividend changes such as the
previous earnings changes hypothesis, the free cash flow hypothesis or the dividend
clientele hypothesis.
In this study we have performed not only the single-equation OLS based estimation but
also a simultaneous-equation model system using the 2SLS method, which was a model
first implemented by Liu and Chen (2015) to solve the mutually endogenous problem
between dividend changes and future earnings changes. We found that in our
estimations the 2SLS model did indeed prove superior to the OLS based estimation as it
was capable of capturing evidence in favour of the dividend-signalling hypothesis while
the OLS estimations only captured evidence of the previous earnings changes
hypothesis and all signs of the dividend-signalling were non-existent.
After running our models we find that there is some merit to the dividend-signalling
hypothesis but the evidence is not absolute like in the study of Liu and Chen (2015) for
the North-American market. We can see the evidence in favour of this theory by
looking at the coefficient α1 in tables 8, 10, 15, 18, 20 and 30 (positive and significant).
The evidence against the hypothesis can be found by looking at the coefficient α1 in
tables 10, 13, 15, 23, 25 and 28 (negative and significant). The difference between the
results of our study and the one performed by Liu and Chen (2015) is in the robustness
tests as those authors found overwhelming evidence in favour of the signalling
hypothesis in those tests (almost all α1s were positive and significant) while our own
robustness tests provided mixed results.
On the other hand, as we can see in tables 8, 10, 13 and 15, our results support their
findings that managers change dividends for signalling future equity-scaled earnings
changes rather than future asset-scaled earnings changes. As suggested by the authors of
the study, it seems that equity investors are the priority targets to the information that
managers want to signal. We did however not find any evidence that points towards a

70
relation between dividend changes and ROA levels, which goes against Liu and Chen
(2015), as in their study increased dividends meant decreased ROA while decreased
dividends meant increased ROA while our study suggests no connection between the
two (β1 is insignificant in tables 22 and 24).
As for the control variables, we found no evidence that supports the dividend catering
hypothesis (all α5s and α6s on the dividend change equations of all model specifications
are insignificant) and some evidence towards the free cash flow hypothesis (the
coefficient α2 is positive and significant in tables 8, 13, 20 and 23). The previous
earnings changes hypothesis however is strongly supported by our model (α4 is positive
and significant in all tables with the dividend change equation) which means that
managers do indeed take into consideration past firm results and signal the persistence
of these firm earnings. The findings related to the dividend catering hypothesis and the
free cash flow hypothesis match those found by the authors in Liu and Chen (2015)‘s
study while the previous earnings changes hypothesis is not fully supported in their
study since their results are mixed on that account.
As for the comparison between the linear and nonlinear formulations of the models we
did not find major differences between the results of both formulations. The results
mirror the evidence from Liu and Chen (2015) that also found opposite results to those
from Grullon et al. (2005).
Finally, table 3 suggests that managers suffer from over-optimism as most managers
increased the dividend levels following the decline of earnings in year 0 and some of
them were met with decreased earnings the following year while those that decreased
dividend levels had their predictions on spot the following year.
As a suggestion for future studies, it would be interesting to analyse the years
surrounding the crisis of 2008 and verify if it had a huge impact on the dividend policy
of firms affected by it. No other study has focused in this period and it could provide
interesting results. Another suggestion is related to the sample size as our own study
was restricted by the limitations of the databases that we used and future researchers can
expand upon the time horizon and obtain a larger and more expressive sample of
European countries.

71
References
Abeyratna, G., Power, M. (2002), “The Post-announcement Performance of Dividend-
changing Companies: The Dividend-Signalling Hypothesis Revisited”, Accounting
and Finance, Vol.42, pp. 131-151.
Adam, T., Goyal, K. (2008), “The investment opportunity set and its proxy variables”,
Journal of Financial Research, Vol. 31, pp. 41-63.
Aharony, J., Dotan, A. (1994), “Regular Dividend Announcements and Future
Unexpected Earnings: An Empirical Analysis”, Financial Review, Vol. 29, pp.125-151.
Ap Gwilym, O.A., Seaton, J. and Thomas, S. (2004), “Dividend Cuts, Firm Profitability
& Financial Characteristics”, Discussion Papers in Accounting & Finance, No. AF04-
18, pp. 44.
Baker, H., Mukherjee, K., Paskelian, G., (2006), “How Norwegien Managers View
Dividend Policy,” Global Finance Journal, Vol. 17, pp. 155-176.
Baker, M., Wurgler, J. (2004), “A Catering Theory of Dividends”, The Journal of
Finance, Vol. 59, No. 3, pp. 1125-1165.
Bhattacharya, S. (1979), “Imperfect Information, Dividend Policy and the Bird in the
Hand Fallacy,” Bell Journal of Economics, Vol. 10(1), pp. 259-270.
Benartzi, S., Michaely, R., Thaler, R.H. (1997), “Do changes in dividends signal the
future of the past?”, Journal of Finance, Vol. 52, pp. 1007-1034.
Brickley, A. (1983), “Shareholders Wealth, Information Signalling and the Specially
Designated Dividend: An Empirical Study”, Journal of Financial Economics, Vol. 12,
pp. 187-209.
Damodaran, A. (2006), Damodaran on Valuation, John Wiley and Sons Ltd.
DeAngelo, H., DeAngelo, L. (1990), “Dividend Policy and Financial Distress”, The
Journal of Finance, Vol. 45, No. 5, pp. 1415-1431.
DeAngelo, H., DeAngelo, L. and Skinner, DJ. (1996), “Reversal of fortune: dividend
policy and the disappearance of sustained earnings growth”, Journal of Financial
Economics, Vol. 40, No. 3, pp. 341-71.
DeAngelo, H., DeAngelo, L. and Skinner, DJ. (2009), “Corporate Payout Policy”,
Foundations and Trends in Finance, Vol. 3, Nos, 2-3, pp. 95-287.
Elgers, P.T., Lo, M.H. (1994), “Reductions in analyst’s annual earnings forecast errors
using information in prior earnings and security returns”, Journal of Accounting
Research, Vol. 32, pp. 290-303.

72
Fama, E.F., H. Babiak, (1968), “Dividend Policy: An Empirical Analysis”, Journal of
the American Statistical Association, Vol. 63, pp. 1132-1161.
Fama, E.F., French, K.R. (1998a), “Dividends, Debt, Investment and Earnings”,
Working Paper, Graduate School of Business, University of Chicago.
Fama, E.F., French, K.R. (1998b), “Taxes, Financing Decisions and Firm Value,”
Journal of Finance, Vol. 53, pp. 819-844.
Fama, E.F., French, K.R. (2000), “Forecasting profitability and earnings”, Journal of
Business, Vol. 73, pp. 161-175.
Ferris, S., Jayraman, N., Sabherwal, S. (2009), “Catering effects in corporate dividend
policy: the international evidence”, Journal of Banking and Finance, Vol. 33, No. 9, pp.
1730-1738.
Frankfurter, G.M., Lane, W.R. (1992), “The Rationality of Dividends”, International
Review of Financial Analysis, Vol. 1, pp. 115-129.
Freeman, R.N., Ohlson, J.A., Penman, S.H. (1982), “Book rate-of-return and prediction
of earnings changes: An empirical investigation”, Journal of Accounting Research, Vol.
20, pp. 639-653.
Fudenberg, D., Tirole, J. (1995), “A Theory of Income and Dividend Smoothing Based
in Incumbency Rents”, Journal of Political Economy, Vol. 103, No. 1, pp.75-93.
Gonedes, N. (1978), “Corporate Signalling, External Accounting, and Capital Market
Equilibrium: Evidence on Dividends, Income and Extraordinary Items”, Journal of
Accounting Research, Vol. 16, pp. 26-79.
Grullon, G., Michaely, R., Swaminathan, B. (2002), “Are Dividend Changes a Sign of
Firm Maturity?”, Journal of Business, Vol. 75, No. 3, pp. 387-424.
Grullon, G., Michaely, R., Benartzi, S., Thaler, R.H. (2005), “Dividend Changes do not
signal changes in future profitability”, Journal of Business, Vol. 78, No. 5, pp. 1659-
1682.
Harada, K., Nguyen, P. (2005), “Dividend Changes Context and Signalling Efficiency
in Japan”, Pacific-Basin Finance Journal, Vol. 13, pp. 504-522.
Healy, P., Palepu, K. (1988), “Earning Information Conveyed by Dividend Initiations
and Omissions”, Journal of Financial Economics, Vol. 21, pp. 149-175.
Hussainey, K., Aal-Eisa, J. (2009), “Disclosure and dividend signalling when sustained
earnings growth declines”, Managerial Auditing Journal, Vol. 24, No. 5, pp. 445-454.
John K., Williams, J., (1985), “Dividends, Dilution and Taxes: A Signalling
Equilibrium”, The Journal of Finance, Vol. 40, pp. 1053-1070.

73
Kaplan, R.S., Roll, R. (1972), “Investor Evaluation of Accounting Information: Some
Empirical Evidence”, Journal of Business, Vol. 45, pp. 225-257.
Karpavicius, S. (2014), “Dividends: Relevance, rigidity, and signalling”, Journal of
Corporate Finance, Vol. 25, pp. 289-312.
Lintner, J. (1956), “Distribution of Incomes of Corporations among Dividends, Retained
Earnings, and Taxes”, American Economic Review, Vol. 46, pp. 97-113.
Liu, C., Chen, A. (2014), “Do firms use dividend changes to signal future profitability?
A simultaneous equation analysis”, International Review of Financial Analysis, Vol. 37,
pp. 194-207.
Litzenberger, R., Ramaswamy. K (1979), “The Effect of Personal Taxes and Dividends
on Capital Asset Prices: Theory and Empirical Evidence”, Journal of Financial
Economics, Vol. 7, pp. 163-195.
Lumby, S., and Jones, C. (1981, reprinted 2000 and 2001), Investment Appraisal &
Financial Decision, London: Chapman and Hall.
Marsh, T., Merton, R. (1987), “Dividend Behavior of the Aggregate Stock Markets”,
Journal of Business, Vol. 60, pp. 1-40.
Miller, M., Modigliani, F. (1961), “Dividend Policy, Growth and the Valuation of
Shares”, Journal of Business, Vol. 34, No. 4, pp. 411-433.
Miller, H., Rock, K. (1985), “Dividend Policy under Asymmetric Information,” The
Journal of Finance, Vol. 40, pp. 1031-1051.
Nissim, D., Ziv, A. (2001), “Dividend changes and future profitability”, Journal of
Finance, Vol. 6, pp. 2111-2133.
Ross, S., Westerfield, R., Jordan, B. (2003), Essentials of Corporate Finance, McGraw-
Hill, 4th edition.
Rozeff, M. S. (1982), “Growth, beta and agency costs as determinants of dividend
payout ratios”, Journal of Financial Research, Vol 27, pp. 993-1007.
Vieira, E., Raposo, C. (2007), “Signalling with dividends? The signalling effects of
dividend change announcements: New evidence from Europe”, Instituto Superior de
Contabilidade e Administração, Universidade de Aveiro, Management Department.
Watts, R. (1973), “The Information Contents of Dividends,” Journal of Business, Vol.
46, pp. 191-211.

74
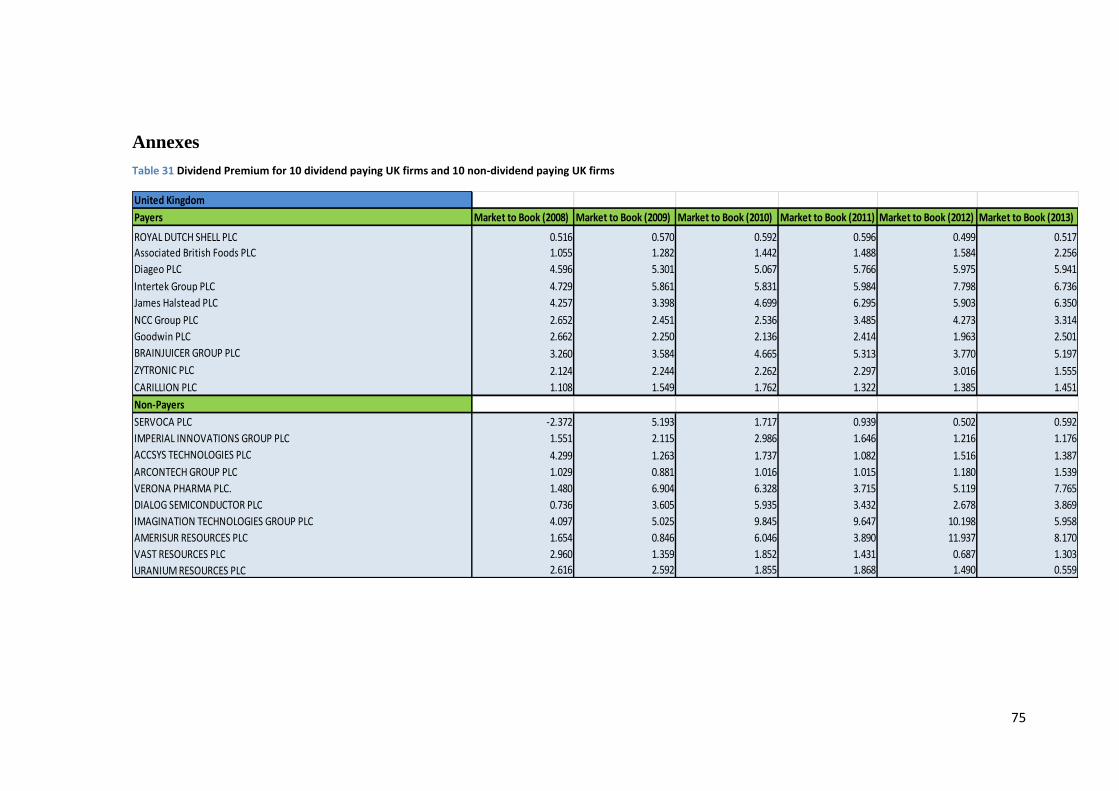
75
Annexes
Table 31 Dividend Premium for 10 dividend paying UK firms and 10 non-dividend paying UK firms
United Kingdom
Payers Market to Book (2008) Market to Book (2009) Market to Book (2010) Market to Book (2011) Market to Book (2012) Market to Book (2013)
ROYAL DUTCH SHELL PLC 0.516 0.570 0.592 0.596 0.499 0.517
Associated British Foods PLC 1.055 1.282 1.442 1.488 1.584 2.256
Diageo PLC 4.596 5.301 5.067 5.766 5.975 5.941
Intertek Group PLC 4.729 5.861 5.831 5.984 7.798 6.736
James Halstead PLC 4.257 3.398 4.699 6.295 5.903 6.350
NCC Group PLC 2.652 2.451 2.536 3.485 4.273 3.314
Goodwin PLC 2.662 2.250 2.136 2.414 1.963 2.501
BRAINJUICER GROUP PLC 3.260 3.584 4.665 5.313 3.770 5.197
ZYTRONIC PLC 2.124 2.244 2.262 2.297 3.016 1.555
CARILLION PLC 1.108 1.549 1.762 1.322 1.385 1.451
Non-Payers
SERVOCA PLC -2.372 5.193 1.717 0.939 0.502 0.592
IMPERIAL INNOVATIONS GROUP PLC 1.551 2.115 2.986 1.646 1.216 1.176
ACCSYS TECHNOLOGIES PLC 4.299 1.263 1.737 1.082 1.516 1.387
ARCONTECH GROUP PLC 1.029 0.881 1.016 1.015 1.180 1.539
VERONA PHARMA PLC. 1.480 6.904 6.328 3.715 5.119 7.765
DIALOG SEMICONDUCTOR PLC 0.736 3.605 5.935 3.432 2.678 3.869
IMAGINATION TECHNOLOGIES GROUP PLC 4.097 5.025 9.845 9.647 10.198 5.958
AMERISUR RESOURCES PLC 1.654 0.846 6.046 3.890 11.937 8.170
VAST RESOURCES PLC 2.960 1.359 1.852 1.431 0.687 1.303
URANIUM RESOURCES PLC 2.616 2.592 1.855 1.868 1.490 0.559
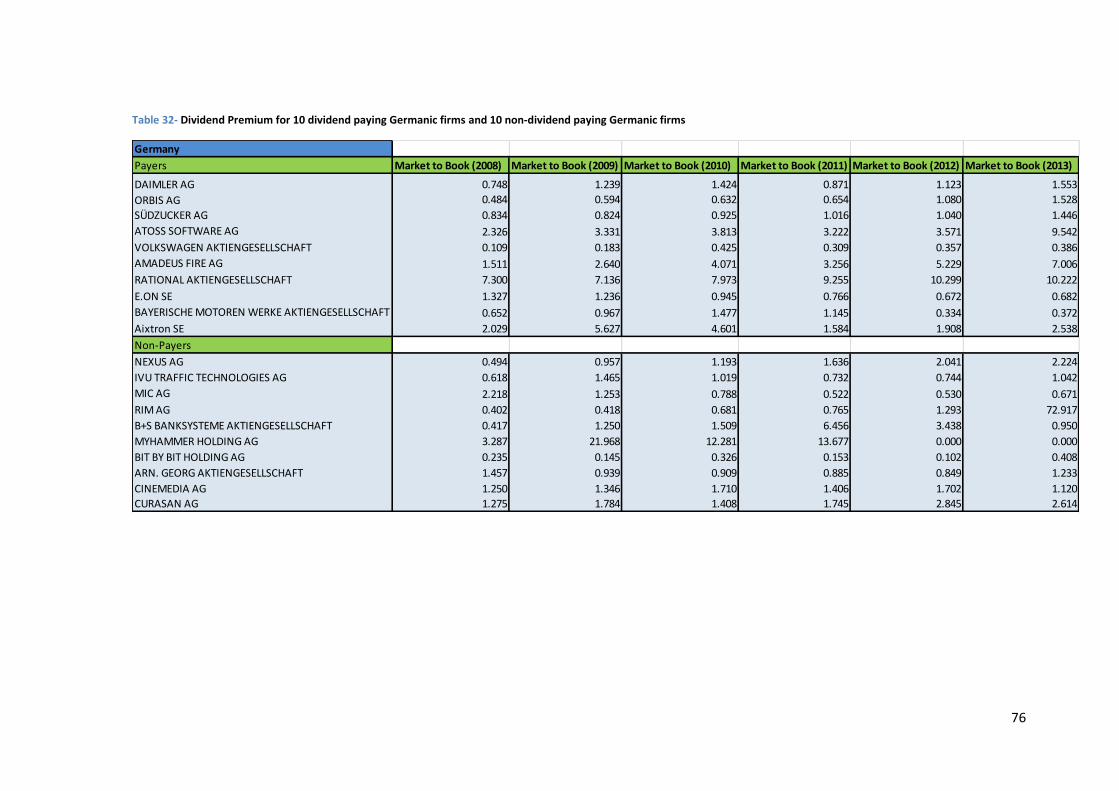
76
Table 32- Dividend Premium for 10 dividend paying Germanic firms and 10 non-dividend paying Germanic firms
Germany
Payers Market to Book (2008) Market to Book (2009) Market to Book (2010) Market to Book (2011) Market to Book (2012) Market to Book (2013)
DAIMLER AG 0.748 1.239 1.424 0.871 1.123 1.553
ORBIS AG 0.484 0.594 0.632 0.654 1.080 1.528
SÜDZUCKER AG 0.834 0.824 0.925 1.016 1.040 1.446
ATOSS SOFTWARE AG 2.326 3.331 3.813 3.222 3.571 9.542
VOLKSWAGEN AKTIENGESELLSCHAFT 0.109 0.183 0.425 0.309 0.357 0.386
AMADEUS FIRE AG 1.511 2.640 4.071 3.256 5.229 7.006
RATIONAL AKTIENGESELLSCHAFT 7.300 7.136 7.973 9.255 10.299 10.222
E.ON SE 1.327 1.236 0.945 0.766 0.672 0.682
BAYERISCHE MOTOREN WERKE AKTIENGESELLSCHAFT 0.652 0.967 1.477 1.145 0.334 0.372
Aixtron SE 2.029 5.627 4.601 1.584 1.908 2.538
Non-Payers
NEXUS AG 0.494 0.957 1.193 1.636 2.041 2.224
IVU TRAFFIC TECHNOLOGIES AG 0.618 1.465 1.019 0.732 0.744 1.042
MIC AG 2.218 1.253 0.788 0.522 0.530 0.671
RIM AG 0.402 0.418 0.681 0.765 1.293 72.917
B+S BANKSYSTEME AKTIENGESELLSCHAFT 0.417 1.250 1.509 6.456 3.438 0.950
MYHAMMER HOLDING AG 3.287 21.968 12.281 13.677 0.000 0.000
BIT BY BIT HOLDING AG 0.235 0.145 0.326 0.153 0.102 0.408
ARN. GEORG AKTIENGESELLSCHAFT 1.457 0.939 0.909 0.885 0.849 1.233
CINEMEDIA AG 1.250 1.346 1.710 1.406 1.702 1.120
CURASAN AG 1.275 1.784 1.408 1.745 2.845 2.614

77
Table 33- Dividend Premium for 10 dividend paying firms and 10 non-dividend paying firms: France
France
Payers Market to Book (2008) Market to Book (2009) Market to Book (2010) Market to Book (2011) Market to Book (2012) Market to Book (2013)
SODEXO 3.393 2.771 2.632 3.212 3.256 3.553
EUTELSAT COMMUNICATIONS 3.552 3.037 4.203 4.132 2.993 2.461
VIRBAC 2.545 2.714 3.776 3.356 3.660 3.171
INTERPARFUMS 1.567 1.719 2.580 1.506 1.480 2.139
POUJOULAT 0.753 0.826 0.767 0.929 0.872 1.114
MGI Coutier 0.291 0.477 0.813 0.643 0.615 1.414
LINEDATA SERVICES 0.563 1.073 1.188 0.820 1.095 1.907
L'AIR LIQUIDE SOCIETE ANONYME 2.527 2.893 3.019 2.780 2.906 2.952
ESSILOR INTERNATIONAL 3.008 3.238 3.380 3.481 4.146 4.099
ORPEA 1.761 1.914 1.555 1.159 1.462 1.658
Non-Payers
STORE ELECTRONIC SYSTEMS 1.783 1.643 1.331 1.224 1.406 1.820
LA COMPAGNIE GENERALE IMMOBILIERE DE FRANCE 0.911 1.160 1.103 1.050 0.985 1.170
C&CO 0.844 1.187 1.271 0.876 0.889 0.911
BUDGET TELECOM 1.519 1.340 1.171 0.567 0.605 1.537
SA ESKER 1.146 2.481 2.584 2.165 3.472 3.538
EURO RESSOURCES 5.664 10.248 8.443 9.111 6.280 5.271
SIDETRADE 3.561 4.031 4.403 4.220 3.634 3.908
HAULOTTE GROUP 0.506 0.875 1.955 0.807 0.983 1.985
AUFEMININ 2.345 2.401 2.727 2.088 1.989 3.277
MGI DIGITAL TECHNOLOGY 1.146 1.958 2.094 1.656 2.071 3.909
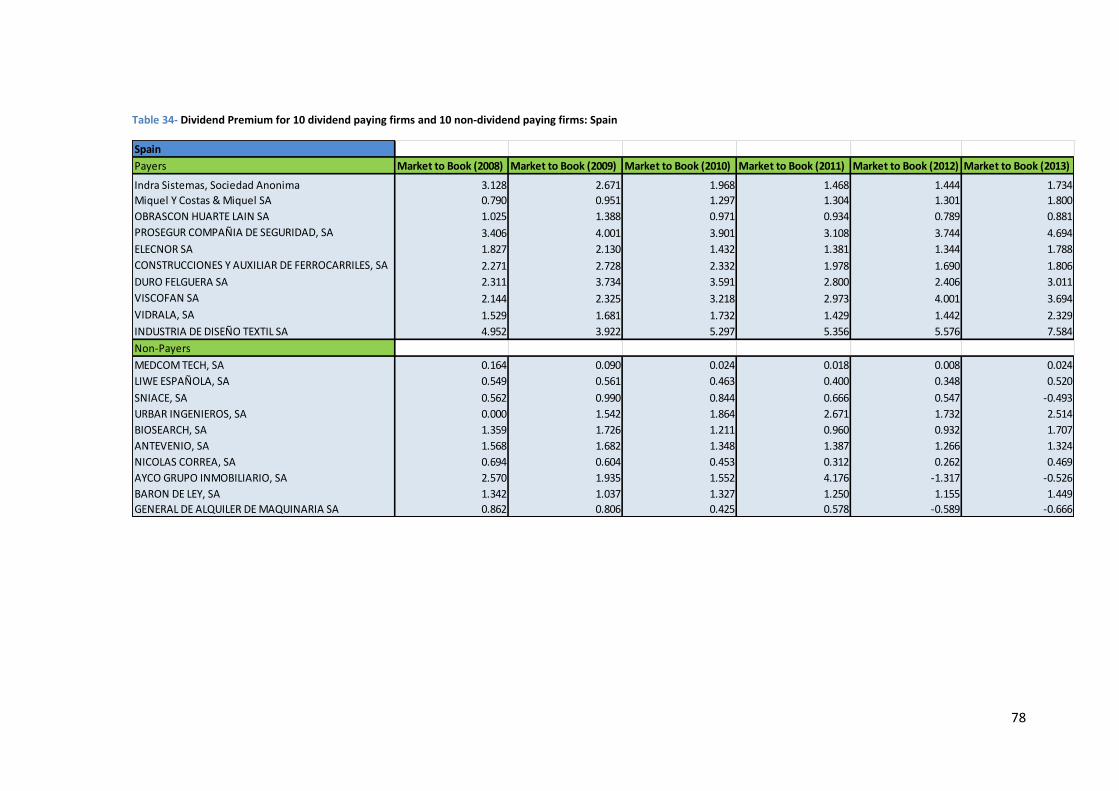
78
Table 34- Dividend Premium for 10 dividend paying firms and 10 non-dividend paying firms: Spain
Spain
Payers Market to Book (2008) Market to Book (2009) Market to Book (2010) Market to Book (2011) Market to Book (2012) Market to Book (2013)
Indra Sistemas, Sociedad Anonima 3.128 2.671 1.968 1.468 1.444 1.734
Miquel Y Costas & Miquel SA 0.790 0.951 1.297 1.304 1.301 1.800
OBRASCON HUARTE LAIN SA 1.025 1.388 0.971 0.934 0.789 0.881
PROSEGUR COMPAÑIA DE SEGURIDAD, SA 3.406 4.001 3.901 3.108 3.744 4.694
ELECNOR SA 1.827 2.130 1.432 1.381 1.344 1.788
CONSTRUCCIONES Y AUXILIAR DE FERROCARRILES, SA 2.271 2.728 2.332 1.978 1.690 1.806
DURO FELGUERA SA 2.311 3.734 3.591 2.800 2.406 3.011
VISCOFAN SA 2.144 2.325 3.218 2.973 4.001 3.694
VIDRALA, SA 1.529 1.681 1.732 1.429 1.442 2.329
INDUSTRIA DE DISEÑO TEXTIL SA 4.952 3.922 5.297 5.356 5.576 7.584
Non-Payers
MEDCOM TECH, SA 0.164 0.090 0.024 0.018 0.008 0.024
LIWE ESPAÑOLA, SA 0.549 0.561 0.463 0.400 0.348 0.520
SNIACE, SA 0.562 0.990 0.844 0.666 0.547 -0.493
URBAR INGENIEROS, SA 0.000 1.542 1.864 2.671 1.732 2.514
BIOSEARCH, SA 1.359 1.726 1.211 0.960 0.932 1.707
ANTEVENIO, SA 1.568 1.682 1.348 1.387 1.266 1.324
NICOLAS CORREA, SA 0.694 0.604 0.453 0.312 0.262 0.469
AYCO GRUPO INMOBILIARIO, SA 2.570 1.935 1.552 4.176 -1.317 -0.526
BARON DE LEY, SA 1.342 1.037 1.327 1.250 1.155 1.449
GENERAL DE ALQUILER DE MAQUINARIA SA 0.862 0.806 0.425 0.578 -0.589 -0.666
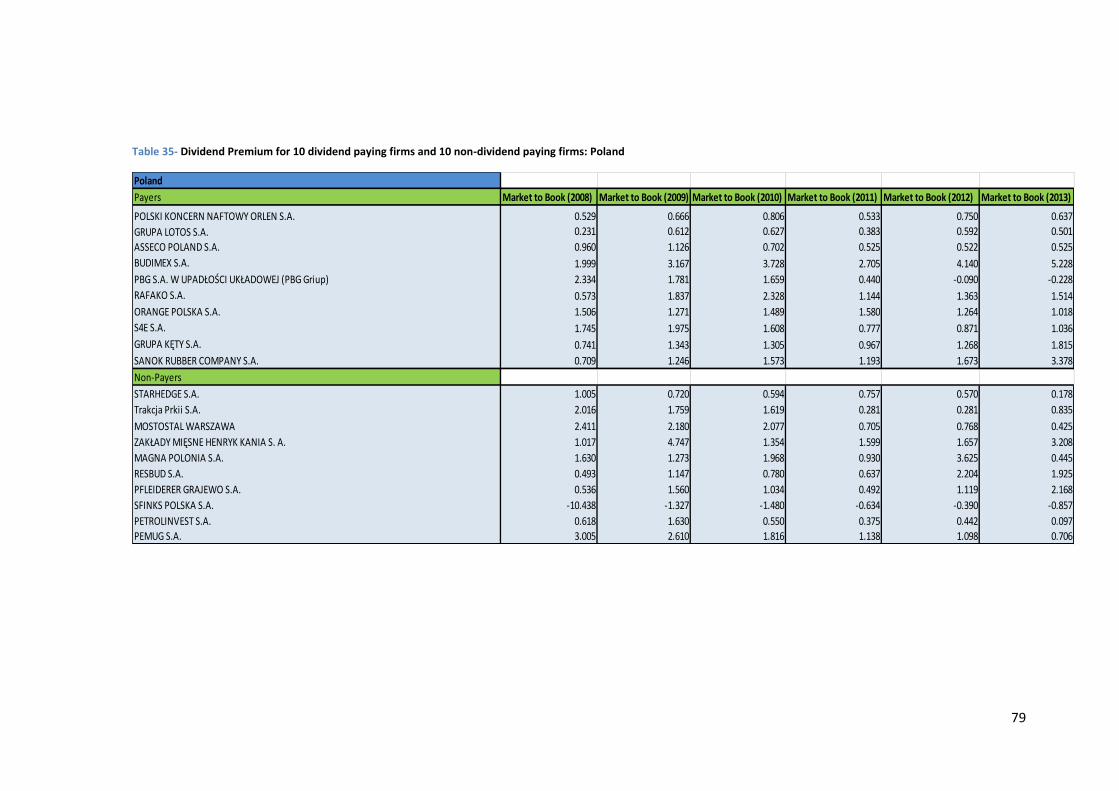
79
Table 35- Dividend Premium for 10 dividend paying firms and 10 non-dividend paying firms: Poland
Poland
Payers Market to Book (2008) Market to Book (2009) Market to Book (2010) Market to Book (2011) Market to Book (2012) Market to Book (2013)
POLSKI KONCERN NAFTOWY ORLEN S.A. 0.529 0.666 0.806 0.533 0.750 0.637
GRUPA LOTOS S.A. 0.231 0.612 0.627 0.383 0.592 0.501
ASSECO POLAND S.A. 0.960 1.126 0.702 0.525 0.522 0.525
BUDIMEX S.A. 1.999 3.167 3.728 2.705 4.140 5.228
PBG S.A. W UPADŁOŚCI UKŁADOWEJ (PBG Griup) 2.334 1.781 1.659 0.440 -0.090 -0.228
RAFAKO S.A. 0.573 1.837 2.328 1.144 1.363 1.514
ORANGE POLSKA S.A. 1.506 1.271 1.489 1.580 1.264 1.018
S4E S.A. 1.745 1.975 1.608 0.777 0.871 1.036
GRUPA KĘTY S.A. 0.741 1.343 1.305 0.967 1.268 1.815
SANOK RUBBER COMPANY S.A. 0.709 1.246 1.573 1.193 1.673 3.378
Non-Payers
STARHEDGE S.A. 1.005 0.720 0.594 0.757 0.570 0.178
Trakcja Prkii S.A. 2.016 1.759 1.619 0.281 0.281 0.835
MOSTOSTAL WARSZAWA 2.411 2.180 2.077 0.705 0.768 0.425
ZAKŁADY MIĘSNE HENRYK KANIA S. A. 1.017 4.747 1.354 1.599 1.657 3.208
MAGNA POLONIA S.A. 1.630 1.273 1.968 0.930 3.625 0.445
RESBUD S.A. 0.493 1.147 0.780 0.637 2.204 1.925
PFLEIDERER GRAJEWO S.A. 0.536 1.560 1.034 0.492 1.119 2.168
SFINKS POLSKA S.A. -10.438 -1.327 -1.480 -0.634 -0.390 -0.857
PETROLINVEST S.A. 0.618 1.630 0.550 0.375 0.442 0.097
PEMUG S.A. 3.005 2.610 1.816 1.138 1.098 0.706
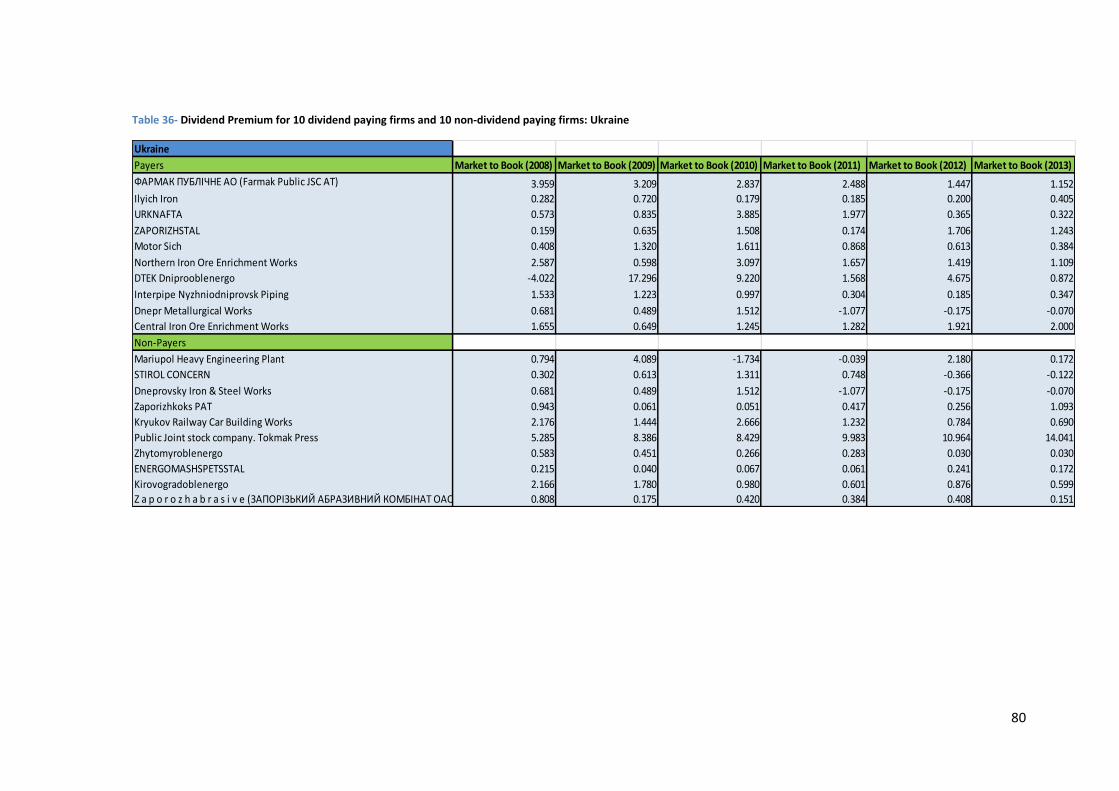
80
Table 36- Dividend Premium for 10 dividend paying firms and 10 non-dividend paying firms: Ukraine
Ukraine
Payers Market to Book (2008) Market to Book (2009) Market to Book (2010) Market to Book (2011) Market to Book (2012) Market to Book (2013)
ФАРМАК ПУБЛІЧНЕ АО (Farmak Public JSC AT) 3.959 3.209 2.837 2.488 1.447 1.152
Ilyich Iron 0.282 0.720 0.179 0.185 0.200 0.405
URKNAFTA 0.573 0.835 3.885 1.977 0.365 0.322
ZAPORIZHSTAL 0.159 0.635 1.508 0.174 1.706 1.243
Motor Sich 0.408 1.320 1.611 0.868 0.613 0.384
Northern Iron Ore Enrichment Works 2.587 0.598 3.097 1.657 1.419 1.109
DTEK Dniprooblenergo -4.022 17.296 9.220 1.568 4.675 0.872
Interpipe Nyzhniodniprovsk Piping 1.533 1.223 0.997 0.304 0.185 0.347
Dnepr Metallurgical Works 0.681 0.489 1.512 -1.077 -0.175 -0.070
Central Iron Ore Enrichment Works 1.655 0.649 1.245 1.282 1.921 2.000
Non-Payers
Mariupol Heavy Engineering Plant 0.794 4.089 -1.734 -0.039 2.180 0.172
STIROL CONCERN 0.302 0.613 1.311 0.748 -0.366 -0.122
Dneprovsky Iron & Steel Works 0.681 0.489 1.512 -1.077 -0.175 -0.070
Zaporizhkoks PAT 0.943 0.061 0.051 0.417 0.256 1.093
Kryukov Railway Car Building Works 2.176 1.444 2.666 1.232 0.784 0.690
Public Joint stock company. Tokmak Press 5.285 8.386 8.429 9.983 10.964 14.041
Zhytomyroblenergo 0.583 0.451 0.266 0.283 0.030 0.030
ENERGOMASHSPETSSTAL 0.215 0.040 0.067 0.061 0.241 0.172
Kirovogradoblenergo 2.166 1.780 0.980 0.601 0.876 0.599
Z a p o r o z h a b r a s i v e (ЗАПОРІЗЬКИЙ АБРАЗИВНИЙ КОМБІНАТ ОАО) 0.808 0.175 0.420 0.384 0.408 0.151
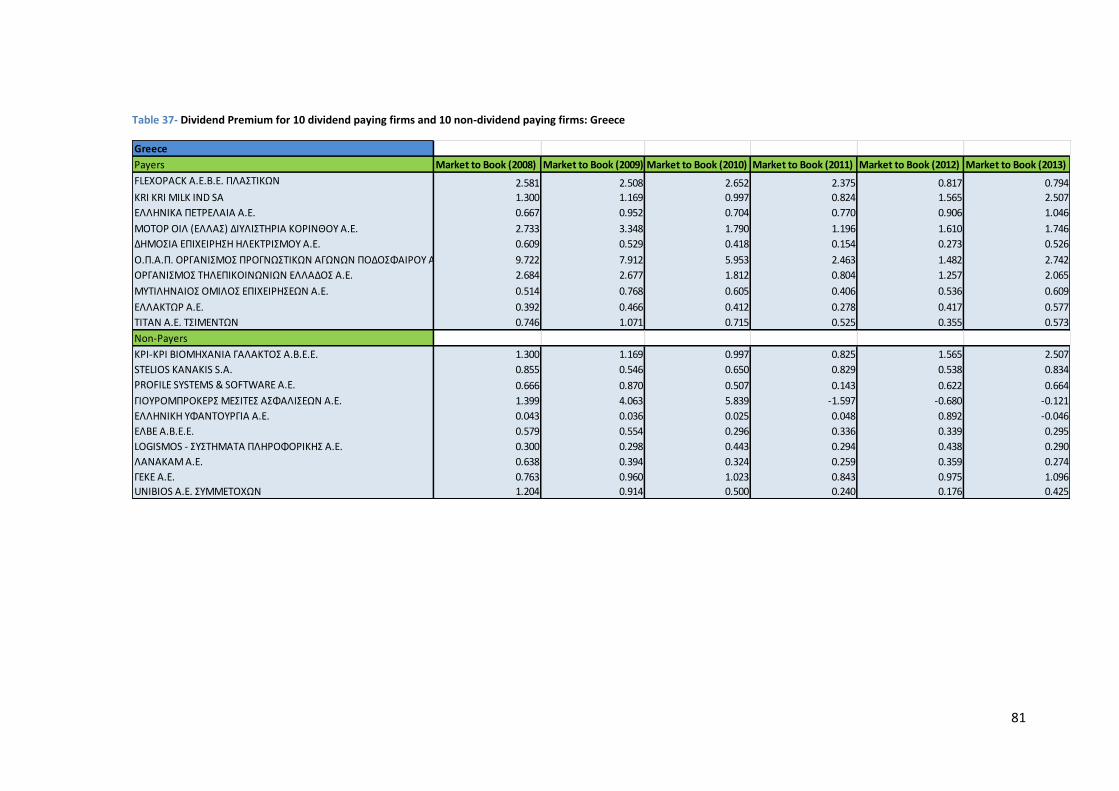
81
Table 37- Dividend Premium for 10 dividend paying firms and 10 non-dividend paying firms: Greece
Greece
Payers Market to Book (2008) Market to Book (2009) Market to Book (2010) Market to Book (2011) Market to Book (2012) Market to Book (2013)
FLEXOPACK A.E.Β.Ε. ΠΛΑΣΤΙΚΩΝ 2.581 2.508 2.652 2.375 0.817 0.794
KRI KRI MILK IND SA 1.300 1.169 0.997 0.824 1.565 2.507
ΕΛΛΗΝΙΚΑ ΠΕΤΡΕΛΑΙΑ Α.Ε. 0.667 0.952 0.704 0.770 0.906 1.046
ΜΟΤΟΡ ΟΙΛ (ΕΛΛΑΣ) ΔΙΥΛΙΣΤΗΡΙΑ ΚΟΡΙΝΘΟΥ Α.Ε. 2.733 3.348 1.790 1.196 1.610 1.746
ΔΗΜΟΣΙΑ ΕΠΙΧΕΙΡΗΣΗ ΗΛΕΚΤΡΙΣΜΟΥ Α.Ε. 0.609 0.529 0.418 0.154 0.273 0.526
Ο.Π.Α.Π. ΟΡΓΑΝΙΣΜΟΣ ΠΡΟΓΝΩΣΤΙΚΩΝ ΑΓΩΝΩΝ ΠΟΔΟΣΦΑΙΡΟΥ Α.Ε. 9.722 7.912 5.953 2.463 1.482 2.742
ΟΡΓΑΝΙΣΜΟΣ ΤΗΛΕΠΙΚΟΙΝΩΝΙΩΝ ΕΛΛΑΔΟΣ Α.Ε. 2.684 2.677 1.812 0.804 1.257 2.065
ΜΥΤΙΛΗΝΑΙΟΣ ΟΜΙΛΟΣ ΕΠΙΧΕΙΡΗΣΕΩΝ Α.Ε. 0.514 0.768 0.605 0.406 0.536 0.609
ΕΛΛΑΚΤΩΡ Α.Ε. 0.392 0.466 0.412 0.278 0.417 0.577
ΤΙΤΑΝ Α.Ε. ΤΣΙΜΕΝΤΩΝ 0.746 1.071 0.715 0.525 0.355 0.573
Non-Payers
ΚΡΙ-ΚΡΙ ΒΙΟΜΗΧΑΝΙΑ ΓΑΛΑΚΤΟΣ Α.Β.Ε.Ε. 1.300 1.169 0.997 0.825 1.565 2.507
STELIOS KANAKIS S.A. 0.855 0.546 0.650 0.829 0.538 0.834
PROFILE SYSTEMS & SOFTWARE Α.Ε. 0.666 0.870 0.507 0.143 0.622 0.664
ΓΙΟΥΡΟΜΠΡΟΚΕΡΣ ΜΕΣΙΤΕΣ ΑΣΦΑΛΙΣΕΩΝ Α.Ε. 1.399 4.063 5.839 -1.597 -0.680 -0.121
ΕΛΛΗΝΙΚΗ ΥΦΑΝΤΟΥΡΓΙΑ Α.Ε. 0.043 0.036 0.025 0.048 0.892 -0.046
ΕΛΒΕ Α.Β.Ε.Ε. 0.579 0.554 0.296 0.336 0.339 0.295
LOGISMOS - ΣΥΣΤΗΜΑΤΑ ΠΛΗΡΟΦΟΡΙΚΗΣ Α.Ε. 0.300 0.298 0.443 0.294 0.438 0.290
ΛΑΝΑΚΑΜ Α.Ε. 0.638 0.394 0.324 0.259 0.359 0.274
ΓΕΚΕ Α.Ε. 0.763 0.960 1.023 0.843 0.975 1.096
UNIBIOS Α.Ε. ΣΥΜΜΕΤΟΧΩΝ 1.204 0.914 0.500 0.240 0.176 0.425
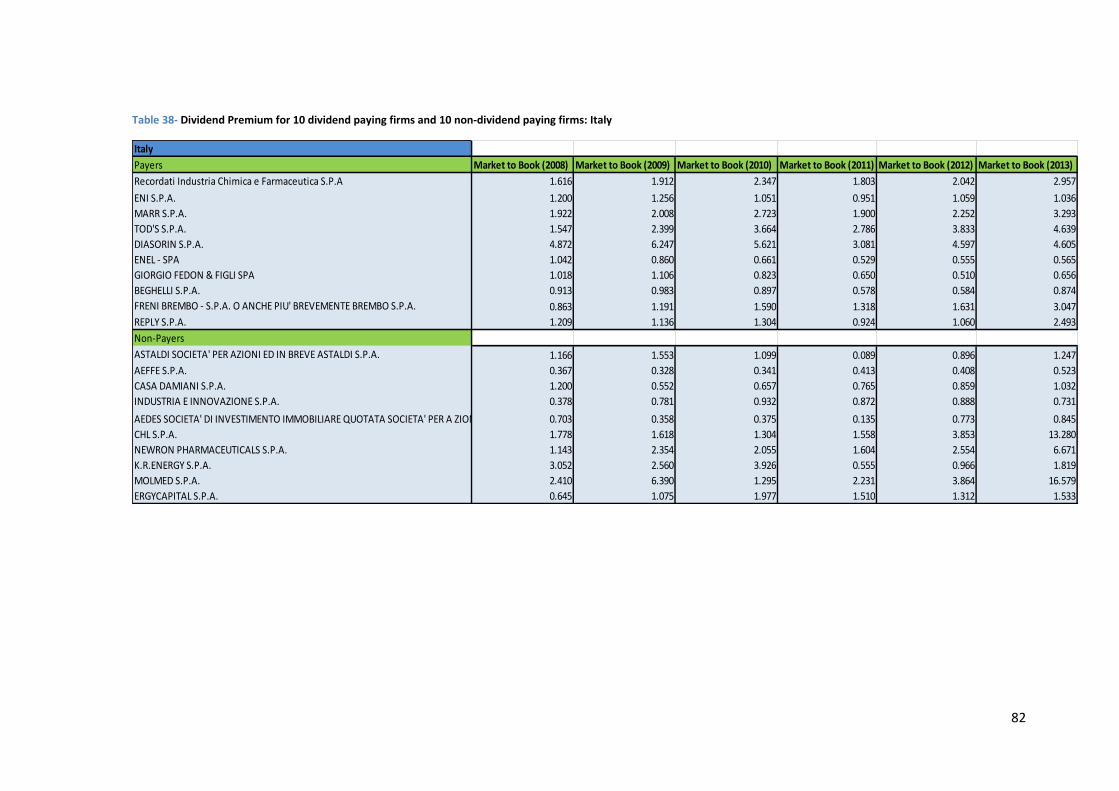
82
Table 38- Dividend Premium for 10 dividend paying firms and 10 non-dividend paying firms: Italy
Italy
Payers Market to Book (2008) Market to Book (2009) Market to Book (2010) Market to Book (2011) Market to Book (2012) Market to Book (2013)
Recordati Industria Chimica e Farmaceutica S.P.A 1.616 1.912 2.347 1.803 2.042 2.957
ENI S.P.A. 1.200 1.256 1.051 0.951 1.059 1.036
MARR S.P.A. 1.922 2.008 2.723 1.900 2.252 3.293
TOD'S S.P.A. 1.547 2.399 3.664 2.786 3.833 4.639
DIASORIN S.P.A. 4.872 6.247 5.621 3.081 4.597 4.605
ENEL - SPA 1.042 0.860 0.661 0.529 0.555 0.565
GIORGIO FEDON & FIGLI SPA 1.018 1.106 0.823 0.650 0.510 0.656
BEGHELLI S.P.A. 0.913 0.983 0.897 0.578 0.584 0.874
FRENI BREMBO - S.P.A. O ANCHE PIU' BREVEMENTE BREMBO S.P.A. 0.863 1.191 1.590 1.318 1.631 3.047
REPLY S.P.A. 1.209 1.136 1.304 0.924 1.060 2.493
Non-Payers
ASTALDI SOCIETA' PER AZIONI ED IN BREVE ASTALDI S.P.A. 1.166 1.553 1.099 0.089 0.896 1.247
AEFFE S.P.A. 0.367 0.328 0.341 0.413 0.408 0.523
CASA DAMIANI S.P.A. 1.200 0.552 0.657 0.765 0.859 1.032
INDUSTRIA E INNOVAZIONE S.P.A. 0.378 0.781 0.932 0.872 0.888 0.731
AEDES SOCIETA' DI INVESTIMENTO IMMOBILIARE QUOTATA SOCIETA' PER A ZIONI 0.703 0.358 0.375 0.135 0.773 0.845
CHL S.P.A. 1.778 1.618 1.304 1.558 3.853 13.280
NEWRON PHARMACEUTICALS S.P.A. 1.143 2.354 2.055 1.604 2.554 6.671
K.R.ENERGY S.P.A. 3.052 2.560 3.926 0.555 0.966 1.819
MOLMED S.P.A. 2.410 6.390 1.295 2.231 3.864 16.579
ERGYCAPITAL S.P.A. 0.645 1.075 1.977 1.510 1.312 1.533
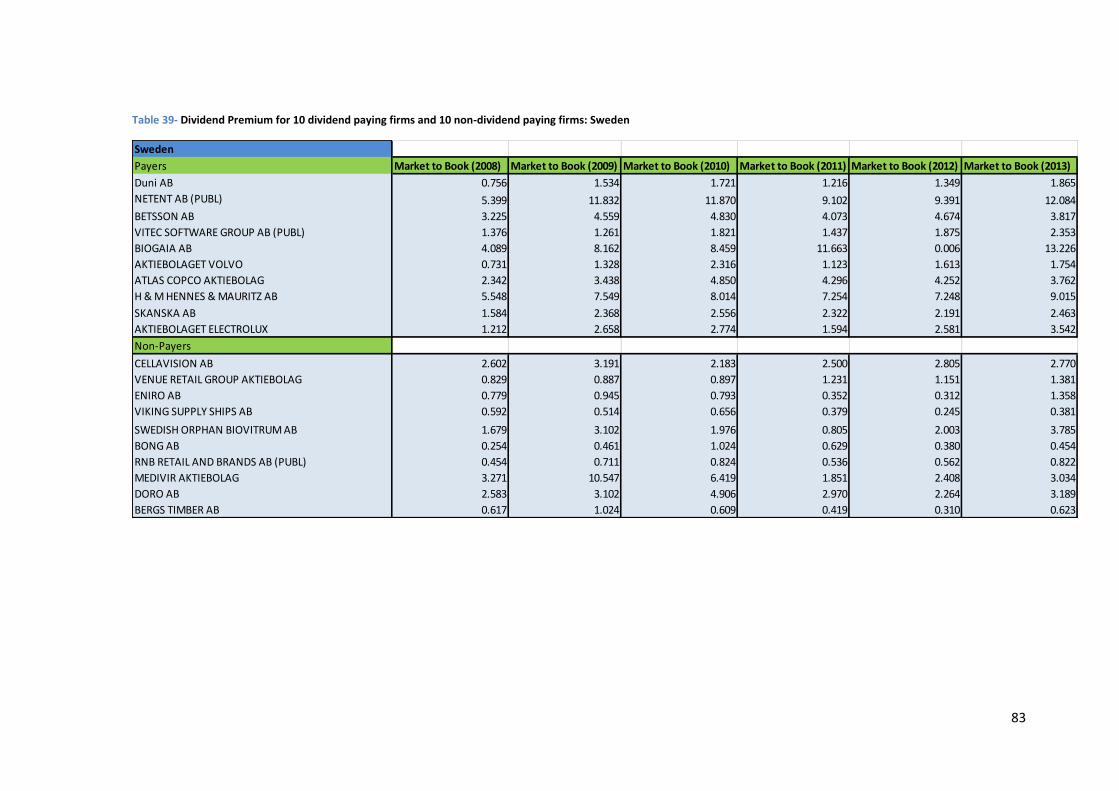
83
Table 39- Dividend Premium for 10 dividend paying firms and 10 non-dividend paying firms: Sweden
Sweden
Payers Market to Book (2008) Market to Book (2009) Market to Book (2010) Market to Book (2011) Market to Book (2012) Market to Book (2013)
Duni AB 0.756 1.534 1.721 1.216 1.349 1.865
NETENT AB (PUBL) 5.399 11.832 11.870 9.102 9.391 12.084
BETSSON AB 3.225 4.559 4.830 4.073 4.674 3.817
VITEC SOFTWARE GROUP AB (PUBL) 1.376 1.261 1.821 1.437 1.875 2.353
BIOGAIA AB 4.089 8.162 8.459 11.663 0.006 13.226
AKTIEBOLAGET VOLVO 0.731 1.328 2.316 1.123 1.613 1.754
ATLAS COPCO AKTIEBOLAG 2.342 3.438 4.850 4.296 4.252 3.762
H & M HENNES & MAURITZ AB 5.548 7.549 8.014 7.254 7.248 9.015
SKANSKA AB 1.584 2.368 2.556 2.322 2.191 2.463
AKTIEBOLAGET ELECTROLUX 1.212 2.658 2.774 1.594 2.581 3.542
Non-Payers
CELLAVISION AB 2.602 3.191 2.183 2.500 2.805 2.770
VENUE RETAIL GROUP AKTIEBOLAG 0.829 0.887 0.897 1.231 1.151 1.381
ENIRO AB 0.779 0.945 0.793 0.352 0.312 1.358
VIKING SUPPLY SHIPS AB 0.592 0.514 0.656 0.379 0.245 0.381
SWEDISH ORPHAN BIOVITRUM AB 1.679 3.102 1.976 0.805 2.003 3.785
BONG AB 0.254 0.461 1.024 0.629 0.380 0.454
RNB RETAIL AND BRANDS AB (PUBL) 0.454 0.711 0.824 0.536 0.562 0.822
MEDIVIR AKTIEBOLAG 3.271 10.547 6.419 1.851 2.408 3.034
DORO AB 2.583 3.102 4.906 2.970 2.264 3.189
BERGS TIMBER AB 0.617 1.024 0.609 0.419 0.310 0.623
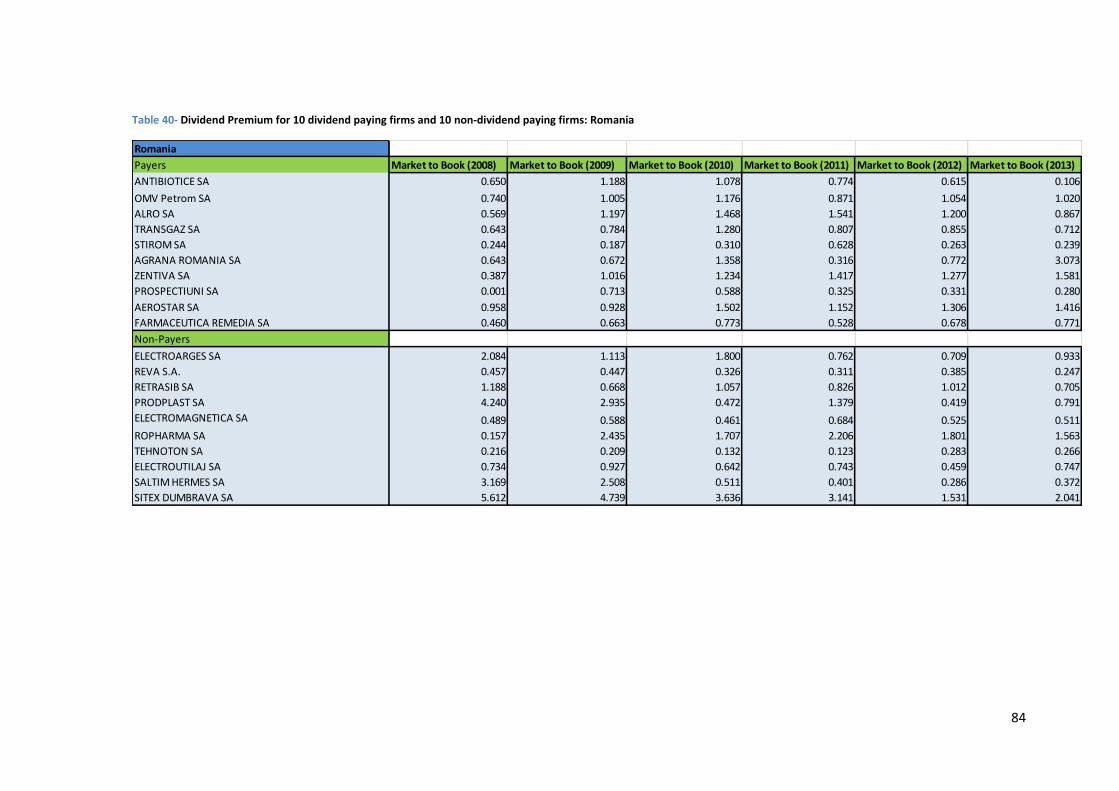
84
Table 40- Dividend Premium for 10 dividend paying firms and 10 non-dividend paying firms: Romania
Romania
Payers Market to Book (2008) Market to Book (2009) Market to Book (2010) Market to Book (2011) Market to Book (2012) Market to Book (2013)
ANTIBIOTICE SA 0.650 1.188 1.078 0.774 0.615 0.106
OMV Petrom SA 0.740 1.005 1.176 0.871 1.054 1.020
ALRO SA 0.569 1.197 1.468 1.541 1.200 0.867
TRANSGAZ SA 0.643 0.784 1.280 0.807 0.855 0.712
STIROM SA 0.244 0.187 0.310 0.628 0.263 0.239
AGRANA ROMANIA SA 0.643 0.672 1.358 0.316 0.772 3.073
ZENTIVA SA 0.387 1.016 1.234 1.417 1.277 1.581
PROSPECTIUNI SA 0.001 0.713 0.588 0.325 0.331 0.280
AEROSTAR SA 0.958 0.928 1.502 1.152 1.306 1.416
FARMACEUTICA REMEDIA SA 0.460 0.663 0.773 0.528 0.678 0.771
Non-Payers
ELECTROARGES SA 2.084 1.113 1.800 0.762 0.709 0.933
REVA S.A. 0.457 0.447 0.326 0.311 0.385 0.247
RETRASIB SA 1.188 0.668 1.057 0.826 1.012 0.705
PRODPLAST SA 4.240 2.935 0.472 1.379 0.419 0.791
ELECTROMAGNETICA SA 0.489 0.588 0.461 0.684 0.525 0.511
ROPHARMA SA 0.157 2.435 1.707 2.206 1.801 1.563
TEHNOTON SA 0.216 0.209 0.132 0.123 0.283 0.266
ELECTROUTILAJ SA 0.734 0.927 0.642 0.743 0.459 0.747
SALTIM HERMES SA 3.169 2.508 0.511 0.401 0.286 0.372
SITEX DUMBRAVA SA 5.612 4.739 3.636 3.141 1.531 2.041
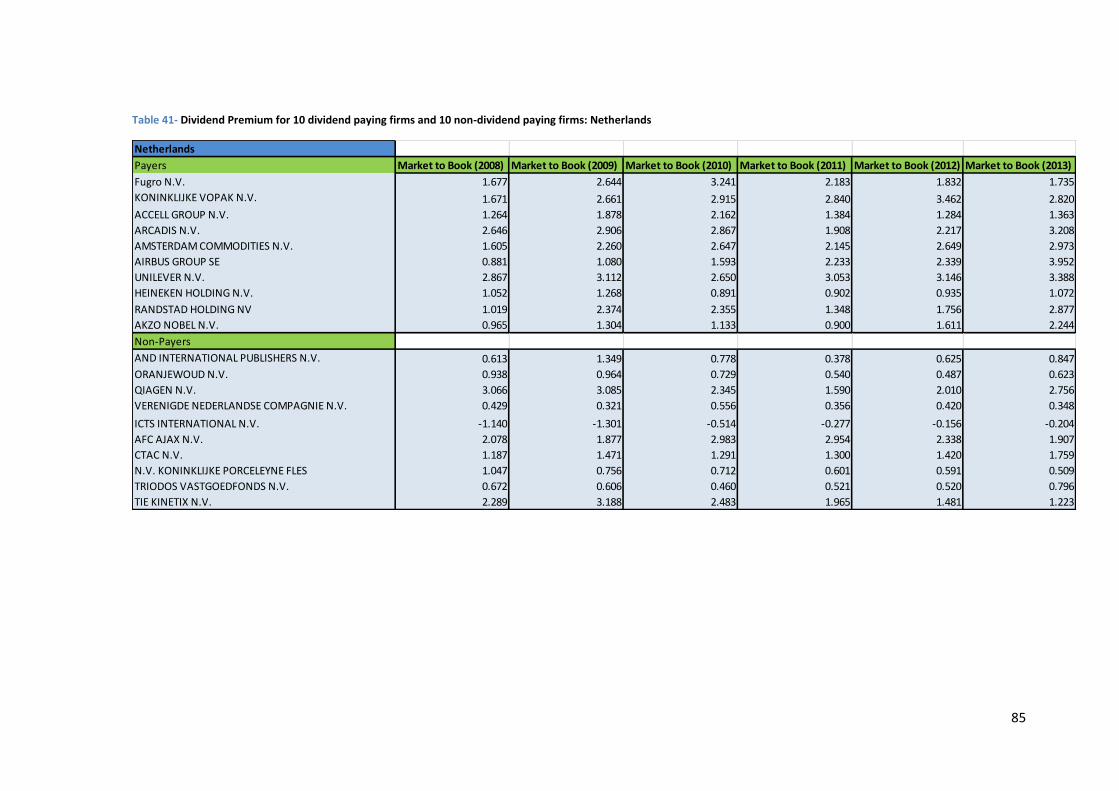
85
Table 41- Dividend Premium for 10 dividend paying firms and 10 non-dividend paying firms: Netherlands
Netherlands
Payers Market to Book (2008) Market to Book (2009) Market to Book (2010) Market to Book (2011) Market to Book (2012) Market to Book (2013)
Fugro N.V. 1.677 2.644 3.241 2.183 1.832 1.735
KONINKLIJKE VOPAK N.V. 1.671 2.661 2.915 2.840 3.462 2.820
ACCELL GROUP N.V. 1.264 1.878 2.162 1.384 1.284 1.363
ARCADIS N.V. 2.646 2.906 2.867 1.908 2.217 3.208
AMSTERDAM COMMODITIES N.V. 1.605 2.260 2.647 2.145 2.649 2.973
AIRBUS GROUP SE 0.881 1.080 1.593 2.233 2.339 3.952
UNILEVER N.V. 2.867 3.112 2.650 3.053 3.146 3.388
HEINEKEN HOLDING N.V. 1.052 1.268 0.891 0.902 0.935 1.072
RANDSTAD HOLDING NV 1.019 2.374 2.355 1.348 1.756 2.877
AKZO NOBEL N.V. 0.965 1.304 1.133 0.900 1.611 2.244
Non-Payers
AND INTERNATIONAL PUBLISHERS N.V. 0.613 1.349 0.778 0.378 0.625 0.847
ORANJEWOUD N.V. 0.938 0.964 0.729 0.540 0.487 0.623
QIAGEN N.V. 3.066 3.085 2.345 1.590 2.010 2.756
VERENIGDE NEDERLANDSE COMPAGNIE N.V. 0.429 0.321 0.556 0.356 0.420 0.348
ICTS INTERNATIONAL N.V. -1.140 -1.301 -0.514 -0.277 -0.156 -0.204
AFC AJAX N.V. 2.078 1.877 2.983 2.954 2.338 1.907
CTAC N.V. 1.187 1.471 1.291 1.300 1.420 1.759
N.V. KONINKLIJKE PORCELEYNE FLES 1.047 0.756 0.712 0.601 0.591 0.509
TRIODOS VASTGOEDFONDS N.V. 0.672 0.606 0.460 0.521 0.520 0.796
TIE KINETIX N.V. 2.289 3.188 2.483 1.965 1.481 1.223
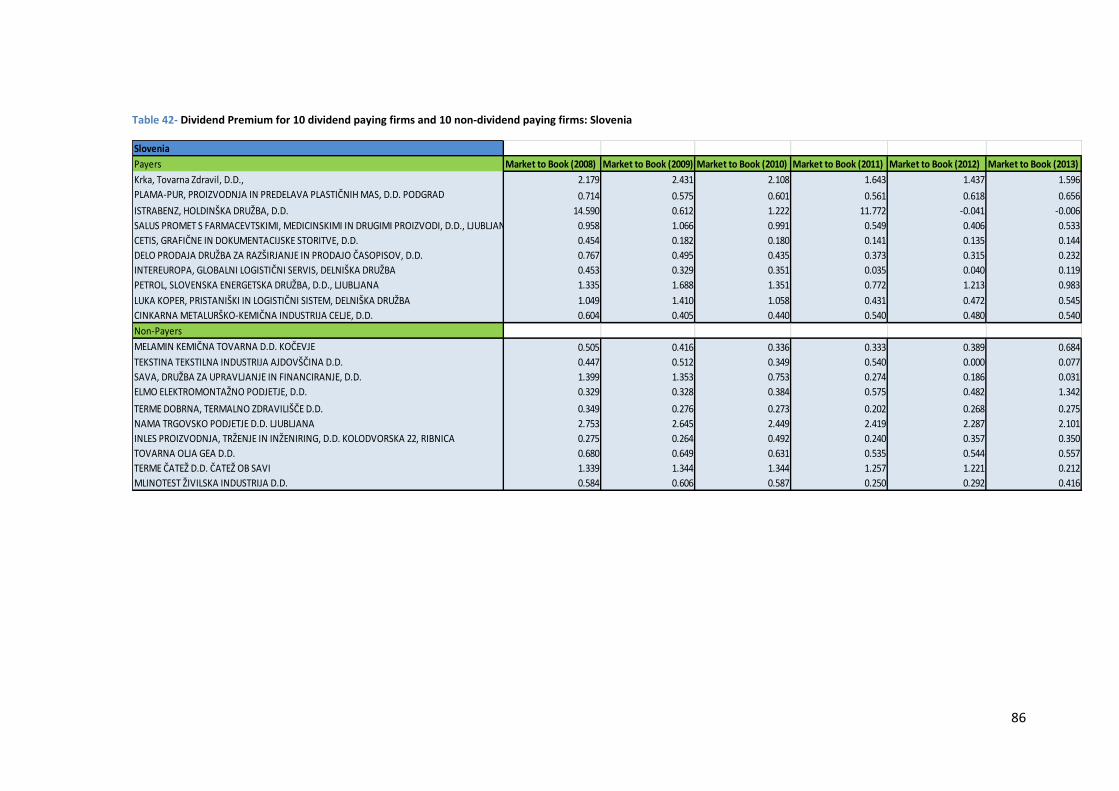
86
Table 42- Dividend Premium for 10 dividend paying firms and 10 non-dividend paying firms: Slovenia
Slovenia
Payers Market to Book (2008) Market to Book (2009) Market to Book (2010) Market to Book (2011) Market to Book (2012) Market to Book (2013)
Krka, Tovarna Zdravil, D.D., 2.179 2.431 2.108 1.643 1.437 1.596
PLAMA-PUR, PROIZVODNJA IN PREDELAVA PLASTIČNIH MAS, D.D. PODGRAD 0.714 0.575 0.601 0.561 0.618 0.656
ISTRABENZ, HOLDINŠKA DRUŽBA, D.D. 14.590 0.612 1.222 11.772 -0.041 -0.006
SALUS PROMET S FARMACEVTSKIMI, MEDICINSKIMI IN DRUGIMI PROIZVODI, D.D., LJUBLJANA 0.958 1.066 0.991 0.549 0.406 0.533
CETIS, GRAFIČNE IN DOKUMENTACIJSKE STORITVE, D.D. 0.454 0.182 0.180 0.141 0.135 0.144
DELO PRODAJA DRUŽBA ZA RAZŠIRJANJE IN PRODAJO ČASOPISOV, D.D. 0.767 0.495 0.435 0.373 0.315 0.232
INTEREUROPA, GLOBALNI LOGISTIČNI SERVIS, DELNIŠKA DRUŽBA 0.453 0.329 0.351 0.035 0.040 0.119
PETROL, SLOVENSKA ENERGETSKA DRUŽBA, D.D., LJUBLJANA 1.335 1.688 1.351 0.772 1.213 0.983
LUKA KOPER, PRISTANIŠKI IN LOGISTIČNI SISTEM, DELNIŠKA DRUŽBA 1.049 1.410 1.058 0.431 0.472 0.545
CINKARNA METALURŠKO-KEMIČNA INDUSTRIJA CELJE, D.D. 0.604 0.405 0.440 0.540 0.480 0.540
Non-Payers
MELAMIN KEMIČNA TOVARNA D.D. KOČEVJE 0.505 0.416 0.336 0.333 0.389 0.684
TEKSTINA TEKSTILNA INDUSTRIJA AJDOVŠČINA D.D. 0.447 0.512 0.349 0.540 0.000 0.077
SAVA, DRUŽBA ZA UPRAVLJANJE IN FINANCIRANJE, D.D. 1.399 1.353 0.753 0.274 0.186 0.031
ELMO ELEKTROMONTAŽNO PODJETJE, D.D. 0.329 0.328 0.384 0.575 0.482 1.342
TERME DOBRNA, TERMALNO ZDRAVILIŠČE D.D. 0.349 0.276 0.273 0.202 0.268 0.275
NAMA TRGOVSKO PODJETJE D.D. LJUBLJANA 2.753 2.645 2.449 2.419 2.287 2.101
INLES PROIZVODNJA, TRŽENJE IN INŽENIRING, D.D. KOLODVORSKA 22, RIBNICA 0.275 0.264 0.492 0.240 0.357 0.350
TOVARNA OLJA GEA D.D. 0.680 0.649 0.631 0.535 0.544 0.557
TERME ČATEŽ D.D. ČATEŽ OB SAVI 1.339 1.344 1.344 1.257 1.221 0.212
MLINOTEST ŽIVILSKA INDUSTRIJA D.D. 0.584 0.606 0.587 0.250 0.292 0.416
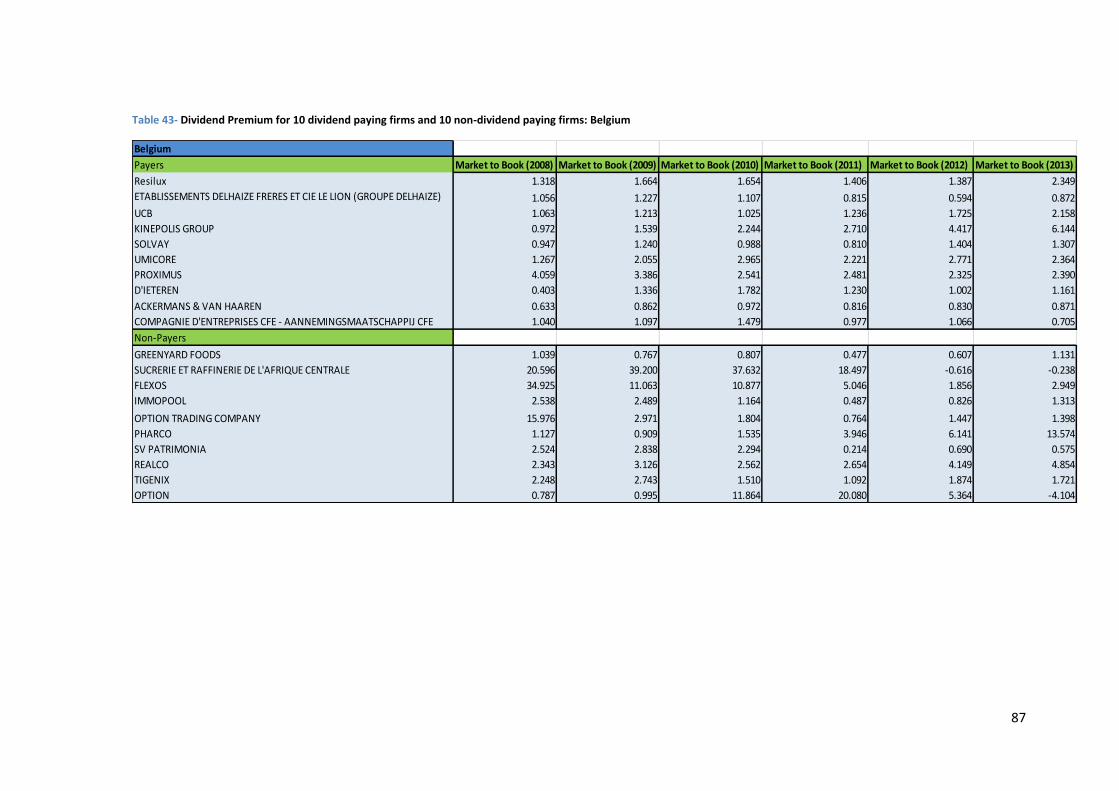
87
Table 43- Dividend Premium for 10 dividend paying firms and 10 non-dividend paying firms: Belgium
Belgium
Payers Market to Book (2008) Market to Book (2009) Market to Book (2010) Market to Book (2011) Market to Book (2012) Market to Book (2013)
Resilux 1.318 1.664 1.654 1.406 1.387 2.349
ETABLISSEMENTS DELHAIZE FRERES ET CIE LE LION (GROUPE DELHAIZE) 1.056 1.227 1.107 0.815 0.594 0.872
UCB 1.063 1.213 1.025 1.236 1.725 2.158
KINEPOLIS GROUP 0.972 1.539 2.244 2.710 4.417 6.144
SOLVAY 0.947 1.240 0.988 0.810 1.404 1.307
UMICORE 1.267 2.055 2.965 2.221 2.771 2.364
PROXIMUS 4.059 3.386 2.541 2.481 2.325 2.390
D'IETEREN 0.403 1.336 1.782 1.230 1.002 1.161
ACKERMANS & VAN HAAREN 0.633 0.862 0.972 0.816 0.830 0.871
COMPAGNIE D'ENTREPRISES CFE - AANNEMINGSMAATSCHAPPIJ CFE 1.040 1.097 1.479 0.977 1.066 0.705
Non-Payers
GREENYARD FOODS 1.039 0.767 0.807 0.477 0.607 1.131
SUCRERIE ET RAFFINERIE DE L'AFRIQUE CENTRALE 20.596 39.200 37.632 18.497 -0.616 -0.238
FLEXOS 34.925 11.063 10.877 5.046 1.856 2.949
IMMOPOOL 2.538 2.489 1.164 0.487 0.826 1.313
OPTION TRADING COMPANY 15.976 2.971 1.804 0.764 1.447 1.398
PHARCO 1.127 0.909 1.535 3.946 6.141 13.574
SV PATRIMONIA 2.524 2.838 2.294 0.214 0.690 0.575
REALCO 2.343 3.126 2.562 2.654 4.149 4.854
TIGENIX 2.248 2.743 1.510 1.092 1.874 1.721
OPTION 0.787 0.995 11.864 20.080 5.364 -4.104
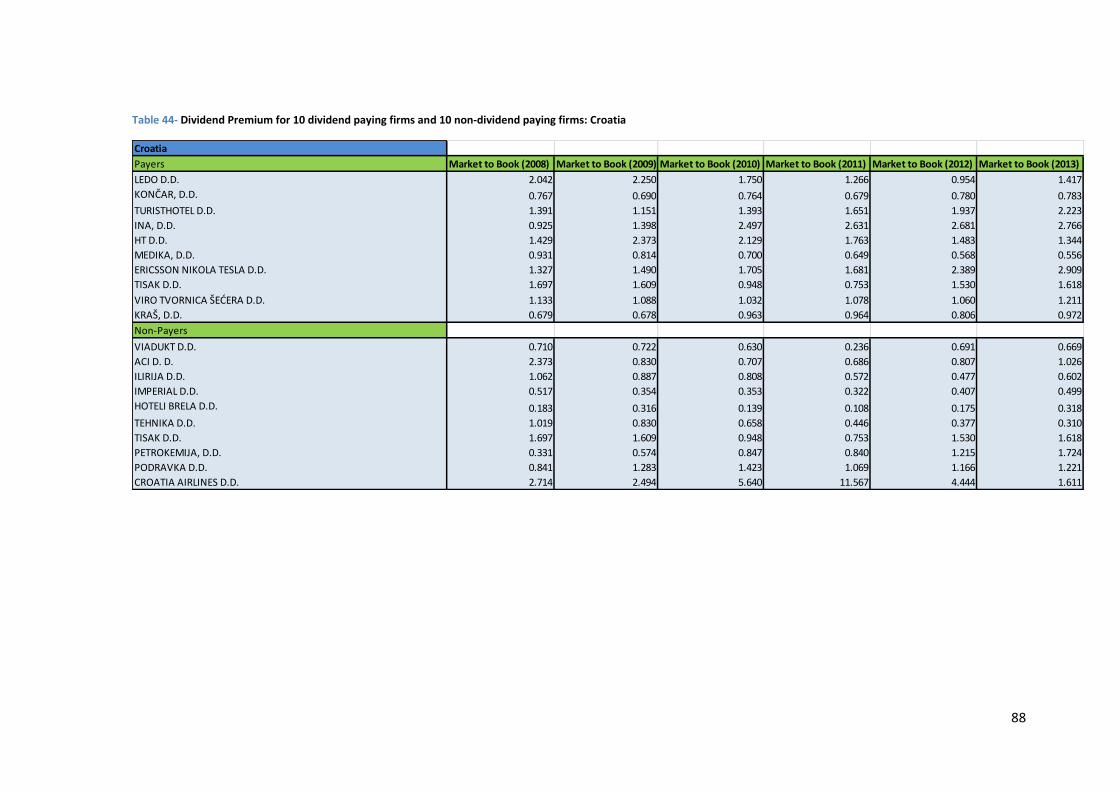
88
Table 44- Dividend Premium for 10 dividend paying firms and 10 non-dividend paying firms: Croatia
Croatia
Payers Market to Book (2008) Market to Book (2009) Market to Book (2010) Market to Book (2011) Market to Book (2012) Market to Book (2013)
LEDO D.D. 2.042 2.250 1.750 1.266 0.954 1.417
KONČAR, D.D. 0.767 0.690 0.764 0.679 0.780 0.783
TURISTHOTEL D.D. 1.391 1.151 1.393 1.651 1.937 2.223
INA, D.D. 0.925 1.398 2.497 2.631 2.681 2.766
HT D.D. 1.429 2.373 2.129 1.763 1.483 1.344
MEDIKA, D.D. 0.931 0.814 0.700 0.649 0.568 0.556
ERICSSON NIKOLA TESLA D.D. 1.327 1.490 1.705 1.681 2.389 2.909
TISAK D.D. 1.697 1.609 0.948 0.753 1.530 1.618
VIRO TVORNICA ŠEĆERA D.D. 1.133 1.088 1.032 1.078 1.060 1.211
KRAŠ, D.D. 0.679 0.678 0.963 0.964 0.806 0.972
Non-Payers
VIADUKT D.D. 0.710 0.722 0.630 0.236 0.691 0.669
ACI D. D. 2.373 0.830 0.707 0.686 0.807 1.026
ILIRIJA D.D. 1.062 0.887 0.808 0.572 0.477 0.602
IMPERIAL D.D. 0.517 0.354 0.353 0.322 0.407 0.499
HOTELI BRELA D.D. 0.183 0.316 0.139 0.108 0.175 0.318
TEHNIKA D.D. 1.019 0.830 0.658 0.446 0.377 0.310
TISAK D.D. 1.697 1.609 0.948 0.753 1.530 1.618
PETROKEMIJA, D.D. 0.331 0.574 0.847 0.840 1.215 1.724
PODRAVKA D.D. 0.841 1.283 1.423 1.069 1.166 1.221
CROATIA AIRLINES D.D. 2.714 2.494 5.640 11.567 4.444 1.611

89
Table 45- Dividend Premium for 10 dividend paying firms and 10 non-dividend paying firms: Switzerland
Switzerland
Payers Market to Book (2008) Market to Book (2009) Market to Book (2010) Market to Book (2011) Market to Book (2012) Market to Book (2013)
GROUPE MINOTERIES SA 1.419 1.425 1.297 1.907 1.809 1.296
NESTLÉ S.A. 2.881 3.414 3.051 3.058 3.075 3.293
NOVARTIS AG 2.579 2.515 2.225 2.376 2.454 2.911
ROCHE HOLDING AG 2.107 2.986 8.308 7.722 7.740 8.266
ABB LTD 2.862 3.112 3.330 2.662 2.718 3.183
ADECCO S.A. 1.624 2.334 2.603 1.605 2.036 3.064
LAFARGEHOLCIM LTD 0.878 1.010 1.101 0.836 1.105 1.172
KÜHNE + NAGEL INTERNATIONAL AG 3.884 5.263 6.603 5.263 5.452 5.509
SYNGENTA AG 3.073 3.727 3.719 3.652 4.261 3.915
SWISSCOM AG 3.127 3.044 3.411 4.291 4.916 4.076
Non-Payers
PERFECT HOLDING SA 6.649 5.436 4.615 2.386 2.573 2.764
DUFRY AG 0.552 1.349 4.193 2.444 2.600 3.830
GROUPE BAUMGARTNER HOLDING SA 0.847 0.842 1.018 0.935 0.825 0.811
ALTIN AG 0.761 0.894 0.740 0.756 0.720 0.898
ADDEX THERAPEUTICS LTD 1.861 1.043 0.985 1.271 6.017 12.594
NEW VALUE AG 0.883 0.734 0.785 0.659 0.927 0.818
SANTHERA PHARMACEUTICALS HOLDING AG 1.302 1.113 0.448 0.419 1.234 1.976
ENR RUSSIA INVEST SA 0.711 0.668 0.840 0.844 0.761 0.848
KUROS BIOSCIENCES AG 4.115 8.004 10.074 -0.856 6.292 22.049
AIROPACK TECHNOLOGY GROUP AG 0.970 0.944 14.811 122.448 103.134 10.412
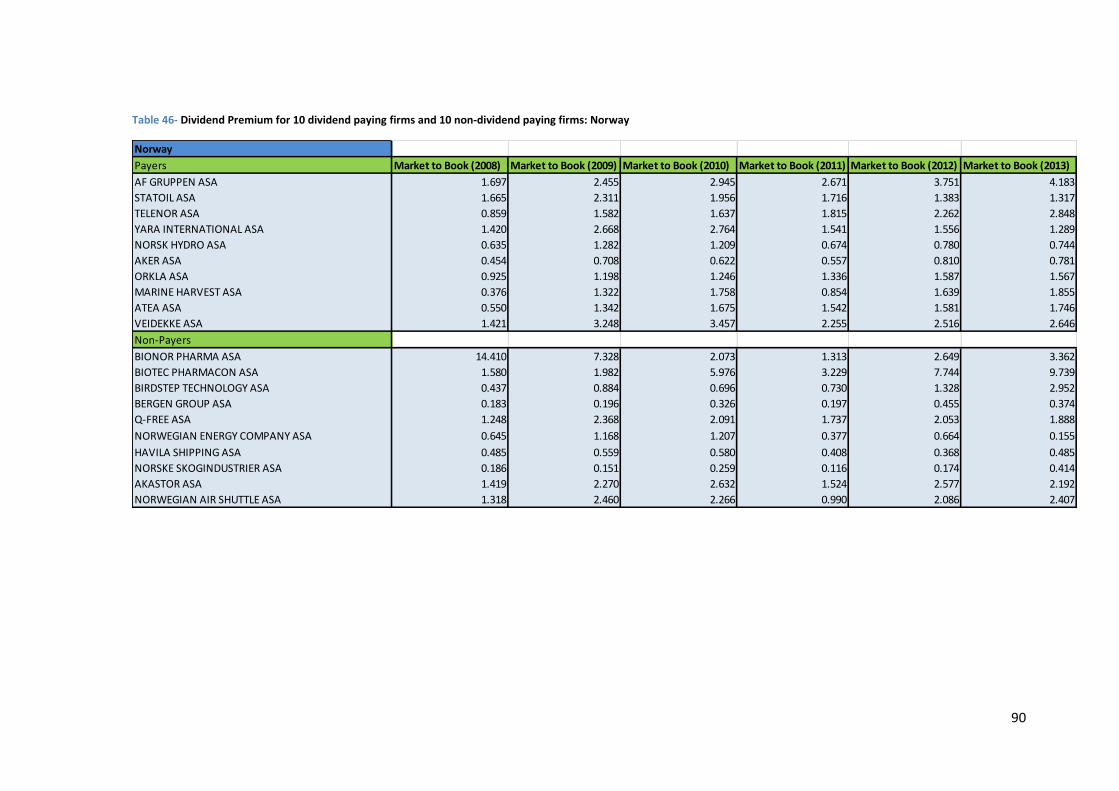
90
Table 46- Dividend Premium for 10 dividend paying firms and 10 non-dividend paying firms: Norway
Norway
Payers Market to Book (2008) Market to Book (2009) Market to Book (2010) Market to Book (2011) Market to Book (2012) Market to Book (2013)
AF GRUPPEN ASA 1.697 2.455 2.945 2.671 3.751 4.183
STATOIL ASA 1.665 2.311 1.956 1.716 1.383 1.317
TELENOR ASA 0.859 1.582 1.637 1.815 2.262 2.848
YARA INTERNATIONAL ASA 1.420 2.668 2.764 1.541 1.556 1.289
NORSK HYDRO ASA 0.635 1.282 1.209 0.674 0.780 0.744
AKER ASA 0.454 0.708 0.622 0.557 0.810 0.781
ORKLA ASA 0.925 1.198 1.246 1.336 1.587 1.567
MARINE HARVEST ASA 0.376 1.322 1.758 0.854 1.639 1.855
ATEA ASA 0.550 1.342 1.675 1.542 1.581 1.746
VEIDEKKE ASA 1.421 3.248 3.457 2.255 2.516 2.646
Non-Payers
BIONOR PHARMA ASA 14.410 7.328 2.073 1.313 2.649 3.362
BIOTEC PHARMACON ASA 1.580 1.982 5.976 3.229 7.744 9.739
BIRDSTEP TECHNOLOGY ASA 0.437 0.884 0.696 0.730 1.328 2.952
BERGEN GROUP ASA 0.183 0.196 0.326 0.197 0.455 0.374
Q-FREE ASA 1.248 2.368 2.091 1.737 2.053 1.888
NORWEGIAN ENERGY COMPANY ASA 0.645 1.168 1.207 0.377 0.664 0.155
HAVILA SHIPPING ASA 0.485 0.559 0.580 0.408 0.368 0.485
NORSKE SKOGINDUSTRIER ASA 0.186 0.151 0.259 0.116 0.174 0.414
AKASTOR ASA 1.419 2.270 2.632 1.524 2.577 2.192
NORWEGIAN AIR SHUTTLE ASA 1.318 2.460 2.266 0.990 2.086 2.407
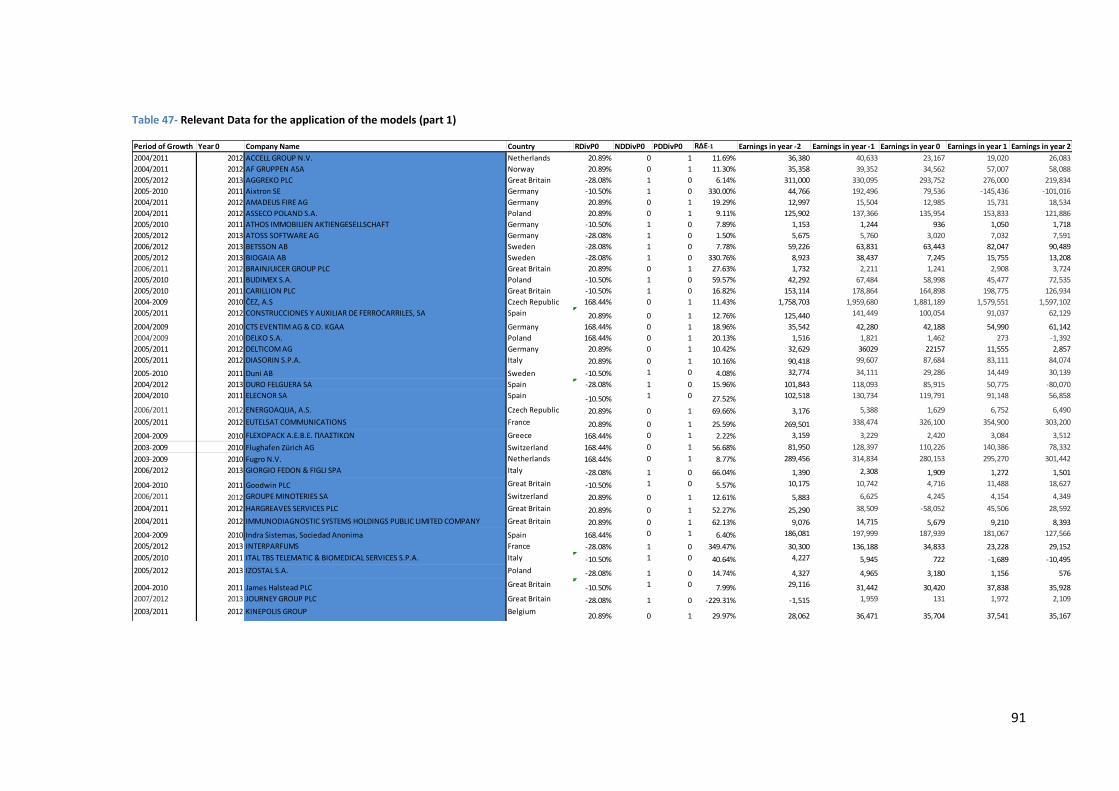
91
Table 47- Relevant Data for the application of the models (part 1)
Period of Growth Year 0 Company Name Country RDivP0 NDDivP0 PDDivP0 R∆E-1 Earnings in year -2 Earnings in year -1 Earnings in year 0 Earnings in year 1 Earnings in year 2
2004/2011 2012 ACCELL GROUP N.V. Netherlands 20.89% 0 1 11.69% 36,380 40,633 23,167 19,020 26,083
2004/2011 2012 AF GRUPPEN ASA Norway 20.89% 0 1 11.30% 35,358 39,352 34,562 57,007 58,088
2005/2012 2013 AGGREKO PLC Great Britain -28.08% 1 0 6.14% 311,000 330,095 293,752 276,000 219,834
2005-2010 2011 Aixtron SE Germany -10.50% 1 0 330.00% 44,766 192,496 79,536 -145,436 -101,016
2004/2011 2012 AMADEUS FIRE AG Germany 20.89% 0 1 19.29% 12,997 15,504 12,985 15,731 18,534
2004/2011 2012 ASSECO POLAND S.A. Poland 20.89% 0 1 9.11% 125,902 137,366 135,954 153,833 121,886
2005/2010 2011 ATHOS IMMOBILIEN AKTIENGESELLSCHAFT Germany -10.50% 1 0 7.89% 1,153 1,244 936 1,050 1,718
2005/2012 2013 ATOSS SOFTWARE AG Germany -28.08% 1 0 1.50% 5,675 5,760 3,020 7,032 7,591
2006/2012 2013 BETSSON AB Sweden -28.08% 1 0 7.78% 59,226 63,831 63,443 82,047 90,489
2005/2012 2013 BIOGAIA AB Sweden -28.08% 1 0 330.76% 8,923 38,437 7,245 15,755 13,208
2006/2011 2012 BRAINJUICER GROUP PLC Great Britain 20.89% 0 1 27.63% 1,732 2,211 1,241 2,908 3,724
2005/2010 2011 BUDIMEX S.A. Poland -10.50% 1 0 59.57% 42,292 67,484 58,998 45,477 72,535
2005/2010 2011 CARILLION PLC Great Britain -10.50% 1 0 16.82% 153,114 178,864 164,898 198,775 126,934
2004-2009 2010 ČEZ, A.S Czech Republic 168.44% 0 1 11.43% 1,758,703 1,959,680 1,881,189 1,579,551 1,597,102
2005/2011 2012 CONSTRUCCIONES Y AUXILIAR DE FERROCARRILES, SA Spain 20.89% 0 1 12.76% 125,440 141,449 100,054 91,037 62,129
2004/2009 2010 CTS EVENTIM AG & CO. KGAA Germany 168.44% 0 1 18.96% 35,542 42,280 42,188 54,990 61,142
2004/2009 2010 DELKO S.A. Poland 168.44% 0 1 20.13% 1,516 1,821 1,462 273 -1,392
2005/2011 2012 DELTICOM AG Germany 20.89% 0 1 10.42% 32,629 36029 22157 11,555 2,857
2005/2011 2012 DIASORIN S.P.A. Italy 20.89% 0 1 10.16% 90,418 99,607 87,684 83,111 84,074
2005-2010 2011 Duni AB Sweden -10.50% 1 0 4.08% 32,774 34,111 29,286 14,449 30,139
2004/2012 2013 DURO FELGUERA SA Spain -28.08% 1 0 15.96% 101,843 118,093 85,915 50,775 -80,070
2004/2010 2011 ELECNOR SA Spain -10.50% 1 0 27.52% 102,518 130,734 119,791 91,148 56,858
2006/2011 2012 ENERGOAQUA, A.S. Czech Republic 20.89% 0 1 69.66% 3,176 5,388 1,629 6,752 6,490
2005/2011 2012 EUTELSAT COMMUNICATIONS France 20.89% 0 1 25.59% 269,501 338,474 326,100 354,900 303,200
2004-2009 2010 FLEXOPACK A.E.Β.Ε. ΠΛΑΣΤΙΚΩΝ Greece 168.44% 0 1 2.22% 3,159 3,229 2,420 3,084 3,512
2003-2009 2010 Flughafen Zürich AG Switzerland 168.44% 0 1 56.68% 81,950 128,397 110,226 140,386 78,332
2003-2009 2010 Fugro N.V. Netherlands 168.44% 0 1 8.77% 289,456 314,834 280,153 295,270 301,442
2006/2012 2013 GIORGIO FEDON & FIGLI SPA Italy -28.08% 1 0 66.04% 1,390 2,308 1,909 1,272 1,501
2004-2010 2011 Goodwin PLC Great Britain -10.50% 1 0 5.57% 10,175 10,742 4,716 11,488 18,627
2006/2011 2012 GROUPE MINOTERIES SA Switzerland 20.89% 0 1 12.61% 5,883 6,625 4,245 4,154 4,349
2004/2011 2012 HARGREAVES SERVICES PLC Great Britain 20.89% 0 1 52.27% 25,290 38,509 -58,052 45,506 28,592
2004/2011 2012 IMMUNODIAGNOSTIC SYSTEMS HOLDINGS PUBLIC LIMITED COMPANY Great Britain 20.89% 0 1 62.13% 9,076 14,715 5,679 9,210 8,393
2004-2009 2010 Indra Sistemas, Sociedad Anonima Spain 168.44% 0 1 6.40% 186,081 197,999 187,939 181,067 127,566
2005/2012 2013 INTERPARFUMS France -28.08% 1 0 349.47% 30,300 136,188 34,833 23,228 29,152
2005/2010 2011 ITAL TBS TELEMATIC & BIOMEDICAL SERVICES S.P.A. Italy -10.50% 1 0 40.64% 4,227 5,945 722 -1,689 -10,495
2005/2012 2013 IZOSTAL S.A. Poland -28.08% 1 0 14.74% 4,327 4,965 3,180 1,156 576
2004-2010 2011 James Halstead PLC Great Britain -10.50% 1 0 7.99% 29,116 31,442 30,420 37,838 35,928
2007/2012 2013 JOURNEY GROUP PLC Great Britain -28.08% 1 0 -229.31% -1,515 1,959 131 1,972 2,109
2003/2011 2012 KINEPOLIS GROUP Belgium20.89% 0 1 29.97% 28,062 36,471 35,704 37,541 35,167
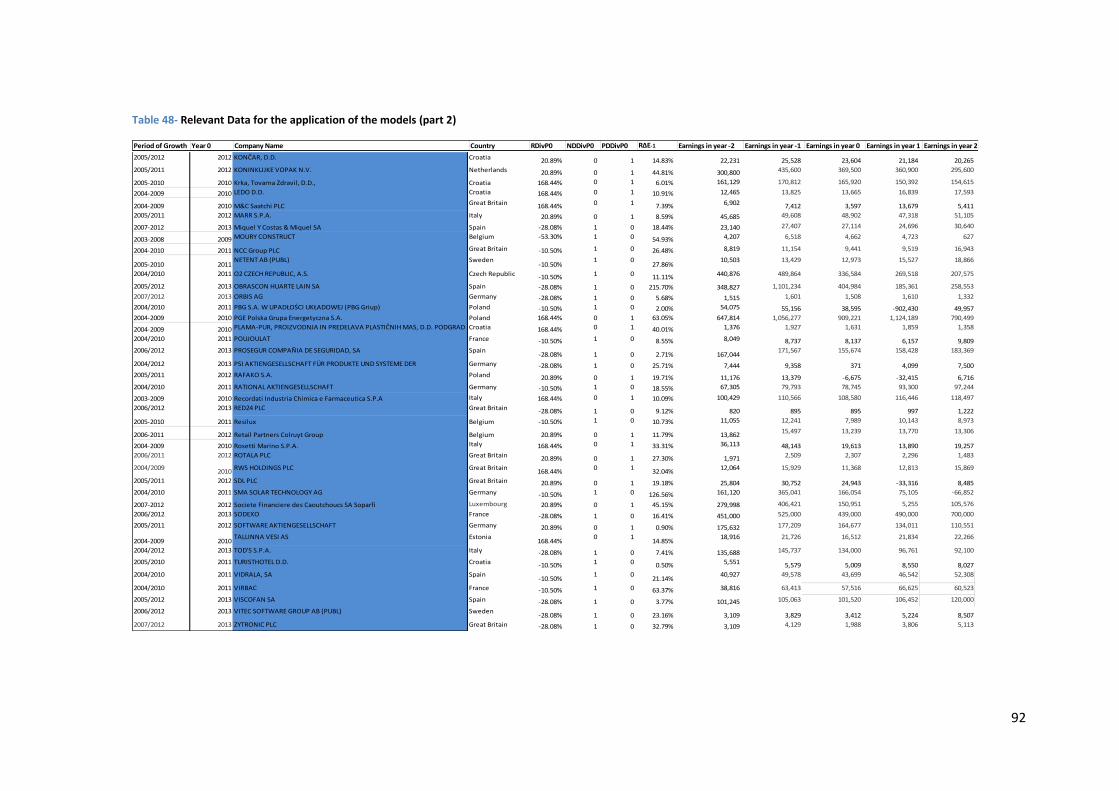
92
Table 48- Relevant Data for the application of the models (part 2)
Period of Growth Year 0 Company Name Country RDivP0 NDDivP0 PDDivP0 R∆E-1 Earnings in year -2 Earnings in year -1 Earnings in year 0 Earnings in year 1 Earnings in year 2
2005/2012 2012 KONČAR, D.D. Croatia 20.89% 0 1 14.83% 22,231 25,528 23,604 21,184 20,265
2005/2011 2012 KONINKLIJKE VOPAK N.V. Netherlands 20.89% 0 1 44.81% 300,800 435,600 369,500 360,900 295,600
2005-2010 2010 Krka, Tovarna Zdravil, D.D., Croatia 168.44% 0 1 6.01% 161,129 170,812 165,920 150,392 154,615
2004-2009 2010 LEDO D.D. Croatia 168.44% 0 1 10.91% 12,465 13,825 13,665 16,839 17,593
2004-2009 2010 M&C Saatchi PLC Great Britain 168.44% 0 1 7.39% 6,902 7,412 3,597 13,679 5,411
2005/2011 2012 MARR S.P.A. Italy 20.89% 0 1 8.59% 45,685 49,608 48,902 47,318 51,105
2007-2012 2013 Miquel Y Costas & Miquel SA Spain -28.08% 1 0 18.44% 23,140 27,407 27,114 24,696 30,640
2003-2008 2009 MOURY CONSTRUCT Belgium -53.30% 1 0 54.93% 4,207 6,518 4,662 4,723 627
2004-2010 2011 NCC Group PLC Great Britain -10.50% 1 0 26.48% 8,819 11,154 9,441 9,519 16,943
2005-2010 2011NETENT AB (PUBL) Sweden
-10.50%1 0
27.86%10,503 13,429 12,973 15,527 18,866
2004/2010 2011 O2 CZECH REPUBLIC, A.S. Czech Republic -10.50% 1 0 11.11% 440,876 489,864 336,584 269,518 207,575
2005/2012 2013 OBRASCON HUARTE LAIN SA Spain -28.08% 1 0 215.70% 348,827 1,101,234 404,984 185,361 258,553
2007/2012 2013 ORBIS AG Germany -28.08% 1 0 5.68% 1,515 1,601 1,508 1,610 1,332
2004/2010 2011 PBG S.A. W UPADŁOŚCI UKŁADOWEJ (PBG Griup) Poland -10.50% 1 0 2.00% 54,075 55,156 38,595 -902,430 49,957
2004-2009 2010 PGE Polska Grupa Energetyczna S.A. Poland 168.44% 0 1 63.05% 647,814 1,056,277 909,221 1,124,189 790,499
2004-2009 2010 PLAMA-PUR, PROIZVODNJA IN PREDELAVA PLASTIČNIH MAS, D.D. PODGRAD Croatia 168.44% 0 1 40.01% 1,376 1,927 1,631 1,859 1,358
2004/2010 2011 POUJOULAT France -10.50% 1 0 8.55% 8,049 8,737 8,137 6,157 9,809
2006/2012 2013 PROSEGUR COMPAÑIA DE SEGURIDAD, SA Spain-28.08% 1 0 2.71% 167,044
171,567 155,674 158,428 183,369
2004/2012 2013 PSI AKTIENGESELLSCHAFT FÜR PRODUKTE UND SYSTEME DER
INFORMATIONSTECHNOLOGIE
Germany -28.08% 1 0 25.71% 7,444 9,358 371 4,099 7,500
2005/2011 2012 RAFAKO S.A. Poland 20.89% 0 1 19.71% 11,176 13,379 -6,675 -32,415 6,716
2004/2010 2011 RATIONAL AKTIENGESELLSCHAFT Germany -10.50% 1 0 18.55% 67,305 79,793 78,745 93,300 97,244
2003-2009 2010 Recordati Industria Chimica e Farmaceutica S.P.A Italy 168.44% 0 1 10.09% 100,429 110,566 108,580 116,446 118,497
2006/2012 2013 RED24 PLC Great Britain -28.08% 1 0 9.12% 820 895 895 997 1,222
2005-2010 2011 Resilux Belgium -10.50% 1 0 10.73% 11,055 12,241 7,989 10,143 8,973
2006-2011 2012 Retail Partners Colruyt Group Belgium 20.89% 0 1 11.79% 13,86215,497 13,239 13,770 13,306
2004-2009 2010 Rosetti Marino S.P.A. Italy 168.44% 0 1 33.31% 36,113 48,143 19,613 13,890 19,257
2006/2011 2012 ROTALA PLC Great Britain 20.89% 0 1 27.30% 1,971 2,509 2,307 2,296 1,483
2004/20092010
RWS HOLDINGS PLC Great Britain168.44%
0 132.04%
12,064 15,929 11,368 12,813 15,869
2005/2011 2012 SDL PLC Great Britain 20.89% 0 1 19.18% 25,804 30,752 24,943 -33,316 8,485
2004/2010 2011 SMA SOLAR TECHNOLOGY AG Germany -10.50% 1 0 126.56% 161,120 365,041 166,054 75,105 -66,852
2007-2012 2012 Societe Financiere des Caoutchoucs SA Soparfi Luxembourg 20.89% 0 1 45.15% 279,998 406,421 150,951 5,255 105,576
2006/2012 2013 SODEXO France -28.08% 1 0 16.41% 451,000 525,000 439,000 490,000 700,000
2005/2011 2012 SOFTWARE AKTIENGESELLSCHAFT Germany 20.89% 0 1 0.90% 175,632 177,209 164,677 134,011 110,551
2004-2009 2010TALLINNA VESI AS Estonia
168.44%0 1
14.85%18,916 21,726 16,512 21,834 22,266
2004/2012 2013 TOD'S S.P.A. Italy -28.08% 1 0 7.41% 135,688 145,737 134,000 96,761 92,100
2005/2010 2011 TURISTHOTEL D.D. Croatia -10.50% 1 0 0.50% 5,551 5,579 5,009 8,550 8,027
2004/2010 2011 VIDRALA, SA Spain-10.50%
1 021.14%
40,927 49,578 43,699 46,542 52,308
2004/2010 2011 VIRBAC France -10.50% 1 0 63.37% 38,816 63,413 57,516 66,625 60,523
2005/2012 2013 VISCOFAN SA Spain -28.08% 1 0 3.77% 101,245 105,063 101,520 106,452 120,000
2006/2012 2013 VITEC SOFTWARE GROUP AB (PUBL) Sweden-28.08% 1 0 23.16% 3,109 3,829 3,412 5,224 8,507
2007/2012 2013 ZYTRONIC PLC Great Britain -28.08% 1 0 32.79% 3,109 4,129 1,988 3,806 5,113
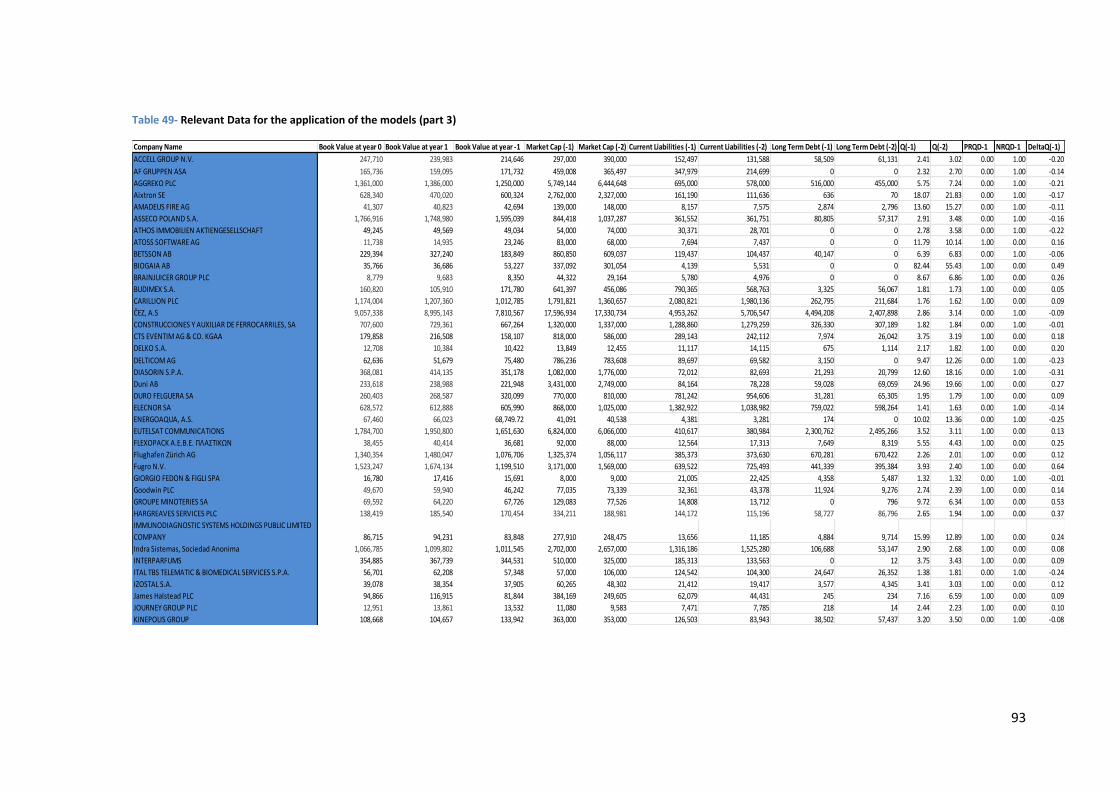
93
Table 49- Relevant Data for the application of the models (part 3)
Company Name Book Value at year 0 Book Value at year 1 Book Value at year -1 Market Cap (-1) Market Cap (-2) Current Liabilities (-1) Current Liabilities (-2) Long Term Debt (-1) Long Term Debt (-2) Q(-1) Q(-2) PRQD-1 NRQD-1 DeltaQ(-1)
ACCELL GROUP N.V. 247,710 239,983 214,646 297,000 390,000 152,497 131,588 58,509 61,131 2.41 3.02 0.00 1.00 -0.20
AF GRUPPEN ASA 165,736 159,095 171,732 459,008 365,497 347,979 214,699 0 0 2.32 2.70 0.00 1.00 -0.14
AGGREKO PLC 1,361,000 1,386,000 1,250,000 5,749,144 6,444,648 695,000 578,000 516,000 455,000 5.75 7.24 0.00 1.00 -0.21
Aixtron SE 628,340 470,020 600,324 2,762,000 2,327,000 161,190 111,636 636 70 18.07 21.83 0.00 1.00 -0.17
AMADEUS FIRE AG 41,307 40,823 42,694 139,000 148,000 8,157 7,575 2,874 2,796 13.60 15.27 0.00 1.00 -0.11
ASSECO POLAND S.A. 1,766,916 1,748,980 1,595,039 844,418 1,037,287 361,552 361,751 80,805 57,317 2.91 3.48 0.00 1.00 -0.16
ATHOS IMMOBILIEN AKTIENGESELLSCHAFT 49,245 49,569 49,034 54,000 74,000 30,371 28,701 0 0 2.78 3.58 0.00 1.00 -0.22
ATOSS SOFTWARE AG 11,738 14,935 23,246 83,000 68,000 7,694 7,437 0 0 11.79 10.14 1.00 0.00 0.16
BETSSON AB 229,394 327,240 183,849 860,850 609,037 119,437 104,437 40,147 0 6.39 6.83 0.00 1.00 -0.06
BIOGAIA AB 35,766 36,686 53,227 337,092 301,054 4,139 5,531 0 0 82.44 55.43 1.00 0.00 0.49
BRAINJUICER GROUP PLC 8,779 9,683 8,350 44,322 29,164 5,780 4,976 0 0 8.67 6.86 1.00 0.00 0.26
BUDIMEX S.A. 160,820 105,910 171,780 641,397 456,086 790,365 568,763 3,325 56,067 1.81 1.73 1.00 0.00 0.05
CARILLION PLC 1,174,004 1,207,360 1,012,785 1,791,821 1,360,657 2,080,821 1,980,136 262,795 211,684 1.76 1.62 1.00 0.00 0.09
ČEZ, A.S 9,057,338 8,995,143 7,810,567 17,596,934 17,330,734 4,953,262 5,706,547 4,494,208 2,407,898 2.86 3.14 0.00 1.00 -0.09
CONSTRUCCIONES Y AUXILIAR DE FERROCARRILES, SA 707,600 729,361 667,264 1,320,000 1,337,000 1,288,860 1,279,259 326,330 307,189 1.82 1.84 0.00 1.00 -0.01
CTS EVENTIM AG & CO. KGAA 179,858 216,508 158,107 818,000 586,000 289,143 242,112 7,974 26,042 3.75 3.19 1.00 0.00 0.18
DELKO S.A. 12,708 10,384 10,422 13,849 12,455 11,117 14,115 675 1,114 2.17 1.82 1.00 0.00 0.20
DELTICOM AG 62,636 51,679 75,480 786,236 783,608 89,697 69,582 3,150 0 9.47 12.26 0.00 1.00 -0.23
DIASORIN S.P.A. 368,081 414,135 351,178 1,082,000 1,776,000 72,012 82,693 21,293 20,799 12.60 18.16 0.00 1.00 -0.31
Duni AB 233,618 238,988 221,948 3,431,000 2,749,000 84,164 78,228 59,028 69,059 24.96 19.66 1.00 0.00 0.27
DURO FELGUERA SA 260,403 268,587 320,099 770,000 810,000 781,242 954,606 31,281 65,305 1.95 1.79 1.00 0.00 0.09
ELECNOR SA 628,572 612,888 605,990 868,000 1,025,000 1,382,922 1,038,982 759,022 598,264 1.41 1.63 0.00 1.00 -0.14
ENERGOAQUA, A.S. 67,460 66,023 68,749.72 41,091 40,538 4,381 3,281 174 0 10.02 13.36 0.00 1.00 -0.25
EUTELSAT COMMUNICATIONS 1,784,700 1,950,800 1,651,630 6,824,000 6,066,000 410,617 380,984 2,300,762 2,495,266 3.52 3.11 1.00 0.00 0.13
FLEXOPACK A.E.Β.Ε. ΠΛΑΣΤΙΚΩΝ 38,455 40,414 36,681 92,000 88,000 12,564 17,313 7,649 8,319 5.55 4.43 1.00 0.00 0.25
Flughafen Zürich AG 1,340,354 1,480,047 1,076,706 1,325,374 1,056,117 385,373 373,630 670,281 670,422 2.26 2.01 1.00 0.00 0.12
Fugro N.V. 1,523,247 1,674,134 1,199,510 3,171,000 1,569,000 639,522 725,493 441,339 395,384 3.93 2.40 1.00 0.00 0.64
GIORGIO FEDON & FIGLI SPA 16,780 17,416 15,691 8,000 9,000 21,005 22,425 4,358 5,487 1.32 1.32 0.00 1.00 -0.01
Goodwin PLC 49,670 59,940 46,242 77,035 73,339 32,361 43,378 11,924 9,276 2.74 2.39 1.00 0.00 0.14
GROUPE MINOTERIES SA 69,592 64,220 67,726 129,083 77,526 14,808 13,712 0 796 9.72 6.34 1.00 0.00 0.53
HARGREAVES SERVICES PLC 138,419 185,540 170,454 334,211 188,981 144,172 115,196 58,727 86,796 2.65 1.94 1.00 0.00 0.37
IMMUNODIAGNOSTIC SYSTEMS HOLDINGS PUBLIC LIMITED
COMPANY 86,715 94,231 83,848 277,910 248,475 13,656 11,185 4,884 9,714 15.99 12.89 1.00 0.00 0.24
Indra Sistemas, Sociedad Anonima 1,066,785 1,099,802 1,011,545 2,702,000 2,657,000 1,316,186 1,525,280 106,688 53,147 2.90 2.68 1.00 0.00 0.08
INTERPARFUMS 354,885 367,739 344,531 510,000 325,000 185,313 133,563 0 12 3.75 3.43 1.00 0.00 0.09
ITAL TBS TELEMATIC & BIOMEDICAL SERVICES S.P.A. 56,701 62,208 57,348 57,000 106,000 124,542 104,300 24,647 26,352 1.38 1.81 0.00 1.00 -0.24
IZOSTAL S.A. 39,078 38,354 37,905 60,265 48,302 21,412 19,417 3,577 4,345 3.41 3.03 1.00 0.00 0.12
James Halstead PLC 94,866 116,915 81,844 384,169 249,605 62,079 44,431 245 234 7.16 6.59 1.00 0.00 0.09
JOURNEY GROUP PLC 12,951 13,861 13,532 11,080 9,583 7,471 7,785 218 14 2.44 2.23 1.00 0.00 0.10
KINEPOLIS GROUP 108,668 104,657 133,942 363,000 353,000 126,503 83,943 38,502 57,437 3.20 3.50 0.00 1.00 -0.08
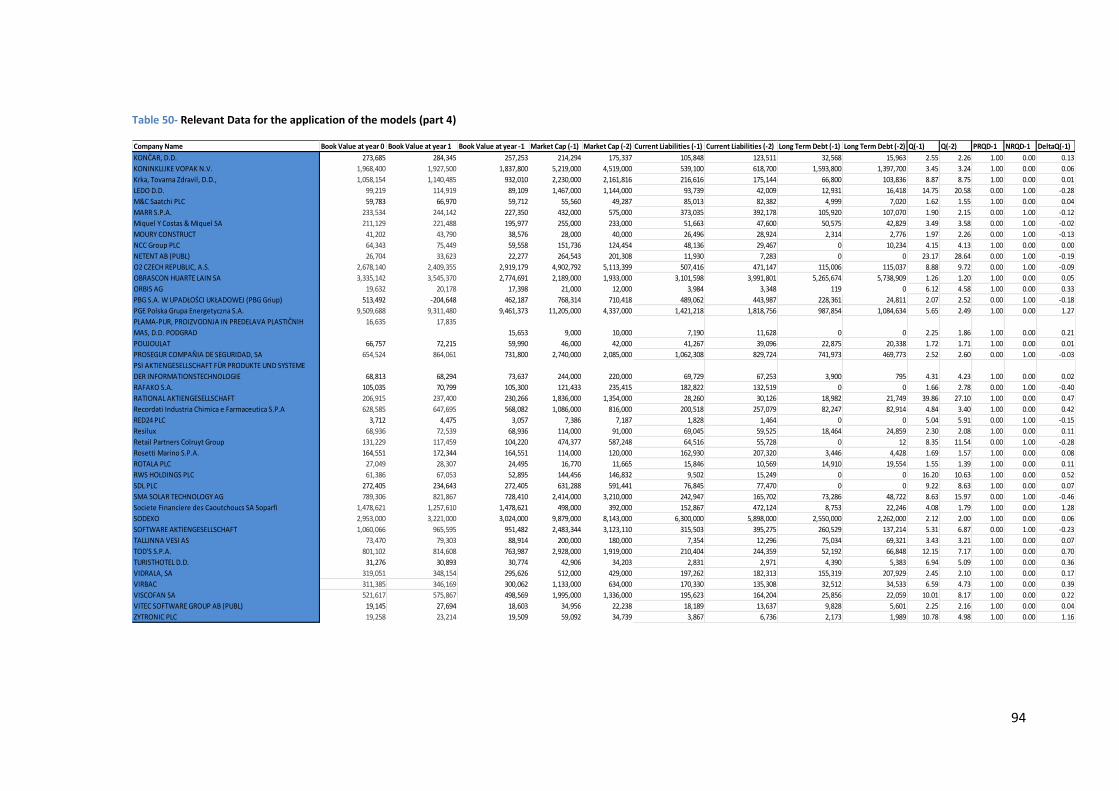
94
Table 50- Relevant Data for the application of the models (part 4)
Company Name Book Value at year 0 Book Value at year 1 Book Value at year -1 Market Cap (-1) Market Cap (-2) Current Liabilities (-1) Current Liabilities (-2) Long Term Debt (-1) Long Term Debt (-2) Q(-1) Q(-2) PRQD-1 NRQD-1 DeltaQ(-1)
KONČAR, D.D. 273,685 284,345 257,253 214,294 175,337 105,848 123,511 32,568 15,963 2.55 2.26 1.00 0.00 0.13
KONINKLIJKE VOPAK N.V. 1,968,400 1,927,500 1,837,800 5,219,000 4,519,000 539,100 618,700 1,593,800 1,397,700 3.45 3.24 1.00 0.00 0.06
Krka, Tovarna Zdravil, D.D., 1,058,154 1,140,485 932,010 2,230,000 2,161,816 216,616 175,144 66,800 103,836 8.87 8.75 1.00 0.00 0.01
LEDO D.D. 99,219 114,919 89,109 1,467,000 1,144,000 93,739 42,009 12,931 16,418 14.75 20.58 0.00 1.00 -0.28
M&C Saatchi PLC 59,783 66,970 59,712 55,560 49,287 85,013 82,382 4,999 7,020 1.62 1.55 1.00 0.00 0.04
MARR S.P.A. 233,534 244,142 227,350 432,000 575,000 373,035 392,178 105,920 107,070 1.90 2.15 0.00 1.00 -0.12
Miquel Y Costas & Miquel SA 211,129 221,488 195,977 255,000 233,000 51,663 47,600 50,575 42,829 3.49 3.58 0.00 1.00 -0.02
MOURY CONSTRUCT 41,202 43,790 38,576 28,000 40,000 26,496 28,924 2,314 2,776 1.97 2.26 0.00 1.00 -0.13
NCC Group PLC 64,343 75,449 59,558 151,736 124,454 48,136 29,467 0 10,234 4.15 4.13 1.00 0.00 0.00
NETENT AB (PUBL) 26,704 33,623 22,277 264,543 201,308 11,930 7,283 0 0 23.17 28.64 0.00 1.00 -0.19
O2 CZECH REPUBLIC, A.S. 2,678,140 2,409,355 2,919,179 4,902,792 5,113,399 507,416 471,147 115,006 115,037 8.88 9.72 0.00 1.00 -0.09
OBRASCON HUARTE LAIN SA 3,335,142 3,545,370 2,774,691 2,189,000 1,933,000 3,101,598 3,991,801 5,265,674 5,738,909 1.26 1.20 1.00 0.00 0.05
ORBIS AG 19,632 20,178 17,398 21,000 12,000 3,984 3,348 119 0 6.12 4.58 1.00 0.00 0.33
PBG S.A. W UPADŁOŚCI UKŁADOWEJ (PBG Griup) 513,492 -204,648 462,187 768,314 710,418 489,062 443,987 228,361 24,811 2.07 2.52 0.00 1.00 -0.18
PGE Polska Grupa Energetyczna S.A. 9,509,688 9,311,480 9,461,373 11,205,000 4,337,000 1,421,218 1,818,756 987,854 1,084,634 5.65 2.49 1.00 0.00 1.27
PLAMA-PUR, PROIZVODNJA IN PREDELAVA PLASTIČNIH
MAS, D.D. PODGRAD
16,635 17,835
15,653 9,000 10,000 7,190 11,628 0 0 2.25 1.86 1.00 0.00 0.21
POUJOULAT 66,757 72,215 59,990 46,000 42,000 41,267 39,096 22,875 20,338 1.72 1.71 1.00 0.00 0.01
PROSEGUR COMPAÑIA DE SEGURIDAD, SA 654,524 864,061 731,800 2,740,000 2,085,000 1,062,308 829,724 741,973 469,773 2.52 2.60 0.00 1.00 -0.03
PSI AKTIENGESELLSCHAFT FÜR PRODUKTE UND SYSTEME
DER INFORMATIONSTECHNOLOGIE 68,813 68,294 73,637 244,000 220,000 69,729 67,253 3,900 795 4.31 4.23 1.00 0.00 0.02
RAFAKO S.A. 105,035 70,799 105,300 121,433 235,415 182,822 132,519 0 0 1.66 2.78 0.00 1.00 -0.40
RATIONAL AKTIENGESELLSCHAFT 206,915 237,400 230,266 1,836,000 1,354,000 28,260 30,126 18,982 21,749 39.86 27.10 1.00 0.00 0.47
Recordati Industria Chimica e Farmaceutica S.P.A 628,585 647,695 568,082 1,086,000 816,000 200,518 257,079 82,247 82,914 4.84 3.40 1.00 0.00 0.42
RED24 PLC 3,712 4,475 3,057 7,386 7,187 1,828 1,464 0 0 5.04 5.91 0.00 1.00 -0.15
Resilux 68,936 72,539 68,936 114,000 91,000 69,045 59,525 18,464 24,859 2.30 2.08 1.00 0.00 0.11
Retail Partners Colruyt Group 131,229 117,459 104,220 474,377 587,248 64,516 55,728 0 12 8.35 11.54 0.00 1.00 -0.28
Rosetti Marino S.P.A. 164,551 172,344 164,551 114,000 120,000 162,930 207,320 3,446 4,428 1.69 1.57 1.00 0.00 0.08
ROTALA PLC 27,049 28,307 24,495 16,770 11,665 15,846 10,569 14,910 19,554 1.55 1.39 1.00 0.00 0.11
RWS HOLDINGS PLC 61,386 67,053 52,895 144,456 146,832 9,502 15,249 0 0 16.20 10.63 1.00 0.00 0.52
SDL PLC 272,405 234,643 272,405 631,288 591,441 76,845 77,470 0 0 9.22 8.63 1.00 0.00 0.07
SMA SOLAR TECHNOLOGY AG 789,306 821,867 728,410 2,414,000 3,210,000 242,947 165,702 73,286 48,722 8.63 15.97 0.00 1.00 -0.46
Societe Financiere des Caoutchoucs SA Soparfi 1,478,621 1,257,610 1,478,621 498,000 392,000 152,867 472,124 8,753 22,246 4.08 1.79 1.00 0.00 1.28
SODEXO 2,953,000 3,221,000 3,024,000 9,879,000 8,143,000 6,300,000 5,898,000 2,550,000 2,262,000 2.12 2.00 1.00 0.00 0.06
SOFTWARE AKTIENGESELLSCHAFT 1,060,066 965,595 951,482 2,483,344 3,123,110 315,503 395,275 260,529 137,214 5.31 6.87 0.00 1.00 -0.23
TALLINNA VESI AS 73,470 79,303 88,914 200,000 180,000 7,354 12,296 75,034 69,321 3.43 3.21 1.00 0.00 0.07
TOD'S S.P.A. 801,102 814,608 763,987 2,928,000 1,919,000 210,404 244,359 52,192 66,848 12.15 7.17 1.00 0.00 0.70
TURISTHOTEL D.D. 31,276 30,893 30,774 42,906 34,203 2,831 2,971 4,390 5,383 6.94 5.09 1.00 0.00 0.36
VIDRALA, SA 319,051 348,154 295,626 512,000 429,000 197,262 182,313 155,319 207,929 2.45 2.10 1.00 0.00 0.17
VIRBAC 311,385 346,169 300,062 1,133,000 634,000 170,330 135,308 32,512 34,533 6.59 4.73 1.00 0.00 0.39
VISCOFAN SA 521,617 575,867 498,569 1,995,000 1,336,000 195,623 164,204 25,856 22,059 10.01 8.17 1.00 0.00 0.22
VITEC SOFTWARE GROUP AB (PUBL) 19,145 27,694 18,603 34,956 22,238 18,189 13,637 9,828 5,601 2.25 2.16 1.00 0.00 0.04
ZYTRONIC PLC 19,258 23,214 19,509 59,092 34,739 3,867 6,736 2,173 1,989 10.78 4.98 1.00 0.00 1.16
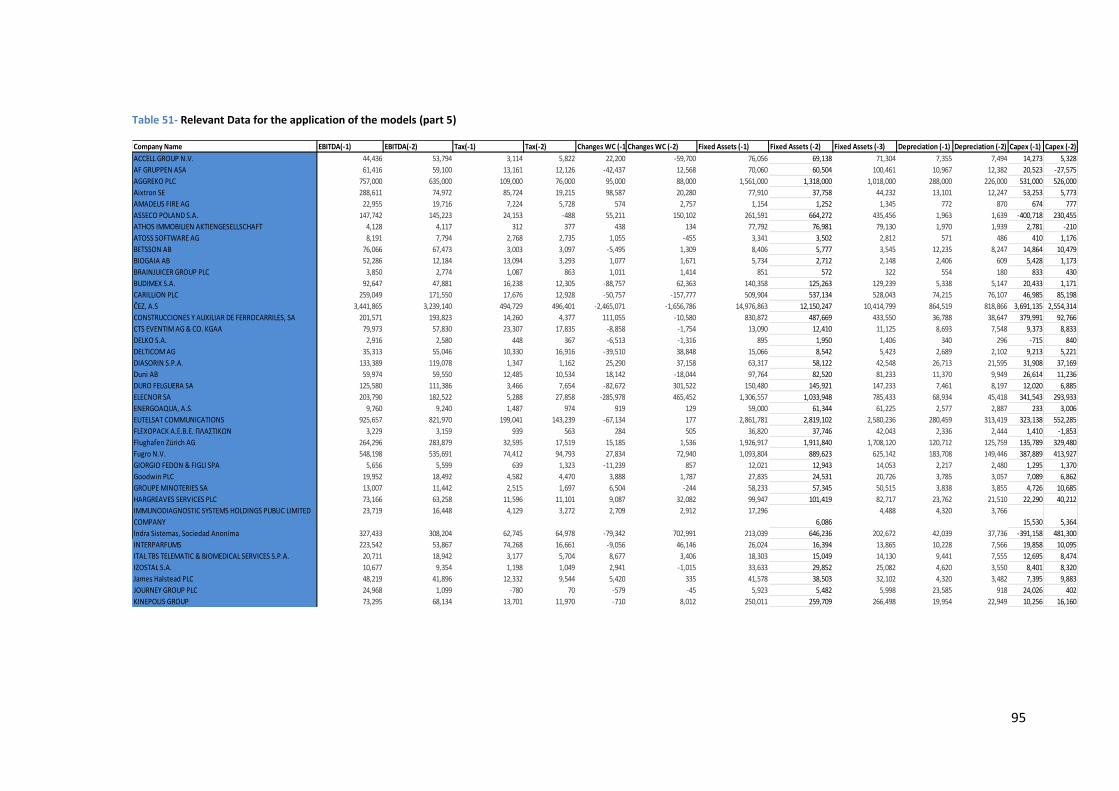
95
Table 51- Relevant Data for the application of the models (part 5)
Company Name EBITDA(-1) EBITDA(-2) Tax(-1) Tax(-2) Changes WC (-1)Changes WC (-2) Fixed Assets (-1) Fixed Assets (-2) Fixed Assets (-3) Depreciation (-1) Depreciation (-2) Capex (-1) Capex (-2)
ACCELL GROUP N.V. 44,436 53,794 3,114 5,822 22,200 -59,700 76,056 69,138 71,304 7,355 7,494 14,273 5,328
AF GRUPPEN ASA 61,416 59,100 13,161 12,126 -42,437 12,568 70,060 60,504 100,461 10,967 12,382 20,523 -27,575
AGGREKO PLC 757,000 635,000 109,000 76,000 95,000 88,000 1,561,000 1,318,000 1,018,000 288,000 226,000 531,000 526,000
Aixtron SE 288,611 74,972 85,724 19,215 98,587 20,280 77,910 37,758 44,232 13,101 12,247 53,253 5,773
AMADEUS FIRE AG 22,955 19,716 7,224 5,728 574 2,757 1,154 1,252 1,345 772 870 674 777
ASSECO POLAND S.A. 147,742 145,223 24,153 -488 55,211 150,102 261,591 664,272 435,456 1,963 1,639 -400,718 230,455
ATHOS IMMOBILIEN AKTIENGESELLSCHAFT 4,128 4,117 312 377 438 134 77,792 76,981 79,130 1,970 1,939 2,781 -210
ATOSS SOFTWARE AG 8,191 7,794 2,768 2,735 1,055 -455 3,341 3,502 2,812 571 486 410 1,176
BETSSON AB 76,066 67,473 3,003 3,097 -5,495 1,309 8,406 5,777 3,545 12,235 8,247 14,864 10,479
BIOGAIA AB 52,286 12,184 13,094 3,293 1,077 1,671 5,734 2,712 2,148 2,406 609 5,428 1,173
BRAINJUICER GROUP PLC 3,850 2,774 1,087 863 1,011 1,414 851 572 322 554 180 833 430
BUDIMEX S.A. 92,647 47,881 16,238 12,305 -88,757 62,363 140,358 125,263 129,239 5,338 5,147 20,433 1,171
CARILLION PLC 259,049 171,550 17,676 12,928 -50,757 -157,777 509,904 537,134 528,043 74,215 76,107 46,985 85,198
ČEZ, A.S 3,441,865 3,239,140 494,729 496,401 -2,465,071 -1,656,786 14,976,863 12,150,247 10,414,799 864,519 818,866 3,691,135 2,554,314
CONSTRUCCIONES Y AUXILIAR DE FERROCARRILES, SA 201,571 193,823 14,260 4,377 111,055 -10,580 830,872 487,669 433,550 36,788 38,647 379,991 92,766
CTS EVENTIM AG & CO. KGAA 79,973 57,830 23,307 17,835 -8,858 -1,754 13,090 12,410 11,125 8,693 7,548 9,373 8,833
DELKO S.A. 2,916 2,580 448 367 -6,513 -1,316 895 1,950 1,406 340 296 -715 840
DELTICOM AG 35,313 55,046 10,330 16,916 -39,510 38,848 15,066 8,542 5,423 2,689 2,102 9,213 5,221
DIASORIN S.P.A. 133,389 119,078 1,347 1,162 25,290 37,158 63,317 58,122 42,548 26,713 21,595 31,908 37,169
Duni AB 59,974 59,550 12,485 10,534 18,142 -18,044 97,764 82,520 81,233 11,370 9,949 26,614 11,236
DURO FELGUERA SA 125,580 111,386 3,466 7,654 -82,672 301,522 150,480 145,921 147,233 7,461 8,197 12,020 6,885
ELECNOR SA 203,790 182,522 5,288 27,858 -285,978 465,452 1,306,557 1,033,948 785,433 68,934 45,418 341,543 293,933
ENERGOAQUA, A.S. 9,760 9,240 1,487 974 919 129 59,000 61,344 61,225 2,577 2,887 233 3,006
EUTELSAT COMMUNICATIONS 925,657 821,970 199,041 143,239 -67,134 177 2,861,781 2,819,102 2,580,236 280,459 313,419 323,138 552,285
FLEXOPACK A.E.Β.Ε. ΠΛΑΣΤΙΚΩΝ 3,229 3,159 939 563 284 505 36,820 37,746 42,043 2,336 2,444 1,410 -1,853
Flughafen Zürich AG 264,296 283,879 32,595 17,519 15,185 1,536 1,926,917 1,911,840 1,708,120 120,712 125,759 135,789 329,480
Fugro N.V. 548,198 535,691 74,412 94,793 27,834 72,940 1,093,804 889,623 625,142 183,708 149,446 387,889 413,927
GIORGIO FEDON & FIGLI SPA 5,656 5,599 639 1,323 -11,239 857 12,021 12,943 14,053 2,217 2,480 1,295 1,370
Goodwin PLC 19,952 18,492 4,582 4,470 3,888 1,787 27,835 24,531 20,726 3,785 3,057 7,089 6,862
GROUPE MINOTERIES SA 13,007 11,442 2,515 1,697 6,504 -244 58,233 57,345 50,515 3,838 3,855 4,726 10,685
HARGREAVES SERVICES PLC 73,166 63,258 11,596 11,101 9,087 32,082 99,947 101,419 82,717 23,762 21,510 22,290 40,212
IMMUNODIAGNOSTIC SYSTEMS HOLDINGS PUBLIC LIMITED
COMPANY
23,719 16,448 4,129 3,272 2,709 2,912 17,296
6,086
4,488 4,320 3,766
15,530 5,364
Indra Sistemas, Sociedad Anonima 327,433 308,204 62,745 64,978 -79,342 702,991 213,039 646,236 202,672 42,039 37,736 -391,158 481,300
INTERPARFUMS 223,542 53,867 74,268 16,661 -9,056 46,146 26,024 16,394 13,865 10,228 7,566 19,858 10,095
ITAL TBS TELEMATIC & BIOMEDICAL SERVICES S.P.A. 20,711 18,942 3,177 5,704 8,677 3,406 18,303 15,049 14,130 9,441 7,555 12,695 8,474
IZOSTAL S.A. 10,677 9,354 1,198 1,049 2,941 -1,015 33,633 29,852 25,082 4,620 3,550 8,401 8,320
James Halstead PLC 48,219 41,896 12,332 9,544 5,420 335 41,578 38,503 32,102 4,320 3,482 7,395 9,883
JOURNEY GROUP PLC 24,968 1,099 -780 70 -579 -45 5,923 5,482 5,998 23,585 918 24,026 402
KINEPOLIS GROUP 73,295 68,134 13,701 11,970 -710 8,012 250,011 259,709 266,498 19,954 22,949 10,256 16,160

96
Table 52- Relevant Data for the application of the models (part 6)
Company Name EBITDA(-1) EBITDA(-2) Tax(-1) Tax(-2) Changes WC (-1)Changes WC (-2) Fixed Assets (-1) Fixed Assets (-2) Fixed Assets (-3) Depreciation (-1) Depreciation (-2) Capex (-1) Capex (-2)
KONČAR, D.D. 40,299 19,871 2,868 2,468 -1,575 7,892 191,176 174,118 155,713 27,744 13,047 44,802 31,452
KONINKLIJKE VOPAK N.V. 636,000 598,000 71,300 72,800 -177,400 52,000 3,772,600 3,316,600 2,689,000 166,600 152,900 622,600 780,500
Krka, Tovarna Zdravil, D.D., 268,018 280,867 37,477 42,843 68,254 50,153 779,297 756,579 740,438 68,503 68,035 91,221 84,176
LEDO D.D. 20,535 19,192 3,126 2,779 -4,575 8,454 63,579 62,872 54,898 5,673 5,351 6,380 13,325
M&C Saatchi PLC 13,634 16,296 4,121 4,089 -8,318 -13,064 10,983 8,989 14,479 2,192 5,019 4,186 -471
MARR S.P.A. 91,401 82,848 25,622 23,189 15,756 -1,659 74,884 67,079 65,128 12,103 11,755 19,908 13,706
Miquel Y Costas & Miquel SA 50,615 45,075 10,188 8,919 2,376 -21,047 154,139 125,855 118,737 14,526 13,997 42,810 21,115
MOURY CONSTRUCT 8,785 6,337 3,659 2,048 1,237 -3,479 9,474 21,281 13,409 805 1,083 -11,002 8,955
NCC Group PLC 19,264 16,048 4,443 3,632 507 -367 3,456 3,344 3,925 3,245 2,887 3,357 2,306
NETENT AB (PUBL) 18,658 13,898 1,223 930 -763 -954 4,957 3,115 993 3,451 2,175 5,293 4,297
O2 CZECH REPUBLIC, A.S. 1,092,221 1,024,113 121,189 121,349 -63,696 219,572 2,268,214 2,189,416 2,373,883 472,950 454,405 551,748 269,938
OBRASCON HUARTE LAIN SA 830,701 1,224,900 341,905 194,995 237,727 -320,469 2,534,364 2,553,429 2,097,296 170,548 252,370 151,483 708,503
ORBIS AG 2,299 1,870 160 15 545 666 4,898 4,543 4,486 536 385 891 442
PBG S.A. W UPADŁOŚCI UKŁADOWEJ (PBG Griup) 78,751 80,053 12,379 9,885 79,249 54,338 305,511 238,318 219,161 10,278 10,280 77,471 29,437
PGE Polska Grupa Energetyczna S.A. 1,303,802 794,956 253,598 121,130 146,519 92,302 10,183,966 9,840,680 11,908,291 2,160 3,509 345,446 -2,064,102
PLAMA-PUR, PROIZVODNJA IN PREDELAVA PLASTIČNIH
MAS, D.D. PODGRAD
4,192 3,900 483 374 -1,473 2,218 12,004
12,870
13,040 1,858 1,835
992 1,665
POUJOULAT 19,707 19,411 4,274 4,176 6,444 -907 36,182 32,990 31,532 5,329 5,132 8,521 6,590
PROSEGUR COMPAÑIA DE SEGURIDAD, SA 426,974 363,504 79,257 85,302 208,602 156,627 699,906 546,626 494,685 115,497 79,408 268,777 131,349
PSI AKTIENGESELLSCHAFT FÜR PRODUKTE UND SYSTEME
DER INFORMATIONSTECHNOLOGIE
16,919 14,646 1,977 1,280 4,210 2,302 14,669
14,672
14,111 4,034 3,981
4,031 4,542
RAFAKO S.A. 16,914 17,698 4,510 3,100 60,885 -18,987 90,741 53,180 49,964 2,370 2,516 39,931 5,732
RATIONAL AKTIENGESELLSCHAFT 112,563 98,071 25,818 22,822 6,540 -4,995 54,205 56,371 61,245 6,796 7,589 4,630 2,715
Recordati Industria Chimica e Farmaceutica S.P.A 201,163 184,404 42,086 37,717 5,993 2,656 122,004 129,803 131,684 34,800 30,192 27,001 28,311
RED24 PLC 1,098 896 140 20 -138 490 292 295 306 66 57 63 46
Resilux 28,163 27,656 2,049 2,334 10,400 -10,755 60,836 50,997 49,708 10,316 10,636 20,155 11,925
Retail Partners Colruyt Group 15,831 13,083 2,724 -1,199 -11,224 16,610 27,848 31,493 31,573 3,759 3,432 114 3,352
Rosetti Marino S.P.A. 77,936 56,359 22,245 18,066 -44,390 69,245 74,425 67,201 26,682 5,348 3,716 12,572 44,235
ROTALA PLC 8,502 7,447 -325 -539 -499 131 35,104 33,783 28,953 4,414 3,327 5,735 8,157
RWS HOLDINGS PLC 15,718 16,907 -539 5,150 20 -1,387 4,998 2,520 1,073 979 848 3,457 2,295
SDL PLC 50,766 44,185 9,589 7,918 -377 11,950 14,747 15,899 12,866 10,722 10,708 9,570 13,741
SMA SOLAR TECHNOLOGY AG 548,106 244,717 153,066 71,070 185,973 20,577 268,580 149,142 94,219 31,300 16,334 150,738 71,257
Societe Financiere des Caoutchoucs SA Soparfi 276,173 603,863 85,922 163,885 -14,061 674 1,629,756 223,118 194,121 27,824 25,004 1,434,462 54,001
SODEXO 1,338,000 1,104,000 286,000 250,000 47,000 41,000 1,294,000 1,087,000 1,148,000 354,000 251,000 561,000 190,000
SOFTWARE AKTIENGESELLSCHAFT 315,472 314,996 82,085 78,738 -25,662 13,012 68,811 71,618 72,756 46,276 46,386 43,469 45,248
TALLINNA VESI AS 110,650 102,200 3,908 4,230 4,643 -4,933 137,599 138,632 134,201 81,127 76,293 80,094 80,724
TOD'S S.P.A. 247,172 230,518 61,980 61,198 51,732 34,078 208,184 200,722 181,958 38,335 35,888 45,797 54,652
TURISTHOTEL D.D. 8,271 8,611 1,269 1,415 -1,627 -707 14,231 17,274 19,828 3,113 3,533 70 979
VIDRALA, SA 100,574 89,846 9,525 5,858 47,583 -22,370 394,978 466,342 447,589 37,643 34,863 -33,721 53,616
VIRBAC 107,246 74,564 21,791 16,727 18,713 1,840 109,710 81,874 74,327 18,518 15,663 46,354 23,210
VISCOFAN SA 185,033 162,142 27,932 26,639 38,834 7,181 356,919 334,286 317,503 45,010 42,050 67,643 58,833
VITEC SOFTWARE GROUP AB (PUBL) 8,873 6,819 847 896 -458 675 1,575 1,655 890 3,865 2,566 3,785 3,331
ZYTRONIC PLC 6,649 5,573 1,124 999 762 553 10,824 9,711 10,011 1,301 1,336 2,414 1,036
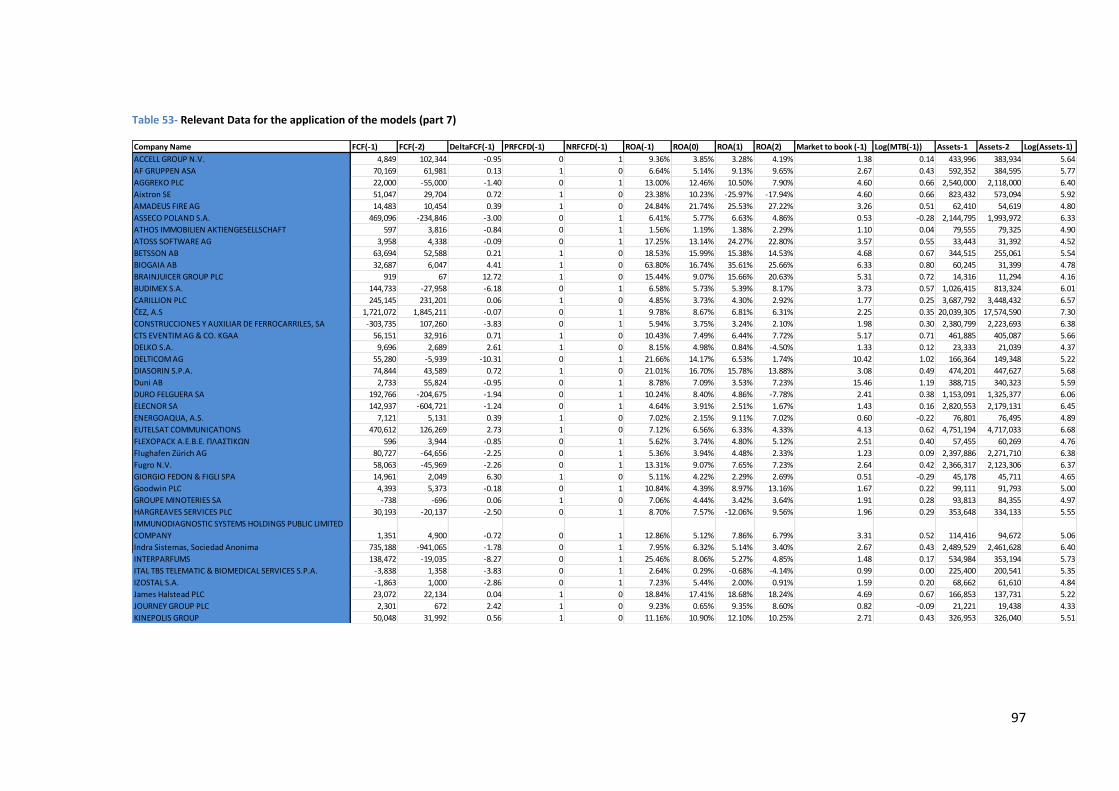
97
Table 53- Relevant Data for the application of the models (part 7)
Company Name FCF(-1) FCF(-2) DeltaFCF(-1) PRFCFD(-1) NRFCFD(-1) ROA(-1) ROA(0) ROA(1) ROA(2) Market to book (-1) Log(MTB(-1)) Assets-1 Assets-2 Log(Assets-1)
ACCELL GROUP N.V. 4,849 102,344 -0.95 0 1 9.36% 3.85% 3.28% 4.19% 1.38 0.14 433,996 383,934 5.64
AF GRUPPEN ASA 70,169 61,981 0.13 1 0 6.64% 5.14% 9.13% 9.65% 2.67 0.43 592,352 384,595 5.77
AGGREKO PLC 22,000 -55,000 -1.40 0 1 13.00% 12.46% 10.50% 7.90% 4.60 0.66 2,540,000 2,118,000 6.40
Aixtron SE 51,047 29,704 0.72 1 0 23.38% 10.23% -25.97% -17.94% 4.60 0.66 823,432 573,094 5.92
AMADEUS FIRE AG 14,483 10,454 0.39 1 0 24.84% 21.74% 25.53% 27.22% 3.26 0.51 62,410 54,619 4.80
ASSECO POLAND S.A. 469,096 -234,846 -3.00 0 1 6.41% 5.77% 6.63% 4.86% 0.53 -0.28 2,144,795 1,993,972 6.33
ATHOS IMMOBILIEN AKTIENGESELLSCHAFT 597 3,816 -0.84 0 1 1.56% 1.19% 1.38% 2.29% 1.10 0.04 79,555 79,325 4.90
ATOSS SOFTWARE AG 3,958 4,338 -0.09 0 1 17.25% 13.14% 24.27% 22.80% 3.57 0.55 33,443 31,392 4.52
BETSSON AB 63,694 52,588 0.21 1 0 18.53% 15.99% 15.38% 14.53% 4.68 0.67 344,515 255,061 5.54
BIOGAIA AB 32,687 6,047 4.41 1 0 63.80% 16.74% 35.61% 25.66% 6.33 0.80 60,245 31,399 4.78
BRAINJUICER GROUP PLC 919 67 12.72 1 0 15.44% 9.07% 15.66% 20.63% 5.31 0.72 14,316 11,294 4.16
BUDIMEX S.A. 144,733 -27,958 -6.18 0 1 6.58% 5.73% 5.39% 8.17% 3.73 0.57 1,026,415 813,324 6.01
CARILLION PLC 245,145 231,201 0.06 1 0 4.85% 3.73% 4.30% 2.92% 1.77 0.25 3,687,792 3,448,432 6.57
ČEZ, A.S 1,721,072 1,845,211 -0.07 0 1 9.78% 8.67% 6.81% 6.31% 2.25 0.35 20,039,305 17,574,590 7.30
CONSTRUCCIONES Y AUXILIAR DE FERROCARRILES, SA -303,735 107,260 -3.83 0 1 5.94% 3.75% 3.24% 2.10% 1.98 0.30 2,380,799 2,223,693 6.38
CTS EVENTIM AG & CO. KGAA 56,151 32,916 0.71 1 0 10.43% 7.49% 6.44% 7.72% 5.17 0.71 461,885 405,087 5.66
DELKO S.A. 9,696 2,689 2.61 1 0 8.15% 4.98% 0.84% -4.50% 1.33 0.12 23,333 21,039 4.37
DELTICOM AG 55,280 -5,939 -10.31 0 1 21.66% 14.17% 6.53% 1.74% 10.42 1.02 166,364 149,348 5.22
DIASORIN S.P.A. 74,844 43,589 0.72 1 0 21.01% 16.70% 15.78% 13.88% 3.08 0.49 474,201 447,627 5.68
Duni AB 2,733 55,824 -0.95 0 1 8.78% 7.09% 3.53% 7.23% 15.46 1.19 388,715 340,323 5.59
DURO FELGUERA SA 192,766 -204,675 -1.94 0 1 10.24% 8.40% 4.86% -7.78% 2.41 0.38 1,153,091 1,325,377 6.06
ELECNOR SA 142,937 -604,721 -1.24 0 1 4.64% 3.91% 2.51% 1.67% 1.43 0.16 2,820,553 2,179,131 6.45
ENERGOAQUA, A.S. 7,121 5,131 0.39 1 0 7.02% 2.15% 9.11% 7.02% 0.60 -0.22 76,801 76,495 4.89
EUTELSAT COMMUNICATIONS 470,612 126,269 2.73 1 0 7.12% 6.56% 6.33% 4.33% 4.13 0.62 4,751,194 4,717,033 6.68
FLEXOPACK A.E.Β.Ε. ΠΛΑΣΤΙΚΩΝ 596 3,944 -0.85 0 1 5.62% 3.74% 4.80% 5.12% 2.51 0.40 57,455 60,269 4.76
Flughafen Zürich AG 80,727 -64,656 -2.25 0 1 5.36% 3.94% 4.48% 2.33% 1.23 0.09 2,397,886 2,271,710 6.38
Fugro N.V. 58,063 -45,969 -2.26 0 1 13.31% 9.07% 7.65% 7.23% 2.64 0.42 2,366,317 2,123,306 6.37
GIORGIO FEDON & FIGLI SPA 14,961 2,049 6.30 1 0 5.11% 4.22% 2.29% 2.69% 0.51 -0.29 45,178 45,711 4.65
Goodwin PLC 4,393 5,373 -0.18 0 1 10.84% 4.39% 8.97% 13.16% 1.67 0.22 99,111 91,793 5.00
GROUPE MINOTERIES SA -738 -696 0.06 1 0 7.06% 4.44% 3.42% 3.64% 1.91 0.28 93,813 84,355 4.97
HARGREAVES SERVICES PLC 30,193 -20,137 -2.50 0 1 8.70% 7.57% -12.06% 9.56% 1.96 0.29 353,648 334,133 5.55
IMMUNODIAGNOSTIC SYSTEMS HOLDINGS PUBLIC LIMITED
COMPANY 1,351 4,900 -0.72 0 1 12.86% 5.12% 7.86% 6.79% 3.31 0.52 114,416 94,672 5.06
Indra Sistemas, Sociedad Anonima 735,188 -941,065 -1.78 0 1 7.95% 6.32% 5.14% 3.40% 2.67 0.43 2,489,529 2,461,628 6.40
INTERPARFUMS 138,472 -19,035 -8.27 0 1 25.46% 8.06% 5.27% 4.85% 1.48 0.17 534,984 353,194 5.73
ITAL TBS TELEMATIC & BIOMEDICAL SERVICES S.P.A. -3,838 1,358 -3.83 0 1 2.64% 0.29% -0.68% -4.14% 0.99 0.00 225,400 200,541 5.35
IZOSTAL S.A. -1,863 1,000 -2.86 0 1 7.23% 5.44% 2.00% 0.91% 1.59 0.20 68,662 61,610 4.84
James Halstead PLC 23,072 22,134 0.04 1 0 18.84% 17.41% 18.68% 18.24% 4.69 0.67 166,853 137,731 5.22
JOURNEY GROUP PLC 2,301 672 2.42 1 0 9.23% 0.65% 9.35% 8.60% 0.82 -0.09 21,221 19,438 4.33
KINEPOLIS GROUP 50,048 31,992 0.56 1 0 11.16% 10.90% 12.10% 10.25% 2.71 0.43 326,953 326,040 5.51
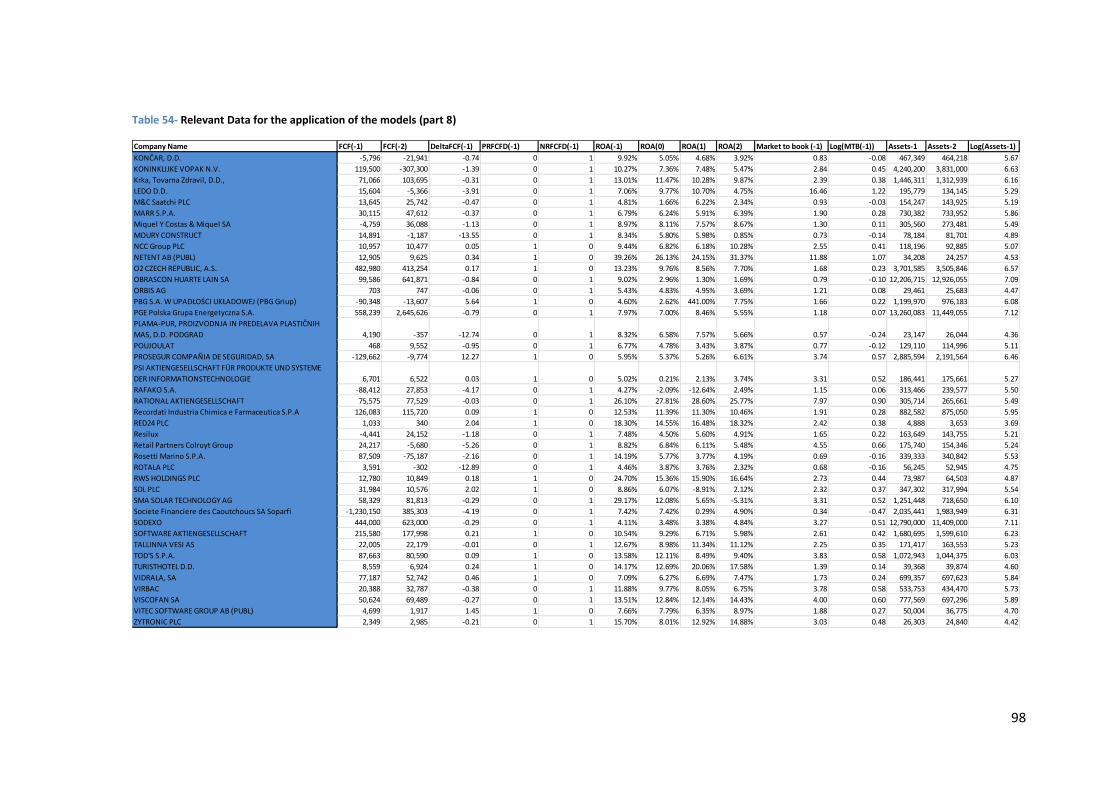
98
Table 54- Relevant Data for the application of the models (part 8)
Company Name FCF(-1) FCF(-2) DeltaFCF(-1) PRFCFD(-1) NRFCFD(-1) ROA(-1) ROA(0) ROA(1) ROA(2) Market to book (-1) Log(MTB(-1)) Assets-1 Assets-2 Log(Assets-1)
KONČAR, D.D. -5,796 -21,941 -0.74 0 1 9.92% 5.05% 4.68% 3.92% 0.83 -0.08 467,349 464,218 5.67
KONINKLIJKE VOPAK N.V. 119,500 -307,300 -1.39 0 1 10.27% 7.36% 7.48% 5.47% 2.84 0.45 4,240,200 3,831,000 6.63
Krka, Tovarna Zdravil, D.D., 71,066 103,695 -0.31 0 1 13.01% 11.47% 10.28% 9.87% 2.39 0.38 1,446,311 1,312,939 6.16
LEDO D.D. 15,604 -5,366 -3.91 0 1 7.06% 9.77% 10.70% 4.75% 16.46 1.22 195,779 134,145 5.29
M&C Saatchi PLC 13,645 25,742 -0.47 0 1 4.81% 1.66% 6.22% 2.34% 0.93 -0.03 154,247 143,925 5.19
MARR S.P.A. 30,115 47,612 -0.37 0 1 6.79% 6.24% 5.91% 6.39% 1.90 0.28 730,382 733,952 5.86
Miquel Y Costas & Miquel SA -4,759 36,088 -1.13 0 1 8.97% 8.11% 7.57% 8.67% 1.30 0.11 305,560 273,481 5.49
MOURY CONSTRUCT 14,891 -1,187 -13.55 0 1 8.34% 5.80% 5.98% 0.85% 0.73 -0.14 78,184 81,701 4.89
NCC Group PLC 10,957 10,477 0.05 1 0 9.44% 6.82% 6.18% 10.28% 2.55 0.41 118,196 92,885 5.07
NETENT AB (PUBL) 12,905 9,625 0.34 1 0 39.26% 26.13% 24.15% 31.37% 11.88 1.07 34,208 24,257 4.53
O2 CZECH REPUBLIC, A.S. 482,980 413,254 0.17 1 0 13.23% 9.76% 8.56% 7.70% 1.68 0.23 3,701,585 3,505,846 6.57
OBRASCON HUARTE LAIN SA 99,586 641,871 -0.84 0 1 9.02% 2.96% 1.30% 1.69% 0.79 -0.10 12,206,715 12,926,055 7.09
ORBIS AG 703 747 -0.06 0 1 5.43% 4.83% 4.95% 3.69% 1.21 0.08 29,461 25,683 4.47
PBG S.A. W UPADŁOŚCI UKŁADOWEJ (PBG Griup) -90,348 -13,607 5.64 1 0 4.60% 2.62% 441.00% 7.75% 1.66 0.22 1,199,970 976,183 6.08
PGE Polska Grupa Energetyczna S.A. 558,239 2,645,626 -0.79 0 1 7.97% 7.00% 8.46% 5.55% 1.18 0.07 13,260,083 11,449,055 7.12
PLAMA-PUR, PROIZVODNJA IN PREDELAVA PLASTIČNIH
MAS, D.D. PODGRAD 4,190 -357 -12.74 0 1 8.32% 6.58% 7.57% 5.66% 0.57 -0.24 23,147 26,044 4.36
POUJOULAT 468 9,552 -0.95 0 1 6.77% 4.78% 3.43% 3.87% 0.77 -0.12 129,110 114,996 5.11
PROSEGUR COMPAÑIA DE SEGURIDAD, SA -129,662 -9,774 12.27 1 0 5.95% 5.37% 5.26% 6.61% 3.74 0.57 2,885,594 2,191,564 6.46
PSI AKTIENGESELLSCHAFT FÜR PRODUKTE UND SYSTEME
DER INFORMATIONSTECHNOLOGIE 6,701 6,522 0.03 1 0 5.02% 0.21% 2.13% 3.74% 3.31 0.52 186,441 175,661 5.27
RAFAKO S.A. -88,412 27,853 -4.17 0 1 4.27% -2.09% -12.64% 2.49% 1.15 0.06 313,466 239,577 5.50
RATIONAL AKTIENGESELLSCHAFT 75,575 77,529 -0.03 0 1 26.10% 27.81% 28.60% 25.77% 7.97 0.90 305,714 265,661 5.49
Recordati Industria Chimica e Farmaceutica S.P.A 126,083 115,720 0.09 1 0 12.53% 11.39% 11.30% 10.46% 1.91 0.28 882,582 875,050 5.95
RED24 PLC 1,033 340 2.04 1 0 18.30% 14.55% 16.48% 18.32% 2.42 0.38 4,888 3,653 3.69
Resilux -4,441 24,152 -1.18 0 1 7.48% 4.50% 5.60% 4.91% 1.65 0.22 163,649 143,755 5.21
Retail Partners Colruyt Group 24,217 -5,680 -5.26 0 1 8.82% 6.84% 6.11% 5.48% 4.55 0.66 175,740 154,346 5.24
Rosetti Marino S.P.A. 87,509 -75,187 -2.16 0 1 14.19% 5.77% 3.77% 4.19% 0.69 -0.16 339,333 340,842 5.53
ROTALA PLC 3,591 -302 -12.89 0 1 4.46% 3.87% 3.76% 2.32% 0.68 -0.16 56,245 52,945 4.75
RWS HOLDINGS PLC 12,780 10,849 0.18 1 0 24.70% 15.36% 15.90% 16.64% 2.73 0.44 73,987 64,503 4.87
SDL PLC 31,984 10,576 2.02 1 0 8.86% 6.07% -8.91% 2.12% 2.32 0.37 347,302 317,994 5.54
SMA SOLAR TECHNOLOGY AG 58,329 81,813 -0.29 0 1 29.17% 12.08% 5.65% -5.31% 3.31 0.52 1,251,448 718,650 6.10
Societe Financiere des Caoutchoucs SA Soparfi -1,230,150 385,303 -4.19 0 1 7.42% 7.42% 0.29% 4.90% 0.34 -0.47 2,035,441 1,983,949 6.31
SODEXO 444,000 623,000 -0.29 0 1 4.11% 3.48% 3.38% 4.84% 3.27 0.51 12,790,000 11,409,000 7.11
SOFTWARE AKTIENGESELLSCHAFT 215,580 177,998 0.21 1 0 10.54% 9.29% 6.71% 5.98% 2.61 0.42 1,680,695 1,599,610 6.23
TALLINNA VESI AS 22,005 22,179 -0.01 0 1 12.67% 8.98% 11.34% 11.12% 2.25 0.35 171,417 163,553 5.23
TOD'S S.P.A. 87,663 80,590 0.09 1 0 13.58% 12.11% 8.49% 9.40% 3.83 0.58 1,072,943 1,044,375 6.03
TURISTHOTEL D.D. 8,559 6,924 0.24 1 0 14.17% 12.69% 20.06% 17.58% 1.39 0.14 39,368 39,874 4.60
VIDRALA, SA 77,187 52,742 0.46 1 0 7.09% 6.27% 6.69% 7.47% 1.73 0.24 699,357 697,623 5.84
VIRBAC 20,388 32,787 -0.38 0 1 11.88% 9.77% 8.05% 6.75% 3.78 0.58 533,753 434,470 5.73
VISCOFAN SA 50,624 69,489 -0.27 0 1 13.51% 12.84% 12.14% 14.43% 4.00 0.60 777,569 697,296 5.89
VITEC SOFTWARE GROUP AB (PUBL) 4,699 1,917 1.45 1 0 7.66% 7.79% 6.35% 8.97% 1.88 0.27 50,004 36,775 4.70
ZYTRONIC PLC 2,349 2,985 -0.21 0 1 15.70% 8.01% 12.92% 14.88% 3.03 0.48 26,303 24,840 4.42
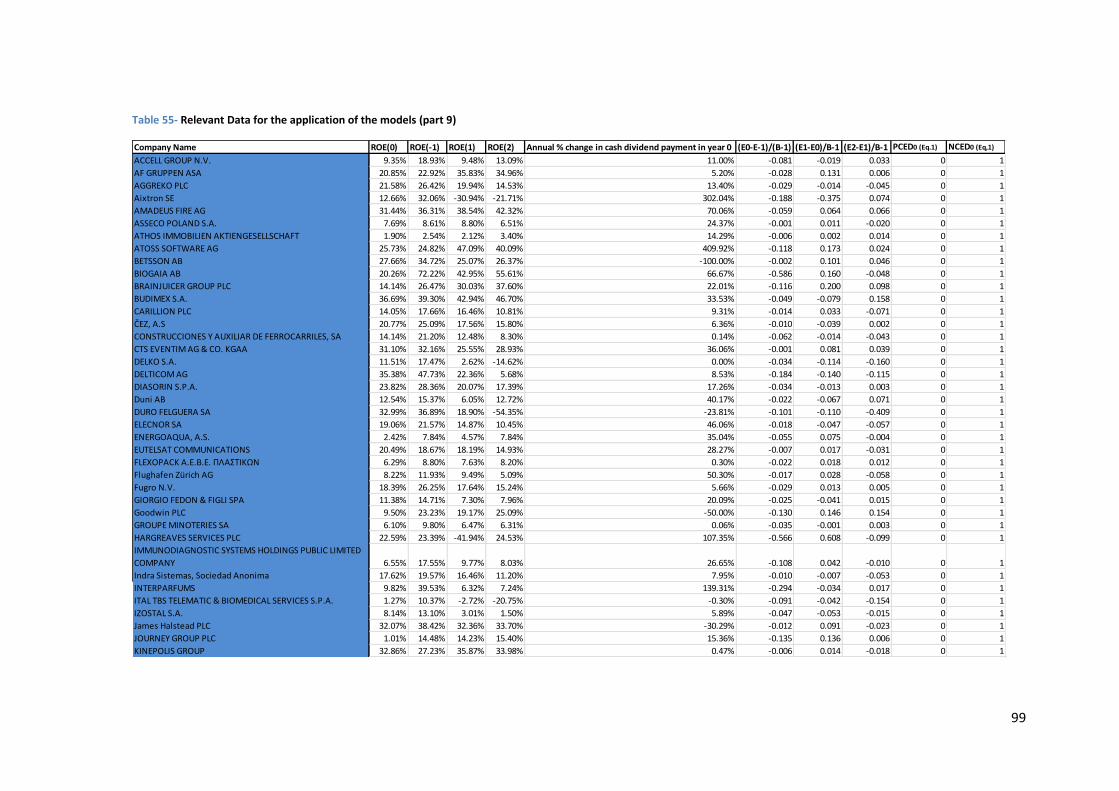
99
Table 55- Relevant Data for the application of the models (part 9)
Company Name ROE(0) ROE(-1) ROE(1) ROE(2) Annual % change in cash dividend payment in year 0 (E0-E-1)/(B-1) (E1-E0)/B-1 (E2-E1)/B-1 PCED0 (Eq.1) NCED0 (Eq,1)
ACCELL GROUP N.V. 9.35% 18.93% 9.48% 13.09% 11.00% -0.081 -0.019 0.033 0 1
AF GRUPPEN ASA 20.85% 22.92% 35.83% 34.96% 5.20% -0.028 0.131 0.006 0 1
AGGREKO PLC 21.58% 26.42% 19.94% 14.53% 13.40% -0.029 -0.014 -0.045 0 1
Aixtron SE 12.66% 32.06% -30.94% -21.71% 302.04% -0.188 -0.375 0.074 0 1
AMADEUS FIRE AG 31.44% 36.31% 38.54% 42.32% 70.06% -0.059 0.064 0.066 0 1
ASSECO POLAND S.A. 7.69% 8.61% 8.80% 6.51% 24.37% -0.001 0.011 -0.020 0 1
ATHOS IMMOBILIEN AKTIENGESELLSCHAFT 1.90% 2.54% 2.12% 3.40% 14.29% -0.006 0.002 0.014 0 1
ATOSS SOFTWARE AG 25.73% 24.82% 47.09% 40.09% 409.92% -0.118 0.173 0.024 0 1
BETSSON AB 27.66% 34.72% 25.07% 26.37% -100.00% -0.002 0.101 0.046 0 1
BIOGAIA AB 20.26% 72.22% 42.95% 55.61% 66.67% -0.586 0.160 -0.048 0 1
BRAINJUICER GROUP PLC 14.14% 26.47% 30.03% 37.60% 22.01% -0.116 0.200 0.098 0 1
BUDIMEX S.A. 36.69% 39.30% 42.94% 46.70% 33.53% -0.049 -0.079 0.158 0 1
CARILLION PLC 14.05% 17.66% 16.46% 10.81% 9.31% -0.014 0.033 -0.071 0 1
ČEZ, A.S 20.77% 25.09% 17.56% 15.80% 6.36% -0.010 -0.039 0.002 0 1
CONSTRUCCIONES Y AUXILIAR DE FERROCARRILES, SA 14.14% 21.20% 12.48% 8.30% 0.14% -0.062 -0.014 -0.043 0 1
CTS EVENTIM AG & CO. KGAA 31.10% 32.16% 25.55% 28.93% 36.06% -0.001 0.081 0.039 0 1
DELKO S.A. 11.51% 17.47% 2.62% -14.62% 0.00% -0.034 -0.114 -0.160 0 1
DELTICOM AG 35.38% 47.73% 22.36% 5.68% 8.53% -0.184 -0.140 -0.115 0 1
DIASORIN S.P.A. 23.82% 28.36% 20.07% 17.39% 17.26% -0.034 -0.013 0.003 0 1
Duni AB 12.54% 15.37% 6.05% 12.72% 40.17% -0.022 -0.067 0.071 0 1
DURO FELGUERA SA 32.99% 36.89% 18.90% -54.35% -23.81% -0.101 -0.110 -0.409 0 1
ELECNOR SA 19.06% 21.57% 14.87% 10.45% 46.06% -0.018 -0.047 -0.057 0 1
ENERGOAQUA, A.S. 2.42% 7.84% 4.57% 7.84% 35.04% -0.055 0.075 -0.004 0 1
EUTELSAT COMMUNICATIONS 20.49% 18.67% 18.19% 14.93% 28.27% -0.007 0.017 -0.031 0 1
FLEXOPACK A.E.Β.Ε. ΠΛΑΣΤΙΚΩΝ 6.29% 8.80% 7.63% 8.20% 0.30% -0.022 0.018 0.012 0 1
Flughafen Zürich AG 8.22% 11.93% 9.49% 5.09% 50.30% -0.017 0.028 -0.058 0 1
Fugro N.V. 18.39% 26.25% 17.64% 15.24% 5.66% -0.029 0.013 0.005 0 1
GIORGIO FEDON & FIGLI SPA 11.38% 14.71% 7.30% 7.96% 20.09% -0.025 -0.041 0.015 0 1
Goodwin PLC 9.50% 23.23% 19.17% 25.09% -50.00% -0.130 0.146 0.154 0 1
GROUPE MINOTERIES SA 6.10% 9.80% 6.47% 6.31% 0.06% -0.035 -0.001 0.003 0 1
HARGREAVES SERVICES PLC 22.59% 23.39% -41.94% 24.53% 107.35% -0.566 0.608 -0.099 0 1
IMMUNODIAGNOSTIC SYSTEMS HOLDINGS PUBLIC LIMITED
COMPANY 6.55% 17.55% 9.77% 8.03% 26.65% -0.108 0.042 -0.010 0 1
Indra Sistemas, Sociedad Anonima 17.62% 19.57% 16.46% 11.20% 7.95% -0.010 -0.007 -0.053 0 1
INTERPARFUMS 9.82% 39.53% 6.32% 7.24% 139.31% -0.294 -0.034 0.017 0 1
ITAL TBS TELEMATIC & BIOMEDICAL SERVICES S.P.A. 1.27% 10.37% -2.72% -20.75% -0.30% -0.091 -0.042 -0.154 0 1
IZOSTAL S.A. 8.14% 13.10% 3.01% 1.50% 5.89% -0.047 -0.053 -0.015 0 1
James Halstead PLC 32.07% 38.42% 32.36% 33.70% -30.29% -0.012 0.091 -0.023 0 1
JOURNEY GROUP PLC 1.01% 14.48% 14.23% 15.40% 15.36% -0.135 0.136 0.006 0 1
KINEPOLIS GROUP 32.86% 27.23% 35.87% 33.98% 0.47% -0.006 0.014 -0.018 0 1
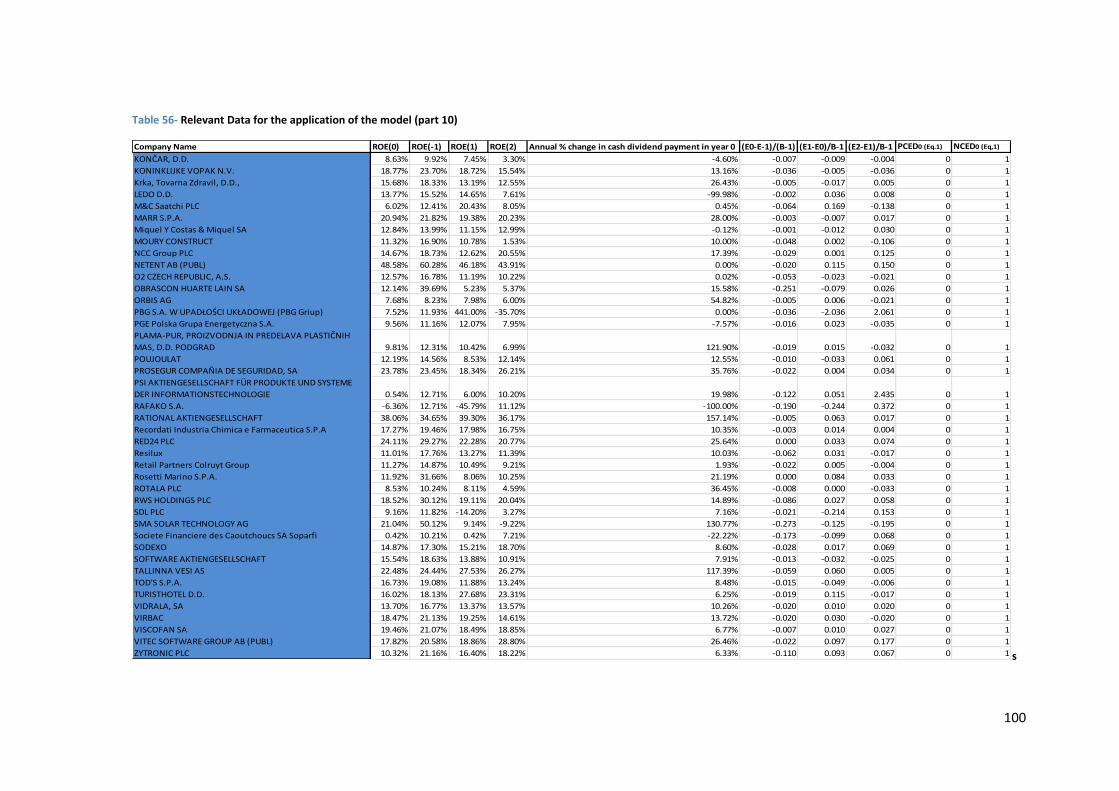
100
Table 56- Relevant Data for the application of the model (part 10)
s
Company Name ROE(0) ROE(-1) ROE(1) ROE(2) Annual % change in cash dividend payment in year 0 (E0-E-1)/(B-1) (E1-E0)/B-1 (E2-E1)/B-1 PCED0 (Eq.1) NCED0 (Eq,1)
KONČAR, D.D. 8.63% 9.92% 7.45% 3.30% -4.60% -0.007 -0.009 -0.004 0 1
KONINKLIJKE VOPAK N.V. 18.77% 23.70% 18.72% 15.54% 13.16% -0.036 -0.005 -0.036 0 1
Krka, Tovarna Zdravil, D.D., 15.68% 18.33% 13.19% 12.55% 26.43% -0.005 -0.017 0.005 0 1
LEDO D.D. 13.77% 15.52% 14.65% 7.61% -99.98% -0.002 0.036 0.008 0 1
M&C Saatchi PLC 6.02% 12.41% 20.43% 8.05% 0.45% -0.064 0.169 -0.138 0 1
MARR S.P.A. 20.94% 21.82% 19.38% 20.23% 28.00% -0.003 -0.007 0.017 0 1
Miquel Y Costas & Miquel SA 12.84% 13.99% 11.15% 12.99% -0.12% -0.001 -0.012 0.030 0 1
MOURY CONSTRUCT 11.32% 16.90% 10.78% 1.53% 10.00% -0.048 0.002 -0.106 0 1
NCC Group PLC 14.67% 18.73% 12.62% 20.55% 17.39% -0.029 0.001 0.125 0 1
NETENT AB (PUBL) 48.58% 60.28% 46.18% 43.91% 0.00% -0.020 0.115 0.150 0 1
O2 CZECH REPUBLIC, A.S. 12.57% 16.78% 11.19% 10.22% 0.02% -0.053 -0.023 -0.021 0 1
OBRASCON HUARTE LAIN SA 12.14% 39.69% 5.23% 5.37% 15.58% -0.251 -0.079 0.026 0 1
ORBIS AG 7.68% 8.23% 7.98% 6.00% 54.82% -0.005 0.006 -0.021 0 1
PBG S.A. W UPADŁOŚCI UKŁADOWEJ (PBG Griup) 7.52% 11.93% 441.00% -35.70% 0.00% -0.036 -2.036 2.061 0 1
PGE Polska Grupa Energetyczna S.A. 9.56% 11.16% 12.07% 7.95% -7.57% -0.016 0.023 -0.035 0 1
PLAMA-PUR, PROIZVODNJA IN PREDELAVA PLASTIČNIH
MAS, D.D. PODGRAD 9.81% 12.31% 10.42% 6.99% 121.90% -0.019 0.015 -0.032 0 1
POUJOULAT 12.19% 14.56% 8.53% 12.14% 12.55% -0.010 -0.033 0.061 0 1
PROSEGUR COMPAÑIA DE SEGURIDAD, SA 23.78% 23.45% 18.34% 26.21% 35.76% -0.022 0.004 0.034 0 1
PSI AKTIENGESELLSCHAFT FÜR PRODUKTE UND SYSTEME
DER INFORMATIONSTECHNOLOGIE 0.54% 12.71% 6.00% 10.20% 19.98% -0.122 0.051 2.435 0 1
RAFAKO S.A. -6.36% 12.71% -45.79% 11.12% -100.00% -0.190 -0.244 0.372 0 1
RATIONAL AKTIENGESELLSCHAFT 38.06% 34.65% 39.30% 36.17% 157.14% -0.005 0.063 0.017 0 1
Recordati Industria Chimica e Farmaceutica S.P.A 17.27% 19.46% 17.98% 16.75% 10.35% -0.003 0.014 0.004 0 1
RED24 PLC 24.11% 29.27% 22.28% 20.77% 25.64% 0.000 0.033 0.074 0 1
Resilux 11.01% 17.76% 13.27% 11.39% 10.03% -0.062 0.031 -0.017 0 1
Retail Partners Colruyt Group 11.27% 14.87% 10.49% 9.21% 1.93% -0.022 0.005 -0.004 0 1
Rosetti Marino S.P.A. 11.92% 31.66% 8.06% 10.25% 21.19% 0.000 0.084 0.033 0 1
ROTALA PLC 8.53% 10.24% 8.11% 4.59% 36.45% -0.008 0.000 -0.033 0 1
RWS HOLDINGS PLC 18.52% 30.12% 19.11% 20.04% 14.89% -0.086 0.027 0.058 0 1
SDL PLC 9.16% 11.82% -14.20% 3.27% 7.16% -0.021 -0.214 0.153 0 1
SMA SOLAR TECHNOLOGY AG 21.04% 50.12% 9.14% -9.22% 130.77% -0.273 -0.125 -0.195 0 1
Societe Financiere des Caoutchoucs SA Soparfi 0.42% 10.21% 0.42% 7.21% -22.22% -0.173 -0.099 0.068 0 1
SODEXO 14.87% 17.30% 15.21% 18.70% 8.60% -0.028 0.017 0.069 0 1
SOFTWARE AKTIENGESELLSCHAFT 15.54% 18.63% 13.88% 10.91% 7.91% -0.013 -0.032 -0.025 0 1
TALLINNA VESI AS 22.48% 24.44% 27.53% 26.27% 117.39% -0.059 0.060 0.005 0 1
TOD'S S.P.A. 16.73% 19.08% 11.88% 13.24% 8.48% -0.015 -0.049 -0.006 0 1
TURISTHOTEL D.D. 16.02% 18.13% 27.68% 23.31% 6.25% -0.019 0.115 -0.017 0 1
VIDRALA, SA 13.70% 16.77% 13.37% 13.57% 10.26% -0.020 0.010 0.020 0 1
VIRBAC 18.47% 21.13% 19.25% 14.61% 13.72% -0.020 0.030 -0.020 0 1
VISCOFAN SA 19.46% 21.07% 18.49% 18.85% 6.77% -0.007 0.010 0.027 0 1
VITEC SOFTWARE GROUP AB (PUBL) 17.82% 20.58% 18.86% 28.80% 26.46% -0.022 0.097 0.177 0 1
ZYTRONIC PLC 10.32% 21.16% 16.40% 18.22% 6.33% -0.110 0.093 0.067 0 1
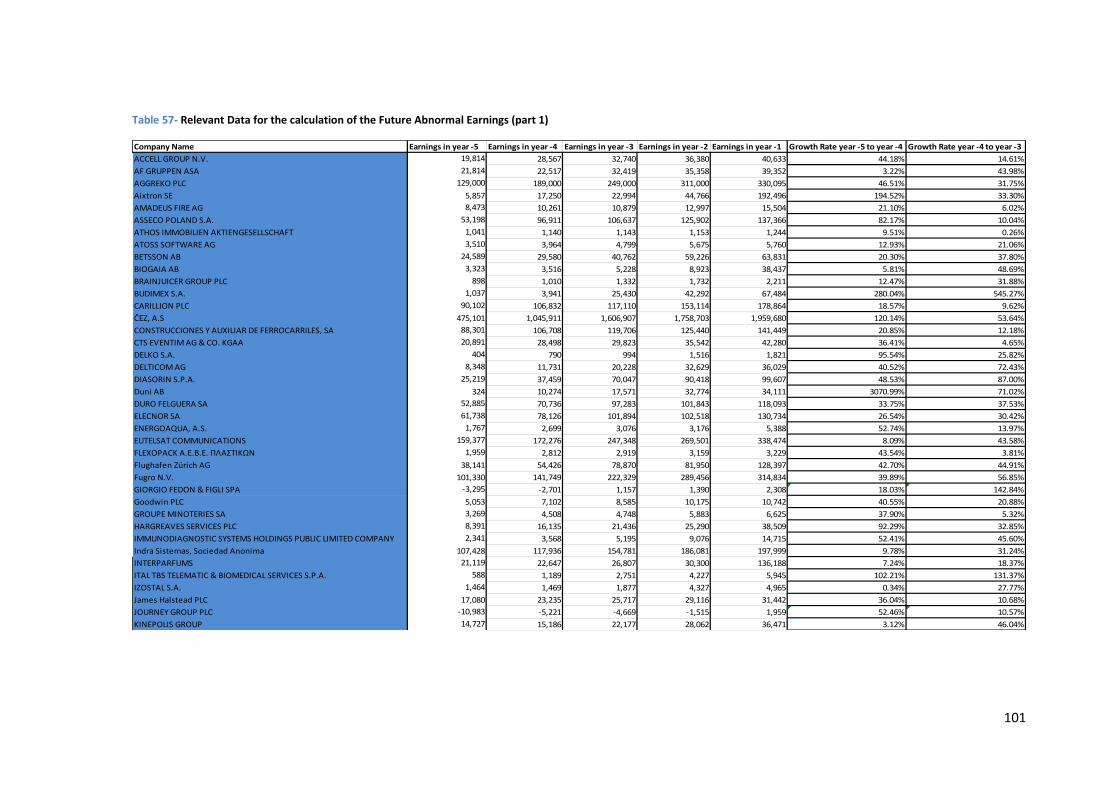
101
Table 57- Relevant Data for the calculation of the Future Abnormal Earnings (part 1)
Company Name Earnings in year -5 Earnings in year -4 Earnings in year -3 Earnings in year -2 Earnings in year -1 Growth Rate year -5 to year -4 Growth Rate year -4 to year -3
ACCELL GROUP N.V. 19,814 28,567 32,740 36,380 40,633 44.18% 14.61%
AF GRUPPEN ASA 21,814 22,517 32,419 35,358 39,352 3.22% 43.98%
AGGREKO PLC 129,000 189,000 249,000 311,000 330,095 46.51% 31.75%
Aixtron SE 5,857 17,250 22,994 44,766 192,496 194.52% 33.30%
AMADEUS FIRE AG 8,473 10,261 10,879 12,997 15,504 21.10% 6.02%
ASSECO POLAND S.A. 53,198 96,911 106,637 125,902 137,366 82.17% 10.04%
ATHOS IMMOBILIEN AKTIENGESELLSCHAFT 1,041 1,140 1,143 1,153 1,244 9.51% 0.26%
ATOSS SOFTWARE AG 3,510 3,964 4,799 5,675 5,760 12.93% 21.06%
BETSSON AB 24,589 29,580 40,762 59,226 63,831 20.30% 37.80%
BIOGAIA AB 3,323 3,516 5,228 8,923 38,437 5.81% 48.69%
BRAINJUICER GROUP PLC 898 1,010 1,332 1,732 2,211 12.47% 31.88%
BUDIMEX S.A. 1,037 3,941 25,430 42,292 67,484 280.04% 545.27%
CARILLION PLC 90,102 106,832 117,110 153,114 178,864 18.57% 9.62%
ČEZ, A.S 475,101 1,045,911 1,606,907 1,758,703 1,959,680 120.14% 53.64%
CONSTRUCCIONES Y AUXILIAR DE FERROCARRILES, SA 88,301 106,708 119,706 125,440 141,449 20.85% 12.18%
CTS EVENTIM AG & CO. KGAA 20,891 28,498 29,823 35,542 42,280 36.41% 4.65%
DELKO S.A. 404 790 994 1,516 1,821 95.54% 25.82%
DELTICOM AG 8,348 11,731 20,228 32,629 36,029 40.52% 72.43%
DIASORIN S.P.A. 25,219 37,459 70,047 90,418 99,607 48.53% 87.00%
Duni AB 324 10,274 17,571 32,774 34,111 3070.99% 71.02%
DURO FELGUERA SA 52,885 70,736 97,283 101,843 118,093 33.75% 37.53%
ELECNOR SA 61,738 78,126 101,894 102,518 130,734 26.54% 30.42%
ENERGOAQUA, A.S. 1,767 2,699 3,076 3,176 5,388 52.74% 13.97%
EUTELSAT COMMUNICATIONS 159,377 172,276 247,348 269,501 338,474 8.09% 43.58%
FLEXOPACK A.E.Β.Ε. ΠΛΑΣΤΙΚΩΝ 1,959 2,812 2,919 3,159 3,229 43.54% 3.81%
Flughafen Zürich AG 38,141 54,426 78,870 81,950 128,397 42.70% 44.91%
Fugro N.V. 101,330 141,749 222,329 289,456 314,834 39.89% 56.85%
GIORGIO FEDON & FIGLI SPA -3,295 -2,701 1,157 1,390 2,308 18.03% 142.84%
Goodwin PLC 5,053 7,102 8,585 10,175 10,742 40.55% 20.88%
GROUPE MINOTERIES SA 3,269 4,508 4,748 5,883 6,625 37.90% 5.32%
HARGREAVES SERVICES PLC 8,391 16,135 21,436 25,290 38,509 92.29% 32.85%
IMMUNODIAGNOSTIC SYSTEMS HOLDINGS PUBLIC LIMITED COMPANY 2,341 3,568 5,195 9,076 14,715 52.41% 45.60%
Indra Sistemas, Sociedad Anonima 107,428 117,936 154,781 186,081 197,999 9.78% 31.24%
INTERPARFUMS 21,119 22,647 26,807 30,300 136,188 7.24% 18.37%
ITAL TBS TELEMATIC & BIOMEDICAL SERVICES S.P.A. 588 1,189 2,751 4,227 5,945 102.21% 131.37%
IZOSTAL S.A. 1,464 1,469 1,877 4,327 4,965 0.34% 27.77%
James Halstead PLC 17,080 23,235 25,717 29,116 31,442 36.04% 10.68%
JOURNEY GROUP PLC -10,983 -5,221 -4,669 -1,515 1,959 52.46% 10.57%
KINEPOLIS GROUP 14,727 15,186 22,177 28,062 36,471 3.12% 46.04%
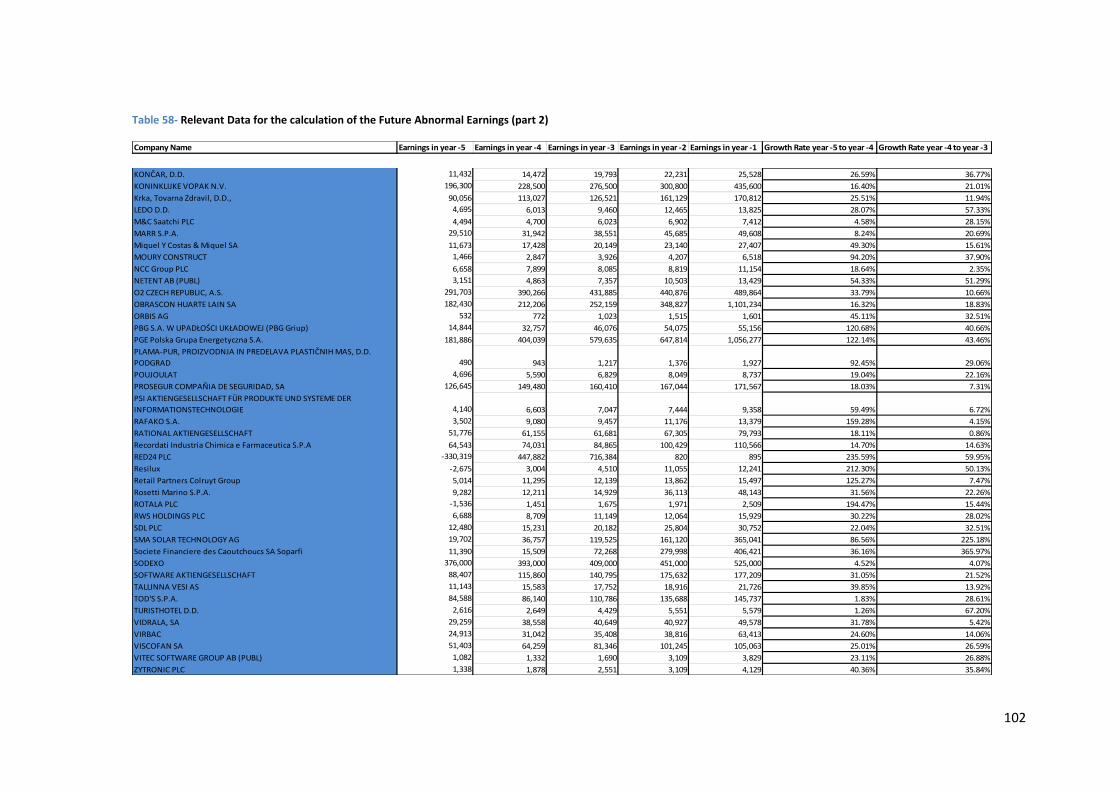
102
Table 58- Relevant Data for the calculation of the Future Abnormal Earnings (part 2)
Company Name Earnings in year -5 Earnings in year -4 Earnings in year -3 Earnings in year -2 Earnings in year -1 Growth Rate year -5 to year -4 Growth Rate year -4 to year -3
KONČAR, D.D. 11,432 14,472 19,793 22,231 25,528 26.59% 36.77%
KONINKLIJKE VOPAK N.V. 196,300 228,500 276,500 300,800 435,600 16.40% 21.01%
Krka, Tovarna Zdravil, D.D., 90,056 113,027 126,521 161,129 170,812 25.51% 11.94%
LEDO D.D. 4,695 6,013 9,460 12,465 13,825 28.07% 57.33%
M&C Saatchi PLC 4,494 4,700 6,023 6,902 7,412 4.58% 28.15%
MARR S.P.A. 29,510 31,942 38,551 45,685 49,608 8.24% 20.69%
Miquel Y Costas & Miquel SA 11,673 17,428 20,149 23,140 27,407 49.30% 15.61%
MOURY CONSTRUCT 1,466 2,847 3,926 4,207 6,518 94.20% 37.90%
NCC Group PLC 6,658 7,899 8,085 8,819 11,154 18.64% 2.35%
NETENT AB (PUBL) 3,151 4,863 7,357 10,503 13,429 54.33% 51.29%
O2 CZECH REPUBLIC, A.S. 291,703 390,266 431,885 440,876 489,864 33.79% 10.66%
OBRASCON HUARTE LAIN SA 182,430 212,206 252,159 348,827 1,101,234 16.32% 18.83%
ORBIS AG 532 772 1,023 1,515 1,601 45.11% 32.51%
PBG S.A. W UPADŁOŚCI UKŁADOWEJ (PBG Griup) 14,844 32,757 46,076 54,075 55,156 120.68% 40.66%
PGE Polska Grupa Energetyczna S.A. 181,886 404,039 579,635 647,814 1,056,277 122.14% 43.46%
PLAMA-PUR, PROIZVODNJA IN PREDELAVA PLASTIČNIH MAS, D.D.
PODGRAD 490 943 1,217 1,376 1,927 92.45% 29.06%
POUJOULAT 4,696 5,590 6,829 8,049 8,737 19.04% 22.16%
PROSEGUR COMPAÑIA DE SEGURIDAD, SA 126,645 149,480 160,410 167,044 171,567 18.03% 7.31%
PSI AKTIENGESELLSCHAFT FÜR PRODUKTE UND SYSTEME DER
INFORMATIONSTECHNOLOGIE 4,140 6,603 7,047 7,444 9,358 59.49% 6.72%
RAFAKO S.A. 3,502 9,080 9,457 11,176 13,379 159.28% 4.15%
RATIONAL AKTIENGESELLSCHAFT 51,776 61,155 61,681 67,305 79,793 18.11% 0.86%
Recordati Industria Chimica e Farmaceutica S.P.A 64,543 74,031 84,865 100,429 110,566 14.70% 14.63%
RED24 PLC -330,319 447,882 716,384 820 895 235.59% 59.95%
Resilux -2,675 3,004 4,510 11,055 12,241 212.30% 50.13%
Retail Partners Colruyt Group 5,014 11,295 12,139 13,862 15,497 125.27% 7.47%
Rosetti Marino S.P.A. 9,282 12,211 14,929 36,113 48,143 31.56% 22.26%
ROTALA PLC -1,536 1,451 1,675 1,971 2,509 194.47% 15.44%
RWS HOLDINGS PLC 6,688 8,709 11,149 12,064 15,929 30.22% 28.02%
SDL PLC 12,480 15,231 20,182 25,804 30,752 22.04% 32.51%
SMA SOLAR TECHNOLOGY AG 19,702 36,757 119,525 161,120 365,041 86.56% 225.18%
Societe Financiere des Caoutchoucs SA Soparfi 11,390 15,509 72,268 279,998 406,421 36.16% 365.97%
SODEXO 376,000 393,000 409,000 451,000 525,000 4.52% 4.07%
SOFTWARE AKTIENGESELLSCHAFT 88,407 115,860 140,795 175,632 177,209 31.05% 21.52%
TALLINNA VESI AS 11,143 15,583 17,752 18,916 21,726 39.85% 13.92%
TOD'S S.P.A. 84,588 86,140 110,786 135,688 145,737 1.83% 28.61%
TURISTHOTEL D.D. 2,616 2,649 4,429 5,551 5,579 1.26% 67.20%
VIDRALA, SA 29,259 38,558 40,649 40,927 49,578 31.78% 5.42%
VIRBAC 24,913 31,042 35,408 38,816 63,413 24.60% 14.06%
VISCOFAN SA 51,403 64,259 81,346 101,245 105,063 25.01% 26.59%
VITEC SOFTWARE GROUP AB (PUBL) 1,082 1,332 1,690 3,109 3,829 23.11% 26.88%
ZYTRONIC PLC 1,338 1,878 2,551 3,109 4,129 40.36% 35.84%
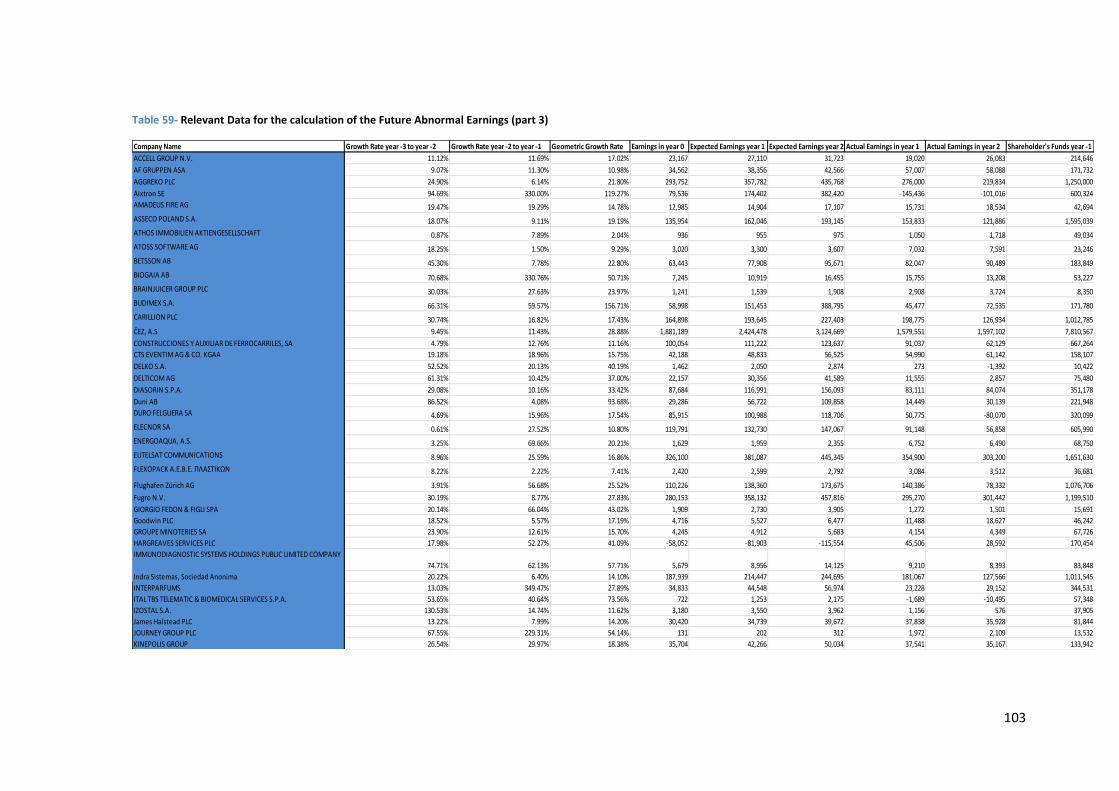
103
Table 59- Relevant Data for the calculation of the Future Abnormal Earnings (part 3)
Company Name Growth Rate year -3 to year -2 Growth Rate year -2 to year -1 Geometric Growth Rate Earnings in year 0 Expected Earnings year 1 Expected Earnings year 2 Actual Earnings in year 1 Actual Earnings in year 2 Shareholder's Funds year -1
ACCELL GROUP N.V. 11.12% 11.69% 17.02% 23,167 27,110 31,723 19,020 26,083 214,646
AF GRUPPEN ASA 9.07% 11.30% 10.98% 34,562 38,356 42,566 57,007 58,088 171,732
AGGREKO PLC 24.90% 6.14% 21.80% 293,752 357,782 435,768 276,000 219,834 1,250,000
Aixtron SE 94.69% 330.00% 119.27% 79,536 174,402 382,420 -145,436 -101,016 600,324
AMADEUS FIRE AG 19.47% 19.29% 14.78% 12,985 14,904 17,107 15,731 18,534 42,694
ASSECO POLAND S.A. 18.07% 9.11% 19.19% 135,954 162,046 193,145 153,833 121,886 1,595,039
ATHOS IMMOBILIEN AKTIENGESELLSCHAFT 0.87% 7.89% 2.04% 936 955 975 1,050 1,718 49,034
ATOSS SOFTWARE AG 18.25% 1.50% 9.29% 3,020 3,300 3,607 7,032 7,591 23,246
BETSSON AB 45.30% 7.78% 22.80% 63,443 77,908 95,671 82,047 90,489 183,849
BIOGAIA AB 70.68% 330.76% 50.71% 7,245 10,919 16,455 15,755 13,208 53,227
BRAINJUICER GROUP PLC 30.03% 27.63% 23.97% 1,241 1,539 1,908 2,908 3,724 8,350
BUDIMEX S.A. 66.31% 59.57% 156.71% 58,998 151,453 388,795 45,477 72,535 171,780
CARILLION PLC 30.74% 16.82% 17.43% 164,898 193,645 227,403 198,775 126,934 1,012,785
ČEZ, A.S 9.45% 11.43% 28.88% 1,881,189 2,424,478 3,124,669 1,579,551 1,597,102 7,810,567
CONSTRUCCIONES Y AUXILIAR DE FERROCARRILES, SA 4.79% 12.76% 11.16% 100,054 111,222 123,637 91,037 62,129 667,264
CTS EVENTIM AG & CO. KGAA 19.18% 18.96% 15.75% 42,188 48,833 56,525 54,990 61,142 158,107
DELKO S.A. 52.52% 20.13% 40.19% 1,462 2,050 2,874 273 -1,392 10,422
DELTICOM AG 61.31% 10.42% 37.00% 22,157 30,356 41,589 11,555 2,857 75,480
DIASORIN S.P.A. 29.08% 10.16% 33.42% 87,684 116,991 156,093 83,111 84,074 351,178
Duni AB 86.52% 4.08% 93.68% 29,286 56,722 109,858 14,449 30,139 221,948
DURO FELGUERA SA 4.69% 15.96% 17.54% 85,915 100,988 118,706 50,775 -80,070 320,099
ELECNOR SA 0.61% 27.52% 10.80% 119,791 132,730 147,067 91,148 56,858 605,990
ENERGOAQUA, A.S. 3.25% 69.66% 20.21% 1,629 1,959 2,355 6,752 6,490 68,750
EUTELSAT COMMUNICATIONS 8.96% 25.59% 16.86% 326,100 381,087 445,345 354,900 303,200 1,651,630
FLEXOPACK A.E.Β.Ε. ΠΛΑΣΤΙΚΩΝ 8.22% 2.22% 7.41% 2,420 2,599 2,792 3,084 3,512 36,681
Flughafen Zürich AG 3.91% 56.68% 25.52% 110,226 138,360 173,675 140,386 78,332 1,076,706
Fugro N.V. 30.19% 8.77% 27.83% 280,153 358,132 457,816 295,270 301,442 1,199,510
GIORGIO FEDON & FIGLI SPA 20.14% 66.04% 43.02% 1,909 2,730 3,905 1,272 1,501 15,691
Goodwin PLC 18.52% 5.57% 17.19% 4,716 5,527 6,477 11,488 18,627 46,242
GROUPE MINOTERIES SA 23.90% 12.61% 15.70% 4,245 4,912 5,683 4,154 4,349 67,726
HARGREAVES SERVICES PLC 17.98% 52.27% 41.09% -58,052 -81,903 -115,554 45,506 28,592 170,454
IMMUNODIAGNOSTIC SYSTEMS HOLDINGS PUBLIC LIMITED COMPANY
74.71% 62.13% 57.71% 5,679 8,956 14,125 9,210 8,393 83,848
Indra Sistemas, Sociedad Anonima 20.22% 6.40% 14.10% 187,939 214,447 244,695 181,067 127,566 1,011,545
INTERPARFUMS 13.03% 349.47% 27.89% 34,833 44,548 56,974 23,228 29,152 344,531
ITAL TBS TELEMATIC & BIOMEDICAL SERVICES S.P.A. 53.65% 40.64% 73.56% 722 1,253 2,175 -1,689 -10,495 57,348
IZOSTAL S.A. 130.53% 14.74% 11.62% 3,180 3,550 3,962 1,156 576 37,905
James Halstead PLC 13.22% 7.99% 14.20% 30,420 34,739 39,672 37,838 35,928 81,844
JOURNEY GROUP PLC 67.55% 229.31% 54.14% 131 202 312 1,972 2,109 13,532
KINEPOLIS GROUP 26.54% 29.97% 18.38% 35,704 42,266 50,034 37,541 35,167 133,942
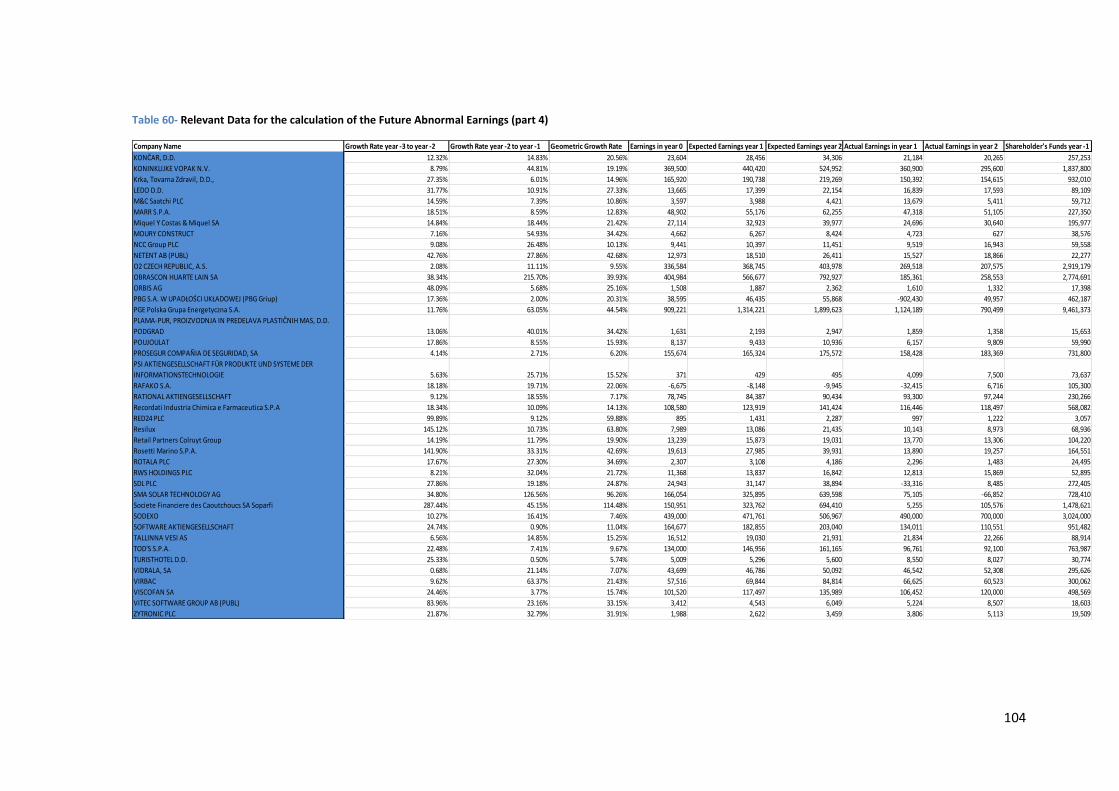
104
Table 60- Relevant Data for the calculation of the Future Abnormal Earnings (part 4)
Company Name Growth Rate year -3 to year -2 Growth Rate year -2 to year -1 Geometric Growth Rate Earnings in year 0 Expected Earnings year 1 Expected Earnings year 2 Actual Earnings in year 1 Actual Earnings in year 2 Shareholder's Funds year -1
KONČAR, D.D. 12.32% 14.83% 20.56% 23,604 28,456 34,306 21,184 20,265 257,253
KONINKLIJKE VOPAK N.V. 8.79% 44.81% 19.19% 369,500 440,420 524,952 360,900 295,600 1,837,800
Krka, Tovarna Zdravil, D.D., 27.35% 6.01% 14.96% 165,920 190,738 219,269 150,392 154,615 932,010
LEDO D.D. 31.77% 10.91% 27.33% 13,665 17,399 22,154 16,839 17,593 89,109
M&C Saatchi PLC 14.59% 7.39% 10.86% 3,597 3,988 4,421 13,679 5,411 59,712
MARR S.P.A. 18.51% 8.59% 12.83% 48,902 55,176 62,255 47,318 51,105 227,350
Miquel Y Costas & Miquel SA 14.84% 18.44% 21.42% 27,114 32,923 39,977 24,696 30,640 195,977
MOURY CONSTRUCT 7.16% 54.93% 34.42% 4,662 6,267 8,424 4,723 627 38,576
NCC Group PLC 9.08% 26.48% 10.13% 9,441 10,397 11,451 9,519 16,943 59,558
NETENT AB (PUBL) 42.76% 27.86% 42.68% 12,973 18,510 26,411 15,527 18,866 22,277
O2 CZECH REPUBLIC, A.S. 2.08% 11.11% 9.55% 336,584 368,745 403,978 269,518 207,575 2,919,179
OBRASCON HUARTE LAIN SA 38.34% 215.70% 39.93% 404,984 566,677 792,927 185,361 258,553 2,774,691
ORBIS AG 48.09% 5.68% 25.16% 1,508 1,887 2,362 1,610 1,332 17,398
PBG S.A. W UPADŁOŚCI UKŁADOWEJ (PBG Griup) 17.36% 2.00% 20.31% 38,595 46,435 55,868 -902,430 49,957 462,187
PGE Polska Grupa Energetyczna S.A. 11.76% 63.05% 44.54% 909,221 1,314,221 1,899,623 1,124,189 790,499 9,461,373
PLAMA-PUR, PROIZVODNJA IN PREDELAVA PLASTIČNIH MAS, D.D.
PODGRAD 13.06% 40.01% 34.42% 1,631 2,193 2,947 1,859 1,358 15,653
POUJOULAT 17.86% 8.55% 15.93% 8,137 9,433 10,936 6,157 9,809 59,990
PROSEGUR COMPAÑIA DE SEGURIDAD, SA 4.14% 2.71% 6.20% 155,674 165,324 175,572 158,428 183,369 731,800
PSI AKTIENGESELLSCHAFT FÜR PRODUKTE UND SYSTEME DER
INFORMATIONSTECHNOLOGIE 5.63% 25.71% 15.52% 371 429 495 4,099 7,500 73,637
RAFAKO S.A. 18.18% 19.71% 22.06% -6,675 -8,148 -9,945 -32,415 6,716 105,300
RATIONAL AKTIENGESELLSCHAFT 9.12% 18.55% 7.17% 78,745 84,387 90,434 93,300 97,244 230,266
Recordati Industria Chimica e Farmaceutica S.P.A 18.34% 10.09% 14.13% 108,580 123,919 141,424 116,446 118,497 568,082
RED24 PLC 99.89% 9.12% 59.88% 895 1,431 2,287 997 1,222 3,057
Resilux 145.12% 10.73% 63.80% 7,989 13,086 21,435 10,143 8,973 68,936
Retail Partners Colruyt Group 14.19% 11.79% 19.90% 13,239 15,873 19,031 13,770 13,306 104,220
Rosetti Marino S.P.A. 141.90% 33.31% 42.69% 19,613 27,985 39,931 13,890 19,257 164,551
ROTALA PLC 17.67% 27.30% 34.69% 2,307 3,108 4,186 2,296 1,483 24,495
RWS HOLDINGS PLC 8.21% 32.04% 21.72% 11,368 13,837 16,842 12,813 15,869 52,895
SDL PLC 27.86% 19.18% 24.87% 24,943 31,147 38,894 -33,316 8,485 272,405
SMA SOLAR TECHNOLOGY AG 34.80% 126.56% 96.26% 166,054 325,895 639,598 75,105 -66,852 728,410
Societe Financiere des Caoutchoucs SA Soparfi 287.44% 45.15% 114.48% 150,951 323,762 694,410 5,255 105,576 1,478,621
SODEXO 10.27% 16.41% 7.46% 439,000 471,761 506,967 490,000 700,000 3,024,000
SOFTWARE AKTIENGESELLSCHAFT 24.74% 0.90% 11.04% 164,677 182,855 203,040 134,011 110,551 951,482
TALLINNA VESI AS 6.56% 14.85% 15.25% 16,512 19,030 21,931 21,834 22,266 88,914
TOD'S S.P.A. 22.48% 7.41% 9.67% 134,000 146,956 161,165 96,761 92,100 763,987
TURISTHOTEL D.D. 25.33% 0.50% 5.74% 5,009 5,296 5,600 8,550 8,027 30,774
VIDRALA, SA 0.68% 21.14% 7.07% 43,699 46,786 50,092 46,542 52,308 295,626
VIRBAC 9.62% 63.37% 21.43% 57,516 69,844 84,814 66,625 60,523 300,062
VISCOFAN SA 24.46% 3.77% 15.74% 101,520 117,497 135,989 106,452 120,000 498,569
VITEC SOFTWARE GROUP AB (PUBL) 83.96% 23.16% 33.15% 3,412 4,543 6,049 5,224 8,507 18,603
ZYTRONIC PLC 21.87% 32.79% 31.91% 1,988 2,622 3,459 3,806 5,113 19,509
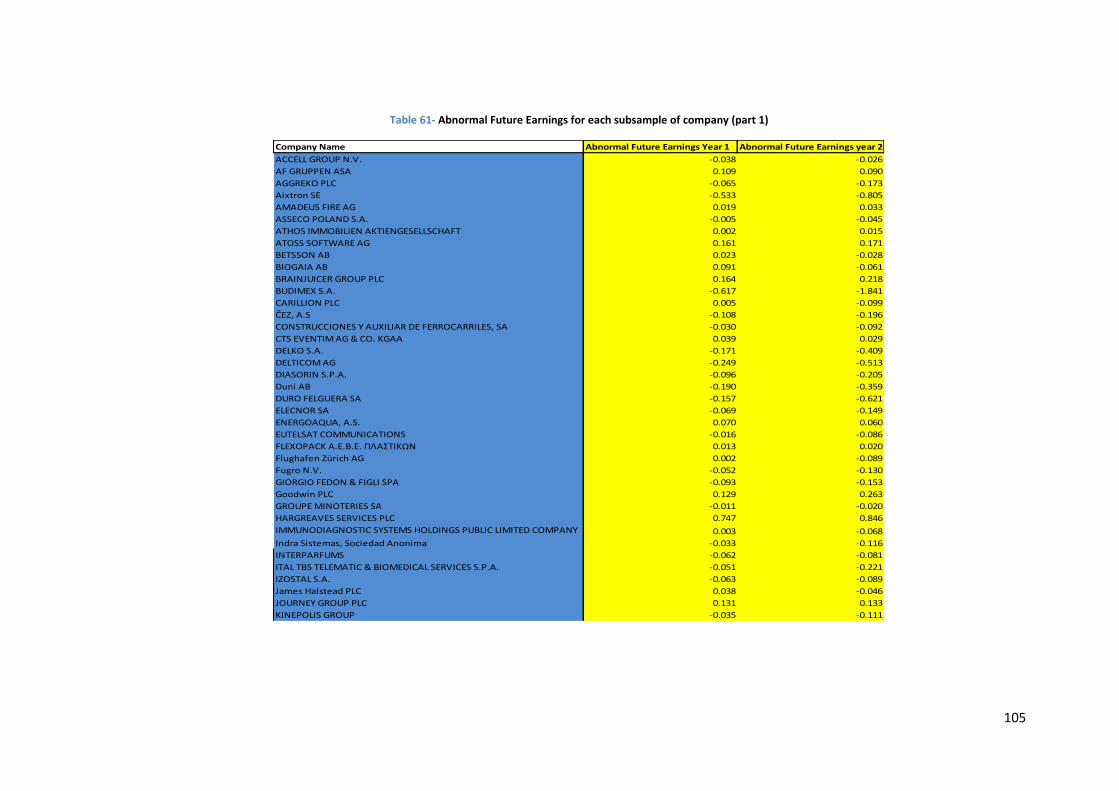
105
Table 61- Abnormal Future Earnings for each subsample of company (part 1)
Company Name Abnormal Future Earnings Year 1 Abnormal Future Earnings year 2
ACCELL GROUP N.V. -0.038 -0.026
AF GRUPPEN ASA 0.109 0.090
AGGREKO PLC -0.065 -0.173
Aixtron SE -0.533 -0.805
AMADEUS FIRE AG 0.019 0.033
ASSECO POLAND S.A. -0.005 -0.045
ATHOS IMMOBILIEN AKTIENGESELLSCHAFT 0.002 0.015
ATOSS SOFTWARE AG 0.161 0.171
BETSSON AB 0.023 -0.028
BIOGAIA AB 0.091 -0.061
BRAINJUICER GROUP PLC 0.164 0.218
BUDIMEX S.A. -0.617 -1.841
CARILLION PLC 0.005 -0.099
ČEZ, A.S -0.108 -0.196
CONSTRUCCIONES Y AUXILIAR DE FERROCARRILES, SA -0.030 -0.092
CTS EVENTIM AG & CO. KGAA 0.039 0.029
DELKO S.A. -0.171 -0.409
DELTICOM AG -0.249 -0.513
DIASORIN S.P.A. -0.096 -0.205
Duni AB -0.190 -0.359
DURO FELGUERA SA -0.157 -0.621
ELECNOR SA -0.069 -0.149
ENERGOAQUA, A.S. 0.070 0.060
EUTELSAT COMMUNICATIONS -0.016 -0.086
FLEXOPACK A.E.Β.Ε. ΠΛΑΣΤΙΚΩΝ 0.013 0.020
Flughafen Zürich AG 0.002 -0.089
Fugro N.V. -0.052 -0.130
GIORGIO FEDON & FIGLI SPA -0.093 -0.153
Goodwin PLC 0.129 0.263
GROUPE MINOTERIES SA -0.011 -0.020
HARGREAVES SERVICES PLC 0.747 0.846
IMMUNODIAGNOSTIC SYSTEMS HOLDINGS PUBLIC LIMITED COMPANY 0.003 -0.068
Indra Sistemas, Sociedad Anonima -0.033 -0.116
INTERPARFUMS -0.062 -0.081
ITAL TBS TELEMATIC & BIOMEDICAL SERVICES S.P.A. -0.051 -0.221
IZOSTAL S.A. -0.063 -0.089
James Halstead PLC 0.038 -0.046
JOURNEY GROUP PLC 0.131 0.133
KINEPOLIS GROUP -0.035 -0.111
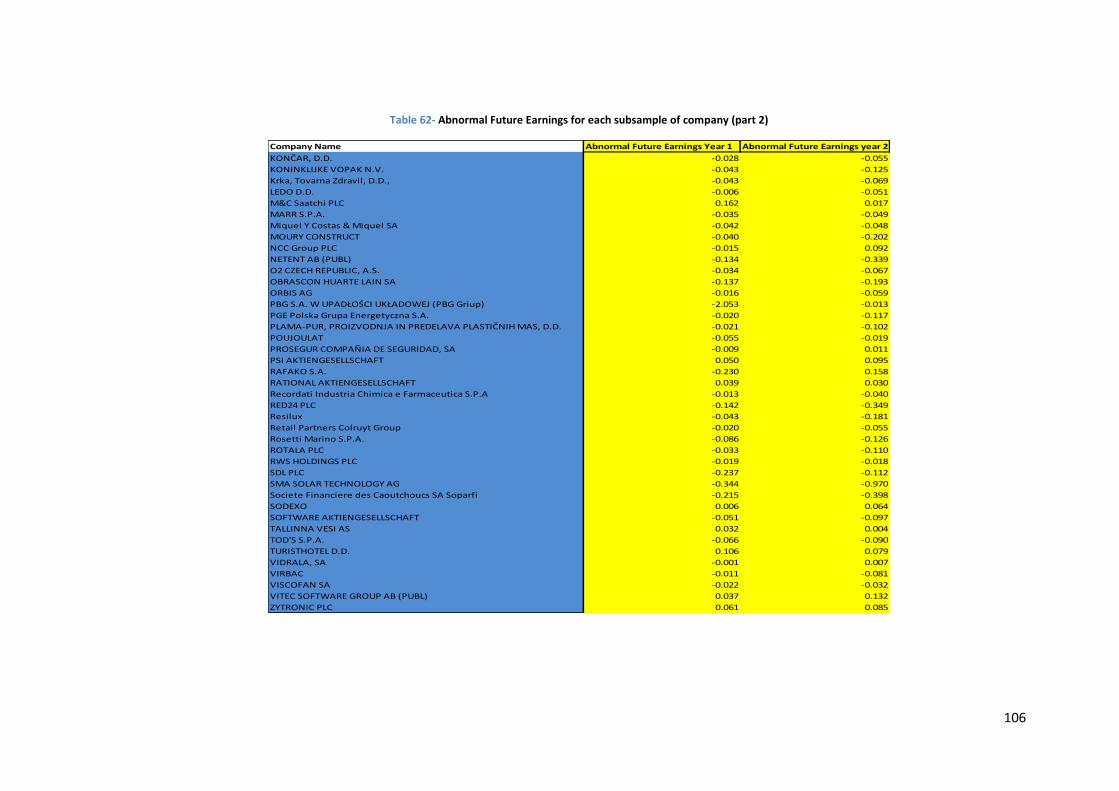
106
Table 62- Abnormal Future Earnings for each subsample of company (part 2)
Company Name Abnormal Future Earnings Year 1 Abnormal Future Earnings year 2
KONČAR, D.D. -0.028 -0.055
KONINKLIJKE VOPAK N.V. -0.043 -0.125
Krka, Tovarna Zdravil, D.D., -0.043 -0.069
LEDO D.D. -0.006 -0.051
M&C Saatchi PLC 0.162 0.017
MARR S.P.A. -0.035 -0.049
Miquel Y Costas & Miquel SA -0.042 -0.048
MOURY CONSTRUCT -0.040 -0.202
NCC Group PLC -0.015 0.092
NETENT AB (PUBL) -0.134 -0.339
O2 CZECH REPUBLIC, A.S. -0.034 -0.067
OBRASCON HUARTE LAIN SA -0.137 -0.193
ORBIS AG -0.016 -0.059
PBG S.A. W UPADŁOŚCI UKŁADOWEJ (PBG Griup) -2.053 -0.013
PGE Polska Grupa Energetyczna S.A. -0.020 -0.117
PLAMA-PUR, PROIZVODNJA IN PREDELAVA PLASTIČNIH MAS, D.D. -0.021 -0.102
POUJOULAT -0.055 -0.019
PROSEGUR COMPAÑIA DE SEGURIDAD, SA -0.009 0.011
PSI AKTIENGESELLSCHAFT 0.050 0.095
RAFAKO S.A. -0.230 0.158
RATIONAL AKTIENGESELLSCHAFT 0.039 0.030
Recordati Industria Chimica e Farmaceutica S.P.A -0.013 -0.040
RED24 PLC -0.142 -0.349
Resilux -0.043 -0.181
Retail Partners Colruyt Group -0.020 -0.055
Rosetti Marino S.P.A. -0.086 -0.126
ROTALA PLC -0.033 -0.110
RWS HOLDINGS PLC -0.019 -0.018
SDL PLC -0.237 -0.112
SMA SOLAR TECHNOLOGY AG -0.344 -0.970
Societe Financiere des Caoutchoucs SA Soparfi -0.215 -0.398
SODEXO 0.006 0.064
SOFTWARE AKTIENGESELLSCHAFT -0.051 -0.097
TALLINNA VESI AS 0.032 0.004
TOD'S S.P.A. -0.066 -0.090
TURISTHOTEL D.D. 0.106 0.079
VIDRALA, SA -0.001 0.007
VIRBAC -0.011 -0.081
VISCOFAN SA -0.022 -0.032
VITEC SOFTWARE GROUP AB (PUBL) 0.037 0.132
ZYTRONIC PLC 0.061 0.085
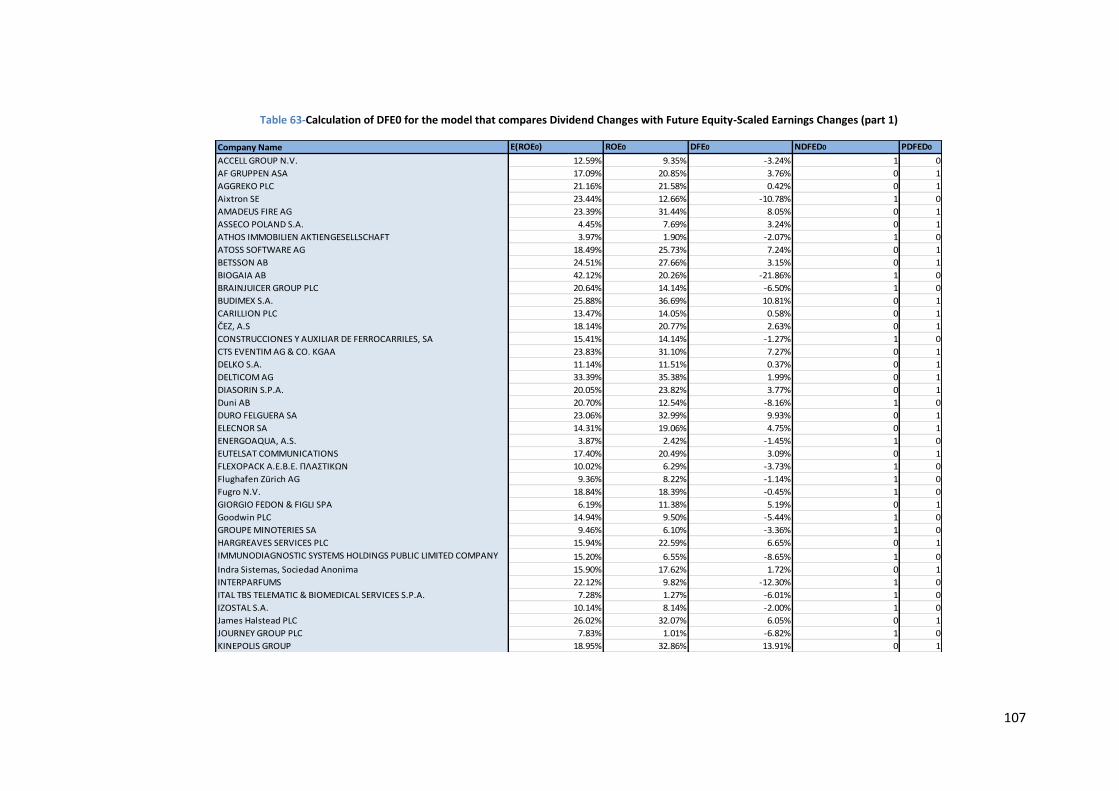
107
Table 63-Calculation of DFE0 for the model that compares Dividend Changes with Future Equity-Scaled Earnings Changes (part 1)
Company Name E(ROE0) ROE0 DFE0 NDFED0 PDFED0
ACCELL GROUP N.V. 12.59% 9.35% -3.24% 1 0
AF GRUPPEN ASA 17.09% 20.85% 3.76% 0 1
AGGREKO PLC 21.16% 21.58% 0.42% 0 1
Aixtron SE 23.44% 12.66% -10.78% 1 0
AMADEUS FIRE AG 23.39% 31.44% 8.05% 0 1
ASSECO POLAND S.A. 4.45% 7.69% 3.24% 0 1
ATHOS IMMOBILIEN AKTIENGESELLSCHAFT 3.97% 1.90% -2.07% 1 0
ATOSS SOFTWARE AG 18.49% 25.73% 7.24% 0 1
BETSSON AB 24.51% 27.66% 3.15% 0 1
BIOGAIA AB 42.12% 20.26% -21.86% 1 0
BRAINJUICER GROUP PLC 20.64% 14.14% -6.50% 1 0
BUDIMEX S.A. 25.88% 36.69% 10.81% 0 1
CARILLION PLC 13.47% 14.05% 0.58% 0 1
ČEZ, A.S 18.14% 20.77% 2.63% 0 1
CONSTRUCCIONES Y AUXILIAR DE FERROCARRILES, SA 15.41% 14.14% -1.27% 1 0
CTS EVENTIM AG & CO. KGAA 23.83% 31.10% 7.27% 0 1
DELKO S.A. 11.14% 11.51% 0.37% 0 1
DELTICOM AG 33.39% 35.38% 1.99% 0 1
DIASORIN S.P.A. 20.05% 23.82% 3.77% 0 1
Duni AB 20.70% 12.54% -8.16% 1 0
DURO FELGUERA SA 23.06% 32.99% 9.93% 0 1
ELECNOR SA 14.31% 19.06% 4.75% 0 1
ENERGOAQUA, A.S. 3.87% 2.42% -1.45% 1 0
EUTELSAT COMMUNICATIONS 17.40% 20.49% 3.09% 0 1
FLEXOPACK A.E.Β.Ε. ΠΛΑΣΤΙΚΩΝ 10.02% 6.29% -3.73% 1 0
Flughafen Zürich AG 9.36% 8.22% -1.14% 1 0
Fugro N.V. 18.84% 18.39% -0.45% 1 0
GIORGIO FEDON & FIGLI SPA 6.19% 11.38% 5.19% 0 1
Goodwin PLC 14.94% 9.50% -5.44% 1 0
GROUPE MINOTERIES SA 9.46% 6.10% -3.36% 1 0
HARGREAVES SERVICES PLC 15.94% 22.59% 6.65% 0 1
IMMUNODIAGNOSTIC SYSTEMS HOLDINGS PUBLIC LIMITED COMPANY 15.20% 6.55% -8.65% 1 0
Indra Sistemas, Sociedad Anonima 15.90% 17.62% 1.72% 0 1
INTERPARFUMS 22.12% 9.82% -12.30% 1 0
ITAL TBS TELEMATIC & BIOMEDICAL SERVICES S.P.A. 7.28% 1.27% -6.01% 1 0
IZOSTAL S.A. 10.14% 8.14% -2.00% 1 0
James Halstead PLC 26.02% 32.07% 6.05% 0 1
JOURNEY GROUP PLC 7.83% 1.01% -6.82% 1 0
KINEPOLIS GROUP 18.95% 32.86% 13.91% 0 1
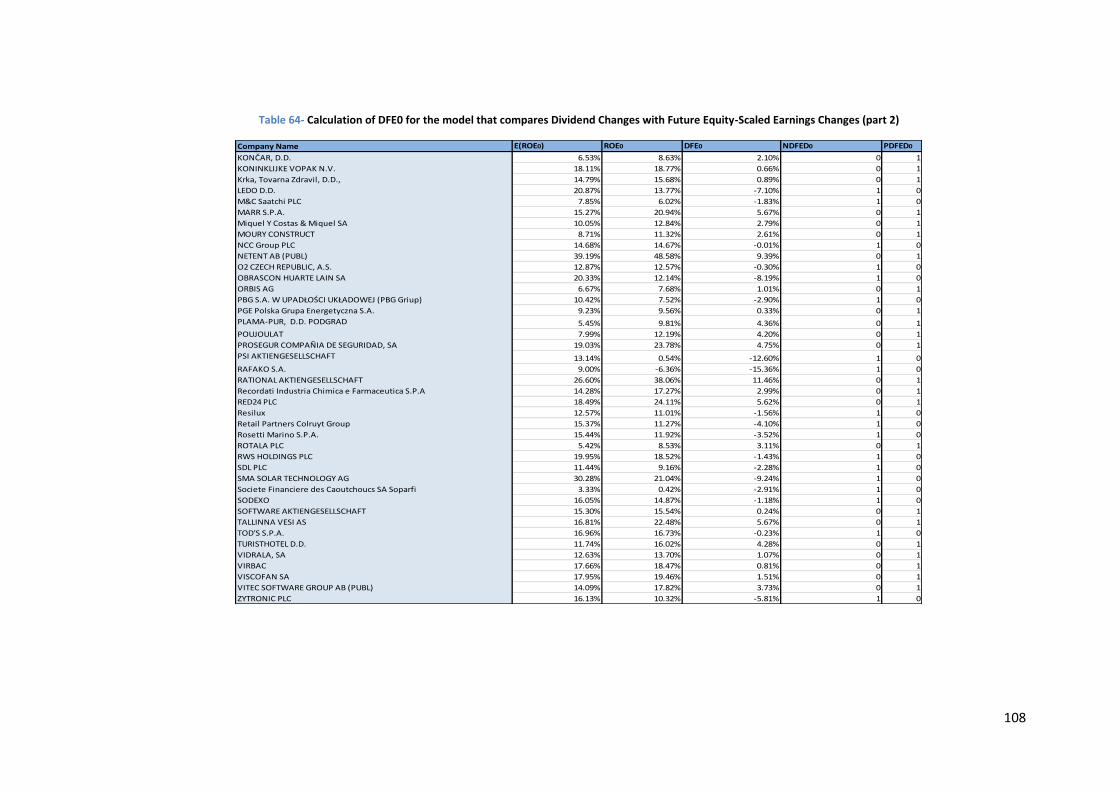
108
Table 64- Calculation of DFE0 for the model that compares Dividend Changes with Future Equity-Scaled Earnings Changes (part 2)
Company Name E(ROE0) ROE0 DFE0 NDFED0 PDFED0
KONČAR, D.D. 6.53% 8.63% 2.10% 0 1
KONINKLIJKE VOPAK N.V. 18.11% 18.77% 0.66% 0 1
Krka, Tovarna Zdravil, D.D., 14.79% 15.68% 0.89% 0 1
LEDO D.D. 20.87% 13.77% -7.10% 1 0
M&C Saatchi PLC 7.85% 6.02% -1.83% 1 0
MARR S.P.A. 15.27% 20.94% 5.67% 0 1
Miquel Y Costas & Miquel SA 10.05% 12.84% 2.79% 0 1
MOURY CONSTRUCT 8.71% 11.32% 2.61% 0 1
NCC Group PLC 14.68% 14.67% -0.01% 1 0
NETENT AB (PUBL) 39.19% 48.58% 9.39% 0 1
O2 CZECH REPUBLIC, A.S. 12.87% 12.57% -0.30% 1 0
OBRASCON HUARTE LAIN SA 20.33% 12.14% -8.19% 1 0
ORBIS AG 6.67% 7.68% 1.01% 0 1
PBG S.A. W UPADŁOŚCI UKŁADOWEJ (PBG Griup) 10.42% 7.52% -2.90% 1 0
PGE Polska Grupa Energetyczna S.A. 9.23% 9.56% 0.33% 0 1
PLAMA-PUR, D.D. PODGRAD 5.45% 9.81% 4.36% 0 1
POUJOULAT 7.99% 12.19% 4.20% 0 1
PROSEGUR COMPAÑIA DE SEGURIDAD, SA 19.03% 23.78% 4.75% 0 1
PSI AKTIENGESELLSCHAFT 13.14% 0.54% -12.60% 1 0
RAFAKO S.A. 9.00% -6.36% -15.36% 1 0
RATIONAL AKTIENGESELLSCHAFT 26.60% 38.06% 11.46% 0 1
Recordati Industria Chimica e Farmaceutica S.P.A 14.28% 17.27% 2.99% 0 1
RED24 PLC 18.49% 24.11% 5.62% 0 1
Resilux 12.57% 11.01% -1.56% 1 0
Retail Partners Colruyt Group 15.37% 11.27% -4.10% 1 0
Rosetti Marino S.P.A. 15.44% 11.92% -3.52% 1 0
ROTALA PLC 5.42% 8.53% 3.11% 0 1
RWS HOLDINGS PLC 19.95% 18.52% -1.43% 1 0
SDL PLC 11.44% 9.16% -2.28% 1 0
SMA SOLAR TECHNOLOGY AG 30.28% 21.04% -9.24% 1 0
Societe Financiere des Caoutchoucs SA Soparfi 3.33% 0.42% -2.91% 1 0
SODEXO 16.05% 14.87% -1.18% 1 0
SOFTWARE AKTIENGESELLSCHAFT 15.30% 15.54% 0.24% 0 1
TALLINNA VESI AS 16.81% 22.48% 5.67% 0 1
TOD'S S.P.A. 16.96% 16.73% -0.23% 1 0
TURISTHOTEL D.D. 11.74% 16.02% 4.28% 0 1
VIDRALA, SA 12.63% 13.70% 1.07% 0 1
VIRBAC 17.66% 18.47% 0.81% 0 1
VISCOFAN SA 17.95% 19.46% 1.51% 0 1
VITEC SOFTWARE GROUP AB (PUBL) 14.09% 17.82% 3.73% 0 1
ZYTRONIC PLC 16.13% 10.32% -5.81% 1 0
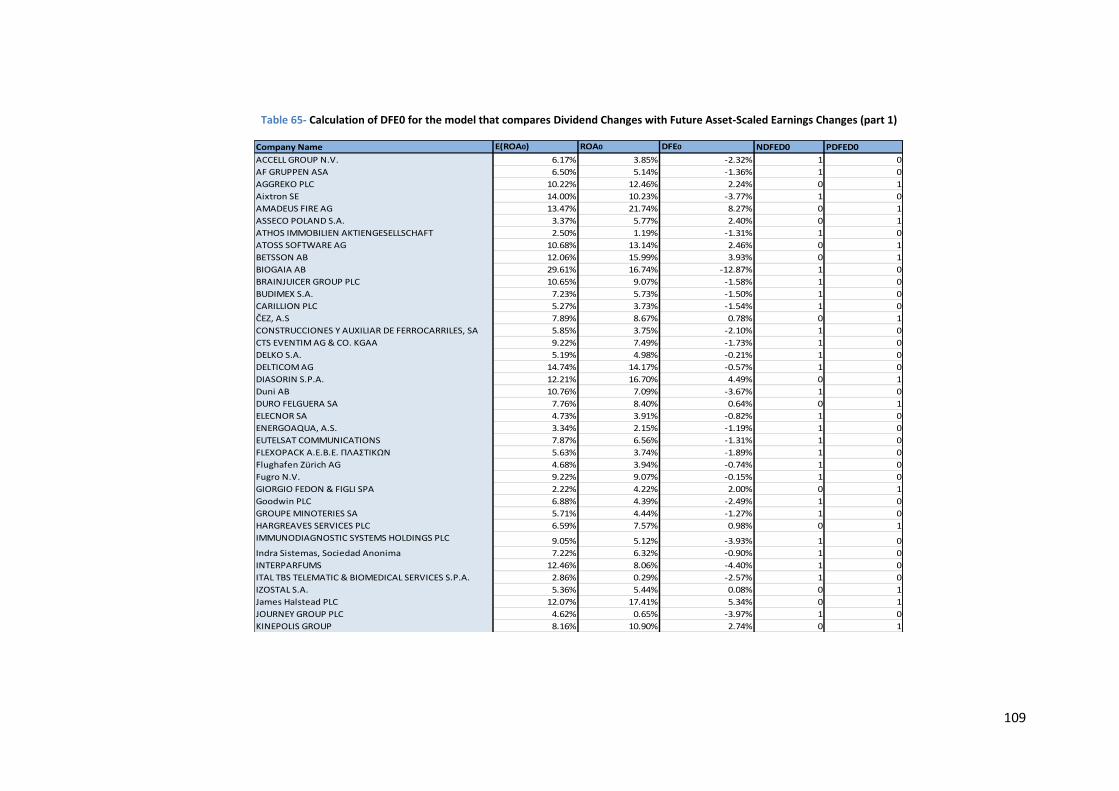
109
Table 65- Calculation of DFE0 for the model that compares Dividend Changes with Future Asset-Scaled Earnings Changes (part 1)
Company Name E(ROA0) ROA0 DFE0 NDFED0 PDFED0
ACCELL GROUP N.V. 6.17% 3.85% -2.32% 1 0
AF GRUPPEN ASA 6.50% 5.14% -1.36% 1 0
AGGREKO PLC 10.22% 12.46% 2.24% 0 1
Aixtron SE 14.00% 10.23% -3.77% 1 0
AMADEUS FIRE AG 13.47% 21.74% 8.27% 0 1
ASSECO POLAND S.A. 3.37% 5.77% 2.40% 0 1
ATHOS IMMOBILIEN AKTIENGESELLSCHAFT 2.50% 1.19% -1.31% 1 0
ATOSS SOFTWARE AG 10.68% 13.14% 2.46% 0 1
BETSSON AB 12.06% 15.99% 3.93% 0 1
BIOGAIA AB 29.61% 16.74% -12.87% 1 0
BRAINJUICER GROUP PLC 10.65% 9.07% -1.58% 1 0
BUDIMEX S.A. 7.23% 5.73% -1.50% 1 0
CARILLION PLC 5.27% 3.73% -1.54% 1 0
ČEZ, A.S 7.89% 8.67% 0.78% 0 1
CONSTRUCCIONES Y AUXILIAR DE FERROCARRILES, SA 5.85% 3.75% -2.10% 1 0
CTS EVENTIM AG & CO. KGAA 9.22% 7.49% -1.73% 1 0
DELKO S.A. 5.19% 4.98% -0.21% 1 0
DELTICOM AG 14.74% 14.17% -0.57% 1 0
DIASORIN S.P.A. 12.21% 16.70% 4.49% 0 1
Duni AB 10.76% 7.09% -3.67% 1 0
DURO FELGUERA SA 7.76% 8.40% 0.64% 0 1
ELECNOR SA 4.73% 3.91% -0.82% 1 0
ENERGOAQUA, A.S. 3.34% 2.15% -1.19% 1 0
EUTELSAT COMMUNICATIONS 7.87% 6.56% -1.31% 1 0
FLEXOPACK A.E.Β.Ε. ΠΛΑΣΤΙΚΩΝ 5.63% 3.74% -1.89% 1 0
Flughafen Zürich AG 4.68% 3.94% -0.74% 1 0
Fugro N.V. 9.22% 9.07% -0.15% 1 0
GIORGIO FEDON & FIGLI SPA 2.22% 4.22% 2.00% 0 1
Goodwin PLC 6.88% 4.39% -2.49% 1 0
GROUPE MINOTERIES SA 5.71% 4.44% -1.27% 1 0
HARGREAVES SERVICES PLC 6.59% 7.57% 0.98% 0 1
IMMUNODIAGNOSTIC SYSTEMS HOLDINGS PLC 9.05% 5.12% -3.93% 1 0
Indra Sistemas, Sociedad Anonima 7.22% 6.32% -0.90% 1 0
INTERPARFUMS 12.46% 8.06% -4.40% 1 0
ITAL TBS TELEMATIC & BIOMEDICAL SERVICES S.P.A. 2.86% 0.29% -2.57% 1 0
IZOSTAL S.A. 5.36% 5.44% 0.08% 0 1
James Halstead PLC 12.07% 17.41% 5.34% 0 1
JOURNEY GROUP PLC 4.62% 0.65% -3.97% 1 0
KINEPOLIS GROUP 8.16% 10.90% 2.74% 0 1
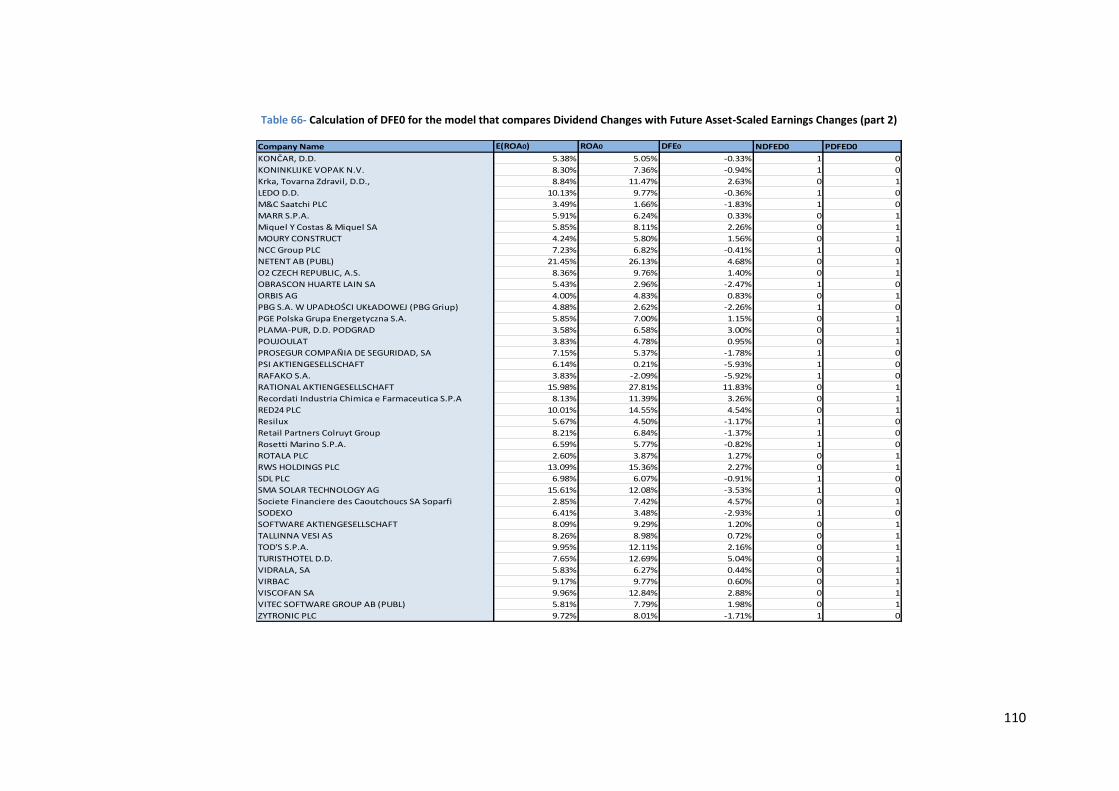
110
Table 66- Calculation of DFE0 for the model that compares Dividend Changes with Future Asset-Scaled Earnings Changes (part 2)
Company Name E(ROA0) ROA0 DFE0 NDFED0 PDFED0
KONČAR, D.D. 5.38% 5.05% -0.33% 1 0
KONINKLIJKE VOPAK N.V. 8.30% 7.36% -0.94% 1 0
Krka, Tovarna Zdravil, D.D., 8.84% 11.47% 2.63% 0 1
LEDO D.D. 10.13% 9.77% -0.36% 1 0
M&C Saatchi PLC 3.49% 1.66% -1.83% 1 0
MARR S.P.A. 5.91% 6.24% 0.33% 0 1
Miquel Y Costas & Miquel SA 5.85% 8.11% 2.26% 0 1
MOURY CONSTRUCT 4.24% 5.80% 1.56% 0 1
NCC Group PLC 7.23% 6.82% -0.41% 1 0
NETENT AB (PUBL) 21.45% 26.13% 4.68% 0 1
O2 CZECH REPUBLIC, A.S. 8.36% 9.76% 1.40% 0 1
OBRASCON HUARTE LAIN SA 5.43% 2.96% -2.47% 1 0
ORBIS AG 4.00% 4.83% 0.83% 0 1
PBG S.A. W UPADŁOŚCI UKŁADOWEJ (PBG Griup) 4.88% 2.62% -2.26% 1 0
PGE Polska Grupa Energetyczna S.A. 5.85% 7.00% 1.15% 0 1
PLAMA-PUR, D.D. PODGRAD 3.58% 6.58% 3.00% 0 1
POUJOULAT 3.83% 4.78% 0.95% 0 1
PROSEGUR COMPAÑIA DE SEGURIDAD, SA 7.15% 5.37% -1.78% 1 0
PSI AKTIENGESELLSCHAFT 6.14% 0.21% -5.93% 1 0
RAFAKO S.A. 3.83% -2.09% -5.92% 1 0
RATIONAL AKTIENGESELLSCHAFT 15.98% 27.81% 11.83% 0 1
Recordati Industria Chimica e Farmaceutica S.P.A 8.13% 11.39% 3.26% 0 1
RED24 PLC 10.01% 14.55% 4.54% 0 1
Resilux 5.67% 4.50% -1.17% 1 0
Retail Partners Colruyt Group 8.21% 6.84% -1.37% 1 0
Rosetti Marino S.P.A. 6.59% 5.77% -0.82% 1 0
ROTALA PLC 2.60% 3.87% 1.27% 0 1
RWS HOLDINGS PLC 13.09% 15.36% 2.27% 0 1
SDL PLC 6.98% 6.07% -0.91% 1 0
SMA SOLAR TECHNOLOGY AG 15.61% 12.08% -3.53% 1 0
Societe Financiere des Caoutchoucs SA Soparfi 2.85% 7.42% 4.57% 0 1
SODEXO 6.41% 3.48% -2.93% 1 0
SOFTWARE AKTIENGESELLSCHAFT 8.09% 9.29% 1.20% 0 1
TALLINNA VESI AS 8.26% 8.98% 0.72% 0 1
TOD'S S.P.A. 9.95% 12.11% 2.16% 0 1
TURISTHOTEL D.D. 7.65% 12.69% 5.04% 0 1
VIDRALA, SA 5.83% 6.27% 0.44% 0 1
VIRBAC 9.17% 9.77% 0.60% 0 1
VISCOFAN SA 9.96% 12.84% 2.88% 0 1
VITEC SOFTWARE GROUP AB (PUBL) 5.81% 7.79% 1.98% 0 1
ZYTRONIC PLC 9.72% 8.01% -1.71% 1 0
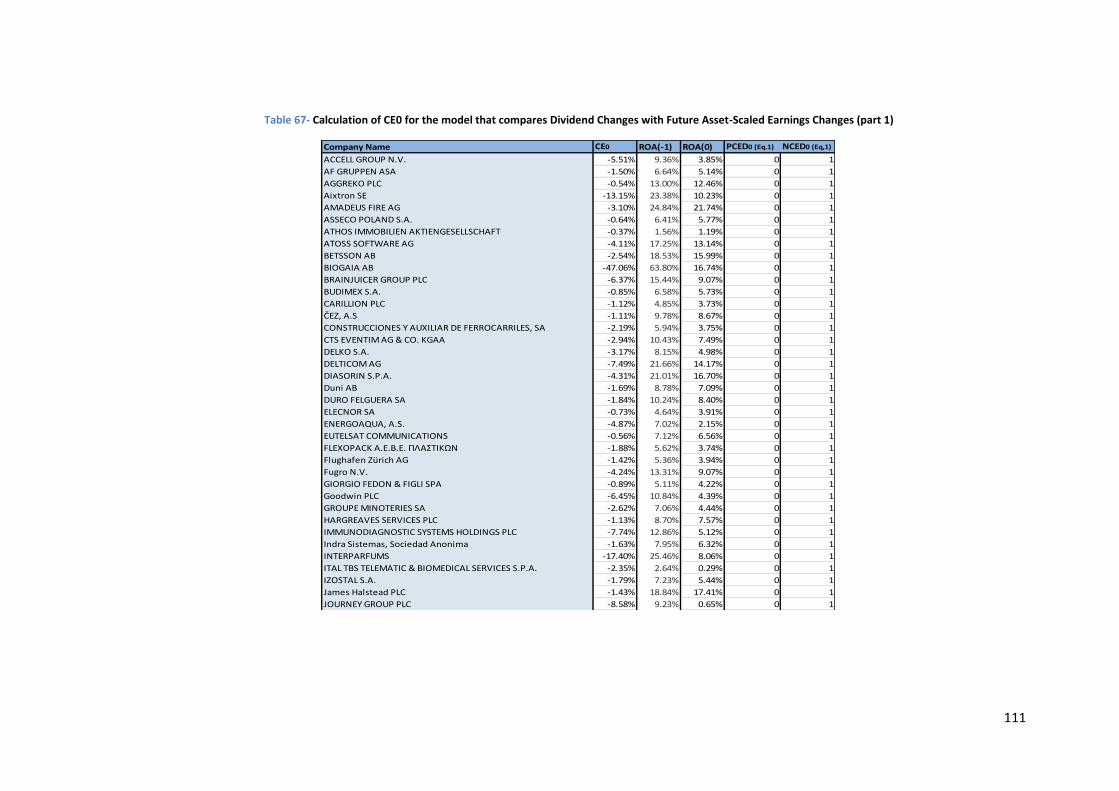
111
Table 67- Calculation of CE0 for the model that compares Dividend Changes with Future Asset-Scaled Earnings Changes (part 1)
Company Name CE0 ROA(-1) ROA(0) PCED0 (Eq.1) NCED0 (Eq,1)
ACCELL GROUP N.V. -5.51% 9.36% 3.85% 0 1
AF GRUPPEN ASA -1.50% 6.64% 5.14% 0 1
AGGREKO PLC -0.54% 13.00% 12.46% 0 1
Aixtron SE -13.15% 23.38% 10.23% 0 1
AMADEUS FIRE AG -3.10% 24.84% 21.74% 0 1
ASSECO POLAND S.A. -0.64% 6.41% 5.77% 0 1
ATHOS IMMOBILIEN AKTIENGESELLSCHAFT -0.37% 1.56% 1.19% 0 1
ATOSS SOFTWARE AG -4.11% 17.25% 13.14% 0 1
BETSSON AB -2.54% 18.53% 15.99% 0 1
BIOGAIA AB -47.06% 63.80% 16.74% 0 1
BRAINJUICER GROUP PLC -6.37% 15.44% 9.07% 0 1
BUDIMEX S.A. -0.85% 6.58% 5.73% 0 1
CARILLION PLC -1.12% 4.85% 3.73% 0 1
ČEZ, A.S -1.11% 9.78% 8.67% 0 1
CONSTRUCCIONES Y AUXILIAR DE FERROCARRILES, SA -2.19% 5.94% 3.75% 0 1
CTS EVENTIM AG & CO. KGAA -2.94% 10.43% 7.49% 0 1
DELKO S.A. -3.17% 8.15% 4.98% 0 1
DELTICOM AG -7.49% 21.66% 14.17% 0 1
DIASORIN S.P.A. -4.31% 21.01% 16.70% 0 1
Duni AB -1.69% 8.78% 7.09% 0 1
DURO FELGUERA SA -1.84% 10.24% 8.40% 0 1
ELECNOR SA -0.73% 4.64% 3.91% 0 1
ENERGOAQUA, A.S. -4.87% 7.02% 2.15% 0 1
EUTELSAT COMMUNICATIONS -0.56% 7.12% 6.56% 0 1
FLEXOPACK A.E.Β.Ε. ΠΛΑΣΤΙΚΩΝ -1.88% 5.62% 3.74% 0 1
Flughafen Zürich AG -1.42% 5.36% 3.94% 0 1
Fugro N.V. -4.24% 13.31% 9.07% 0 1
GIORGIO FEDON & FIGLI SPA -0.89% 5.11% 4.22% 0 1
Goodwin PLC -6.45% 10.84% 4.39% 0 1
GROUPE MINOTERIES SA -2.62% 7.06% 4.44% 0 1
HARGREAVES SERVICES PLC -1.13% 8.70% 7.57% 0 1
IMMUNODIAGNOSTIC SYSTEMS HOLDINGS PLC -7.74% 12.86% 5.12% 0 1
Indra Sistemas, Sociedad Anonima -1.63% 7.95% 6.32% 0 1
INTERPARFUMS -17.40% 25.46% 8.06% 0 1
ITAL TBS TELEMATIC & BIOMEDICAL SERVICES S.P.A. -2.35% 2.64% 0.29% 0 1
IZOSTAL S.A. -1.79% 7.23% 5.44% 0 1
James Halstead PLC -1.43% 18.84% 17.41% 0 1
JOURNEY GROUP PLC -8.58% 9.23% 0.65% 0 1
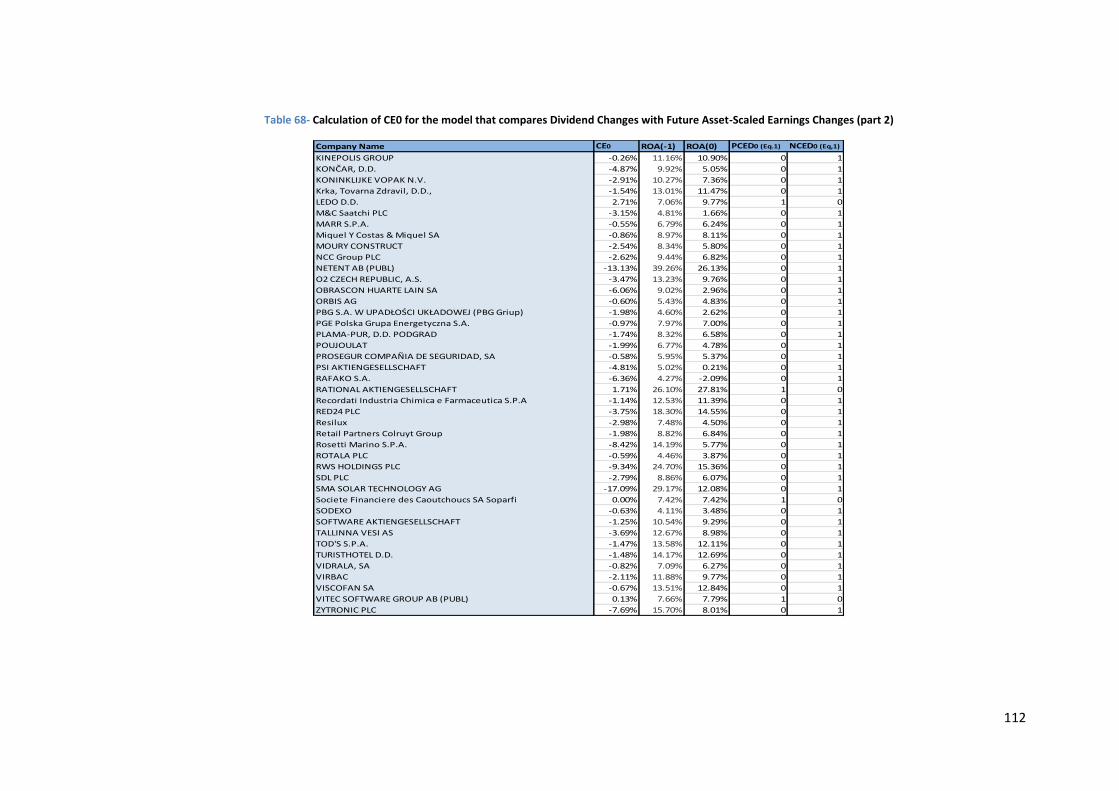
112
Table 68- Calculation of CE0 for the model that compares Dividend Changes with Future Asset-Scaled Earnings Changes (part 2)
Company Name CE0 ROA(-1) ROA(0) PCED0 (Eq.1) NCED0 (Eq,1)
KINEPOLIS GROUP -0.26% 11.16% 10.90% 0 1
KONČAR, D.D. -4.87% 9.92% 5.05% 0 1
KONINKLIJKE VOPAK N.V. -2.91% 10.27% 7.36% 0 1
Krka, Tovarna Zdravil, D.D., -1.54% 13.01% 11.47% 0 1
LEDO D.D. 2.71% 7.06% 9.77% 1 0
M&C Saatchi PLC -3.15% 4.81% 1.66% 0 1
MARR S.P.A. -0.55% 6.79% 6.24% 0 1
Miquel Y Costas & Miquel SA -0.86% 8.97% 8.11% 0 1
MOURY CONSTRUCT -2.54% 8.34% 5.80% 0 1
NCC Group PLC -2.62% 9.44% 6.82% 0 1
NETENT AB (PUBL) -13.13% 39.26% 26.13% 0 1
O2 CZECH REPUBLIC, A.S. -3.47% 13.23% 9.76% 0 1
OBRASCON HUARTE LAIN SA -6.06% 9.02% 2.96% 0 1
ORBIS AG -0.60% 5.43% 4.83% 0 1
PBG S.A. W UPADŁOŚCI UKŁADOWEJ (PBG Griup) -1.98% 4.60% 2.62% 0 1
PGE Polska Grupa Energetyczna S.A. -0.97% 7.97% 7.00% 0 1
PLAMA-PUR, D.D. PODGRAD -1.74% 8.32% 6.58% 0 1
POUJOULAT -1.99% 6.77% 4.78% 0 1
PROSEGUR COMPAÑIA DE SEGURIDAD, SA -0.58% 5.95% 5.37% 0 1
PSI AKTIENGESELLSCHAFT -4.81% 5.02% 0.21% 0 1
RAFAKO S.A. -6.36% 4.27% -2.09% 0 1
RATIONAL AKTIENGESELLSCHAFT 1.71% 26.10% 27.81% 1 0
Recordati Industria Chimica e Farmaceutica S.P.A -1.14% 12.53% 11.39% 0 1
RED24 PLC -3.75% 18.30% 14.55% 0 1
Resilux -2.98% 7.48% 4.50% 0 1
Retail Partners Colruyt Group -1.98% 8.82% 6.84% 0 1
Rosetti Marino S.P.A. -8.42% 14.19% 5.77% 0 1
ROTALA PLC -0.59% 4.46% 3.87% 0 1
RWS HOLDINGS PLC -9.34% 24.70% 15.36% 0 1
SDL PLC -2.79% 8.86% 6.07% 0 1
SMA SOLAR TECHNOLOGY AG -17.09% 29.17% 12.08% 0 1
Societe Financiere des Caoutchoucs SA Soparfi 0.00% 7.42% 7.42% 1 0
SODEXO -0.63% 4.11% 3.48% 0 1
SOFTWARE AKTIENGESELLSCHAFT -1.25% 10.54% 9.29% 0 1
TALLINNA VESI AS -3.69% 12.67% 8.98% 0 1
TOD'S S.P.A. -1.47% 13.58% 12.11% 0 1
TURISTHOTEL D.D. -1.48% 14.17% 12.69% 0 1
VIDRALA, SA -0.82% 7.09% 6.27% 0 1
VIRBAC -2.11% 11.88% 9.77% 0 1
VISCOFAN SA -0.67% 13.51% 12.84% 0 1
VITEC SOFTWARE GROUP AB (PUBL) 0.13% 7.66% 7.79% 1 0
ZYTRONIC PLC -7.69% 15.70% 8.01% 0 1
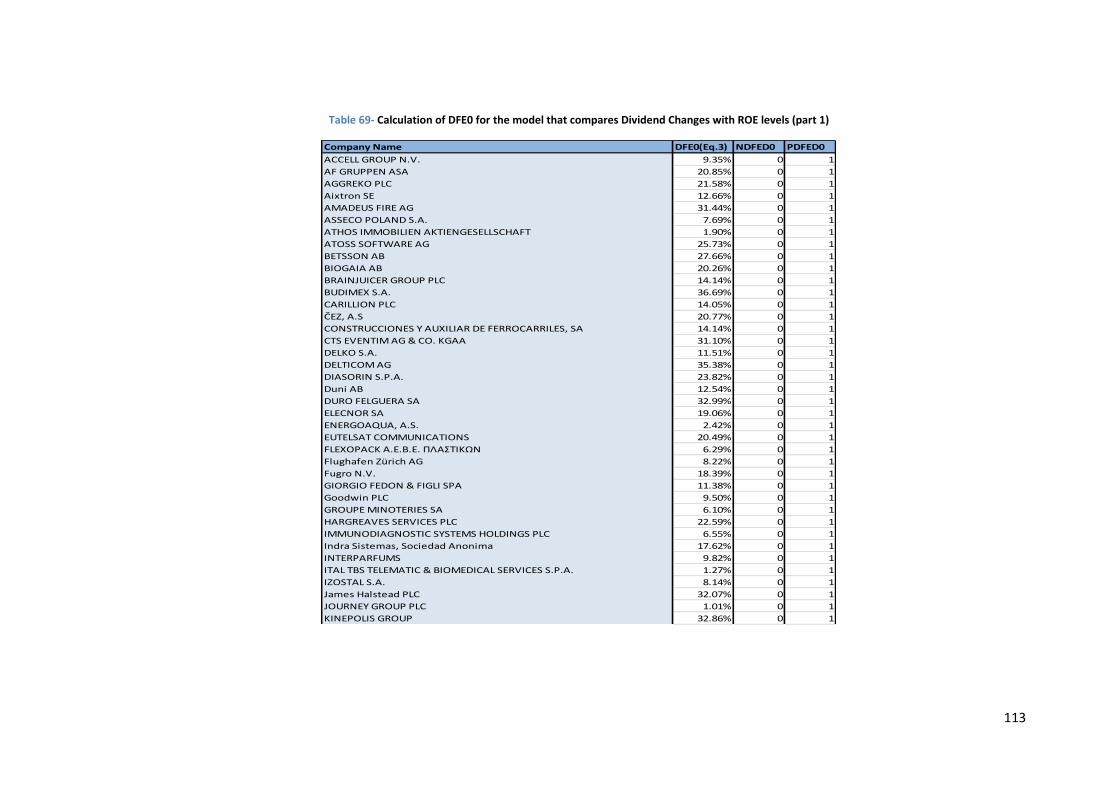
113
Table 69- Calculation of DFE0 for the model that compares Dividend Changes with ROE levels (part 1)
Company Name DFE0(Eq.3) NDFED0 PDFED0
ACCELL GROUP N.V. 9.35% 0 1
AF GRUPPEN ASA 20.85% 0 1
AGGREKO PLC 21.58% 0 1
Aixtron SE 12.66% 0 1
AMADEUS FIRE AG 31.44% 0 1
ASSECO POLAND S.A. 7.69% 0 1
ATHOS IMMOBILIEN AKTIENGESELLSCHAFT 1.90% 0 1
ATOSS SOFTWARE AG 25.73% 0 1
BETSSON AB 27.66% 0 1
BIOGAIA AB 20.26% 0 1
BRAINJUICER GROUP PLC 14.14% 0 1
BUDIMEX S.A. 36.69% 0 1
CARILLION PLC 14.05% 0 1
ČEZ, A.S 20.77% 0 1
CONSTRUCCIONES Y AUXILIAR DE FERROCARRILES, SA 14.14% 0 1
CTS EVENTIM AG & CO. KGAA 31.10% 0 1
DELKO S.A. 11.51% 0 1
DELTICOM AG 35.38% 0 1
DIASORIN S.P.A. 23.82% 0 1
Duni AB 12.54% 0 1
DURO FELGUERA SA 32.99% 0 1
ELECNOR SA 19.06% 0 1
ENERGOAQUA, A.S. 2.42% 0 1
EUTELSAT COMMUNICATIONS 20.49% 0 1
FLEXOPACK A.E.Β.Ε. ΠΛΑΣΤΙΚΩΝ 6.29% 0 1
Flughafen Zürich AG 8.22% 0 1
Fugro N.V. 18.39% 0 1
GIORGIO FEDON & FIGLI SPA 11.38% 0 1
Goodwin PLC 9.50% 0 1
GROUPE MINOTERIES SA 6.10% 0 1
HARGREAVES SERVICES PLC 22.59% 0 1
IMMUNODIAGNOSTIC SYSTEMS HOLDINGS PLC 6.55% 0 1
Indra Sistemas, Sociedad Anonima 17.62% 0 1
INTERPARFUMS 9.82% 0 1
ITAL TBS TELEMATIC & BIOMEDICAL SERVICES S.P.A. 1.27% 0 1
IZOSTAL S.A. 8.14% 0 1
James Halstead PLC 32.07% 0 1
JOURNEY GROUP PLC 1.01% 0 1
KINEPOLIS GROUP 32.86% 0 1
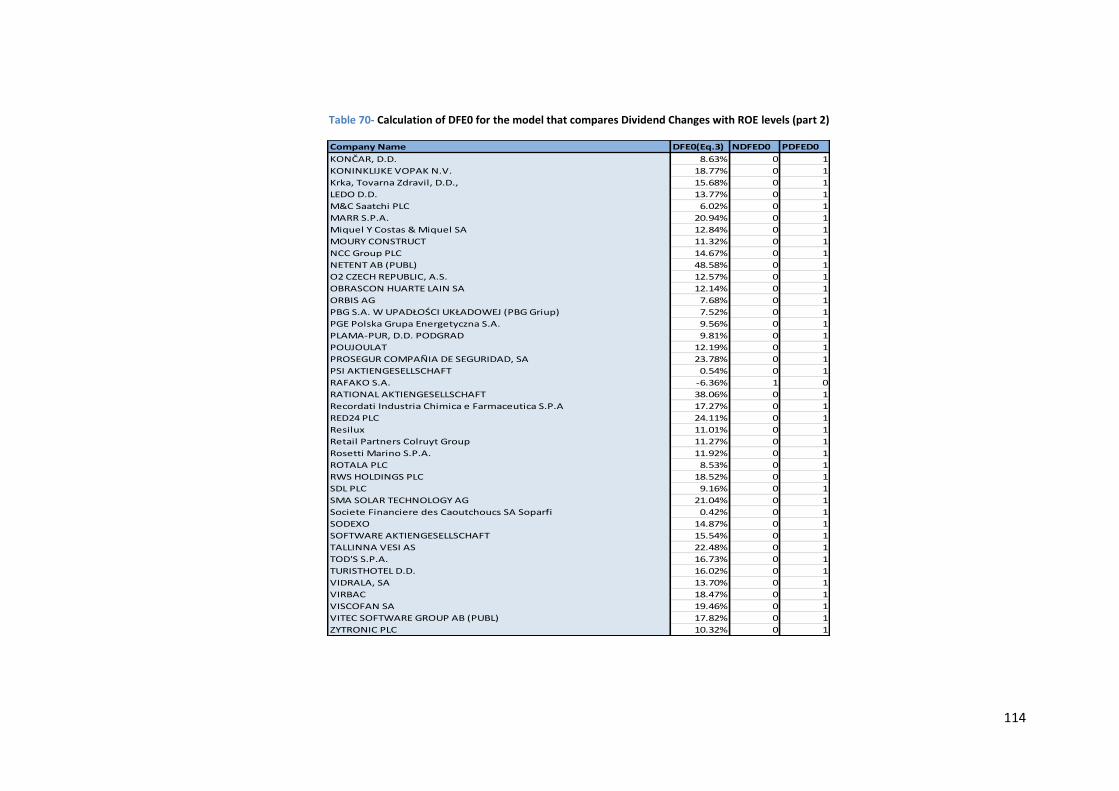
114
Table 70- Calculation of DFE0 for the model that compares Dividend Changes with ROE levels (part 2)
Company Name DFE0(Eq.3) NDFED0 PDFED0
KONČAR, D.D. 8.63% 0 1
KONINKLIJKE VOPAK N.V. 18.77% 0 1
Krka, Tovarna Zdravil, D.D., 15.68% 0 1
LEDO D.D. 13.77% 0 1
M&C Saatchi PLC 6.02% 0 1
MARR S.P.A. 20.94% 0 1
Miquel Y Costas & Miquel SA 12.84% 0 1
MOURY CONSTRUCT 11.32% 0 1
NCC Group PLC 14.67% 0 1
NETENT AB (PUBL) 48.58% 0 1
O2 CZECH REPUBLIC, A.S. 12.57% 0 1
OBRASCON HUARTE LAIN SA 12.14% 0 1
ORBIS AG 7.68% 0 1
PBG S.A. W UPADŁOŚCI UKŁADOWEJ (PBG Griup) 7.52% 0 1
PGE Polska Grupa Energetyczna S.A. 9.56% 0 1
PLAMA-PUR, D.D. PODGRAD 9.81% 0 1
POUJOULAT 12.19% 0 1
PROSEGUR COMPAÑIA DE SEGURIDAD, SA 23.78% 0 1
PSI AKTIENGESELLSCHAFT 0.54% 0 1
RAFAKO S.A. -6.36% 1 0
RATIONAL AKTIENGESELLSCHAFT 38.06% 0 1
Recordati Industria Chimica e Farmaceutica S.P.A 17.27% 0 1
RED24 PLC 24.11% 0 1
Resilux 11.01% 0 1
Retail Partners Colruyt Group 11.27% 0 1
Rosetti Marino S.P.A. 11.92% 0 1
ROTALA PLC 8.53% 0 1
RWS HOLDINGS PLC 18.52% 0 1
SDL PLC 9.16% 0 1
SMA SOLAR TECHNOLOGY AG 21.04% 0 1
Societe Financiere des Caoutchoucs SA Soparfi 0.42% 0 1
SODEXO 14.87% 0 1
SOFTWARE AKTIENGESELLSCHAFT 15.54% 0 1
TALLINNA VESI AS 22.48% 0 1
TOD'S S.P.A. 16.73% 0 1
TURISTHOTEL D.D. 16.02% 0 1
VIDRALA, SA 13.70% 0 1
VIRBAC 18.47% 0 1
VISCOFAN SA 19.46% 0 1
VITEC SOFTWARE GROUP AB (PUBL) 17.82% 0 1
ZYTRONIC PLC 10.32% 0 1
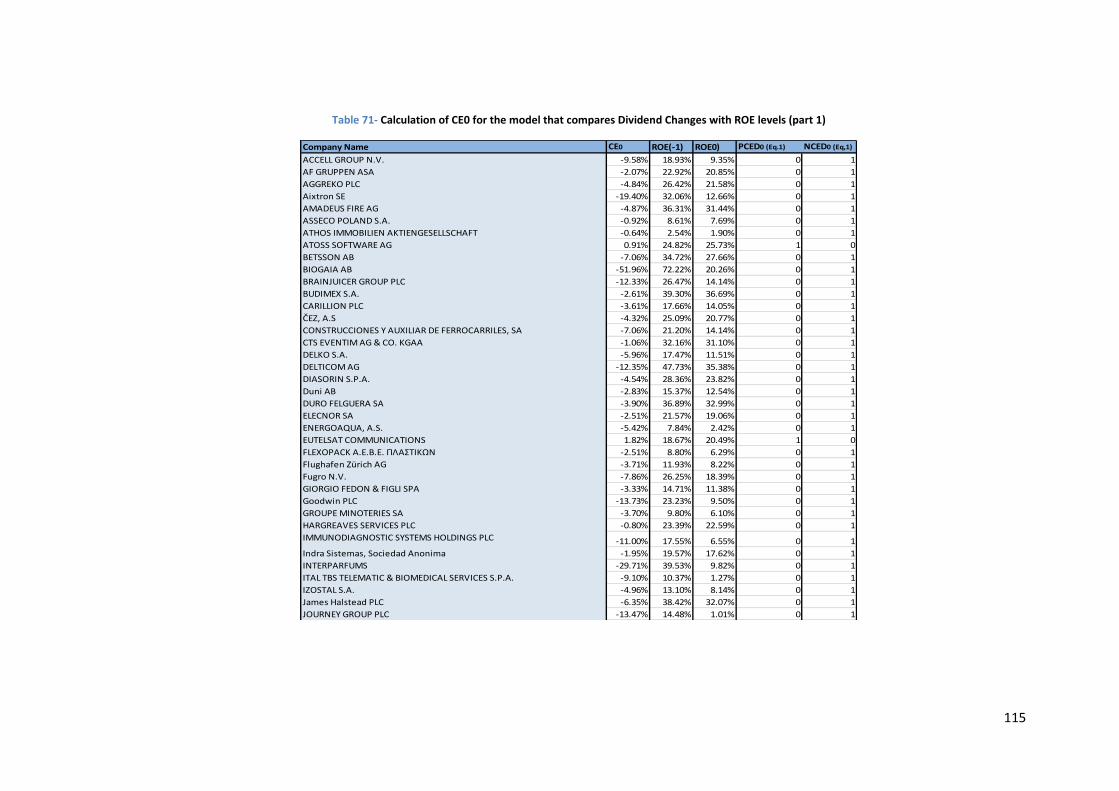
115
Table 71- Calculation of CE0 for the model that compares Dividend Changes with ROE levels (part 1)
Company Name CE0 ROE(-1) ROE0) PCED0 (Eq.1) NCED0 (Eq,1)
ACCELL GROUP N.V. -9.58% 18.93% 9.35% 0 1
AF GRUPPEN ASA -2.07% 22.92% 20.85% 0 1
AGGREKO PLC -4.84% 26.42% 21.58% 0 1
Aixtron SE -19.40% 32.06% 12.66% 0 1
AMADEUS FIRE AG -4.87% 36.31% 31.44% 0 1
ASSECO POLAND S.A. -0.92% 8.61% 7.69% 0 1
ATHOS IMMOBILIEN AKTIENGESELLSCHAFT -0.64% 2.54% 1.90% 0 1
ATOSS SOFTWARE AG 0.91% 24.82% 25.73% 1 0
BETSSON AB -7.06% 34.72% 27.66% 0 1
BIOGAIA AB -51.96% 72.22% 20.26% 0 1
BRAINJUICER GROUP PLC -12.33% 26.47% 14.14% 0 1
BUDIMEX S.A. -2.61% 39.30% 36.69% 0 1
CARILLION PLC -3.61% 17.66% 14.05% 0 1
ČEZ, A.S -4.32% 25.09% 20.77% 0 1
CONSTRUCCIONES Y AUXILIAR DE FERROCARRILES, SA -7.06% 21.20% 14.14% 0 1
CTS EVENTIM AG & CO. KGAA -1.06% 32.16% 31.10% 0 1
DELKO S.A. -5.96% 17.47% 11.51% 0 1
DELTICOM AG -12.35% 47.73% 35.38% 0 1
DIASORIN S.P.A. -4.54% 28.36% 23.82% 0 1
Duni AB -2.83% 15.37% 12.54% 0 1
DURO FELGUERA SA -3.90% 36.89% 32.99% 0 1
ELECNOR SA -2.51% 21.57% 19.06% 0 1
ENERGOAQUA, A.S. -5.42% 7.84% 2.42% 0 1
EUTELSAT COMMUNICATIONS 1.82% 18.67% 20.49% 1 0
FLEXOPACK A.E.Β.Ε. ΠΛΑΣΤΙΚΩΝ -2.51% 8.80% 6.29% 0 1
Flughafen Zürich AG -3.71% 11.93% 8.22% 0 1
Fugro N.V. -7.86% 26.25% 18.39% 0 1
GIORGIO FEDON & FIGLI SPA -3.33% 14.71% 11.38% 0 1
Goodwin PLC -13.73% 23.23% 9.50% 0 1
GROUPE MINOTERIES SA -3.70% 9.80% 6.10% 0 1
HARGREAVES SERVICES PLC -0.80% 23.39% 22.59% 0 1
IMMUNODIAGNOSTIC SYSTEMS HOLDINGS PLC -11.00% 17.55% 6.55% 0 1
Indra Sistemas, Sociedad Anonima -1.95% 19.57% 17.62% 0 1
INTERPARFUMS -29.71% 39.53% 9.82% 0 1
ITAL TBS TELEMATIC & BIOMEDICAL SERVICES S.P.A. -9.10% 10.37% 1.27% 0 1
IZOSTAL S.A. -4.96% 13.10% 8.14% 0 1
James Halstead PLC -6.35% 38.42% 32.07% 0 1
JOURNEY GROUP PLC -13.47% 14.48% 1.01% 0 1
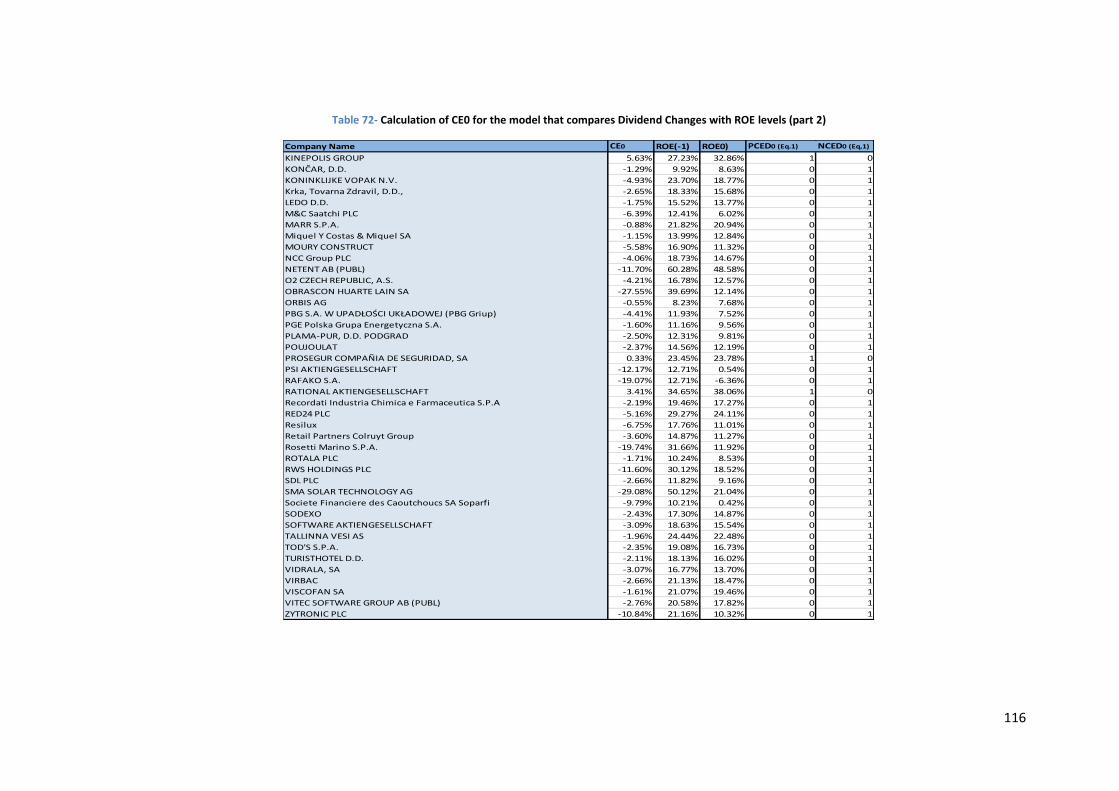
116
Table 72- Calculation of CE0 for the model that compares Dividend Changes with ROE levels (part 2)
Company Name CE0 ROE(-1) ROE0) PCED0 (Eq.1) NCED0 (Eq,1)
KINEPOLIS GROUP 5.63% 27.23% 32.86% 1 0
KONČAR, D.D. -1.29% 9.92% 8.63% 0 1
KONINKLIJKE VOPAK N.V. -4.93% 23.70% 18.77% 0 1
Krka, Tovarna Zdravil, D.D., -2.65% 18.33% 15.68% 0 1
LEDO D.D. -1.75% 15.52% 13.77% 0 1
M&C Saatchi PLC -6.39% 12.41% 6.02% 0 1
MARR S.P.A. -0.88% 21.82% 20.94% 0 1
Miquel Y Costas & Miquel SA -1.15% 13.99% 12.84% 0 1
MOURY CONSTRUCT -5.58% 16.90% 11.32% 0 1
NCC Group PLC -4.06% 18.73% 14.67% 0 1
NETENT AB (PUBL) -11.70% 60.28% 48.58% 0 1
O2 CZECH REPUBLIC, A.S. -4.21% 16.78% 12.57% 0 1
OBRASCON HUARTE LAIN SA -27.55% 39.69% 12.14% 0 1
ORBIS AG -0.55% 8.23% 7.68% 0 1
PBG S.A. W UPADŁOŚCI UKŁADOWEJ (PBG Griup) -4.41% 11.93% 7.52% 0 1
PGE Polska Grupa Energetyczna S.A. -1.60% 11.16% 9.56% 0 1
PLAMA-PUR, D.D. PODGRAD -2.50% 12.31% 9.81% 0 1
POUJOULAT -2.37% 14.56% 12.19% 0 1
PROSEGUR COMPAÑIA DE SEGURIDAD, SA 0.33% 23.45% 23.78% 1 0
PSI AKTIENGESELLSCHAFT -12.17% 12.71% 0.54% 0 1
RAFAKO S.A. -19.07% 12.71% -6.36% 0 1
RATIONAL AKTIENGESELLSCHAFT 3.41% 34.65% 38.06% 1 0
Recordati Industria Chimica e Farmaceutica S.P.A -2.19% 19.46% 17.27% 0 1
RED24 PLC -5.16% 29.27% 24.11% 0 1
Resilux -6.75% 17.76% 11.01% 0 1
Retail Partners Colruyt Group -3.60% 14.87% 11.27% 0 1
Rosetti Marino S.P.A. -19.74% 31.66% 11.92% 0 1
ROTALA PLC -1.71% 10.24% 8.53% 0 1
RWS HOLDINGS PLC -11.60% 30.12% 18.52% 0 1
SDL PLC -2.66% 11.82% 9.16% 0 1
SMA SOLAR TECHNOLOGY AG -29.08% 50.12% 21.04% 0 1
Societe Financiere des Caoutchoucs SA Soparfi -9.79% 10.21% 0.42% 0 1
SODEXO -2.43% 17.30% 14.87% 0 1
SOFTWARE AKTIENGESELLSCHAFT -3.09% 18.63% 15.54% 0 1
TALLINNA VESI AS -1.96% 24.44% 22.48% 0 1
TOD'S S.P.A. -2.35% 19.08% 16.73% 0 1
TURISTHOTEL D.D. -2.11% 18.13% 16.02% 0 1
VIDRALA, SA -3.07% 16.77% 13.70% 0 1
VIRBAC -2.66% 21.13% 18.47% 0 1
VISCOFAN SA -1.61% 21.07% 19.46% 0 1
VITEC SOFTWARE GROUP AB (PUBL) -2.76% 20.58% 17.82% 0 1
ZYTRONIC PLC -10.84% 21.16% 10.32% 0 1

117