contents the domestic currency, rupee, slightly gained against dollar due to sustained selling of...
TRANSCRIPT


Contents
Equity 4-7
Derivatives 8-9
Commodity 10-13
Currency 14
IPO 15
FD Monitor 16
Insurance 17
Mutual Fund 18
SMC RESEARCH TEAMREGISTERED OFFICES:
11 / 6B, Shanti Chamber, Pusa Road, New Delhi 110005.
Tel: 91-11-30111000, Fax: 91-11-25754365
MUMBAI OFFICE:
Dheeraj Sagar, 1st Floor, Opp. Goregaon sports Club, Link Road
Malad (West), Mumbai 400064
Tel: 91-22-67341600, Fax: 91-22-28805606
KOLKATA OFFICE:
18,Rabindra Sarani, Poddar Court, Gate No-4,5th Floor, Kolkata-700001
Tel : 91-33-39847000 Fax No : 91-33-39847004
AHMEDABAD OFFICE :
10/A, 4th Floor, Kalapurnam Building, Near Municipal Market,
C G Road, Ahmedabad-380009, Gujarat
Tel : 91-79-26424801 - 05, 40049801 - 03
CHENNAI OFFICE:
Salzburg Square, Flat No.1, III rd Floor, Door No.107, Harrington Road,
Chetpet, Chennai - 600031.
Tel: 044-39109100, Fax -044- 39109111
SECUNDERABAD OFFICE:
206, 3rd Floor, above CMR Exclusive, Bhuvana Towers, S.D.Road,
Secunderabad - 500003
Tel: 91-40-30780298/99, 39109536
DUBAI OFFICE:
312, Belshalat Building, Al Karama, Dubai, P.O. Box 117210, U.A.E.
Tel: 97143963120, Mobile : 971502612483
Fax : 9714 3963122
Email ID : [email protected]
Printed and Published on behalf of
Mr. Saurabh Jain @ Publication Address
11/6B, Shanti Chamber, Pusa Road, New Delhi-110005
Website: www.smcindiaonline.com
Investor Grievance : [email protected]
Printed at: S&S MARKETING
102, Mahavirji Complex LSC-3, Rishabh Vihar, New Delhi - 110092 (India)
Ph.: +91-11- 43035012, 43035014, Email: [email protected]
n the week gone by, global stock markets witnessed mixed movements as investors
adopted a wait-and-watch approach on the eve of a US interest rate decision and oil Iprices weakened. The US Fed on Wednesday left the benchmark policy rates
unchanged, but maintained that the "near-term risks" to the economy have diminished.
Meanwhile, the Bank of Japan (BoJ) maintained its current negative interest rates and bond
buying program, but has increased its purchases of Exchange Traded Funds (ETF) to 6
trillion yen per annum from 3.3 trillion previously.
Back at home, a favourable outcome from the US Federal Reserve's meeting and positive
June quarter earnings amid a renewed push for GST reforms lifted the sentiments of the
market participants. However, on Friday market closed in red due to profit booking. In
another development, recently the Union Cabinet has increased the foreign shareholding
limit in Indian stock exchanges, a depository, a banking company, an insurance company
and a commodity derivative exchange from 5% to 15%. Also the domestic currency, rupee,
slightly gained against dollar due to sustained selling of the US dollar by banks and
exporters, prompted by persistent foreign capital inflows. Government on Friday has listed
the much-awaited GST bill for consideration and passage in Rajya Sabha's agenda for the
next week. Recently, the cabinet has cleared changes in the GST Constitutional Amendment
Bill, dropping the 1% manufacturing tax. Moreover, the GST Constitutional Amendment bill
guarantee compensation for any revenue losses states may experience in the first five years
of rolling out the proposed indirect tax scheme. The next batch of Q1 June 2016 corporate
results, the progress of the monsoon rains and trend in global stock market will dictate the
near term trend of the domestic markets.
On the commodity market front, big movements were witnessed in many commodities.
Bullion counter sparkled again whereas crude prices nosedived…base metals were more on
bearish side. This week, bullion counter is expected to trade on upside path as Fed kept
interest rate unchanged in July meeting and also due to weaker greenback. Crude oil price
is expected to continue its downside movement amid fear of supply glut and lack of demand
can keep the prices under pressure. Overall it can move in the range of 2600-2950 in MCX.
Natural gas may continue its bullish momentum on good demand amid hot temperatures in
US. It can test 210 in MCX. Manufacturing PMI of China, ISM Manufacturing, ISM
Services/Non-Manufacturing Composite, Unemployment Rate and Change in Non-farm
Payrolls of US, Reserve Bank of Australia Rate Decision, Bank of England Rate Decision,
unemployment Rate of Canada etc are the set of data and events, which are scheduled this
week.
From The Desk Of Editor
(Saurabh Jain)
SMC Global Securities Limited is proposing, subject to receipt of requisite approvals, market conditions and other considerations, a further public offering of its equity shares and has filed the Draft Red Herring Prospectus with the Securities and Exchange Board of India (“SEBI”) and the Stock Exchanges. The Draft Red Herring Prospectus is available on the website of SEBI at www.sebi.gov.in and on the websites of the Book Running Lead Manager i.e., ICICI Securities Limited at www.icicisecurities.com and the Co- Book Running Lead Manager i.e., Elara Capital (India) Private Limited at www.elaracapital.com . Investors should note that investment in equity shares involves a high degree of risk and for details relating to the same, please see the section titled “Risk Factors” of the aforementioned offer document.
SMC Global Securities Ltd. (hereinafter referred to as “SMC”) is a registered Member of National Stock Exchange of India Limited, Bombay Stock Exchange Limited and its associate is member of MCX stock Exchange Limited. It is also registered as a Depository Participant with CDSL and NSDL. Its associates merchant banker and Portfolio Manager are registered with SEBI and NBFC registered with RBI. It also has registration with AMFI as a Mutual Fund Distributor.
SMC has applied with SEBI for registering as a Research Entity in terms of SEBI (Research Analyst) Regulations, 2014. SMC or its associates has not been debarred/ suspended by SEBI or any other regulatory authority for accessing /dealing in securities Market.
SMC or its associates including its relatives/analyst do not hold any financial interest/beneficial ownership of more than 1% in the company covered by Analyst. SMC or its associates and relatives does not have any material conflict of interest. SMC or its associates/analyst has not received any compensation from the company covered by Analyst during the past twelve months. The subject company has not been a client of SMC during the past twelve months. SMC or its associates has not received any compensation or other benefits from the company covered by analyst or third party in connection with the research report. The Analyst has not served as an officer, director or employee of company covered by Analyst and SMC has not been engaged in market making activity of the company covered by Analyst.
The views expressed are based solely on information available publicly available/internal data/ other reliable sources believed to be true.
SMC does not represent/ provide any warranty express or implied to the accuracy, contents or views expressed herein and investors are advised to independently evaluate the market conditions/risks involved before making any investment decision.
NEWS
DOMESTIC NEWS
Pharmaceutical
• Sun Pharmaceutical Industries Ltd said it entered into $50 million licensing agreement with Spanish firm Almirall for the development and commercialisation of tildrakizumab for psoriasis in Europe.
Telecom
• Idea Cellular announced expansion of its high-speed 4G LTE services in over nine districts of the North East Service Area. The telecom operator's services are now available in Agartala, Aizawl, Imphal, Kohima, Mokokchung, Senapati and Tura, in addition to Dimapur launched earlier this year. With the rapid expansion in a fairly short span of time, Idea's 4G LTE services are now available to over 1.7 million people in North East.
Realty/ Construction
• Hindustan Construction Company (HCC) has won a `1,749.59 crore contract from IRCON International to construct two tunnels and a bridge in Jammu and Kashmir.
• Ahluwalia Contracts (India) has bagged orders worth `472.81 crore for construction of institutional and residential buildings.
Travel Agencies
• Thomas Cook (India) has entered into a partnership with Matrimony Bazaar to tap the 'romantic leisure travel' segment which is seeing an "exponential" growth. The contract for the tunnels and bridge on Katra-Banihal Section of Udhampur-Srinagar-Baramulla New BG Railway Line Project will be completed within 30 months.
Information Technology
• Zen Technologies Limited announced its biggest export order till date, of about `30 crore from Egypt. The Ministry of Defence (MoD), Egypt, has chosen Zen Technologies to provide a range of training equipment including Smart Target Systems, according to the company.
Diversified
• Kesoram Industries has lined up a ̀ 600-crore capital expenditure plan in the ongoing fiscal year, which will help the company take forward its restructuring agenda. Of the planned capex, ̀ 350 crore will be spent on the tyre business, while the cement business will attract an investment of `250 crore.
Miscellaneous
• Emami Agrotech, a part of the Emami Group, will invest `300 crore for expansion of its edible oil refining capacity by 1,000 tonnes per day (tpd) at its Haldia plant in West Bengal.
INTERNATIONAL NEWS
• As was widely expected, the Federal Reserve announced it has decided to maintain the target range for the federal funds rate at 1/4 to 1/2 percent. The Fed's statement noted that information received since its June meeting indicates that the labor market strengthened and that economic activity has been expanding at a moderate rate. While the statement was largely unchanged from the previous meeting, the Fed did say near-term risks to the economic outlook have diminished.
• US initial jobless claims climbed to 266,000, an increase of 14,000 from the previous week's revised level of 252,000. Economists had expected jobless claims to rise to 264,000 from the 253,000 originally reported for the previous week.
• US pending home sales index edged up by 0.2 percent to 111.0 in June after tumbling by 3.7 percent to 110.8 in May. Economists had expected the index to jump by 1.3 percent. A pending home sale is one in which a contract was signed but not yet closed. Normally, it takes four to six weeks to close a contracted sale.
• US durable goods orders tumbled by 4.0 percent in June following a revised 2.8 percent decrease in May. Economists had expected durable goods orders to dip by 1.3 percent compared to the 2.2 percent decline originally reported for the previous month.
• U.S. new home sales rose at the highest pace in seven years in June, prompted by attractive prices and exceedingly low interest rates. Sales rose 3.5 percent to a seasonally adjusted annual rate of 592,000, the Commerce Department, the strongest since February 2008. With upward revisions to prior months, sales of new homes are up 10 percent in the second quarter compared to the first.
• Eurozone economic sentiment index rose to 104.6 in July from 104.4 in June, survey results from the European Commission showed Thursday. Economists had forecast a fall to 103.5.
Ex-Date Company Purpose
1-Aug-16 Apollo Tyres Dividend - Rs 2/- Per Share2-Aug-16 ACC Interim Dividend - Rs 11/- Per Share2-Aug-16 Ambuja Cements Interim Dividend - Rs 1.60/- Per Share2-Aug-16 Tata Chemicals Dividend Rs 10/- Per Share3-Aug-16 MRF Dividend -Rs 94/- Per Share4-Aug-16 D.B.Corp Dividend Rs.4.25 Per Share5-Aug-16 Voltas And Dividend Rs.2.60 Per Share5-Aug-16 Indiabulls Housing Finance Interim Dividend -Rs 9/- Per Share8-Aug-16 Tata Global Beverages Dividend Rs 2.25 Per Share8-Aug-16 NCC Dividend - Re 0.60/- Per Share9-Aug-16 Bharti Infratel Dividend - Rs 3/- Per Share10-Aug-16 HCL Technologies Interim Dividend11-Aug-16 Bharti Airtel Dividend - Rs 1.36/- Per Share11-Aug-16 JB Chemicals &
Pharmaceuticals Dividend - Re 0.50/- Per Share12-Aug-16 L&T Finance Holdings Dividend - Re 0.80/- Per Share
Meeting Date Company Purpose
1-Aug-16 Greaves Cotton Results2-Aug-16 Voltas Results3-Aug-16 HCL Technologies Results/Dividend3-Aug-16 Titan Company Results3-Aug-16 Berger Paints (I) Results4-Aug-16 Tata Power Company Results4-Aug-16 Siemens Results/Dividend4-Aug-16 Arvind Results5-Aug-16 Bharat Forge Results6-Aug-16 Union Bank of India Results8-Aug-16 Idea Cellular Results9-Aug-16 Apollo Tyres Results10-Aug-16 Mahindra & Mahindra Results11-Aug-16 Jindal Stainless Results12-Aug-16 Shree Cements Results
FORTHCOMING EVENTS
NOTES:1) These levels should not be confused with the daily trend sheet, which is sent every morning by e-mail in the name
of "Morning Mantra ".2) Sometimes you will find the stop loss to be too far but if we change the stop loss once, we will find more strength
coming into the stock. At the moment, the stop loss will be far as we are seeing the graphs on weekly basis and taking a long-term view and not a short-term view.
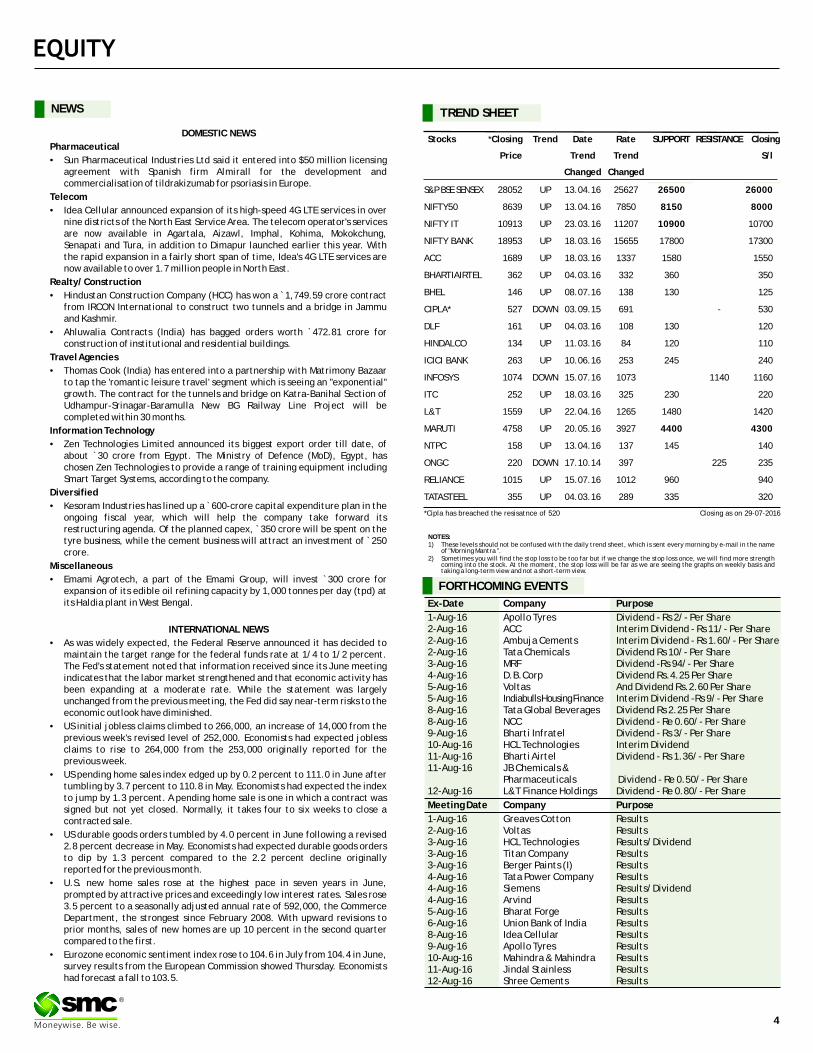
TREND SHEET
Stocks *Closing Trend Date Rate SUPPORT RESISTANCE Closing
Price Trend Trend
Changed Changed
S&P BSE SENSEX 28052 UP 13.04.16 25627 26500 26000
NIFTY50 8639 UP 13.04.16 7850 8150 8000
NIFTY IT 10913 UP 23.03.16 11207 10900 10700
NIFTY BANK 18953 UP 18.03.16 15655 17800 17300
ACC 1689 UP 18.03.16 1337 1580 1550
BHARTIAIRTEL 362 UP 04.03.16 332 360 350
BHEL 146 UP 08.07.16 138 130 125
CIPLA* 527 DOWN 03.09.15 691 - 530
DLF 161 UP 04.03.16 108 130 120
HINDALCO 134 UP 11.03.16 84 120 110
ICICI BANK 263 UP 10.06.16 253 245 240
INFOSYS 1074 DOWN 15.07.16 1073 1140 1160
ITC 252 UP 18.03.16 325 230 220
L&T 1559 UP 22.04.16 1265 1480 1420
MARUTI 4758 UP 20.05.16 3927 4400 4300
NTPC 158 UP 13.04.16 137 145 140
ONGC 220 DOWN 17.10.14 397 225 235
RELIANCE 1015 UP 15.07.16 1012 960 940
TATASTEEL 355 UP 04.03.16 289 335 320
S/l
4
®
Closing as on 29-07-2016*Cipla has breached the resisatnce of 520

BSE SENSEX GAINERS & LOSERS TOP (% Change) NSE NIFTY GAINERS TOP & LOSERS (% Change)
SECTORAL INDICES (% Change)
SMC Trend
FMCGHealthcare
Auto BankRealty
Cap GoodsCons Durable
Oil & GasPower
ITMetal
Down SidewaysUp
GLOBAL INDICES (% Change)
INDIAN INDICES (% Change)
5
®
SMC Trend
Nifty Sensex BSE Midcap BSE Smallcap Nifty Junior S&P CNX 500
SMC Trend
FTSE 100CAC 40
NasdaqDow jonesS&P 500
NikkeiStrait times
Hang SengShanghai
-227.80
518.46
803.66 718.44
474.87
146.30
-348.00
-600.00
-400.00
-200.00
0.00
200.00
400.00
600.00
800.00
1000.00
Friday Monday Tuesday Wednesday Thursday
FII / FPI Activity MF Activity
7.91 7.81
4.94 4.58 4.24
-17.88
-4.11-2.86 -2.21 -2.09
-20.00
-15.00
-10.00
-5.00
0.00
5.00
10.00
Maruti Suzuki
Asian Paints Power Grid Corpn
Sun Pharma.Inds.
TCS Dr Reddy's Labs
Tata Steel GAIL (India) Bajaj Auto Hero Motocorp
10.56
7.90 7.736.50 6.07
-17.78
-4.27 -3.83-2.77 -2.41
-20.00
-15.00
-10.00
-5.00
0.00
5.00
10.00
15.00
Bharti Infra. Maruti Suzuki Asian Paints Eicher Motors B H E L Dr Reddy's Labs
Tata Steel Tech Mahindra
GAIL (India) Aurobindo Pharma
1.46 1.46
2.41
1.44
2.00
1.54
0.00
0.50
1.00
1.50
2.00
2.50
3.00
Nifty Sensex BSE Midcap BSE Smallcap
Nifty Next 50
S&P CNX 500
1.35
2.06
0.27
3.47
1.32
-1.13
1.84
0.33
0.91
1.81
0.68
-2.00
-1.00
0.00
1.00
2.00
3.00
4.00
Auto Index Bankex Cap Goods Index
Cons Durable Index
FMCG Index Healthcare Index
IT Index Metal Index Oil & Gas Index
Power Index Realty Index
-0.62
-0.23
-0.90-0.91
-0.61
-0.14
1.070.96
0.90
-1.50
-1.00
-0.50
0.00
0.50
1.00
1.50
Nasdaq Comp. Dow Jones S&P 500 Nikkei Strait Times Hang Seng Shanghai Comp.
FTSE 100 CAC 40
INSTITUTIONAL ACTIVITY (Equity) (` Crore)

Beat the street - Fundamental Analysis
Above calls are recommended with a time horizon of 8 to 10 months. Source: Company Website Reuters Capitaline
6
®
DEWAN HOUSING FINANCE CORPORATION LIMITED CMP: 223.8 Upside: 19%Target Price:266.00
Investment Rationale �The launch of 'Housing-For-All by 2022' scheme in financial year 2015-16 heralds a new era in the �Dewan Housing Finance Corporation Limited housing finance sector. It will provide the much-(DHFL) focuses on providing financing products to needed boost to the real estate and housing the lower and middle income segments in India, finance industry by creating an enabling and primarily in Tier II and Tier III cities, and towns. It supportive environment for expanding credit flow offers loans for construction or purchase of and increasing home ownership.residential property and loans against property.
Valuation�The management of the company expects loan book growth of 17-19% and earnings growth of 15- The company has a track record of financial and 20% for FY2017, which is expected to be driven by operating performance and has developed deep low and middle income segment. understanding of rural India. Going forward, the
company is likely to maintain the same on the back of �The share of project loans has increased to 10% of healthy loan growth expectation and expansion in total AUM at the end June 2016 from 9% at end NIM. It is also focusing on improving its assets quality, March 2016, while the company would restrict the which would have a positive impact on the overall project loan share at 12-15% of AUM.performance of the company. We expect the stock to �The company proposes to consistently improve see a price target of `266 in 8-10 month time frame the cost-to-income ratio, while expects to reduce on a current P/Bv of 1.4x and FY17 (E) book value per cost-to-income ratio by at least 25 bps in FY2017.share of ̀ 190.08.
�The company also expects to maintain NIMs in the range of 2.8-3.0% and also would maintain Capital Adequacy Ratio above 9%.
�The loan portfolio of the company increased 18% yoy to ̀ 63647 crore at end June 2016 from ̀ 53796 crore at end June 2015. The disbursements increased 26% to `6214.81 crore, while the loan sanctions moved up 12% to `8800.68 crore in the quarter ended June 2016 over the corresponding quarter of last year.
�Gross NPA ratio remained stable at 0.98% at end June 2016 from 0.93% a quarter ago. The NPA coverage ratio was strong at 99.3% at end June 2016.
Face Value (`) 10.00
52 Week High/Low 268.00/140.55
M.Cap (`Cr.) 6530.44
EPS (`) 25.95
P/E Ratio (times) 8.62
P/B Ratio (times) 1.33
Dividend Yield (%) 3.57
Stock Exchange BSE
% OF SHARE HOLDING
P/B Chart
` in cr
Actual Estimate
FY Mar-15 FY Mar-16 FY Mar-17
REVENUE 5,979.00 2,359.70 2,169.10
EBIT 1,048.00 1,115.90 1,559.90
NET INCOME 621.30 749.30 859.30
EPS 23.60 23.73 29.45
BVPS 159.11 184.71 190.08
ROE 15.10 14.50 15.90
VALUE PARAMETERS
Investment Rationale for the quarter ended June 2016. Total revenue grew to Rs. 2,880.94 crores in the quarter ended •The management of the company has maintained June 2016 from `2,574.09 crores in the quarter capex guidance for FY17 at `400 crore. Capex ended June 2015.stood at ̀ 450 crore in FY 16. FY17 capex includes
brownfield expansion at i ts exist ing •During the quarter ended June 2016, the overall manufacturing plants. two-wheeler sales of TVS Motor Company,
including exports grew by 15.3% to 7.01 lakh units •The company has targeted 50-55k units/month for in the quarter ended June 2016 from 6.08 lakh TVS Jupiter for FY17. The company expects recovery units registered in the quarter ended June 2015. in exports in 2QFY17 driven by some improvement in
availability of dollar in key markets. Valuation
•Management sees signs of easing of availability of Based on the above rationale, the company is forex going forward. Momentum of exports is expected to gain market share and increase expected to be better inH2FY17. It expects 3W profitability from the second half of the year. As per export volumes to clock 6-6.5k units/ month in the the management, the rural demand is moderate and near term from the current run rate of 4-4.5k units. the same would pick up in second half of FY17 on the
back of normal monsoon and festive season. It is •Management maintains EBITDA margin target of expected that the stock will see a price target of ̀ 425 double digit (10%) by FY18 (without BMW in 8 to 10 months time frame on a target P/E of 34x alliance). Tax rate is expected to be ~26-27% and FY17 (E) earnings of ̀ 12.5.range in FY17.
•Inventory at dealers increased from 27-28 days to 31-32 days in 1QFY17.Retail inventory is estimated to be marginally higher on qoq basis. Excise duty incentives at Himachal Pradesh plant will lapse by Mar-17.Contribution of Himachal plant stands at 10% of total production.
•Victor and Apache 200R models were rolled out on PanIndia basis in 1QFY17. TVS Motor's management expects a 20k/month run rate of Victor for FY17. Jupiter millionedition and Star City chocolate gold versions were also launched in 1QFY17. The company has targeted 50-55k units/month for TVS Jupiter for FY17.
•Company has reported a revenue growth of 12%
P/E Chart
TVS MOTOR LIMITED CMP: 290.2 Upside: 46%Target Price: 425.00
Face Value (`) 1.00
52 Week High/Low 340.90/201.00
M.Cap (`Cr.) 13787.40
EPS (`) 7.32
P/E Ratio (times) 39.65
P/B Ratio (times) 9.44
Dividend Yield (%) 0.92
Stock Exchange BSE
` in cr
% OF SHARE HOLDING
VALUE PARAMETERS
Actual EstimateFY Mar-15 FY Mar-16 FY Mar-17
Revenue 9,920.10 11,108.20 12,981.80EBITDA 604.30 750.70 989.90EBIT 451.00 560.90 754.90Pre-Tax Profit 456.20 571.70 805.30Net Income 347.80 437.80 592.80EPS 7.32 9.22 12.50BVPS 34.63 40.77 49.85ROE (%) 22.70 24.40 26.90
15.56
14.47
1.5
57.4
11.07
Foreign
Institutions
Non Promoter Corporate Holding
Promoters
Public & Others
32.71
2.630
13.94
34.89
15.82 Foreign
Institutions
Govt Holding
Non Promoter Corp. Hold.
Promoters
Public & Others

Charts by Spider Software India Ltd
7
EQUITY
Above calls are recommended with a time horizon of 1-2 months
Disclaimer : The analyst and its affiliates companies make no representation or warranty in relation to the accuracy, completeness or reliability of the information contained in its research. The analysis contained in the analyst research is based on numerous assumptions. Different assumptions could result in materially different results.The analyst, not any of its affiliated companies, not any of their members, directors, employees or agents accepts any liability for any loss or damage arising out of the use of all or any part of the analysis research.
SOURCE: CAPITAL LINE
®
The stock closed at ̀ 349.55 on 29thJuly 2016. It made a 52-week low at ̀ 211 on
12th February 2016 and a 52-week high at `349.45 on 27th July 2016. The 200
days Exponential Moving Average (EMA) of the stock on the daily chart is
currently at ̀ 299.36.
As we can see on the charts, it made its 52 week high on 27th July and again it
exceed that price on 29th July which shows its bullishness to make new highs in
coming weeks. One can buy in the range of 338-343 levels for the target of 365-
370 levels with SL of 327 levels.
Voltas Limited
The stock closed at ̀ 497.30 on 29th July 2016. It made a 52-week low at ̀ 346.70
on 24th August 2015 and a 52-week high of ̀ 494 on 27th July 2016. The 200 days
Exponential Moving Average (EMA) of the stock on the daily chart is currently at
`418.88.
The trend of this particular scrip remained bullish since beginning despite ups
and downs in the broader index. This signifies that it has potential to remain
upwards even though other scrip's are falling down. Moreover, it has made its
new 52 week high on 27th July of 494 levels but on 29th July it breached that
level also showing its potential to remain bullish in the near term. One can buy in
the range of 492-496 levels for the target of 525-530 levels with strict SL of 480
levels.
Zee Entertainment Enterprises Limited
DERIVATIVES
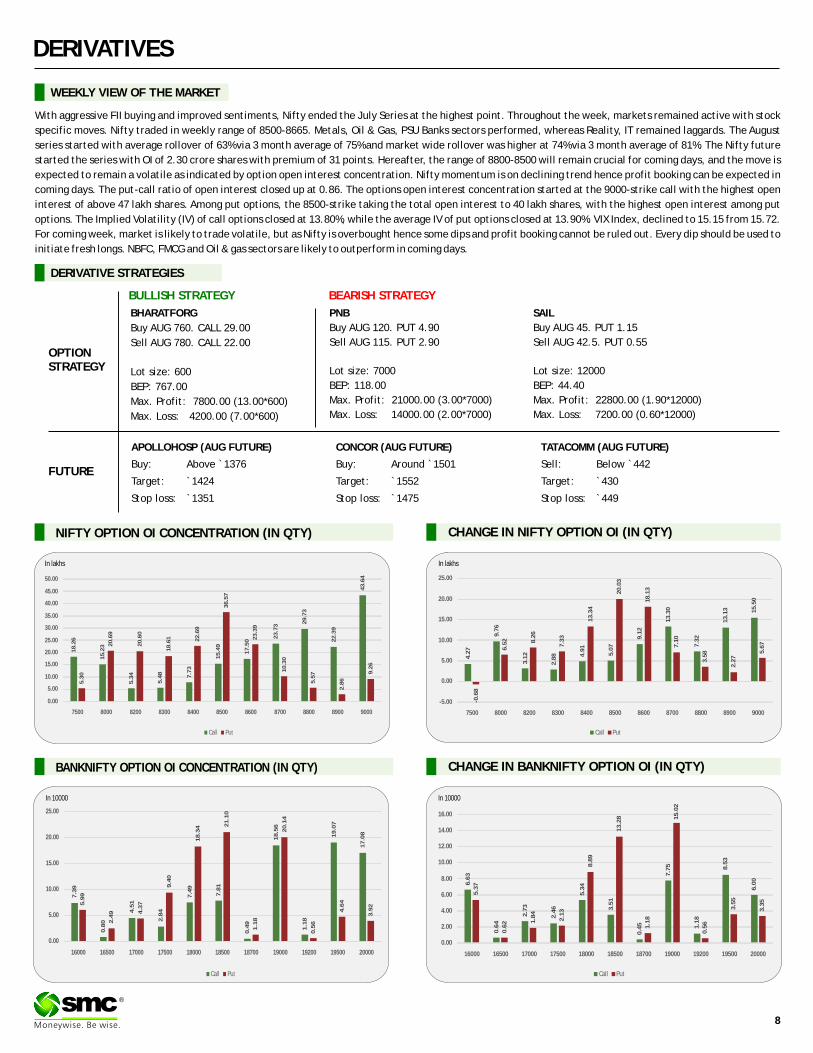
CHANGE IN NIFTY OPTION OI (IN QTY)
WEEKLY VIEW OF THE MARKET
NIFTY OPTION OI CONCENTRATION (IN QTY)
CHANGE IN BANKNIFTY OPTION OI (IN QTY)BANKNIFTY OPTION OI CONCENTRATION (IN QTY)
®
With aggressive FII buying and improved sentiments, Nifty ended the July Series at the highest point. Throughout the week, markets remained active with stock
specific moves. Nifty traded in weekly range of 8500-8665. Metals, Oil & Gas, PSU Banks sectors performed, whereas Reality, IT remained laggards. The August
series started with average rollover of 63% via 3 month average of 75% and market wide rollover was higher at 74% via 3 month average of 81%. The Nifty future
started the series with OI of 2.30 crore shares with premium of 31 points. Hereafter, the range of 8800-8500 will remain crucial for coming days, and the move is
expected to remain a volatile as indicated by option open interest concentration. Nifty momentum is on declining trend hence profit booking can be expected in
coming days. The put-call ratio of open interest closed up at 0.86. The options open interest concentration started at the 9000-strike call with the highest open
interest of above 47 lakh shares. Among put options, the 8500-strike taking the total open interest to 40 lakh shares, with the highest open interest among put
options. The Implied Volatility (IV) of call options closed at 13.80%, while the average IV of put options closed at 13.90%. VIX Index, declined to 15.15 from 15.72.
For coming week, market is likely to trade volatile, but as Nifty is overbought hence some dips and profit booking cannot be ruled out. Every dip should be used to
initiate fresh longs. NBFC, FMCG and Oil & gas sectors are likely to outperform in coming days.
In lakhs
In 10000 In 10000
APOLLOHOSP (AUG FUTURE)
Buy: Above `1376
Target: `1424
Stop loss: `1351
SAIL
Buy AUG 45. PUT 1.15
Sell AUG 42.5. PUT 0.55
Lot size: 12000
BEP: 44.40
Max. Profit: 22800.00 (1.90*12000)
Max. Loss: 7200.00 (0.60*12000)
OPTIONSTRATEGY
FUTURE
BHARATFORG
Buy AUG 760. CALL 29.00
Sell AUG 780. CALL 22.00
Lot size: 600
BEP: 767.00
Max. Profit: 7800.00 (13.00*600)
Max. Loss: 4200.00 (7.00*600)
PNB
Buy AUG 120. PUT 4.90
Sell AUG 115. PUT 2.90
Lot size: 7000
BEP: 118.00
Max. Profit: 21000.00 (3.00*7000)
Max. Loss: 14000.00 (2.00*7000)
DERIVATIVE STRATEGIES
CONCOR (AUG FUTURE)
Buy: Around `1501
Target: `1552
Stop loss: `1475
TATACOMM (AUG FUTURE)
Sell: Below `442
Target: `430
Stop loss: `449
BULLISH STRATEGY BEARISH STRATEGY
Call Put
18
.26
15
.23
5.3
4
5.4
8
7.7
3
15
.49
17
.50
23
.73
29
.73
22
.39
43
.64
5.3
0
20
.69
20
.60
18
.61 22
.69
36
.57
23
.39
10
.30
5.5
7
2.8
6
9.2
6
0.00
5.00
10.00
15.00
20.00
25.00
30.00
35.00
40.00
45.00
50.00
7500 8000 8200 8300 8400 8500 8600 8700 8800 8900 9000
Call Put
4.2
7
9.7
6
3.1
2
2.8
8 4.9
1
5.0
7
9.1
2
13
.30
7.3
2
13
.13 15
.50
-0.6
8
6.5
2 8.2
6
7.3
3
13
.34
20
.03
18
.13
7.1
0
3.5
8
2.2
7
5.6
7
-5.00
0.00
5.00
10.00
15.00
20.00
25.00
7500 8000 8200 8300 8400 8500 8600 8700 8800 8900 9000
Call Put
7.3
9
0.8
0
4.5
1
2.8
4
7.4
9
7.8
1
0.4
9
18
.56
1.1
8
19
.07
17
.08
5.9
9
2.4
9 4.3
7
9.4
0
18
.34 2
1.1
0
1.1
8
20
.14
0.5
6
4.6
4
3.9
2
0.00
5.00
10.00
15.00
20.00
25.00
16000 16500 17000 17500 18000 18500 18700 19000 19200 19500 20000
Call Put
6.6
3
0.6
4
2.7
3
2.4
6
5.3
4
3.5
1
0.4
5
7.7
5
1.1
8
8.5
3
6.0
0
5.3
7
0.6
2 1.8
4
2.1
3
8.8
9
13
.28
1.1
8
15
.02
0.5
6
3.5
5
3.3
5
0.00
2.00
4.00
6.00
8.00
10.00
12.00
14.00
16.00
16000 16500 17000 17500 18000 18500 18700 19000 19200 19500 20000
8
In lakhs
9
DERIVATIVES
®
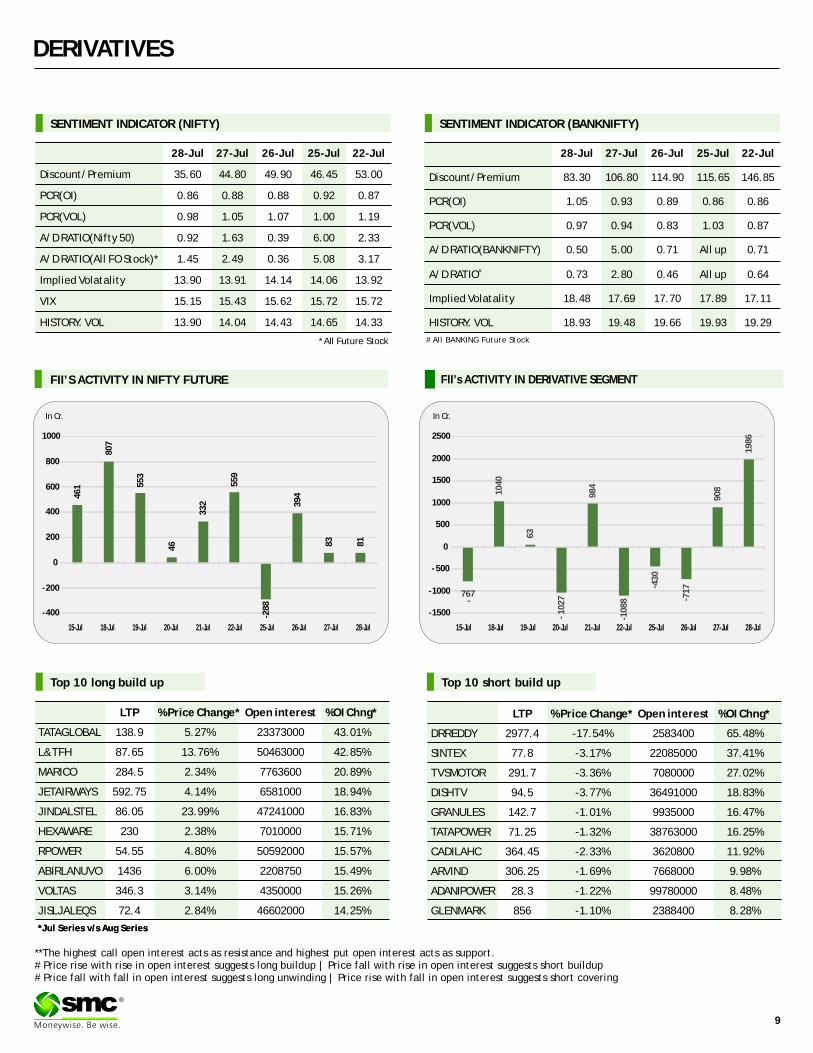
FII’s ACTIVITY IN DERIVATIVE SEGMENT
SENTIMENT INDICATOR (NIFTY)
28-Jul 27-Jul 26-Jul 25-Jul 22-Jul
Discount/Premium 35.60 44.80 49.90 46.45 53.00
PCR(OI) 0.86 0.88 0.88 0.92 0.87
PCR(VOL) 0.98 1.05 1.07 1.00 1.19
A/D RATIO(Nifty 50) 0.92 1.63 0.39 6.00 2.33
A/D RATIO(All FO Stock)* 1.45 2.49 0.36 5.08 3.17
Implied Volatality 13.90 13.91 14.14 14.06 13.92
VIX 15.15 15.43 15.62 15.72 15.72
HISTORY. VOL 13.90 14.04 14.43 14.65 14.33
*All Future Stock
SENTIMENT INDICATOR (BANKNIFTY)
28-Jul 27-Jul 26-Jul 25-Jul 22-Jul
Discount/Premium 83.30 106.80 114.90 115.65 146.85
PCR(OI) 1.05 0.93 0.89 0.86 0.86
PCR(VOL) 0.97 0.94 0.83 1.03 0.87
A/D RATIO(BANKNIFTY) 0.50 5.00 0.71 All up 0.71
#A/D RATIO 0.73 2.80 0.46 All up 0.64
Implied Volatality 18.48 17.69 17.70 17.89 17.11
HISTORY. VOL 18.93 19.48 19.66 19.93 19.29
FII’S ACTIVITY IN NIFTY FUTURE
**The highest call open interest acts as resistance and highest put open interest acts as support.# Price rise with rise in open interest suggests long buildup | Price fall with rise in open interest suggests short buildup # Price fall with fall in open interest suggests long unwinding | Price rise with fall in open interest suggests short covering
# All BANKING Future Stock
Top 10 short build upTop 10 long build up
LTP % Price Change* Open interest %OI Chng*
TATAGLOBAL 138.9 5.27% 23373000 43.01%
L&TFH 87.65 13.76% 50463000 42.85%
MARICO 284.5 2.34% 7763600 20.89%
JETAIRWAYS 592.75 4.14% 6581000 18.94%
JINDALSTEL 86.05 23.99% 47241000 16.83%
HEXAWARE 230 2.38% 7010000 15.71%
RPOWER 54.55 4.80% 50592000 15.57%
ABIRLANUVO 1436 6.00% 2208750 15.49%
VOLTAS 346.3 3.14% 4350000 15.26%
JISLJALEQS 72.4 2.84% 46602000 14.25%
LTP % Price Change* Open interest %OI Chng*
DRREDDY 2977.4 -17.54% 2583400 65.48%
SINTEX 77.8 -3.17% 22085000 37.41%
TVSMOTOR 291.7 -3.36% 7080000 27.02%
DISHTV 94.5 -3.77% 36491000 18.83%
GRANULES 142.7 -1.01% 9935000 16.47%
TATAPOWER 71.25 -1.32% 38763000 16.25%
CADILAHC 364.45 -2.33% 3620800 11.92%
ARVIND 306.25 -1.69% 7668000 9.98%
ADANIPOWER 28.3 -1.22% 99780000 8.48%
GLENMARK 856 -1.10% 2388400 8.28%
In Cr. In Cr.
46
1
80
7
55
3
46
33
2
55
9
-28
8
39
4
83
81
-400
-200
0
200
400
600
800
1000
15-Jul 18-Jul 19-Jul 20-Jul 21-Jul 22-Jul 25-Jul 26-Jul 27-Jul 28-Jul
-767
10
40
63
-1
02
7
98
4
-10
88
- 43
0
- 71
7
90
8
19
86
-1500
-1000
- 500
0
500
1000
1500
2000
2500
15-Jul 18-Jul 19-Jul 20-Jul 21-Jul 22-Jul 25-Jul 26-Jul 27-Jul 28-Jul
*Jul Series v/s Aug Series*Jul Series v/s Aug Series
10
®
Turmeric futures (Aug) is expected to trade sideways in a broader range of 7900-8400 levels with downside getting capped. The yellow spice is witnessing steady tone in major market across the country due to normal buying by local and upcountry traders. Demand for turmeric is hand-to-mouth, but in days to come it is expected to improve as stockists are unlikely to liquidate their stocks easily at the lower rates. Further turmeric stocks in the country are balanced at present. The traders are choosing to procure quality turmeric at Erode spot markets & quoting higher price for the quality turmeric. Cardamom futures (Aug) is looking bullish & can test 1000 levels. This season there may be delay in harvesting owing to which the capsules prices is expected to rise sharply from an anticipated decline in output. An unusually long summer without rains has delayed the harvest, which is now likely only by the end of August or in September. The market is currently running on carryover stock from the previous year. Moreover, it is reported that in Idukki, a decaying disease that has afflicted the crop in the heavy rains. The disease has spread its tentacles in a very short span of time. Jeera futures (Aug) is expected to consolidate in the range of 18550-20000 levels. A lower level buying may emerge from levels & any little more correction will attract good demand due to tight supply-demand balance sheet. Meanwhile China and Bangladesh have bought cumin heavily so far this season and export demand is likely to continue to witness an upside, as other producing countries are not well placed for supplies.
SPICES
Soybean futures (Oct) is expected to fall further & can test 3550-3520 levels. The fundamentals have turned bearish in the domestic markets & the counter is also expected to take negative cues from the international market as well. Soybean is trading sideways with a downside bias in major markets of Madhya Pradesh and Maharashtra in the absence of any encouraging cues. In days to come, soybean prices will largely depended on demand soybean meal, as the other by-product refined soy oil is imported in large quantity to meet domestic demand. The ratio of realization from soybean crushing between meal and oil used to be 55:45 & has now changed to 72:28 because of falling oil prices. And lower realizations from oil have made it difficult to export our meal at competitive rates. On CBOT, U.S soybean futures (Nov) U.S. soybeans may extend is downside towards $9.40 levels & is poised to record its biggest one-month fall in more than two years as concerns over unfavourable weather eased, boosting expectations for bumper supplies. The downside in mustard futures (Aug) may get extended towards 4750-4720 levels. Mustard seed have started declining pressured on sluggish demand & slowdown in demand for mustard oil at higher level. Mustard seed prices at Jaipur market dropped further ̀ 50 at ̀ 5,000/100kg. CPO futures (Aug) is expected to consolidate in the range of 485-505 levels, while refined soy oil futures (Sep) may get slippery & fall towards 620 levels, pressured by strength in rupee. Moreover, the improving weather condition in the country which has raised hopes for better than expected oil seed production, and may result more supply of edible oil.
OIL AND OILSEEDS
OTHER COMMODITIES
Kapas futures (Apr) is expected to witness a steep fall towards 950 levels, if breaks 1000 levels. Spinning units are still in the wait and watch phase and do not want to incur major losses after production of yarn has been eating the profitability of the millers. Further disparity in yarn and shortage of cotton with higher prices has forced many mills in the North India to cut down production by going on production holiday for 1-3 days. The correction phase in Mentha oil futures (Aug) is likely to continue as the counter can test 890-880 levels in days to come. Mentha oil dropped on the spot markets after recent strong rise amid slow lackluster demand. Mentha oil prices surged more than 16 percent this month, which has prompted long liquidation at the higher level. The downtrend in guar seed (Oct) will possibly continue & bring down the prices towards 3440 levels, while bearish crude oil prices can put pressure on guar gum & in days to come, the current month contract (Oct) can test 6140 levels. Recent consistent fall in crude oil and strong selling on futures at the higher level pushed spot Guarseed & Guargum lower at the spot markets. Moreover, this season average Guar seed yield in Rajasthan likely to be around 500 -600 kilogram per hectare Sugar futures (Oct) can turn bearish & witness 3780-3750 levels. The selling pressure over the counter is expected to rise as the central government is mulling whether to impose stock limits for sugar millers and restrictions on domestic sales by fixing a quota on each mill, to tame retail prices, currently Rs 43 a kg.
Bullion counter is expected to trade on upside path as Fed kept interest rate unchanged in July meeting and weaker greenback. Movement of local currency rupee can also affect the prices as it can move in the range of 66-68 in MCX. Gold can trade in the range of 30500-31800 while silver can move in the range of 45500-48500 in near term. Recently safe haven demand can lift the gold prices. Recently, Bank of Japan expanded monetary stimulus through a modest increase in purchases of exchange-traded funds, yielding to pressure from the government and financial markets for bolder action to spur growth and accelerate inflation towards its 2 percent target. After its two-day policy meeting, the Fed elected not to raise interest rates, as economists had expected, though it said near-term risks to the economy have diminished. The optimistic statement leaves the door open for a rate increase as early as September, though officials offered no specifics on timing. The dovish Fed policy is a boon for gold, which as a non-interest-bearing asset fares well compared with yield-bearing assets when borrowing costs are low. The timing of future interest-rate increases will depend on the strength of economic data in the coming months. SPDR Gold Trust, the world's largest gold-backed exchange traded fund, holdings stood at 954.23 tonnes recently. Physical gold in India, the world's second-biggest consumer, was at a discount of $52 an ounce to the global spot benchmark, lower from last week's discounts of about $40, as retail demand was dampened.
BULLIONS
Crude oil prices can continue its downside movement amid fear of supply glut and lack of demand can keep the prices under pressure. Overall it can move in the range of 2600-2950 in MCX. U.S. crude headed for its biggest monthly loss in a year, on growing worries that the world was pumping more crude than needed. Surplus barrels of gasoline already have made the glut developing in oil this year more worrisome to some than the crude oversupply of the past two years that had halved prices. U.S. Gulf Coast gasoline stocks hit record highs for the month of July while East Coast inventories reached all-time peaks. The EIA reported that weekly US crude oil production rose by 21,000 bpd (barrels per day) to 8,515,000 barrels per day from July 15–22, 2016 as production rose by 0.25% week-over-week. US crude oil production peaked at 9.6 MMbpd in June 2015. In contrast, it hit a low of 8.4 MMbpd for the week ended July 1, 2016. It was the lowest level since June 2014.Natural gas may continue its bullish momentum on good demand amid hot temperatures in US .It can test 210 in MCX. The EIA reported that U.S. working stocks of natural gas totaled about 3.294 trillion cubic feet, around 524 billion cubic feet above the five-year average of 2.770 trillion cubic feet and 436 billion cubic feet above last year's total for the same period. Unless intense summer heat boosts demand from power plants, stockpiles will test physical storage limits of 4.3 trillion cubic feet at the end of October.
ENERGY COMPLEX
In base metal counter, nickel may continue to head higher amid supply concerns while Aluminum can witness lower level buying. Red metal copper may move in the range of 320-344. Demand for copper in China, which accounts for nearly 50 percent of global consumption estimated at around 22 million tonnes this year, has fallen sharply in recent years as growth and investment spending has slowed. Copper output in Peru rose 42 percent in June compared with the same month in 2015. Lead can hover in the range of 117-125. Zinc can move in the range of 143-153. MMG, based in Melbourne and owned by China Minmetals Corp., expects to produce 120,000 tons to 135,000 tons of zinc in 2016 from mines in Australia. Chinese-owned MMG Ltd. is seeking new zinc mines in Peru, which has the world's third-largest reserves, after a dearth of global exploration in past decades led to an output crunch. Aluminum can move in the range of 105-111 levels in near term. Stocks of aluminium registered with the London Metal Exchange (LME), for example, have fallen by 577,275 tonnes, or almost 20 percent, so far this year. Norway's Norsk Hydro has just revised upwards its Chinese demand growth forecast for this year to 5-7 percent from a previous 3.5 percent. Nickel may trade higher and can test 760 in this week. Philippine President Rodrigo Duterte, who began a six-year term on June 30, has warned he could cancel mining projects causing environmental harm, suggesting a tough regulatory road ahead for Philippine miners. Local nickel ore producers are the biggest suppliers to China.
BASE METALS
11
TECHNICAL RECOMMENDATIONS
COMMODITY
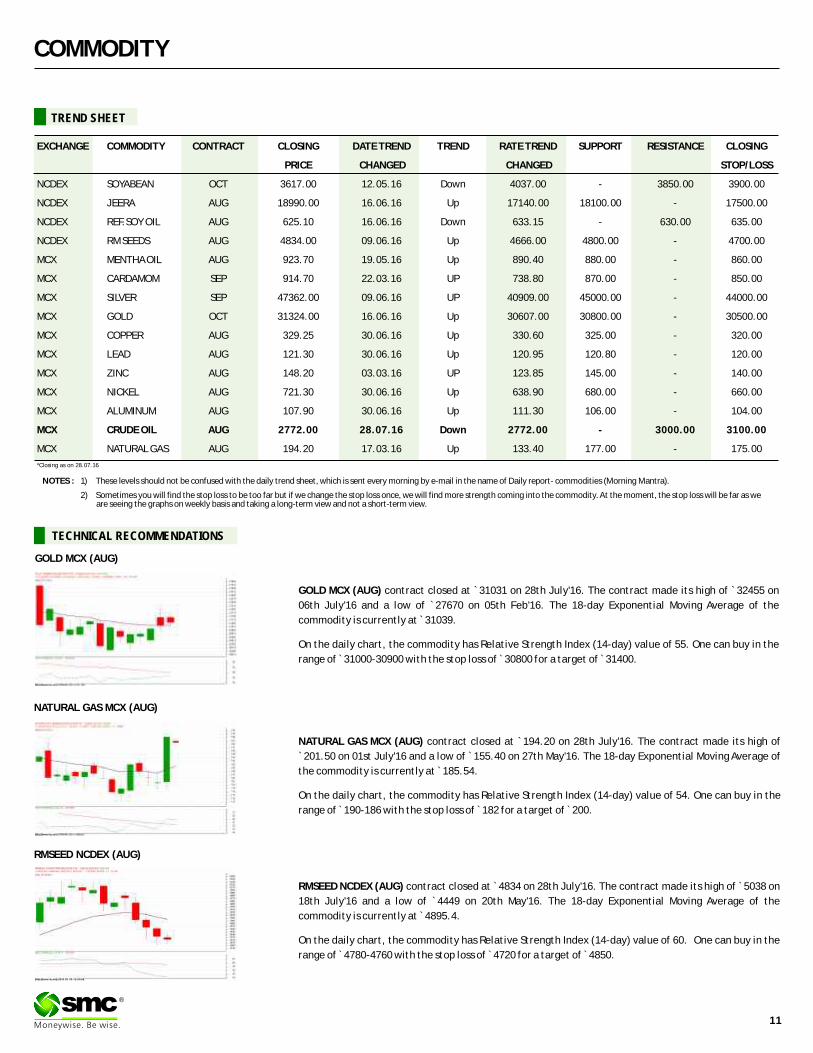
GOLD MCX (AUG) contract closed at `31031 on 28th July'16. The contract made its high of 32455 on
06th July'16 and a low of `27670 on 05th Feb'16. The 18-day Exponential Moving Average of the
commodity is currently at ̀ 31039.
On the daily chart, the commodity has Relative Strength Index (14-day) value of 55. One can buy in the
range of ̀ 31000-30900 with the stop loss of ̀ 30800 for a target of ̀ 31400.
`
NATURAL GAS MCX (AUG) contract closed at 194.20 on 28th July'16. The contract made its high of
`201.50 on 01st July'16 and a low of ̀ 155.40 on 27th May'16. The 18-day Exponential Moving Average of
the commodity is currently at ̀ 185.54.
On the daily chart, the commodity has Relative Strength Index (14-day) value of 54. One can buy in the
range of ̀ 190-186 with the stop loss of ̀ 182 for a target of ̀ 200.
`
RMSEED NCDEX (AUG) contract closed at 4834 on 28th July'16. The contract made its high of 5038 on
18th July'16 and a low of `4449 on 20th May'16. The 18-day Exponential Moving Average of the
commodity is currently at ̀ 4895.4.
On the daily chart, the commodity has Relative Strength Index (14-day) value of 60. One can buy in the
range of ̀ 4780-4760 with the stop loss of ̀ 4720 for a target of ̀ 4850.
` `
®
GOLD MCX (AUG)
NATURAL GAS MCX (AUG)
RMSEED NCDEX (AUG)
NOTES : 1) These levels should not be confused with the daily trend sheet, which is sent every morning by e-mail in the name of Daily report- commodities (Morning Mantra).
2) Sometimes you will find the stop loss to be too far but if we change the stop loss once, we will find more strength coming into the commodity. At the moment, the stop loss will be far as we are seeing the graphs on weekly basis and taking a long-term view and not a short-term view.
EXCHANGE COMMODITY CONTRACT CLOSING DATE TREND TREND RATE TREND SUPPORT RESISTANCE CLOSING
PRICE CHANGED CHANGED STOP/LOSS
NCDEX SOYABEAN OCT 3617.00 12.05.16 Down 4037.00 - 3850.00 3900.00
NCDEX JEERA AUG 18990.00 16.06.16 Up 17140.00 18100.00 - 17500.00
NCDEX REF.SOY OIL AUG 625.10 16.06.16 Down 633.15 - 630.00 635.00
NCDEX RM SEEDS AUG 4834.00 09.06.16 Up 4666.00 4800.00 - 4700.00
MCX MENTHA OIL AUG 923.70 19.05.16 Up 890.40 880.00 - 860.00
MCX CARDAMOM SEP 914.70 22.03.16 UP 738.80 870.00 - 850.00
MCX SILVER SEP 47362.00 09.06.16 UP 40909.00 45000.00 - 44000.00
MCX GOLD OCT 31324.00 16.06.16 Up 30607.00 30800.00 - 30500.00
MCX COPPER AUG 329.25 30.06.16 Up 330.60 325.00 - 320.00
MCX LEAD AUG 121.30 30.06.16 Up 120.95 120.80 - 120.00
MCX ZINC AUG 148.20 03.03.16 UP 123.85 145.00 - 140.00
MCX NICKEL AUG 721.30 30.06.16 Up 638.90 680.00 - 660.00
MCX ALUMINUM AUG 107.90 30.06.16 Up 111.30 106.00 - 104.00
MCX CRUDE OIL AUG 2772.00 28.07.16 Down 2772.00 - 3000.00 3100.00
MCX NATURAL GAS AUG 194.20 17.03.16 Up 133.40 177.00 - 175.00
TREND SHEET
*Closing as on 28.07.16
COMMODITY
NEWS DIGEST
The week gone by was an eventful week. Big movements were witnessed in many
commodities. The Federal Reserve on last Wednesday left key interest rates untouched but
acknowledged improved economic performance, suggesting a rate increase may be on the
horizon in 2016. FED said near-term economic risks have diminished and the labor market has
strengthened. More positive language compared with the last meeting prompted some
speculation that U.S. data may be strong enough to permit a rate increase this year, possibly as
early as September. Gold and silver spiked on unchanged interest rate and steep fall was seen
in dollar index. However, it was a bad week, infact a bad month for crude oil. Crude crumbled
to three-month lows of $42.36 a barrel on Tuesday, which leaves oil down 12% in July alone.
The world still seems to have more oil than it needs -- and the epic supply glut has even spread
into gasoline. Gasoline inventories are sitting at the highest levels ever for this time of the
year, despite the fact that it is the heart of summer driving season. Natural gas saw a massive
rise. Natural-gas futures rallied by 8% on last Thursday, their largest one-day percentage gain
of the year, as U.S. government data revealed a smaller-than-expected weekly climb in
domestic inventories, lifting prices to their highest level in nearly a month. Base metal prices
moved down on weaker than expected US durable goods and other economic data, except
nickel. 339 is a good resistance for copper in MCX. Aluminium has hit the lowest in the month.
Copper prices were also pressured by rising copper supply, highlighted when Grupo Mexico's
April-June data showed copper output surging 22.7 per cent to 266,071 tons from the same
2015 period.
In agri commodities, jeera declined in the absence of any encouraging cues from buying side at
higher levels. However, traders preferred profitbooking at higher side. Cardamom and dhaniya
moved up on fresh buying. Oil seeds and edible oil complex declined on sluggish demand.
Mentha saw profitbooking at higher levels. Guargum and guar seed futures traded in lower
circuits as demand sluggished in spot market after a steep rise in prices.
WEEKLY COMMENTARY
COMMODITY UNIT 28.07.16 DIFFERENCEQTY. QTY.
29MM COTTON NEW BALES 1600.00 0.00 -1600.00BARLEY MT 10432.00 10432.00 0.00CHANA MT 212.00 171.00 -41.00CORIANDER NEW MT 4246.00 4645.00 399.00COTTON SEED OILCAKE MT 34974.00 34626.00 -348.00GUARGUM MT 30153.00 28993.00 -1160.00GUARSEED MT 26749.00 23725.00 -3024.00JEERA NEW MT 5006.00 5610.00 604.00MAIZE MT 11274.00 11334.00 60.00RM SEED MT 54077.00 52143.00 -1934.00SOYABEAN MT 9022.00 3225.00 -5797.00SUGAR MT 9941.00 8713.00 -1228.00TURMERIC MT 5921.00 6171.00 250.00WHEAT MT 15967.00 15967.00 0.00
21.07.16 COMMODITY UNIT 28.07.16 DIFFERENCE
QTY. QTY.
CARDAMOM MT 13.90 2.90 -11.00
COTTON BALES 19000.00 17100.00 -1900.00
GOLD KGS 157.00 157.00 0.00
GOLD MINI KGS 314.30 314.30 0.00
GOLD GUINEA KGS 13.55 13.55 0.00
MENTHA OIL KGS 2113118.38 2503965.38 390847.00
SILVER (30 KG Bar) KGS 31091.13 30933.18 -157.96
21.07.16
•US new Durable Goods Orders dipped by 4.0% on the July month, falling considerably below consensus estimates of a 1.3% decline.
•China's refined fuel inventories fell 2.93% at the end of June from the preceding month to 19.0 million tonnes.
•Chilean copper miner Antofagasta said full-year copper production would be at the lower end of the 710,000 to 740,000 tonnes it predicted in January.
•China produced 229.102 tonnes of gold in the first half of this year, up 0.16% from the same period a year earlier.
•U.S. consumer confidence held steady in July and new single-family home sales hit their highest level in nearly 8-1/2 years in June.
•In a first, the government is planning to launch a cotton price index of its own, taking into account benchmark rates from four different sources.
•NCDEX informed that all futures contracts in Chana will be closed with immediate effect. The remaining outstanding positions at the close of trading day on July 27, 2016 will be closed out at the volume weighted average of futures price of Rs. 8,055 / quintal August 2016 contract traded on July 27, 2016.
•NCDEX raises margin for less liquid commodities such as Chana, Sugar (M Grade), Barley, Chilli Teja, Coriander, Guar Gum, Jeera, Turmeric.
•In a move to attract more overseas capital, the government today allowed a foreign company to own up to 15% in the domestic stock or commodity exchanges as against 5% currently.
WEEKLY STOCK POSITIONS IN WAREHOUSE (MCX)
12
®
WEEKLY STOCK POSITIONS IN WAREHOUSE (NCDEX)
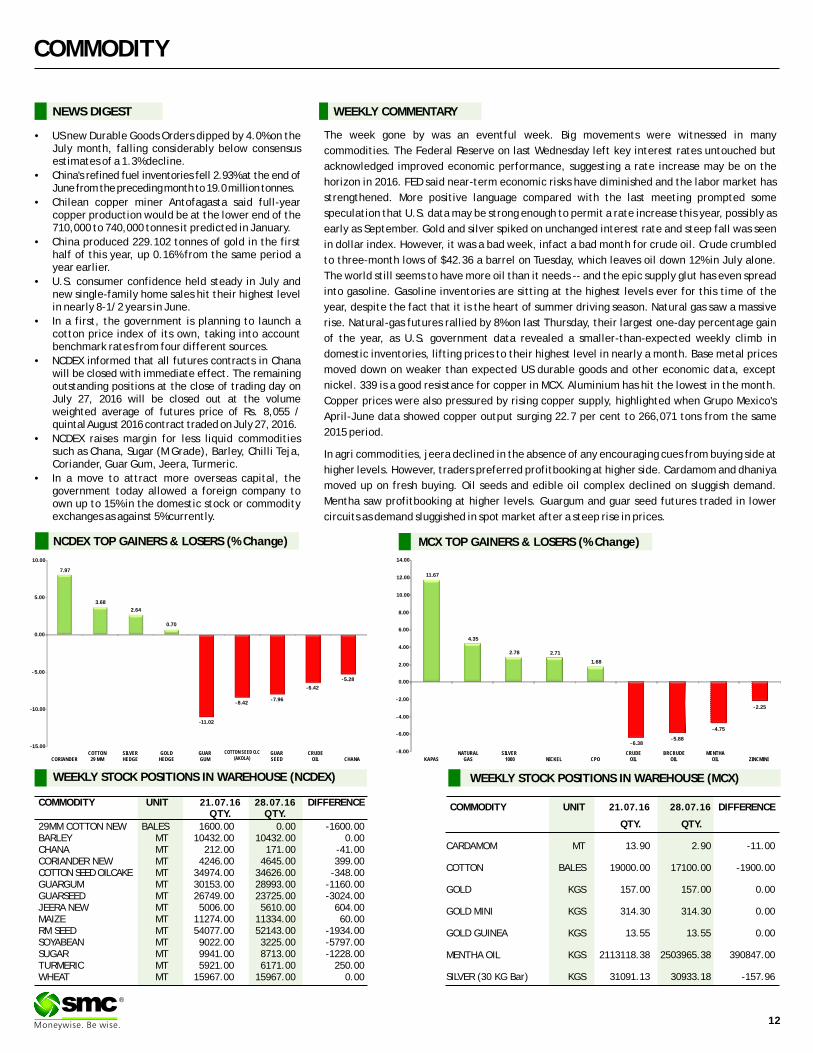
NCDEX TOP GAINERS & LOSERS (% Change) MCX TOP GAINERS & LOSERS (% Change)
7.97
3.68
2.64
0.70
-11.02
-8.42-7.96
-6.42
-5.28
-15.00
-10.00
- 5.00
0.00
5.00
10.00
CORIANDERCOTTON
29 MMSILVER HEDGE
GOLD HEDGE
GUAR GUM
COTTON SEED O.C (AKOLA)
GUAR SEED
CRUDEOIL CHANA
11.67
4.35
2.78 2.71
1.68
-6.38-5.88
-4.75
-2.25
-8.00
-6.00
-4.00
-2.00
0.00
2.00
4.00
6.00
8.00
10.00
12.00
14.00
KAPASNATURAL
GASSILVER 1000 NICKEL CPO
CRUDEOIL
BRCRUDEOIL
MENTHAOIL ZINCMINI

COMMODITY
COMMODITY EXCHANGE CONTRACT 22 28.07.16 CHANGE%
ALUMINIUM LME 3 MONTHS 1611.00 1609.00 -0.12
COPPER LME 3 MONTHS 4920.00 4896.50 -0.48
LEAD LME 3 MONTHS 1840.00 1803.00 -2.01
NICKEL LME 3 MONTHS 10410.00 10695.00 2.74
ZINC LME 3 MONTHS 2245.00 2205.00 -1.78
GOLD COMEX AUG 1323.40 1332.30 0.67
SILVER COMEX SEP 19.69 20.19 2.55
LIGHT CRUDE OIL NYMEX AUG 44.19 41.14 -6.90
NATURAL GAS NYMEX AUG 2.78 2.87 3.46
.07.16
PRICES OF METALS IN LME/ COMEX/ NYMEX (in US $)
WEEKLY STOCK POSITIONS IN LME (IN TONNES)
COMMODITY STOCK POSITION STOCK POSITION DIFFERENCE
21.07.16 28.07.16
ALUMINIUM 2297450 2318125 20675
COPPER 228000 214425 -13575
NICKEL 377202 374652 -2550
LEAD 185850 187150 1300
ZINC 437950 435600 -2350
INTERNATIONAL COMMODITY PRICES
COMMODITY EXCHANGE CONTRACT UNIT 22.07.16 28.07.16 CHANGE(%)
Soybean CBOT NOV Cent per Bushel 988.25 978.00 -1.04
Corn CBOT DEC Cent per Bushel 341.75 338.75 -0.88
CPO BMD OCT MYR per MT 2320.00 2300.00 -0.86
Sugar LIFFE AUG 10 cents per MT 537.80 518.10 -3.66
13
®
SPOT PRICES (% change) Kharif Crop sowing on fast track
Due to better monsoon rains so far in the current monsoon season the total sown area as on 22nd July, 2016 as per reports received from States, stands at 692.98 lakh hectare as compared to 671.01 lakh hectare at this time last year. As on July 25, the countrywide cumulative rainfall is 14% above the normal. Kharif sowing will continue for another 25-30 days.
As per reports, it is reported that rice has been sown/transplanted in 183.06 lakh ha, compared with 182.38 lakh hectares last year. Coarse cereals area was estimated 3.59 percent higher at 130.8 lakh hectares compared with 126.27 lakh hectares last year
The better news come on pulses acreage as it has turned sharply up at 90.17 lakh hectares from 64.69 lakh hectares in 2015-16. Pulses are equally increasing the misery of the people and government as the the availability of pulses are going away from the lower and middle income group due to skyrocketing prices.
Oilseed acreage also recovered and turned positive by 4.29 percent at 149.16 lakh hectares against 143.03 lakh hectares, whereas cotton has been sown in 86.86 lakh hectares, down 12.72 percent from 99.52 lakh hectares a year ago.
The details of the area covered so far and that covered during this time last year are given below(in lakh hectare):
The trend of fast sowing so far indicates to a better kharif crop this year, although the output would also depend on how rains perform in the rest of the season till September. Better production of pulses and oilseed will ease the pressure form government to import the commodities to curb the inflation. It will also boost the Indian economy.
-9.72
-7.07
-5.99
-4.65
-2.43
-2.34
-1.94
-1.37
-0.70
-0.58
-0.38
-0.26
0.15
0.51
0.79
1.36
2.08
4.37
-12.00 -10.00 -8.00 -6.00 -4.00 -2.00 0.00 2.00 4.00 6.00
GUAR GUM (JODHPUR)
RAW JUTE (KOLKATA)
GUAR SEED (JODHPUR)
CHANA (DELHI )
COTTON SEED OIL CAKE (AKOLA)
CRUDE PALM OIL (KANDLA)
MUSTARD (JAIPUR)
COTTON (KADI)
TURMERIC (NIZAMABAD)
PEPPER MALABAR GAR (KOCHI)
WHEAT (DELHI)
SOYABEAN (INDORE)
JEERA (UNJHA)
SUGAR (KOLKATA)
CORIANDER (KOTA)
BARLEY (JAIPUR)
GUR (MUZAFFARNGR.)
SILVER 5 KG (DELHI)
Source : MOA

CURRENCY
Currency Table
Currency Pair Open High Low Close
USD/INR 67.19 67.46 67.18 67.38
EUR/INR 73.75 74.92 73.75 74.73
GBP/INR 88.19 89.16 88.02 88.72
JPY/INR 63.18 64.71 63.17 64.34
(Source: Reliable Software, Open: Monday 9.00 AM IST, Close: Thursday (5.00 PM IST)
News Flows of last week
25th Jul Dollar weakens against yen before Fed, BOJ meetings
25th Jul Japan FY2020 budget deficit to narrow to 5.5 trillion yen - sources
26th Jul U.S. crude hits three-month low; API reports smaller crude draw
27th Jul Fed leaves rates unchanged, says risks to outlook reduced
28th Jul U.S. stocks rebound, yen weakens on BOJ stimulus report
28th Jul Japan jobless rate falls to 3.1 percent in June
EUR/INR (AUG) contract closed at 74.73 on 28th July'16. The contract made its high of 74.92 on 28th July'16 and a low of 73.75 on 25th July '16 (Weekly Basis). The 14-day Exponential Moving Average of the EUR/INR is currently at 74.39.
On the daily chart, EUR/INR has Relative Strength Index (14-day) value of 50.28. One can buy above 74.30 for a target of 75.05 with the stop loss of 73.95.
JPY/NR (AUG) contract closed at 64.34 on 28th July'16. The contract made its high of 64.71 on 26thJuly '16 and a low of 63.17 on 25 July'16 (Weekly Basis). The 14-day Exponential Moving Average of the JPY/INR is currently at 64.07.
On the daily chart, JPY/INR has Relative Strength Index (14-day) value of 51.59. One can buy above 64.80 for a target of 65.80 with the stop loss of 64.20.
Market Stance
Indian rupee slightly gained against dollar in the week gone by. The rupee
gained against dollar due to sustained selling of the US dollar by banks and
exporters, prompted by persistent foreign capital inflows. The US Federal
Reserve on Wednesday maintain status quote and kept the interest rate
unchanged which resulted foreign institutional investors (FIIs) interest to buy
local equities and bonds in the Indian markets. The dollar had dropped against
other currencies overseas as well after the United States Federal Reserve left
interest rates untouched. The rupee also benefited from the Cabinet's
approval to the goods and services tax. The American currency fell against yen
on Friday after the Bank of Japan's stimulus fell short of market expectations.
A favourable outcome from the US Federal Reserve's rate-setting meeting and
positive June quarter earnings amid a renewed push for GST reforms lifted the
domestic stock market.
EUR/INR
USD/INR (AUG) contract closed at 67.38 on 28th July'16. The contract made its high of 67.46 on 26th July'16 and a low of 67.18 on 25thJuly'16 (Weekly Basis). The 14-day Exponential Moving Average of the USD/INR is currently at 67.30.
On the daily chart, the USD/INR has Relative Strength Index (14-day) value of 49.78. One can buy around 67.20 for the target of 67.90 with the stop loss of 66.85
GBP/INR (AUG) contract closed at 88.72 on 28th July'16. The contract made its high of 89.16 on 28th July'16 and a low of 88.02 on 26th July '16 (Weekly Basis). The 14-day Exponential Moving Average of the GBP/INR is currently at 88.95.
On the daily chart, GBP/INR has Relative Strength Index (14-day) value of 40.06. One can buy above 89.15 for a target of 90.10 with the stop loss of 88.65.
USD/INRTechnical Recommendation
Economic gauge for the next week
Date Currency Event Previous
01-Aug USD ISM Manufacturing PMI(Jul) 53.2
02-Aug JPY BoJ Monetary Policy Meeting Minutes (Japan )
03-Aug EUR Non-monetary policy's ECB meeting
03-Aug EUR Markit PMI Composite(Jul) 52.9
03-Aug USD ADP Employment Change(Jul) 172K
03-Aug USD Markit PMI Composite(Jul) 51.5
04-Aug GBP BoE Asset Purchase Facility(Aug) £ 375B
04-AUG GBP BoE Interest Rate Decision 0.5%
04-Aug USD Initial Jobless Claims (Jul 29) 226K
04-Aug USD Factory Orders (MoM) (Jun) -1%
05-Aug USD Nonfarm Payrolls(Jul) 287K
05-Aug USD Unemployment Rate(Jul) 4.9%
GBP/INR JPY/INR
14
®

IPO
Issue Composition
Offer for sale 10,227,273Fresh issue 19,634,703Total Issue for Sale 29,861,976QIB 14,930,988
In shares
Book Running Lead ManagerAxis Capital LimitedIIFL Holdings LimitedJM Financial Institutional Securities Limited*PNB Investment Services Limited
Name of the registrarLink Intime India Private Limited
Industry Construction
Total Issue (Shares) - Offer for sale 10,227,273
Total Issue (Shares) - Fresh Issue 19,634,703
Net Offer to the Public 29,861,976
Issue Size (`Cr.) 640-654
Price Band (`) 214-219
Offer Date 1-Aug-16
Close Date 3-Aug-16
Face Value 10
Lot Size 65 Equity Shares
Issue Highlights
DILIP BUILDCON LTD
Shareholding Pattern (%)
Particulars Pre-issue Post issue
Promoters & promoters group 90.25% 75.63%
QIB 9.75% 13.45%
NIB 0.00% 3.28%
Retail 0.00% 7.64%
Total 100.00% 100.00%
Objects of the Issue
The proceeds from the fresh issue will be
utilised towards the following objects:
A. Prepayment or scheduled repayment of a
portion of term loans availed by the
company;
B. To meet working capital requirements; and
C. General corporate purposes.
Business Overview
Incorporated in 2006, Dilip Buildcon Ltd is Bhopal, MP based Engineering, Procurement and Construction (EPC) contractor focused on road projects in India. Company's core business is undertaking construction projects across India in the roads and irrigation sectors. It is specialized in constructing state and national highways, city roads, culverts and bridges. The company is expanded into the irrigation and urban development businesses.
Strengths
One of the Leading Road-focused EPC Contractor: The Company is one of the leading road-focused EPC contractors in India. The operations of the company have expanded rapidly to include working with central Government agencies such as NHAI and the Ministry of Road Transport and Highways in Madhya Pradesh, Andhra Pradesh, Rajasthan, Karnataka, Uttar Pradesh, Tamil Nadu and Telangana, as well as private firms.
Efficient business model: The growth of the company is largely attributable to its efficient business model of careful selection and geographical clustering of its projects. This model has facilitated maximum efficiency and profitability.
Excellent execution track record through strong operating systems and controls: For the five Financial Years ended March 31, 2016, the company has completed 36 EPC projects and 11 BOT projects, with most of these projects completed on or ahead of their respective scheduled completion dates or completion dates rescheduled by its counterparties.
Strong financial performance and credit profile: The business growth of the company during the last five Financial Years contributed significantly to its financial strength. Its order book of Rs. 10778.73 crore as of March 31, 2016 provides the company with strong revenue visibility. It has achieved a CAGR of 38.18% of revenue growth on a consolidated basis for the five-year period ended March 31, 2016.
Visible growth through a robust order book and excellent pre-qualification credentials: The order book of the company has grown significantly over the last four financial years, from Rs. 3320 crore as of March 31, 2013 to Rs. 5160.90 crore as of March 31, 2014 and Rs. 7474.70 crore as of March 31, 2015 and Rs. 10778.73 crore as of March 31, 2016, with government contracts accounting for 76.27% and private contracts accounting for 23.73% of its order book.
Continue focusing on enhancing execution efficiency: The Company intends to continue to focus on performance and project execution in order to maximize client satisfaction and profit margins. It also intends to integrate best practices from different sectors and geographic regions.
Diversify into new businesses: Strong government support and increasing business volume in some segments, such as irrigation and urban development, are providing the company with exciting opportunities to further develop its business and achieve higher profitability.
Strategy
Continue focusing on on-time delivery and quality execution: The Company intends to focus on performance and project execution in order to maximize client satisfaction and profit margin and also to integrate best practices from different sectors and geographic regions.
Increase competitiveness through continuous focus on EPC business: By focusing on EPC projects, the company intends to increase engineering and procurement capabilities. Moreover, track record in the construction business will provide with a significant advantage in pursuing opportunities in this line of business.
Achieve higher efficiency and profitability through project clustering: The company intends to maintain focus on geographically clustering of its projects to further improve business and financial performance and create project clusters outside of Madhya Pradesh.
Enhance system of equipment usage, procurement and manpower: The Company intends to further enhance its execution efficiency and improve operating systems of equipment usage, procurement and manpower; also intend to strive to ensure continuous availability of equipment for its projects and exercise better control over the execution of all projects.
Strengthen IT systems and other internal processes to reduce manual intervention: The company is in the process of upgrading its existing IT systems and currently is in the process of installing an ERP system, increase data security, increase funding for improving IT systems and train and retain competent IT staff.
Develop relationship with clients and optimize client mix: To mprove profitability and cash flow, it intends to select projects carefully and optimize client mix. It also intends to continue focusing on securing bids for government contracts in the near future.
Risks
�The projects are exposed to various implementation and other risks and uncertainties.
�The company has substantial existing debt and may incur substantial additional debt.
�The businesses of the company are capital intensive.
�The business of the company is substantially dependent on projects in India awarded or funded by the Central or State Governments.
Valuation
Considering the P/E valuation on the upper end of the price band of ̀ 219, the stock is priced at pre issue P/E of 13.05x on its FY16 EPS of `16.79. Post issue, the stock is priced at a P/E of 15.23 x on its EPS of `14.38. Looking at the P/B ratio at ̀ 219 the stock is priced at P/B ratio of 2.56x on the pre issue book value of ̀ 85.48 and on the post issue book value of ̀ 89.58 the P/B comes out to 2.44x.
On the lower end of the price band of `214 the stock is priced at pre issue P/E of 12.75x on its FY16 EPS of `16.79.Post issue, the stock is priced at a P/E of 14.88x on its EPS of ̀ 14.38. Looking at the P/B ratio at ̀ 214, the stock is priced at P/B ratio of 2.50x on the pre issue book value of ̀ 85.48 and on the post issue book value of ̀ 89.58, the P/B comes out to 2.39x.
SMC Ranking
Outlook
The company has a track record of execution of
all type of road projects either small or medium,
and its healthy growth order book has been
buoyed by a growth in the infrastructure sector,
However, its order book is concentrated in the
road construction and EPC segment, and even
here it has mostly obtained projects related to up
gradation, maintenance etc. Investors with long
term view can opt this issue.
(2/5)
15
®

®
16


Returns (%) Risk Market Cap (%)
Scheme Name NAV Launch QAAUM 3M 6M 1Y 3Y Since Std.Dev Jenson LARGE MID SMALL DEBT &
(`) Date (` Cr.) Launch CAP CAP CAP OTHER
Birla Sun Life Balanced 95 - Growth 627.77 10-Feb-1995 2797.01 11.22 16.81 10.98 23.43 21.26 1.68 0.18 43.47 22.87 0.01 33.65
HDFC Balanced Fund - Growth 118.63 11-Sep-2000 5707.42 9.47 15.66 10.01 25.77 16.85 1.70 0.16 42.45 24.86 1.43 31.27
Mirae Asset Prudence Fund - Reg - G 10.96 29-Jul-2015 211.64 10.19 15.02 9.48 N.A 9.56 1.83 0.09 64.11 5.12 N.A 30.77
Kotak Balance - Growth 20.38 05-Nov-2014 265.19 9.88 17.47 9.46 N.A 8.49 1.65 0.11 42.51 20.79 1.51 35.20
Reliance RSF - Balanced - Growth 43.94 08-Jun-2005 2369.77 9.20 12.75 9.37 23.08 14.20 1.73 0.15 50.59 10.94 4.09 34.39
UTI Balanced Fund - Growth 139.16 20-Jan-1995 1374.21 10.96 16.16 9.20 18.73 16.15 1.63 0.10 46.76 23.25 2.58 27.42
ICICI Prudential Balanced - Growth 101.27 03-Nov-1999 2791.56 10.30 16.90 9.00 22.73 14.83 1.66 0.15 54.14 17.18 1.25 27.43
Annualised
Returns (%) RiskAverage Yield till
Scheme Name NAV Launch QAAUM Since Std. SharpeMaturity (Days) Maturity
1W 2W 1M 6M 1Y 3Y(`) Date (`Cr.) Launch Dev.
ICICI Prudential Dynamic Bond F - Prem Plus - G 18.26 14-Jan-2010 908.38 35.89 31.16 32.40 17.27 13.54 11.78 9.64 22.72 0.22 2726.55 8.27
ICICI Prudential LTP - Growth 19.03 20-Jan-2010 839.77 43.64 37.18 37.88 20.36 12.85 13.18 10.36 28.72 0.17 5215.86 7.78
HDFC Income Fund - Growth 35.91 11-Sep-2000 2964.98 64.05 50.13 43.33 19.32 12.13 10.17 8.38 26.91 0.14 6106.45 7.88
ICICI Prudential Income Fund -Growth 49.17 09-Jul-1998 3205.75 46.04 37.01 37.30 19.70 12.11 10.06 9.22 29.08 0.14 5602.75 8.05
Kotak Bond Scheme - Plan A - Reg - G 44.47 25-Nov-1999 4191.67 45.95 40.02 37.76 19.08 11.37 9.44 9.36 28.90 0.12 4522.36 8.05
Reliance Dynamic Bond Fund - Growth 21.17 15-Nov-2004 5366.60 51.48 38.36 37.36 16.22 11.34 10.16 6.62 25.95 0.14 4179.25 7.90
SBI Dynamic Bond Fund - Growth 19.14 09-Feb-2004 3267.88 18.40 22.71 27.34 15.26 11.27 8.65 5.34 25.73 0.14 4215.75 7.35
Returns (%) Risk Average Yield tillScheme Name NAV Launch QAAUM Since Std. Sharpe Maturity (Days) Maturity
1W 2W 1M 6M 1Y 3Y(`) Date (`Cr.) Launch Dev.
Birla Sun Life Dynamic Bond F - Ret - G 27.97 24-Sep-2004 12444.60 64.71 47.35 37.66 19.50 12.42 11.60 9.07 23.67 0.19 6442.25 7.60
HDFC HIF - Dynamic - Growth 54.02 27-Apr-1997 1920.84 53.90 42.50 39.79 19.09 12.05 10.74 9.15 27.49 0.15 5975.05 7.96
Kotak Flexi Debt Scheme - Plan A - Reg - G 19.75 27-May-2008 376.91 33.40 27.41 30.14 13.92 11.94 10.18 8.68 17.66 0.16 3055.05 7.90
Birla Sun Life Treasury Optimizer Plan - DAP 183.09 22-Jun-2009 5427.04 28.81 23.38 26.52 13.72 11.24 11.01 8.89 12.51 0.26 2087.80 8.12
ICICI Prudential Banking & PSU Debt F - Reg - G 17.66 01-Jan-2010 3961.68 25.97 21.44 24.97 13.44 11.15 10.29 9.03 11.70 0.24 1689.43 8.00
Birla Sun Life Short Term Opportunities F - Reg - G 25.80 24-Apr-2003 3659.39 22.85 19.94 21.95 12.70 10.29 10.44 7.40 9.88 0.27 1876.11 8.41
HDFC HIF - S T P - Growth 30.85 06-Feb-2002 1570.33 25.72 22.14 22.54 12.22 9.69 9.87 8.09 10.52 0.19 2233.80 8.51
Returns (%) Risk Average Yield tillScheme Name NAV Launch QAAUM Since Std. Sharpe Maturity (Days) Maturity
1W 2W 1M 3M 1Y 3Y(`) Date (`Cr.) Launch Dev.
Kotak Banking and PSU Debt Fund - Reg - G 34.84 29-Dec-1998 373.28 17.95 16.63 16.92 10.90 8.96 10.00 7.35 3.82 0.41 846.80 7.72
ICICI Prudential Ultra Short Term Plan - Reg - G 15.85 11-Aug-2009 6639.27 15.58 13.50 16.25 10.53 9.37 9.53 6.83 5.64 0.36 799.35 7.98
Franklin India Low Duration Fund - G 17.34 26-Jul-2010 1749.86 11.00 11.78 12.75 10.49 9.49 10.04 9.59 4.83 0.47 386.90 9.76
Birla Sun Life Floating Rate F - LTP - Ret - G 272.39 05-Jun-2003 1915.00 10.90 11.87 14.70 10.02 9.31 9.62 7.91 3.88 0.50 569.40 7.71
Birla Sun Life Savings Fund - Ret - DAP 173.10 23-Jun-2009 13606.00 11.93 11.31 13.13 9.71 9.13 9.61 8.03 3.03 0.63 503.70 8.12
Kotak Low Duration Fund - Ret - G 1928.94 06-Mar-2008 2064.27 11.40 11.04 11.69 9.44 9.04 9.27 8.14 4.90 0.42 255.50 9.32
ICICI Prudential Flexible Income Plan - Reg - G 294.90 27-Sep-2002 16042.90 10.48 10.27 11.69 9.38 8.91 9.52 8.13 2.95 0.58 335.83 7.94
Returns (%) Risk Market Cap (%)
Scheme Name NAV Launch QAAUM 3M 6M 1Y 3Y Since Std.Dev Beta Jenson LARGE MID SMALL DEBT &
(`) Date (` Cr.) Launch CAP CAP CAP OTHER
Sundaram Rural India Fund - Reg - G 32.83 12-May-2006 156.53 19.37 31.50 23.55 29.29 12.33 2.27 0.88 0.33 38.15 38.73 10.36 12.75
Birla Sun Life Small & Midcap Fund - G 29.43 31-May-2007 203.96 16.82 24.16 18.65 36.47 12.49 2.41 0.85 0.35 5.77 74.22 8.57 11.44
DSP BlackRock Micro Cap Fund - Reg - G 49.29 14-Jun-2007 2680.20 15.23 22.43 18.42 49.94 19.09 2.64 0.90 0.50 N.A 69.21 22.69 8.10
Franklin India Smaller Companies Fund - G 45.79 13-Jan-2006 2886.58 13.68 22.54 17.18 42.36 15.52 2.17 0.79 0.37 10.65 59.91 12.43 17.01
L&T Emerging Businesses Fund - Reg - G 17.11 12-May-2014 326.81 17.96 18.36 15.19 N.A 27.46 2.48 0.85 0.29 N.A 75.65 17.95 6.40
Kotak Emerging Equity Scheme - Reg - G 30.27 30-Mar-2007 869.58 14.56 24.16 13.79 39.90 12.59 2.27 0.85 0.39 15.13 64.09 12.04 8.75
Mirae Asset Emerging Bluechip Fund - G 35.27 09-Jul-2010 1556.80 13.97 19.93 13.53 41.72 23.13 2.29 0.86 0.40 31.83 57.32 2.95 7.91
Note: Indicative corpus are including Growth & Dividend option. The above mentioned data is on the basis of 28/07/2016Beta, Sharpe and Standard Deviation are calculated on the basis of period: 1 year, frequency: Weekly Friday, RF: 7%
Annualised
18
MUTUAL FUND Performance Charts
EQUITY (Diversified)
INCOME FUND
ULTRA SHORT TERM
SHORT TERM FUND
Due to their inherent long term nature, the following 3 categories have been sorted on the basis of 1 year returns
Due to their inherent short term nature, Short term funds and Ultra short term funds have been sorted on the basis of 6month and 3month returns respectively
Annualised
®
BALANCED

SMC is conferred upon with Best NBFC of Year (Northern Region) during Assocham Excellence Awardsheld on 20th July 2016 at hotel Le Meridien, New Delhi.
Investor Awareness program organized by SMC held on 9th July 2016 at Bhuj, Gujrat.
