the driving forces behind peo- neuroscience computational ... · research article neuroscience...
TRANSCRIPT
RESEARCH ARTICLE SUMMARY◥
NEUROSCIENCE
Computational and neurobiologicalfoundations of leadership decisionsMicah G. Edelson*, Rafael Polania, Christian C. Ruff, Ernst Fehr*, Todd A. Hare*
INTRODUCTION: Decisions as diverse ascommitting soldiers to the battlefield or pick-ing a school for your child share a basic at-tribute: assuming responsibility for the outcomeof others. This responsibility is inherent in theroles of prime ministers and generals, as wellas in themore quotidian roles of firmmanagers,schoolteachers, and parents. Here we identifythe underlying behavioral, computational, andneurobiological mechanisms that determine thechoice to assume responsibility over others.
METHODS:Wedeveloped adecisionparadigmin which an individual can delegate decision-making power about a choice between a riskyand a safe option to their group or keep the rightto decide: In the “self” trials, only the individual’spayoff is at stake, whereas in the “group” trials,each group member’s payoff is affected. Wecombined models from perceptual and value-based decision-making to estimate each in-dividual’s personal utility for every availableaction in order to tease apart potential motiva-tions for choosing to “lead” or “follow.”We alsoused brain imaging to examine the neuro-biological basis of leadership choices.
RESULTS: The large majority of the subjectsdisplay responsibility aversion (see figure, leftpanel), that is, their willingness to choose be-tween the risky and the safe option is lowerin the group trials relative to the self trials,independent of basic preferences toward risk,losses, ambiguity, social preferences, or in-trinsic valuations of decision rights. Further-more, our findings indicate that responsibilityaversion is not associated with the overallfrequency of keeping or delegating decision-making power. Rather, responsibility aversionis driven by a second-order cognitive processreflecting an increase in the demand for cer-tainty about what constitutes the best choicewhen others’ welfare is affected. Individualswho are less responsibility averse have higherquestionnaire-based and real-life leadershipscores. The center panel of the figure showsthe correlation between predicted and ob-served leadership scores in a new, independentsample. Our analyses of the dynamic inter-actions between brain regions demonstratethe importance of information flow betweenbrain regions involved in computing separatecomponents of the choice to understanding
leadership decisions and individual differencesin responsibility aversion.
DISCUSSION: The driving forces behind peo-ple’s choices to lead or follow are veryimportant but largely unknown. We identifyresponsibility aversion as a key determinantof the willingness to lead. Moreover, it ispredictive of both survey-based and real-lifeleadership scores. These results suggest thatmany people associate a psychological costwith assuming responsibility for others’ out-comes. Individual differences in the percep-tion of, and willingness to bear, responsibilityas the price of leadership may determinewho will strive toward leadership roles and,
moreover, are associatedwith how well they per-form as leaders.Ourcomputationalmod-
el provides a conceptualframework for the deci-sion to assume responsi-
bility for others’ outcomes as well as insightsinto the cognitive and neural mechanismsdriving this choice process. This frameworkapplies to many different leadership types,includingauthoritarian leaders,whomakemostdecisions themselves, and egalitarian leaders,who frequently seek a group consensus. Webelieve that such a theoretical foundation iscritical for a precise understandingof thenatureand consequences of leadership.▪
RESEARCH
Edelson et al., Science 361, 467 (2018) 3 August 2018 1 of 1
The list of author affiliations is available in the full article online.*Corresponding author. Email: [email protected](M.G.E.); [email protected] (T.A.H.); [email protected] (E.F.)Cite this article as M. G. Edelson et al., Science 361, eaat0036(2018). DOI: 10.1126/science.aat0036
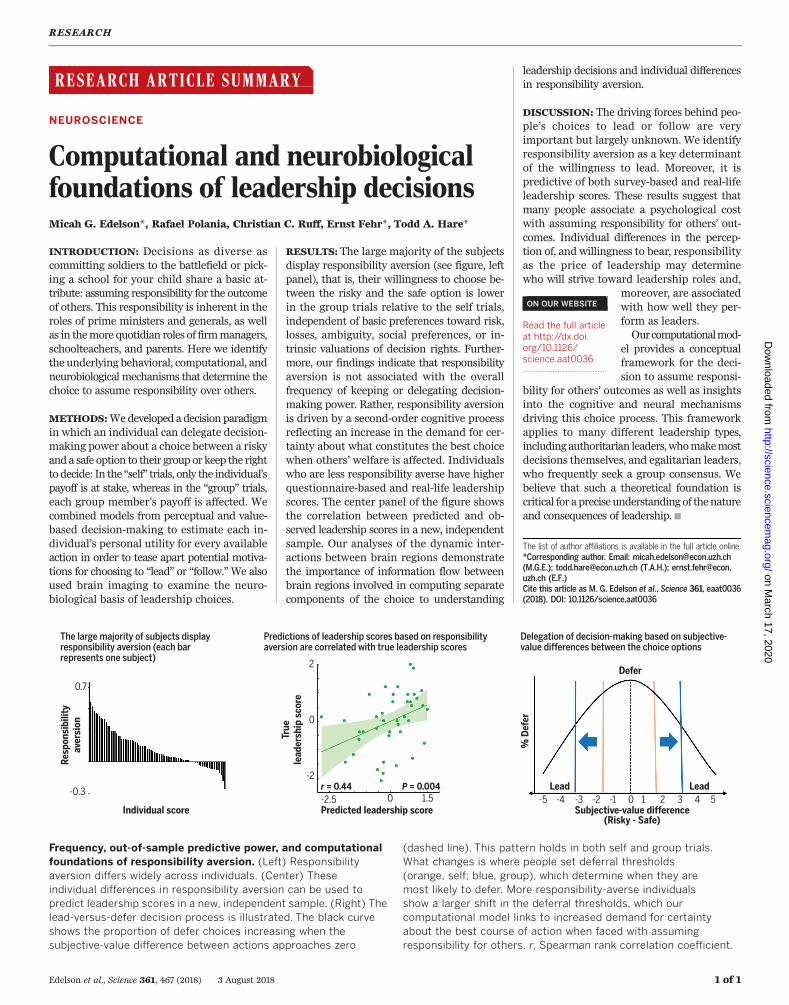
Frequency, out-of-sample predictive power, and computationalfoundations of responsibility aversion. (Left) Responsibilityaversion differs widely across individuals. (Center) Theseindividual differences in responsibility aversion can be used topredict leadership scores in a new, independent sample. (Right) Thelead-versus-defer decision process is illustrated. The black curveshows the proportion of defer choices increasing when thesubjective-value difference between actions approaches zero
(dashed line). This pattern holds in both self and group trials.What changes is where people set deferral thresholds(orange, self; blue, group), which determine when they aremost likely to defer. More responsibility-averse individualsshow a larger shift in the deferral thresholds, which ourcomputational model links to increased demand for certaintyabout the best course of action when faced with assumingresponsibility for others. r, Spearman rank correlation coefficient.
ON OUR WEBSITE◥
Read the full articleat http://dx.doi.org/10.1126/science.aat0036..................................................
on March 17, 2020
http://science.sciencem
ag.org/D
ownloaded from
RESEARCH ARTICLE◥
NEUROSCIENCE
Computational and neurobiologicalfoundations of leadership decisionsMicah G. Edelson1*, Rafael Polania1,2, Christian C. Ruff1, Ernst Fehr1*, Todd A. Hare1*
Leaders must take responsibility for others and thus affect the well-being of individuals,organizations, and nations. We identify the effects of responsibility on leaders’ choices atthe behavioral and neurobiological levels and document the widespread existence ofresponsibility aversion, that is, a reduced willingness to make decisions if the welfareof others is at stake. In mechanistic terms, basic preferences toward risk, loss, andambiguity do not explain responsibility aversion, which, instead, is driven by a second-ordercognitive process reflecting an increased demand for certainty about the best choicewhen others’ welfare is affected. Finally, models estimating levels of information flowbetween brain regions that process separate choice components provide the first step inunderstanding the neurobiological basis of individual variability in responsibilityaversion and leadership scores.
Leadership decisions pervade every level ofsociety, from the basic family unit up toglobal organizations and political institu-tions. Parents, teachers, CEOs, and headsof state all lead their respective groups and
make decisions that have widespread and lastingconsequences for themselves and others (1). Thus,a key aspect of leadership is the acceptance ofresponsibility for others. We developed a be-havioral task that, together with computationalmodeling and neuroimaging (2–4), allows us todetermine the cognitive and neural mechanismsdriving the choice to assumeor forgo the respon-sibility of leading a group.There are some key features of leadership
choices that are potential drivers of decisionsto lead. For example, a position of leadership isassociated with the right to make decisions thataffect one’s own and others’welfare. Therefore,the choice to lead a group may be taken par-ticularly often by those who put a high value ondecision rights or who are driven by a desire todetermine and control others’ outcomes (5, 6).Alternatively, leadership might be perceived asa burden, and those who are most willing toshoulder this responsibility may be most likelyto choose to lead. Furthermore, the decision tolead could be predicated on the willingness toaccept losses or potential failures for oneself orothers or to act under conditions of high un-certainty and ambiguity. Finally, because leaders’decisions often have far-reaching consequencesthat require careful forethought, those who aremost competent in the task at hand (for example,make more accurate and objective assessments
of probabilities) may be more likely to make de-cisions to lead.We designed an experiment to allow us to dis-
tinguish between the hypotheses that decisionsto lead others are related to (changes in) basicpreferences over risk, loss, or ambiguity and thepossibility that responsibility affects choicesthrough a separate mechanism. Participants wereinitially divided into groups of four. After a groupinduction phase designed to enhance inter-individual affiliation (7) (see supplementarymethods 2.1.1), each participant completed a“baseline choice task” independently of the othergroup members. In this task, participants de-cided in each trial whether to accept or reject agamble that involved probabilities of gains andlosses (Fig. 1A and appendix S1). As the exactprobability of success is rarely known in real-istic choice situations, the task included manytrials with ambiguous probabilities of gainsand losses. However, to distinguish individuals’attitudes toward pure risk versus ambiguity,the task also contained trials in which the exactprobabilities were known.In the “delegation task” (Fig. 1B), the partic-
ipants faced the same gambles as in the baselinetask, but now they had the option to make thedecisions themselves (i.e., to lead) or to defer andfollow the decision of the group. If a participantdeferred, the action implemented (risky or safe)was the one chosen by the majority of the othergroup members in response to the exact samegamble in the baseline task. The delegation taskhad two types of trials, the “self” trials and the“group” trials, which were matched on all fea-tures except who received the outcome (Fig. 1B).In the self trials, only the payoff of the decidingparticipant is at stake and the payoffs of theother group members were not affected. By con-trast, in the group trials, the decision outcomeaffected the payoff of every groupmember equally.
In real-life decisions, individual group mem-bers, even though they may objectively face thesame situation, often possess unique informationor perspectives (8). Our task incorporated thisaspect by ensuring that, for every matched base-line and delegation trial, no two group memberssaw the exact same segment of the probabilityspace (Fig. 1C). Consequently, the group, as awhole, always had more information about theprobabilities with which gains or losses occurredthan any single individual in the group.All participants were explicitly informed about
the nature of the group-level informational ad-vantage before the delegation task (see supple-mentary methods 2.2.1 and appendix S2 for taskinstructions). This group advantage increasedwith the level of ambiguity, resulting in an iden-tical parametric manipulation of the incentive todefer in both the self and group trials (fig. S1).Although in all trials, deferring to the majoritymeant taking a better-informed action, it alsomeant the loss of the individual’s decision rightsor power to determine the choice (see fig. S1and supplementary results 1). Thus, participantsalways had to weigh both of these aspects—thesubjective value they put on their decision rightversus the value of a better-informed decision—when choosing to lead or defer.We collected and analyzed choice data from
two independent samples of participants: an ini-tial dataset examining only choice behavior and asecond dataset in which we replicated the behav-ioral experiment but also collected neuroimagingdata. For brevity, we discuss the behavioral resultsacross all subjects and, in the main text, only re-port those results that replicated within eachdataset independently (for results of each groupseparately, see the supplementary materials).
Baseline preferences andleadership scores
We initially measured individuals’ leadershipscores with two widely used scales (9, 10) thatpredict leadership positions and ability innumerous domains, including politics, athletics,and business (1, 11–13), and later supplementedthese questionnaire measures with data on actualleadership roles (see supplementarymethods 2.3).On the basis of these measures, we examinedwhether risk, loss, and ambiguity preferences inthe baseline taskwere associatedwith leadershipscores. None of these preference measures wasconsistently correlated with leadership scoresacross both independent samples (table S1 andfig. S2). Moreover, sensitivity to the informa-tional advantage, response times, and choiceconsistency were not reliably associated withleadership scores (table S1 and supplementaryresults 1, 2, and 7).
The role of preferences for decisionrights and control
Every decision in the delegation task, across bothself and group conditions, requires the partic-ipant to choose whether or not she will make thedecision herself or give up the right to make thechoice and follow the other group members’
RESEARCH
Edelson et al., Science 361, eaat0036 (2018) 3 August 2018 1 of 8
1Zürich Center for Neuroeconomics, Department ofEconomics, University of Zürich, 8006 Zürich, Switzerland.2Decision Neuroscience Lab, Department of Health Sciencesand Technology, ETH Zürich, 8057 Zürich, Switzerland.*Corresponding author. Email: [email protected] (M.G.E.);[email protected] (T.A.H.); [email protected] (E.F.)
on March 17, 2020
http://science.sciencem
ag.org/D
ownloaded from
collective judgment. Individuals who put a highvalue onmaintaining their private decision rightsshould display a relatively lower deferral ratein the self trials when compared to individualswho do not value their private decision rightsas highly.Consistent with the view (5, 6) that decision
rights are generally valued positively, partici-pants preferred, on average, to maintain controlover their own outcomes in the self trials andwere willing to forgo the informational advan-tage available when deferring to the majority inmost trials (mean = 62.7%;Wilcoxon signed-ranktest versus a random-choice null hypothesis, zscore = 6.0, P = 2 × 10⁻⁹). However, the pro-portion of control-taking choices in the self con-dition was not related to individual leadershipscores (Fig. 2A; Spearman rank correlation co-efficient (r) = −0.03, P = 0.84).The driver behind leadership might not be the
desire to control only one’s own outcome butrather to exert decision rights with broad im-plications for whole groups. This would implythat the frequency of keeping control in the grouptrials is informative about real-life leadershipmeasures. Just as in the self trials, on average,participants preferred to maintain control overgroup outcomes despite the informational ad-vantage of deferring. However, again there isno evidence for an association between thestrength of the preference for control in grouptrials and leadership scores (Fig. 2B; r = 0.13, P =0.33; see also supplementary results 1). Thus,preferences in favor of decision rights and con-trol over self or others did not explain individualdifferences in leadership scores, suggesting thatdifferent motivational forces are at work.
Leadership and responsibility aversion
If it is not the aforementioned preferences thatdistinguish high- from low-scoring leaders, thenperhaps a dynamic change to the decision pro-cess between individual versus group choicesholds the key. A critical difference betweengroup and self trials is the potential responsibilityfor others’welfare in group trials. Relatively littleis known about how responsibility for others’outcomes influences decision-making. Indeed,we do not even know yet whether the averageperson prefers to seek or avoid responsibility,much less how responsibility preferences mightrelate to leadership.Themajority of participants preferred to avoid
responsibility, that is, participants deferredmoreon group than self trials. Thus, we term this pref-erence responsibility aversion. The mean percentincrease in deferral rate from self to group trialswas 17.3% (Wilcoxon signed-rank test, z score =5.4, P = 5 × 10⁻⁸). However, there was substantialvariability in the level of responsibility aversionacross individuals (SD = ±43%). Critically, in-dividuals who showed less responsibility aversionhad higher leadership scores (Fig. 2C; r = −0.46,P = 2 × 10⁻⁴). This variability in responsibilityaversion was not significantly correlated withbaseline preferences over risk, ambiguity, or loss,nor did it correlate with personality traits from
the “five-factor model” (table S1 and supple-mentary results 4: for risk, loss, and ambiguitypreferences, allP>0.66; for the five-factormodel,all P > 0.2).To assess the ecological validity of this as-
sociation between responsibility aversion andleadership scores, we collected real-life expres-sions of leadership behavior fromour participants(rank obtained duringmandatorymilitary serviceand leadership experience in scouts organiza-tions, supplementary methods 2.3.4). Respon-sibility aversion was the only measure thatsignificantly correlated with these real-lifeexpressions of leadership (Fig. 2D, r = −0.49,P = 0.02).This relationship between responsibility aver-
sion and leadership is also robust. First, allresults presented above and in the upcomingsections on computational modeling were ini-tially obtained in the behavioral group and thenindependently replicated in the functional mag-netic resonance imaging (fMRI) group (see thesupplementary materials). Second, we computedout-of-sample predictions of the leadership scoresfor the fMRI sample based on parameter es-
timates computed on the basis of the originalbehavior-only sample. The predicted leadershipscores for the fMRI sample were, indeed, sig-nificantly correlatedwith the empirically observedleadership scores from those participants (Fig. 2E,r = 0.44, P = 0.004; supplementary results 3).Taken together, these results suggest that
responsibility aversion, an as yet mechanisticallyundetermined behavioral preference, is a robustand ecologically valid predictor of leadership.Critically, these results hint that some key latentfactor(s) in the decision process must changewhen individuals are faced with the choice tolead others versus making the same choice forthemselves alone. What are the underlyingcognitive computations and neural mechanisms?
What is responsibility aversion, and whydoes it arise?
Responsibility aversion, as an interpersonalphenomenon, might be related to social prefer-ences, that is, a concern for others’ payoffs. Wetherefore examined several measures of socialpreferences as well as feelings of group affiliationand democratic tendencies. We also performed a
Edelson et al., Science 361, eaat0036 (2018) 3 August 2018 2 of 8
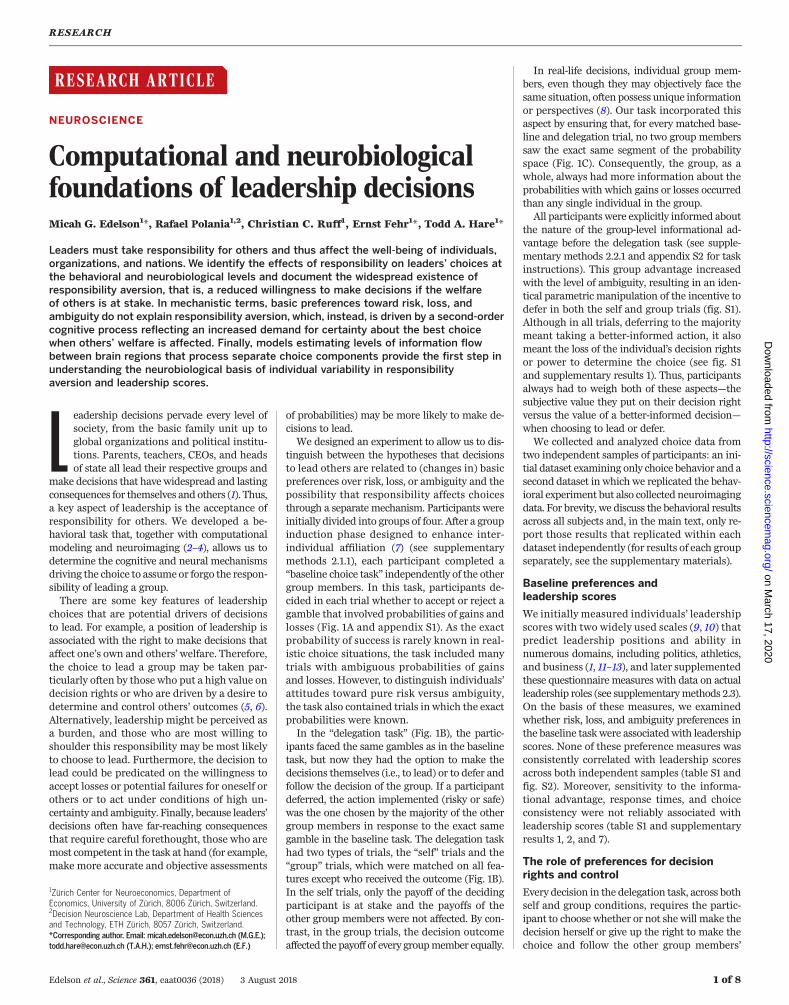
Fig. 1. Experimental design. (A) Baseline task. Individuals needed to select a risky option (“act”)or safe option (“not act”) on the basis of the probability of success of the risky option and the possiblegain or loss if that option was chosen. The probability of success and failure was indicated by theproportion of green or red slices, respectively, in the probability pie and by adjacent text. In each trial, avarying amount of the probability information was obscured by a gray cover. If the individuals preferredthe safe choice, they received a sure outcome of 0 for that trial. (B) Delegation task. Two days later,individuals were faced with the same choices but had the additional option to “defer” to the majorityopinion of their group and gain access to the group’s informational advantage. This task involved twoconditions, group (where the participant’s action affected the payoff of all group members) and self(where the participant’s action affected only herself). (C) Informational advantage for the group.Shown is one example of potential observable probabilities seen by each of the four individuals in thegroup as well as the true underlying probability pie, which was not displayed to the participants. Theposition of the obscuring gray cover changed for each individual, resulting in the exposure of a differentpart of the probability information. Consequently, in our task, the group, as a whole, had moreinformation than each individual alone. For a full description, see supplementary results 1 and fig. S1.Theinformational advantage and optimal choice, in terms of expected monetary payoff, were identical foreach matched group and self trial (see also supplementary results 8).
RESEARCH | RESEARCH ARTICLEon M
arch 17, 2020
http://science.sciencemag.org/
Dow
nloaded from
control experiment to identify the potential im-pact of regret, blame, or guilt on responsibilityaversion. However, none of these measures wascorrelated with responsibility aversion (table S1and supplementary results 5, 6, and 8).Moreover,the association between leadership scores andresponsibility aversion remained significant aftercontrolling for such measures in a multiple re-gression analysis (table S1). Thus, responsibilityaversion is distinct from other trait-level pref-erence categories. This raises the questions ofwhy and how it affects decision processes—questions that can only be answeredby identifyingthe underlying computational mechanism—andhow the brain implements these processes.One possibility is that responsibility aversion
is driven by a tendency to become more con-servative in terms of risk, loss, or ambiguitywhen making choices that can affect others.Alternatively, responsibility aversion could bedriven by an as yet uncharacterized cognitiveprocess. Therefore, we analyzed participants’behavior by developing a computational modelthat allowed us to determine the mechanismunderlying responsibility aversion.To convey the logic of our computational
modeling approach, we first describe the choice
behavior that participants demonstrated in thebaseline and self trials, in which responsibilitycan play no role, and then explain how this in-spired our efforts to formally model the mech-anisms generating the observed changes inbehavior for the matched group trials. The pat-terns of deferral choices (Fig. 3A) and reactiontimes (Fig. 3B) provide an initial clue as to howdeferral decisions are made and the type of com-putational process that might underlie thesechoices. We estimated subjects’ preference pa-rameters (i.e., attitudes toward risk, loss, andambiguity and probability weights), using a pro-spect theory model (supplementary methods 3.1;see also supplementary results 9), and used theseparameters to compute the subjective-value dif-ferences between accepting and rejecting thegamble in each trial. Fig. 3A depicts the pro-portion of deferral choices during self trials asa function of these subjective-value differences.The figure shows an invertedU-shaped pattern.
For large subjective-value differences, the prob-ability of deferral is close to zero, whereas forsmall differences, average deferral rates reachalmost 60%. Low subjective-value differencesmean that the values of the two options aredifficult to distinguish, that is, the discrimina-
bility between the options is low, whereas highsubjective-valuedifferences implyhighdiscrimina-bility between the options. This interpretation isalso supported by reaction-time data (Fig. 3B),which show that response times are highestwhen subjective-value differences are low. Thus,when there is little doubt that accepting (or re-jecting) the gamble is the superior option in agiven trial, participants generally make the de-cision themselves rather than letting the groupdecide. However, when standard preferencestoward loss, risk, and ambiguity provide littleguidance about what constitutes the best choicebecause the subjective-value difference is small,participants defer more often to the group.We thus postulated that responsibility aver-
sion might be due to changes in the demand forcertainty about what constitutes the best choicewhen also deciding for others instead of only foroneself. According to this hypothesis, the sub-jective value of the gamble and the uncertaintyabout what is the best choice do not change be-tween the self and the group trials. Rather, it isthe required level of certainty about the bestresponse to the gamble that changes when in-dividuals are responsible for others. In mech-anistic terms, the demand for certainty in a given
Edelson et al., Science 361, eaat0036 (2018) 3 August 2018 3 of 8
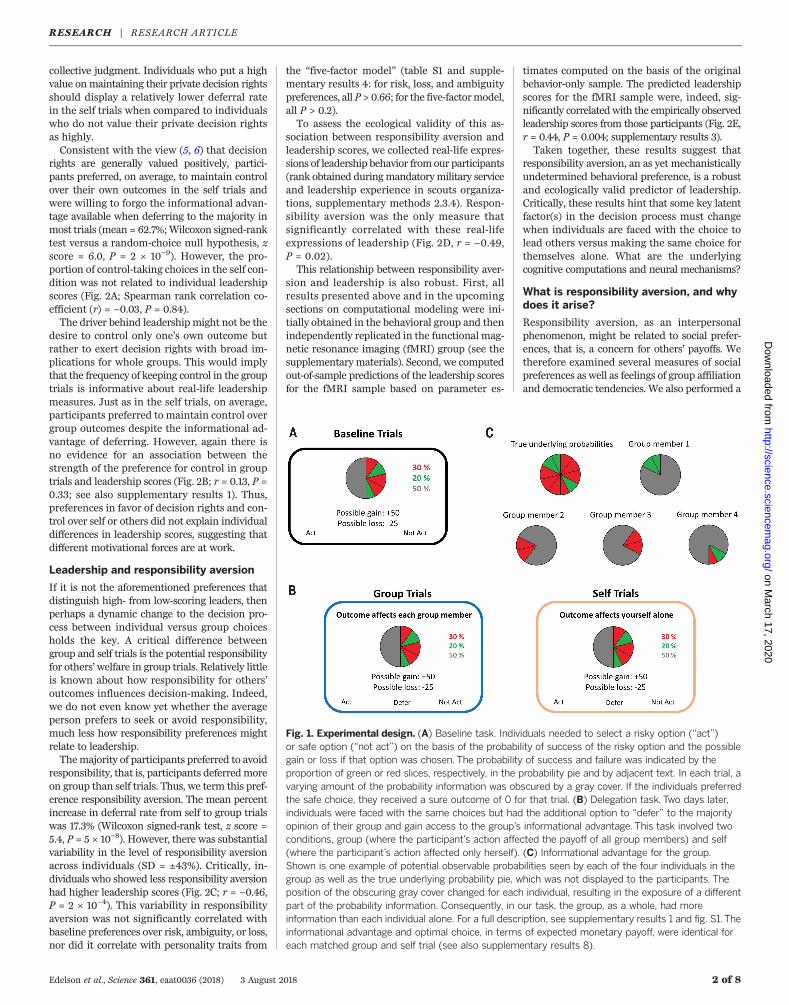
Fig. 2. Behavioral evidence for responsibility aversion. (A and B) Leader-ship scores as a function of control-taking in self (A) and group (B) trials.The scatter plots and the associated regression line show the (lack of)association between normalized leadership scores and a basic preferencefor controlling one’s own or common outcomes. (C) Responsibility aversionscores correlated negatively with leadership questionnaire scores (r = −0.46,P = 2 × 10⁻⁴). For (A) to (C), each marker (triangles for the originalbehavioral group and squares for the fMRI replication group) representsone participant. (D) Responsibility aversion scores (normalized) correlatednegatively with real-life manifestation of leadership behavior (such as militaryrank, r = −0.49, P = 0.02, data obtainable for n = 21). (E) Out-of-sample
prediction of leadership scores for individuals in the fMRI sample. Thisprediction is based on the parameter coefficients estimated usingparticipants in the original, behavior-only dataset and then applied to eachindividual in the independent fMRI dataset to predict leadership scores(for full details, see supplementary results 3). The correlation betweenthe observed leadership score and the predicted leadership scores isr = 0.44 (P = 0.004). For all scatter plots, the solid line is the best-fitregression line, and shaded areas indicate a 95% prediction interval for fitlines estimated from new out-of-sample data points. The correlationcoefficients and P values were calculated by using the nonparametricSpearman rank correlation.
RESEARCH | RESEARCH ARTICLEon M
arch 17, 2020
http://science.sciencemag.org/
Dow
nloaded from
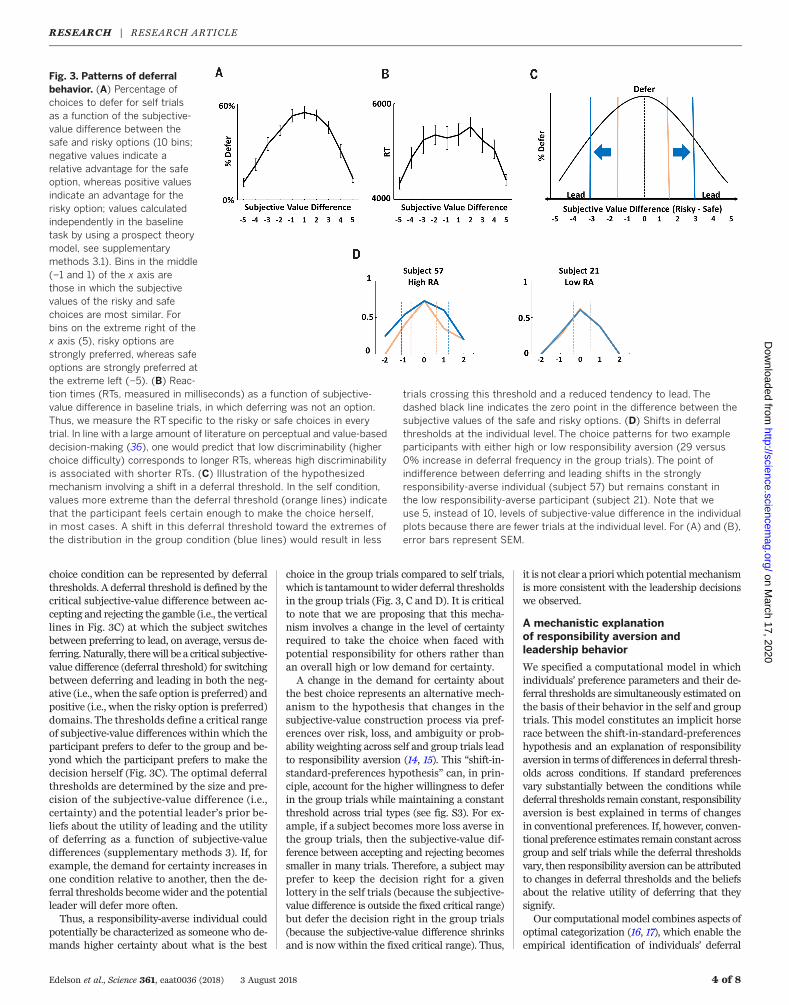
choice condition can be represented by deferralthresholds. A deferral threshold is defined by thecritical subjective-value difference between ac-cepting and rejecting the gamble (i.e., the verticallines in Fig. 3C) at which the subject switchesbetween preferring to lead, on average, versus de-ferring.Naturally, therewill be a critical subjective-value difference (deferral threshold) for switchingbetween deferring and leading in both the neg-ative (i.e., when the safe option is preferred) andpositive (i.e., when the risky option is preferred)domains. The thresholds define a critical rangeof subjective-value differences within which theparticipant prefers to defer to the group and be-yond which the participant prefers to make thedecision herself (Fig. 3C). The optimal deferralthresholds are determined by the size and pre-cision of the subjective-value difference (i.e.,certainty) and the potential leader’s prior be-liefs about the utility of leading and the utilityof deferring as a function of subjective-valuedifferences (supplementary methods 3). If, forexample, the demand for certainty increases inone condition relative to another, then the de-ferral thresholds becomewider and the potentialleader will defer more often.Thus, a responsibility-averse individual could
potentially be characterized as someone who de-mands higher certainty about what is the best
choice in the group trials compared to self trials,which is tantamount towider deferral thresholdsin the group trials (Fig. 3, C and D). It is criticalto note that we are proposing that this mecha-nism involves a change in the level of certaintyrequired to take the choice when faced withpotential responsibility for others rather thanan overall high or low demand for certainty.A change in the demand for certainty about
the best choice represents an alternative mech-anism to the hypothesis that changes in thesubjective-value construction process via pref-erences over risk, loss, and ambiguity or prob-ability weighting across self and group trials leadto responsibility aversion (14, 15). This “shift-in-standard-preferences hypothesis” can, in prin-ciple, account for the higher willingness to deferin the group trials while maintaining a constantthreshold across trial types (see fig. S3). For ex-ample, if a subject becomes more loss averse inthe group trials, then the subjective-value dif-ference between accepting and rejecting becomessmaller in many trials. Therefore, a subject mayprefer to keep the decision right for a givenlottery in the self trials (because the subjective-value difference is outside the fixed critical range)but defer the decision right in the group trials(because the subjective-value difference shrinksand is now within the fixed critical range). Thus,
it is not clear a priori which potentialmechanismis more consistent with the leadership decisionswe observed.
A mechanistic explanationof responsibility aversion andleadership behavior
We specified a computational model in whichindividuals’ preference parameters and their de-ferral thresholds are simultaneously estimated onthe basis of their behavior in the self and grouptrials. This model constitutes an implicit horserace between the shift-in-standard-preferenceshypothesis and an explanation of responsibilityaversion in terms of differences in deferral thresh-olds across conditions. If standard preferencesvary substantially between the conditions whiledeferral thresholds remain constant, responsibilityaversion is best explained in terms of changesin conventional preferences. If, however, conven-tional preference estimates remain constant acrossgroup and self trials while the deferral thresholdsvary, then responsibility aversion can be attributedto changes in deferral thresholds and the beliefsabout the relative utility of deferring that theysignify.Our computational model combines aspects of
optimal categorization (16, 17), which enable theempirical identification of individuals’ deferral
Edelson et al., Science 361, eaat0036 (2018) 3 August 2018 4 of 8
Fig. 3. Patterns of deferralbehavior. (A) Percentage ofchoices to defer for self trialsas a function of the subjective-value difference between thesafe and risky options (10 bins;negative values indicate arelative advantage for the safeoption, whereas positive valuesindicate an advantage for therisky option; values calculatedindependently in the baselinetask by using a prospect theorymodel, see supplementarymethods 3.1). Bins in the middle(−1 and 1) of the x axis arethose in which the subjectivevalues of the risky and safechoices are most similar. Forbins on the extreme right of thex axis (5), risky options arestrongly preferred, whereas safeoptions are strongly preferred atthe extreme left (−5). (B) Reac-tion times (RTs, measured in milliseconds) as a function of subjective-value difference in baseline trials, in which deferring was not an option.Thus, we measure the RT specific to the risky or safe choices in everytrial. In line with a large amount of literature on perceptual and value-baseddecision-making (36), one would predict that low discriminability (higherchoice difficulty) corresponds to longer RTs, whereas high discriminabilityis associated with shorter RTs. (C) Illustration of the hypothesizedmechanism involving a shift in a deferral threshold. In the self condition,values more extreme than the deferral threshold (orange lines) indicatethat the participant feels certain enough to make the choice herself,in most cases. A shift in this deferral threshold toward the extremes ofthe distribution in the group condition (blue lines) would result in less
trials crossing this threshold and a reduced tendency to lead. Thedashed black line indicates the zero point in the difference between thesubjective values of the safe and risky options. (D) Shifts in deferralthresholds at the individual level. The choice patterns for two exampleparticipants with either high or low responsibility aversion (29 versus0% increase in deferral frequency in the group trials). The point ofindifference between deferring and leading shifts in the stronglyresponsibility-averse individual (subject 57) but remains constant inthe low responsibility-averse participant (subject 21). Note that weuse 5, instead of 10, levels of subjective-value difference in the individualplots because there are fewer trials at the individual level. For (A) and (B),error bars represent SEM.
RESEARCH | RESEARCH ARTICLEon M
arch 17, 2020
http://science.sciencemag.org/
Dow
nloaded from
thresholds, with prospect theory (18), whichenables the empirical identification of individualspreference parameters for risk, loss, and ambi-guity and probability weights (see supplementarymethods 3 and supplementary results 9). Themodel simultaneously estimates a condition-specific(group or self) deferral threshold and condition-specific preference parameters from each indi-vidual’s pattern of choices. The probability ofdeferring is jointly determined by the subjectivevalue of the gamble and the deferral thresholds.The probability of choosing the risky versus safeaction conditional on leading is determined foreach decision problem on the basis of the sub-jective value of the risky relative to the safe option.Our computational model accurately captures
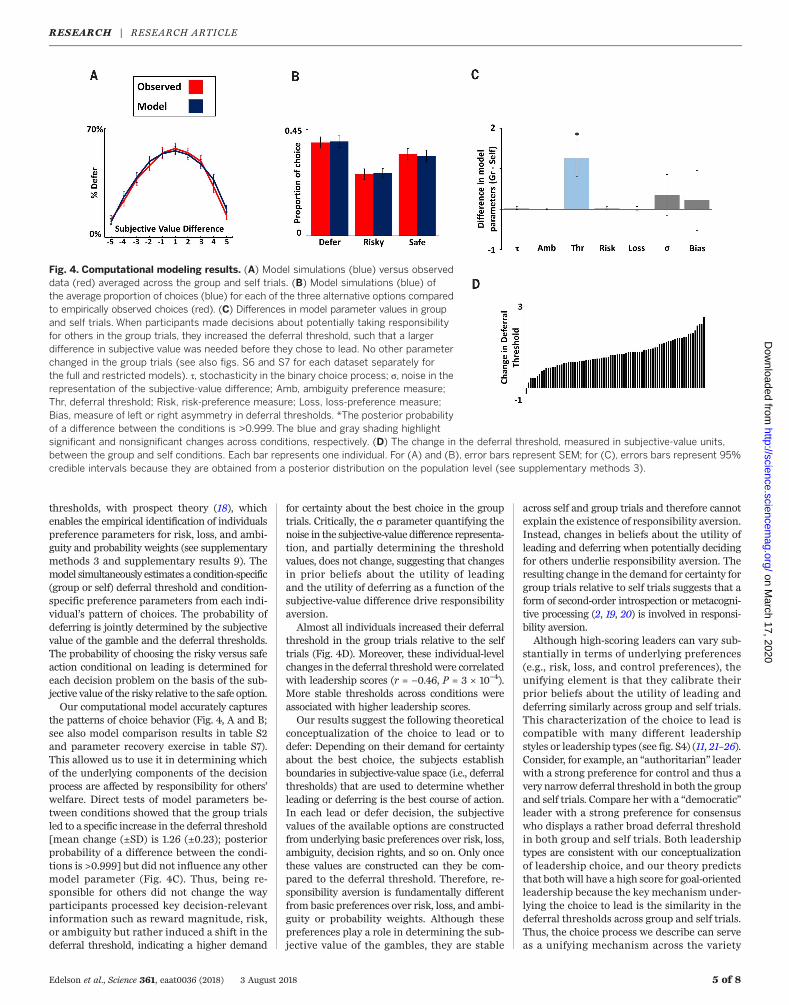
the patterns of choice behavior (Fig. 4, A and B;see also model comparison results in table S2and parameter recovery exercise in table S7).This allowed us to use it in determining whichof the underlying components of the decisionprocess are affected by responsibility for others’welfare. Direct tests of model parameters be-tween conditions showed that the group trialsled to a specific increase in the deferral threshold[mean change (±SD) is 1.26 (±0.23); posteriorprobability of a difference between the condi-tions is >0.999] but did not influence any othermodel parameter (Fig. 4C). Thus, being re-sponsible for others did not change the wayparticipants processed key decision-relevantinformation such as reward magnitude, risk,or ambiguity but rather induced a shift in thedeferral threshold, indicating a higher demand
for certainty about the best choice in the grouptrials. Critically, the s parameter quantifying thenoise in the subjective-value difference representa-tion, and partially determining the thresholdvalues, does not change, suggesting that changesin prior beliefs about the utility of leadingand the utility of deferring as a function of thesubjective-value difference drive responsibilityaversion.Almost all individuals increased their deferral
threshold in the group trials relative to the selftrials (Fig. 4D). Moreover, these individual-levelchanges in the deferral thresholdwere correlatedwith leadership scores (r = −0.46, P = 3 × 10⁻⁴).More stable thresholds across conditions wereassociated with higher leadership scores.Our results suggest the following theoretical
conceptualization of the choice to lead or todefer: Depending on their demand for certaintyabout the best choice, the subjects establishboundaries in subjective-value space (i.e., deferralthresholds) that are used to determine whetherleading or deferring is the best course of action.In each lead or defer decision, the subjectivevalues of the available options are constructedfrom underlying basic preferences over risk, loss,ambiguity, decision rights, and so on. Only oncethese values are constructed can they be com-pared to the deferral threshold. Therefore, re-sponsibility aversion is fundamentally differentfrom basic preferences over risk, loss, and ambi-guity or probability weights. Although thesepreferences play a role in determining the sub-jective value of the gambles, they are stable
across self and group trials and therefore cannotexplain the existence of responsibility aversion.Instead, changes in beliefs about the utility ofleading and deferring when potentially decidingfor others underlie responsibility aversion. Theresulting change in the demand for certainty forgroup trials relative to self trials suggests that aform of second-order introspection or metacogni-tive processing (2, 19, 20) is involved in responsi-bility aversion.Although high-scoring leaders can vary sub-
stantially in terms of underlying preferences(e.g., risk, loss, and control preferences), theunifying element is that they calibrate theirprior beliefs about the utility of leading anddeferring similarly across group and self trials.This characterization of the choice to lead iscompatible with many different leadershipstyles or leadership types (see fig. S4) (11, 21–26).Consider, for example, an “authoritarian” leaderwith a strong preference for control and thus avery narrow deferral threshold in both the groupand self trials. Compare her with a “democratic”leader with a strong preference for consensuswho displays a rather broad deferral thresholdin both group and self trials. Both leadershiptypes are consistent with our conceptualizationof leadership choice, and our theory predictsthat bothwill have a high score for goal-orientedleadership because the key mechanism under-lying the choice to lead is the similarity in thedeferral thresholds across group and self trials.Thus, the choice process we describe can serveas a unifying mechanism across the variety
Edelson et al., Science 361, eaat0036 (2018) 3 August 2018 5 of 8
Fig. 4. Computational modeling results. (A) Model simulations (blue) versus observeddata (red) averaged across the group and self trials. (B) Model simulations (blue) ofthe average proportion of choices (blue) for each of the three alternative options comparedto empirically observed choices (red). (C) Differences in model parameter values in groupand self trials. When participants made decisions about potentially taking responsibilityfor others in the group trials, they increased the deferral threshold, such that a largerdifference in subjective value was needed before they chose to lead. No other parameterchanged in the group trials (see also figs. S6 and S7 for each dataset separately forthe full and restricted models). t, stochasticity in the binary choice process; s, noise in therepresentation of the subjective-value difference; Amb, ambiguity preference measure;Thr, deferral threshold; Risk, risk-preference measure; Loss, loss-preference measure;Bias, measure of left or right asymmetry in deferral thresholds. *The posterior probabilityof a difference between the conditions is >0.999. The blue and gray shading highlightsignificant and nonsignificant changes across conditions, respectively. (D) The change in the deferral threshold, measured in subjective-value units,between the group and self conditions. Each bar represents one individual. For (A) and (B), error bars represent SEM; for (C), errors bars represent 95%credible intervals because they are obtained from a posterior distribution on the population level (see supplementary methods 3).
RESEARCH | RESEARCH ARTICLEon M
arch 17, 2020
http://science.sciencemag.org/
Dow
nloaded from
of traits and characteristics associated withleadership (1, 11).
Neural mechanisms ofresponsibility aversion
We next turned to neural data to further under-stand the latent determinants of this processand how they are implemented in the brain. Inour computational model, the key factor deter-mining whether an individual will assumeresponsibility in any given trial is whether thecurrent subjective-value difference exceedsthe deferral threshold. Consequently, we cantest the hypothesis that individual differences inresponsibility aversion will manifest as differ-ences in this comparison process at the neurallevel.How might such a comparison process be im-
plemented in the brain? Higher-order cogni-tive functions, such as leadership decisions, aremost likely supported by interactions betweenboth local and anatomically distinct pools ofneurons (27). Therefore, we constructed a min-imal model of the neural processing nodes thatcan incorporate the different choice aspects re-lated to assuming responsibility and used this
minimal network to test manifestations of in-dividual differences at the neural level.We first used fMRI data fromparticipantswho
made decisions in the delegation task to identifybrain regions (i.e., potential network nodes) whereactivity correlated with the four key aspects ofour task: (i) the trial type (group versus self), (ii)relying on the group’s decision (defer rather thanlead), (iii) the subjective-value difference, and (iv)the estimated probability of leading, p(l) in eachtrial. Our goal herewas not an exhaustive charac-terization of all brain activity patterns underlyingleadership decisions. Rather, we aimed to test ifactivity patterns, centered on the time of choice,in a minimalistic brain network, can further un-cover unobservable aspects of the internal decisionprocess and test the mechanism for choosingthe responsibility of leadership derived throughcomputational modeling of the choice data.First, we identified activation that correlated
with the four aforementioned variables in ourleadership decision task at the time of choice(see tables S3 to S5). The basic contrast testingfor differential activity as a function of choicecondition (group versus self) revealed increasedactivity in the middle-superior temporal gyrus
(TG) when participants were potentially respon-sible for the welfare of others. The temporalparietal junction (TPJ) (i) was more active whenparticipants deferred their decision right to thegroup and (ii) also increased as a function of theinformational advantage (i.e., potential benefit)available by deferring and taking advantage ofthe other group members’ knowledge regardlessof the decision outcome (see supplementary re-sults 10.2).We also used themodel-derived, trial-wise esti-
mates of the subjective-value difference and theprobability of leading, p(l) as parametric regres-sors in our fMRI analyses. These two parametriccontrasts revealed that the subjective-value dif-ference was associated with activity in severalbrain regions, including the medial prefrontalcortex (mPFC), whereas the probability of lead-ing was most strongly reflected in the activityof the anterior insula (aIns; for additional detailsand full results of all univariate analyses, see sup-plementarymethods 5, supplementary results 10,and tables S3 to S5).Having identified regional activity (TG, TPJ,
mPFC, and aIns) that correlated with the fourcritical components of our leadership task, we
Edelson et al., Science 361, eaat0036 (2018) 3 August 2018 6 of 8
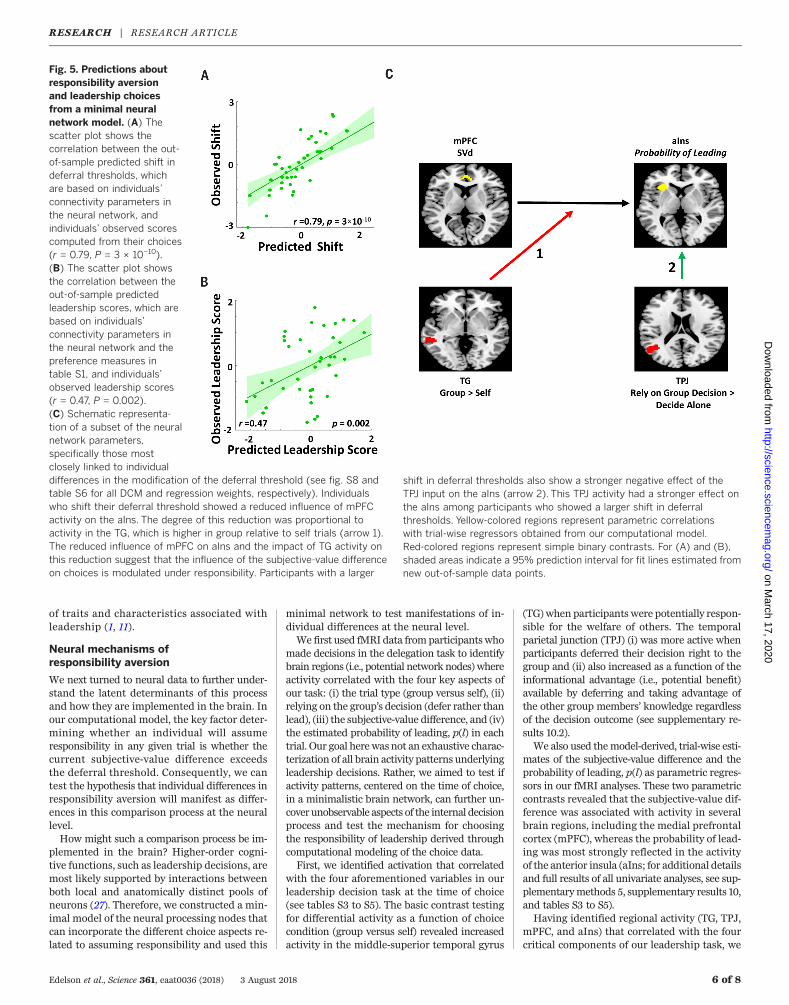
Fig. 5. Predictions aboutresponsibility aversionand leadership choicesfrom a minimal neuralnetwork model. (A) Thescatter plot shows thecorrelation between the out-of-sample predicted shift indeferral thresholds, whichare based on individuals’connectivity parameters inthe neural network, andindividuals’ observed scorescomputed from their choices(r = 0.79, P = 3 × 10⁻¹⁰).(B) The scatter plot showsthe correlation between theout-of-sample predictedleadership scores, which arebased on individuals’connectivity parameters inthe neural network and thepreference measures intable S1, and individuals’observed leadership scores(r = 0.47, P = 0.002).(C) Schematic representa-tion of a subset of the neuralnetwork parameters,specifically those mostclosely linked to individualdifferences in the modification of the deferral threshold (see fig. S8 andtable S6 for all DCM and regression weights, respectively). Individualswho shift their deferral threshold showed a reduced influence of mPFCactivity on the aIns. The degree of this reduction was proportional toactivity in the TG, which is higher in group relative to self trials (arrow 1).The reduced influence of mPFC on aIns and the impact of TG activity onthis reduction suggest that the influence of the subjective-value differenceon choices is modulated under responsibility. Participants with a larger
shift in deferral thresholds also show a stronger negative effect of theTPJ input on the aIns (arrow 2). This TPJ activity had a stronger effect onthe aIns among participants who showed a larger shift in deferralthresholds. Yellow-colored regions represent parametric correlationswith trial-wise regressors obtained from our computational model.Red-colored regions represent simple binary contrasts. For (A) and (B),shaded areas indicate a 95% prediction interval for fit lines estimated fromnew out-of-sample data points.
RESEARCH | RESEARCH ARTICLEon M
arch 17, 2020
http://science.sciencemag.org/
Dow
nloaded from
next quantified the levels of functional inter-action between these four network compo-nents. We fit a stochastic dynamic causal model(DCM) (28) to estimate the context-dependentchanges in functional coupling within our net-work on the group and self choices (for fulldetails, see supplementary methods 5.4). Oncewe obtained the parameters representing thelevels of local activity and functional couplingwithin our brain network model on group rel-ative to self trials, we tested whether these mea-sures can be used to predict and, ultimately,better understand individual patterns of leader-ship choices.Individual differences in the parameters of our
brain network model were indeed predictive ofindividual differences in the shift in deferralthresholds and leadership scores (Fig. 5, A andB). A model including only the neural networkparameters yielded accurate out-of-sample predic-tions for each participant’s shift in the deferralthreshold (median split classification accuracy =91%, P = 2 × 10⁻¹¹).We also tested if these neural parameters ex-
plained variation in leadership scores over andabove the behavioral measures listed in table S1(including responsibility aversion). Model com-parison demonstrated that including the pa-rameters of the DCM along with the behavioralmeasures provided a better fit to the data (Akaikeinformation criterion and Bayesian informationcriterions differences are equal to 186.6 and 119.8,respectively). Once again, this combined modelmade accurate out-of-sample classifications of theparticipants’ leadership scores (median split clas-sification accuracy = 71%, P = 0.006).Next, we turned to the question of which brain
network parameters best explained individualdifferences in behavior. In our computationalmodel of behavior, the deferral thresholds arecompared to the subjective-value difference todetermine whether it is best to lead or defer ineach trial, and these thresholds generally in-crease with responsibility for others (Figs. 3Dand 4C). This widening of the deferral thresholdssignifies a change in the association between thesubjective-value difference and deferral-choiceprobabilities, and this change is greater inhighly responsibility-averse individuals becausethe deferral threshold moves further out. There-fore, if mPFC activity is associated with thesubjective-value difference and aIns activity isassociated with the probability of leading, thenwe should see a differential impact of mPFCactivity on the aIns in participants with largerresponsibility aversion (i.e., greater wideningof the thresholds) in the group trials.This pattern of results was indeed observed
(Fig. 5C and table S6) and was conditional onactivity in the TG. Recall that TG activity washigher in the group trials compared to the selftrials. Increased TG activity was associated witha lower or inhibited influence ofmPFC on aIns atthe neural level. Leaders show less of this in-hibition. This provides a potential neural mech-anism for the change in deferral thresholds.These findings further support the conclusion
that responsibility aversion is the result of asecond-order process operating on the results ofsubjective-value computations generally thoughtto be related to mPFC activity (29, 30).We also found that, during the group trials
(relative to the self trials), there was a strongerinfluence of TPJ activity on the aIns in individualswho showed a larger shift in deferral thresholds.Activity in the TPJ reflected, in our task, the po-tential informational advantage available bydeferring to the decisions of the other groupmembers, consistentwith theories on the role ofthe TPJ in mentalizing (31). We speculate thatstronger signaling from the TPJ to the aIns ingroup trials may be one means through whichthe deferral threshold is increased, thus produc-ing the observed responsibility-averse choices.
Conclusion
Being a leader requires making choices that willdetermine others’ welfare. Decisions as diverseas committing soldiers to the battlefield or pick-ing a school for your child share a basic attribute:assuming responsibility for the outcome of others.Thus, although the motivations driving one tolead a country, business, or classroom are manyand varied (and domain-specific attitudes mostlikely play an important role), a willingness toshoulder responsibility is present in all whochoose to lead, shaping every level of society forbetter or worse.Our results provide a behavioral, computa-
tional, and neurobiological microfoundation ofthe processes underlying the decision to lead.Although early conceptual leadership researchemphasized the importance, and speculated onthe nature, of internal decision-making processes(32), the necessary empirical and analytic toolsto directly address these questions were not avail-able at the time. We identify low responsibilityaversion as an important determinant of the de-cision to lead and demonstrate, empirically andcomputationally, that it is based on a multilevelevaluation of the subjective evidence in favor ofone potential action over another in the light ofprior beliefs about the utility of maintaining con-trol (33), gaining information, and taking respon-sibility for others’ outcomes.We provide both a precise empirical measure
and a theoretical foundation of responsibilityaversion that make it possible to further ex-plore its implications for social and economicphenomena (34). There could be a psychologicalcost for assuming responsibility for others’ out-comes, which may require extra compensation.It may explain why “responsibility” is often usedto justify pay differentials in hierarchical orga-nizations (35), as well as why organizations maywant to economize on these costs and preferen-tially choose individuals with low responsibilityaversion for leadership positions and why in-dividuals with low responsibility aversion aremore likely to self-select into such positions (seeFig. 2D). These conjectures and our characteri-zation of the leadership choice process raisemanyfuture research opportunities, and we hope thatthe empirical and theoretical concepts developed
in this paper will prove useful in providing amore thorough understanding of these issues.
Methods summary
A full description of thematerials andmethods isprovided in the supplementarymaterials. Briefly,we collected choice data from 40 participants ona decision paradigm inwhich an individual coulddelegate decision-making power about a choicebetween a risky and a safe option to their groupor keep the right to decide. In the main task, theparticipants made 140 different choices undertwo conditions: in the self trials, only the in-dividual’s payoff is at stake, whereas in the grouptrials, each groupmember’s payoff is affected.Wecombined computational modeling approachesfrom the perceptual and value-based decision-making domains to estimate each individual’spersonal utility for every available action inorder to tease apart potential motivations forchoosing to “lead” or “follow.” In a separate sam-ple of 44 participants, we collected choice datausing the same decision paradigm in conjunc-tion with fMRI. The fMRI data were analyzedwith effective functional connectivity modelingtechniques to examine the neurobiological basisof leadership choices.
REFERENCES AND NOTES
1. B. Bass, R. Bass, The Bass Handbook of Leadership: Theory,Research, and Managerial Applications (Free Press, New York,2009).
2. S. M. Fleming, N. D. Daw, Self-evaluation of decision-making:A general Bayesian framework for metacognitive computation.Psychol. Rev. 124, 91–114 (2017). doi: 10.1037/rev0000045;pmid: 28004960
3. C. Summerfield, K. Tsetsos, Do humans make good decisions?Trends Cogn. Sci. 19, 27–34 (2015). doi: 10.1016/j.tics.2014.11.005; pmid: 25488076
4. B. De Martino, S. Bobadilla-Suarez, T. Nouguchi, T. Sharot,B. C. Love, Social information is integrated into value andconfidence judgments according to its reliability. J. Neurosci.37, 6066–6074 (2017). doi: 10.1523/JNEUROSCI.3880-16.2017; pmid: 28566360
5. B. Bartling, E. Fehr, H. Herz, The intrinsic value of decisionrights. Econometrica 82, 2005–2039 (2014). doi: 10.3982/ECTA11573
6. E. Fehr, H. Herz, T. Wilkening, The lure of authority: Motivationand incentive effects of power. Am. Econ. Rev. 103, 1325–1359(2013). doi: 10.1257/aer.103.4.1325
7. C. Eckel, P. Grossman, Managing diversity by creating teamidentity. J. Econ. Behav. Organ. 58, 371–392 (2005).doi: 10.1016/j.jebo.2004.01.003
8. J. Faria, J. Dyer, C. Tosh, J. Krause, Leadership and socialinformation use in human crowds. Anim. Behav. 79, 895–901(2010). doi: 10.1016/j.anbehav.2009.12.039
9. A. W. Halpin, B. J. Winer, in Leader Behavior: Its Description andMeasurement, R. M. Stogdill, A. E. Coons, Eds. (Ohio StateUniv., 1957).
10. R. Blake, J. Mouton, A. Bidwell, Managerial grid.Adv. Manag.–Office Exec. 1, 12–15 (1962).
11. E. A. Fleishman et al., Taxonomic efforts in the description ofleader behavior: A synthesis and functional interpretation.Leadersh. Q. 2, 245–287 (1992). doi: 10.1016/1048-9843(91)90016-U
12. C. S. Burke et al., What type of leadership behaviors arefunctional in teams? A meta-analysis. Leadersh. Q. 17,288–307 (2006). doi: 10.1016/j.leaqua.2006.02.007
13. T. A. Judge, R. F. Piccolo, R. Ilies, The forgotten ones? Thevalidity of consideration and initiating structure in leadershipresearch. J. Appl. Psychol. 89, 36–51 (2004). doi: 10.1037/0021-9010.89.1.36; pmid: 14769119
14. G. Charness, M. Jackson, The role of responsibility in strategicrisk-taking. J. Econ. Behav. Organ. 69, 241–247 (2009).doi: 10.1016/j.jebo.2008.10.006
Edelson et al., Science 361, eaat0036 (2018) 3 August 2018 7 of 8
RESEARCH | RESEARCH ARTICLEon M
arch 17, 2020
http://science.sciencemag.org/
Dow
nloaded from
15. J. Pahlke, S. Strasser, F. Vieider, Responsibility effects indecision making under risk. J. Risk Uncertain. 51, 125–146(2015). doi: 10.1007/s11166-015-9223-6
16. D. M. Green, J. A. Swets, Signal Detection Theory andPsychophysics (Wiley, 1966).
17. A. T. Qamar et al., Trial-to-trial, uncertainty-based adjustmentof decision boundaries in visual categorization. Proc. Natl.Acad. Sci. U.S.A. 110, 20332–20337 (2013). doi: 10.1073/pnas.1219756110; pmid: 24272938
18. A. Tversky, D. Kahneman, Advances in prospect theory:Cumulative representation of uncertainty. J. Risk Uncertain. 5,297–323 (1992). doi: 10.1007/BF00122574
19. C. D. Frith, U. Frith, Mechanisms of social cognition.Annu. Rev. Psychol. 63, 287–313 (2012). doi: 10.1146/annurev-psych-120710-100449; pmid: 21838544
20. Y.-L. Boureau, P. Sokol-Hessner, N. D. Daw, Deciding howto decide: Self-control and meta-decision making.Trends Cogn. Sci. 19, 700–710 (2015). doi: 10.1016/j.tics.2015.08.013; pmid: 26483151
21. B. J. Avolio, B. M. Bass, D. I. Jung, Re-examining thecomponents of transformational and transactional leadershipusing the Multifactor Leadership. J. Occup. Organ. Psychol. 72,441–462 (1999). doi: 10.1348/096317999166789
22. P. Balthazard, D. Waldman, R. W. Thatcher, S. T. Hannah,Differentiating transformational and non-transformationalleaders on the basis of neurological imaging. Leadersh. Q. 23,244–258 (2012). doi: 10.1016/j.leaqua.2011.08.002
23. S. Einarsen, M. S. Aasland, A. Skogstad, Destructive leadershipbehaviour: A definition and conceptual model. Leadersh. Q. 18,207–216 (2007). doi: 10.1016/j.leaqua.2007.03.002
24. J. Antonakis, D. V. Day, B. Schyns, Leadership and individualdifferences: At the cusp of a renaissance. Leadersh. Q. 23,643–650 (2012). doi: 10.1016/j.leaqua.2012.05.002
25. R. E. Boyatzis, K. Rochford, A. I. Jack, Antagonistic neuralnetworks underlying differentiated leadership roles.Front. Hum. Neurosci. 8, 114 (2014). doi: 10.3389/fnhum.2014.00114; pmid: 24624074
26. J. Jiang et al., Leader emergence through interpersonal neuralsynchronization. Proc. Natl. Acad. Sci. U.S.A. 112, 4274–4279(2015). doi: 10.1073/pnas.1422930112; pmid: 25831535
27. S. L. Bressler, V. Menon, Large-scale brain networks in cognition:Emerging methods and principles. Trends Cogn. Sci. 14, 277–290(2010). doi: 10.1016/j.tics.2010.04.004; pmid: 20493761
28. B. Li et al., Generalised filtering and stochastic DCM for fMRI.Neuroimage 58, 442–457 (2011). doi: 10.1016/j.neuroimage.2011.01.085; pmid: 21310247
29. O. Bartra, J. T. McGuire, J. W. Kable, The valuation system:A coordinate-based meta-analysis of BOLD fMRI experimentsexamining neural correlates of subjective value. Neuroimage76, 412–427 (2013). doi: 10.1016/j.neuroimage.2013.02.063;pmid: 23507394
30. J. A. Clithero, A. Rangel, Informatic parcellation of the networkinvolved in the computation of subjective value. Soc. Cogn.Affect. Neurosci. 9, 1289–1302 (2014). doi: 10.1093/scan/nst106; pmid: 23887811
31. R. M. Carter, S. A. Huettel, A nexus model of the temporal-parietal junction. Trends Cogn. Sci. 17, 328–336 (2013).doi: 10.1016/j.tics.2013.05.007; pmid: 23790322
32. V. Vroom, P. Yetton, Leadership and Decision-Making(Univ. Pittsburgh Press, 1973).
33. L. A. Leotti, M. R. Delgado, The value of exercising control overmonetary gains and losses. Psychol. Sci. 25, 596–604 (2014).doi: 10.1177/0956797613514589; pmid: 24390827
34. Consider the analogy with the intuitive notion of risk aversion,which lacked a precise theoretical underpinning before Arrowand Pratt precisely defined it in terms of the concavity ofan individual’s utility function, thereby opening the door fortheoretical modeling and the precise interpretation of empiricalmeasures of risk aversion. Without these foundations, progressin understanding the concept of risk aversion would have beenseriously impeded.
35. J. Dickinson, Employees’ preferences for the bases of paydifferentials. Employee Relat. 28, 164–183 (2006).doi: 10.1108/01425450610639383
36. I. Krajbich, B. Bartling, T. Hare, E. Fehr, Rethinking fast andslow based on a critique of reaction-time reverse inference.Nat. Commun. 6, 7455 (2015). doi: 10.1038/ncomms8455;pmid: 26135809
ACKNOWLEDGMENTS
We thank Y. Berson, T. Fitzgerald, M. Grueschow, and T. Sharot for helpfulfeedback; L. Kasper and K. Treiber for technical assistance; andS. Gobbi for error-proofing scripts. Funding: E.F. was supported by theEuropean Research Council (Advanced Grant on the Foundations ofEconomic Preferences). M.G.E., R.P., C.C.R., E.F., and T.A.H. weresupported by the Swiss National Science Foundation (grant numbers100014_140277, 320030_143443, and 105314_152891 and Sinergia grantCRSII3_141965). C.C.R was supported by the European Research Council(BRAINCODES). Author contributions: M.G.E. conceived the idea.M.G.E., T.A.H., and E.F. designed experiments with contributionsfrom C.C.R.. M.G.E. conducted the experiments. M.G.E., R.P., andT.A.H. performed the analyses and computational modeling withcontributions from E.F. M.G.E., T.A.H., and E.F. wrote the paper withcontributions from C.C.R. and R.P. All authors discussed the results andimplications and commented on the manuscript at all stages.Competinginterests: The authors declare no competing financial interests. Dataand materials availability: Data and analyses codes are available athttps://econgit.uzh.ch/thare/Edelson_Polania_Ruff_Fehr_Hare_2018.git.
SUPPLEMENTARY MATERIALS
www.sciencemag.org/content/361/6401/eaat0036/suppl/DC1Materials and MethodsSupplementary ResultsFig. S1 to S8Tables S1 to S7References (37–122)Appendices S1 and S2
14 January 2018; accepted 6 July 201810.1126/science.aat0036
Edelson et al., Science 361, eaat0036 (2018) 3 August 2018 8 of 8
RESEARCH | RESEARCH ARTICLEon M
arch 17, 2020
http://science.sciencemag.org/
Dow
nloaded from
Computational and neurobiological foundations of leadership decisionsMicah G. Edelson, Rafael Polania, Christian C. Ruff, Ernst Fehr and Todd A. Hare
DOI: 10.1126/science.aat0036 (6401), eaat0036.361Science
, this issue p. 467; see also p. eaat0036Sciencetemporal gyrus, the temporal parietal junction, and the anterior insula.encoded in the activity and connectivity of a brain network that comprises the medial prefrontal cortex, the superior mechanistic understanding of this preference. Neuroimaging experiments showed how the key theoretical concepts arehad higher leadership scores. A computational model combining signal detection theory with prospect theory provided a
aversion''metacognitive process (see the Perspective by Fleming and Bang). Individuals who showed less ''responsibility found empirically and theoretically that the choice to lead rests on aet al.underpinnings of leadership choices. Edelson
neurobiologicalresearch has rarely used computational modeling or neuroimaging techniques to examine mechanistic or Leadership of groups is of paramount importance and pervades almost every aspect of society. Leadership
Leadership and responsibility
ARTICLE TOOLS http://science.sciencemag.org/content/361/6401/eaat0036
MATERIALSSUPPLEMENTARY http://science.sciencemag.org/content/suppl/2018/08/01/361.6401.eaat0036.DC1
CONTENTRELATED
file:/contenthttp://science.sciencemag.org/content/sci/361/6401/449.full
REFERENCES
http://science.sciencemag.org/content/361/6401/eaat0036#BIBLThis article cites 102 articles, 10 of which you can access for free
PERMISSIONS http://www.sciencemag.org/help/reprints-and-permissions
Terms of ServiceUse of this article is subject to the
is a registered trademark of AAAS.ScienceScience, 1200 New York Avenue NW, Washington, DC 20005. The title (print ISSN 0036-8075; online ISSN 1095-9203) is published by the American Association for the Advancement ofScience
Copyright © 2018, American Association for the Advancement of Science
on March 17, 2020
http://science.sciencem
ag.org/D
ownloaded from