the dssat cropping system model - agricultural and biological
TRANSCRIPT
The DSSAT cropping system model�
J.W. Jones a,�, G. Hoogenboom b, C.H. Porter a, K.J. Boote a,W.D. Batchelor c, L.A. Hunt d, P.W. Wilkens e, U. Singh e, A.J. Gijsman a,
J.T. Ritchie f
a Agricultural and Biological Engineering Department, P.O. Box 110570, University of Florida, Gainesville, FL, USAb Department of Biological and Agricultural Engineering, University of Georgia, 165 Gordon Futral Court, Griffin, GA 30223, USA
c Agricultural and Biosystems Engineering, 219b Davidson Hall, Iowa State University, Ames, IA 50011, USAd Department of Plant Agriculture, Crop Science Building, University of Guelph, Guelph, Ont., Canada N1G 2W1
e International Fertilizer Development Center, Muscle Shoals, AL, USAf Department of Crop and Soil Science, Michigan State University, East Lansing, MI, USA
Abstract
The decision support system for agrotechnology transfer (DSSAT) has been in use for the last 15 years by researchers
worldwide. This package incorporates models of 16 different crops with software that facilitates the evaluation and
application of the crop models for different purposes. Over the last few years, it has become increasingly difficult to
maintain the DSSAT crop models, partly due to fact that there were different sets of computer code for different crops
with little attention to software design at the level of crop models themselves. Thus, the DSSAT crop models have been
re-designed and programmed to facilitate more efficient incorporation of new scientific advances, applications,
documentation and maintenance. The basis for the new DSSAT cropping system model (CSM) design is a modular
structure in which components separate along scientific discipline lines and are structured to allow easy replacement or
addition of modules. It has one Soil module, a Crop Template module which can simulate different crops by defining
species input files, an interface to add individual crop models if they have the same design and interface, a Weather
module, and a module for dealing with competition for light and water among the soil, plants, and atmosphere. It is
also designed for incorporation into various application packages, ranging from those that help researchers adapt and
test the CSM to those that operate the DSSAT�/CSM to simulate production over time and space for different
purposes. In this paper, we describe this new DSSAT�/CSM design as well as approaches used to model the primary
scientific components (soil, crop, weather, and management). In addition, the paper describes data requirements and
methods used for model evaluation. We provide an overview of the hundreds of published studies in which the DSSAT
crop models have been used for various applications. The benefits of the new, re-designed DSSAT�/CSM will provide
considerable opportunities to its developers and others in the scientific community for greater cooperation in
interdisciplinary research and in the application of knowledge to solve problems at field, farm, and higher levels.
# 2002 Elsevier Science B.V. All rights reserved.
Keywords: Crop simulation; Weather; Research tool; Decision aid
�Contribution from Florida Agricultural Experiment Station, University of Florida. Journal Series No. R-08916.
� Corresponding author. Tel.: �/1-352-392-1864x289; fax: �/1-352-392-4092
E-mail address: [email protected] (J.W. Jones).
Europ. J. Agronomy 18 (2003) 235�/265
www.elsevier.com/locate/eja
1161-0301/02/$ - see front matter # 2002 Elsevier Science B.V. All rights reserved.
PII: S 1 1 6 1 - 0 3 0 1 ( 0 2 ) 0 0 1 0 7 - 7
1. Introduction
Information needs for agricultural decision
making at all levels are increasing rapidly due to
increased demands for agricultural products and
increased pressures on land, water, and other
natural resources. The generation of new data
through traditional agronomic research methods
and its publication are not sufficient to meet theseincreasing needs. Traditional agronomic experi-
ments are conducted at particular points in time
and space, making results site- and season-specific,
time consuming and expensive. Unless new data
and research findings are put into formats that are
relevant and easily accessible, they may not be
used effectively. The decision support system for
agrotechnology transfer (DSSAT) was originallydeveloped by an international network of scien-
tists, cooperating in the International Benchmark
Sites Network for Agrotechnology Transfer pro-
ject (IBSNAT, 1993; Tsuji, 1998; Uehara, 1998;
Jones et al., 1998), to facilitate the application of
crop models in a systems approach to agronomic
research. Its initial development was motivated by
a need to integrate knowledge about soil, climate,crops, and management for making better deci-
sions about transferring production technology
from one location to others where soils and
climate differed (IBSNAT, 1993; Uehara and
Tsuji, 1998). The systems approach provided a
framework in which research is conducted to
understand how the system and its components
function. This understanding is then integratedinto models that allow one to predict the behavior
of the system for given conditions. After one is
confident that the models simulate the real world
adequately, computer experiments can be per-
formed hundreds or even thousands of times for
given environments to determine how to best
manage or control the system. DSSAT was devel-
oped to operationalize this approach and make itavailable for global applications. The DSSAT
helps decision-makers by reducing the time and
human resources required for analyzing complex
alternative decisions (Tsuji et al., 1998). It also
provides a framework for scientific cooperation
through research to integrate new knowledge and
apply it to research questions.
Prior to the development of the DSSAT, cropmodels were available, but these were used mostly
in labs where they were created. For example, the
original crop models implemented in DSSAT, the
CERES models for maize (Jones and Kiniry, 1986)
and wheat (Ritchie and Otter, 1985) and the
SOYGRO soybean (Wilkerson et al., 1983) and
PNUTGRO peanut (Boote et al., 1986) models,
were already enjoying early successes. Thosemodels required different file and data structures
and had different modes of operation. Because the
IBSNAT project aimed to provide a framework
for cropping system analysis, these crop models
had to be revised to make them compatible
regarding data inputs and application modes.
The decision to make these models compatible
led to the design of the DSSAT and the ultimatedevelopment of compatible models for additional
crops, such as potato, rice, dry beans, sunflower,
and sugarcane (Hoogenboom et al., 1994a; Jones
et al., 1998; Hoogenboom et al., 1999). In DSSAT
v3.5, the latest release at the time this paper was
written, there are models for 16 different crops and
a bare fallow simulation.
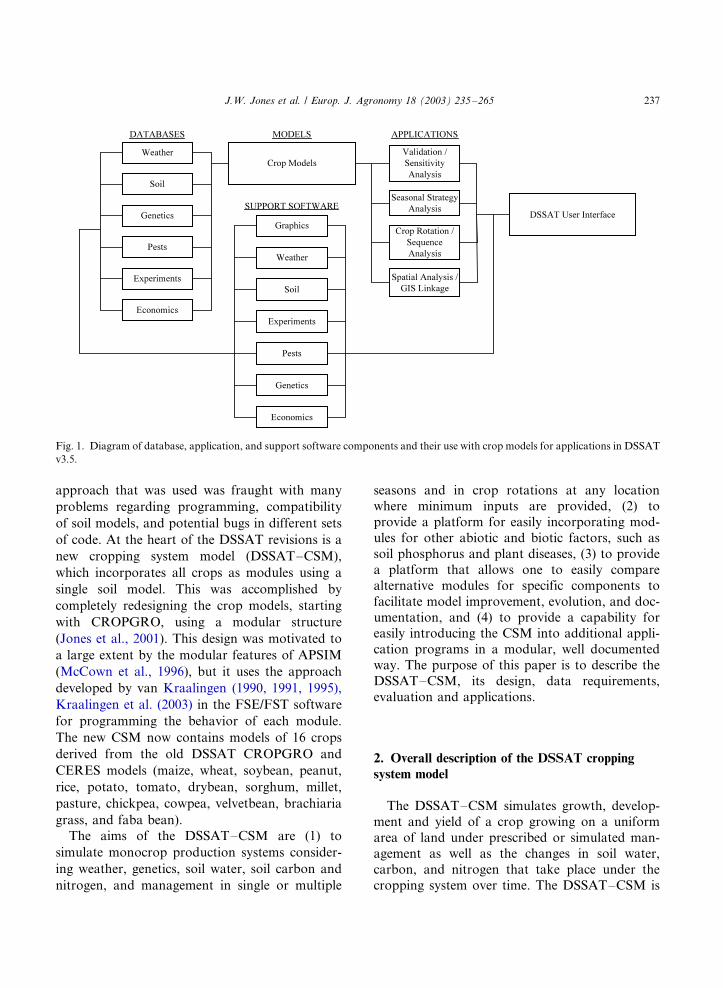
The DSSAT is a collection of independentprograms that operate together; crop simulation
models are at its center (Fig. 1). Databases
describe weather, soil, experiment conditions and
measurements, and genotype information for ap-
plying the models to different situations. Software
helps users prepare these databases and compare
simulated results with observations to give them
confidence in the models or to determine ifmodifications are needed to improve accuracy
(Uehara, 1989; Jones et al., 1998). In addition,
programs contained in DSSAT allow users to
simulate options for crop management over a
number of years to assess the risks associated
with each option. DSSAT was first released (v2.1)
in 1989; additional releases were made in 1994
(v3.0) (Tsuji et al., 1994) and 1998 (v3.5) (Hoo-genboom et al., 1999).
The DSSAT is currently undergoing major
revisions, not in its aim but in its design. One
major reason for this re-design is that each
individual crop model in DSSAT v3.5 had its
own soil model components. Although simulation
of crop rotations was possible in that version, the
J.W. Jones et al. / Europ. J. Agronomy 18 (2003) 235�/265236
approach that was used was fraught with many
problems regarding programming, compatibility
of soil models, and potential bugs in different sets
of code. At the heart of the DSSAT revisions is a
new cropping system model (DSSAT�/CSM),
which incorporates all crops as modules using a
single soil model. This was accomplished by
completely redesigning the crop models, starting
with CROPGRO, using a modular structure
(Jones et al., 2001). This design was motivated to
a large extent by the modular features of APSIM
(McCown et al., 1996), but it uses the approach
developed by van Kraalingen (1990, 1991, 1995),
Kraalingen et al. (2003) in the FSE/FST software
for programming the behavior of each module.
The new CSM now contains models of 16 crops
derived from the old DSSAT CROPGRO and
CERES models (maize, wheat, soybean, peanut,
rice, potato, tomato, drybean, sorghum, millet,
pasture, chickpea, cowpea, velvetbean, brachiaria
grass, and faba bean).
The aims of the DSSAT�/CSM are (1) to
simulate monocrop production systems consider-
ing weather, genetics, soil water, soil carbon and
nitrogen, and management in single or multiple
seasons and in crop rotations at any locationwhere minimum inputs are provided, (2) to
provide a platform for easily incorporating mod-
ules for other abiotic and biotic factors, such as
soil phosphorus and plant diseases, (3) to provide
a platform that allows one to easily compare
alternative modules for specific components to
facilitate model improvement, evolution, and doc-
umentation, and (4) to provide a capability foreasily introducing the CSM into additional appli-
cation programs in a modular, well documented
way. The purpose of this paper is to describe the
DSSAT�/CSM, its design, data requirements,
evaluation and applications.
2. Overall description of the DSSAT cropping
system model
The DSSAT�/CSM simulates growth, develop-
ment and yield of a crop growing on a uniform
area of land under prescribed or simulated man-
agement as well as the changes in soil water,
carbon, and nitrogen that take place under the
cropping system over time. The DSSAT�/CSM is
Fig. 1. Diagram of database, application, and support software components and their use with crop models for applications in DSSAT
v3.5.
J.W. Jones et al. / Europ. J. Agronomy 18 (2003) 235�/265 237
structured using the modular approach described
by Jones et al. (2001) and Porter et al. (2000). The
most important features of our approach are:
. It separates modules along disciplinary lines,
. It defines clear and simple interfaces for each
module,. It enables individual components to be plugged
in or unplugged with little impact on the main
program or other modules, i.e. for comparison
of different models or model components,
. It facilitates documentation and maintenance of
code,
. It enables modules written in different program-
ming languages to be linked together,. It allows for easy integration into different
types of application packages due to the well
defined and documented interface to the mod-
ules,
. It allows for evolution to integrate other
components, such as livestock and intercrop-
ping, through well defined module interfaces,
and. It facilitates cooperation among different model
development groups where each can focus on
specific modules as building blocks for expand-
ing the scope and utility of the CSM. All co-
authors of this paper actively contributed to the
overall design of DSSAT�/CSM, provided mod-
ules, and are responsible for maintenance of
specific modules.
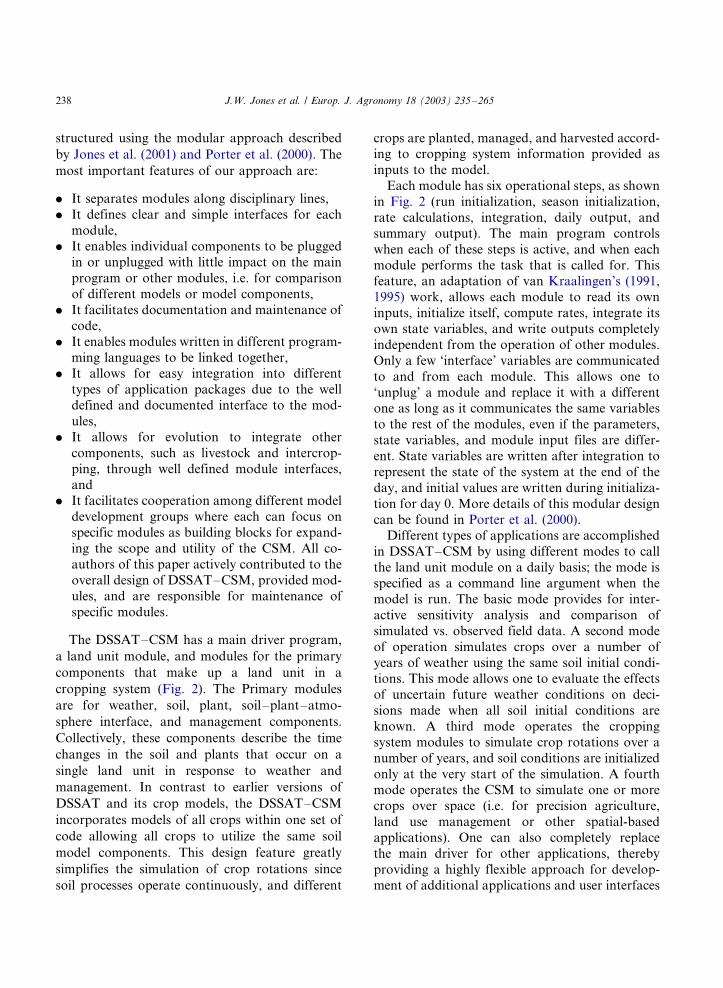
The DSSAT�/CSM has a main driver program,
a land unit module, and modules for the primary
components that make up a land unit in a
cropping system (Fig. 2). The Primary modules
are for weather, soil, plant, soil�/plant�/atmo-
sphere interface, and management components.
Collectively, these components describe the time
changes in the soil and plants that occur on a
single land unit in response to weather and
management. In contrast to earlier versions of
DSSAT and its crop models, the DSSAT�/CSM
incorporates models of all crops within one set of
code allowing all crops to utilize the same soil
model components. This design feature greatly
simplifies the simulation of crop rotations since
soil processes operate continuously, and different
crops are planted, managed, and harvested accord-ing to cropping system information provided as
inputs to the model.
Each module has six operational steps, as shown
in Fig. 2 (run initialization, season initialization,
rate calculations, integration, daily output, and
summary output). The main program controls
when each of these steps is active, and when each
module performs the task that is called for. Thisfeature, an adaptation of van Kraalingen’s (1991,
1995) work, allows each module to read its own
inputs, initialize itself, compute rates, integrate its
own state variables, and write outputs completely
independent from the operation of other modules.
Only a few ‘interface’ variables are communicated
to and from each module. This allows one to
‘unplug’ a module and replace it with a differentone as long as it communicates the same variables
to the rest of the modules, even if the parameters,
state variables, and module input files are differ-
ent. State variables are written after integration to
represent the state of the system at the end of the
day, and initial values are written during initializa-
tion for day 0. More details of this modular design
can be found in Porter et al. (2000).Different types of applications are accomplished
in DSSAT�/CSM by using different modes to call
the land unit module on a daily basis; the mode is
specified as a command line argument when the
model is run. The basic mode provides for inter-
active sensitivity analysis and comparison of
simulated vs. observed field data. A second mode
of operation simulates crops over a number ofyears of weather using the same soil initial condi-
tions. This mode allows one to evaluate the effects
of uncertain future weather conditions on deci-
sions made when all soil initial conditions are
known. A third mode operates the cropping
system modules to simulate crop rotations over a
number of years, and soil conditions are initialized
only at the very start of the simulation. A fourthmode operates the CSM to simulate one or more
crops over space (i.e. for precision agriculture,
land use management or other spatial-based
applications). One can also completely replace
the main driver for other applications, thereby
providing a highly flexible approach for develop-
ment of additional applications and user interfaces
J.W. Jones et al. / Europ. J. Agronomy 18 (2003) 235�/265238
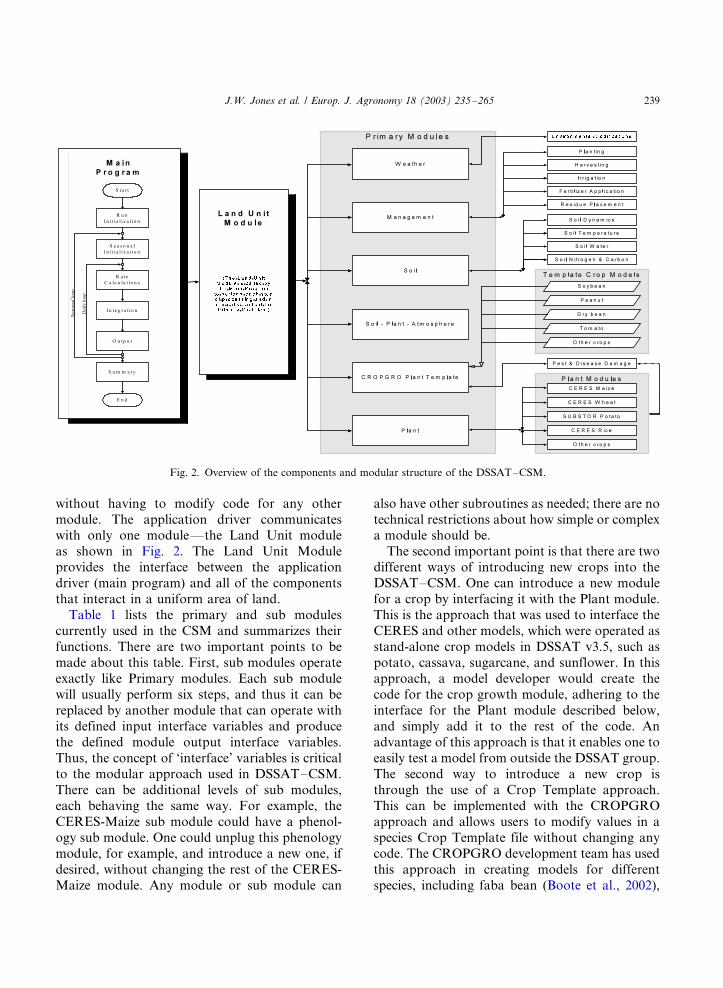
without having to modify code for any other
module. The application driver communicateswith only one module*/the Land Unit module
as shown in Fig. 2. The Land Unit Module
provides the interface between the application
driver (main program) and all of the components
that interact in a uniform area of land.
Table 1 lists the primary and sub modules
currently used in the CSM and summarizes their
functions. There are two important points to be
made about this table. First, sub modules operate
exactly like Primary modules. Each sub module
will usually perform six steps, and thus it can be
replaced by another module that can operate with
its defined input interface variables and produce
the defined module output interface variables.
Thus, the concept of ‘interface’ variables is critical
to the modular approach used in DSSAT�/CSM.
There can be additional levels of sub modules,
each behaving the same way. For example, the
CERES-Maize sub module could have a phenol-
ogy sub module. One could unplug this phenology
module, for example, and introduce a new one, if
desired, without changing the rest of the CERES-
Maize module. Any module or sub module can
also have other subroutines as needed; there are no
technical restrictions about how simple or complexa module should be.
The second important point is that there are two
different ways of introducing new crops into the
DSSAT�/CSM. One can introduce a new module
for a crop by interfacing it with the Plant module.
This is the approach that was used to interface the
CERES and other models, which were operated as
stand-alone crop models in DSSAT v3.5, such as
potato, cassava, sugarcane, and sunflower. In this
approach, a model developer would create the
code for the crop growth module, adhering to the
interface for the Plant module described below,
and simply add it to the rest of the code. An
advantage of this approach is that it enables one to
easily test a model from outside the DSSAT group.
The second way to introduce a new crop is
through the use of a Crop Template approach.
This can be implemented with the CROPGRO
approach and allows users to modify values in a
species Crop Template file without changing any
code. The CROPGRO development team has used
this approach in creating models for different
species, including faba bean (Boote et al., 2002),
Fig. 2. Overview of the components and modular structure of the DSSAT�/CSM.
J.W. Jones et al. / Europ. J. Agronomy 18 (2003) 235�/265 239
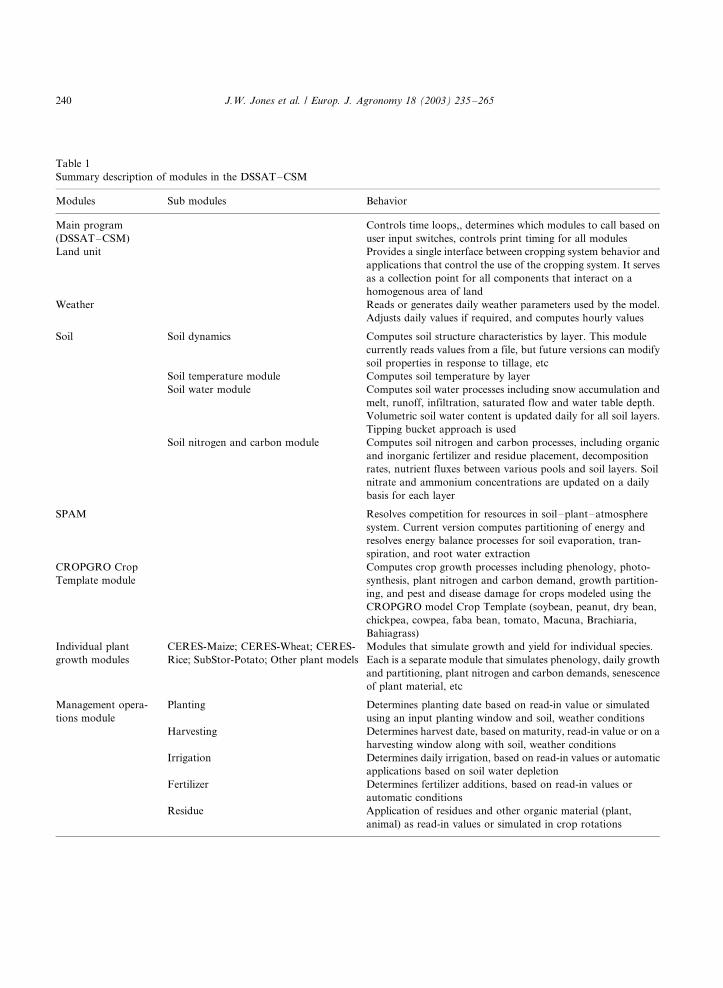
Table 1
Summary description of modules in the DSSAT�/CSM
Modules Sub modules Behavior
Main program
(DSSAT�/CSM)
Controls time loops,, determines which modules to call based on
user input switches, controls print timing for all modules
Land unit Provides a single interface between cropping system behavior and
applications that control the use of the cropping system. It serves
as a collection point for all components that interact on a
homogenous area of land
Weather Reads or generates daily weather parameters used by the model.
Adjusts daily values if required, and computes hourly values
Soil Soil dynamics Computes soil structure characteristics by layer. This module
currently reads values from a file, but future versions can modify
soil properties in response to tillage, etc
Soil temperature module Computes soil temperature by layer
Soil water module Computes soil water processes including snow accumulation and
melt, runoff, infiltration, saturated flow and water table depth.
Volumetric soil water content is updated daily for all soil layers.
Tipping bucket approach is used
Soil nitrogen and carbon module Computes soil nitrogen and carbon processes, including organic
and inorganic fertilizer and residue placement, decomposition
rates, nutrient fluxes between various pools and soil layers. Soil
nitrate and ammonium concentrations are updated on a daily
basis for each layer
SPAM Resolves competition for resources in soil�/plant�/atmosphere
system. Current version computes partitioning of energy and
resolves energy balance processes for soil evaporation, tran-
spiration, and root water extraction
CROPGRO Crop
Template module
Computes crop growth processes including phenology, photo-
synthesis, plant nitrogen and carbon demand, growth partition-
ing, and pest and disease damage for crops modeled using the
CROPGRO model Crop Template (soybean, peanut, dry bean,
chickpea, cowpea, faba bean, tomato, Macuna, Brachiaria,
Bahiagrass)
Individual plant
growth modules
CERES-Maize; CERES-Wheat; CERES-
Rice; SubStor-Potato; Other plant models
Modules that simulate growth and yield for individual species.
Each is a separate module that simulates phenology, daily growth
and partitioning, plant nitrogen and carbon demands, senescence
of plant material, etc
Management opera-
tions module
Planting Determines planting date based on read-in value or simulated
using an input planting window and soil, weather conditions
Harvesting Determines harvest date, based on maturity, read-in value or on a
harvesting window along with soil, weather conditions
Irrigation Determines daily irrigation, based on read-in values or automatic
applications based on soil water depletion
Fertilizer Determines fertilizer additions, based on read-in values or
automatic conditions
Residue Application of residues and other organic material (plant,
animal) as read-in values or simulated in crop rotations
J.W. Jones et al. / Europ. J. Agronomy 18 (2003) 235�/265240
brachiaria grass (Giraldo et al., 1998), tomato(Scholberg et al., 1997), chickpea (Singh and
Virmani, 1994) and velvet bean (Hartkamp et al.,
2002), for example. A major advantage of this
approach is that working with the Crop Template
will no doubt be less prone to errors.
3. Component descriptions
The main program reads information from the
DSSAT standard file that describes a particular
experiment or situation to be simulated (Hunt et
al., 2001) and sets a number of variables for
controlling a simulation run. It initiates the
simulation by setting the DYNAMIC variable
for initializing the run and calls the Land Unit
module. It then starts a crop season time loop andcalls the Land Unit module for initializing vari-
ables that must be set at the start of each season.
After initialization of the seasonal loop, the main
program starts a daily loop and calls the Land
Unit module three times in sequence, first to
compute rates, secondly to integrate, and finally
to report daily outputs. After a crop season is
completed, it calls the Land Unit module toproduce season-end variables and to create sum-
mary output files. A summary of these operations
is presented in Fig. 2. The main program provides
these timing and simulation control variables to all
modules.
The Land Unit module calls each of the primary
cropping system modules shown in Fig. 2 each
day. At the start of each new crop season, itobtains management information from the
DSSAT input file. The Land Unit and Primary
modules link to sub modules, and thus are used to
aggregate processes and information describing
successive components of the cropping system. For
example, the Soil module has four sub modules
that integrate soil water, soil carbon and nitrogen,
soil temperature and soil dynamics processes. ThePlant module has sub modules for various crops.
Below, we describe these modules and sub mod-
ules, emphasizing those for simulating soil and
plant growth processes and their interactions.
Table 2 shows the variables that are currently
passed from each of the Primary modules to the
Land Unit module, excluding the timing andcontrol variables. These interface variables are
available for any primary module since they are
passed into the Land Unit module.
3.1. Weather module
The main function of the Weather module is to
read or generate daily weather data. It reads in
daily weather values (maximum and minimum air
temperatures, solar radiation and precipitation,
relative humidity and wind speed when available),
from the daily weather file. Hourly weather valuesare computed for use by some modules that
require them. This module generates daily weather
data using the WGEN (Richardson, 1981, 1985) or
SIMMETEO (Geng et al., 1986, 1988) weather
generators. It also can modify daily weather
variables for studying climate change or simulat-
ing experiments in which solar radiation, rainfall,
maximum and minimum temperatures, day length,and/or atmospheric CO2 concentrations were set
at constant values or increased/decreased relative
to their read-in values. Based on the inputs
provided from the management file, the Weather
module knows whether to just read-in daily values
or to generate or modify them (using the Environ-
mental Modification sub module). The variables
listed in Table 2a are passed through its interface.
3.2. Soil module
The soil in the land unit is represented as a one-dimensional profile; it is homogenous horizontally
and consists of a number of vertical soil layers.
The Soil module integrates information from four
sub modules: soil water, soil temperature, soil
carbon and nitrogen, and soil dynamics. Table
2b defines the variables produced by this module
for use in other modules. The soil dynamics
module is designed to read-in soil parameters forthe land unit and to modify them based on tillage,
long-term changes in soil carbon, or other field
operations. The soil dynamics module currently
reads in soil properties from a file. Descriptions of
the other three sub modules of Soil are given
below.
J.W. Jones et al. / Europ. J. Agronomy 18 (2003) 235�/265 241
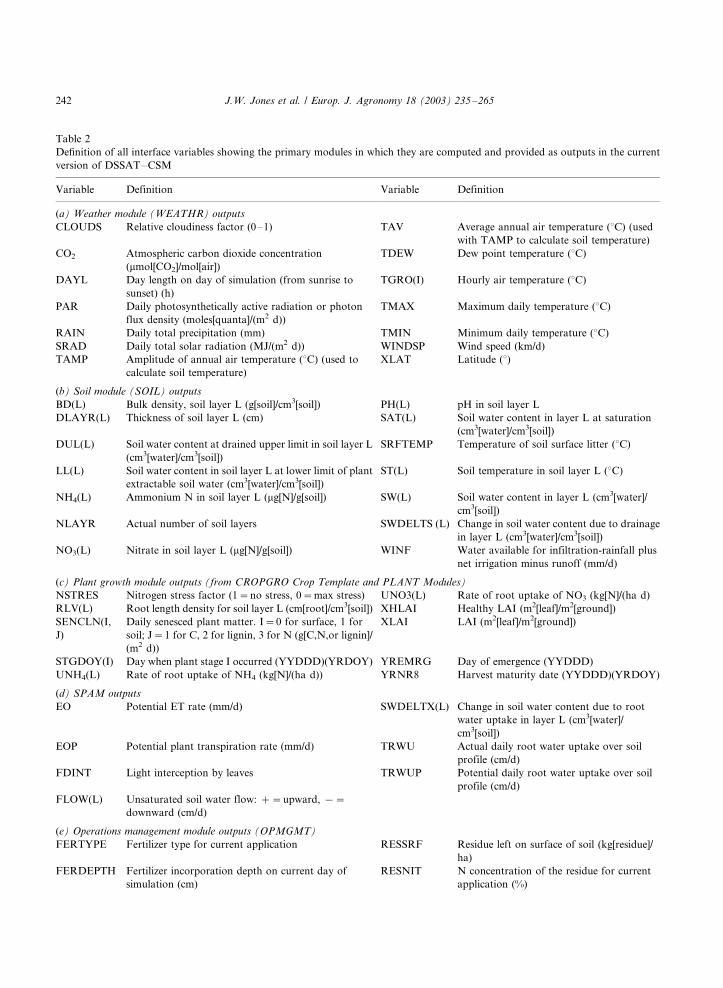
Table 2
Definition of all interface variables showing the primary modules in which they are computed and provided as outputs in the current
version of DSSAT�/CSM
Variable Definition Variable Definition
(a) Weather module (WEATHR) outputs
CLOUDS Relative cloudiness factor (0�/1) TAV Average annual air temperature (8C) (used
with TAMP to calculate soil temperature)
CO2 Atmospheric carbon dioxide concentration
(mmol[CO2]/mol[air])
TDEW Dew point temperature (8C)
DAYL Day length on day of simulation (from sunrise to
sunset) (h)
TGRO(I) Hourly air temperature (8C)
PAR Daily photosynthetically active radiation or photon
flux density (moles[quanta]/(m2 d))
TMAX Maximum daily temperature (8C)
RAIN Daily total precipitation (mm) TMIN Minimum daily temperature (8C)
SRAD Daily total solar radiation (MJ/(m2 d)) WINDSP Wind speed (km/d)
TAMP Amplitude of annual air temperature (8C) (used to
calculate soil temperature)
XLAT Latitude (8)
(b) Soil module (SOIL) outputs
BD(L) Bulk density, soil layer L (g[soil]/cm3[soil]) PH(L) pH in soil layer L
DLAYR(L) Thickness of soil layer L (cm) SAT(L) Soil water content in layer L at saturation
(cm3[water]/cm3[soil])
DUL(L) Soil water content at drained upper limit in soil layer L
(cm3[water]/cm3[soil])
SRFTEMP Temperature of soil surface litter (8C)
LL(L) Soil water content in soil layer L at lower limit of plant
extractable soil water (cm3[water]/cm3[soil])
ST(L) Soil temperature in soil layer L (8C)
NH4(L) Ammonium N in soil layer L (mg[N]/g[soil]) SW(L) Soil water content in layer L (cm3[water]/
cm3[soil])
NLAYR Actual number of soil layers SWDELTS (L) Change in soil water content due to drainage
in layer L (cm3[water]/cm3[soil])
NO3(L) Nitrate in soil layer L (mg[N]/g[soil]) WINF Water available for infiltration-rainfall plus
net irrigation minus runoff (mm/d)
(c) Plant growth module outputs (from CROPGRO Crop Template and PLANT Modules)
NSTRES Nitrogen stress factor (1�/no stress, 0�/max stress) UNO3(L) Rate of root uptake of NO3 (kg[N]/(ha d)
RLV(L) Root length density for soil layer L (cm[root]/cm3[soil]) XHLAI Healthy LAI (m2[leaf]/m2[ground])
SENCLN(I,
J)
Daily senesced plant matter. I�/0 for surface, 1 for
soil; J�/1 for C, 2 for lignin, 3 for N (g[C,N,or lignin]/
(m2 d))
XLAI LAI (m2[leaf]/m2[ground])
STGDOY(I) Day when plant stage I occurred (YYDDD)(YRDOY) YREMRG Day of emergence (YYDDD)
UNH4(L) Rate of root uptake of NH4 (kg[N]/(ha d)) YRNR8 Harvest maturity date (YYDDD)(YRDOY)
(d) SPAM outputs
EO Potential ET rate (mm/d) SWDELTX(L) Change in soil water content due to root
water uptake in layer L (cm3[water]/
cm3[soil])
EOP Potential plant transpiration rate (mm/d) TRWU Actual daily root water uptake over soil
profile (cm/d)
FDINT Light interception by leaves TRWUP Potential daily root water uptake over soil
profile (cm/d)
FLOW(L) Unsaturated soil water flow: �/�/upward, �/�/
downward (cm/d)
(e) Operations management module outputs (OPMGMT)
FERTYPE Fertilizer type for current application RESSRF Residue left on surface of soil (kg[residue]/
ha)
FERDEPTH Fertilizer incorporation depth on current day of
simulation (cm)
RESNIT N concentration of the residue for current
application (%)
J.W. Jones et al. / Europ. J. Agronomy 18 (2003) 235�/265242
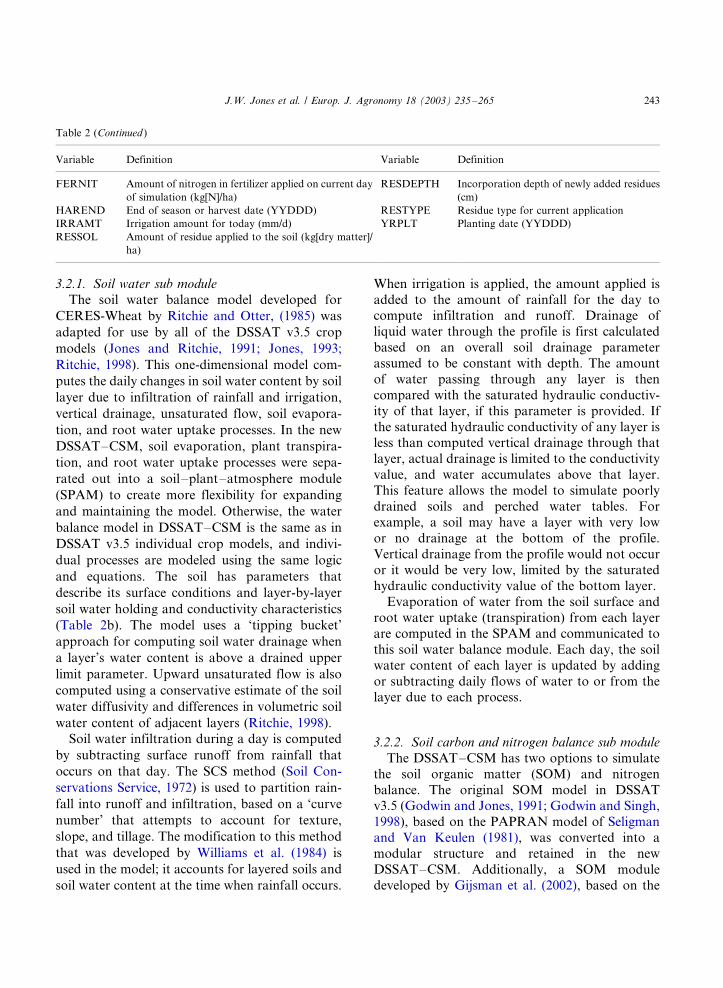
3.2.1. Soil water sub module
The soil water balance model developed for
CERES-Wheat by Ritchie and Otter, (1985) was
adapted for use by all of the DSSAT v3.5 crop
models (Jones and Ritchie, 1991; Jones, 1993;
Ritchie, 1998). This one-dimensional model com-
putes the daily changes in soil water content by soil
layer due to infiltration of rainfall and irrigation,
vertical drainage, unsaturated flow, soil evapora-
tion, and root water uptake processes. In the new
DSSAT�/CSM, soil evaporation, plant transpira-
tion, and root water uptake processes were sepa-
rated out into a soil�/plant�/atmosphere module
(SPAM) to create more flexibility for expanding
and maintaining the model. Otherwise, the water
balance model in DSSAT�/CSM is the same as in
DSSAT v3.5 individual crop models, and indivi-
dual processes are modeled using the same logic
and equations. The soil has parameters that
describe its surface conditions and layer-by-layer
soil water holding and conductivity characteristics
(Table 2b). The model uses a ‘tipping bucket’
approach for computing soil water drainage when
a layer’s water content is above a drained upper
limit parameter. Upward unsaturated flow is also
computed using a conservative estimate of the soil
water diffusivity and differences in volumetric soil
water content of adjacent layers (Ritchie, 1998).
Soil water infiltration during a day is computed
by subtracting surface runoff from rainfall that
occurs on that day. The SCS method (Soil Con-
servations Service, 1972) is used to partition rain-
fall into runoff and infiltration, based on a ‘curve
number’ that attempts to account for texture,
slope, and tillage. The modification to this method
that was developed by Williams et al. (1984) is
used in the model; it accounts for layered soils and
soil water content at the time when rainfall occurs.
When irrigation is applied, the amount applied is
added to the amount of rainfall for the day tocompute infiltration and runoff. Drainage of
liquid water through the profile is first calculated
based on an overall soil drainage parameter
assumed to be constant with depth. The amount
of water passing through any layer is then
compared with the saturated hydraulic conductiv-
ity of that layer, if this parameter is provided. If
the saturated hydraulic conductivity of any layer isless than computed vertical drainage through that
layer, actual drainage is limited to the conductivity
value, and water accumulates above that layer.
This feature allows the model to simulate poorly
drained soils and perched water tables. For
example, a soil may have a layer with very low
or no drainage at the bottom of the profile.
Vertical drainage from the profile would not occuror it would be very low, limited by the saturated
hydraulic conductivity value of the bottom layer.
Evaporation of water from the soil surface and
root water uptake (transpiration) from each layer
are computed in the SPAM and communicated to
this soil water balance module. Each day, the soil
water content of each layer is updated by adding
or subtracting daily flows of water to or from thelayer due to each process.
3.2.2. Soil carbon and nitrogen balance sub module
The DSSAT�/CSM has two options to simulate
the soil organic matter (SOM) and nitrogen
balance. The original SOM model in DSSATv3.5 (Godwin and Jones, 1991; Godwin and Singh,
1998), based on the PAPRAN model of Seligman
and Van Keulen (1981), was converted into a
modular structure and retained in the new
DSSAT�/CSM. Additionally, a SOM module
developed by Gijsman et al. (2002), based on the
Table 2 (Continued )
Variable Definition Variable Definition
FERNIT Amount of nitrogen in fertilizer applied on current day
of simulation (kg[N]/ha)
RESDEPTH Incorporation depth of newly added residues
(cm)
HAREND End of season or harvest date (YYDDD) RESTYPE Residue type for current application
IRRAMT Irrigation amount for today (mm/d) YRPLT Planting date (YYDDD)
RESSOL Amount of residue applied to the soil (kg[dry matter]/
ha)
J.W. Jones et al. / Europ. J. Agronomy 18 (2003) 235�/265 243
CENTURY model (Parton et al., 1988, 1994), isincluded. This CENTURY-based module was
added to facilitate simulation of soil organic
sequestration potential for different crop rotations
over long time periods after initializing soil C and
other variables only once at the start of the
simulation. The main differences are that the
CENTURY-based module (i) divides the SOM in
more fractions, each of which has a variable C:Nratio and can mineralize or immobilize nutrients,
(ii) it has a residue layer on top of the soil, and (iii)
the decomposition rate is texture dependent. In
both SOM modules, organic matter decomposi-
tion depends on soil temperature and water
content. Because of the widespread use of the
CENTURY model and interest in its use in CSMs,
we focus on this component in this section. Thisversion is more appropriate for use in low input
agricultural systems, for example those that use
green manure where the surface layer is crucial.
Gijsman et al. (2002) showed that this new
component greatly improved the accuracy of
simulating the long-term changes in soil carbon
in the Rothamsted bare fallow experiment.
The CENTURY-based module distinguishesthree types of SOM: (1) easily decomposable
(microbial) SOM1, (2) recalcitrant SOM2, which
contains lignin and cell walls, and (3) an almost
inert SOM3. At initialization of the simulation, the
fractional ratio of these three pools is set, with
SOM1 of only about 2% of total SOM, while
SOM2 and SOM3 vary with the management
history of the soil (grassland or cultivated) andthe degree of depletion. The improved SOM
module also allows one to perform more realistic
simulations on carbon sequestration, i.e. the build
up of soil organic C under different management
systems.
Most of the interface input variables to the soil
carbon and nitrogen balance modules are soil
properties and variables computed in the soilwater and soil temperature sub modules. Trans-
port of N through the soil to deeper layers is based
on water flux values obtained from the soil water
module. The only interface variable from the Plant
module is the array of plant mass being senesced
and abscised onto the soil surface daily. The
output variables sent to other modules are ammo-
nium and nitrate nitrogen in each soil layer (Table2b).
3.2.3. Soil temperature sub module
The soil temperature model currently in the
DSSAT�/CSM was originally derived from the
EPIC model (Williams et al., 1984; Jones et al.,
1991) and is the same as the one in the CERES and
CROPGRO models in DSSAT v3.5. Soil tempera-ture is computed from air temperature and a deep
soil temperature boundary condition that is calcu-
lated from the average annual air temperature and
the amplitude of monthly mean temperatures. It
also includes a simple approach to calculate the
impact of solar radiation and albedo on the soil
surface temperature. However, it does not consider
differences in soil wetness or surface conditions.Soil temperature is used to modify plant processes
(emergence) and SOM decomposition. Additional
details on this component are in Jones and Kiniry
(1986) in the description of the CERES-Maize
model.
3.3. Soil�/plant�/atmosphere module
This module computes daily soil evaporationand plant transpiration. The current version was
originally developed by Ritchie (1972) and was
used in all of the DSSAT v3.5 crop models as part
of the soil water balance. This module brings
together soil, plant and atmosphere inputs and
computes light interception by the canopy, poten-
tial evapotranspiration (ET) as well as actual soil
evaporation and plant transpiration (Table 2d). Italso computes the root water uptake of each soil
layer. The daily weather values as well as all soil
properties and current soil water content, by layer,
are required as input. In addition, leaf area index
(LAI) and root length density for each layer are
needed.
The module first computes daily net solar
radiation, taking into account the combined soiland plant canopy albedo. It calculates potential
ET using one of two current options. The default
Priestley and Taylor (1972) method requires only
daily solar radiation and temperature, and was
described in detail by Ritchie (1972), Ritchie and
Otter, (1985) and Jones and Ritchie (1991). The
J.W. Jones et al. / Europ. J. Agronomy 18 (2003) 235�/265244
Penman-FAO (Doorenbos and Pruitt, 1977)method for computing potential ET can optionally
be used to better account for arid or windy
conditions, but weather data files must include
wind and humidity data. We have also created
options for using the Penman�/Monteith (Mon-
teith, 1986) method for daily potential ET calcula-
tions and for using hourly energy balance
(unpublished).The potential ET is partitioned into potential
soil evaporation based on the fraction of solar
energy reaching the soil surface, based on a
negative exponential function of LAI, and poten-
tial plant transpiration. Actual soil evaporation is
based on a two-stage process (Ritchie, 1972). After
the soil surface is first wetted due to either rainfall
or irrigation, evaporation occurs at the potentialrate until a cumulative soil evaporation amount
since wetting is reached. Then, a soil-limiting daily
soil evaporation amount is computed as a square
root function of time since stage one ended. Actual
soil evaporation is the minimum of the potential
and soil-limiting calculations on a daily basis. If
evaporation is less than potential soil evaporation,
this difference is added back to potential planttranspiration to account for the increased heat
load on the canopy when the soil surface is dry
(Ritchie, 1972).
To determine whether the soil or atmosphere
limits plant transpiration, potential root water
uptake is computed by calculating a maximum
water flow to roots in each layer and summing
these values (Ritchie and Otter, 1985; Ritchie,1998; Jones and Ritchie, 1991). These calculations
account for root length density in each layer and
the soil water content in the layer. The equation
that computes potential root water uptake in each
layer is an approximation to the radial flow
equation, where assumptions are made about soil
texture effect on hydraulic conductivity, root
diameter, and a maximum water potential differ-ence between roots and the soil. The actual plant
transpiration is then computed as the minimum of
potential plant transpiration and the potential root
water uptake. Thus, the atmosphere can limit
transpiration by low solar radiation and cool
temperatures, the canopy can limit it by low
LAI, and the soil can limit it by low soil water
content, low root length density, and their dis-tributions relative to each other.
This method for computing ET has provided an
excellent functional approach for determining
water stress in the plant without explicitly model-
ing water status in the plant component. The ratio
of actual ET to potential ET, if less than 1.0,
indicates that stomatal conductance would have
had to be decreased sometimes during the day toprevent plant desiccation. This ratio is typically
used in the Plant modules to reduce photosynth-
esis in proportion to relative decreases in tran-
spiration. Similarly, a ratio of potential root water
uptake and potential transpiration is used to
reduce plant turgor and expansive growth of
crops. The rationale for this is that as soil water
becomes more limiting, turgor pressure in leaveswould decrease and affect leaf expansion before
photosynthesis is reduced. In the current Plant
modules this ratio is set to 1.5.
3.4. Template crop module (CROPGRO)
The CROPGRO Crop Template module in
DSSAT�/CSM is the same as that described byBoote et al. (1998a), although its components were
modified to fit the modular structure. The inter-
face variables linking this module (and the Plant
module where CERES and other individual crops
are modeled) to other modules are defined in
Table 2c. CROPGRO was created after our earlier
experience in adapting SOYGRO to PNUTGRO
and BEANGRO (Hoogenboom et al., 1994b)suggested to us the value of having one common
program with values from files providing informa-
tion for each species to be modeled. CROPGRO
was then developed as a generic approach for
modeling crops in the sense that it has one
common source code, yet it can predict the growth
of a number of different crops. Currently, it
simulates ten crops; including seven grain legumes(soybean (Glycine max L. Merr.); peanut (Arachis
hypogaea L.); dry bean (Phaseolus vulgaris L.);
chickpea; cowpea; velvet bean and faba bean
(Vicia faba L.)), and non-legumes such as tomato
(Lycopersicon esculentum Mill.) (Scholberg et al.,
1997; Boote et al., 1998a,b). This versatility is
J.W. Jones et al. / Europ. J. Agronomy 18 (2003) 235�/265 245
achieved through input files that define species
traits.
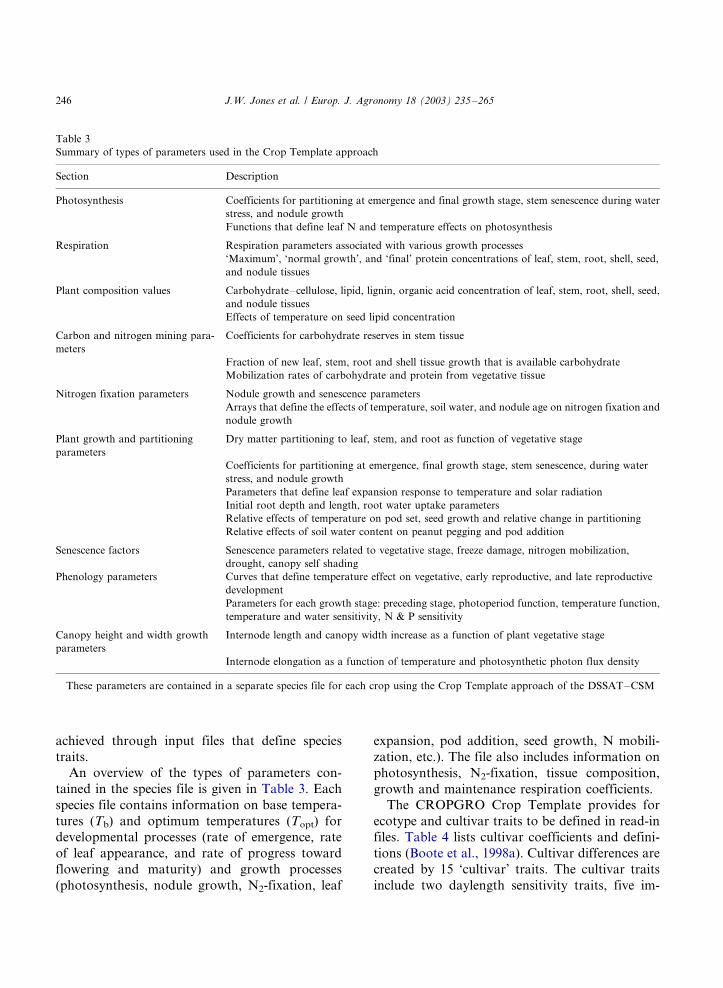
An overview of the types of parameters con-
tained in the species file is given in Table 3. Each
species file contains information on base tempera-
tures (Tb) and optimum temperatures (Topt) for
developmental processes (rate of emergence, rate
of leaf appearance, and rate of progress toward
flowering and maturity) and growth processes
(photosynthesis, nodule growth, N2-fixation, leaf
expansion, pod addition, seed growth, N mobili-
zation, etc.). The file also includes information on
photosynthesis, N2-fixation, tissue composition,
growth and maintenance respiration coefficients.
The CROPGRO Crop Template provides for
ecotype and cultivar traits to be defined in read-in
files. Table 4 lists cultivar coefficients and defini-
tions (Boote et al., 1998a). Cultivar differences are
created by 15 ‘cultivar’ traits. The cultivar traits
include two daylength sensitivity traits, five im-
Table 3
Summary of types of parameters used in the Crop Template approach
Section Description
Photosynthesis Coefficients for partitioning at emergence and final growth stage, stem senescence during water
stress, and nodule growth
Functions that define leaf N and temperature effects on photosynthesis
Respiration Respiration parameters associated with various growth processes
‘Maximum’, ‘normal growth’, and ‘final’ protein concentrations of leaf, stem, root, shell, seed,
and nodule tissues
Plant composition values Carbohydrate�/cellulose, lipid, lignin, organic acid concentration of leaf, stem, root, shell, seed,
and nodule tissues
Effects of temperature on seed lipid concentration
Carbon and nitrogen mining para-
meters
Coefficients for carbohydrate reserves in stem tissue
Fraction of new leaf, stem, root and shell tissue growth that is available carbohydrate
Mobilization rates of carbohydrate and protein from vegetative tissue
Nitrogen fixation parameters Nodule growth and senescence parameters
Arrays that define the effects of temperature, soil water, and nodule age on nitrogen fixation and
nodule growth
Plant growth and partitioning
parameters
Dry matter partitioning to leaf, stem, and root as function of vegetative stage
Coefficients for partitioning at emergence, final growth stage, stem senescence, during water
stress, and nodule growth
Parameters that define leaf expansion response to temperature and solar radiation
Initial root depth and length, root water uptake parameters
Relative effects of temperature on pod set, seed growth and relative change in partitioning
Relative effects of soil water content on peanut pegging and pod addition
Senescence factors Senescence parameters related to vegetative stage, freeze damage, nitrogen mobilization,
drought, canopy self shading
Phenology parameters Curves that define temperature effect on vegetative, early reproductive, and late reproductive
development
Parameters for each growth stage: preceding stage, photoperiod function, temperature function,
temperature and water sensitivity, N & P sensitivity
Canopy height and width growth
parameters
Internode length and canopy width increase as a function of plant vegetative stage
Internode elongation as a function of temperature and photosynthetic photon flux density
These parameters are contained in a separate species file for each crop using the Crop Template approach of the DSSAT�/CSM
J.W. Jones et al. / Europ. J. Agronomy 18 (2003) 235�/265246
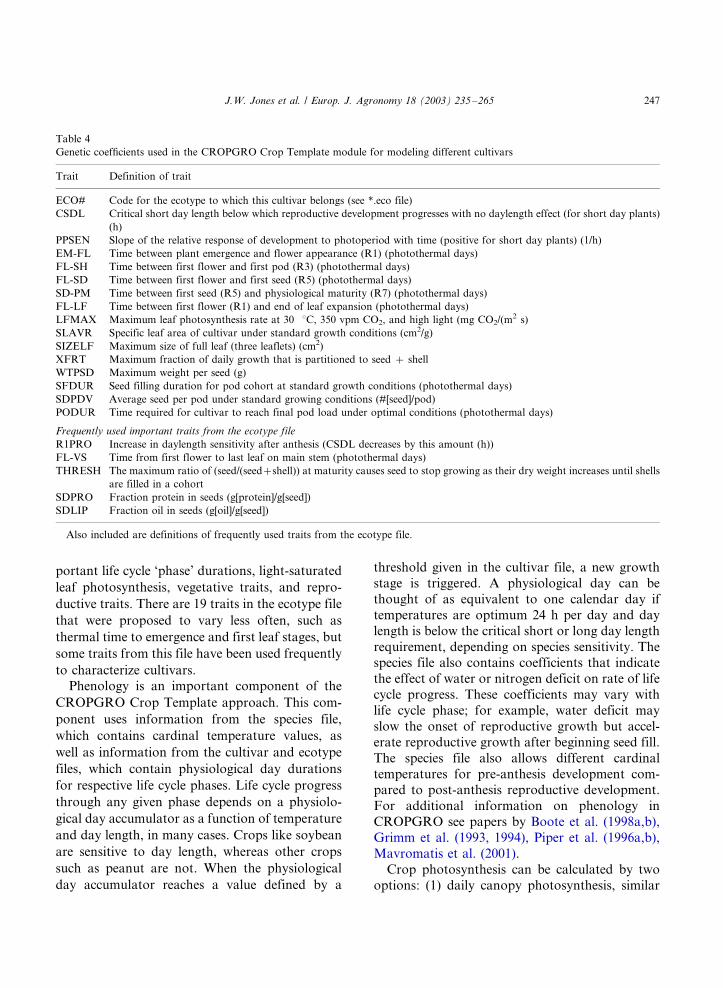
portant life cycle ‘phase’ durations, light-saturated
leaf photosynthesis, vegetative traits, and repro-
ductive traits. There are 19 traits in the ecotype file
that were proposed to vary less often, such as
thermal time to emergence and first leaf stages, but
some traits from this file have been used frequently
to characterize cultivars.Phenology is an important component of the
CROPGRO Crop Template approach. This com-
ponent uses information from the species file,
which contains cardinal temperature values, as
well as information from the cultivar and ecotype
files, which contain physiological day durations
for respective life cycle phases. Life cycle progress
through any given phase depends on a physiolo-
gical day accumulator as a function of temperature
and day length, in many cases. Crops like soybean
are sensitive to day length, whereas other crops
such as peanut are not. When the physiological
day accumulator reaches a value defined by a
threshold given in the cultivar file, a new growth
stage is triggered. A physiological day can be
thought of as equivalent to one calendar day if
temperatures are optimum 24 h per day and day
length is below the critical short or long day length
requirement, depending on species sensitivity. Thespecies file also contains coefficients that indicate
the effect of water or nitrogen deficit on rate of life
cycle progress. These coefficients may vary with
life cycle phase; for example, water deficit may
slow the onset of reproductive growth but accel-
erate reproductive growth after beginning seed fill.
The species file also allows different cardinal
temperatures for pre-anthesis development com-pared to post-anthesis reproductive development.
For additional information on phenology in
CROPGRO see papers by Boote et al. (1998a,b),
Grimm et al. (1993, 1994), Piper et al. (1996a,b),
Mavromatis et al. (2001).
Crop photosynthesis can be calculated by two
options: (1) daily canopy photosynthesis, similar
Table 4
Genetic coefficients used in the CROPGRO Crop Template module for modeling different cultivars
Trait Definition of trait
ECO# Code for the ecotype to which this cultivar belongs (see �.eco file)
CSDL Critical short day length below which reproductive development progresses with no daylength effect (for short day plants)
(h)
PPSEN Slope of the relative response of development to photoperiod with time (positive for short day plants) (1/h)
EM-FL Time between plant emergence and flower appearance (R1) (photothermal days)
FL-SH Time between first flower and first pod (R3) (photothermal days)
FL-SD Time between first flower and first seed (R5) (photothermal days)
SD-PM Time between first seed (R5) and physiological maturity (R7) (photothermal days)
FL-LF Time between first flower (R1) and end of leaf expansion (photothermal days)
LFMAX Maximum leaf photosynthesis rate at 30 8C, 350 vpm CO2, and high light (mg CO2/(m2 s)
SLAVR Specific leaf area of cultivar under standard growth conditions (cm2/g)
SIZELF Maximum size of full leaf (three leaflets) (cm2)
XFRT Maximum fraction of daily growth that is partitioned to seed �/ shell
WTPSD Maximum weight per seed (g)
SFDUR Seed filling duration for pod cohort at standard growth conditions (photothermal days)
SDPDV Average seed per pod under standard growing conditions (#[seed]/pod)
PODUR Time required for cultivar to reach final pod load under optimal conditions (photothermal days)
Frequently used important traits from the ecotype file
R1PRO Increase in daylength sensitivity after anthesis (CSDL decreases by this amount (h))
FL-VS Time from first flower to last leaf on main stem (photothermal days)
THRESH The maximum ratio of (seed/(seed�/shell)) at maturity causes seed to stop growing as their dry weight increases until shells
are filled in a cohort
SDPRO Fraction protein in seeds (g[protein]/g[seed])
SDLIP Fraction oil in seeds (g[oil]/g[seed])
Also included are definitions of frequently used traits from the ecotype file.
J.W. Jones et al. / Europ. J. Agronomy 18 (2003) 235�/265 247
to radiation use efficiency models, or (2) hourlyhedgerow light interception and leaf-level photo-
synthesis. The daily canopy photosynthesis option,
modified from the method used in SOYGRO V5.4
(Jones et al., 1989), predicts daily gross photo-
synthesis as a function of daily irradiance for a full
canopy, which is then multiplied by factors 0�/1 for
light interception, temperature, leaf nitrogen sta-
tus, and water deficit. There are additional adjust-ments for CO2 concentration, specific leaf weight,
row spacing, and cultivar. The hourly hedgerow
photosynthesis light interception approach is de-
scribed by Boote and Pickering (1994). On an
hourly time step during each day, interception and
absorption of direct and diffuse light components
are computed based upon canopy height and
width, LAI, leaf angle, row direction, latitude,day of year, and time of day (Boote and Pickering,
1994). Photosynthesis of sunlit and shaded leaves
is computed hourly using the asymptotic exponen-
tial response equation, where quantum efficiency
and light-saturated photosynthesis rate variables
are dependent on CO2 and temperature (Boote
and Pickering, 1994). Hourly canopy photosynth-
esis on a land area basis is computed from the sumof sunlit and shaded leaf contributions by multi-
plying sunlit and shaded leaf photosynthetic rates
by their respective LAIs. The hourly time loop is
handled completely by the subroutine that uses
this approach; gross photosynthesis is integrated
hourly to provide a daily total value for use by
other subroutines in the CROPGRO module.
Growth of new tissues depends on daily avail-able carbohydrate, partitioning to different tissues,
and respiration costs of tissue synthesis. During
vegetative growth, the model follows a partition-
ing pattern dependent on vegetative growth stage,
but modified by water deficit and nitrogen defi-
ciency. Partitioning coefficients for leaf, stem, and
root are defined in the species Crop Template file.
Beginning at flowering, cohorts of flowers, pods,and seeds are added daily. These cohorts have an
explicit assimilate demand per day depending on
genetic potential and temperature. Reproductive
tissues have first priority for assimilate over
vegetative tissues, up to a maximum reproductive
partitioning factor. This factor may be less than
1.0 for indeterminate plants (such as peanut and
tomato) and 1.0 for determinate plants, indicatingthat reproductive tissue eventually can utilize
100% of the assimilate. Leaf area expansion
depends on leaf weight growth and specific leaf
area, where the latter depends on temperature,
light, and water deficit. Leaf expansion during
reproductive growth is terminated by decrease of
assimilate allocated to leaf growth and by reaching
a phase that terminates leaf expansion. Duringseed fill, nitrogen is mobilized from vegetative
tissues. As a result photosynthesis declines and leaf
abscission increases. Protein and carbohydrate
mobilized from vegetative tissue contribute to
seed growth while photosynthesis declines.
Growth respiration and conversion efficiency
follow the approach of Penning de Vries and van
Laar (1982) where the glucose cost for respirationand for condensation are computed as a function
of the composition of each tissue. The species file
contains the glucose cost to synthesize protein,
lipid, lignin, organic acid, cellulose-carbohydrate,
and mineral fractions as well as the approximate
composition of each tissue. Maintenance respira-
tion depends on temperature as well as gross
photosynthesis and total crop mass minus proteinand oil in the seed. Maintenance respiration is
subtracted from gross daily photosynthesis to give
available carbohydrates for new tissue growth.
Details on these relationships and sources of data
used in their development have been published by
various authors (Wilkerson et al., 1983; Boote et
al., 1986; Jones et al., 1989; Boote and Pickering,
1994; Boote et al., 1997, 1998a,b, 2002).
3.5. Individual crop module interface (plant
module)
The individual crop module interface serves the
same function as the CROPGRO Crop Template
module in that it has the same interface variables
(Table 2), linking plant growth dynamics to the
other modules in the DSSAT�/CSM. However, it isdesigned to link modules that describe growth,
development and yield for individual crops. This
module links in, for example, the CERES models
from DSSAT v3.5 after modifications were made
to fit the modular structure. We have implemented
several of the individual models from DSSAT v3.5
J.W. Jones et al. / Europ. J. Agronomy 18 (2003) 235�/265248
(maize, wheat, sorghum, millet, barley, and rice) as
well as potato (Hoogenboom et al., 1999; Ritchie
et al., 1998; Singh et al., 1998), and we are
converting others. One could add additional crops
by adhering to the modular structure and provid-
ing the interface variables defined in Table 2. Here,
we summarize how crop growth is computed forthree crops (maize, wheat, and barley).
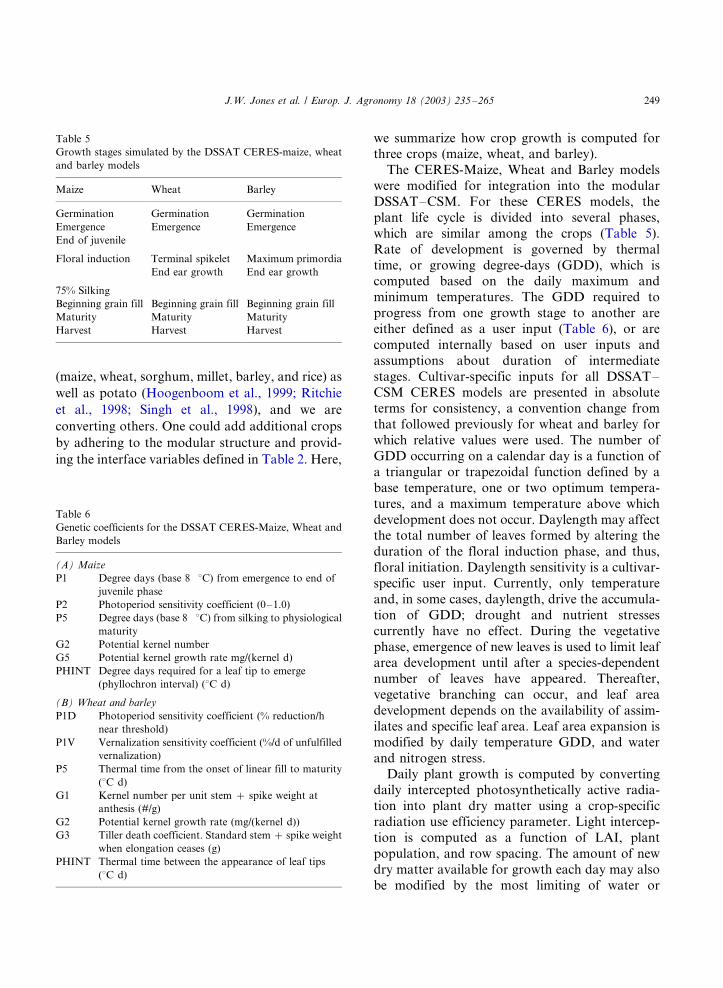
The CERES-Maize, Wheat and Barley models
were modified for integration into the modular
DSSAT�/CSM. For these CERES models, the
plant life cycle is divided into several phases,
which are similar among the crops (Table 5).
Rate of development is governed by thermal
time, or growing degree-days (GDD), which iscomputed based on the daily maximum and
minimum temperatures. The GDD required to
progress from one growth stage to another are
either defined as a user input (Table 6), or are
computed internally based on user inputs and
assumptions about duration of intermediate
stages. Cultivar-specific inputs for all DSSAT�/
CSM CERES models are presented in absoluteterms for consistency, a convention change from
that followed previously for wheat and barley for
which relative values were used. The number of
GDD occurring on a calendar day is a function of
a triangular or trapezoidal function defined by a
base temperature, one or two optimum tempera-
tures, and a maximum temperature above which
development does not occur. Daylength may affectthe total number of leaves formed by altering the
duration of the floral induction phase, and thus,
floral initiation. Daylength sensitivity is a cultivar-
specific user input. Currently, only temperature
and, in some cases, daylength, drive the accumula-
tion of GDD; drought and nutrient stresses
currently have no effect. During the vegetative
phase, emergence of new leaves is used to limit leafarea development until after a species-dependent
number of leaves have appeared. Thereafter,
vegetative branching can occur, and leaf area
development depends on the availability of assim-
ilates and specific leaf area. Leaf area expansion is
modified by daily temperature GDD, and water
and nitrogen stress.
Daily plant growth is computed by convertingdaily intercepted photosynthetically active radia-
tion into plant dry matter using a crop-specific
radiation use efficiency parameter. Light intercep-
tion is computed as a function of LAI, plant
population, and row spacing. The amount of new
dry matter available for growth each day may also
be modified by the most limiting of water or
Table 5
Growth stages simulated by the DSSAT CERES-maize, wheat
and barley models
Maize Wheat Barley
Germination Germination Germination
Emergence Emergence Emergence
End of juvenile
Floral induction Terminal spikelet Maximum primordia
End ear growth End ear growth
75% Silking
Beginning grain fill Beginning grain fill Beginning grain fill
Maturity Maturity Maturity
Harvest Harvest Harvest
Table 6
Genetic coefficients for the DSSAT CERES-Maize, Wheat and
Barley models
(A) Maize
P1 Degree days (base 8 8C) from emergence to end of
juvenile phase
P2 Photoperiod sensitivity coefficient (0�/1.0)
P5 Degree days (base 8 8C) from silking to physiological
maturity
G2 Potential kernel number
G5 Potential kernel growth rate mg/(kernel d)
PHINT Degree days required for a leaf tip to emerge
(phyllochron interval) (8C d)
(B) Wheat and barley
P1D Photoperiod sensitivity coefficient (% reduction/h
near threshold)
P1V Vernalization sensitivity coefficient (%/d of unfulfilled
vernalization)
P5 Thermal time from the onset of linear fill to maturity
(8C d)
G1 Kernel number per unit stem �/ spike weight at
anthesis (#/g)
G2 Potential kernel growth rate (mg/(kernel d))
G3 Tiller death coefficient. Standard stem �/ spike weight
when elongation ceases (g)
PHINT Thermal time between the appearance of leaf tips
(8C d)
J.W. Jones et al. / Europ. J. Agronomy 18 (2003) 235�/265 249
nitrogen stress, and temperature, and is sensitiveto atmospheric CO2 concentration. Above ground
biomass has priority for carbohydrate, and at the
end of each day, carbohydrate not used for above
ground biomass is allocated to roots. Roots must
receive, however, a specified stage-dependent mini-
mum of the daily carbohydrate available for
growth. Leaf area is converted into new leaf weight
using empirical functions.Kernel numbers per plant are computed during
flowering based on the cultivar’s genetic potential,
canopy weight, average rate of carbohydrate
accumulation during flowering, and temperature,
water and nitrogen stresses. Potential kernel num-
ber is a user-defined input for specific cultivars.
Once the beginning of grain fill is reached, the
model computes daily grain growth rate based ona user-specified cultivar input (Table 6) defined as
the potential kernel growth rate (mg/(kernel d)).
Daily growth rate is modified by temperature and
assimilate availability. If the daily pool of carbon
is insufficient to allow growth at the potential rate,
a fraction of carbon can be remobilized from the
vegetative to reproductive sinks each day. Kernels
are allowed to grow until physiological maturity isreached. If the plant runs out of resources,
however, growth is terminated prior to physiolo-
gical maturity. Likewise, if the grain growth rate is
reduced below a threshold value for several days,
growth is also terminated. Readers are referred to
other papers for additional details on these
CERES models ((Jones and Kiniry, 1986; Ritchie
and Otter, 1985; Ritchie et al., 1998).
3.6. Management module
The management module determines when field
operations are performed by calling sub modules.
Currently, these operations are planting, harvest-
ing, applying inorganic fertilizer, irrigating and
applying crop residue and organic material. These
operations can be specified by users in thestandard ‘experiment’ input file (Hunt et al.,
2001). Users specify whether any or all of the
operations are to be automatic or fixed based on
input dates or days from planting. Conditions that
cause automatic planting within the interval of
time are soil water content averaged over a
specified depth (i.e. 30 cm) and soil temperatureat a specified depth to be between specified limits.
Harvesting can occur on given dates, when the
crop is mature, or when soil water conditions in
the field are favorable for machine operation.
Irrigation can be applied on specific dates with
specified irrigation amount or can be controlled by
the plant available water. If plant available water
drops below a specified fraction of water holdingcapacity in an irrigation management depth, an
irrigation event is triggered. The irrigation amount
applied can be either a fixed amount or it can refill
the profile to the management depth. Similarly,
fertilizer can be applied on fixed dates in specified
amounts, or the applications can optionally be
controlled by plant needs for nitrogen via the
nitrogen stress variable from the Plant module.Crop residue and organic fertilizer, such as man-
ure, is applied either at the start of simulation,
after harvesting the crop or on fixed dates similar
to inorganic fertilizer applications. These manage-
ment options allow users a great deal of flexibility
for simulating experiments that were conducted in
the past for model evaluation and improvement
and for simulating optional management systemsfor different applications. The management file
also provides scope to define multiple crops and
management strategies for crop rotations and
sequencing.
3.7. Pest module
The Pest module was developed for the CROP-
GRO models by Batchelor et al. (1993), followingthe approach described by Boote et al. (1983,
1993). It allows users to input field observations
and scouting data on insect populations or damage
to different plant parts, disease severity on differ-
ent plant tissues, and physical damage to plants or
plant components to simulate the effects of
specified pest and diseases on growth and yield.
Feedbacks on plant growth processes are throughleaf area reduction, assimilate loss, loss of leaves,
fruit, stems, or roots, and inactivation of the
photosynthetic capacity of leaves (Boote et al.,
1983). This feature has been used successfully for
soybean, peanut, and tomato in the past (e.g.
Boote et al., 1983, 1993; Batchelor et al., 1993),
J.W. Jones et al. / Europ. J. Agronomy 18 (2003) 235�/265250
and now this capability is accessible to all crops
modeled in the DSSAT�/CSM.
4. Data requirements
The DSSAT models require the minimum data
set for model operation. The contents of such a
dataset have been defined based on efforts by
workers in IBSNAT and ICASA (Jones et al.,
1994; Hunt and Boote, 1998; Hunt et al., 2001),
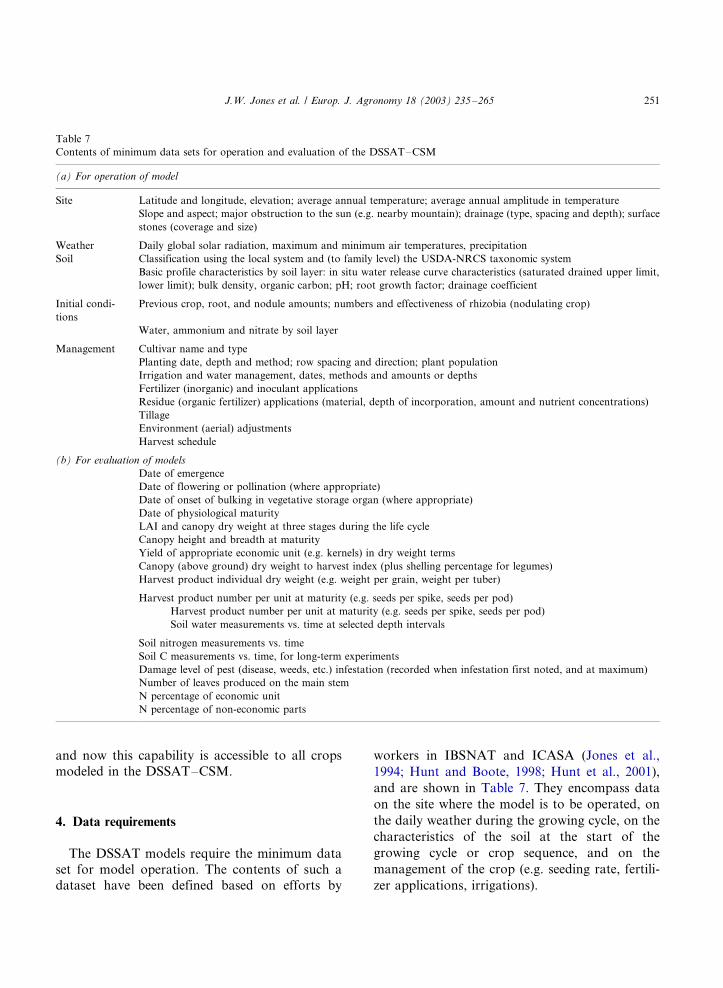
and are shown in Table 7. They encompass data
on the site where the model is to be operated, on
the daily weather during the growing cycle, on the
characteristics of the soil at the start of the
growing cycle or crop sequence, and on the
management of the crop (e.g. seeding rate, fertili-
zer applications, irrigations).
Table 7
Contents of minimum data sets for operation and evaluation of the DSSAT�/CSM
(a) For operation of model
Site Latitude and longitude, elevation; average annual temperature; average annual amplitude in temperature
Slope and aspect; major obstruction to the sun (e.g. nearby mountain); drainage (type, spacing and depth); surface
stones (coverage and size)
Weather Daily global solar radiation, maximum and minimum air temperatures, precipitation
Soil Classification using the local system and (to family level) the USDA-NRCS taxonomic system
Basic profile characteristics by soil layer: in situ water release curve characteristics (saturated drained upper limit,
lower limit); bulk density, organic carbon; pH; root growth factor; drainage coefficient
Initial condi-
tions
Previous crop, root, and nodule amounts; numbers and effectiveness of rhizobia (nodulating crop)
Water, ammonium and nitrate by soil layer
Management Cultivar name and type
Planting date, depth and method; row spacing and direction; plant population
Irrigation and water management, dates, methods and amounts or depths
Fertilizer (inorganic) and inoculant applications
Residue (organic fertilizer) applications (material, depth of incorporation, amount and nutrient concentrations)
Tillage
Environment (aerial) adjustments
Harvest schedule
(b) For evaluation of models
Date of emergence
Date of flowering or pollination (where appropriate)
Date of onset of bulking in vegetative storage organ (where appropriate)
Date of physiological maturity
LAI and canopy dry weight at three stages during the life cycle
Canopy height and breadth at maturity
Yield of appropriate economic unit (e.g. kernels) in dry weight terms
Canopy (above ground) dry weight to harvest index (plus shelling percentage for legumes)
Harvest product individual dry weight (e.g. weight per grain, weight per tuber)
Harvest product number per unit at maturity (e.g. seeds per spike, seeds per pod)
Harvest product number per unit at maturity (e.g. seeds per spike, seeds per pod)
Soil water measurements vs. time at selected depth intervals
Soil nitrogen measurements vs. time
Soil C measurements vs. time, for long-term experiments
Damage level of pest (disease, weeds, etc.) infestation (recorded when infestation first noted, and at maximum)
Number of leaves produced on the main stem
N percentage of economic unit
N percentage of non-economic parts
J.W. Jones et al. / Europ. J. Agronomy 18 (2003) 235�/265 251
Required weather data (Table 7a) encompassdaily records of total solar radiation incident on
the top of the crop canopy, maximum and mini-
mum air temperature above the crop, and rainfall.
However, it is recognized that all required weather
data for a particular site and a particular time
period are often not available. In such cases, the
integrity of the minimum data set is maintained by
calculating surrogate values or using data fromnearby sites. To calculate surrogate values, statis-
tics of the climate at a particular site are necessary
and may thus be required.
The DSSAT�/CSM requires information on the
water holding characteristics of different soil
layers. It needs a root weighting factor that
accommodates the impact of several adverse soil
factors on root growth in different soil layers, suchas soil pH, soil impedance, and salinity. Additional
soil parameters are needed for computing surface
runoff, evaporation from the soil surface, and
drainage (Ritchie, 1972). Initial values of soil
water, nitrate and ammonium are needed as well
as an estimate of the above- and below-ground
residues from the previous crop. All aspects of
crop management including modifications to theenvironment (e.g. photoperiod extension) as im-
posed in some crop physiology studies, are needed.
Typical crop management factors include planting
date, planting depth, row spacing, plant popula-
tion, fertilization, irrigation and inoculation. Plant
bed configuration and bund height is also neces-
sary for some crops. The DSSAT�/CSM also
requires coefficients for the genotypes involved(Hunt, 1993; Ritchie, 1993), as described earlier
with examples in Tables 4 and 6.
5. Software implementation, distribution policy
The DSSAT�/CSM is a new implementation of
the individual crop models contained in DSSAT
v3.5. Its first release was in June 2002 where it wasused in a course on application of CSMs at the
University of Florida. Thus, although this version
of the DSSAT models has not achieved wide-
spread distribution yet, it is the latest release of the
widely used DSSAT suite of crop models in a
much more integrated format that was designed in
part for better capabilities for simulating croppingsystems. At the time of publication, this DSSAT�/
CSM was available from the same source as
DSSAT v3.5, as described below.
For over 5 years, DSSAT v3.5 DSSAT (Tsuji et
al., 1994; Hoogenboom et al., 1999) has been
distributed through the International Consortium
for Agricultural Systems Applications (ICASA)
for a small fee; order forms are at the ICASA website (www.ICASAnet.org). ICASA supports an
open code policy and encourages collaborating
scientists to evaluate and improve the source code.
Source code of the cropping systems models is
available upon request for registered users of
DSSAT. ICASA also maintains a list server to
exchange information between users and devel-
opers of DSSAT. Currently there are more than325 members of this list server. Information on
how to subscribe to the DSSAT list server and
archives of frequently asked questions can also be
found at the ICASA web site. Technical support is
provided by the individual developers of the CSM
and is normally conducted via electronic mail.
ICASA considers DSSAT to be an open platform
and encourages active participation by the users’community to help with the improvement and
advancement of its various models, modules, tools
and application programs.
6. Model evaluation and testing
Evaluation involves comparison of model out-
puts with real data and a determination ofsuitability for an intended purpose. It is useful to
think of model evaluation as a documentation of
its accuracy for specific predictions in specified
environments, with appropriate consideration gi-
ven to possible errors in input variables or
evaluation data. Essential parts of any minimum
data set for evaluation are: (1) a complete record
of the information required to run the model(Table 7a), and (2) field information on the
aspect(s) for which the model is being validated
(Table 7b). The data sets should not have been
used previously for calibration and should repre-
sent the complete array of environments and crop
sequences for which the model will be applied. In
J.W. Jones et al. / Europ. J. Agronomy 18 (2003) 235�/265252
the past, it has often been difficult to obtainenough data sets for effective evaluation, and to
this end the DSSAT community has endeavoured
to assemble a collection of datasets that can be
used on an ongoing basis for model evaluation.
Testing over diverse regions is valuable to expose
models to new and different environments and test
model robustness as Piper et al. (1998) did.
DSSAT model developers and other scientistshave tested the models against various single
factors, such as water, nitrogen, cultivar or plant-
ing date choice, and temperature. Since the
DSSAT�/CSM has just been released, we describe
here evaluation of the crop models as they existed
in the previous versions of DSSAT, the most
recent being DSSAT v3.5. This is appropriate
since component models in DSSAT�/CSM arethe same as those in DSSAT v3.5, reprogrammed
and integrated together. The only new addition
was the incorporation of the CENTURY module
to facilitate more accurate cropping system analy-
sis (Gijsman et al., 2002). Testing of these models
has occurred at the level of processes, in terms of
seasonal dynamics of leaf area, crop biomass, or
ET over time, or in terms of final yield variablessuch as total biomass or grain yield. Statements of
adequacy of model prediction include calculation
of standard errors, root mean square error, and
slope and intercept of regression of observed vs.
predicted variables. Additionally, many studies
have evaluated model performance, particularly
yield, relative to observations from farmers’ fields
or other tests of cropping systems where manyfactors may vary (e.g. Boote et al., 1989). This
latter approach was used in the international study
of climate change impacts on agriculture described
by Rosenzweig et al. (1995). In that study,
researchers first evaluated model performance
using data from cropping systems currently used
in their respective countries, then used the models
to assess the potential impacts of climate changeon their cropping systems using different climate
scenarios. Many of the studies referenced in Table
8 evaluated the models for the applications shown.
Recent examples of model evaluation for two
crops (corn and soybean) demonstrate the use of
different model evaluation approaches for differ-
ent purposes. Braga (2000) evaluated the ability of
the CERES-Maize model to accurately describethe spatial variability in maize yields over 2 years
for use in precision agriculture research and
decision support. He precisely measured soil water
holding parameters in 40 locations in a farmer’s
field in Michigan, including initial conditions at
planting during each of 2 years. Fig. 3 shows a
comparison of simulated vs. observed maize yields
for the 40 locations over 2 years, showing that themodel reproduced observed grain yields for these
conditions when accurate soil, weather and culti-
var information was available. Mavromatis et al.
(2002) demonstrated the value of using routinely
collected data from yield trials for both estimating
cultivar characteristics and for evaluation. They
used yield trial data from Georgia and North
Carolina to show the robustness of the CROP-GRO-Soybean model predictions across regions.
They first used the yield trial data from Georgia to
estimate cultivar coefficients for a number of
cultivars, then used coefficients estimated from
North Carolina yield trial data to predict the
performance of the same cultivars in Georgia
(Fig. 4). Results in Fig. 4(b) demonstrate the
ability of the CROPGRO-Soybean model inDSSAT to predict soybean yields in environments
different from those used to estimate the coeffi-
cients; on average simulated yields were within
2.5% of mean observed yields at each location.
Another important issue in model testing in-
volves evaluation of simulations under different
conditions as models undergo modifications dur-
ing maintenance or enhancements. Modificationsto some scientific relationships in a model may
cause unexpected responses or bugs in the code
that may go unnoticed unless a rigorous testing
procedure is carried out. During the creation of
the DSSAT�/CSM, modifications to the original
CERES and CROPGRO code were required, so
software was developed to automatically compare
simulated results from the new modular modelswith those obtained from the latest released
versions in DSSAT v3.5 (C. Porter, unpublished).
This software invokes two versions of models for
the same crop (e.g. soybean) as changes are made
to make sure that results are the same or to
understand the reasons for changes that occur as
a result of modifications. A standard set of real
J.W. Jones et al. / Europ. J. Agronomy 18 (2003) 235�/265 253
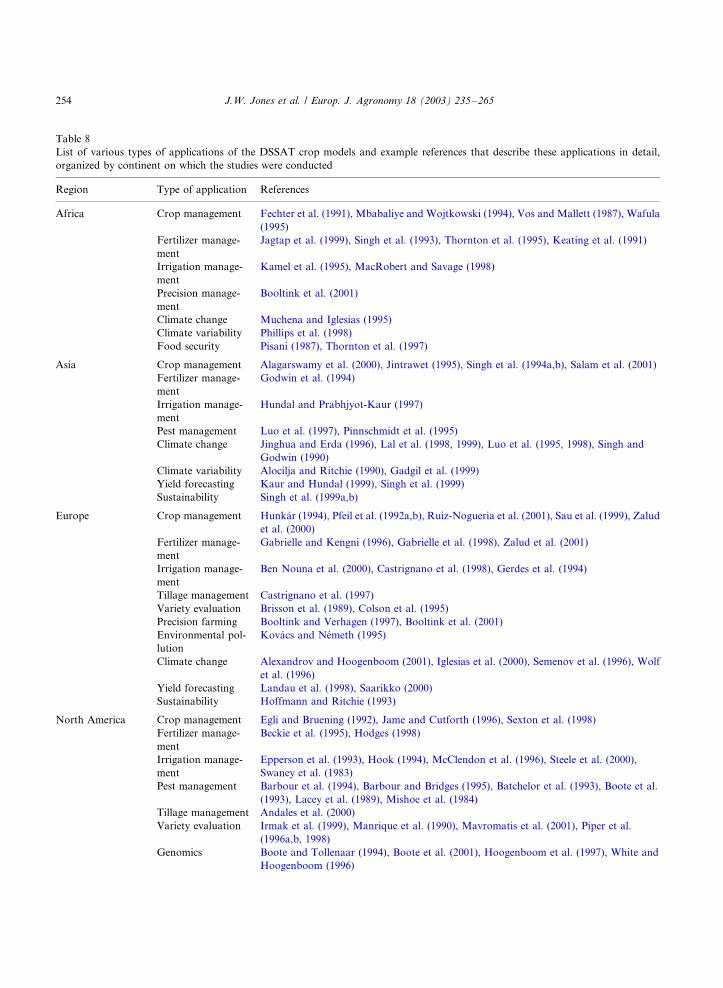
Table 8
List of various types of applications of the DSSAT crop models and example references that describe these applications in detail,
organized by continent on which the studies were conducted
Region Type of application References
Africa Crop management Fechter et al. (1991), Mbabaliye and Wojtkowski (1994), Vos and Mallett (1987), Wafula
(1995)
Fertilizer manage-
ment
Jagtap et al. (1999), Singh et al. (1993), Thornton et al. (1995), Keating et al. (1991)
Irrigation manage-
ment
Kamel et al. (1995), MacRobert and Savage (1998)
Precision manage-
ment
Booltink et al. (2001)
Climate change Muchena and Iglesias (1995)
Climate variability Phillips et al. (1998)
Food security Pisani (1987), Thornton et al. (1997)
Asia Crop management Alagarswamy et al. (2000), Jintrawet (1995), Singh et al. (1994a,b), Salam et al. (2001)
Fertilizer manage-
ment
Godwin et al. (1994)
Irrigation manage-
ment
Hundal and Prabhjyot-Kaur (1997)
Pest management Luo et al. (1997), Pinnschmidt et al. (1995)
Climate change Jinghua and Erda (1996), Lal et al. (1998, 1999), Luo et al. (1995, 1998), Singh and
Godwin (1990)
Climate variability Alocilja and Ritchie (1990), Gadgil et al. (1999)
Yield forecasting Kaur and Hundal (1999), Singh et al. (1999)
Sustainability Singh et al. (1999a,b)
Europe Crop management Hunkar (1994), Pfeil et al. (1992a,b), Ruiz-Nogueria et al. (2001), Sau et al. (1999), Zalud
et al. (2000)
Fertilizer manage-
ment
Gabrielle and Kengni (1996), Gabrielle et al. (1998), Zalud et al. (2001)
Irrigation manage-
ment
Ben Nouna et al. (2000), Castrignano et al. (1998), Gerdes et al. (1994)
Tillage management Castrignano et al. (1997)
Variety evaluation Brisson et al. (1989), Colson et al. (1995)
Precision farming Booltink and Verhagen (1997), Booltink et al. (2001)
Environmental pol-
lution
Kovacs and Nemeth (1995)
Climate change Alexandrov and Hoogenboom (2001), Iglesias et al. (2000), Semenov et al. (1996), Wolf
et al. (1996)
Yield forecasting Landau et al. (1998), Saarikko (2000)
Sustainability Hoffmann and Ritchie (1993)
North America Crop management Egli and Bruening (1992), Jame and Cutforth (1996), Sexton et al. (1998)
Fertilizer manage-
ment
Beckie et al. (1995), Hodges (1998)
Irrigation manage-
ment
Epperson et al. (1993), Hook (1994), McClendon et al. (1996), Steele et al. (2000),
Swaney et al. (1983)
Pest management Barbour et al. (1994), Barbour and Bridges (1995), Batchelor et al. (1993), Boote et al.
(1993), Lacey et al. (1989), Mishoe et al. (1984)
Tillage management Andales et al. (2000)
Variety evaluation Irmak et al. (1999), Manrique et al. (1990), Mavromatis et al. (2001), Piper et al.
(1996a,b, 1998)
Genomics Boote and Tollenaar (1994), Boote et al. (2001), Hoogenboom et al. (1997), White and
Hoogenboom (1996)
J.W. Jones et al. / Europ. J. Agronomy 18 (2003) 235�/265254
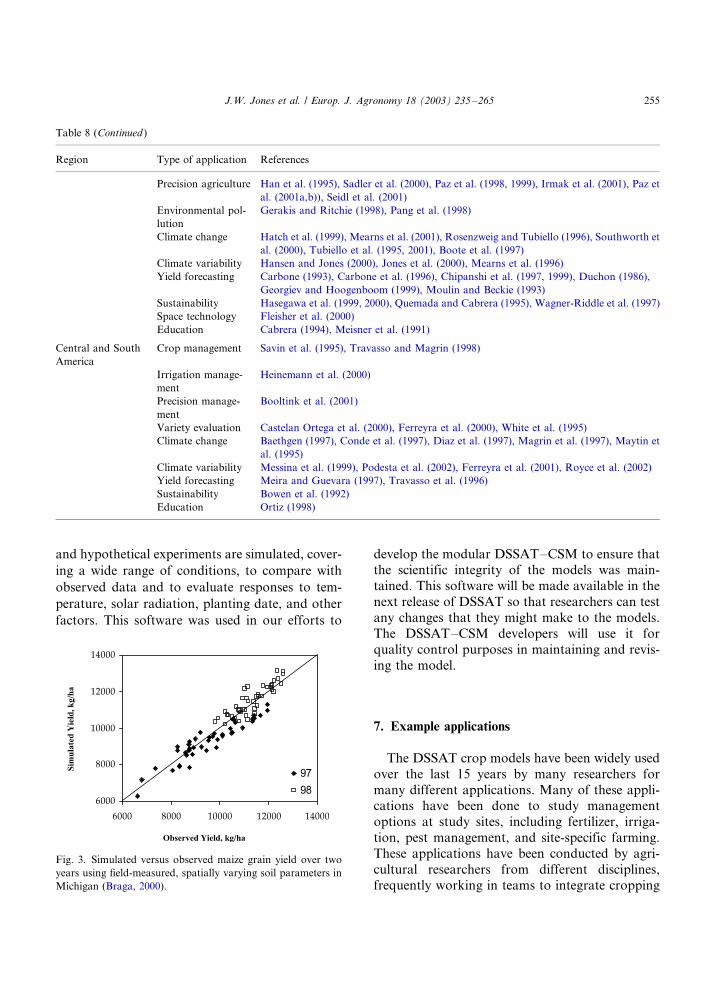
and hypothetical experiments are simulated, cover-
ing a wide range of conditions, to compare with
observed data and to evaluate responses to tem-
perature, solar radiation, planting date, and other
factors. This software was used in our efforts to
develop the modular DSSAT�/CSM to ensure thatthe scientific integrity of the models was main-
tained. This software will be made available in the
next release of DSSAT so that researchers can test
any changes that they might make to the models.
The DSSAT�/CSM developers will use it for
quality control purposes in maintaining and revis-
ing the model.
7. Example applications
The DSSAT crop models have been widely used
over the last 15 years by many researchers for
many different applications. Many of these appli-cations have been done to study management
options at study sites, including fertilizer, irriga-
tion, pest management, and site-specific farming.
These applications have been conducted by agri-
cultural researchers from different disciplines,
frequently working in teams to integrate cropping
Table 8 (Continued )
Region Type of application References
Precision agriculture Han et al. (1995), Sadler et al. (2000), Paz et al. (1998, 1999), Irmak et al. (2001), Paz et
al. (2001a,b)), Seidl et al. (2001)
Environmental pol-
lution
Gerakis and Ritchie (1998), Pang et al. (1998)
Climate change Hatch et al. (1999), Mearns et al. (2001), Rosenzweig and Tubiello (1996), Southworth et
al. (2000), Tubiello et al. (1995, 2001), Boote et al. (1997)
Climate variability Hansen and Jones (2000), Jones et al. (2000), Mearns et al. (1996)
Yield forecasting Carbone (1993), Carbone et al. (1996), Chipanshi et al. (1997, 1999), Duchon (1986),
Georgiev and Hoogenboom (1999), Moulin and Beckie (1993)
Sustainability Hasegawa et al. (1999, 2000), Quemada and Cabrera (1995), Wagner-Riddle et al. (1997)
Space technology Fleisher et al. (2000)
Education Cabrera (1994), Meisner et al. (1991)
Central and South
America
Crop management Savin et al. (1995), Travasso and Magrin (1998)
Irrigation manage-
ment
Heinemann et al. (2000)
Precision manage-
ment
Booltink et al. (2001)
Variety evaluation Castelan Ortega et al. (2000), Ferreyra et al. (2000), White et al. (1995)
Climate change Baethgen (1997), Conde et al. (1997), Diaz et al. (1997), Magrin et al. (1997), Maytin et
al. (1995)
Climate variability Messina et al. (1999), Podesta et al. (2002), Ferreyra et al. (2001), Royce et al. (2002)
Yield forecasting Meira and Guevara (1997), Travasso et al. (1996)
Sustainability Bowen et al. (1992)
Education Ortiz (1998)
Fig. 3. Simulated versus observed maize grain yield over two
years using field-measured, spatially varying soil parameters in
Michigan (Braga, 2000).
J.W. Jones et al. / Europ. J. Agronomy 18 (2003) 235�/265 255
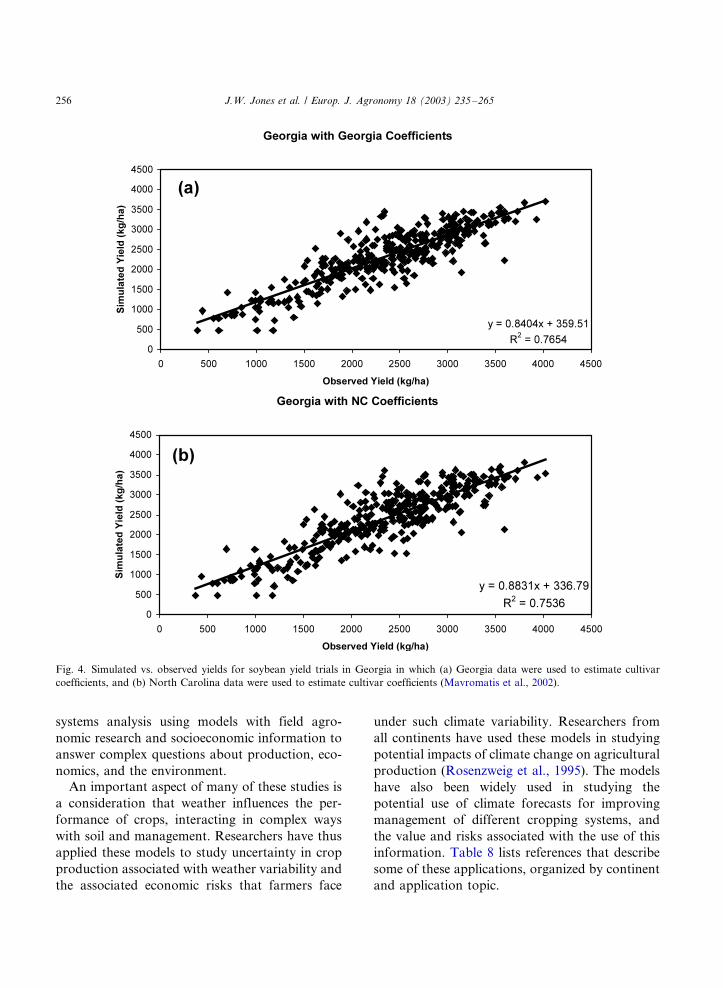
systems analysis using models with field agro-
nomic research and socioeconomic information to
answer complex questions about production, eco-
nomics, and the environment.
An important aspect of many of these studies is
a consideration that weather influences the per-
formance of crops, interacting in complex ways
with soil and management. Researchers have thus
applied these models to study uncertainty in crop
production associated with weather variability and
the associated economic risks that farmers face
under such climate variability. Researchers from
all continents have used these models in studying
potential impacts of climate change on agricultural
production (Rosenzweig et al., 1995). The models
have also been widely used in studying the
potential use of climate forecasts for improving
management of different cropping systems, and
the value and risks associated with the use of this
information. Table 8 lists references that describe
some of these applications, organized by continent
and application topic.
Fig. 4. Simulated vs. observed yields for soybean yield trials in Georgia in which (a) Georgia data were used to estimate cultivar
coefficients, and (b) North Carolina data were used to estimate cultivar coefficients (Mavromatis et al., 2002).
J.W. Jones et al. / Europ. J. Agronomy 18 (2003) 235�/265256
In addition to research applications, the DSSATand its crop models have been used in teaching,
both in continuing education courses and in
formal university courses at graduate and under-
graduate levels (Tsuji et al., 1998). There also have
been attempts to use these models in advising
farmers (through extension services and the pri-
vate sector). In one application, described by
Welch et al. (2002), an agricultural company hasimplemented versions of three of the DSSAT v3.5
models in a comprehensive farmer support soft-
ware package that is being used by private
consultants. This software package, called
PCYield, includes CROPGRO-Soybean, CERES-
Maize and CERES-Wheat models. PCYield is
available to clients of the company via the Internet
along with daily weather data for specific farmlocations. It has a very simple user interface to
allow private crop consultants to operate them for
any of their farmer clients (http://www.mPower3.-
com).
The applications referred to in Table 8 provide a
broad overview of the many studies that have used
the DSSAT and its crop models. These were
conducted before the new modular DSSAT�/
CSM was developed. Thus, many of these applica-
tions have focused on single crops instead of
cropping systems. Since the DSSAT�/CSM simu-
lates crop and soil processes the same as DSSAT
v3.5 (except for the new CENTURY-based soil C
and N module), the current version has the same
scientific capabilities that were used in most of
these previous studies. However, the new DSSAT�/
CSM opens the way for more effective research on
cropping systems (Gijsman et al., 2002), and it
opens the way for more effective scientific im-
provements than ever before due to overcoming
many hurdles imposed by the structure of previous
versions.
8. Closing the loop between development andapplication
As shown in the previous section, researchers
have been applying DSSAT crop models for many
purposes. However, as more experience has been
gained by the scientific community in using these
models, the demands have increased beyond thosethat motivated many of these studies. In many
past studies, researchers accepted the crop and soil
models in DSSAT as they were, but many studies
showed that improvements were needed in various
parts of the models. In some cases, researchers
modified the code to create their own versions of
crop models, but such efforts were complicated by
the design of the models themselves and by thelack of adequate documentation in some cases.
The re-design of the DSSAT�/CSM was under-
taken to help overcome some of these problems as
well as to facilitate an efficient evolution for
broader and more advanced applications in the
future. Although the DSSAT�/CSM is new, re-
searchers are already adding new modules for pest
dynamics (J. Koo, personal communication),models for new crops (O. Daza, personal commu-
nication). We expect that the modular structure,
open code, testing software, the documentation,
and instructions for modifying or adding modules
and embedding DSSAT�/CSM into other software
will help close the gap between development and
research applications. This includes the use of
CSMs for policy; our experience indicates thatresearchers will be part of the process of cropping
system applications for informing policy makers.
A more difficult issue is, however, the gap that
exists between CSMs and their applications for
decision support at a farm level. There are
scientific and technical reasons for this gap.
Many CSMs currently do not include factors
that may limit growth and yield of crops grownunder field conditions, such as different pests or
other soil constraints. Gaining an understanding
of these factors, how they interact with environ-
ment and management, and expanding model
capabilities to include them is a challenge for
agricultural scientists (Boote et al., 1996). Even if
all of these factors were included in models, there
would still be enormous difficulties in providingdata inputs necessary to simulate these factors and
their effects on crop production at a site. Our own
experience with PCYield (Welch et al., 2002)
indicated that crop consultants will use CSMs if
they add value to the services that consultants
provide to farmers, are easy to use, inexpensive in
terms of dollar and time costs, and have ready
J.W. Jones et al. / Europ. J. Agronomy 18 (2003) 235�/265 257
access to farm-specific and industry-specific infor-mation. Although some progress was made to
overcome some impediments, such as access to
daily weather data for specific farms (Welch et al.,
2002) and software for calculating genetic coeffi-
cients using yield trial data (Mavromatis et al.,
2001, 2002) others still exist. Technically, the
major impediments are access to accurate site-
specific soil and management information as wellas high quality software that addresses relevant
issues and appropriately embeds CSMs. However,
the use of CSMs in software for decision support
may be more constrained by social factors
(McCown, 2001). Overcoming these constraints
are likely to require consistent social interactions
between advisors who use models and people to
whom they give advice.Looking ahead, we envision many applications
in which the DSSAT�/CSM will be integrated with
other models and information for many research
purposes. We are already developing special dri-
vers for integrating the CSM with GIS for
diagnosing causes of yield variability in precision
agriculture fields (Paz et al., 2001a; Irmak et al.,
2001) and for prescribing variable management(Paz et al., 2001b) and for linking with other
models, such as for water quality and mixed crop-
livestock farming system analysis. The DSSAT�/
CSM will continue to evolve as these new applica-
tions are developed and as we learn how to
effectively incorporate other factors for more
comprehensive agricultural systems analyses.
References
Alagarswamy, G., Singh, P., Hoogenboom, G., Wani, S.P.,
Pathak, P., Virmani, S.M., 2000. Evaluation and applica-
tion of the CROPGRO-Soybean simulation model in vertic
inceptisol. Agricultural Systems 63, 19�/32.
Alexandrov, V.A., Hoogenboom, G., 2001. The impact of
climate variability and change on crop yield in Bulgaria.
Agricultural and Forest Meteorology 104, 315�/327.
Alocilja, E.C., Ritchie, J.T., 1990. The application of SIMOP-
T2:RICE to evaluate profit and yield-risk in upland-rice
production. Agricultural Systems 33, 315�/326.
Andales, A.A., Batchelor, W.D., Anderson, C.E., Farnham,
D.E., Whigham, D.K., 2000. Incorporating tillage effects
into soybean model. Agricultural Systems 66, 69�/98.
Baethgen, W.E., 1997. Vulnerability of the agricultural sector of
Latin America to climate change. Climate Research 9, 1�/7.
Barbour, J.C., Bridges, D.C., 1995. A model of competition for
light between peanut (Arachis hypogaea ) and broadleaf
weeds. Weed Science 43 (2), 247�/257.
Barbour, J.C., Bridges, D.C., Nesmith, D.S., 1994. Peanut
acclimation to simulated shading by weeds. Agronomy
Journal 86 (5), 874�/880.
Batchelor, W.D., Jones, J.W., Boote, K.J., Pinnschmidt, H.O.,
1993. Extending the use of crop models to study pest
damage. Transactions of the ASAE 36 (2), 551�/558.
Beckie, H.J., Moulin, A.P., Campbell, C.A., Brandt, S.A., 1995.
Testing effectiveness of four simulation models for estimat-
ing nitrates and water in two soils. Canadian Journal of Soil
Sciences 75, 135�/143.
Ben Nouna, B., Katerji, N., Mastrorilli, M., 2000. Using the
CERES-Maize model in a semi-arid Mediterranean envir-
onment. Evaluationof model performance. European Jour-
nal of Agronomy 13 (4), 309�/322.
Booltink, H.W.G., Verhagen, J., 1997. Using decision support
systems to optimize barley management on spatial variable
soil. In: Kropff, M., et al. (Eds.), Applications of Systems
Approaches at the Field Level, vol. 2. Kluwer Academic
Publishers, Dordrecht, Netherlands, pp. 219�/233.
Booltink, H.W.G., van Alphen, B.J., Batchelor, W.D., Paz,
J.O., Stoorvogel, J.J., Vargas, R., 2001. Tools for optimiz-
ing management of spatially-variable fields. Agricultural
Systems 70, 445�/476.
Boote, K.J., Batchelor, W.D., Jones, J.W., Pinnschmidt, H.,
Bourgeois, G., 1993. Pest damage relations at the field level.
In: Penning de Vries, F.W.T., et al. (Eds.), Systems
Approaches for Agricultural Development. Kluwer Aca-
demic Publishers, Dordrecht, The Netherlands.
Boote, K.J., Bennett, J.M., Jones, J.W., Jowers, H.E., 1989.
On-farm testing of peanut and soybean models in Florida.
ASAE P No. 89-4040. Am. Soc. Agr. Engr. (ASAE), St.
Joseph, MI, pp. 54.
Boote, K.J., Jones, J.W., Hoogenboom, G., 1998a. Simulation
of crop growth: CROPGRO model. In: Peart, R.M., Curry,
R.B. (Eds.), Agricultural Systems Modeling and Simulation
(Chapter 18). Marcel Dekker, Inc, New York, pp. 651�/692.
Boote, K.J., Jones, J.W., Hoogenboom, G., Pickering, N.B.,
1998b. The CROPGRO model for grain legumes. In: Tsuji,
G.Y., Hoogenboom, G., Thornton, P.K. (Eds.), Under-
standing Options for Agricultural Production. Kluwer
Academic Publishers, Dordrecht, pp. 99�/128.
Boote, K.J., Jones, J.W., Pickering, N.B., 1996. Potential uses
and limitations of crop models. Agronomie Journal 88,
704�/716.
Boote, K.J., Mınguez, M.I., Sau, F., 2002. Adapting the
CROPGRO-legume model to simulate growth of faba
bean. Agronomy Journal 94, 743�/756.
Boote, K.J., Pickering, N.B., 1994. Modeling photosynthesis of
row crop canopies. HortScience 29, 1423�/1434.
Boote, K.J., Kropff, M.J., Bindraban, P.S., 2001. Physiology
and modeling of traits in crop plants: implications for
genetic improvement. Agricultural Systems 70, 395�/420.
J.W. Jones et al. / Europ. J. Agronomy 18 (2003) 235�/265258
Boote, K.J., Jones, J.W., Mishoe, J.W., Berger, R.D., 1983.
Coupling pests to crop growth simulators to predict yield
reductions. Phytopathology 73 (11), 1581�/1587.
Boote, K.J., Jones, J.W., Mishoe, J.W., Wilkerson, G.G., 1986.
Modeling growth and yield of groundnut. Agrometeorology
of Groundnut: Proceedings of an International Symposium,
ICRISAT Sahelian Center, Niamey, Niger. 21�/26 Aug,
1985, ICRISAT, Patancheru, A.P. 502 324, India, pp. 243�/
254.
Boote, K.J., Pickering, N.B., Allen, L.H., Jr., 1997. Plant
modeling: advances and gaps in our capability to project
future crop growth and yield in response to global climate
change. In: Allen, L.H., Jr., Kirkham, M.B., Olszyk, D.M.,
Whitman, C.E. (Eds.), Advances in Carbon Dioxide Effects
Research (Special Publication No. 61). ASA-CSSA-SSSA,
Madison, WI, pp. 179�/228.
Boote, K.J., Tollenaar, M., 1994. Modeling genetic yield
potential. In: Boote, K.J., Bennett, J.M., Sinclair, T.R.,
Paulsen, G.M. (Eds.), Physiology and Determination of
Crop Yield. ASA-CSSA-SSSA, Madison, WI, pp. 533�/565.
Bowen, W.T., Jones, J.W., Thornton P.K., 1992. Crop simula-
tion as a potential tool for evaluating sustainable land
management. Utilization of Soil Survey Information for
Sustainable Land Use Proceedings: 11�/24 July.
Braga, R., 2000. Predicting the spatial pattern of grain yield
under water limiting conditions. PhD Dissertation, Agri-
cultural and Biological Engineering Department, University
of Florida, Gainesville, FL, pp. 176.
Brisson, N., Bona, S., Bouniols, A., 1989. A soybean crop
simulation model: validation and adaptation to varieties
cultivated in southern Europe. Agronomie 9, 27�/36.
Cabrera, M.L., 1994. N-show: an educational computer pro-
gram that displays dynamic graphs of nitrogen in soil.
Journal of Natural Resources and Life Scince Education 23
(1), 43�/45.
Carbone, G.J., 1993. Considerations of meteorological time-
series in estimating regional-scale crop yield. Journal of
Climate 6 (8), 1607�/1615.
Carbone, G.J., Narumalani, S., King, M., 1996. Application of
remote sensing and GIS technologies with physiological
crop models. American Society for Photogrammetry and
Remote Sensing 62 (2), 171�/179.
Castrignano, A., Colucci, R., Degiorgio, D., Rizzo, V., Stelluti,
M., 1997. Tillage effects on plant extractable soil�/water in a
silty clay vertisol in southern Italy. Soil and Tillage
Research 40 (3�/4), 227�/237.
Castrignano, A., Katerji, N., Karam, F., Mastrorilli, M.,
Hamdy, A., 1998. A modified version of CERES-Maize
model for predicting crop response to salinity stress.
Ecological Modelling 111 (2�/3), 107�/120.
Castelan Ortega, O.A., Fawcett, R.H., Arriaga Jordan, C.M.,
Smith, A.J., 2000. Evaluation of the CERES-Maize model
in simulating Campesino farmer yields in the highlands of
central Mexico. Experimental Agriculture 36 (4), 479�/500.
Chipanshi, A.C., Ripley, E.A., Lawford, R.G., 1997. Early
prediction of spring wheat yields in Saskatchewan from
current and historical weather data using the CERES-wheat
model. Agricultural and Forest Meteorology 84 (3�/4), 223�/
232.
Chipanshi, A.C., Ripley, E.A., Lawford, R.G., 1999. Large-
scale simulation of wheat yields in a semi-arid environment
using a crop-growth model. Agricultural Systems 59 (1),
57�/66.
Colson, J., Bouniols, A., Jones, J.W., 1995. Soybean reproduc-
tive development: adapting a model for European cultivars.
Agronomy Journal 87, 1129�/1139.
Conde, C., Liverman, D., Flores, M., Ferrer, R., Araujo, R.,
Betancourt, E., Villarreal, G., Gay, C., 1997. Vulnerability
of rainfed maize crops in Mexico to climate change. Climate
Research 9, 17�/23.
Diaz, R.A., Magrin, G.O., Travasso, M.I., Rodriguez, R.O.,
1997. Climate change and its impact on the properties of
agricultural soils in the Argentinean rolling pampas. Cli-
mate Research 9, 25�/30.
Doorenbos, J., Pruitt, W.D., 1977. Guidelines for predicting
crop water requirements. Food and Agriculture Organiza-
tion of the United Nations, Rome. Irrigation and Drainage
Paper No. 24.
Duchon, C.E., 1986. Corn yield prediction using climatology.
Journal of Climate and Applied Meteorology 25 (5), 581�/
590.
Egli, D.B., Bruening, W., 1992. Planting date and soybean
yield: evaluation of environmental effects with a crop
simulation model: SOYGRO. Agricultural and Forest
Meteorology 62 (1�/2), 19�/29.
Epperson, J.E., Hook, J.E., Mustafa, Y.R., 1993. Dynamic
programming for improving irrigation scheduling strategies
of maize. Agricultural Systems 42, 85�/101.
Fechter, J., Allison, B.E., Sivakumar, M.V.K., van der Ploeg,
R.R., Bley, J., 1991. An evaluation of the SWATRER and
CERES-Millet models for southwest Niger. In: Sivakumar,
M.V.K., Wallace, J.S., Renard, C., Giroux, C. (Eds.), Soil
Water Balance in the Sudano-Sahhelian Zone. International
Association of Hydrological Sciences, Wallingford, pp.
505�/513.
Ferreyra, R.A., Pachepsky, L.B., Collino, D., Acock, B., 2000.
Modeling peanut leaf gas exchange for the calibration of
crop models for different cultivars. Ecological Modelling
131 (2�/3), 285�/298.
Ferreyra, R.A., Podesta, G.P., Messina, C.D., Letson, D.,
Dardanelli, J., Guevera, E., Meira, S., 2001. A linked-
modeling framework to estimate maize production risk
associated with ENSO-related climate variability in Argen-
tina. Agricultural and Forest Meteorology 107, 177�/192.
Fleisher, D.H., Cavazzoni, J., Giacomelli, G.A., Ting K.C.,
2000. Adaption of SUBTOR for hydroponic, controlled
environment white potato production. ASAE Paper 00-
4089. American Society of Agricultural Engineers, St.
Joseph, MI.
Gabrielle, B., Kengni, L., 1996. Analysis and field-evaluation of
the CERES models’ soil components: nitrogen transfer and
transformations. Soil Science Society of American Journal
60, 142�/149.
J.W. Jones et al. / Europ. J. Agronomy 18 (2003) 235�/265 259
Gabrielle, B., Denoroy, P., Gosse, G., Justes, E., Andersen,
M.N., 1998. Development and evaluation of a CERES-type
model for winter oilseed rape. Field Crops Research 57 (1),
95�/111.
Gadgil, S., Seshagiri Rao, P.R., Sridhar, S., 1999. Modelling
impact of climate variability on rainfed groundnut. Current
Science 76, 557�/569.
Geng, S., Penning de Vries, F.W.T., Supit, I., 1986. A simple
method for generating daily rainfall data. Agricultural and
Forest Meteorology 36, 363�/376.
Geng, S., Auburn, J., Brandstetter, E., Li, B., 1988. A program
to simulate meteorological variables. Documentation for
SIMMETEO. Agronomy Report No. 204. University of
California, Davis Crop Extension, Davis, CA.
Georgiev, G.A., Hoogenboom, G., 1999. Near real-time
agricultural simulations on the web. Simulation 73 (1),
22�/28.
Gerakis, A., Ritchie, J.T., 1998. Simulation of atrazine leaching
in relation to water-table management using the CERES
model. Journal of Environmental Management 52, 241�/
258.
Gerdes, G., Allison, B.E., Pereira, L.S., 1994. Overestimation of
soybean crop transpiration by sap flow measurements under
field conditions in central Portugal. Irrigation Science 14 (3),
135�/139.
Giraldo, L.M., Lizcano, L.J., Gijsman, A.J., Rivera, B.,
Franco, L.H., 1998. Adaptation of the DSSAT model for
simulation of Brachiaria decumbens production. Pasturas
Tropicales 20, 2�/12.
Gijsman, A.J., Hoogenboom, G., Parton, W.J., Kerridge, P.C.,
2002. Modifying DSSAT for low-input agricultural systems,
using a soil organic matter*/residue module from CEN-
TURY. Agronomy Journal 94 (3), 462�/474.
Godwin, D.C., Jones, C.A., 1991. Nitrogen dynamics in soil�/
plant systems. In: Hanks, J., Ritchie, J.T. (Eds.), Modeling
Plant and Soil Systems (Agronomy monograph no. 31).
ASA, CSSA, and SSSA, Madison, WI, pp. 287�/321.
Godwin, D.C., Singh, U., 1998. Nitrogen balance and crop
response to nitrogen in upland and lowland cropping
systems. In: Tsuji, G.Y., Hoogenboom, G., Thornton,
P.K. (Eds.), Understanding Options for Agricultural Pro-
duction. System Approaches for Sustainable Agricultural
Development. Kluwer Academic Publishers, Dordrecht,
Netherlands, pp. 55�/77.
Godwin, D.C., Meyer, W.S., Singh, U., 1994. Simulation of the
effect of chilling injury and nitrogen supply on floret fertility
and yield in rice. Australian Journal Experimental Agricul-
tural 34, 921�/926.
Grimm, S.S., Jones, J.W., Boote, K.J., Herzog, D.C., 1994.
Modeling the occurrence of reproductive stages after flower-
ing for four soybean cultivars. Agronomy Journal 86, 31�/
38.
Grimm, S.S., Jones, J.W., Boote, K.J., Hesketh, J.D., 1993.
Parameter estimation for predicting flowering date of
soybean cultivars. Crop Scince 33, 137�/144.
Han, S., Evans, R.G., Hodges, T., Rawlins, S.L., 1995. Linking
a geographic information system with a potato simulation
model for site-specific crop management. Journal of En-
vironmental Quality 24, 772�/777.
Hansen, J.W., Jones, J.W., 2000. Scaling-up crop models for
climate variability applications. Agricultural Systems 65,
43�/72.
Hartkamp, A.D., Hoogenboom, G., White, J.W., 2002. Adap-
tation of the CROPGRO growth model to velvet bean as a
green manure cover crop: I. Model development. Field
Crops Research 78 (1), 9�/25.
Hasegawa, H., Bryant, D.C., Denison, R.F., 2000. Testing
CERES model predictions of crop growth and N dynamics,
in cropping systems with leguminous green manures in a
Mediterranean climate. Field Crops Research 67 (3), 239�/
255.
Hasegawa, H., Labavitch, J.M., McGuire, A.M., Bryant, D.C.,
Denison, R.F., 1999. Testing CERES model predictions of
N release from legume cover crop residue. Field Crops
Research 63, 255�/267.
Hatch, U., Jagtap, S., Jones, J., Lamb, M., 1999. Potential
effects of climate change on agricultural, water use in the
southeast US. Journal of the American Water Resources
Association 35, 1551�/1561.
Heinemann, A.B., Hoogenboom, G., Georgiev, G.A., de Faria,
R.T., Frizzone, J.A., 2000. Center pivot irrigation manage-
ment optimization of dry beans in humid areas. Transac-
tions of the ASAE 43 (6), 1507�/1516.
Hoffmann, F., Ritchie, J.T., 1993. Model for slurry and manure
in CERES and similar models. Journal Agronomy and Crop
Science 170, 330�/340.
Hodges, T., 1998. Water and nitrogen applications for potato:
commercial and experimental rates compared to a simula-
tion model. Journal of Sustainable Agriculture 13, 79�/90.
Hoogenboom, G., Wilkens, P.W., Thornton, P.K., Jones, J.W.,
Hunt, L.A., Imamura, D.T., 1999. Decision support system
for agrotechnology transfer v3.5. In: Hoogenboom, G.,
Wilkens, P.W., Tsuji, G.Y. (Eds.), DSSAT version 3, vol. 4
(ISBN 1-886684-04-9). University of Hawaii, Honolulu, HI,
pp. 1�/36.
Hoogenboom, G., White, J.W., Acosta-Gallegos, J., Gaudiel,
R.G., Myers, J.R., Silbernagel, M.J., 1997. Evaluation of a
crop simulation model that incorporates gene action.
Agronomy Journal 89 (4), 613�/620.
Hoogenboom, G., Jones, J.W., Wilkens, P.W., Batchelor,
W.D., Bowen, W.T., Hunt, L.A., Pickering, N.B., Singh,
U., Godwin, D.C., Baer, B., Boote, K.J., Ritchie, J.T.,
White, J.W., 1994a. Crop models. In: Tsuji, G.Y., Uehara,
G., Balas, S. (Eds.), DSSAT Version 3, vol. 2. University of
Hawaii, Honolulu, HI, pp. 95�/244.
Hoogenboom, G., White, J.W., Jones, J.W., Boote, K.J.,
1994b. BEANGRO: A process-oriented dry bean model
with a versatile user interface. Agronomy Journal 86, 182�/
190.
Hook, J.E., 1994. Using crop models to plan water withdrawals
for irrigation in drought years. Agricultural Systems 45,
271�/289.
Hundal, S.S., Prabhjyot-Kaur, 1997. Application of the
CERES-Wheat model to yield predictions in the irrigated
J.W. Jones et al. / Europ. J. Agronomy 18 (2003) 235�/265260
plains of the Indian Punjab. Journal of Agricultural Science
129, 13�/18.
Hunkar, M., 1994. Validation of crop simulation model
CERES-Maize. Quarterly Journal of Hungarian Meteorol-
ogy Series 98, 37�/46.
Hunt, L.A., 1993. Designing improved plant types: a breeder’s
viewpoint. In: Penning de Vries, F., Teng, P., Metselaar, K.
(Eds.), Systems Approaches for Agricultural Development.
Kluwer Academic Press, Boston, pp. 3�/17.
Hunt, L.A., Boote, K.J., 1998. Data for model operation,
calibration, and evaluation. In: Tsuji, G.Y., Hoogenboom,
G., Thornton, P.K. (Eds.), Understanding Options for
Agricultural Production. Kluwer Academic Publishers, pp.
9�/39.
Hunt, L.A., White, J.W., Hoogenboom, G., 2001. Agronomic
data: advances in documentation and protocols for ex-
change and use. Agricultural Systems 70, 477�/492.
Iglesias, A., Rosenzweig, C., Pereira, D., 2000. Agricultural
impacts of climate change in Spain: developing tools for a
spatial analysis. Global Environmental Change 10, 69�/80.
International Benchmark Sites Network for Agrotechnology
Transfer. 1993. The IBSNAT Decade. Department of
Agronomy and Soil Science, College of Tropical Agriculture
and Human Resources, University of Hawaii, Honoluly,
Hawaii.
Irmak, A., Jones, J.W., Mavromatis, T., Welch, S.M., Boote,
K.J., Wilkerson, G.G., 1999. Evaluating methods for
simulating soybean culitvar responses using cross valida-
tion. Agronomy Journal 92, 1140�/1149.
Irmak, A., Jones, J.W., Batchelor, W.D., Paz, J.O., 2001.
Linking multiple layers of information for diagnosing
causes of spatial yield variability. Trans. ASAE 45 (3),
839�/849.
Jagtap, S.S., Abamu, F.J., Kling, J.G., 1999. Long-term
assessment of nitrogen and variety technologies on attain-
able maize yields in Nigeria using CERES-maize. Agricul-
tural Systems 60, 77�/86.
Jame, Y.W., Cutforth, H.W., 1996. Crop growth-models for
decision-support systems. Canadian Journal of Plant
Science 76 (1), 9�/19.
Jinghua, W., Erda, L., 1996. The impacts of potential climate
change and climate variability on simulated maize produc-
tion in China. Water, Air and Soil Pollution 92, 75�/85.
Jintrawet, A., 1995. A decision support system for rapid
assessment of lowland rice-based cropping alternatives in
Thailand. Agricultural Systems 47, 245�/258.
Jones, C.A., Kiniry, J.R., 1986. CERES-Maize: A Simulation
Model of Maize Growth and Development. Texas A&M
University Press, College Station, Texas.
Jones, C.A., Dyke, P.T., Williams, J.R., Kiniry, J.R., Benson,
V.W., Griggs, R.H., 1991. EPIC: an operational model for
evaluation of agricultural sustainability. Agricultural Sys-
tems 37, 341�/350.
Jones J.W. Ritchie, J.T., 1991. Crop growth models In: Hoff-
man, G.J, Howell, T.A., Solomon, K.H. (Eds.), Manage-
ment of Farm Irrigation Systems, American Society for
Agricultural Engineering, pp. 63�/89.
Jones, J.W., 1993. Decision support systems for agricultural
development. In: Penning de Vries, F., Teng, P., Metselaar,
K. (Eds.), Systems Approaches for Agricultural Develop-
ment. Kluwer Academic Press, Boston, pp. 459�/471.
Jones, J.W., Boote, K.J., Hoogenboom, G., Jagtap, S.S.,
Wilkerson, G.G., 1989. SOYGRO V5.42, Soybean Crop
Growth Simulation Model. User’s Guide. Fl. Agric. Exp.
Sta., Journal No. 8304. University of Florida, Gainesville.
pp. 53.
Jones, J.W., Tsuji, G.Y., Hoogenboom, G., Hunt, L.A.,
Thornton, P.K., Wilkens, P.W., Imamura, D.T., Bowen,
W.T., Singh, U., 1998. Decision support system for
agrotechnology transfer; DSSAT v3. In: Tsuji, G.Y.,
Hoogenboom, G., Thornton, P.K. (Eds.), Understanding
Options for Agricultural Production. Kluwer Academic
Publishers, Dordrecht, the Netherlands, pp. 157�/177.
Jones, J.W., Hansen, J.W., Royce, F.S., Messina, C.D., 2000.
Potential benefits of climate forecasting to agriculture.
Agriculture Ecosystems and Environment 82, 169�/184.
Jones, J.W., Hunt, L.A., Hoogenboom, G., Godwin, D.C.,
Singh, U., Tsuji, G.Y., Pickering, N.B., Thornton, P.K.,
Bowen, W.T., Boote, K.J., Ritchie, J.T., 1994. Input and
output files. In: Tsuji, G.Y., Uehara, G., Balas, S. (Eds.),
Decision Support System for Agrotechnology Transfer
(DSSAT) Version 3, vol. 2. University of Hawaii, Honolulu,
HI, pp. 1�/94.
Jones, J.W., Keating, B.A., Porter, C.H., 2001. Approaches to
modular model development. Agricultural Systems 70, 421�/
443.
Kamel, A., Schroeder, K., Sticklen, J., Rafea, A., Salah, A.,
Schulthess, U., Ward, R., Ritchie, J.T., 1995. Integrated
wheat crop management based on generic task knowledge-
based systems and CERES numerical-simulation. AI Ap-
plications 9 (1), 17�/28.
Kaur, P., Hundal, S.S., 1999. Forecasting growth and yield of
groundnut (Arachis hypogaea ) with a dynamic simulation
model ‘PNUTGRO’ under Punjab conditions. Journal of
Agricultural Science 133, 167�/173.
Keating, B.A., Godwin, D.G., Watiki, J.M., 1991. Optimising
nitrogen inputs in response to climatic risk. In: Muchow,
R.C., Bellamy, J.A. (Eds.), Climatic Risk in Crop Produc-
tion-Models and Management for the Semi-arid Tropics
and Subtropics. CAB Internatinal, Wallingford.
Kovacs, G.T., Nemeth, T., 1995. Testing simulation models for
the assessment of crop production and nitrate leaching in
Hungary. Agricultural Systems 49, 385�/397.
Kraalingen, D.W.G. van, 1990. The FORTRAN version of
CSMP MACROS (Modules for Annual CRop Simulation).
Simulation reports CABO-TT; nr. 21. Centre for Agrobio-
logical Research and Deptarment of Theoretical Production
Ecology, Agricultural University, Wageningen, the Nether-
lands.
Kraalingen, D.W.G. van, 1991. The FSE system for crop
simulation. Simulation reports CABO-TT; nr. 23. Centre
for Agrobiological Research and Deptarment of Theoretical
Production Ecology, Agricultural University, Wageningen,
the Netherlands.
J.W. Jones et al. / Europ. J. Agronomy 18 (2003) 235�/265 261
Kraalingen, D.W.G. van. 1995. The FSE system for crop
simulation, version 2.1. Quantitative Approaches in Systems
Analysis, No. 1, C.T. de Wit Graduate School for Produc-
tion Ecology and Resource Conservation, Wageningen
University, The Netherlands, pp. 58.
Kraalingen, D.W.G. van, Rappoldt C., Van Laar, H.H., 2003.
The Fortran simulation translator, a simulation language.
European Journal of Agronomy 18, 359�/361.
Lacey, D.K., McClendon, R.W., Hook, J.E., Todd, J.W.,
Womack, H., 1989. Express: An Expert Simulation System
for Peanut Insect Pest Management (ASAE Paper 89-7574).
American Society of Agricultural Engineers, St Joseph,
Michigan.
Lal, M., Singh, K.K., Rathore, L.S., Srinivasan, G., Saseen-
dran, S.A., 1998. Vulnerability of rice and wheat yields in
NW India to future changes in climate. Agricultural and
Forest Meteorology 89, 101�/114.
Lal, M., Singh, K.K., Srinivasan, G., Rathore, L.S., Naidu, D.,
Tripathi, C.N., 1999. Growth and yield responses of
soybean in Madhya Pradesh, India to climate variability
and change. Agricultural and Forest Meteorology 93 (1),
53�/70.
Landau, S., Mitchell, R.A.C., Barnett, V., Colls, J.J., Craigon,
J., Moore, K.L., Payne, R.W., 1998. Testing winter wheat
simulation models’ predictions against observed UK grain
yields. Agricultural and Forest Meteorology 89 (2), 85�/99.
Luo, Y., Tebeest, D.O., Teng, P.S., Fabellar, N.G., 1995.
Simulation studies on risk analysis of rice leaf blast
epidemics associated with global climate-change in several
Asian countries. Journal of Biogeography 22 (4�/5), 673�/
678.
Luo, Y., Teng, P.S., Fabellar, N.G., Tebeest, D.O., 1997. A
rice-leaf blast combined model for simulation of epidemics
and yield loss. Agricultural Systems 53 (1), 27�/39.
Luo, Y., Teng, P.S., Fabellar, N.G., TeBeest, D.O., 1998. The
effects of global temperature change on rice leaf blast
epidemics: a simulation study in three agroecological zones.
Agriculture Ecosystems and Environment 68, 187�/196.
MacRobert, J.F., Savage, M.J., 1998. The use of a crop
simulation model for planning wheat irrigation in Zim-
babwe. In: Tsuji, G.Y., Hoogenboom, G., Thornton, P.K.
(Eds.), Understanding Options for Agricultural Production.
Kluwer Academic Publishers, Dordrecht, the Netherlands,
pp. 205�/220.
Magrin, G.O., Travasso, M.I., Diaz, R.A., Rodriguez, R.O.,
1997. Vulnerability of the agricultural systems of Argentina
to climate change. Climate Research 9, 31�/36.
Manrique, L.A., Hodges, T., Johnson, B.S., 1990. Genetic
variables for potato. American Potato Journal 67 (10), 669�/
683.
Mavromatis, T., Boote, K.J., Jones, J.W., Irmak, A., Shinde,
D., Hoogenboom, G., 2001. Developing genetic coefficients
for crop simulation models with data from crop perfor-
mance trials. Crop Science 41, 40�/51.
Mavromatis, T., Boote, K.J., Jones, J.W., Wilkerson, G.G.,
Hoogenboom, G., 2002. Repeatability of model genetic
coefficients derived from soybean performance trials cross
different states. Crop Sci. 42, 76�/89.
Maytin, C.E., Acevedo, M., Jaimez, R., Andressen, R.,
Harwell, M.A., Robock, A., Azocar, A., 1995. Potential
effects of global climatic-change on the phenology and yield
of maize in Venezuela. Climatic Change 29 (2), 189�/211.
Mbabaliye, T., Wojtkowski, P.A., 1994. Problems and perspec-
tives on the use of a crop simulation model in an African
research station. Experimental Agriculture 30, 441�/446.
Mearns, L.O., Mavromatis, T., Tsvetsinskaya, E., Hays, C.,
Easterling, W., 2001. Comparative responses of EPIC and
CERES crop models to high and low spatial resolution
climate change scenarios. Journal of Geophysical Research
104, 6623�/6646.
Mearns, L.O., Rosenzweig, C., Goldberg, R., 1996. The effect
of changes in daily and interannual climatic variability of
CERES-Wheat: a sensitivity study. Climatic Change 32,
257�/292.
Messina, C.C., Hansen, J.W., Hall, A.J., 1999. Land allocation
conditioned on El Nino-Southern Oscillation phases in the
Pampas of Argentina. Agricultural Systems 60, 197�/212.
McClendon, R.W., Hoogenboom, G., Seigner, I., 1996. Opti-
mal control and neural networks applied to peanut irriga-
tion management. Transactions of the ASAE 39 (1), 275�/
279.
McCown, R.L., Hammer, G.L., Hargreaves, J.N.G., Holz-
worth, D.P., Freebairn, D.M., 1996. APSIM: a novel
software system for model development, model testing and
simulation in agricultural systems research. Agricultural
Systems 50, 255�/271.
McCown, R.L., 2001. Learning to bridge the gap between
science-based decision support and the practice of farming:
evolution in paradigms of model-based research and inter-
vention from design to dialogue. Australian Journal of
Agricultural Research 52, 549�/571.
Meira, S., Guevara, E., 1997. Application of SOYGRO in
Argentina. In: Kropff, M.J., et al. (Eds.), Applications of
System Approaches at the Field Level, v.2. Kluwer Aca-
demic Publishers, Dordrecht, Netherlands, pp. 235�/242.
Meisner, C.A., Karnok, K.J., McCrimmon, J.N., 1991. Using
crop models in a beginning crop science laboratory. Journal
of Agronomic Education 20, 157�/158.
Mishoe, J.W., Jones, J.W., Swaney, D.P., Wilkerson, G.G.,
1984. Using crop and pest models for management applica-
tions. Agricultural Systems 15, 153�/170.
Monteith, J.L., 1986. How do crops manipulate water supply
and demand? Philosophical Transactions of the Royal
Society London A 316, 245�/259.
Moulin, A.P., Beckie, H.J., 1993. Evaluation of the CERES and
EPIC models for predicting spring wheat grain yield over
time. Canadian Journal Plant Sciences 73, 713�/719.
Muchena, P., Iglesias, A., 1995. Vulnerability of maize yields to
climate change in different farming sectors in Zimbabwe. In:
Rosenzweig, C., Allen, L.H., Harper, L.A., Hollinger, S.E.,
Jones, J.W. (Eds.), Climate Change and Agriculture:
Analysis of Potential International Impacts (ASA Special
J.W. Jones et al. / Europ. J. Agronomy 18 (2003) 235�/265262
Publication 59). American Society of Agronomy, Madison,
Wisconsin, pp. 229�/239.
Ortiz, R.A., 1998. Crop simulation models as an educational
tool. In: Tsuji, G.Y., Hoogenboom, G., Thornton, P.K.
(Eds.), Understanding Options for Agricultural Production.
Kluwer Academic Publishers, Dordrecht, The Netherlands,
pp. 383�/388.
Pang, X.P., Gupta, S.C., Moncrief, J.F., Rosen, C.J.,
Cheng, H.H., 1998. Evaluation of nitrate leaching
potential in Minnesota glacial outwash soils using the
CERES-Maize model. Journal of Environmental Quality
27 (1), 75�/85.
Penning de Vries, F.W.T., van Laar, H.H., 1982. Simulation of
growth processes and the model BACROS. In: Penning de
Vries, F.W.T., van Laar, H.H. (Eds.), Simulation of Plant
Growth and Crop Production. PUDOC, Wageningen, The
Netherlands, pp. 114�/136.
Parton, W.J., Stewart, J.W.B., Cole, C.V., 1988. Dynamics of
C, N, P and S in grassland soils: a model. Biogeochemistry
5, 109�/131.
Parton, W.J., Ojima, D.S., Cole, C.V., Schimel, D.S., 1994. A
general model for soil organic matter dynamics: sensitivity
to litter chemistry, texture and management. In: Bryant,
R.B., Arnold, R.W. (Eds.), Quantitative Modeling of Soil
Forming Processes (Special Publication 39). SSSA, Madi-
son, WI, pp. 147�/167.
Paz, J.O., Batchelor, W.D., Colvin, T.S., Logsdon, S.D.,
Kaspar, T.C., Karlen, D.L., 1998. Analysis of water stress
effects causing spatial yield variability. Transactions of the
ASAE 41, 1527�/1534.
Paz, J.O., Batchelor, W.D., Babcock, B.A., Colvin, T.S.,
Logsdon, S.D., Kaspar, T.C., Karlen, D.L., 1999. Model-
based technique to determine variable rate nitrogen for
corn. Agricultural Systems 61, 69�/75.
Paz, J.O., Batchelor, W.D., Tylka, G.L., Hartzler, R.G., 2001a.
A modeling approach to quantifying the effects of spatial
soybean yield limiting factors. Trans. ASAE 44 (5), 1329�/
1334.
Paz, J.O., Batchelor, W.D., Tylka, G.L., 2001b. Estimating
potential economic return for variable rate management in
soybeans. Trans. ASAE 44 (5), 1335�/1341.
Pfeil, E.V., Hundertmark, W., Thies, F.D., Widmoser, P.,
1992a. Calibration of the simulation model ‘Ceres Wheat’
under conditions of soils with shallow watertable and
temperate climate. Part 1: limitations in the applicability
of the original model and necessary modifications. Zeits-
chrift fuer Pflanzenernahr Bodenk 155, 323�/326.
Pfeil, E.V., Hundertmark, W., Thies, F.D., Widmoser, P.,
1992b. Calibration of the simulation model ‘Ceres Wheat’
under conditions of soils with shallow watertable and
temperate climate. Part 2: verification of the modified model
‘Ceres Wheat’. Zeitschrift fuer Pflanzenernahr Bodenk 155,
327�/331.
Phillips, J.G., Cane, M.A., Rosenzweig, C., 1998. ENSO,
seasonal rainfall patterns and simulated maize yield varia-
bility in Zimbabwe. Agricultural and Forest Meteorology
90, 39�/50.
Pinnschmidt, H.O., Batchelor, W.D., Teng, P.S., 1995. Simula-
tion of multiple species pest damage in rice using CERES-
rice. Agricultural Systems 48, 193�/222.
Piper, E.L., Boote, K.J., Jones, J.W., Grimm, S.S., 1996a.
Comparison of two phenology models for predicting flower-
ing and maturity date of soybean. Crop Science 36, 1606�/
1614.
Piper, E.L., Boote, K.J., Jones, J.W., 1998. Evaluation and
improvement of crop models using regional cultivar trial
data. Applied Engineering in Agriculture 14, 435�/446.
Piper, E.L., Smit, M.A., Boote, K.J., Jones, J.W., 1996b. The
role of daily minimum temperature in modulating the
development rate to flowering in soybean. Field Crop
Research 47, 211�/220.
Pisani, du A., 1987. The CERES-MAIZE model as a potential
tool for drought assessment in South Africa. Water SA 13
(3), 159�/164.
Podesta, G., Letson, D., Messina, C.D., Royce, F., Ferreyra,
R.A., Jones, J.W., Jones, J.W., Llovet, I., Grondona, M.,
O’Brien, J.J., 2002. Use of ENSO-related climate informa-
tion in agricultural decision making in Argentina. Agricul-
tural Systems (in press).
Porter, C., Jones, J.W., Braga, R., 2000. An approach for
modular crop model development. International Consor-
tium for Agricultural Systems Applications, 2440 Campus
Rd., 527 Honolulu, HI 96822, pp. 13. Available from http://
www.icasanet.org/modular/index.html.
Priestley, C.H.B., Taylor, R.J., 1972. On the assessment of
surface heat flux and evaporation using large scale para-
meters. Monthly Weather Review 100, 81�/92.
Quemada, M., Cabrera, M.L., 1995. CERES-N model predic-
tions of nitrogen mineralized from cover crop residues. Soil
Science Society of American Journal 59, 1059�/1065.
Richardson, C.W., 1981. Stochastic simulation of daily pre-
cipitation, temperature, and solar radiation. Water Re-
sources Research 17 (1), 182�/190.
Richardson, C.W., 1985. Weather simulation for crop manage-
ment models. Transactions of the ASAE 28 (5), 1602�/1606.
Ritchie, J.T., 1972. Model for predicting evaporation from a
row crop with incomplete cover. Water Resources Research
8, 1204�/1213.
Ritchie, J.T., 1993. Genetic specific data for crop modeling. In:
Penning de Vries, F., Teng, P., Metselaar, K. (Eds.),
Systems Approaches for Agricultural Development. Kluwer
Academic Press, Boston, pp. 77�/93.
Ritchie, J.T., 1998. Soil water balance and plant stress. In:
Tsuji, G.Y., Hoogenboom, G., Thornton, P.K. (Eds.),
Understanding Options for Agricultural Production.
Kluwer Academic Publishers, Dordrecht, The Netherlands,
pp. 41�/54.
Ritchie, J.T., Otter, S., 1985. Description and performance of
CERES-Wheat: a user-oriented wheat yield model. In: ARS
Wheat Yield Project. ARS-38. Natl Tech Info Serv, Spring-
field, Missouri, pp. 159�/175.
Ritchie, J.T., Singh, U., Godwin, D.C., Bowen, W.T., 1998.
Cereal growth, development and yield. In: Tsuji, G.Y.,
Hoogenboom, G., Thornton, P.K. (Eds.), Understanding
J.W. Jones et al. / Europ. J. Agronomy 18 (2003) 235�/265 263
Options for Agricultural Production. Kluwer Academic
Publishers, Dordrecht, The Netherlands, pp. 79�/98.
Rosenzweig, C., Tubiello, F.N., 1996. Effects of changes in
minimum and maximum temperature on wheat yields in the
central US*/a simulation study. Agricultural and Forest
Meteorology 80 (2�/4), 215�/230.
Rosenzweig, C., Allen, L.H., Jr., Jones, J.W., Tsuji, G.Y.,
Hildebrand, P. (Eds.), Climate Change and Agriculture:
Analysis of Potential International impacts (ASA Special
Publication No. 59). Amer. Soc. Agron.,, Madison, WI
1995, p. 382.
Royce, F.S., Jones, J.W., Hansen, J.W., 2002. Model-Based
Optimization of Crop Management for Climate Forecast
Applications. Trans. ASAE 44 (5), 1319�/1327.
Ruiz-Nogueria, B., Boote, K.J., Sau, F., 2001. Calibration and
use of CROPGRO-soybean model for improving soybean
management under rainfed conditions. Agricultural Systems
68 (2), 151�/173.
Saarikko, R.A., 2000. Applying a site based crop model to
estimate regional yields under current and changed climates.
Ecological Modelling 131 (2�/3), 191�/206.
Sadler, E.J., Gerwig, B.K., Evans, D.E., Busscher, W.J., Bauer,
P.J., 2000. Sit-specific modeling of corn yield in the SE
coastal plain. Agricultural Systems 64, 189�/207.
Salam, M.U., Jones, J.W., Kobayashi, K., 2001. Predicting
nursery growth and transplanting shock in rice. Experi-
mental Agriculture 37, 65�/81.
Sau, F., Boote, K.J., Ruiz-Nogueira, B., 1999. Evaluation and
improvement of CROPGRO-soybean model for a cool
environment in Galicia, northwest Spain. Field Crops
Research 61, 273�/291.
Savin, R., Satorre, E.H., Hall, A.J., Slafer, G.A., 1995.
Assessing strategies for wheat cropping in the monsoonal
climate of the Pampas using the CERES-Wheat simulation
model. Field Crops Research 42, 81�/91.
Scholberg, J.M.S., Boote, K.J., Jones, J.W., McNeal, B.L.,
1997. Adaptation of the CROPGRO model to simulate the
growth of field-grown tomato. In: Kropff, M.J., et al.
(Eds.), Systems Approaches for Sustainable Agricultural
Development: Applications of Systems Approaches at the
Field Level. Kluwer Academic Publishers, Dordrecht, The
Netherlands, pp. 133�/151.
Seidl, M.S., Batchelor, W.D., Fallick, J.B., Paz, J.O., 2001.
GIS-crop model based decision support system to evaluate
corn and soybean prescriptions. Applied Engineering in
Agriculture 17 (5), 721�/728.
Seligman, N.C., Van Keulen, H., 1981. PAPRAN: a simulation
model of annual pasture production limited by rainfall and
nitrogen. In: Frissel, M.J., Van Veen, J.A. (Eds.), Simula-
tion of Nitrogen Behaviour of Soil�/Plant Systems. Centrum
voor Landbouwpublikaties en Landbouwdocumentatie
(PUDOC), Wageningen, Netherlands, pp. 192�/221.
Semenov, M.A., Wolf, J., Evans, L.G., Eckersten, H., Iglesias,
A., 1996. Comparison of wheat simulation models under
climate change. II. Application of climate change scenarios.
Climate Research 7, 271�/281.
Sexton, P.J., Batchelor, W.D., Boote, K.J., Shibles, R., 1998.
Evaluation of CROPGRO for prediction of soybean nitro-
gen balance in a Midwestern environment. Transactions of
the ASAE 41, 1543�/1548.
Singh, K.K., Kumar, R., Mall, R.K., Rathore, L.S., Sanker,
U., Gupta, B.R.D., 1999. Soybean (Glycine max ) yield
prediction from current and historical weather data using
CROPGRO model. Indian Journal of Agricultural Sciences
69 (9), 639�/643.
Singh, P., Boote, K.J., Virmani, S.M., 1994a. Evaluation of the
groundnut model PNUTGRO for crop response to plant
population and row spacing. Field Crops Research 39, 163�/
170.
Singh, P., Boote, K.J., Rao, Y.A., Iruthayaraj, M.R., Sheikh,
A.M., Hundal, S.S., Narang, R.S., 1994b. Evaluation of the
groundnut model PNUTGRO for crop response to water
availability, sowing dates, and seasons. Field Crops Re-
search 39, 147�/162.
Singh, P., Alagarswamy, G., Hoogenboom, G., Pathak, P.,
Wani, S.P., Virmani, S.M., 1999a. Soybean�/chickpea rota-
tion on vetric inceptisols: 2. Long-term simulation of water
balance and crop yields. Field Crops Research 63, 225�/236.
Singh, P., Alagarswamy, G., Pathak, P., Wani, S.P., Hoogen-
boom, G., Virmani, S.M., 1999b. Soybean�/chickpea rota-
tion on vertic inceptisols: 1. Effect of soil depth and
landform on light interception, water balance and crop
yields. Field Crops Research 63, 211�/224.
Singh, U., Godwin, D.C., 1990. Modelling the impact of
climate change on agricultural production in the South
Pacific. In: Hughes, P.J., McGregor, G. (Eds.), Global
Warming-Related Effects on Agriculture and Human
Health and Comfort in the South Pacific. South Pacific
Regional Environment Programme, New Guinea, pp. 521�/
537.
Singh, U., Thornton, P.K., Saka, A.R., Dent, J.B., 1993. Maize
modeling in Malawi: a tool for soil fertility research and
development. In: Penning de Vries, F.W.T., et al. (Eds.),
Systems Approaches for Agricultural Development. Kluwer
Academic Publishers, Dordrecht, The Netherlands, pp.
253�/273.
Singh, P., Virmani, S.M., 1994. Modeling growth and yield of
chickpea (Cicer arietinum L.). Field Crops Research 46, 1�/
29.
Singh, U., Matthews, R.B., Griffin, T.S., Ritchie, J.T., Hunt,
L.A., Goenaga, R., 1998. Modeling growth and develop-
ment of root and tuber crops. In: Tsuji, G.Y., Hoogen-
boom, G., Thornton, P.K. (Eds.), Understanding Options
for Agricultural Production. Kluwer Academic Publishers,
Dordrecht, The Netherlands, pp. 129�/156.
Soil Conservations Service (SCS) 1972. National Engineering
Handbook, Hydrology Section 4, Chapters 4�/10.
Southworth, J., Randolph, J.C., Habeck, M., Doering, O.C.,
Pfeifer, R.A., Rao, D.G., Johnston, J.J., 2000. Conse-
quences of future climate change and changing climate
variability on maize yields on the midwestern United States.
Agriculture Ecosystems and Environment 82, 139�/158.
J.W. Jones et al. / Europ. J. Agronomy 18 (2003) 235�/265264
Steele, D.D., Stegman, E.C., Knighton, R.E., 2000. Irrigation
management for corn in the northern Great Plains, USA.
Irrigation Science 19, 107�/114.
Swaney, D.P., Jones, J.W., Boggess, W.G., Wilkerson, G.G.,
Mishoe, J.W., 1983. Real-time irrigation decision analysis
using simulation. Transactions of the ASAE 26, 562�/568.
Thornton, P.K., Saka, A.R., Singh, U., Kumwenda, J.D.T.,
Brink, J.E., Dent, J.B., 1995. Application of a maize crop
simulation model in the central region of Malawi. Experi-
mental Agriculture 31, 213�/226.
Thornton, P.K., Bowen, W.T., Ravelo, A.C., Wilkens, P.W.,
Farmer, G., Brock, J., Brink, J.E., 1997. Estimating millet
production for famine early warning: an application of crop
simulation modelling using satellite and ground-based data
in Burkina Faso. Agricultural and Forest Meteorology 83,
95�/112.
Travasso, M.I., Magrin, G.O., 1998. Utility of CERES-Barley
under Argentine conditions. Field Crops Research 57, 329�/
333.
Travasso, M.I., Caldiz, D.O., Saluzzo, J.A., 1996. Yield
prediction using the substor-potato model under Argenti-
nean conditions. Potato Research 39, 305�/312.
Tsuji, G.Y., Uehara, G., Balas, S. (Eds.), Decision Support
System for Agrotechnology Transfer (DSSAT) Version 3.
University of Hawaii, Honolulu, Hawaii 1994.
Tsuji, G.Y., 1998. Network management and information
dissemination for agrotechnology transfer. In: Tsuji, G.Y.,
Hoogenboom, G., Thornton, P.K. (Eds.), Understanding
Options for Agricultural Production. Kluwer Academic
Publishers, Dordrecht, The Netherlands, pp. 367�/381.
Tsuji, G.Y., Hoogenboom, G., Thornton, P.K. (Eds.), Under-
standing options for agricultural production. Systems
Approaches for Sustainable Agricultural Development.
Kluwer Academic Publishers, Dordrecht, The Netherlands
1998, p. 400.
Tubiello, F.N., Rosenzweig, C., Volk, T., 1995. Interactions of
CO2 temperature and management practices: simulations
with a modified version of CERES-Wheat. Agricultural
Systems 49, 135�/152.
Tubiello, F.N., Rosenzweig, C., Kimball, B.A., Pinter, P.J., Jr.,
Wall, G.W., Hunsaker, D.J., LaMorte, R.L., Garcia, R.L.,
2001. Testing CERES-wheat with free-air carbon dioxide
enrichment (FACE) experiment data: CO2 and water
interactions. Agronomy Journal 91, 247�/255.
Uehara, G., 1989. Technology transfer in the tropics. Outlook
Agricultural 18, 38�/42.
Uehara, G., 1998. Synthesis. In: Tsuji, G.Y., Hoogenboom, G.,
Thornton, P.K. (Eds.), Understanding Options For Agri-
cultural Production. Kluwer Academic Publishers, Dor-
drecht, The Netherlands, pp. 389�/392.
Uehara, G., Tsuji, G.Y., 1998. Overview of IBSNAT. In: Tsuji,
G.Y., Hoogenboom, G., Thornton, P.K. (Eds.), Under-
standing Options For Agricultural Production. Kluwer
Academic Publishers, Dordrecht, The Netherlands, pp. 1�/7.
Vos, de R.N., Mallett, J.B., 1987. Preliminary evaluation of two
maize (Zea mays L.) growth-simulation models. South
African Journal of Plant Soil 4 (3), 131�/136.
Wafula, B.M., 1995. Applications of crop simulation in
agricultural extension and research in Kenya. Agricultural
Systems 49, 399�/412.
Wagner-Riddle, C., Gillespie, T.J., Hunt, L.A., Swanton, C.J.,
1997. Modeling a rye cover crop and subsequent soybean
yield. Agronomy Journal 89, 208�/218.
Welch, S.M., Jones, J.W., Brennan, M.W., Reeder, G.,
Jacobson, B.M., 2002. PCYield: Model-Based Decision
Support for PRIVATE Soybean Production. Agricultural
Systems 74 (1), 79�/98.
White, J.W., Hoogenboom, G., 1996. Simulating effects of
genes for physiological traits in a process-oriented crop
model. Agronomy Journal 88, 416�/422.
White, J.W., Hoogenboom, G., Jones, J.W., Boote, K.J., 1995.
Evaluation of the dry bean model BEANGRO V1.01 for
crop production research in a tropical environment. Experi-
mental Agriculture 31, 241�/254.
Wilkerson, G.G., Jones, J.W., Boote, K.J., Ingram, K.T.,
Mishoe, J.W., 1983. Modeling soybean growth for crop
management. Transactions of the ASAE 26, 63�/73.
Williams, J.R., Jones, C.A., Dyke, P.T., 1984. A modeling
approach to determining the relationships between erosion
and soil productivity. Transactions of the ASAE 27, 129�/
144.
Wolf, J., Evans, L.G., Semenov, M.A., Eckersten, H., Iglesias,
A., 1996. Comparison of wheat simulation models under
climate change. I. Model calibration and sensitivity ana-
lyses. Climate Research 7, 253�/270.
Zalud, Z., Trnka, M., Dubrovsky, M., 2000. Change of spring
barley production potential using crop model CERES-
Barley. Rostlinna Vyroba 46 (9), 423�/428.
Zalud, Z., Stralkova, R., Pokorny, E., Podesvova, J., 2001.
Estimation of winter wheat nitrogen stress using the CERES
crop model. Rostlinna Vyroba 47 (6), 253�/259.
J.W. Jones et al. / Europ. J. Agronomy 18 (2003) 235�/265 265