the dynamics of disability and social...
TRANSCRIPT

The Dynamics of Disability and Social Inclusion
Brenda Gannon and Brian Nolan
NATIONAL DISABILITY AUTHORITYThe National Disability Authority (NDA) was established in June 2000 as an independentstatutory body operating under the aegis of the Department of Justice, Equality and LawReform.
The NDA’s functions, as set out in the National Disability Authority Act of 1999, are:
• To advise the Minister on issues of policy and practice in relation to disability
• To assist the Minister in the co-ordination and development of policy in relation topeople with disabilities
• To undertake, commission or collaborate in research on issues relating to disability
• To assist in the development of statistical information for planning, delivering andmonitoring services for people with disabilities
• To advise in relation to standards for programmes and services for people withdisabilities
• To monitor the implementation of standards and codes of practice for services forpeople with disabilities
The NDA is committed to the creation of an inclusive Irish society, one in which peoplewith disabilities have equal rights and opportunities to participate in the economic, socialand cultural life of the nation.
THE EQUALITY AUTHORITYThe Equality Authority was established in 1999. It has a broad mandate to promoteequality of opportunity and to combat discrimination in the areas covered by theEmployment Equality Acts 1998 and 2004 and the Equal Status Acts 2000 to 2004.
The Employment Equality Acts 1998 and 2004 prohibit discrimination in the workplace.The Equal Status Acts 2000 to 2004 prohibit discrimination in the provision of goods andservices, accommodation and educational establishments. Separate provision is made inrelation to registered clubs. Both Acts prohibit discrimination, including indirectdiscrimination and discrimination by association, sexual harassment and harassment, andvictimisation. Both Acts allow positive action (in pursuit of full equality in practice underthe Employment Equality Acts) and require a reasonable accommodation of people withdisabilities subject to exemptions. Both Acts are subject to exemptions. Both Acts covernine grounds – gender, marital status, family status, age, disability, race, sexual orientation,religion and membership of the Traveller community.The disability ground is broadlydefined to include people with physical, intellectual, learning, cognitive or emotionaldisabilities and a range of medical conditions.
The functions of the Equality Authority include the provision of information on theworking of the Acts and on the Maternity Protection Acts 1994 and 2004, the AdoptiveLeave Act 1995 and the Parental Leave Act 1998, to monitor and keep under review theActs and to make recommendations to the Minister for Justice, Equality and Law Reformfor change.The powers afforded to the Equality Authority to carry out its functionsinclude: to conduct equality reviews and action plans, to prepare Codes of Practice, toconduct inquiries, to provide legal assistance to claimants under the Employment EqualityActs and the Equal Status Acts at its discretion on a strategic basis, to take cases in its ownname in certain circumstances and to conduct research.

THE DYNAMICS OF DISABILITY AND SOCIAL INCLUSION
Brenda Gannon and Brian NolanEconomic and Social Research Institute
First Published July 2006 by
The Equality Authority2 Clonmel StreetDublin 2
© 2006 The Equality Authority
ISBN-10 1-905628-23-4ISBN-13 978-1-905628-23-0
The views expressed in this report are those of the authors and do not necessarily represent those of the Equality Authority or the National Disability Authority.

FOREWORD
The Dynamics of Disability and Social Inclusion provides timely insight into the experience and situation ofpeople with disabilities. It is published at a time that coincides with the preparation of a new NationalAnti Poverty Strategy. It suggests that people with disability must be a particular focus within thetargets, indicators, actions and investments to be established by the strategy.
This report makes use of data from the Living in Ireland Surveys, 1995 to 2001. It explores the impacton employment, income and relative income poverty, and social participation for people who acquire a disability, for people who cease reporting a disability and for people who have a disability over thewhole period examined.Acquiring a disability is found to be associated with a decline in the probabilityof being in employment and a decline in household income.Those who ceased to report a disabilityover the period are found to have increased probability of employment and increased householdincome.Those with a disability over the whole period register a pronounced reduction in likelihood of being in employment and lower household income.
The impact of having a disability that emerges from this report must focus attention on the barriersexperienced by people with disabilities in securing employment.These barriers stretch from theworkplace into labour market programmes, the education system and wider society. Employers, serviceproviders and policy makers all have a key contribution to make in dismantling these barriers andcreating a society where the experience of disability is no longer linked to exclusion and poverty.
The Dynamics of Disability and Social Inclusion is a joint venture of the Equality Authority and theNational Disability Authority. It reflects the benefits that can flow where shared objectives areadvanced through pooling resources and expertise. It builds on previous joint work which wascommissioned and published as Disability and Social Inclusion in Ireland.
We are grateful to Brenda Gannon and Brian Nolan for their expert and insightful work on this report.
Niall CrowleyChief Executive Officer,The Equality Authority
This research, a joint publication between the National Disability Authority and the Equality Authority,provides an important opportunity to examine in detail the impact of disability on social inclusion inIreland and to examine how that impact changes over time. Specifically the research allows us tobetter understand the experience of disability over time in the areas of employment, income and socialparticipation. By examining this dynamic we can better plan policy and programme interventions topromote return to work and training at critical points and how and when to intervene to prevent thatimportant decline into poverty associated with disability.
The sharp drop in participation in the workforce following onset of a disability, highlighted by this research,points to the importance of having a comprehensive employment strategy for people with disabilities,which addresses among other issues the retention of employment following onset of a disability.

The research findings on the poverty risk faced by people with long-term disabilities show how thishas to be a core concern of an effective anti-poverty programme.
Promoting the inclusion of people with disabilities is a key goal of the National Disability Authority andachieving this requires an array of social policies and programmes working coherently to respond toand support the person experiencing disability across their lifespan.
Through a range of measures the National Disability Strategy sets important new challenges for Irishsociety and provides a framework in which the inclusion of people with disabilities can be enhanced.The Disability Act 2005, the cornerstone of the strategy, provides for new accessibility measures toensure that people with disabilities enjoy access to public services, information, buildings, heritage andICT. It also provides an employment target to promote the employment of people with disabilityacross the public sector.
The statutory Sectoral Plans on disability for six key Government departments, published in July 2006,set out a range of policies and programmes to promote increased participation of people withdisabilities in Irish society. Improved accessibility of public transport and of public streets are two areaswhere the sectoral plans aim to reduce some of the obstacles to fuller participation by people withdisabilities in the life of the community.
The research in this report sets out the challenge to achieve a more inclusive society.The NationalDisability Strategy is a key tool towards that end.The NDA will work with other stakeholders to achievethe goal of maximum participation of people with disabilities in Irish society as full and equal citizens.
The National Disability Authority joins the Equality Authority in thanking Brian Nolan and BrendaGannon for their expert work on this document and for their significant contribution to our sector.
Angela KerinsChairperson,National Disability Authority

AUTHORS’ ACKNOWLEDGEMENTS
Very helpful comments on the content of this study were received from Laurence Bond (EqualityAuthority) and Eithne FitzGerald (National Disability Authority).

CONTENTS
Page
Executive Summary 9
Chapter
1. Introduction 11
2. The Dynamics of Disability 14
2.1 Introduction 142.2 The Living in Ireland Surveys 142.3 The Analytical Framework 162.4 Disability “Onset” 162.5 Disability “Exit” 202.6 Persistent Disability 212.7 Conclusions 24
3. The Dynamics of Disability and Work 26
3.1 Introduction 263.2 Disability “Onset” and Employment 273.3 Disability “Exit” and Employment 313.4 Persistent Disability and Employment 333.5 Conclusions 35
4. The Dynamics of Disability, Household Income and Poverty 36
4.1 Introduction 364.2 Disability “Onset” and Household Income 374.3 Disability “Exit” and Household Income 394.4 Persistent Disability and Household Income 404.5 Disability “Onset” and Poverty 414.6 Disability “Exit” and Poverty 424.7 Persistent Disability and Poverty 454.8 Conclusions 46
5. The Dynamics of Disability and Social Participation 48
5.1 Introduction 485.2 Disability and Social Participation, 1995-2001 485.3 Onset of Disability and Social Participation 495.4 Exit from Disability and Social Participation 515.5 Persistent Disability and Social Participation 525.6 Conclusions 54
6. Conclusions 55
6.1 Introduction 556.2 The Impact of Disability Onset 56

6.3 The Impact of Disability Exit 576.4 The Impact of Persistent Disability 576.5 The Challenge Posed by the Research 58
Bibliography 59
List of Tables
2.1 Onset of Chronic Illness/Disability, Living in Ireland Survey, 1995-2001 172.2 Onset of Chronic Illness/Disability by Selected Characteristics 182.3 Logistic Regression Model of Onset of Chronic Illness/Disability 192.4 Exit from Chronic Illness/Disability, Living in Ireland Survey, 1995-2001 202.5 Rates of Exit from Chronic Illness/Disability 202.6 Logistic Regression Model of Exit from Chronic Illness/Disability 212.7 Persistent Chronic Illness/Disability, 1995 – 2001 222.8 Rates of Persistent Chronic Illness/Disability 232.9 Logistic Regression Model of Persistent Chronic Illness/Disability 243.1 Labour Force Participation for those with Onset of 28
Disability,Age 16-64, Living in Ireland Surveys, 1995-20013.2 Characteristics of those Experiencing Onset of Chronic Illness/Disability
by Employment Status,Age 16-64 293.3 Onset of Chronic Illness/Disability and Probability of Stopping Work,Age 16-64 303.4 Labour Force Participation for those Exiting from Chronic Illness/Disability, 31
Age 16-643.5 Exit from Chronic Illness/Disability and Probability of being in Work,Age 16-64 323.6 Persistent Chronic Illness/Disability and Number of Years in Work,Age 16-64 333.7 Persistent Chronic Illness/Disability and Probability of Being in Work,Age 16-64 344.1 Mean Equivalised Household Weekly Net Income and Onset of Chronic
Illness/Disability,Age 16+, Living in Ireland Surveys 374.2 Onset of Chronic Illness/Disability and Household Income 384.3 Mean Equivalised Household Weekly Net Income and Exit from Chronic
Illness/Disability 394.4 Exit from Chronic Illness/Disability and Household Income 394.5 Mean Equivalised Household Weekly Net Income and Persistent Chronic
Illness/Disability 404.6 Mean Equivalised Household Weekly Net Income for those Reporting 40
Persistent Chronic Illness/Disability4.7 Persistent Chronic Illness/Disability and Household Income 414.8 Poverty Risk and Onset of Chronic Illness/Disability,Age 16+ 424.9 Onset of Chronic Illness/Disability and Probability of Poverty 434.10 Poverty Risk and Exit from Chronic Illness/Disability,Age 16+ 434.11 Exit from Chronic Illness/Disability and Poverty Risk 444.12 Poverty Risk and Persistent Chronic Illness/Disability,Age 16+ 454.13 Persistent Chronic Illness/Disability and Risk of Poverty 455.1 Chronic Illness/Disability and Social Participation, 1995-2001,Age 16+ 495.2 Onset of Chronic Illness/Disability and Social Participation 505.3 Onset of Chronic Illness/Disability and Probability of Social Participation 505.4 Exit from Chronic Illness/Disability and Social Participation,Age 15+ 515.5 Exit from Chronic Illness/Disability and Social Participation 525.6 Persistent Chronic Illness/Disability and Social Participation, 1995-2001,Age 16+ 535.7 Persistent Chronic Illness/Disability and Social Participation 53

EXECUTIVE SUMMARY
Introduction
Previous research in large-scale representative household surveys has shown that people reportingchronic illness or disability fare worse than others in terms of employment, income and socialparticipation.This study uses data from the Living in Ireland Surveys (LISs), 1995-2001, to see howemployment, income and relative income poverty, and social participation changed when someonemoved from not experiencing disability to reporting disability (referred to as disability onset) or vice versa (referred to as disability exit), which provides a valuable insight into the impact of disabilityholding other things constant.The position of those reporting disability throughout the years of the LISwas also studied, to get a sense of the effects of such persistent disability.
Disability can be identified in a relatively crude but still valuable fashion in a general household survey such as this. In any year about 20% of the adult population reported having a chronic illness or disability.Tracking individual adults from 1995 to 2001, about twice that many reported such anillness or disability at some point over the seven years.
The Impact of Disability Onset
The onset of disability for adults of working age in the survey was found to be associated with adecline of about 20 percentage points in the probability of being in employment, taking a range ofpersonal and household characteristics into account.This fall was more pronounced when the chronicillness or disability hampered the person in their daily activities, when the person was already in a low-income household, and for women and those with low levels of education.
Disability onset was also seen to be associated with a decline in household income, of the order of15% on average. Household income fell partly because of reduced employment, but also because some of those remaining in employment worked fewer hours.There was also a marked increase,of 7 percentage points, in the probability of falling below a widely-used relative income povertythreshold (60% of median income).
As far as social participation is concerned, only onset of severely hampering disability was associatedwith a significantly lower level of participation, whereas disability that hampered the individual to some extent or not at all did not have that effect.
The Impact of Disability Exit
When an adult moved from reporting to not reporting disability in the survey there was an increase ofabout 7 percentage points in the probability of their being in employment, having controlled forpersonal and household characteristics.There was also an increase of about 10% in predictedhousehold income. Despite this there was no independent statistically significant effect on thelikelihood of their being in poverty. Similarly, the estimated impact of exit on social participation was not statistically significant.
The Dynamics of Disability and Social Inclusion | 9

The Impact of Persistent Disability
As well as examining what happened on disability onset and exit, the experience of those reportingpersistent illness/disability over all seven years of the panel survey was also investigated in some depth.Persistent disability of this sort was associated with a very pronounced reduction, of 42 percentagepoints, in the likelihood of being in employment when a range of other personal and householdcharacteristics was taken into account. It was also strongly linked to lower income, predictedhousehold income being 20% lower than for someone otherwise similar but with no experience ofdisability over the period.The probability of being below the relative income poverty threshold was 13 percentage points, with reduced employment the key channel through which disability increasedpoverty risk. Finally, having a chronic illness or disability throughout the life of the panel significantlyreduced the expected level of social participation.
The Challenge
The results pose a major challenge for policy in relation to tackling the many-faceted barriers toobtaining and maintaining employment that face people with disabilities, as well as in designing incomesupport policies that provide them with an adequate standard of living.
10 | The Dynamics of Disability and Social Inclusion
1
INTRODUCTION
In a recently completed research study for the Equality Authority and the National Disability Authoritywe examined various aspects of social inclusion and social exclusion for people with disabilities, usingavailable data from representative household surveys of the Irish population (Gannon and Nolan 2005).That study investigated the extent of social exclusion for people with disabilities under the followingheadings: Education, Earnings, Poverty and Deprivation, and Social Life and Social Participation. Data fromthe Living in Ireland Surveys and the Quarterly National Household Survey was employed to analysethe extent of exclusion in a cross section context, that is to say using those datasets as a “snapshot” tocompare the position of people with disabilities with others in Irish society at the time the surveyswere carried out. Labour force participation, an absolutely central dimension of overall participation insociety, was analysed from a disability perspective using the same data sources in a previous study bythe same authors for the Equality Authority (Gannon and Nolan 2004a).
These studies showed that on almost all the measures studied, people with chronic illness or disabilityfared worse than others in their own age group.This is strongly associated with the degree to whichthey are hampered in their daily lives by their illness or disability.Those with a chronic illness ordisability tend to have lower levels of educational attainment than others, and only a minority are inwork. People with chronic illness or disability are more than twice as likely to be at risk of poverty,and more than twice as likely to be poor, using official measures of poverty. People with a chronicillness or disability are also less likely to be in a club or an association, to talk to their neighbours,friends or relatives most days, or to have a social afternoon or evening out.
The Living in Ireland Surveys, carried out from 1994 to 2001, were not simply a set of repeated cross-section surveys interviewing a new set of respondents each year. Instead, the design employedwas a longitudinal one, in other words the same people were followed up from one year to the nextand re-interviewed insofar as possible.This means that not only the circumstances of those individualsat a point in time, but also how they evolved over time can be studied.While this is a very valuableaspect of the data in exploring a wide range of socio-economic phenomena, it is particularly useful intrying to capture the impact of disability on social exclusion. In a cross-section, one can seek to“control” statistically for the effects of other relevant factors such as gender, age, or educational levelin assessing the impact of disability on income, poverty, social participation and so on. However, onecannot be sure that all the relevant factors have been properly controlled for, and it is not possible toidentify the specific channels of influence or causal mechanisms through which disability has an impact.
With longitudinal data, on the other hand, we can see individuals who move from not experiencingdisability at one point to subsequently reporting disability, and others who move from reportingdisability to not doing so – which we will refer to as disability “onset” and “exit” respectively.Thechange in the outcomes of interest – employment status, household income and poverty, social
The Dynamics of Disability and Social Inclusion | 11
participation – as the person moves into or out of disability can then be studied directly.This improvesour capacity to estimate the effects of disability with precision and allows the channels whereby theseeffects operate to be traced with more confidence. (Our analysis applies only to adults, and thereforewill not capture onset during childhood.)
It is also the case that the duration of disability may well influence the scale and nature of its effects.Ideally, longitudinal data would allow us to observe an individual's situation pre-onset, around the timeof onset, and as the specific disability experience either lengthens or ends, and provide a basis fordistinguishing these effects. In practice, the numbers in the sample inevitably constrain the depth of the analysis, and we will have to focus particularly on those reporting disability throughout the sample– for whom we have not observed onset or exit – in investigating duration and the effects ofexperiencing disability long-term. (Some of these people will have acquired the disability duringchildhood or even had it from birth, while others will have experienced onset during adulthood butbefore the survey began.) Nonetheless, it is useful to have this framework in mind: we want to capture the impact of disability onset, exit and duration.
In doing so, we have to take into account the fact that those experiencing disability may have had pre-existing disadvantages, such as family background or low education level. (Disability acquired inchildhood or teenage years may of course itself have impacted on educational attainment, but we willnot be capturing that dimension here.) These other factors could well independently affect theoutcomes we are interested in; looking at someone with a disability who has limited education (notitself related to the presence of disability), one could then mistakenly attribute for example lowincome to the presence of disability, when in fact it was primarily a consequence of educationalattainment. In comparing people in a cross-section, as in our previous studies, it was clearly essential totry to abstract from or “control for” such effects, and that remains true in analysing longitudinal data,even when we are comparing the situation of the same individual at two different points in time.
Suppose for example we observe someone who experiences the onset of disability and at the sametime moves from being in work to being unemployed. If that person has a low level of education, thenthey may have been prone to unemployment anyway, even in the absence of disability. If on the otherhand they have a high level of education and would have been very unlikely to experienceunemployment in the absence of a disability, we can with more certainty attribute the change in theirlabour force status to disability onset. So the analysis will need to incorporate a variety of individual andhousehold characteristics into the analysis, as well as measures of disability onset, duration and exit.
This report aims to exploit this potential of the longitudinal data from the Living in Ireland surveys,presenting an investigation of the dynamic relationship between disability and social exclusion whichcomplements the cross-sectional analysis in Gannon and Nolan (2005). It investigates howemployment, income, poverty and social participation are observed to change from the reported dateof onset of disability or exit from disability, as well as the situation of those reporting disabilitythroughout the life of the panel.
As we emphasised in our previous reports, the measurement of disability in a survey context posesconsiderable definitional and methodological difficulties, and disability can be captured in only a very crudefashion in a general household survey like the Living in Ireland Survey.The survey asks whether one has achronic or longstanding illness or disability, and follows up to obtain some additional information about thenature of the illness or disability and how much it limits or hampers the person.This does not reflect a“medical model” of disability; the respondent is asked to assess the extent to which he or she is hamperedin daily activities, which will be affected not only by the specific impairments involved but also social,attitudinal and environmental barriers to participation.The information available cannot serve as substitutefor the in-depth information that would be obtained via a full-scale national survey on disability prevalenceand impact. However, as previous studies have demonstrated, it does allow for significant improvement inour understanding of the impact of disability on key outcomes such as income, living standards, and socialparticipation that are measured in some considerable depth in the survey.
12 | The Dynamics of Disability and Social Inclusion

The Dynamics of Disability and Social Inclusion | 13
The structure of the study is as follows. Chapter 2 describes the Living in Ireland Survey and thepattern of disability dynamics it reveals, in terms of duration of disability experienced, the numbers anddistinguishing characteristics of those observed with an “onset” of disability over the life of the panelsurvey and those observed with an “exit” from disability over the life of the panel survey. Chapter 3then focuses on employment, Chapter 4 on earnings and household income, and Chapter 5 on socialparticipation across various dimensions. In each case we investigate what happens to the outcome inquestion as onset and exit are observed, and also examine the situation of those reporting chronicillness or disability throughout the life of the panel survey. Chapter 6 brings together and summarisesthe key findings.
14 | The Dynamics of Disability and Social Inclusion
2
THE DYNAMICS OF DISABILITY
2.1 Introduction
If we look at a cross-sectional “snapshot” of people who report that they currently have a chronicillness or disability, this will include people with very different experiences of disability. Some will havehad a chronic illness or disability from birth, some will have developed a disability or chronic illnessrecently which will in all likelihood affect them long-term, and others will only experience thatdisability for a short period.We would expect the impact of these different patterns of disability onsocial inclusion to be very different.This is in essence why it is important to complement a cross-sectional picture with the analysis of the dynamics of disability over time and how it affects crucialaspects of societal participation.
In this study we will be using the longitudinal data obtained in the Living in Ireland survey from 1995to 2001, and the chapter starts with a description of this panel dataset, which is unique in an Irishcontext.We then outline the analytic framework adopted in using these data to look at the impact ofdisability on key aspects of social inclusion on which the study is focused.This involves distinguishingthose observed as experiencing an “onset” of disability during the period covered by the survey – andthus acquire that disability during adulthood – those experiencing an “exit” from disability, and thoseexperiencing chronic illness and disability over the entire seven-year period of the panel survey.Thechapter also describes the numbers observed in each of these groups and their characteristics, asbackground to the analysis presented in the rest of the study.
2.2 The Living in Ireland Surveys
The Living in Ireland Survey was conducted by the Economic and Social Research Institute (ESRI) eachyear from 1994 to 2001, as part of the European Community Household Panel organised by Eurostat,the Statistical Office of the European Communities.The first wave of the survey in 1994 obtainedinformation for 4,048 households, where possible interviewing each adult in the household. (Moredetail is given in Gannon and Nolan, (2004) and a full description is in Callan et al, (1996).) What iscritical from the point of view of the present study is that the initial sample was then followed insubsequent years for re-interview.All individuals in the initial survey were to be followed andhousehold and individual interviews were to be conducted as long as the person still lived in a privatehousehold. (New households were included where a person already in the sample moved to anotherhousehold.) The fact that the same people were interviewed each year, insofar as possible, means thatit is possible to study changes in the characteristics and circumstances of those individuals and theirhouseholds over time, the unique feature of longitudinal or panel data.The European Community Panel
The Dynamics of Disability and Social Inclusion | 15
Survey ran up until 2001, when it was discontinued, and so the wave conducted in 2001 was also theeighth and last wave of the Living in Ireland survey.
By that point there had been substantial “attrition”, in other words a substantial number of thoseincluded in the initial survey had dropped out over time, as is common in panel surveys. In the case ofthe Living in Ireland Survey, slightly more than half the individuals interviewed in the original surveywere no longer in the panel by 2000.At that point the Irish panel was supplemented by 1,500 newhouseholds, also included in the base for the final survey in 2001, which helped in ensuring a morecomprehensive and accurate picture of those years, but the analysis of dynamics has to rely on thosewho were in the panel for a longer period. In this study we focus on what is known as the “balancedpanel” of individuals present throughout the life of the survey.
With attrition on this scale, it was obviously important to see whether it was substantially affecting the composition of the sample in terms of age profile, urban-rural split, household composition andsocio-economic status.The overall impact in those terms seems to have been relatively small, andweights were developed to counteract such effects where they were detected.A comprehensivedescription of the response pattern in the Living in Ireland Survey over the full eight years, thesupplementation in 2000, the problem of attrition and the weights developed to deal with it are givenin Whelan et al (2003). Gannon (2005) analysed attrition specifically in terms of those reportingchronic illness or disability and its impact on the estimated impact of disability on labour forceparticipation, using the procedure suggested by Wooldridge, and found no evidence to suggest that the results were affected by such attrition.
The Living in Ireland Survey included several questions directly focused on illness or disability, asdescribed in Gannon and Nolan (2005). Respondents were asked:
“Do you have any chronic physical or mental health problem, illness or disability?”
Those who said they did were then asked
• “What is the nature of this illness or disability?”
• “Since when have you had this illness or disability?”
• “Are you hampered in your daily activities by this physical or mental health problem, illness or disability?”with response categories “severely”,“to some extent”, or “not at all”.
The question posed about illness or disability in the initial, 1994 survey was slightly different so we do not use that year's results, basing our analysis on the seven years from 1995 to 2001.This leaves uswith a total of 2,727 adults who responded fully in each wave.
In studying the dynamics of disability one has to be aware that, in addition to panel attrition in general,there may be a specific concern about attrition due to chronic illness or disability. In other words,those who already have a chronic illness or disability may be more likely than others to drop out of the panel survey over time, and “onset” of such a disability may itself be associated with an increasedlikelihood of drop-out.We can look at the panel data to see whether more of the people reporting achronic illness or disability in one wave have dropped out by the next one, and evidence from theEuropean Community Household Panel suggests that there does seem to be some such effect acrossthe participating countries.We cannot see whether, in addition, some others who dropped outexperienced onset of disability after they were last observed in the panel and this contributed to theirdropping out.The implications for dynamic analysis of those remaining in the panel are difficult toassess, since we do not know how similar or different those who dropped out are, but the fact thatthose who are available for such analysis might not be entirely representative needs to be kept in mind.

16 | The Dynamics of Disability and Social Inclusion
2.3 The Analytical Framework
We now outline the analytical framework we will employ in assessing the impact of disability on keyoutcomes of interest, the rationale for this approach and what it involves.This framework is used toaddress the core questions towards which the study is directed: what impact does disability have on an individual's labour force participation, his or her household income, the likelihood that this incomewill fall below conventional income poverty thresholds, and the extent of their social networks andparticipation?
As emphasised in our introductory chapter, it is particularly useful to be able to look at observedmovements into chronic illness or disability – which following Jenkins and Rigg (2003) we label as'onset' – because we can then see what happens to the outcomes we are interested in, such as labourforce status and income, as disability occurs. In doing so it is helpful to first identify all those individualswho could potentially experience disability onset at a particular point, and see how many actuallyexperience onset.We can then compare the outcomes of interest for those experiencing onset withthose who could have but did not experience it.This comparison gives us the most direct measure ofthe impact of disability onset, via a “control group” who do not experience onset but are similar inother respects.1
As well as analysing what happens when someone starts a period of disability, it is also valuable to beable to capture the extent to which labour force status, income etc. change when a disability spellends.Adopting the same approach as with onset, we can compare those observed in the panel surveyto “exit” disability with those who could have exited but did not do so.To be in a position topotentially exit, one clearly has to be reporting a chronic illness or disability; taking all those whocould have exited, the comparison is between those who do and do not experience exit.
As brought out in our introductory chapter, looking at disability onset and exit, while very informative,will not capture the impact of how long a disability lasts.To explore the impact of persistent, long-termdisability we will complement our analysis of disability onset and exit by also examining those whoreport a chronic illness or disability throughout the period covered by the panel survey, in each yearfrom 1995 to 2001.
So the analytical framework to be adopted in subsequent chapters involves looking in turn at theimpact of disability onset, disability exit, and long-term or persistent disability on the outcomes ofinterest in the study – employment, income, poverty and social participation. Before going on to thatanalysis, we look in the rest of this chapter at those actually observed in the panel survey toexperience onset, exit and persistent disability, on whom we will be focusing in the remainder of the study.
2.4 Disability Onset
We now discuss how we define and measure disability onset, and the types of individual observed inthe sample as experiencing it. Since only adults were interviewed, only onset after 16 will be included– disability acquired in childhood might have a rather different impact, since educational attainmentmight well be affected as already noted. One way of capturing onset would be to simply take all adultsnot reporting disability in any of the surveys from 1995 to 2000 as “at risk”, and take every case
1 The “control group” analogy is not of course exact because the two groups have not been selected at random, as theywould be in a randomised control trial, and those who actually experience disability onset may have characteristics that pre-dispose them to doing so – such as low socio-economic status – which in fact distinguish them from others in the at riskpopulation; this is what is known as a “selection” problem and means that the socio-economic characteristics of the individualalso have to be incorporated into the analysis of the impact of disability onset.
where we subsequently observe a spell of disability starting as “onset”. (The “at risk” population couldonly be measured up to 2000, since 2001 was the last survey and we could not observe subsequentonset).That would mean that a particular individual could count as being at risk up to a maximum ofsix times.An individual could also experience onset more than once – in fact, with seven year's data anindividual could report up to three distinct “onsets”.2
However, Jenkins and Rigg's British study take a more restrictive definition that concentrates on moresustained spells of disability following longer periods of “no disability”.They define “at risk of onset” asnot having a chronic illness or disability for at least two years, and “onset” as then having a chronicillness or disability which lasts for at least two years.With that more restrictive definition one needs awindow of four years to capture onset of chronic illness or disability – for example, individuals whohad no chronic illness or disability in 1995 and 1996 are at risk, and if they become chronically ill ordisabled in 1997 and remain so until at least 1998 they are defined as having an onset of chronicillness/disability. Our sample only covers 7 years, so by definition an individual can then only have oneonset of chronic illness/disability.This “tighter” measure of disability onset is the one we adopt in thepresent study, because it allows us to focus on the impact of more sustained disability and reduces thepossible impact of measurement error in reporting disability.3
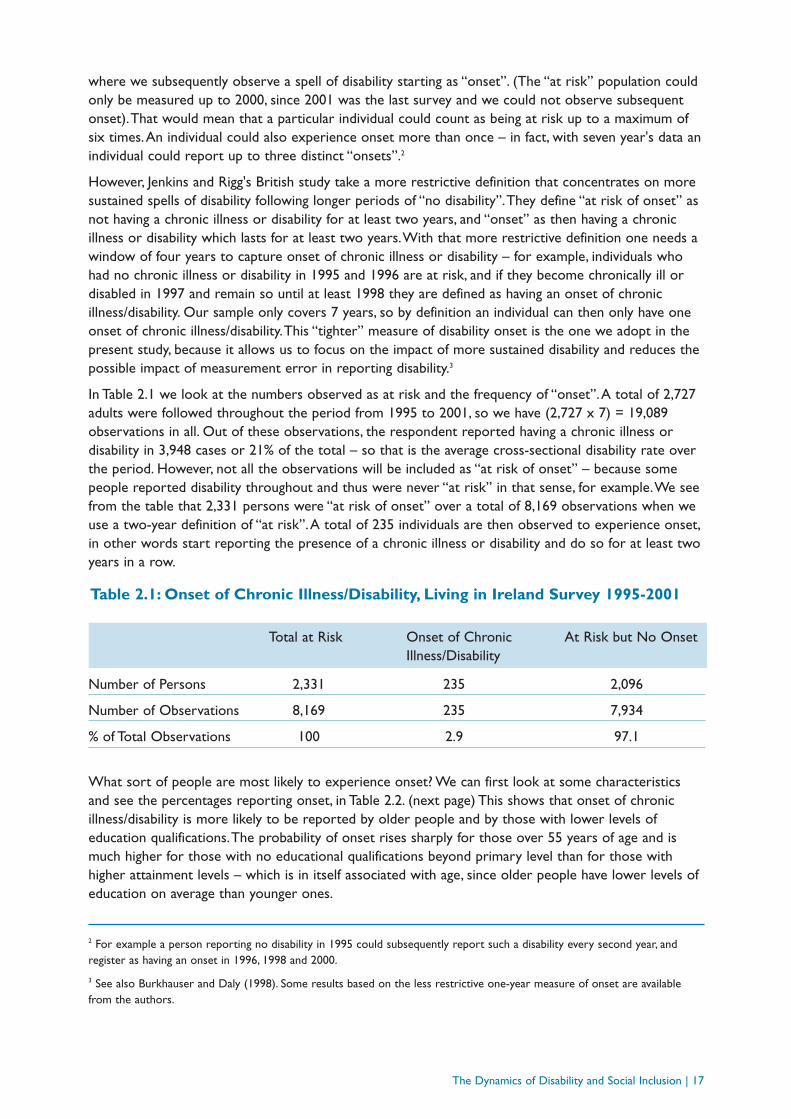
In Table 2.1 we look at the numbers observed as at risk and the frequency of “onset”.A total of 2,727adults were followed throughout the period from 1995 to 2001, so we have (2,727 x 7) = 19,089observations in all. Out of these observations, the respondent reported having a chronic illness ordisability in 3,948 cases or 21% of the total – so that is the average cross-sectional disability rate overthe period. However, not all the observations will be included as “at risk of onset” – because somepeople reported disability throughout and thus were never “at risk” in that sense, for example.We seefrom the table that 2,331 persons were “at risk of onset” over a total of 8,169 observations when weuse a two-year definition of “at risk”.A total of 235 individuals are then observed to experience onset,in other words start reporting the presence of a chronic illness or disability and do so for at least twoyears in a row.
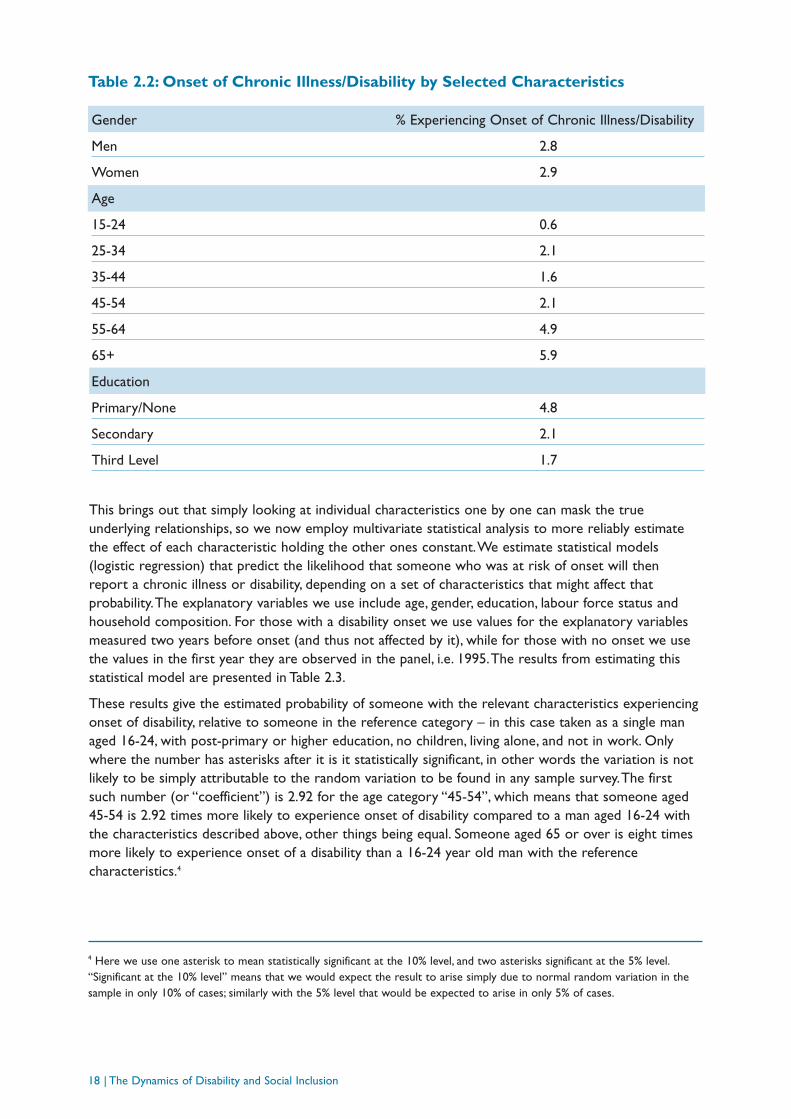
What sort of people are most likely to experience onset? We can first look at some characteristicsand see the percentages reporting onset, in Table 2.2. (next page) This shows that onset of chronicillness/disability is more likely to be reported by older people and by those with lower levels ofeducation qualifications.The probability of onset rises sharply for those over 55 years of age and ismuch higher for those with no educational qualifications beyond primary level than for those withhigher attainment levels – which is in itself associated with age, since older people have lower levels ofeducation on average than younger ones.
The Dynamics of Disability and Social Inclusion | 17
Total at Risk Onset of ChronicIllness/Disability
At Risk but No Onset
Number of Persons 2,331 235 2,096
Number of Observations 8,169 235 7,934
% of Total Observations 100 2.9 97.1
Table 2.1: Onset of Chronic Illness/Disability, Living in Ireland Survey 1995-2001
2 For example a person reporting no disability in 1995 could subsequently report such a disability every second year, andregister as having an onset in 1996, 1998 and 2000.
3 See also Burkhauser and Daly (1998). Some results based on the less restrictive one-year measure of onset are availablefrom the authors.
18 | The Dynamics of Disability and Social Inclusion
This brings out that simply looking at individual characteristics one by one can mask the trueunderlying relationships, so we now employ multivariate statistical analysis to more reliably estimatethe effect of each characteristic holding the other ones constant.We estimate statistical models(logistic regression) that predict the likelihood that someone who was at risk of onset will then report a chronic illness or disability, depending on a set of characteristics that might affect thatprobability.The explanatory variables we use include age, gender, education, labour force status andhousehold composition. For those with a disability onset we use values for the explanatory variablesmeasured two years before onset (and thus not affected by it), while for those with no onset we usethe values in the first year they are observed in the panel, i.e. 1995.The results from estimating thisstatistical model are presented in Table 2.3.
These results give the estimated probability of someone with the relevant characteristics experiencingonset of disability, relative to someone in the reference category – in this case taken as a single managed 16-24, with post-primary or higher education, no children, living alone, and not in work. Onlywhere the number has asterisks after it is it statistically significant, in other words the variation is notlikely to be simply attributable to the random variation to be found in any sample survey.The first such number (or “coefficient”) is 2.92 for the age category “45-54”, which means that someone aged45-54 is 2.92 times more likely to experience onset of disability compared to a man aged 16-24 withthe characteristics described above, other things being equal. Someone aged 65 or over is eight timesmore likely to experience onset of a disability than a 16-24 year old man with the referencecharacteristics.4
4 Here we use one asterisk to mean statistically significant at the 10% level, and two asterisks significant at the 5% level.“Significant at the 10% level” means that we would expect the result to arise simply due to normal random variation in thesample in only 10% of cases; similarly with the 5% level that would be expected to arise in only 5% of cases.
Gender % Experiencing Onset of Chronic Illness/Disability
Men 2.8
Women 2.9
Age
15-24 0.6
25-34 2.1
35-44 1.6
45-54 2.1
55-64 4.9
65+ 5.9
Education
Primary/None 4.8
Secondary 2.1
Third Level 1.7
Table 2.2: Onset of Chronic Illness/Disability by Selected Characteristics

The Dynamics of Disability and Social Inclusion | 19
Apart from age, the other socio-demographic characteristics are not statistically significant indistinguishing those who experience onset – the small number of cases observed to do so reduces the likelihood of detecting such effects, but it does suggest that the apparent greater likelihood ofonset for those with lower education in Table 2.5 was indeed associated with their older age profile.
The extensive research literature on health inequalities suggests that people already in poverty may be more susceptible to chronic illness/disability onset (Burchardt, 2003).When income poverty statusbefore onset – measured by whether the individual was in a household falling below 60% of medianincome (see Chapter 4) – is included in the model it is also significant, with individuals living in suchhouseholds 1.7 times more likely to experience onset of chronic illness or disability than others.
These results provide useful background to the analysis in subsequent chapters of what happens asonset occurs.We also want to look at what happens to employment, income etc. when a disabilityspell ends, and so we now turn to how that is captured in the survey and how many people areobserved as “exiting” disability.
Probability of Onset: Odds Ratio
Female 1.0571
No Education Qualifications 1.3348
Working 0.9570
Two Adults in Household 0.8362
Three or More Adults in Household 0.9594
One Child in Household 0.7289
Two or More Children in Household 1.1681
Age 25-34 2.1189
35-44 1.9182
45-54 2.9210**
55-64 5.4861**
65+ 8.3649**
Year 1.0296
Mean of Onset 0.03
N 8169
Table 2.3: Logistic Regression Model of Onset of Chronic Illness/Disability
Pseudo R2 = 0.0545
** Statistically significant at 5% level * Statistically significant at 10% level
Reference category: male, education qualification beyond primary, not working, single
adult household, no children, aged 16-24.
20 | The Dynamics of Disability and Social Inclusion
2.5 Disability “Exit”
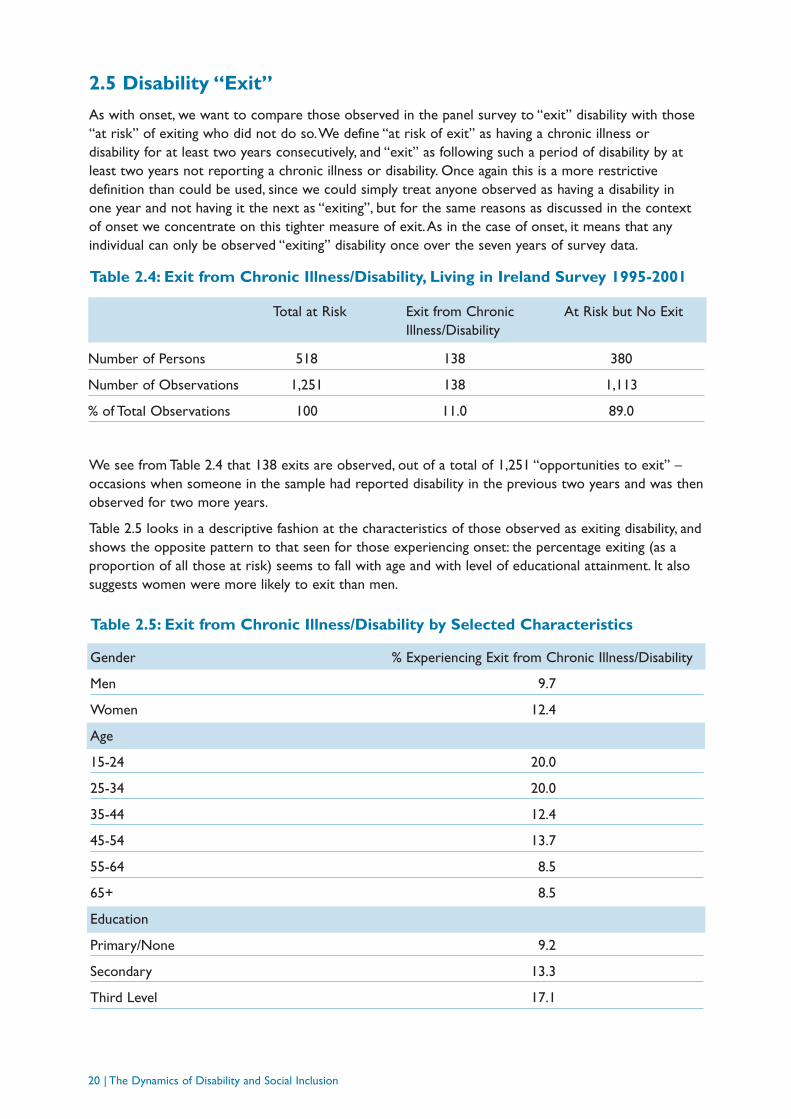
As with onset, we want to compare those observed in the panel survey to “exit” disability with those“at risk” of exiting who did not do so.We define “at risk of exit” as having a chronic illness ordisability for at least two years consecutively, and “exit” as following such a period of disability by atleast two years not reporting a chronic illness or disability. Once again this is a more restrictivedefinition than could be used, since we could simply treat anyone observed as having a disability in one year and not having it the next as “exiting”, but for the same reasons as discussed in the contextof onset we concentrate on this tighter measure of exit.As in the case of onset, it means that anyindividual can only be observed “exiting” disability once over the seven years of survey data.
We see from Table 2.4 that 138 exits are observed, out of a total of 1,251 “opportunities to exit” –occasions when someone in the sample had reported disability in the previous two years and was thenobserved for two more years.
Table 2.5 looks in a descriptive fashion at the characteristics of those observed as exiting disability, andshows the opposite pattern to that seen for those experiencing onset: the percentage exiting (as aproportion of all those at risk) seems to fall with age and with level of educational attainment. It alsosuggests women were more likely to exit than men.
Total at Risk Exit from ChronicIllness/Disability
At Risk but No Exit
Number of Persons 518 138 380
Number of Observations 1,251 138 1,113
% of Total Observations 100 11.0 89.0
Table 2.4: Exit from Chronic Illness/Disability, Living in Ireland Survey 1995-2001
Gender % Experiencing Exit from Chronic Illness/Disability
Men 9.7
Women 12.4
Age
15-24 20.0
25-34 20.0
35-44 12.4
45-54 13.7
55-64 8.5
65+ 8.5
Education
Primary/None 9.2
Secondary 13.3
Third Level 17.1
Table 2.5: Exit from Chronic Illness/Disability by Selected Characteristics
The Dynamics of Disability and Social Inclusion | 21
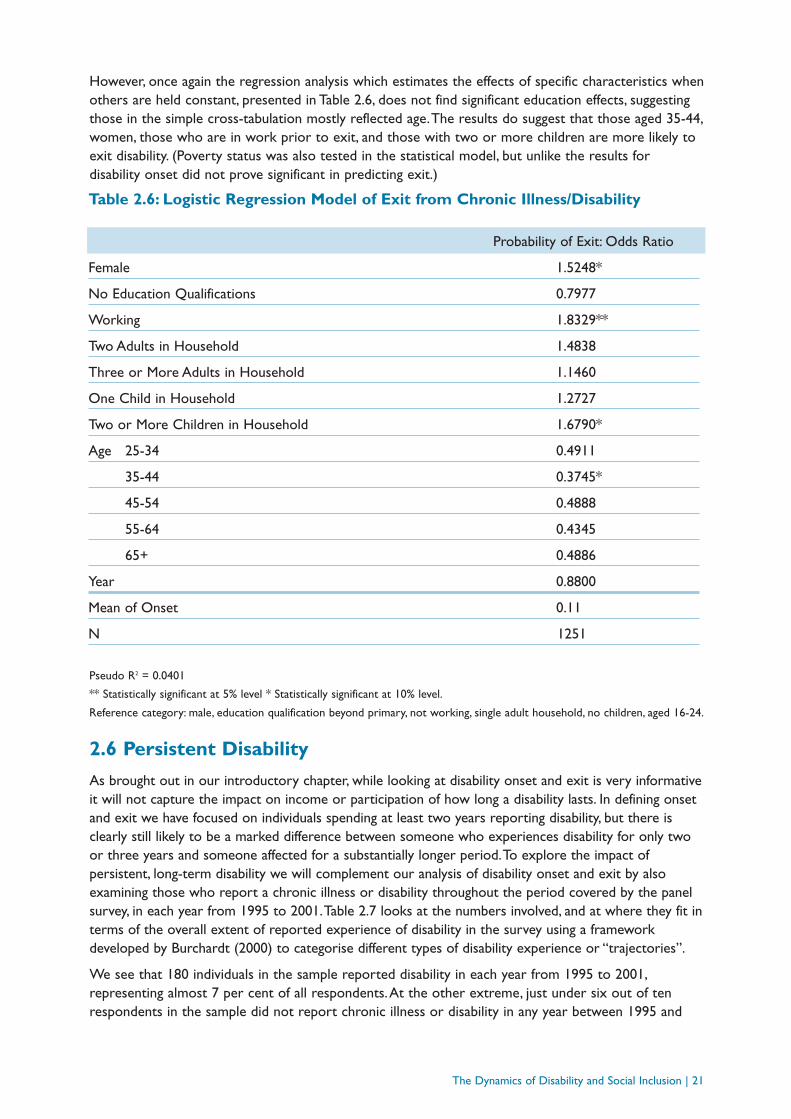
However, once again the regression analysis which estimates the effects of specific characteristics whenothers are held constant, presented in Table 2.6, does not find significant education effects, suggestingthose in the simple cross-tabulation mostly reflected age.The results do suggest that those aged 35-44,women, those who are in work prior to exit, and those with two or more children are more likely toexit disability. (Poverty status was also tested in the statistical model, but unlike the results fordisability onset did not prove significant in predicting exit.)
2.6 Persistent Disability
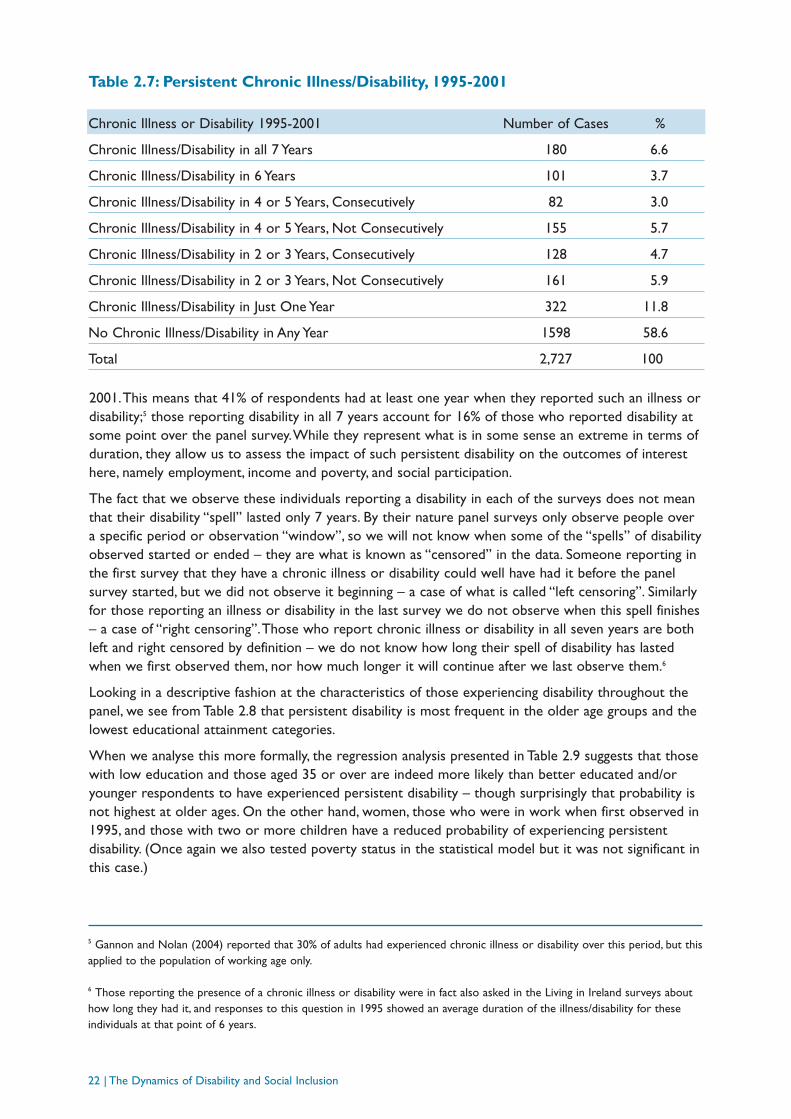
As brought out in our introductory chapter, while looking at disability onset and exit is very informativeit will not capture the impact on income or participation of how long a disability lasts. In defining onsetand exit we have focused on individuals spending at least two years reporting disability, but there isclearly still likely to be a marked difference between someone who experiences disability for only twoor three years and someone affected for a substantially longer period.To explore the impact ofpersistent, long-term disability we will complement our analysis of disability onset and exit by alsoexamining those who report a chronic illness or disability throughout the period covered by the panelsurvey, in each year from 1995 to 2001.Table 2.7 looks at the numbers involved, and at where they fit interms of the overall extent of reported experience of disability in the survey using a frameworkdeveloped by Burchardt (2000) to categorise different types of disability experience or “trajectories”.
We see that 180 individuals in the sample reported disability in each year from 1995 to 2001,representing almost 7 per cent of all respondents.At the other extreme, just under six out of tenrespondents in the sample did not report chronic illness or disability in any year between 1995 and
Probability of Exit: Odds Ratio
Female 1.5248*
No Education Qualifications 0.7977
Working 1.8329**
Two Adults in Household 1.4838
Three or More Adults in Household 1.1460
One Child in Household 1.2727
Two or More Children in Household 1.6790*
Age 25-34 0.4911
35-44 0.3745*
45-54 0.4888
55-64 0.4345
65+ 0.4886
Year 0.8800
Mean of Onset 0.11
N 1251
Table 2.6: Logistic Regression Model of Exit from Chronic Illness/Disability
Pseudo R2 = 0.0401
** Statistically significant at 5% level * Statistically significant at 10% level.
Reference category: male, education qualification beyond primary, not working, single adult household, no children, aged 16-24.
22 | The Dynamics of Disability and Social Inclusion
2001.This means that 41% of respondents had at least one year when they reported such an illness ordisability;5 those reporting disability in all 7 years account for 16% of those who reported disability atsome point over the panel survey.While they represent what is in some sense an extreme in terms ofduration, they allow us to assess the impact of such persistent disability on the outcomes of interesthere, namely employment, income and poverty, and social participation.
The fact that we observe these individuals reporting a disability in each of the surveys does not meanthat their disability “spell” lasted only 7 years. By their nature panel surveys only observe people overa specific period or observation “window”, so we will not know when some of the “spells” of disabilityobserved started or ended – they are what is known as “censored” in the data. Someone reporting inthe first survey that they have a chronic illness or disability could well have had it before the panelsurvey started, but we did not observe it beginning – a case of what is called “left censoring”. Similarlyfor those reporting an illness or disability in the last survey we do not observe when this spell finishes– a case of “right censoring”.Those who report chronic illness or disability in all seven years are bothleft and right censored by definition – we do not know how long their spell of disability has lastedwhen we first observed them, nor how much longer it will continue after we last observe them.6
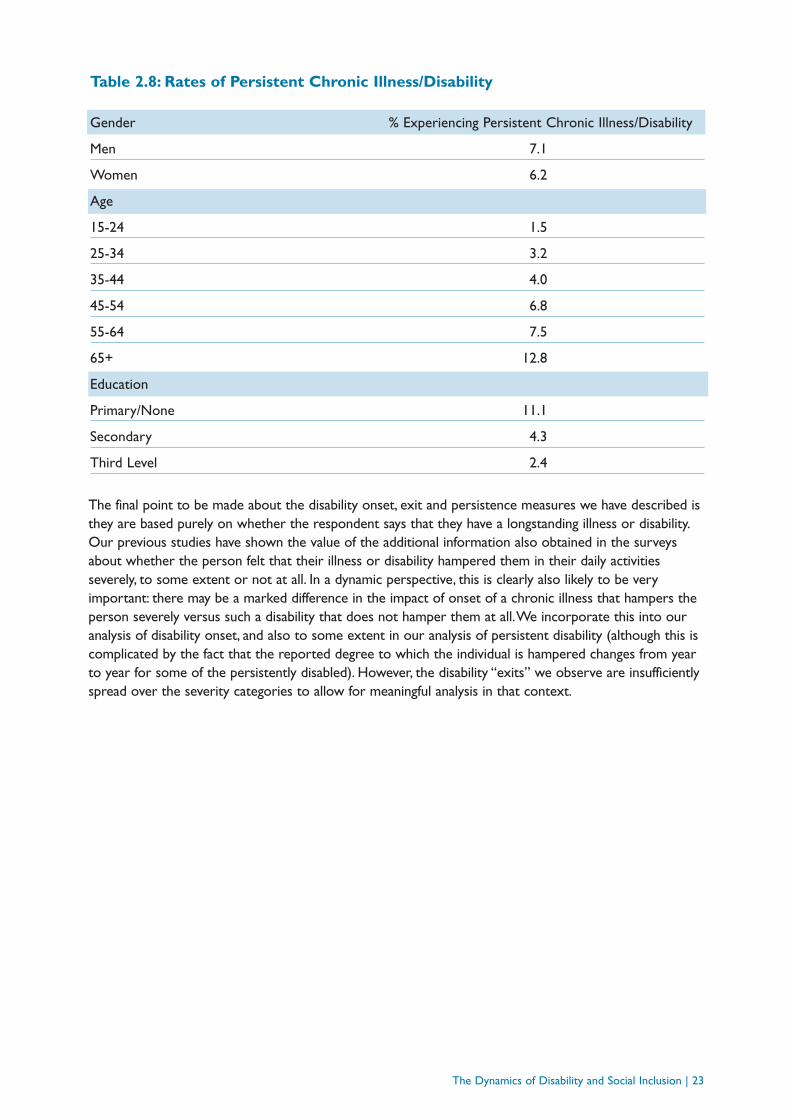
Looking in a descriptive fashion at the characteristics of those experiencing disability throughout thepanel, we see from Table 2.8 that persistent disability is most frequent in the older age groups and thelowest educational attainment categories.
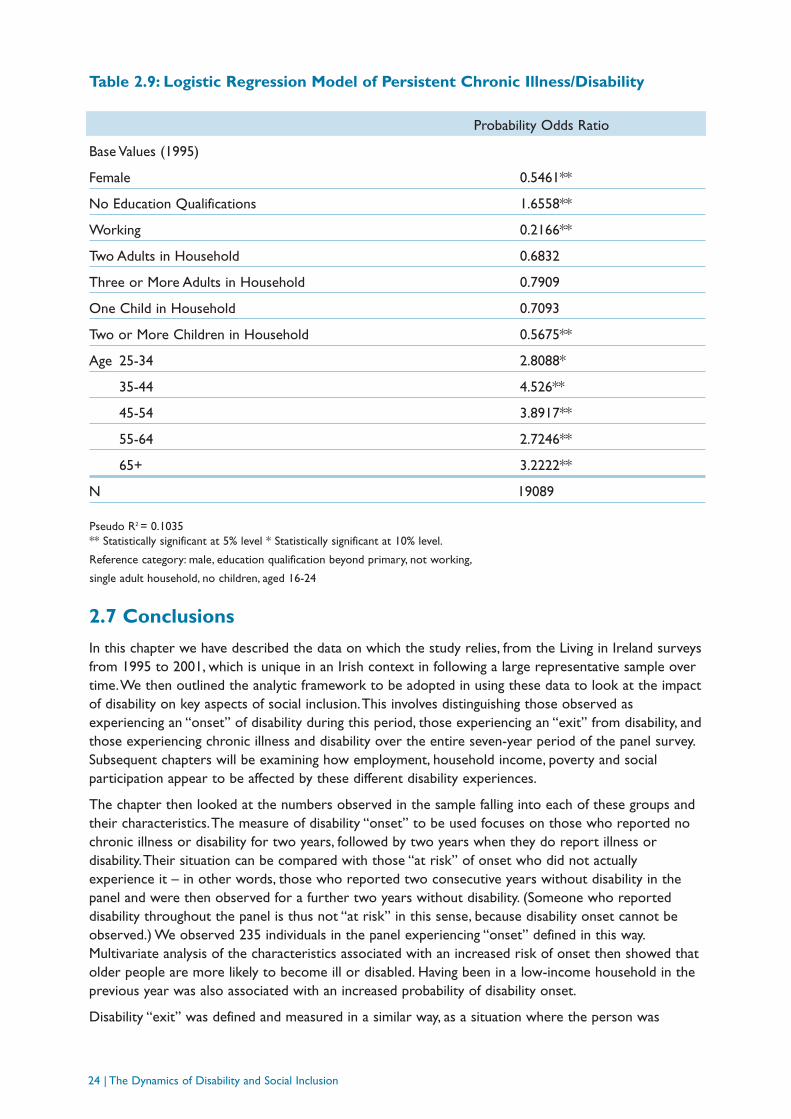
When we analyse this more formally, the regression analysis presented in Table 2.9 suggests that thosewith low education and those aged 35 or over are indeed more likely than better educated and/oryounger respondents to have experienced persistent disability – though surprisingly that probability isnot highest at older ages. On the other hand, women, those who were in work when first observed in1995, and those with two or more children have a reduced probability of experiencing persistentdisability. (Once again we also tested poverty status in the statistical model but it was not significant inthis case.)
5 Gannon and Nolan (2004) reported that 30% of adults had experienced chronic illness or disability over this period, but thisapplied to the population of working age only.
6 Those reporting the presence of a chronic illness or disability were in fact also asked in the Living in Ireland surveys abouthow long they had it, and responses to this question in 1995 showed an average duration of the illness/disability for theseindividuals at that point of 6 years.
Chronic Illness or Disability 1995-2001 Number of Cases %
Chronic Illness/Disability in all 7 Years 180 6.6
Chronic Illness/Disability in 6 Years 101 3.7
Chronic Illness/Disability in 4 or 5 Years, Consecutively 82 3.0
Chronic Illness/Disability in 4 or 5 Years, Not Consecutively 155 5.7
Chronic Illness/Disability in 2 or 3 Years, Consecutively 128 4.7
Chronic Illness/Disability in 2 or 3 Years, Not Consecutively 161 5.9
Chronic Illness/Disability in Just One Year 322 11.8
No Chronic Illness/Disability in Any Year 1598 58.6
Total 2,727 100
Table 2.7: Persistent Chronic Illness/Disability, 1995-2001
The final point to be made about the disability onset, exit and persistence measures we have described isthey are based purely on whether the respondent says that they have a longstanding illness or disability.Our previous studies have shown the value of the additional information also obtained in the surveysabout whether the person felt that their illness or disability hampered them in their daily activitiesseverely, to some extent or not at all. In a dynamic perspective, this is clearly also likely to be veryimportant: there may be a marked difference in the impact of onset of a chronic illness that hampers theperson severely versus such a disability that does not hamper them at all.We incorporate this into ouranalysis of disability onset, and also to some extent in our analysis of persistent disability (although this iscomplicated by the fact that the reported degree to which the individual is hampered changes from yearto year for some of the persistently disabled). However, the disability “exits” we observe are insufficientlyspread over the severity categories to allow for meaningful analysis in that context.
The Dynamics of Disability and Social Inclusion | 23
Gender % Experiencing Persistent Chronic Illness/Disability
Men 7.1
Women 6.2
Age
15-24 1.5
25-34 3.2
35-44 4.0
45-54 6.8
55-64 7.5
65+ 12.8
Education
Primary/None 11.1
Secondary 4.3
Third Level 2.4
Table 2.8: Rates of Persistent Chronic Illness/Disability
24 | The Dynamics of Disability and Social Inclusion
2.7 Conclusions
In this chapter we have described the data on which the study relies, from the Living in Ireland surveysfrom 1995 to 2001, which is unique in an Irish context in following a large representative sample overtime.We then outlined the analytic framework to be adopted in using these data to look at the impactof disability on key aspects of social inclusion.This involves distinguishing those observed asexperiencing an “onset” of disability during this period, those experiencing an “exit” from disability, andthose experiencing chronic illness and disability over the entire seven-year period of the panel survey.Subsequent chapters will be examining how employment, household income, poverty and socialparticipation appear to be affected by these different disability experiences.
The chapter then looked at the numbers observed in the sample falling into each of these groups andtheir characteristics.The measure of disability “onset” to be used focuses on those who reported nochronic illness or disability for two years, followed by two years when they do report illness ordisability.Their situation can be compared with those “at risk” of onset who did not actuallyexperience it – in other words, those who reported two consecutive years without disability in thepanel and were then observed for a further two years without disability. (Someone who reporteddisability throughout the panel is thus not “at risk” in this sense, because disability onset cannot beobserved.) We observed 235 individuals in the panel experiencing “onset” defined in this way.Multivariate analysis of the characteristics associated with an increased risk of onset then showed thatolder people are more likely to become ill or disabled. Having been in a low-income household in theprevious year was also associated with an increased probability of disability onset.
Disability “exit” was defined and measured in a similar way, as a situation where the person was
Table 2.9: Logistic Regression Model of Persistent Chronic Illness/Disability
Pseudo R2 = 0.1035** Statistically significant at 5% level * Statistically significant at 10% level.
Reference category: male, education qualification beyond primary, not working,
single adult household, no children, aged 16-24
Probability Odds Ratio
Base Values (1995)
Female 0.5461**
No Education Qualifications 1.6558**
Working 0.2166**
Two Adults in Household 0.6832
Three or More Adults in Household 0.7909
One Child in Household 0.7093
Two or More Children in Household 0.5675**
Age 25-34 2.8088*
35-44 4.526**
45-54 3.8917**
55-64 2.7246**
65+ 3.2222**
N 19089
The Dynamics of Disability and Social Inclusion | 25
observed in the panel reporting two consecutive years with a disability followed by two years withoutsuch a disability.They can be compared with those “at risk” of exit who do not experience it – thosereporting disability for two years in a row but not then reporting two disability-free years.The numberof cases observed with a disability “exit” defined in this way was 138.Among all those “at risk”, womenand those in work (prior to exit) seemed more likely than others to report exiting disability.
The final group to be studied is those reporting persistent illness/disability over the seven years of thepanel survey.A total of 180 cases had that experience, accounting for 7% of all respondents and 16%of those who reported disability at any point over the life of the survey.Those experiencing persistentdisability were seen to be disproportionately male, older and poorly educated.
We go on in the rest of the study to examine the relationship between these disability experiencesand key socio-economic outcomes, starting in the next chapter with employment.

26 | The Dynamics of Disability and Social Inclusion
3
THE DYNAMICS OF DISABILITY AND WORK
3.1 Introduction
Our aim in this chapter is to make use of the dynamic information in relation to disability onset, exitand persistence to deepen our understanding of the impact of disability on paid work among those ofworking age. Cross-sectional analysis has shown that those reporting a chronic illness or disability aremuch less likely to be in employment than those who say they have no such illness or disability.Gannon and Nolan (2004a) found that about 40% of those reporting a longstanding/chronic illness ordisability and of working age in the Living in Ireland Survey were in employment, with the remaindermostly not active in labour force (rather than unemployed).This compared with an employment rateof close to 70% for those not reporting such an illness or disability. Other data sources such as theCensus of Population and the Quarterly National Household Survey also show people with disabilitieshaving much lower employment rates than others (see also NDA, 2005).
Very much the same picture is seen if we use the full information obtained over the life of the panelfrom 1995-2001 to capture the cross-sectional relationship between disability and employment. If welook over the full dataset at the labour market status of an individual when he or she was reportingthe presence of chronic illness or disability, we find that 42% of those reporting illness/disability werein employment at that time, and more than half were inactive in labour force terms, with only 5%unemployed. By contrast, the employment rate was 69% for those not then reporting chronic illness or disability.
However, some key points must be kept in mind in interpreting this cross-sectional pattern for peoplewith disabilities. Not all of that difference in employment rates may be attributable to the presence orabsence of disability per se, because those who report disability may also have other characteristics thatdisadvantage them in the labour market – for example in terms of age, gender, education and skills, orgeographic location. Interpretation is further complicated by the fact that some of those otherdisadvantages may themselves sometimes have been affected by the presence of a long-standingdisability – for example, the level of education and skills acquired. Finally, what matters in terms oflabour market outcomes is not so much whether a disability is present or not, but the extent to whicha disability restricts the individual in their activities and the way it is perceived in the labour market.
One can take these complexities into account to a certain degree in carrying out analysis of cross-sectional data, notably by incorporating other relevant characteristics of individuals into statisticalmodels aimed at explaining or predicting the likelihood that an individual will be in employment.Gannon and Nolan (2004a, b) carried out this type of analysis taking the severity as well as thepresence of chronic illness or disability into account, and incorporating age, gender, educational
The Dynamics of Disability and Social Inclusion | 27
attainment, family composition and location into the estimated statistical model.The results showedthat those reporting a longstanding/chronic illness or disability that hampers them in their dailyactivities or restricts the kind of work they can do have a significantly reduced probability ofparticipating in the paid labour force. For men who report being severely hampered or restricted, thatreduction is as much as 60 percentage points or more, while for women it is about 50 percentagepoints. For those who report being hampered or restricted “to some extent” rather than severely theeffect is much smaller but still substantial. On the other hand, for those reporting alongstanding/chronic illness or disability that did not hamper or restrict them, the probability of beingin the labour force was similar to others of the same age, gender and educational attainment and notreporting any such condition.
With cross-sectional data it is however difficult to be sure that one has adequately taken into accountthe influence of other factors and thus reliably identified the impact of disability itself. It is also hard toidentify the specific channels of influence or causal mechanisms through which this impact comesabout.That is why, as explained in the introductory chapter, information on an individual over timeallows the analysis of the impact of disability to be deepened.The longitudinal data in the Living inIreland survey was in fact exploited to some extent in Gannon and Nolan (2004a) to look at disabilityand labour force participation over time rather than in a single snap-shot.The number of years ofchronic illness or disability reported over the life of the panel, and the pattern of disability trajectories,was described for adults of working age only, the base population of relevance in the context of labourforce participation. Gannon and Nolan (2004a) went on to find a stark difference in labour forceparticipation between those reporting a chronic illness or disability throughout the life of the paneland those not reporting chronic illness or disability. On average, those reporting chronic illness ordisability consistently over the seven years 1995-2001 spent only 1.6 years in work over the period,whereas those who never reported such an illness or disability spent 3.5 of the years in work.Trackingindividuals from before the onset of disability through the period of onset and beyond, a substantialand sustained decline in their employment rate was also seen.This was not however investigated byestimation of an appropriate statistical model to control for other factors, nor was disability exitincluded in the analysis.
The aim of this chapter is to build on those results to deepen the dynamic analysis of disability andlabour force participation. It builds on our previous work by carrying out a more in-depth statisticalinvestigation of the impact of disability onset and persistent disability, by incorporating disability exit,and by extending the period of analysis as data for 2001 is now available. Given its focus on labourforce participation it is confined to adults of working age, whereas in other chapters all those aged 16or over are included in the analysis.We start in Section 3.2 by comparing the labour forceparticipation of persons reporting an onset of disability with those who were at risk but did notexperience onset.We then look in Section 3.3 at participation rates for those who “exit” from a spellof chronic illness or disability. Section 3.4 focuses on the labour force situation of those who reportedpersistent disability over the course of the panel survey. Finally the conclusions from the analysis aresummarised in Section 3.5.
3.2 Disability “Onset” and Employment
We begin our dynamic analysis by looking at what happens to labour force participation when theonset of disability is observed. Specifically, we look at the labour force status of those who areobserved over the life of the panel to have an onset of disability using the restricted definition adoptedby Jenkins and Rigg and discussed in Chapter 2 – in other words, people who are observed in thepanel for two years in a row not reporting a chronic illness or disability, and then for a further twoyears reporting such an illness or disability.Table 3.1 shows the labour force status of such individualsin the year before the onset of illness/disability, in the year of onset, and in the year following onset ofthe illness/disability.

We see that around 60% of those who become ill or disabled were in employment in the year beforeonset.Their employment rate falls to about 46% in the year of onset of the illness or disability. Oneyear after onset the employment rate remains well below what it was before the onset of chronicillness or disability, and the inactivity rate is over half compared with one-third before onset.Theseresults are broadly similar to those presented in Gannon and Nolan (2004a) using data from 1995 to1999, but can be taken with more confidence because they are based on a greater number of cases inthe longer panel now available.7
These figures, although still based on only a relatively small number of cases in the data, certainly suggestthat onset of disability is indeed associated with a substantial decline in the employment rate.Two furtherpoints are worth noting about the level of their employment rate before and after onset.The first is thateven before onset their employment rate was below the overall average, at about 60% rather than 70%.Secondly, though, their employment rate in the year after onset, at just over 40%, is as low as the overallaverage for all those reporting chronic illness or disability, which will include some people who have beenin that situation for much longer (as well as some only reporting it for the first time). So loosely speaking,in terms of the 40%-70% contrast in employment rates between those with versus without a disabilityhighlighted earlier, for these individuals about two-thirds of that gap seems to be reasonably attributableto the onset of disability and the fact that it has lasted at least over two waves of the panel; the remainingone-third of the gap is then attributable to “selection effects” – the pre-existing labour marketdisadvantages that these individuals had, in terms of education etc., before onset.
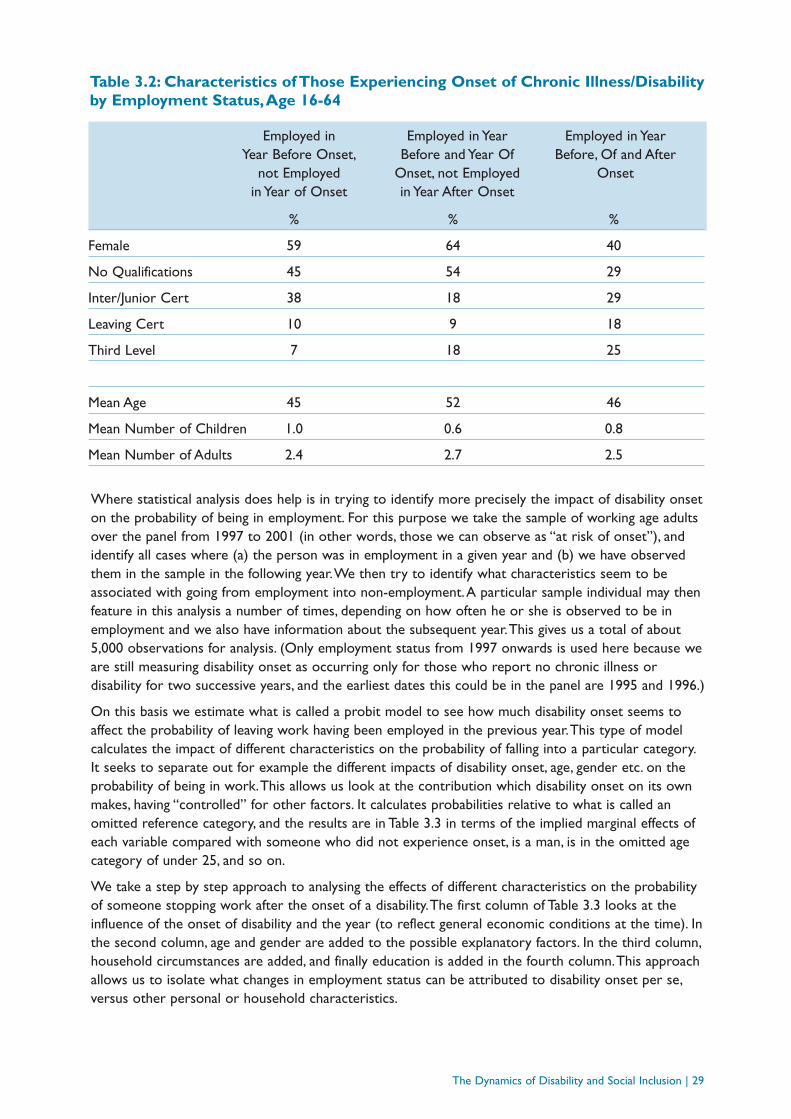
It is particularly interesting to know what distinguishes the people who leave employment followingonset of a chronic illness or disability from those who do not, so we look at their profiles in terms ofsome key characteristics.Table 3.2 compares the profile of those who leave employment in the year ofonset, those who remain employed in the year of onset but have left by the following year, and thosewho remained in employment throughout.We see that women and persons with low levels ofeducational qualifications constitute a much higher proportion of those who leave employment than ofthose who do not. On the other hand the groups are not markedly different in terms of age or familycomposition. Unfortunately the sample sizes in these different groups are not large enough to supporta formal statistical analysis to see whether these suggestive differences are in fact significant instatistical terms.
28 | The Dynamics of Disability and Social Inclusion
1 Year Before Onset
Year of Onset OfChronic Illness/Disability
Year After Onset
% % %
Employed 61.4 46.4 42.8
Unemployed 4.8 4.2 4.8
Inactive 33.7 49.4 52.4
Number of cases = 166
Table 3.1: Labour Force Participation for Those With Onset of Disability,Age 16-64,Living in Ireland Surveys, 1995-2001
7 See Gannon and Nolan (2204a) Table 7.8, p. 50.individuals at that point of 6 years.
The Dynamics of Disability and Social Inclusion | 29
Where statistical analysis does help is in trying to identify more precisely the impact of disability onseton the probability of being in employment. For this purpose we take the sample of working age adultsover the panel from 1997 to 2001 (in other words, those we can observe as “at risk of onset”), andidentify all cases where (a) the person was in employment in a given year and (b) we have observedthem in the sample in the following year.We then try to identify what characteristics seem to beassociated with going from employment into non-employment.A particular sample individual may thenfeature in this analysis a number of times, depending on how often he or she is observed to be inemployment and we also have information about the subsequent year.This gives us a total of about5,000 observations for analysis. (Only employment status from 1997 onwards is used here because weare still measuring disability onset as occurring only for those who report no chronic illness ordisability for two successive years, and the earliest dates this could be in the panel are 1995 and 1996.)
On this basis we estimate what is called a probit model to see how much disability onset seems toaffect the probability of leaving work having been employed in the previous year.This type of modelcalculates the impact of different characteristics on the probability of falling into a particular category.It seeks to separate out for example the different impacts of disability onset, age, gender etc. on theprobability of being in work.This allows us look at the contribution which disability onset on its ownmakes, having “controlled” for other factors. It calculates probabilities relative to what is called anomitted reference category, and the results are in Table 3.3 in terms of the implied marginal effects ofeach variable compared with someone who did not experience onset, is a man, is in the omitted agecategory of under 25, and so on.
We take a step by step approach to analysing the effects of different characteristics on the probabilityof someone stopping work after the onset of a disability.The first column of Table 3.3 looks at theinfluence of the onset of disability and the year (to reflect general economic conditions at the time). Inthe second column, age and gender are added to the possible explanatory factors. In the third column,household circumstances are added, and finally education is added in the fourth column.This approachallows us to isolate what changes in employment status can be attributed to disability onset per se,versus other personal or household characteristics.
Employed in Year Before Onset,
not Employed in Year of Onset
Employed in YearBefore and Year Of
Onset, not Employed in Year After Onset
Employed in YearBefore, Of and After
Onset
% % %
Female 59 64 40
No Qualifications 45 54 29
Inter/Junior Cert 38 18 29
Leaving Cert 10 9 18
Third Level 7 18 25
Mean Age 45 52 46
Mean Number of Children 1.0 0.6 0.8
Mean Number of Adults 2.4 2.7 2.5
Table 3.2: Characteristics of Those Experiencing Onset of Chronic Illness/Disabilityby Employment Status,Age 16-64
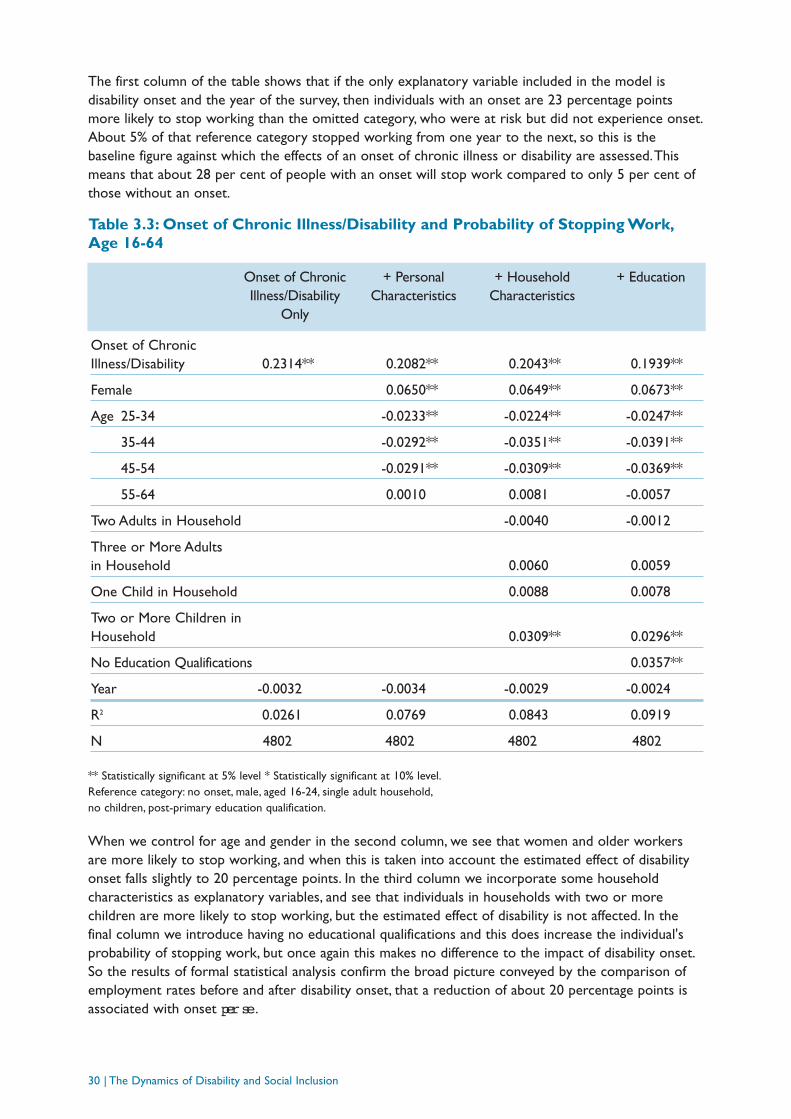
The first column of the table shows that if the only explanatory variable included in the model isdisability onset and the year of the survey, then individuals with an onset are 23 percentage pointsmore likely to stop working than the omitted category, who were at risk but did not experience onset.About 5% of that reference category stopped working from one year to the next, so this is thebaseline figure against which the effects of an onset of chronic illness or disability are assessed.Thismeans that about 28 per cent of people with an onset will stop work compared to only 5 per cent ofthose without an onset.
When we control for age and gender in the second column, we see that women and older workersare more likely to stop working, and when this is taken into account the estimated effect of disabilityonset falls slightly to 20 percentage points. In the third column we incorporate some householdcharacteristics as explanatory variables, and see that individuals in households with two or morechildren are more likely to stop working, but the estimated effect of disability is not affected. In thefinal column we introduce having no educational qualifications and this does increase the individual'sprobability of stopping work, but once again this makes no difference to the impact of disability onset.So the results of formal statistical analysis confirm the broad picture conveyed by the comparison ofemployment rates before and after disability onset, that a reduction of about 20 percentage points isassociated with onset per se.
30 | The Dynamics of Disability and Social Inclusion
Table 3.3: Onset of Chronic Illness/Disability and Probability of Stopping Work,Age 16-64
Onset of ChronicIllness/Disability
Only
+ PersonalCharacteristics
+ HouseholdCharacteristics
+ Education
** Statistically significant at 5% level * Statistically significant at 10% level.Reference category: no onset, male, aged 16-24, single adult household,no children, post-primary education qualification.
Onset of Chronic Illness/Disability 0.2314** 0.2082** 0.2043** 0.1939**
Female 0.0650** 0.0649** 0.0673**
Age 25-34 -0.0233** -0.0224** -0.0247**
35-44 -0.0292** -0.0351** -0.0391**
45-54 -0.0291** -0.0309** -0.0369**
55-64 0.0010 0.0081 -0.0057
Two Adults in Household -0.0040 -0.0012
Three or More Adults in Household 0.0060 0.0059
One Child in Household 0.0088 0.0078
Two or More Children in Household 0.0309** 0.0296**
No Education Qualifications 0.0357**
Year -0.0032 -0.0034 -0.0029 -0.0024
R2 0.0261 0.0769 0.0843 0.0919
N 4802 4802 4802 4802

The Dynamics of Disability and Social Inclusion | 31
As noted in Chapter 2, it is not only the presence but also the severity of a chronic illness or disabilitythat may be critical in determining its impact.We can examine this by replacing the variable capturingdisability onset with three variables, for onset of a chronic illness or disability that hampers the personin their daily activities severely, to some extent, or not at all (as reported by the individual in the year ofonset).The results show that those reporting onset but not hampered in daily activities have a lowerprobability of working by 10 percentage points, compared to those without an onset of chronic illnessor disability. For those who are hampered severely or to some extent by the chronic illness or disability,the percentage predicted to be working is much lower; the predicted impact of onset of a hamperingdisability is now a reduction of the order of 30 percentage points, controlling for other factors.
As well as the individual's own characteristics and their household composition, it might well be thatthe economic circumstances in which they find themselves affect whether they stay in employmenthaving experienced onset of disability. In particular, being in a disadvantaged household before onsetmay affect the relationship between disability onset and employment.We tested for such an effect byincluding as an additional explanatory variable whether in the year before onset the person was in ahousehold falling below 60% of median income, which as we discuss in the next chapter is acommonly-used poverty threshold.The results show that coming from such a household does increasethe likelihood that the person will stop working after disability onset, by about 7 percentage points.(Inclusion of this variable leaves the estimated coefficient on the onset variable itself unchanged).
If the likelihood of being in work declines substantially when disability onset occurs, It is also clearly ofinterest to look at what happens when someone who has been reporting a chronic illness or disabilitystops doing so – does their employment rate go back up? In the next section we turn to exit fromdisability and the probability of being in work.
3.3 Disability “Exit” and Employment
We are now interested in persons for whom we observe the ending of a spell of chronic illness ordisability, and as explained earlier, focus for this purpose on individuals who reported a chronic illnessor disability for two years and then reported no such illness or disability for the next two years.Wefound there were 72 such cases in the sample aged under 65, and Table 3.4 shows the employmentrate for these people in the year before disability “exit”, the year of exit, and the following year.
Exactly 50 per cent were employed when they were reporting the chronic illness or disability.Thisrose to 58 per cent in the year they stopped reporting such an illness or disability, and was slightlylower in the next year.The numbers involved are however small.
Year Before Exit Year of Exit fromChronic Illness/Disability
Year After Exit
% % %
Employed 50.0 58.3 56.2
Unemployed 7.3 5.2 6.3
Inactive 42.7 36.5 37.5
Number of cases = 72
Table 3.4: Labour Force Participation for those Exiting from ChronicIllness/Disability,Age 16-64

32 | The Dynamics of Disability and Social Inclusion
We then apply a statistical model of the probability of being in work for the entire sample of individualswho had a chronic illness or disability for the previous two years.The results in Table 3.5 show thatthose who exit disability are 10 percentage points more likely to be in work than those at risk who donot exit.When we enter additional explanatory variables to control for other factors such as age,gender, and household size and composition, the effect of exiting disability falls but remains statisticallysignificant. However, when whether the person has post-primary educational qualifications is alsoentered, the effect of exiting disability is no longer significant.This implies that those exiting disabilityhave other characteristics – notably educational attainment levels – that make it easier for them to findor stay in work that those who do not exit. (We would also like to have distinguished the impact ofexit from a hampering versus non-hampering disability, but the number of cases available and theirdistribution across the severity categories did not allow this to be done reliably.)
So far in this chapter we have used the panel data to look at what happens to employment whentransitions in disability status are observed, but the panel also allows us to follow those who have achronic illness or disability throughout the period, and their labour market participation is the subjectof the next section.
Table 3.5: Exit from Chronic Illness/Disability and Probability of Being in Work,Aged 16-64
Exit from ChronicIllness/Disability
Only
+ PersonalCharacteristics
+ HouseholdCharacteristics
+ Education
** Statistically significant at 5% level * Statistically significant at 10% level.Reference category: no exit, male, aged 16-24, single adult household,no children, post-primary education qualification.
Exit from Chronic Illness/Disability 0.1039** 0.0723** 0.0693* 0.0574
Female -0.0372 -0.0263 -0.0371
Age 25-34 -0.0819** -0.0778** -0.0688**
35-44 -0.1093** -0.1045** -0.0932**
45-54 -0.1871** -0.1991** -0.1611**
55-64 -0.3434** -0.3654** -0.3162**
Two Adults in Household -0.0218 -0.0295
Three or More Adults 0.0282 0.0154in Household
One Child in Household -0.0485* -0.0471*
Two or More Children 0.0217 0.0214in Household
No Education Qualifications -0.0676**
Year -0.0247** -0.0097 -0.0087 -0.0092
Pseudo R2 0.0273 0.1950 0.2276 0.2510
N 488 488 488 488
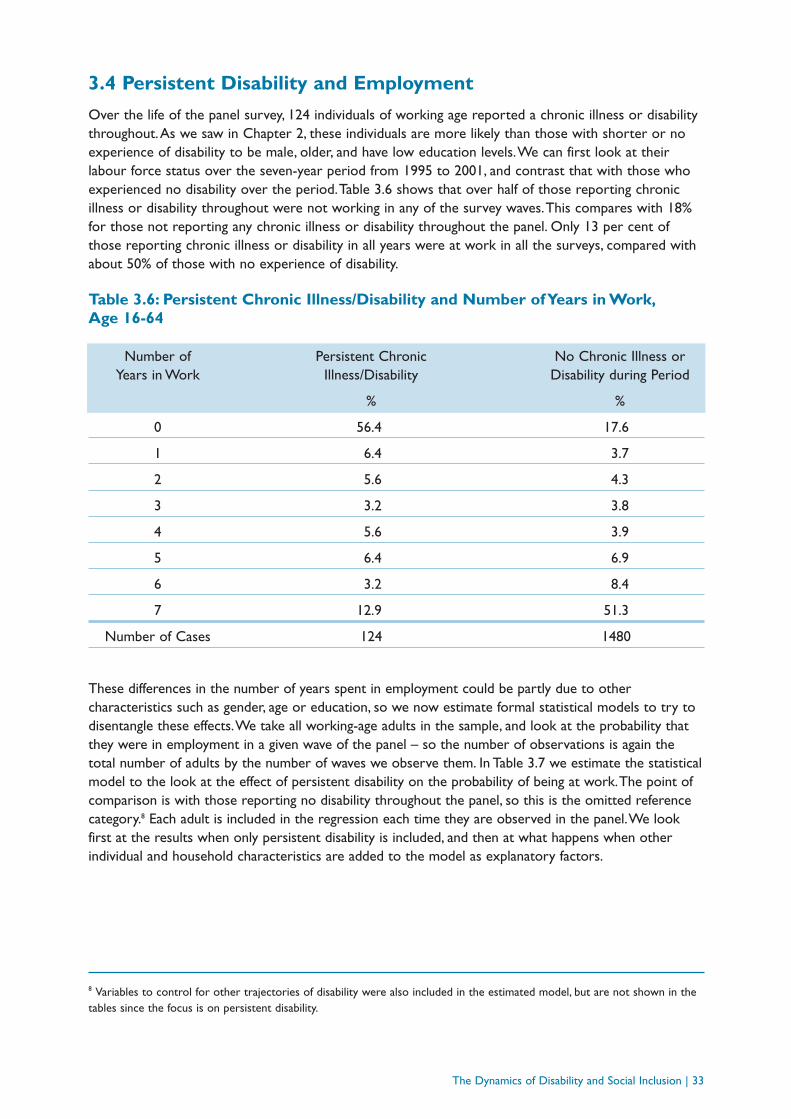
3.4 Persistent Disability and Employment
Over the life of the panel survey, 124 individuals of working age reported a chronic illness or disabilitythroughout.As we saw in Chapter 2, these individuals are more likely than those with shorter or noexperience of disability to be male, older, and have low education levels.We can first look at theirlabour force status over the seven-year period from 1995 to 2001, and contrast that with those whoexperienced no disability over the period.Table 3.6 shows that over half of those reporting chronicillness or disability throughout were not working in any of the survey waves.This compares with 18%for those not reporting any chronic illness or disability throughout the panel. Only 13 per cent ofthose reporting chronic illness or disability in all years were at work in all the surveys, compared withabout 50% of those with no experience of disability.
These differences in the number of years spent in employment could be partly due to othercharacteristics such as gender, age or education, so we now estimate formal statistical models to try todisentangle these effects.We take all working-age adults in the sample, and look at the probability thatthey were in employment in a given wave of the panel – so the number of observations is again thetotal number of adults by the number of waves we observe them. In Table 3.7 we estimate the statisticalmodel to the look at the effect of persistent disability on the probability of being at work.The point ofcomparison is with those reporting no disability throughout the panel, so this is the omitted referencecategory.8 Each adult is included in the regression each time they are observed in the panel.We lookfirst at the results when only persistent disability is included, and then at what happens when otherindividual and household characteristics are added to the model as explanatory factors.
The Dynamics of Disability and Social Inclusion | 33
8 Variables to control for other trajectories of disability were also included in the estimated model, but are not shown in thetables since the focus is on persistent disability.
Number of Persistent Chronic No Chronic Illness orYears in Work Illness/Disability Disability during Period
% %
0 56.4 17.6
1 6.4 3.7
2 5.6 4.3
3 3.2 3.8
4 5.6 3.9
5 6.4 6.9
6 3.2 8.4
7 12.9 51.3
Number of Cases 124 1480
Table 3.6: Persistent Chronic Illness/Disability and Number of Years in Work,Age 16-64

34 | The Dynamics of Disability and Social Inclusion
We see in the first column that persistent disability has a marked impact on the probability of being inwork, reducing it by 42 percentage points compared with the reference category, of whom 70% werein employment in a given wave.This means that for those who always reported a disability, thepredicted employment rate is only 28% (that is, 70%-42%). Controlling for age and gender (in column2) actually increases the estimated effect of persistent disability, but when household characteristicsand the individual's education levels are included (in columns 3 and 4) that effect falls back again toabout the level seen without any controls. So the impact of persistent disability throughout the panelsurvey on the likelihood of being in work is very substantial indeed.9
Capturing the severity of persistent disability for the persistently disabled using the reported extent towhich the individual was hampered was not straightforward, since those reports proved quite variablefrom one year to the next. However, when the degree to which the person was hampered in amajority of the seven years or in the final year was included in the model it proved highly significant,with those hampered severely least likely to be in employment and a lower but still marked effect forthose hampered to some extent.
Table 3.7: Persistent Chronic Illness/Disability and Probability of Being in Work,Age 16-64
Persistent ChronicIllness/Disability
+ PersonalCharacteristics
+ HouseholdCharacteristics
+ Education
** Statistically significant at 5% level * Statistically significant at 10% level.Reference category: no disability, male, aged 16-24, single adult household,no children, post-primary education qualification.
Persistent Chronic Illness/Disability -0.4190** -0.4695** -0.4387** -0.4138**
Female -0.3547** -0.3715** -0.3808**
Age 25-34 0.0984** 0.0987** 0.1181**
35-44 0.0586** 0.0789** 0.1052**
44-54 -0.0165 -0.0121 0.0348
55-64 -0.2433** -0.2712** -0.2008**
Two Adults in Household -0.0183 -0.0301
Three or More Adults -0.0546 -0.0558in Household
One Child in Household -0.0013 0.0025
Two or More Children -0.0573** -0.0523**in Household
Poor in Previous Year -0.3858** -0.3561**
No Education Qualifications -0.1403**
Year 0.0213** 0.0279** 0.0281** 0.0260**
N 15332 15332 15321 15321
R2 0.0422 0.1780 0.2366 0.2460
9 Note that in looking at the impact of disability Gannon and Nolan (2004a) looked at the employment rate in 2000 of thosewho had experienced persistent disability, whereas here we have incorporated employment over the entire period from 1995to 2001.
The Dynamics of Disability and Social Inclusion | 35
3.5 Conclusions
When observed at a point in time, about 40% of those reporting a longstanding/chronic illness or disabilityand of working age in the Living in Ireland Survey were in employment and 5% were unemployed, with theremainder not active in labour force; by contrast, almost 70% of those not reporting such a chronic illnessor disability were in employment.This chapter has sought to deepen our understanding of thesedifferences by looking at the employment status of people with a chronic illness or disability over time. Itbuilds on our previous work by carrying out a more in-depth statistical investigation of the impact ofdisability onset and persistent disability, by incorporating disability exit, and by extending the period ofanalysis as more data is now available.
We first examined what happens to employment when we see an individual in the panel survey movingfrom not reporting a chronic illness or disability to reporting such an illness or disability – what wedefined in earlier chapters as disability “onset”.We found that only about 60% of those we seeexperiencing onset were employed before that happened – these individuals were already more prone tounemployment and inactivity than others before onset.When disability onset then occurs, the employmentrate for these individuals fell from 60% to 46%, and in the year after onset this fell a little more to 43%.
Statistical analysis of these individuals then showed that, having taken a range of personal and householdcharacteristics into account, the onset of disability was associated with a decline of about 20 percentagepoints in the probability of being active in the labour force. However, where the chronic illness or disabilitydoes not hamper the person in their daily activities it was seen to have an impact of about 10% points,bringing down the estimated overall effect of onset.This means that where the chronic illness or disabilitydoes hamper the person in their daily activities, the estimated reduction in the probability of being inemployment is closer to 30 percentage points.Those already in low-income households were more likelyto move from being active to inactive, as were women, those with two or more children, and those withlow levels of education.
Again exploiting the dynamic nature of the data, we then focused on those observed in the panel “exiting”chronic illness or disability.We found that for someone who is observed for at least two years reporting achronic illness or disability and then two years not reporting such an illness or disability their employmentrate rose on “exit”, from about 50% to 58%. Statistical analysis of these individuals suggested that exitingdisability was associated with an increase of about 7 percentage points in the probability of being inemployment, having controlled for personal and household characteristics, but when the person's level ofeducation was also included in the model this effect became statistically insignificant.We were not able todistinguish the impact of hampering versus non-hampering disability in the case of exits.
Finally, we saw that persistent disability – reporting chronic illness or disability throughout the sevenyears of the panel survey – was associated with a greatly reduced likelihood of being in employment.Only 13% of these individuals were in employment throughout the period.When a range of personaland household characteristics was taken into account, such persistent disability was shown bystatistical analysis to be associated with a 42 percentage point reduction in the likelihood of being inemployment.The scale of the effect was seen to be associated with the extent to which the individualreported being hampered by the disability.
These findings deepen our knowledge and understanding of the impact of disability on employment.They complement the evidence from previous research about the impact of persistent disability in theprobability of being in work. Furthermore, they quantify the impact of disability onset on thatprobability, having taken other characteristics of the individual and their household into account.Theyshow that not only persistent disability but also disability onset are associated with a very substantialreduction in the likelihood that someone will be in employment.This poses a major challenge forpolicy in relation to tackling the many-faceted barriers to obtaining and maintaining employment thatface people with disabilities.
4
THE DYNAMICS OF DISABILITY, HOUSEHOLDINCOME AND POVERTY
4.1 Introduction
In the previous chapter we saw that onset of disability significantly reduces the probability of staying inwork, and that people experiencing persistent disability spend much less time in work and are lesslikely to be working than others. One would expect this to have consequences for their incomes fromwork, and for their overall household incomes even taking replacement of lost earnings by socialwelfare into account.This in turn would affect their poverty status, increasing the probability ofentering poverty or remaining in that situation. In this chapter we explore these potentialconsequences of disability from a dynamic perspective, once again exploiting the panel nature of theLiving in Ireland survey.We now include in our analysis not only those of working age but all adults inthe sample.
In analysing household income, we focus on income after direct tax and social insurance contributions,in other words disposable income.To take differences in household size and composition into account,we adjust the income of the household for the number of adults and children depending on it by theuse of what are known as equivalence scale.The particular scale we employ here assigns a value of 1to the first adult in the household, 0.66 to each other adult, and 0.33 to each child: so a couple withtwo children “need” an income 2.32 times that of a single-adult household to reach the same standardof living.The income of the household is then scaled by the appropriate weight for the household'scomposition, to convert it to the equivalent for a single adult. It is assumed that all individuals in thehousehold enjoy the living standard attributed to the household in this way. In analysing poverty wealso rely on the income of the household, looking at whether it falls below relative income povertythresholds – described in more detail at the appropriate point below.
To put our dynamic analysis into context, it is worth looking first at the cross-sectional gap in averagehousehold income between those currently reporting versus not reporting chronic illness or disability,over the whole period covered by the panel survey.Average income for those reporting chronic illnessor disability turns out to be only 80% of the corresponding figure for those not reporting such adisability, and there is an even larger gap between median incomes10 for the two groups.To see what lightdynamic analysis can throw on this we first investigate household income for those experiencing onset of
36 | The Dynamics of Disability and Social Inclusion
10 The median is the value where half fall above and half below.

The Dynamics of Disability and Social Inclusion | 37
disability, exit from disability, and chronic illness or disability throughout the panel, in Sections 4.2-4.4respectively. Section 4.5 focuses, for each of these different experiences of disability, on whether thehousehold falls below conventional income poverty lines. Conclusions are summarised in Section 4.6.
4.2 Disability “Onset” and Household Income
We begin by exploring the relationship between disability onset and household income, using themeasure of onset described in previous chapters and the detailed information about income obtainedin the surveys. Income from various sources – employment, self-employment, rent interest anddividends, private pensions and social welfare pensions of various sorts – received by each member ofthe household is sought, with the period covered being the most recent pay period – usually last weekor month – for most income sources.11 Weekly household income after income tax and employeesocial insurance contributions is then calculated and is the measure used.
Table 4.1 presents the average weekly household income of those reporting the onset of a chronicillness or disability in the year before onset, at the time of onset, and one year after onset (when theperson still is reporting disability, since we are using the two-year onset definition). Incomes reportedin earlier years of the panel are not directly comparable in purchasing power terms with thosereported in later years because prices had increased in the meantime, so all monetary values havebeen deflated to 1995 values.We have also converted to euro amounts for convenience, though thefigures reported in the surveys were of course in IR£.We see that mean weekly net householdequivalised income fell by 5% in the year of onset, but increases in the year after onset so much that itis actually higher than before onset.
We now employ more formal statistical methods to assess the relationship between disability onset andhousehold income, including in the analysis not just those who experienced onset but also those whowere “at risk of onset” but did not experience it.These represent a particularly valuable point ofcomparison for our onset group, because the actual change in income over time for the latter could beaffected by factors other than disability (including trends in the economy), we cannot simply attribute it todisability onset. Since those other factors would also be expected to affect the comparison group,including them should allow us to distinguish more accurately the impact of onset per se.
Table 4.2 shows the results from estimating a probit model explaining or predicting household incomeamong those at risk of disability onset, first simply in terms of whether disability onset actually occurs, andthen adding in the range of socio-economic characteristics employed in previous chapters.We see thatwhen no other variables are included, disability onset is a significant predictor of a decline in weeklyhousehold income – that is, comparing weekly income in the survey when a chronic illness is first
Year Before Onset Year of Onset ofChronic Illness/Disability
Year After Onset
Table 4.1: Mean Equivalised Household Weekly Net Income and Onset of ChronicIllness/Disability,Age 16+, Living in Ireland Surveys
Note: Income at constant 1995 values
Mean Equivalised Household Income (€) 192.72 183.12 201.25
Number of Cases = 234
11 For self-employment income, income over the previous year is generally sought in the survey and the weekly averagecalculated, since income from this source can vary a great deal from week to week.

38 | The Dynamics of Disability and Social Inclusion
reported with weekly income at the time of the previous survey.When individual and householdcharacteristics are included the estimated effect of onset on income is reduced by about one-third but isstill highly significant. In scale, it means that predicted household income in the year of onset is about 15%lower than it would otherwise be, taking the characteristics of the individual and his or her household into
account.Once again it is useful to distinguish amongst those experiencing onset by the severity of the disabilitythey report.These results (not shown in the table) suggest that onset of a severely hampering disabilityhas a much more substantial impact than one that is hampering “to some extent”, but that the latter isstill associated with a decline in household income, whereas onset of a non-hampering disability is notaccompanied by such a decline compared with those who do not experience onset.Thoseexperiencing onset of a disability that hampers them to some extent face a predicted reduction ofabout 15% in income compared with those with no onset, whereas for those severely hampered thepredicted scale of the reduction is about twice that size.
Household income could be lower for those experiencing disability onset for a variety of reasons. Firstand most obviously, relating back to Chapter 3, some of those affected will move from employment tonon-employment. Secondly, though, even when we focus on those experiencing onset who remain inemployment, their average weekly earnings decline by over one-third with onset.This seems to bemostly due to a decline in hours worked, though there is also some decline in their average hourly
Table 4.2: Onset of Chronic Illness/Disability and Household Income
Onset of Chronic Illness/Disability -0.2383** -0.2007** -0.1857** -0.1493**
Female -0.0460** -0.0324 -0.0453**
Age 25-34 0.0754** 0.1113** 0.1479**
35-44 -0.0375 0.0921** 0.1562**
45-54 0.0223 0.0684* 0.1829**
55-64 0.0102 -0.0635* 0.1175**
65+ -0.2452** -0.3302** -0.0854**
Two Adults in Household 0.2556** 0.2105**
Three or More Adults in Household 0.2380** 0.2147**
One Child in Household -0.1769** -0.1657**
Two or More Children in Household -0.3319** -0.3226**
No Education Beyond Primary -0.3781**
Year 0.0582** 0.0614** 0.0617** 0.0505**
Constant 4.724 4.7552 4.665** 4.7436**
R2 0.0191 0.0513 0.1046 0.1846
N 8159 8159 8159 8159
** Statistically significant at 5% level * Statistically significant at 10% level.Reference category: no onset, male, aged 16-24, single adult household, no children, post-primary education qualification.
Chronic Illness or + Personal + Household + EducationDisability Only Characteristics Characteristics
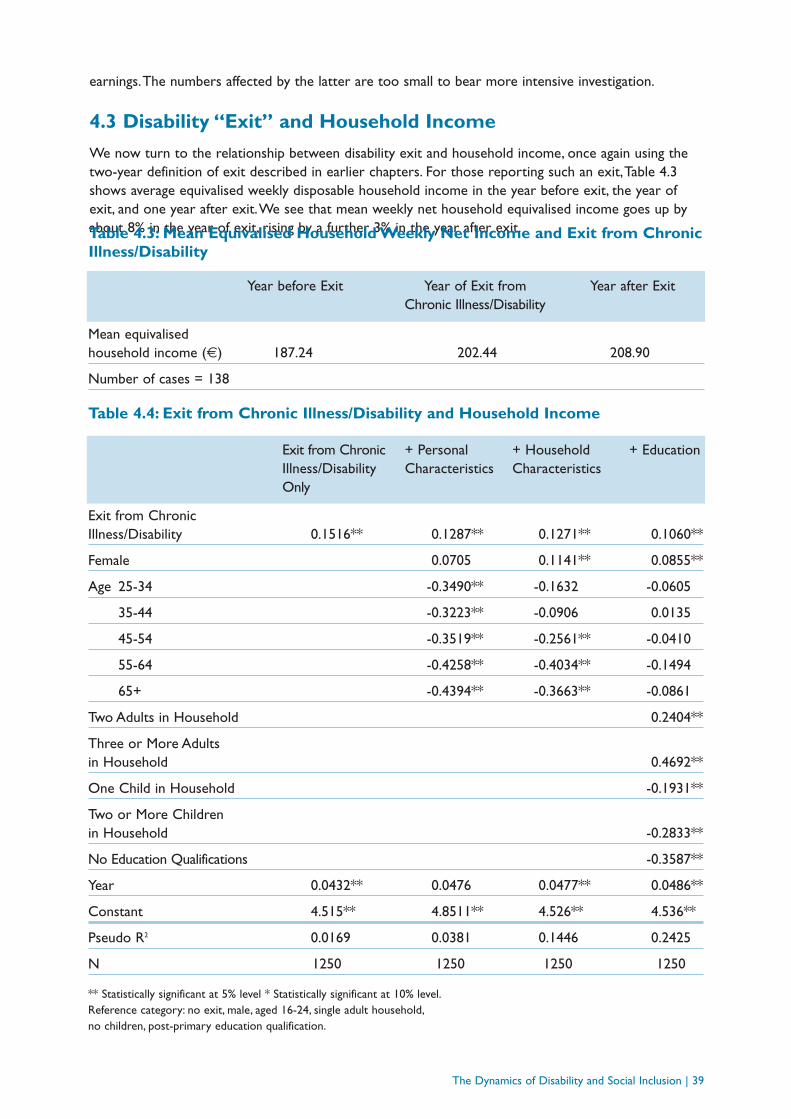
The Dynamics of Disability and Social Inclusion | 39
earnings.The numbers affected by the latter are too small to bear more intensive investigation.
4.3 Disability “Exit” and Household Income
We now turn to the relationship between disability exit and household income, once again using thetwo-year definition of exit described in earlier chapters. For those reporting such an exit,Table 4.3shows average equivalised weekly disposable household income in the year before exit, the year ofexit, and one year after exit.We see that mean weekly net household equivalised income goes up byabout 8% in the year of exit, rising by a further 3% in the year after exit.
Year before Exit Year of Exit fromChronic Illness/Disability
Year after Exit
Mean equivalised household income (€) 187.24 202.44 208.90
Number of cases = 138
Table 4.3: Mean Equivalised Household Weekly Net Income and Exit from ChronicIllness/Disability
Table 4.4: Exit from Chronic Illness/Disability and Household Income
Exit from Chronic + Personal + Household + EducationIllness/Disability Characteristics CharacteristicsOnly
Exit from Chronic Illness/Disability 0.1516** 0.1287** 0.1271** 0.1060**
Female 0.0705 0.1141** 0.0855**
Age 25-34 -0.3490** -0.1632 -0.0605
35-44 -0.3223** -0.0906 0.0135
45-54 -0.3519** -0.2561** -0.0410
55-64 -0.4258** -0.4034** -0.1494
65+ -0.4394** -0.3663** -0.0861
Two Adults in Household 0.2404**
Three or More Adultsin Household 0.4692**
One Child in Household -0.1931**
Two or More Childrenin Household -0.2833**
No Education Qualifications -0.3587**
Year 0.0432** 0.0476 0.0477** 0.0486**
Constant 4.515** 4.8511** 4.526** 4.536**
Pseudo R2 0.0169 0.0381 0.1446 0.2425
N 1250 1250 1250 1250
** Statistically significant at 5% level * Statistically significant at 10% level.Reference category: no exit, male, aged 16-24, single adult household,no children, post-primary education qualification.

We then estimate the same statistical model as employed in the previous section to explain householdincome among all those who were at risk of exit, that is everyone observed with two consecutive years ofdisability and followed for two more years in the survey.The results presented in Table 4.4 show first thatdisability exit is indeed statistically significant in predicting an increase in household income, before anyother variables are taken into account.When personal and household characteristics, including educationlevel, are taken into account the size of this estimated “exit” effect is reduced but remains highly significant.
The size of these estimated effects suggests that, having controlled for other features of the individual andhis or her household, exit from disability is predicted to be associated with an increase of about 10% inequivalised household income.
4.4 Persistent Disability and Household Income
As well as experiencing onset of or exit from chronic illness or disability, having a chronic illness ordisability throughout the panel might well have a substantial impact on income. First,Table 4.5 showsthat mean equivalised household income for individuals who have a disability throughout the panel isless than 75% of the mean for those not reporting a disability at any point.
Mean income also differs across individuals experiencing persistent disability, as Table 4.6 shows.Women with persistent disability are in households with substantially higher income than men, themiddle age groups experiencing persistent disability have somewhat lower incomes, and in particularmean income varies very substantially with the individual's level of education.
40 | The Dynamics of Disability and Social Inclusion
Persistent Chronic Illness/Disability No Chronic Illness/Disability Experience Over Period
Mean Equivalised Household Income (€) 166.83 229.39
Number of Cases with Persistent Chronic Illness/Disability = 180
Table 4.5: Mean Equivalised Household Weekly Net Income and PersistentChronic Illness/Disability
Table 4.6: Mean Equivalised Household Net Weekly Income for Those ReportingPersistent Chronic Illness/Disability
Gender €
Female 186.66
Male 148.61
Age
25-34 175.10
35-44 165.09
45-54 155.24
55-54 169.49
65+ 170.32
Education
No Qualifications 139.82
Secondary 194.00
Third Level 333.96

The Dynamics of Disability and Social Inclusion | 41
We now apply our statistical model explaining household income, comparing those experiencingpersistent disability with those who reported no disability.The results presented in Table 4.7 show firstthat persistent disability is statistically significant in predicting lower household income than those withno disability.When personal and household characteristics, including education level, are taken intoaccount the size of the estimated effect of persistent disability is reduced by 40% but remains highlysignificant.The predicted reduction in income associated with persistent disability is close to 20%.
4.5 Disability Onset and PovertyHaving looked at the impact of disability on household income, we now analyse the implications forpoverty, to the extent that this is captured by income. In measuring poverty for this purpose we focuson whether the income of the household falls below 60% of median income, where incomes are onceagain adjusted to take the greater needs of larger households into account by the use of equivalencescales.As discussed at length in previous studies, including Gannon and Nolan (2005), no one measurereliably allows one to identify those who would generally be consider as “poor”, but those below suchan income threshold are certainly at enhanced risk of poverty. Indeed, falling below such an incomethreshold is taken in the EU's official set of indicators for social inclusion as indicating the person is “atrisk of poverty”, and it is in that light that we concentrate on it here.To put the dynamic results intocontext, it is worth noting that the cross-sectional relative income poverty rate for those currently
Table 4.7: Persistent Chronic Illness/Disability and Household Income
** Statistically significant at 5% level * Statistically significant at 10% level.Reference category: no disability, male, aged 16-24, single adult household,no children, post-primary education qualification.
Base + Personal + Household + EducationCharacteristics Characteristics
Persistent Chronic Illness/Disability -0.3198** -0.2683** -0.2630** -0.1863**
Female -0.03741** -0.0181 -0.0338**
Age 25-34 0.0907** 0.1446** 0.1861**
35-44 0.0001 0.1401** 0.2035**
44-54 0.0554* 0.0945** 0.2142**
55-64 0.0202 -0.0546* 0.1296**
65+ -0.1531** -0.2184** 0.0143
Two Adults in Household 0.2509** 0.2097**
Three or More Adults in Household 0.2792** 0.2612**
One Child in Household -0.1855** -0.1708**
Two or More Children in Household -0.3311** -0.3141**
No Education Qualifications -0.3712**
Year 0.0599 0.0624** 0.0593** 0.0542**
N 19061 19061 19061 4.6659
R2 0.0783 0.0980 0.1519 0.2286
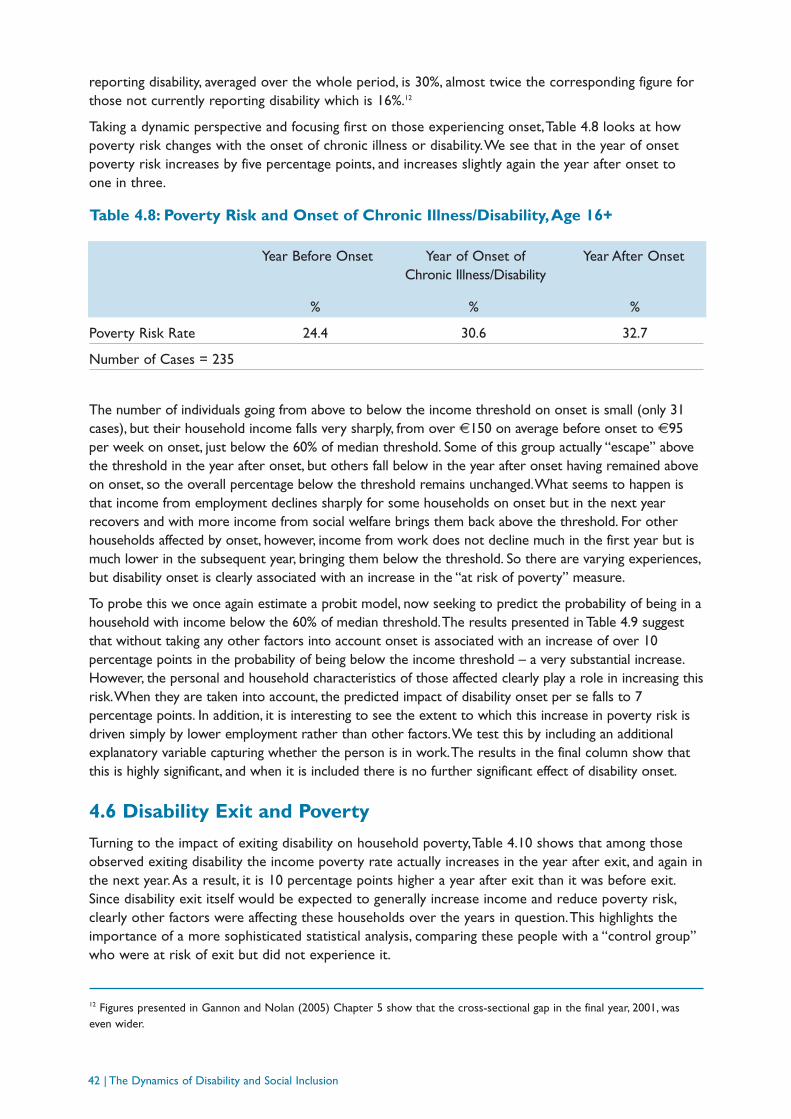
42 | The Dynamics of Disability and Social Inclusion
reporting disability, averaged over the whole period, is 30%, almost twice the corresponding figure forthose not currently reporting disability which is 16%.12
Taking a dynamic perspective and focusing first on those experiencing onset,Table 4.8 looks at howpoverty risk changes with the onset of chronic illness or disability.We see that in the year of onsetpoverty risk increases by five percentage points, and increases slightly again the year after onset to one in three.
The number of individuals going from above to below the income threshold on onset is small (only 31cases), but their household income falls very sharply, from over €150 on average before onset to €95per week on onset, just below the 60% of median threshold. Some of this group actually “escape” abovethe threshold in the year after onset, but others fall below in the year after onset having remained aboveon onset, so the overall percentage below the threshold remains unchanged.What seems to happen isthat income from employment declines sharply for some households on onset but in the next yearrecovers and with more income from social welfare brings them back above the threshold. For otherhouseholds affected by onset, however, income from work does not decline much in the first year but ismuch lower in the subsequent year, bringing them below the threshold. So there are varying experiences,but disability onset is clearly associated with an increase in the “at risk of poverty” measure.
To probe this we once again estimate a probit model, now seeking to predict the probability of being in ahousehold with income below the 60% of median threshold.The results presented in Table 4.9 suggestthat without taking any other factors into account onset is associated with an increase of over 10percentage points in the probability of being below the income threshold – a very substantial increase.However, the personal and household characteristics of those affected clearly play a role in increasing thisrisk.When they are taken into account, the predicted impact of disability onset per se falls to 7percentage points. In addition, it is interesting to see the extent to which this increase in poverty risk isdriven simply by lower employment rather than other factors.We test this by including an additionalexplanatory variable capturing whether the person is in work.The results in the final column show thatthis is highly significant, and when it is included there is no further significant effect of disability onset.
4.6 Disability Exit and Poverty
Turning to the impact of exiting disability on household poverty,Table 4.10 shows that among thoseobserved exiting disability the income poverty rate actually increases in the year after exit, and again inthe next year.As a result, it is 10 percentage points higher a year after exit than it was before exit.Since disability exit itself would be expected to generally increase income and reduce poverty risk,clearly other factors were affecting these households over the years in question.This highlights theimportance of a more sophisticated statistical analysis, comparing these people with a “control group”who were at risk of exit but did not experience it.
12 Figures presented in Gannon and Nolan (2005) Chapter 5 show that the cross-sectional gap in the final year, 2001, waseven wider.
Year Before Onset Year of Onset ofChronic Illness/Disability
Year After Onset
% % %
Poverty Risk Rate 24.4 30.6 32.7
Number of Cases = 235
Table 4.8: Poverty Risk and Onset of Chronic Illness/Disability,Age 16+
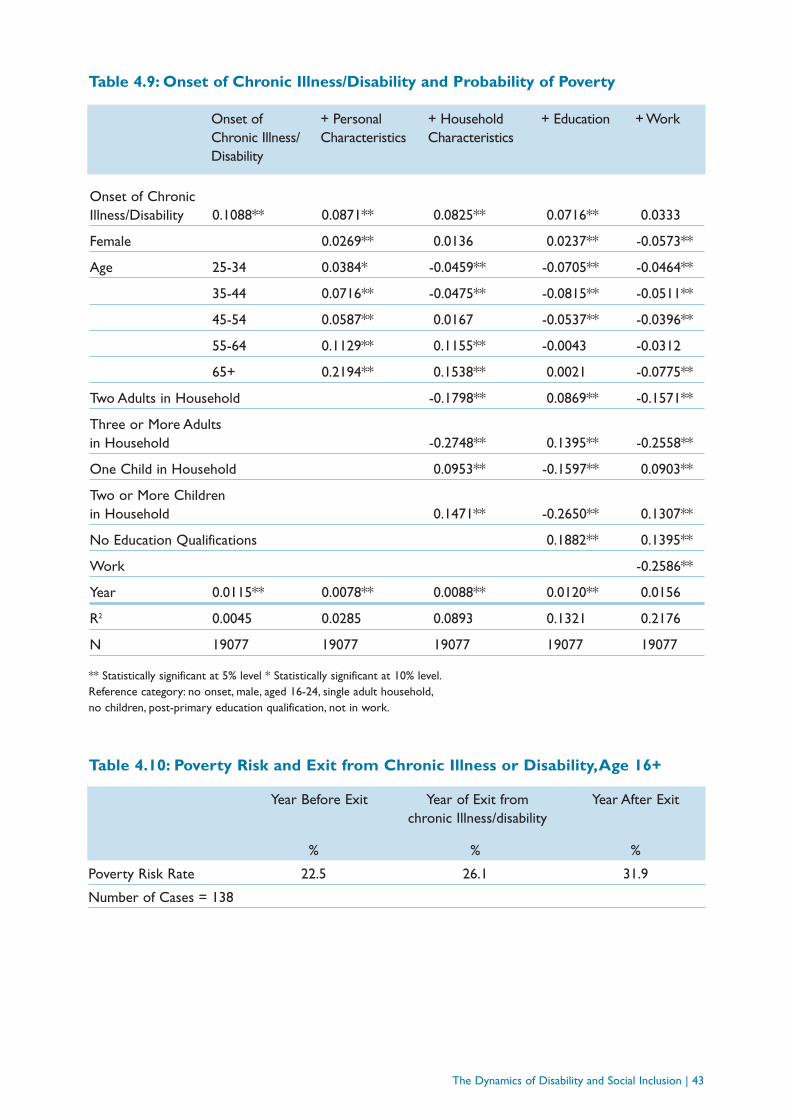
The Dynamics of Disability and Social Inclusion | 43
Table 4.9: Onset of Chronic Illness/Disability and Probability of Poverty
** Statistically significant at 5% level * Statistically significant at 10% level.Reference category: no onset, male, aged 16-24, single adult household,no children, post-primary education qualification, not in work.
Year Before Exit Year of Exit fromchronic Illness/disability
Year After Exit
% % %
Poverty Risk Rate 22.5 26.1 31.9
Number of Cases = 138
Table 4.10: Poverty Risk and Exit from Chronic Illness or Disability,Age 16+
Onset of + Personal + Household + Education + WorkChronic Illness/ Characteristics CharacteristicsDisability
Onset of Chronic Illness/Disability 0.1088** 0.0871** 0.0825** 0.0716** 0.0333
Female 0.0269** 0.0136 0.0237** -0.0573**
Age 25-34 0.0384* -0.0459** -0.0705** -0.0464**
35-44 0.0716** -0.0475** -0.0815** -0.0511**
45-54 0.0587** 0.0167 -0.0537** -0.0396**
55-64 0.1129** 0.1155** -0.0043 -0.0312
65+ 0.2194** 0.1538** 0.0021 -0.0775**
Two Adults in Household -0.1798** 0.0869** -0.1571**
Three or More Adults in Household -0.2748** 0.1395** -0.2558**
One Child in Household 0.0953** -0.1597** 0.0903**
Two or More Children in Household 0.1471** -0.2650** 0.1307**
No Education Qualifications 0.1882** 0.1395**
Work -0.2586**
Year 0.0115** 0.0078** 0.0088** 0.0120** 0.0156
R2 0.0045 0.0285 0.0893 0.1321 0.2176
N 19077 19077 19077 19077 19077

The estimated model presented in Table 4.11 suggests first that disability exit per se was associatedwith a decline in poverty risk rather than an increase.The poverty rate for all those “at risk” ofdisability exit was trending sharply upwards over the period (as reflected in the “year” variableincluded in the model); those who actually exited then had a lower predicted rate than those who didnot.This upward trend, seen in a sharp increase in cross-sectional income poverty for those reportingdisability as documented in Gannon and Nolan (2005),13 is likely to have reflected the very rapidincrease in household disposable income and thus the relative income threshold.This was in excess ofincreases in social welfare support, and would have impacted particularly on those with a disabilitygiven the high rate of welfare dependence among that group.
However, we see from the rest of Table 4.11 that when other characteristics are added to the explanatorymodel the size of the estimated effect of exit declines; when education level is added, although still negativeit becomes statistically insignificant. In other words, the apparent rise in poverty for those exiting a spell ofdisability can be attributed to factors other than that exit, such as personal and household characteristics.
44 | The Dynamics of Disability and Social Inclusion
Table 4.11: Exit from Chronic Illness/Disability and Poverty Risk
Chronic Illness/ + Personal + Household + EducationDisability Exit Characteristics CharacteristicsOnly
Exit from Chronic Illness/Disability -0.0869* -0.0743 -0.0784* -0.0664
Female -0.0228 -0.0626 -0.0408
Age 25-34 0.0628 -0.1268 -0.1983*
35-44 0.0650 -0.1816* -0.2458**
45-54 0.0694 -0.0425 -0.1871*
55-64 0.1942* 0.1309 -0.0601
65+ 0.1416 -0.0177 -0.2170**
Two Adults in Household -0.2966** -0.2895**
Three or More Adults -0.5108** -0.5221**in Household
One Child in Household 0.2354** 0.2225**
Two or More Children 0.2340** 0.2229**in Household
No Education Qualifications 0.2326**
Year 0.0597** 0.0536** 0.0622** 0.0636**
Pseudo R2 0.0181 0.0262 0.1524 0.1899
N 1250 1250 1250 1250
** Statistically significant at 5% level * Statistically significant at 10% level.Reference category: no exit, male, aged 16-24, single adult household,no children, post-primary education qualification, not in work.
13 See Gannon and Nolan (2005) Table 5.7, p. 56.

4.7 Persistent Disability and Poverty
Turning to those reporting persistent disability throughout the panel,Table 4.12 shows that theirrelative income poverty rate of 35% on average over the period was very high, more than twice thefigure for those not experiencing disability at all during the panel.
Table 4.12: Poverty Risk and Persistent Chronic Illness/Disability,Age 16+
The Dynamics of Disability and Social Inclusion | 45
Persistent Chronic No Experience of Chronic Illness/Disability Illness/Disability
% %
Poverty Risk Rate 35.2 14.5
Number of Cases with Persistent Chronic Illness/Disability = 180
Table 4.13: Persistent Chronic Illness/Disability and Risk of Poverty
** Statistically significant at 5% level * Statistically significant at 10% level.Reference category: no disability, male, aged 16-24, single adult household,no children, post-primary education qualification, not in work.
Chronic Illness/ + Personal + Household + Education + WorkDisability Only Characteristics Characteristics
Persistent Chronic Illness/Disability 0.2234** 0.1808** 0.1669** 0.1237** 0.0394**
Female 0.0278** 0.0143 0.0237** -0.0558**
Age 25-34 0.0313 -0.0518** -0.0733** -0.0486**
35-44 0.0607** -0.0559** -0.0851** -0.0537**
45-54 0.0383* -0.0007 -0.0614** -0.0435**
55-64 0.0802** -0.0844** -0.0166 -0.0361*
65+ 0.1649** 0.1058** -0.0831**
Two Adults in Household -0.1724** -0.1549** -0.1552**
Three or More Adults -0.2685** -0.2607** -0.2542**in Household
One Child in Household 0.0953** 0.0874** 0.0901**
Two or More Children 0.1487** 0.1409** 0.1314**in Household
No Education Qualifications 0.1774** 0.1354**
Working -0.2537**
Year 0.0113** 0.0085** 0.0096** 0.0123** 0.0156**
R2 0.0240 0.0413 0.1006 0.1383 0.2187
N 19077 19077 19077 19077 19077
46 | The Dynamics of Disability and Social Inclusion
Since this could in part be attributable to other factors, we once again estimate a statistical modelincorporating age, gender, education and work, and household composition directly into the analysis.The results presented in Table 4.13 show that those reporting chronic illness or disability throughoutthe panel are much more likely to be below the income poverty threshold than those in the referencecategory, who experienced no disability over the panel period.The relative income poverty rate forthe latter was 14%, while the estimated coefficient for persistent disability suggests a 22 percentagepoint increase – so the predicted at risk rate for those reporting persistent disability is 36%.
The next column shows that when we control for age and gender, the magnitude of the estimatedeffect of persistent disability declines slightly, with women and older persons more likely to be belowthe threshold. Including household composition, in the next column, shows that having more adults inthe household reduces poverty risk while children increase it, but with little effect on the impact ofdisability. Having no education qualifications is shown in the next column to be significantly associatedwith an enhanced likelihood of being below the income threshold, and including it reduces theestimated impact of disability per se. Nonetheless, an increase in the relative income poverty rate ofabout 13 percentage points is still predicted for someone experiencing persistent disability, controllingfor individual and household characteristics.
That may well reflect the impact of disability on employment, so in the final column we again add anexplanatory variable capturing whether the individual reporting the chronic illness or disability is inpaid work.We see that this is strongly related to the likelihood of being in a household below theincome threshold, and when it is included the remaining impact of persistent disability is reducedsubstantially.This confirms the importance of employment as the core channel through which disabilityreduces household income and increases poverty risk.
4.8 Conclusions
This chapter has focused on the impact of disability on household income for those affected, and onthe implications for poverty to the extent that is captured by household income. On a cross-sectionalbasis, average household income (adjusted to take household size into account) for individualsreporting a chronic illness or disability is only about 80% of the corresponding figure for those notreporting such an illness or disability.The proportion falling below conventional relative incomepoverty thresholds such as 60% of median income also differs markedly, with about 30% of thosereporting chronic illness or disability below that threshold on average over the period compared with17% of those not reporting such a disability. However, these gaps could be partly due to factors otherthan the presence of disability, which differ across the two groups.The aim of the chapter has been toexploit the longitudinal nature of the Living in Ireland Survey data to identify more accurately theimpact of disability itself.
We focused first on those observed to experience onset of disability during the period of the survey.Estimates from a statistical model of household income for all those “at risk” of onset shows onsetitself to be associated with a decline in household income. in the year it occurs.When other individualand household characteristics are included in the model the estimated effect of onset is reduced byabout one-third but is still highly significant. It suggests that household income in the year of onset isabout 15% lower than it would have been if the person had not become ill/disabled. For thoseexperiencing onset of a disability that hampers them severely, the predicted reduction is about twicethat size.
Household income is lower for those affected by disability onset partly because some move fromemployment to non-employment, but also because some of those remaining in employment see theirearnings fall.This in turn reflects two distinct processes: a decline in hours worked, which seems to bethe dominant element, and some decline in hourly earnings.

The corresponding model estimated in relation to exit from disability suggests it is associated with anincrease in household income. Personal and household characteristics account for some of thisapparent effect, but when they are taken into account exit itself is still accompanied by an increase ofabout 10% in equivalised household income.
Persistent disability over the life of the panel survey was then shown to be statistically significant inpredicting lower household income.When personal and household characteristics, including educationlevel, are taken into account the size of the estimated effect of persistent disability is reduced by 40% –so they are a distinctive group in other respects – but it remains highly significant.The predictedreduction in income associated with persistent disability, compared with someone with no experienceof disability over the period, is about 20%.
We then looked at the impact of disability on whether households fall below an income threshold setas 60% of median household income.This is a measure aimed at capturing those “at risk of poverty”rather than of poverty per se, but is widely used and a useful reference point.We tracked whathappened to the income of the household as disability onset was observed. Statistical analysis showedthat onset is associated with a very substantial increase in the probability of being below the incomethreshold. Personal and household characteristics of those affected were seen to play some role inincreasing this risk, but even when they are incorporated in the model the predicted impact ofdisability onset per se is to increase the relative income poverty rate by 7 percentage points. Much ofthis increase in poverty risk was attributable to lower employment.
Although the income poverty rate actually rose as exit from disability was observed over the period,this was against the background of an even greater increase for those reporting disability who did notexit. Statistical analysis suggested that exit per se was associated with a reduction in poverty risk, butwhen other characteristics were added to the explanatory model, notably education level, it becamestatistically insignificant.
Reporting chronic illness or disability throughout the panel was seen to substantially increase theprobability of being below the income poverty threshold. Once again other individual and householdcharacteristics contributed, but when these were taken into account the (relative income) poverty rateof those experiencing persistent disability over the seven years studied is 13 percentage points higherthan for those who did not experience any disability over the period. Reduced employment seemed tobe the core channel through which disability increases poverty risk.
The Dynamics of Disability and Social Inclusion | 47

48 | The Dynamics of Disability and Social Inclusion
5
THE DYNAMICS OF DISABILITY AND SOCIALPARTICIPATION
5.1 Introduction
In the previous chapters, we have seen how having a chronic illness or disability can lead to socialexclusion in the form of lower employment rates, lower income and a higher risk of poverty.We nowlook at social exclusion in a broader context, and explore the effect of disability on social participationin daily activities. Once again this is intended to build on the cross-sectional analysis of this topicpresented in Gannon and Nolan (2005), which showed that the presence of chronic illness or disabilitywas associated with reduced levels of participation in such activities.We complement and deepen thatcross-sectional picture by taking a dynamic perspective, looking at what happens to levels of socialparticipation as people move from not reporting a chronic illness or disability to doing so or viceversa, and also examining the particular situation of those reporting disability throughout the panel.
In Section 5.2 we describe how social participation has been measured in the survey and look at theoverall levels of participation between 1995 and 2001.We then look in Section 5.3 at levels ofparticipation for individuals with an onset of disability, comparing participation before and after onsetand with those “at risk” who did not experience onset. In Section 5.4 we present correspondinganalysis of disability exit, while Section 5.5 focuses on those reporting disability throughout the panel.Conclusions are summarised in Section 5.6.
5.2 Disability and Social Participation 1995-2001
As in the cross-sectional analysis presented in Gannon and Nolan (2005, Chapter 6), we use thefollowing information from the Living in Ireland Surveys relating to social participation andinvolvement:
1) Whether the respondent was a member of a club or organisation such as a sports orentertainment club, a neighbourhood group, a political party etc;
2) How often he or she talks to any of the neighbours
a. On most days;b. Once or twice a week;c. Once or twice a month;d. Less than once a month; ore. Never
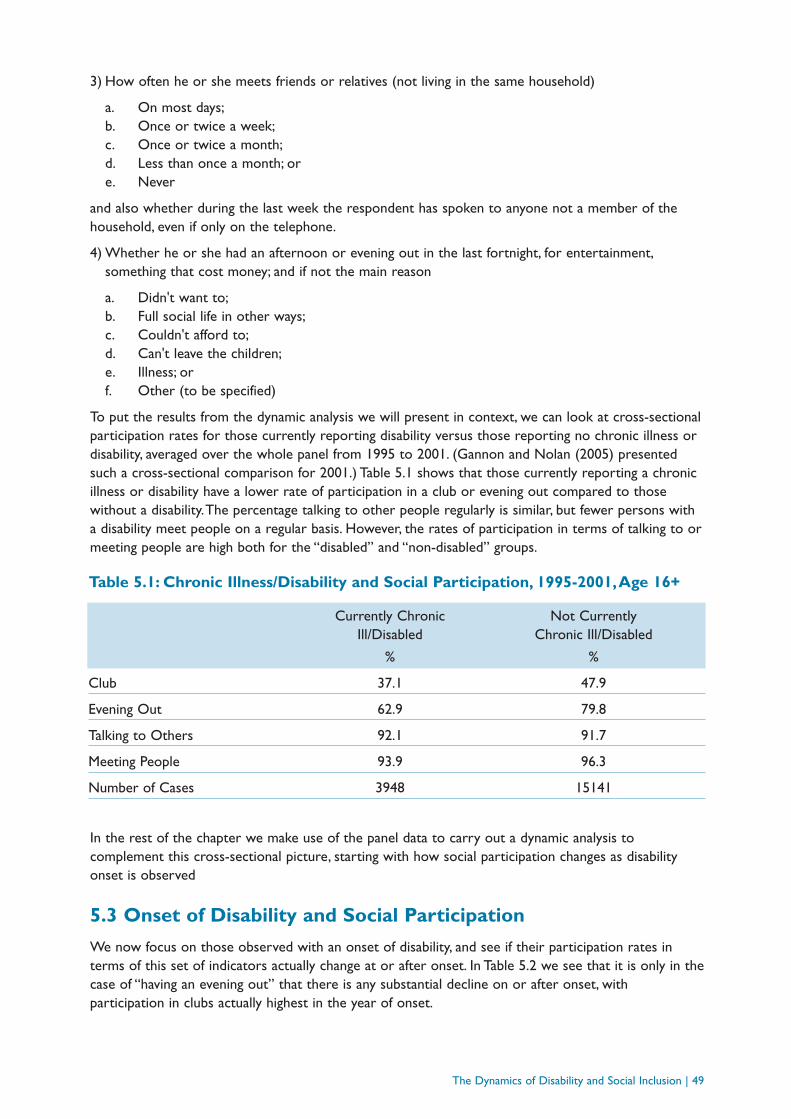
The Dynamics of Disability and Social Inclusion | 49
3) How often he or she meets friends or relatives (not living in the same household)
a. On most days;b. Once or twice a week;c. Once or twice a month;d. Less than once a month; ore. Never
and also whether during the last week the respondent has spoken to anyone not a member of thehousehold, even if only on the telephone.
4) Whether he or she had an afternoon or evening out in the last fortnight, for entertainment,something that cost money; and if not the main reason
a. Didn't want to;b. Full social life in other ways;c. Couldn't afford to;d. Can't leave the children;e. Illness; orf. Other (to be specified)
To put the results from the dynamic analysis we will present in context, we can look at cross-sectionalparticipation rates for those currently reporting disability versus those reporting no chronic illness ordisability, averaged over the whole panel from 1995 to 2001. (Gannon and Nolan (2005) presentedsuch a cross-sectional comparison for 2001.) Table 5.1 shows that those currently reporting a chronicillness or disability have a lower rate of participation in a club or evening out compared to thosewithout a disability.The percentage talking to other people regularly is similar, but fewer persons witha disability meet people on a regular basis. However, the rates of participation in terms of talking to ormeeting people are high both for the “disabled” and “non-disabled” groups.
In the rest of the chapter we make use of the panel data to carry out a dynamic analysis tocomplement this cross-sectional picture, starting with how social participation changes as disabilityonset is observed
5.3 Onset of Disability and Social Participation
We now focus on those observed with an onset of disability, and see if their participation rates interms of this set of indicators actually change at or after onset. In Table 5.2 we see that it is only in thecase of “having an evening out” that there is any substantial decline on or after onset, withparticipation in clubs actually highest in the year of onset.
Currently Chronic Not Currently Ill/Disabled Chronic Ill/Disabled
% %
Club 37.1 47.9
Evening Out 62.9 79.8
Talking to Others 92.1 91.7
Meeting People 93.9 96.3
Number of Cases 3948 15141
Table 5.1: Chronic Illness/Disability and Social Participation, 1995-2001,Age 16+
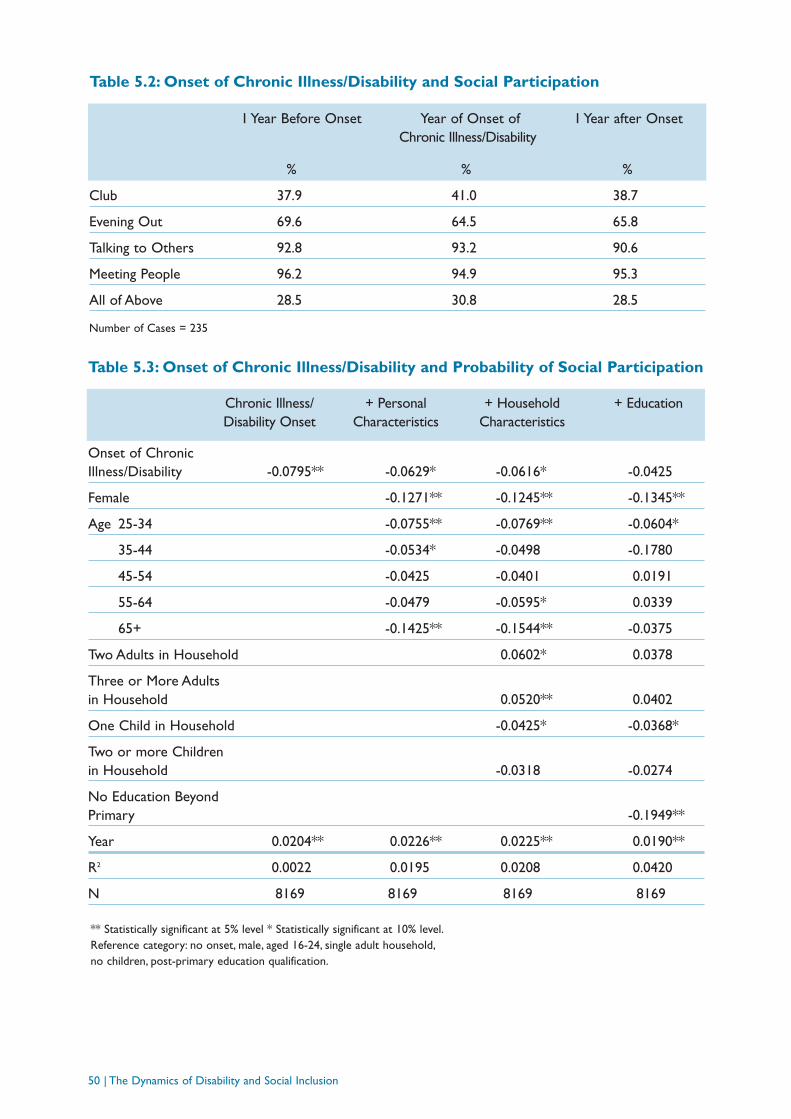
50 | The Dynamics of Disability and Social Inclusion
1 Year Before Onset Year of Onset ofChronic Illness/Disability
1 Year after Onset
% % %
Club 37.9 41.0 38.7
Evening Out 69.6 64.5 65.8
Talking to Others 92.8 93.2 90.6
Meeting People 96.2 94.9 95.3
All of Above 28.5 30.8 28.5
Number of Cases = 235
Table 5.2: Onset of Chronic Illness/Disability and Social Participation
Table 5.3: Onset of Chronic Illness/Disability and Probability of Social Participation
Chronic Illness/Disability Onset
+ PersonalCharacteristics
+ HouseholdCharacteristics
+ Education
** Statistically significant at 5% level * Statistically significant at 10% level.Reference category: no onset, male, aged 16-24, single adult household,no children, post-primary education qualification.
Onset of Chronic Illness/Disability -0.0795** -0.0629* -0.0616* -0.0425
Female -0.1271** -0.1245** -0.1345**
Age 25-34 -0.0755** -0.0769** -0.0604*
35-44 -0.0534* -0.0498 -0.1780
45-54 -0.0425 -0.0401 0.0191
55-64 -0.0479 -0.0595* 0.0339
65+ -0.1425** -0.1544** -0.0375
Two Adults in Household 0.0602* 0.0378
Three or More Adults in Household 0.0520** 0.0402
One Child in Household -0.0425* -0.0368*
Two or more Children in Household -0.0318 -0.0274
No Education Beyond Primary -0.1949**
Year 0.0204** 0.0226** 0.0225** 0.0190**
R2 0.0022 0.0195 0.0208 0.0420
N 8169 8169 8169 8169
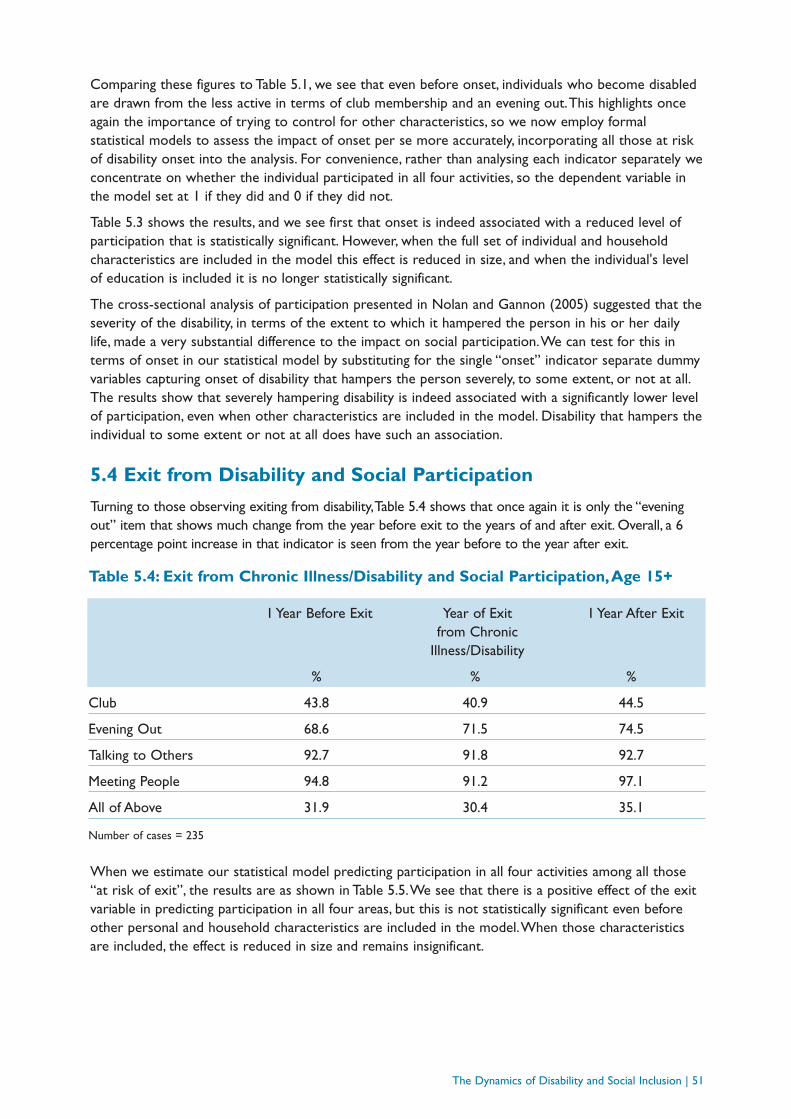
The Dynamics of Disability and Social Inclusion | 51
Comparing these figures to Table 5.1, we see that even before onset, individuals who become disabledare drawn from the less active in terms of club membership and an evening out.This highlights onceagain the importance of trying to control for other characteristics, so we now employ formalstatistical models to assess the impact of onset per se more accurately, incorporating all those at riskof disability onset into the analysis. For convenience, rather than analysing each indicator separately weconcentrate on whether the individual participated in all four activities, so the dependent variable inthe model set at 1 if they did and 0 if they did not.
Table 5.3 shows the results, and we see first that onset is indeed associated with a reduced level ofparticipation that is statistically significant. However, when the full set of individual and householdcharacteristics are included in the model this effect is reduced in size, and when the individual's levelof education is included it is no longer statistically significant.
The cross-sectional analysis of participation presented in Nolan and Gannon (2005) suggested that theseverity of the disability, in terms of the extent to which it hampered the person in his or her dailylife, made a very substantial difference to the impact on social participation.We can test for this interms of onset in our statistical model by substituting for the single “onset” indicator separate dummyvariables capturing onset of disability that hampers the person severely, to some extent, or not at all.The results show that severely hampering disability is indeed associated with a significantly lower levelof participation, even when other characteristics are included in the model. Disability that hampers theindividual to some extent or not at all does have such an association.
5.4 Exit from Disability and Social Participation
Turning to those observing exiting from disability,Table 5.4 shows that once again it is only the “eveningout” item that shows much change from the year before exit to the years of and after exit. Overall, a 6percentage point increase in that indicator is seen from the year before to the year after exit.
When we estimate our statistical model predicting participation in all four activities among all those“at risk of exit”, the results are as shown in Table 5.5.We see that there is a positive effect of the exitvariable in predicting participation in all four areas, but this is not statistically significant even beforeother personal and household characteristics are included in the model.When those characteristicsare included, the effect is reduced in size and remains insignificant.
1 Year Before Exit Year of Exit from Chronic
Illness/Disability
1 Year After Exit
% % %
Club 43.8 40.9 44.5
Evening Out 68.6 71.5 74.5
Talking to Others 92.7 91.8 92.7
Meeting People 94.8 91.2 97.1
All of Above 31.9 30.4 35.1
Number of cases = 235
Table 5.4: Exit from Chronic Illness/Disability and Social Participation,Age 15+
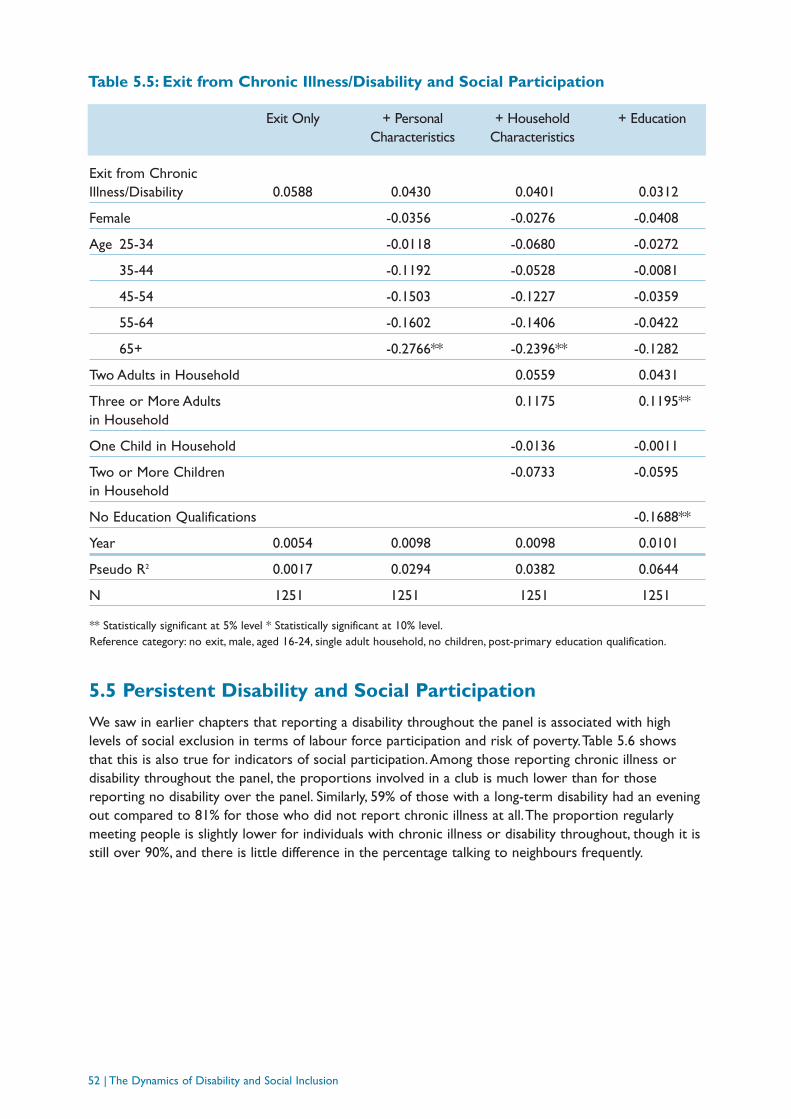
52 | The Dynamics of Disability and Social Inclusion
5.5 Persistent Disability and Social Participation
We saw in earlier chapters that reporting a disability throughout the panel is associated with highlevels of social exclusion in terms of labour force participation and risk of poverty.Table 5.6 showsthat this is also true for indicators of social participation.Among those reporting chronic illness ordisability throughout the panel, the proportions involved in a club is much lower than for thosereporting no disability over the panel. Similarly, 59% of those with a long-term disability had an eveningout compared to 81% for those who did not report chronic illness at all.The proportion regularlymeeting people is slightly lower for individuals with chronic illness or disability throughout, though it isstill over 90%, and there is little difference in the percentage talking to neighbours frequently.
Table 5.5: Exit from Chronic Illness/Disability and Social Participation
Exit Only + PersonalCharacteristics
+ HouseholdCharacteristics
+ Education
** Statistically significant at 5% level * Statistically significant at 10% level.Reference category: no exit, male, aged 16-24, single adult household, no children, post-primary education qualification.
Exit from Chronic Illness/Disability 0.0588 0.0430 0.0401 0.0312
Female -0.0356 -0.0276 -0.0408
Age 25-34 -0.0118 -0.0680 -0.0272
35-44 -0.1192 -0.0528 -0.0081
45-54 -0.1503 -0.1227 -0.0359
55-64 -0.1602 -0.1406 -0.0422
65+ -0.2766** -0.2396** -0.1282
Two Adults in Household 0.0559 0.0431
Three or More Adults 0.1175 0.1195**in Household
One Child in Household -0.0136 -0.0011
Two or More Children -0.0733 -0.0595in Household
No Education Qualifications -0.1688**
Year 0.0054 0.0098 0.0098 0.0101
Pseudo R2 0.0017 0.0294 0.0382 0.0644
N 1251 1251 1251 1251
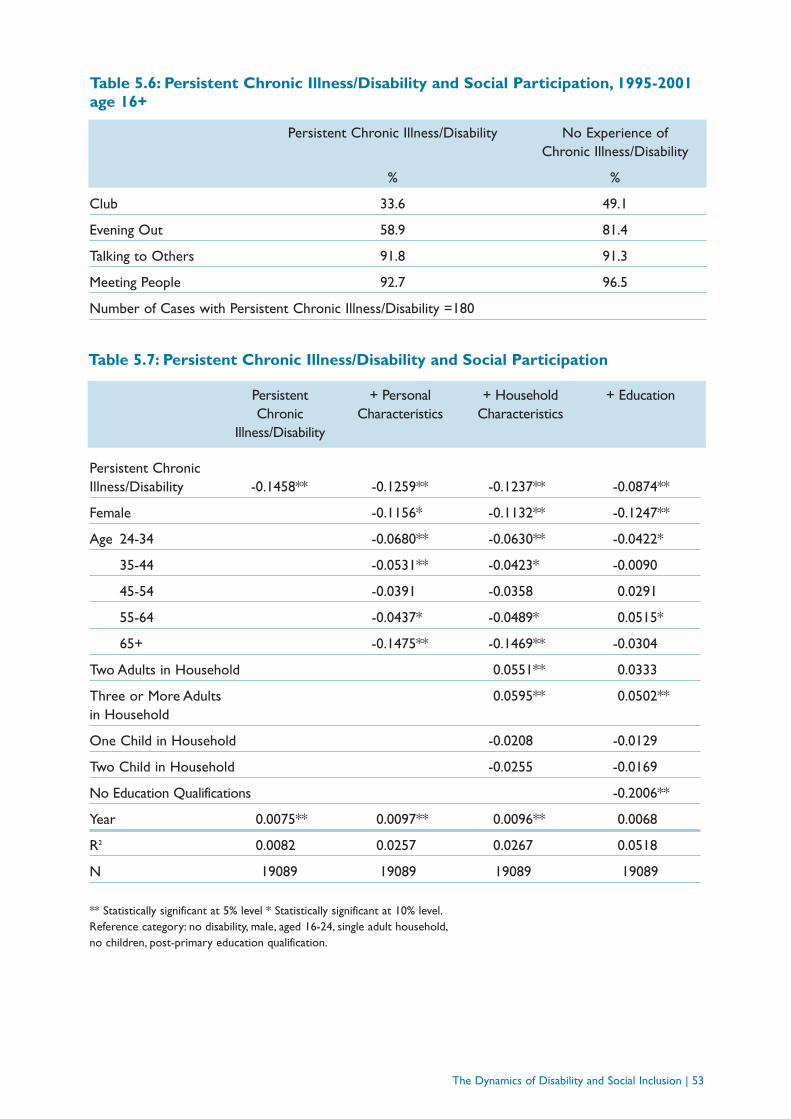
The Dynamics of Disability and Social Inclusion | 53
Table 5.6: Persistent Chronic Illness/Disability and Social Participation, 1995-2001age 16+
Persistent Chronic Illness/Disability No Experience of Chronic Illness/Disability
% %
Club 33.6 49.1
Evening Out 58.9 81.4
Talking to Others 91.8 91.3
Meeting People 92.7 96.5
Number of Cases with Persistent Chronic Illness/Disability =180
Table 5.7: Persistent Chronic Illness/Disability and Social Participation
PersistentChronic
Illness/Disability
+ PersonalCharacteristics
+ HouseholdCharacteristics
+ Education
Persistent Chronic Illness/Disability -0.1458** -0.1259** -0.1237** -0.0874**
Female -0.1156* -0.1132** -0.1247**
Age 24-34 -0.0680** -0.0630** -0.0422*
35-44 -0.0531** -0.0423* -0.0090
45-54 -0.0391 -0.0358 0.0291
55-64 -0.0437* -0.0489* 0.0515*
65+ -0.1475** -0.1469** -0.0304
Two Adults in Household 0.0551** 0.0333
Three or More Adults 0.0595** 0.0502**in Household
One Child in Household -0.0208 -0.0129
Two Child in Household -0.0255 -0.0169
No Education Qualifications -0.2006**
Year 0.0075** 0.0097** 0.0096** 0.0068
R2 0.0082 0.0257 0.0267 0.0518
N 19089 19089 19089 19089
** Statistically significant at 5% level * Statistically significant at 10% level.Reference category: no disability, male, aged 16-24, single adult household,no children, post-primary education qualification.

We now apply our statistical model in order to identify the effects of persistent disability per se onsocial participation.Table 5.7 shows that those who report a chronic illness or disability throughoutare 15 percentage points less likely to participate than the reference category, before other factors aretaken into account.This reference group, people who did not report a chronic illness or disability atany point over the panel, had a participation rate of 38 per cent, so the predicted rate for thosereporting disability throughout is 23 per cent.
When we control for personal characteristics such as age and gender, we find slightly lower effects ofdisability: women and the elderly are less likely to participate, and the effects of persistent disability arereduced by about 2 percentage points. Controlling for household composition makes little differenceto the estimated impact of persistent disability, but adding absence of educational qualifications reducesthe size of that effect. Even after controlling for personal and household characteristics and educationalattainment this effect remains significant: compared with people who did not report a chronic illnessor disability at any point, the predicted rate for those reporting disability throughout is 9 percentagepoints lower. (Severity of disability also plays a role, with those mostly reporting that they are severelyhampered even less likely to participate.)
5.6 Conclusions
In this chapter we have used the panel data from the Living in Ireland Survey to analyse therelationship between social participation and disability from a dynamic perspective. Cross-sectionalanalysis suggests that those reporting a chronic illness or disability have lower rates of socialparticipation on some indicators than those not reporting such illness or disability, though their levelsof participation on average are quite high.
Here, when we focused on cases where disability onset is observed during the panel survey, we sawthat the only indicator registering a decline in participation on onset was “having an evening out”.Results of statistical analysis of a summary indicator capturing participation in all four activities showedthat onset of severely hampering disability was associated with a significantly lower level ofparticipation, even when other characteristics were included in the model. Disability that hampered theindividual to some extent or not at all did have such an association.
For those observed exiting from disability, once again it was only the “evening out” item that showedmuch change.The statistical model predicting participation in all four activities among all those “at riskof exit” found a positive effect of the exit variable but it was not statistically significant, even beforeother personal and household characteristics are included in the model.
Reporting chronic illness or disability throughout the life of the panel was found to significantly reducethe expected level of social participation, based on the single summary indicator of participation.Aftercontrolling for personal and household characteristics and education level, for those reportingdisability throughout the predicted rate of participation is still 9 percentage points lower than forthose with no experience of disability over the period of the panel.
54 | The Dynamics of Disability and Social Inclusion

The Dynamics of Disability and Social Inclusion | 55
6
CONCLUSIONS
6.1 Introduction
Various aspects of social inclusion and social exclusion for people with disabilities have been analysedin previous studies for the NDA and the Equality Authority, including cross-sectional analysis ofavailable data from representative household surveys (Gannon and Nolan 2004, 2005). On almost allthe measures studied, people with chronic illness or disability fared worse than others in their ownage group. It is however difficult to tease out from such a “snap-shot” precisely the role played bydisability itself, as opposed to other factors – since those affected by disability may also be distinctivein other ways, such as age, education and labour market experience.The Living in Ireland Surveysfollowed the same people from one year to the next, and so can be used to track individuals notexperiencing disability and then subsequently reporting disability, and others who move from reportingdisability to not doing so.The change in the outcomes of interest – labour force status, earnings,household income and social participation – as disability status changes can then be studied directly.This improves our capacity to estimate the effects of disability with precision and allows the channelswhereby these effects operate to be traced with more confidence.
This study has exploited this potential of the longitudinal data from the Living in Ireland surveys,presenting an investigation of the dynamic relationship between disability and exclusion. Specifically, ithas investigated how employment, income and income poverty, and social participation change as onsetof or exit from disability is observed in the panel surveys.The position of those reporting disabilitythroughout the life of the panel was also studied, to get a sense of the effects of such persistentdisability.The key questions being asked are what we can learn from the experience of these peoplewith differing experiences of disability about how much impact disability itself has on employment,income and poverty, and social participation.As emphasised in previous reports, the measurement ofdisability in a survey context poses considerable definitional and methodological difficulties, anddisability can be captured in only a very crude fashion in a general household survey like the Living inIreland Survey.
The study relied on data from the Living in Ireland Survey over the period from 1995 to 2001,described in Chapter 2 and in greater detail elsewhere. In that survey, in any year about 20% of theadult population reported having a chronic illness or disability.Tracking individual adults from 1995 to2001, about twice that many reported such an illness or disability at some point over the seven years.Our interest here has been in three different sub-sets of that total: those for whom we observe thestart of a spell of disability over the life of the survey, those for whom we observe the end of such aspell, and those who reported disability in all seven years of the survey. Including in the analysis notonly those observed with a disability “transition” during the panel survey but also those persistently
disabled meant that the duration of disability, which might be expected to have a major role indetermining its impact, was not neglected.
6.2 The Impact of Disability Onset
The impact of disability “onset” was studied by focusing on persons in the survey who reported nochronic illness or disability for two years, followed by two years when they do report illness ordisability.The analytical strategy employed was then to compare their situation with those “at risk” ofonset who did not actually experience it – in other words, those who reported two consecutive yearswithout disability in the panel and were then observed for a further two years without disability.(Someone who reported disability throughout the panel was not “at risk” in this sense, because theonset of disability could not be observed.) A total of 235 individuals were observed in the panelexperiencing disability “onset”, defined in that way. Older people were seen to be more likely thanothers to experience onset, and being in a low-income household was also associated with anincreased probability of onset.
We then went on to examine the relationship between disability onset and employment.Whenobserved in a cross-section, about 70% of those not reporting a longstanding/chronic illness ordisability and of working age in the Living in Ireland Survey were in employment, compared with 40%for those reporting such a condition. Focusing on those observed to experience onset, only about 60%were employed before that happened – these individuals were already more prone to unemploymentand inactivity than others.When disability onset then occurs, the employment rate for these individualsfell from 60% to 46%, and in the year after onset this fell a little more to 43%.
Statistical analysis of these individuals then showed that, having taken a range of personal andhousehold characteristics into account, the onset of disability was associated with a decline of about20 percentage points in the probability of being active in the labour force.Where the chronic illness ordisability did not hamper the person in their daily activities it was seen to reduce the probability ofbeing in employment by about 10 percentage points, whereas when it did hamper them that reductionwas closer to 30 percentage points.Those already in low-income households were more likely tomove from being active to inactive, as were women and those with low levels of education.
The impact of disability onset on household income and income poverty was also examined. From across-sectional perspective, average household income (adjusted to take the needs of larger versussmaller households into account) for individuals in the sample reporting a chronic illness or disabilitywas only about 80% of the corresponding average for those not reporting such an illness or disability.Focusing on those observed to experience onset of disability during the period of the survey showedonset to be associated with a decline in household income.When other individual and householdcharacteristics were included in the statistical model the estimated effect of onset was reduced byabout one-third, but was still statistically significant and substantial. Household income in the year ofonset was estimated to be about 15% lower than it would have been if the person had not becomeill/disabled. For those experiencing onset of a disability that hampers them severely, the predictedimpact on income was considerably larger. Household income fell partly because of reducedemployment, but also because some of those remaining in employment worked fewer hours.
Turning to relative income poverty, from a cross-sectional perspective 30% of those reporting chronicillness or disability fall below 60% of median household income, a widely-used measure of incomepoverty, compared with 17% of those not reporting such a disability. Disability onset was then seen tobe associated with very substantial increase in the probability of being below that income threshold.Personal and household characteristics of those affected played some role in increasing this risk, buteven when they were taken into account disability onset per se increased the “at risk of poverty” rateby 7 percentage points. Much of this increase in poverty risk was attributable to lower employment.
56 | The Dynamics of Disability and Social Inclusion
The relationship between social participation and disability onset was also analysed from a dynamicperspective. Cross-sectional figures show those reporting a chronic illness or disability with lowerrates of social participation on some indicators than those not reporting such illness or disability,though their levels of participation on average are quite high.When disability onset was observedduring the panel survey, however, only one of our four social participation indicators registered adecline. Statistical analysis suggested that only onset of severely hampering disability was associatedwith a significantly lower level of participation, whereas disability that hampered the individual to someextent or not at all did not have such an association.
6.3 The Impact of Disability Exit
The impact of disability “exit” was studied by focusing on persons observed in the panel reporting twoconsecutive years with a disability followed by two years without such a disability.They were comparedwith those “at risk” of exit who did not experience it – those reporting disability for two years in arow but not then reporting two disability-free years.The number of cases observed with a disability“exit” defined in this way was 138.Among all those “at risk”, persons initially in work were more likelythan others to exit disability.
The employment rate of those observed to exit disability in this way rose from about 50% to 58%comparing the year of exit with the previous year. Statistical analysis of these individuals confirmed thatexiting disability was associated with an increase of about 7 percentage points in the probability ofbeing in employment, having controlled for personal and household characteristics.
Exit from disability was also found to be associated with an increase in household income. Personaland household characteristics accounted for some of this apparent effect, but when they were takeninto account exit itself was still associated with an increase of about 10% in predicted householdincome. Exit from disability appeared to be associated with some reduction in poverty risk, but whenother characteristics were added to the explanatory model, notably the person's education level, thateffect was no longer statistically significant. Similarly, the estimated impact of exit on socialparticipation was not statistically significant.
6.4 The Impact of Persistent Disability
As well as examining what happened on disability onset and exit, we also looked at those reportingpersistent illness/disability, that is over all seven years of the panel survey.A total of 180 cases had thatexperience, accounting for 7% of all respondents and 16% of those who reported disability at anypoint over the life of the survey.Those experiencing persistent disability were disproportionately olderand less well educated than others.
Persistent disability was associated with a greatly reduced likelihood of being in work, with only 13% ofthese individuals in employment throughout the period of the panel, compared with half of those ofworking age with no reported disability experience.When a range of other personal and householdcharacteristics was taken into account, such persistent disability was estimated to be associated with a42 percentage point reduction in the likelihood of being in employment.This represents a verysubstantial reduction, with all the implications that has both for income and for broader participationin the life of society.
Persistent disability over the life of the panel survey was also strongly linked to lower householdincome. Even when the personal and household characteristics, including education level, of theindividual were taken into account, the predicted household income of someone reporting persistentdisability was 20% lower than someone who was otherwise similar but had no experience of disabilityover the period.
The Dynamics of Disability and Social Inclusion | 57
Persistent chronic illness or disability also substantially increased the probability of being below therelative income poverty threshold.When other individual and household characteristics were takeninto account, the predicted “at risk of poverty” rate was 13 percentage points higher for someonewho experienced persistent disability, compared with those who experienced no disability over thepanel period. Once again reduced employment seemed to be the key channel through which disabilityincreased poverty risk.
Finally, having a chronic illness or disability throughout the life of the panel significantly affected theexpected level of social participation.After controlling for personal, and household characteristics,the predicted rate of participation (in all four aspects measured) for those reporting disabilitythroughout the panel was 9 percentage points lower than for those with no experience of disabilityover the period.
6.5 The Challenge Posed by the Research
The findings of the study, summarised in this chapter, serve to deepen our knowledge andunderstanding of the impact of disability on key outcomes.They complement the evidence fromprevious research about the impact of persistent disability on the probability of being in work, onhousehold income and poverty, and on social participation. Furthermore, they quantify the impact ofdisability onset on that probability, having taken other characteristics of the individual and theirhousehold into account. Perhaps the single most important finding is that disability onset andpersistent disability, even when everything else we know about the person and their household aretaken into account, are each associated with a very substantial reduction in the likelihood of being inwork, and primarily through this channel also result in lower household income and a higher risk ofpoverty.This poses a major challenge for policy in relation to tackling the many-faceted barriers toobtaining and maintaining employment that face people with disabilities, as well as in designing incomesupport policies that provide an adequate standard of living for those relying on that support whilealso promoting employment.
58 | The Dynamics of Disability and Social Inclusion
BIBLIOGRAPHY
Burchardt,T. (2003) Being and becoming: Social Exclusion and the onset of disability. Centre for Analysis ofSocial Exclusion, Report 21, London School of Economics
Burkhauser, R. and Daly, M. (1998) Disability and work:The experiences of American and German men,Economic Review, 2, 17-28
Callan,T., Nolan, B.,Whelan, B.J.,Whelan, C.T. and Williams, J. (1996) Poverty in the 1990s: Evidence fromthe 1994 Living in Ireland Survey, General Research Series Paper 170, Dublin: Economic and SocialResearch Institute/ Oak Tree Press
Gannon, B. (2005) ‘A dynamic analysis of disability and labour force participation in Ireland 1995-2000’, Health Economics, 14, 925-938
Gannon, B. and Nolan, B. (2004a) Disability and labour market participation, Dublin: Equality Authority
Gannon, B. and Nolan, B. (2004b) ‘Disability and Labour Market Participation in Ireland’, Economic andSocial Review, 35 (2), 135-155, 2004
Jenkins, S. and Rigg, J. (2003) Disability and disadvantage: Selection, onset and duration effects, ISER Workingpaper 2003-18, University of Essex
National Disability Authority (2005) Disability and work, Dublin: NDA
Whelan, C.T., Layte, R., Maitre, B., Gannon, B., Nolan,B.,Watson, D. and Williams, J. (2003) Monitoringpoverty trends in Ireland: Results from the 2001 Living in Ireland Survey, Policy Research Series Paper No.51, Dublin:The Economic and Social Research Institute
Wooldridge, J. (2002) Econometric analysis of cross-section and panel data, Cambridge, Mass: MIT Press
The Dynamics of Disability and Social Inclusion | 59

60 | The Dynamics of Disability and Social Inclusion

The Equality Authority2 Clonmel Street, Dublin 2Public Information Centre Lo Call: 1890 245 545Tel: (01) 417 3333 Business queries: (01) 417 3336Text phone: (01) 417 3385 Fax: (01) 417 3331Email: [email protected] www.equality.ie
EqualityResearchSeries
National Disability Authority25 Clyde Road, Dublin 4Tel: (01) 608 0400 Fax: (01) 660 9935Email: [email protected] www.nda.ie
Disability Research Series 5