the e conomic power of californiaËs nonprofi t sec tor
TRANSCRIPT
New FINDINGS 2019
The economic Power of california’s nonProfiT secTor
CountCauses

About The Nonprofit Institute at the University of San Diego
Housed in the School of Leadership Studies and Education Sciences, The Nonprofit Institute advances the University of San Diego’s (USD) commitment to academic excellence, expanding liberal and professional knowledge, creating a diverse and inclusive community, and preparing leaders who are dedicated to ethical conduct and compassionate service. Founded in 2002,
The Nonprofit Institute provides education, training and research to strengthen organizations that help meet community needs.
About the California Association of NonprofitsThe California Association of Nonprofits (CalNonprofits) is a statewide policy alliance of more than 10,000 organizations, representing and promoting California’s
growing nonprofit sector. We are the voice of California nonprofits to the legislature, government agencies, philanthropy, and the public. CalNonprofits provides membership benefits including health insurance for nonprofit staff, liability insurance for organizations, access to special advocacy opportunities, and the energy that comes from participating in an active advocacy network. CalNonprofits is proud to present this economic impact study of California’s nonprofit community. CalNonprofits has offices in San Francisco, Los Angeles, Capitola, and Sacramento. www.calnonprofits.org
The Nonprofit Institute, University of San Diego Research Team
Principal InvestigatorsMary Jo Schumann, Ph.D. Tessa Tinkler, Ph.D.Jon DurnfordLaura Deitrick, Ph.D.Emily Young, Ph.D.Kim Hunt, Ph.D., CNP Research AssistantsLisa Walker, M. Sust. Colton C. Strawser, MS, CFRE, CNP
CalNonprofits Research and Report Team
Jan Masaoka, CEO, CalNonprofitsNancy Berlin, Policy Director, CalNonprofitsChristina Dragonetti, Outreach and Communications
Director, CalNonprofitsChristine Metropoulos, Project Manager, CalNonprofits
Patrick Santana, Graphic Design and Production
Cite as: California Association of Nonprofits & The Nonprofit Institute. (2019). Causes Count: The Economic Power of California’s Nonprofit Sector.
California assoCiation of nonprofits
Calnonprofits
The Causes Count team has so many people and organizations to thank.
We first want to acknowledge the countless researchers, state and county government employees, and nonprofit leaders who provided data and content expertise. In particular, we want to thank Daniel Schneider from the Employment Development Department for his expertise in employment and wage data. We also want to thank the staff at the Counties of Alameda, Los Angeles, Merced, Santa Clara, San Diego, and San Francisco and at the California State Department of Aging, Department of Developmental Services, Department of General Services, Department of Fish and Wildlife, CAL Fire, and University of California for providing us with data on nonprofit government contracts. Tania Ibanez and her team at the California Attorney General’s Office have helped us identify and obtain important data.
Thank you to the Causes Count Advisory Committee: James Andreoni, University of California, San Diego; Melissa Breach, League of Women Voters of California; Janet Camarena, Foundation Center (now Candid); Cecilia Chen, Northern California Grantmakers; Sarah de Guia, California Pan-Ethnic Health Network; Leticia de Lara, RAP
Foundation; Patricia Gardner, Silicon Valley Council of Nonprofits; Susan Gomez, Inland Empire Community Collaborative; Chris Hoene, California Budget and Policy Center; Holy Ivel, GuideStar (now Candid); Amy Jester, Humboldt Area Foundation; Cami Kahl, Ceres Community Project; Graham Knaus, California State Association of Counties; Pete Manzo, United Ways of California; Preeta Naya, Bridgespan; Manuel Pastor, University of Southern California; Reshma Shamasunder, Advancing Justice LA; and Joe St. John, Koreatown Youth Counseling Center.
We also want to acknowledge the 1,227 nonprofit leaders who completed the California Nonprofit Survey and the 1,603 California residents who completed the California Resident Survey.
At the University of San Diego we want to thank Dean Nick Landany at USD’s School of Leadership and Education Sciences and Emily Young, Director of the Nonprofit Institute, for their support. CalNonprofits’ graphic designer and artist Patrick Santana has helped make this report readable and usable and we very much appreciate his contributions.
This study was funded in part by the Ralph M. Parsons Foundation and Union Bank. Like everything that CalNonprofits does, it was also funded by foundations making unrestricted grants: the California Wellness Foundation, David & Lucile Packard Foundation, and the Weingart Foundation, as well as our many many nonprofit members.
— Causes Count team members at CalNonprofits and the University of San Diego
Acknowledgements

the voice for California’s nonprofit community.
California assoCiation of nonprofits
Calnonprofits
Jan Masaoka, CEO
Dear Friends,
We could not be more excited to publish this economic impact report on California’s nonprofit sector.
This new research comes at a time when California’s nonprofits are increasingly influential in matters affecting their communities and the nonprofit community as a whole.
By showing the nonprofit “forest” as well as the individual trees, this report helps policymakers, foundations, business, and nonprofits realize that the university, the child care center, the wildlife refuge, the scholarship program, the immigrant center, the art museum, the youth soccer league and the local church and temple are part of the vibrant and varied nonprofit community.
Please join with us in using this data to inform public policy, nonprofit management, and the strengthening of the nonprofit community.
Jan MasaokaCEO, California Association of Nonprofits (CalNonprofits)

Introduction and Executive Summary
Notable Changes since the 2014 Causes Count Report
PART 1
Number and Types of California Nonprofits
PART 2
Nonprofits Count in the California Economy
PART 3
Nonprofit Jobs Count
PART 4
Disparities and Equity
PART 5
Nonprofit Finances Count
PART 6
Government and Nonprofits
PART 7
Foundations and Nonprofit Economics
PART 8
Nonprofits, Public Confidence, and Advocacy
Concluding Comments from CalNonprofits
Data Sources
Appendix
5
9
11
13
18
27
38
45
57
64
68
70
71
Contents
California’s nonprofits bring more than $40 billion into California each year from out-of-state sources, and one in every 14 California jobs is at a nonprofit.
in addition to documenting and expanding economic data, two emerging stories jump out from this report:
California’s nonprofit sector continues to mirror substantial disparities — between northern and southern California, between rural and metropolitan regions, and between predominantly white communities and communities that are predominantly people of color. these disparities are growing wider.
California’s state, county, and city governments rely heavily on nonprofits to serve communities. for example: an estimated one-third of Medicare and Medi-Cal services are provided by nonprofits. this deep partnership between California’s nonprofits and government is crucial to the state, and offers opportunities for strengthening on all sides.
like the inaugural Causes Count report in 2014, this “Causes Count 2.0” report summarizes the noteworthy size, variety, diversity, activities,
accomplishments, and overall magnitude and importance of California’s nonprofit sector.
the research was conducted by the nonprofit institute at the University of san Diego, working alongside Calnonprofits staff. the research involved finding and scrutinizing many different sources of data to create this synthesized exposé of the breadth, depth, and strength of California’s nonprofit sector.
policymakers, nonprofit leaders, and philanthropic leaders will find this report has new and relevant data that can inform public policy, grantmaking
plans, and strategies for individual nonprofits and ecosystems.
The following pages are some
highlights from the full report
California’s large and economically powerful nonprofit sector continues
to be an important driver for both jobs and community well-being.
Introduction and Executive Summary
Causes Count: the eConomiC Power of California’s nonProfit seCtor (2019) — CalnonProfits.org 5

Economic Power
One in every 14 California jobs is at a nonprofit organization, and more than 1.2 million people are employed by nonprofits in California, accounting for 7% of all California employment.
Nonprofits rank as the 3rd largest by wages among key industries in California and the 4th largest by number of jobs, producing more jobs than finance and insurance, wholesale trade, or construction.
The nonprofit sector’s workforce is more diverse by gender and race/ethnicity compared to the adult civilian workforce as a whole.
California volunteers contribute approximately $16.6 billion in unpaid labor each year, the equivalent of 331,058 full-time jobs, most of it in direct work with people, animals, and the land.
Employment and the Nonprofit Workforce
Nonprofits are key contributors to California’s economy, with nonprofit economic activity generating approximately 15% of California’s Gross State Product.
Nonprofits bring more than $40 billion into California each year from out-of-state sources, including the federal government, out-of-state foundations, and individual donations from around the world.
California’s nonprofits generate $273.7 billion in annual revenue and hold $436.7 billion in assets.
Despite being exempt from paying corporate income tax, nonprofits pay more than $37 billion in taxes each year at federal, state, and local levels.
California foundations make $3.2 billion in grants to California nonprofits annually, and another $2.2 billion in grants to nonprofits outside of California. California imports $1.5 billion in foundation grants from outside the state, making the state a net exporter in foundation funding.
6 CausesCount:theeConomiCPowerofCalifornia’snonProfitseCtor(2019)—CalnonProfits.org

Government-Nonprofit Partnership at the CoreCalifornia’s governments rely on nonprofits to provide healthcare and community services, to build housing, to operate state parks, to care for children, to fight contagious disease, manage foster care, protect natural resources, and more. Government funds come from federal, state, county, city, and other government agencies, with funding often flowing from one government agency to another along the way.
The scale of government funding makes it crucial to study. As examples:
$1.1 billion in federal funding from Housing and Urban Development (HUD) comes to California nonprofits for supportive housing for the elderly.
$388 million comes to California Head Start programs directly from the federal government.
$156 million of federal funds is re-granted by the State of California to California nonprofit foster care programs.
$148 million of federal funds in the Community Development Block Grant (CDBG) program is re-granted by local governments to nonprofits.
But government funding is unevenly distributed throughout the state. For example:
The San Francisco Bay Area has 19% of California’s population, but its nonprofits receive 31% of the state’s federal grant funding.
At the other end, the Inland Empire region has 11% of the state’s population, but receives only 3% of California’s federal funding.
Providing services through nonprofits is not a marginal activity for state and local governments, but rather a core strategy. For example, an estimated 32% of California’s $127 billion Medi-Cal budget pays for services delivered by nonprofits.
In turn, working with government is a central strategy for many nonprofits, especially those in human services and health. Because there is such a high correlation between scale and government funding, it remains to be seen whether government funds only large nonprofits, or whether it is difficult for nonprofits to grow beyond $5 million without government funding: 41% of those nonprofits that have revenue between $5–10 million utilize government funding, and it represents 30% or more of their income.
Contracting practices between government and nonprofits are in need of streamlining, consistency and fair cost structures, as the health of the nonprofit ecosystem — a core part of the supply chain for government — is as crucial as other industries in which government needs a healthy sector.
Causes Count: the eConomiC Power of California’s nonProfit seCtor (2019) — CalnonProfits.org 7

Nonprofits in Civic Life and in Public Standing
DisparitiesAlthough many nonprofit organizations strive to mitigate disparities among the California population, significant resource disparities continue to persist within the nonprofit community:
In rural compared to metropolitan communities
In southern compared to northern California
In communities of color compared to predominantly white communities
Between “have” and “have not” communities
Just as importantly, these disparities have grown worse over the past few years. For example, in 2012, for every $1 per capita that metropolitan nonprofits had, rural nonprofits had 61 cents. This report shows that now, for every $1 per capita in metropolitan nonprofits, rural nonprofits have 59 cents.
California nonprofits are key players in civic life, with more than half of nonprofits reporting that they meet with public officials or their staff, participate in coalitions for influencing public policy, and encourage people to vote.
Californians trust nonprofits to a much greater degree than for-profit and government sectors. Over 80% of Californians surveyed for this study are confident that nonprofits act ethically, help people in poverty, and protect the earth, animals, and environment. In addition, substantial majorities rated nonprofits higher than either for-profit business or government to:
Operate efficiently
Spend money wisely
Act on the public’s behalf
8 CausesCount:theeConomiCPowerofCalifornia’snonProfitseCtor(2019)—CalnonProfits.org

the 2014 Causes Count report was the first-ever
economic impact study of California’s nonprofit
sector. as such it has been groundbreaking,
baseline-setting, and highly influential. this
report looks at changes in detail in several
sections with a few highlights below.
Both California and the nation have changed since
our first report, with California now ranked the 5th
largest economy in the world (from 8th in 2012),
employment up by 10%, and GDp growth of 5.7%.
these overall rates give context for the remarkable
growth in California’s nonprofit community.
California nonprofits lead in economic growth and in national market share:
Notable changes since the 2014 Causes Count report
Nonprofit assets have grown to $436.7 billion, an average increase of 6.7% per year.
California’s nonprofits are gaining market share in the U.s.,
now generating 13.5% of total U.S. nonprofit revenue compared with 12.9% in 2012.
Nonprofit wages are up 23%, slightly lower than 25% for California wages in general.
Foundation assets have grown by an astonishing 34% to $137.5 billion.
the number of California
nonprofit employers grew by 10%, the same growth rate as other California employers. there are now more than 1.2 million jobs at California nonprofits and one in 14 California jobs is at a nonprofit.
there has been a
slight increase in the percent of government grant contributions, although still not as high as levels prior to 2012.
the nonprofit sector’s annual revenue grew faster than did California’s GDP as a whole, with rates of 6.2% and 5.7% respectively. the sector’s total annual revenue is now $273.7 billion.
California is increasingly a net exporter of foundation
dollars: $1.5 billion now comes in from out-of-state compared to $1 billion at the time of the first study, while foundation dollars exported outside the state have grown from $1.3 billion to $2.2 billion.
Causes Count: the eConomiC Power of California’s nonProfit seCtor (2019) — CalnonProfits.org 9

Donor-advised funds (DAFs) held at commercial-affiliated sponsors, community foundations and others, are playing a bigger role and heavily sway data about revenue, assets, and foundation giving. In 2016, California-based DAF sponsors received $4.5 billion in revenue, and held assets of $18.1 billion.
other
noteworthy findings
The nonprofit sector appears to be mirroring the shrinking of the middle class in America, with the highest growth found in the largest organizations and the smallest organizations; and medium-sized organizations remaining relatively flat. Between 2012 and 2016 the group of largest nonprofits — those with revenue of $10 million and above — has grown from 68% of total nonprofit revenue to 72%, while the middle group — those between $50,000 and $10 million — has gone from 31% of total revenue to 27%.
The San Francisco Bay Area stands out from other
regions in California, with notably more services,
government funding, foundation funding, assets,
revenues, and nonprofit revenue per capita than other regions.
10 CausesCount:theeConomiCPowerofCalifornia’snonProfitseCtor(2019)—CalnonProfits.org
part 1
How Many Nonprofits Are in California?
Which nonprofits are in the “picture” for this report?
How many nonprofits are there in California?
there are 110,547 organizations registered as 501(c)(3) nonprofits in California. these are “tax-exempt charities,” the only type of nonprofit corporation to which donations are tax-deductible and can make use of certain other benefits. the public understands the term “nonprofit” to apply to this category, and this report uses “nonprofit” to refer to these 501(c)(3) tax-exempt charities. this does not include churches or houses of worship, and private foundations.
in addition, there are another 32,270 nonprofit corporations that are 501(c) but not 501(c)(3), including non-charity nonprofits such as Chambers of Commerce (c)(6), labor unions (c)(5), condominium associations (c)(7), membership associations, volunteer fire departments and so forth.
Which nonprofits are the focus of this report?
this report discusses the economic impact of 501(c)(3) nonprofit corporations (public charities).
financial information in this report largely utilizes information from federal form 990 circa 2016. not all nonprofits file form 990. first, religious charities (such as churches and other houses of worship) are not required to file the 990, although some do. in addition, there were 47,998 nonprofits with annual expenses of less than $50,000; as such they complete form 990-n which does not ask for financial information. private grantmaking foundations complete a different form 990 (990-pf).
in addition, there are 17,980 “non-filers,” who had not filed a form 990 within 24 months of the data gathered here. these are likely to be in the process of exemption application, delinquent, or in the process of termination (i.e., their initial or final return was not yet available).
as a result, the 44,569 nonprofits that are required to report financial and other information are the primary focus of the financial information in this report. other areas of interest rely on these and other sources of data; for instance, much of the employment data comes from the California Employment Development Department.
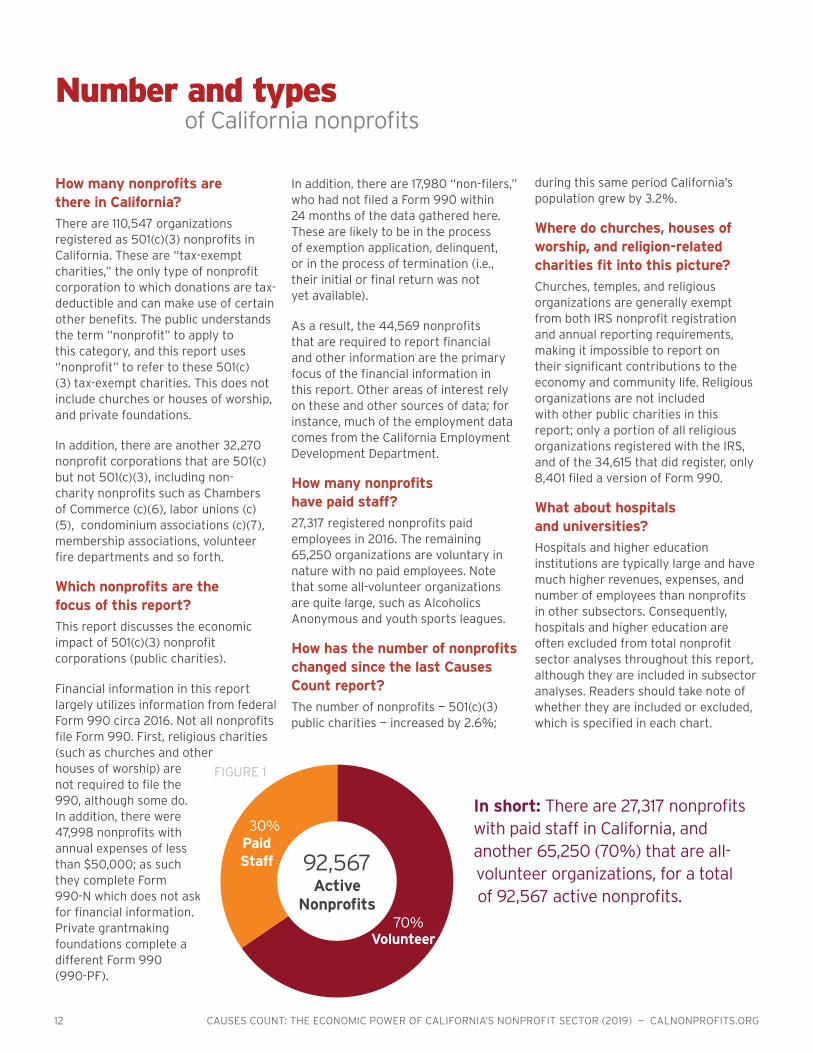
How many nonprofits have paid staff?
27,317 registered nonprofits paid employees in 2016. the remaining 65,250 organizations are voluntary in nature with no paid employees. note that some all-volunteer organizations are quite large, such as alcoholics anonymous and youth sports leagues.
How has the number of nonprofits changed since the last Causes Count report?
the number of nonprofits — 501(c)(3) public charities — increased by 2.6%;
during this same period California’s population grew by 3.2%.
Where do churches, houses of worship, and religion-related charities fit into this picture?
Churches, temples, and religious organizations are generally exempt from both irs nonprofit registration and annual reporting requirements, making it impossible to report on their significant contributions to the economy and community life. religious organizations are not included with other public charities in this report; only a portion of all religious organizations registered with the irs, and of the 34,615 that did register, only 8,401 filed a version of form 990.
What about hospitals and universities?
Hospitals and higher education institutions are typically large and have much higher revenues, expenses, and number of employees than nonprofits in other subsectors. Consequently, hospitals and higher education are often excluded from total nonprofit sector analyses throughout this report, although they are included in subsector analyses. readers should take note of whether they are included or excluded, which is specified in each chart.
In short: there are 27,317 nonprofits with paid staff in California, and another 65,250 (70%) that are all-volunteer organizations, for a total of 92,567 active nonprofits.
Number and types of California nonprofits
92,567 Active
Nonprofits
PaidStaff
30%
70%Volunteer
Figure 1
12 CausesCount:theeConomiCPowerofCalifornia’snonProfitseCtor(2019)—CalnonProfits.org

— or one-sixth — of California’s Gross state product1
$260 billion annually sector output of
California’s nonprofit
15%
Part 2
Nonprofits Count in the California Economy
represents
1. Causes Count: The Economic Power of California’s Nonprofit Sector. California Association of Nonprofits and the Caster Family Center for Nonprofit and Philanthropic Research, University of San Diego, 2014.

With California positioned as the 5th largest economy in the world — surpassed only by the United states, China, Japan and Germany2 — California’s nonprofit sector makes a major contribution to this economic engine.
Moreover, California’s nonprofit revenue has grown over the past four years and continues to outpace that of the nonprofit sector nationally.
figure 2 shows this increase in market share:
+ the number of nonprofits in California is increasing (0.7% over the last year), but at a slower rate than the number of nonprofits across the country (1.9%).
+ total revenue for the sector is still showing robust growth (4.7% over the last year) but a drop from the high growth rate of 8.9% in 2013.
+ With the national growth rate of total nonprofit revenue at 3.8%, California’s nonprofits continue to gain in national market share, and average nonprofit revenue continues to rise.
2. U. s. Bureau of Economic analysis and California Department of finance. the state calculates California’s economic ranking as if it were a country by comparing state level GDp from the Bureau of Economic analysis at the U.s. Department of Commerce with global data from the international Monetary fund.
Revenue growth faster than growth in nonprofit numbers
CArevenue
CAcount
California nonprofits are gaining in national market share: they’re growing more slowly in number of nonprofits — but faster in revenue — compared to the U.S.
Source: IRS Business Master Files (BMF) of Registered 501(c) Exempt Organizations, 2010–2018; and IRS Form 990, 990-EZ, and 990-N (e-Postcard) annual information returns, circa fiscal years 2012–2016.
USrevenue
UScount
Fig
ur
e 2
3.9%
7.6%
5.6%
8.7%
3.4%
5.2%
3.8%
8.4%
3.2%
5.7%
4.4%
7.7%Average growth per year, 2012-2016
0.7%
3.8%
1.9%
4.7%
2013
2014
2015
2016
5.1%
6.6%
6.4%
8.9%
14 CausesCount:theeConomiCPowerofCalifornia’snonProfitseCtor(2019)—CalnonProfits.org

one way to describe and quantify the size and scope of the nonprofit sector is by examining financial data. California’s 44,569 nonprofits that filed 990 or 990EZ in 2016 generated a total of $273.7 billion in revenue. that means, on average nonprofit revenue is just over $6 million, but we know that revenue is not distributed evenly. for example, hospitals make up just 0.5% of the number of nonprofits but bring in 53.3% of the sector’s revenue.
looking closer, we see that in every subsector there are a few “heavyweight” nonprofits that tip the scales when you look at averages. Median revenue offers a better picture. for example, the 5,588 arts organizations have total revenue of nearly $5 billion, which might sound as if a typical arts organization has annual revenue of nearly $1 million. the dramatically lower median revenue — at $106,500 — shows that while there are some arts nonprofits with very high revenues, more than 50% of arts organizations have annual revenue below $106,500.
Sources: IRS Business Master Files (BMF) of Registered 501(c) Exempt Organizations, 2014–2018; and IRS Form 990 and 990-EZ annual information returns, circa fiscal year 2016.
Human services and education nonprofits are the most numerous, while hospitals and universities dominate the revenue picture
Fig
ur
e 3
Organization TypeNumber of nonprofits
% of total nonprofits
% of total revenue
Average revenue
Median revenue
Human services 15,349 34.4% 11.1% $1,982,400 $153,600
Education, other 9,038 20.3% 5.9% $1,799,700 $107,300
Arts, culture, and humanities 5,588 12.5% 1.8% $871,000 $106,500
Mutual, Public and Societal Benefit 5,219 11.7% 3.1% $1,634,200 $98,000
Health, other 4,562 10.2% 11.5% $6,923,600 $192,100
Environment 2,515 5.6% 1.0% 1,136,600 $127,700
International 1,368 3.1% 0.9% $1,877,700 $120,200
Community foundations 294 0.7% 1.2% $11,285,900 $160,700
Higher Education 241 0.5% 8.8% $100,271,900 $3,817,000
Hospitals 203 0.5% 53.3% $717,969,700 $99,129,300
Federated giving 185 0.4% 0.4% $5,197,200 $270,000
National DAF sponsors 7 Less than 0.1% 0.9% $339,396,600 $31,855,400
TOTAL 44,569 100% 100% $6,141,039
Quantifying the size and scope of the nonprofit sector
Causes Count: the eConomiC Power of California’s nonProfit seCtor (2019) — CalnonProfits.org 15

total assets held:
$19 billion
a donor-advised fund (Daf) is a financial account that holds charitable
contributions from one or more donors
and is managed by a 501(c)(3) sponsor.
an individual can create a Daf at a Daf
sponsor, thereby obtaining an immediate
tax deduction regardless of when — or
if — these funds are later distributed to
active nonprofits. the Daf sponsor legally
controls the Daf and any distributions, but
in practice, sponsors make disbursements
based on directions from the donor who
created the account, which is why these
accounts are called “donor-advised funds.”
Daf sponsors include community
foundations, universities, religious charities,
and issue-based nonprofits such as
environmental funds, as well as large Daf
sponsors closely affiliated with for-profit
investment firms such as fidelity, Vanguard,
and schwab, that have created affiliated
501(c)(3) organizations to sponsor Dafs.
More about
Donor-Advised Funds
WHAt do dAFS look lIke IN CAlIForNIA?
of the three large Daf sponsors affiliated with commercial firms, only schwab is a California nonprofit. Many non-California residents hold Daf accounts in schwab, and many California residents hold Daf accounts in fidelity and Vanguard. the numbers above include schwab’s Daf accounts (not fidelity’s or Vanguard’s).
Because Daf sponsors other than community foundations are classified as active nonprofits, not as foundations, their activity shows up in nonprofit financial reports rather than in reports about foundations.
number of California-based nonprofits reporting they hold donor-advised funds:
157
total revenue:
$4.5 billion
Disbursements to other nonprofits:
$3.5 billion
source: irs form 990 annual information returns, circa fiscal year 2016.
16 CausesCount:theeConomiCPowerofCalifornia’snonProfitseCtor(2019)—CalnonProfits.org

a sector of
‘family farms’
percentage of California nonprofits mapped by their annual expense levels*
fiG
Ur
E 4
*includes 990-n filers
although 92,567 nonprofits sounds like a great many nonprofits, two-thirds are very small, with annual expenses of $50,000 or less. a nonprofit with $1 million or more in expenses is in the top 9% of nonprofits, and if it has $10 million or more in expenses, it is in the top 2%.
sources: irs Business Master files (BMf) of registered 501(c) Exempt organizations, 2014–2018; and irs form 990, 990-EZ, and 990-n (e-postcard) annual information returns, circa fiscal year 2016.
Conversely, two thirds of California nonprofits have expenses of $50,000 or less
less than 2% of all filing nonprofits have expenses over $10 million, yet they represent:
67% of total contributions
73% of total revenues
74% of total expenses
69% of total assets
1% 1% 1% 5%
66%
17%
9%
$20M and above
$10M to $20M
$5M to $10M
$1M to $5M
$250,000 to $1M
$50,000 to $250,000
Below $50,000*
annUal ExpEnsE lEVEls
Causes Count: the eConomiC Power of California’s nonProfit seCtor (2019) — CalnonProfits.org 17
one of every 14 California jobs is at a nonprofit
HIRINGNOW
Part 3
Nonprofit Jobs Count

the findings from this study document the importance of the nonprofit sector as a vital and vibrant locus of employment, utilizing both paid staff and unpaid volunteers (see page 25 for more information on volunteers).
note: the following data include religion, Hospitals, and Higher Education because their employee information is included in the data received from the Economic Development Department (EDD).
1.0m
.5m
0
nu
mb
er o
f E
mp
loye
es
in 2
016
(m
illio
ns)
sECtor *excludes private foundations
Ad
min
istr
atio
n &
Was
te S
ervi
ces
1,079
,000
Co
nst
ruct
ion
769,700
Wh
ole
sale
Tra
de
716,0
00
More Californians work at nonprofitsthan in construction
sources: California Employment Development Department, 2016, private industry Quarterly Census of Employment and Wages (QECW). numbers have been rounded to nearest hundred.
Fig
ur
e 5 Comparison of nonprofit
employment to select California industries
approximately 1.2 million Californians work for a nonprofit
one of every 14 California jobs is at a nonprofit
overall, nonprofits make up 7.2% of all California employment, and 8.4% of non-government employment
nonprofits rank as the 4th largest employer by number of jobs among key California industries, with more employees than construction, and the 3rd largest in total wages paid
California’s volunteers contribute the equivalent of 331,000 full-time jobs each year
nonprofit staff are more diverse in gender and race/ethnicity than the general workforce
the three industries with more jobs than nonprofits are: retail (1,667,800), accommodation/food service (1,586,300), and manufacturing (1,294,800)
Non
pro
fits
*
1,19
7,8
00
.
4th largest Employer in Ca
Causes Count: the eConomiC Power of California’s nonProfit seCtor (2019) — CalnonProfits.org 19

Nonprofit employment and wages — by subsector
Fig
ur
e 6
In addition to the 1.2 million jobs directly produced by the nonprofit sector, the economic model developed for the first Causes Count study indicates that the nonprofit sector supports an additional 800,000 jobs through both induced and indirect effects. The total effect is that 2 million jobs in California result from nonprofit activity.
Nonprofits
Healthcare
largest employer
sources: California Employment Development Department, 2016, private industry Quarterly Census of Employment and Wages (QECW), and irs Business Master files (BMf) of registered 501(c) Exempt organizations, 2014–2018. numbers have been rounded to nearest hundred; resulting in rounded totals.
nonprofit hospitals represent only 4% of all nonprofit employers, yet they account for 40% of total nonprofit wages. Conversely, human-service nonprofits account for 35% of all nonprofit employers, yet they account for only 11% of wages.
continues to be the nonprofit sector’s
Nonprofit sectorTotal jobs
Percent of total jobs
Percent of nonprofit
employers Total
wages paid
Percent of total
wages paidHospitals 352,200 29% 4% $29.3 billion 40%Human services 229,900 19% 37% $7.9 billion 11%Other health 150,900 13% 18% $9.1 billion 12%Higher education 215,300 18% 1% $15.8 billion 22%Other education 131,300 11% 13% $5.7 billion 8%Arts and humanities 35,800 3% 8% $1.5 billion 2%Religion-related 25,700 2% 7% $0.8 billion 1%Public/Societal benefit 33,600 3% 6% $2.3 billion 3%Environment and animals 15,700 1% 4% $0.7 billion 1%International and other 7,400 1% 2% $0.5 billion 1%Total public charities — 501(c)(3)s 1,197,800 100% 100% $73.5 billion 100%
paid $74 billionin wages to California workers
20 CausesCount:theeConomiCPowerofCalifornia’snonProfitseCtor(2019)—CalnonProfits.org
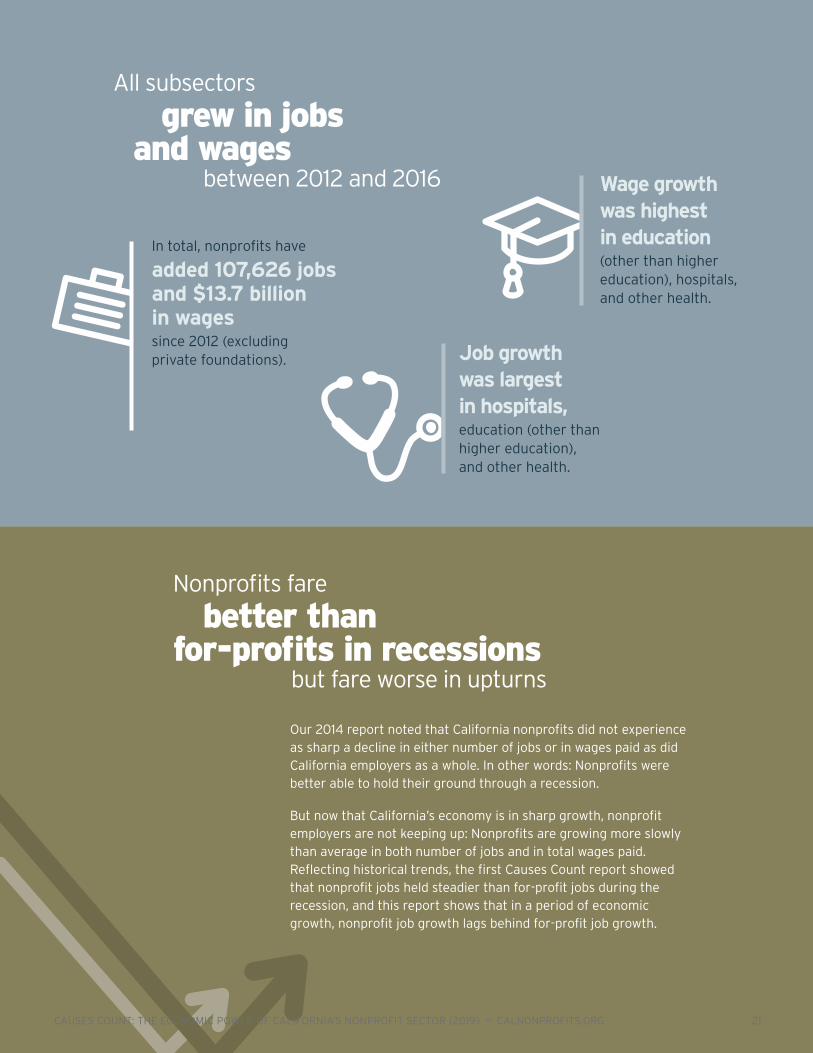
our 2014 report noted that California nonprofits did not experience as sharp a decline in either number of jobs or in wages paid as did California employers as a whole. in other words: nonprofits were better able to hold their ground through a recession.
But now that California’s economy is in sharp growth, nonprofit employers are not keeping up: nonprofits are growing more slowly than average in both number of jobs and in total wages paid. reflecting historical trends, the first Causes Count report showed that nonprofit jobs held steadier than for-profit jobs during the recession, and this report shows that in a period of economic growth, nonprofit job growth lags behind for-profit job growth.
all subsectors
grew in jobs and wages between 2012 and 2016
Nonprofits fare better than for-profits in recessions but fare worse in upturns
in total, nonprofits have
added 107,626 jobs and $13.7 billion in wages since 2012 (excluding private foundations).
Wage growth was highest in education (other than higher education), hospitals, and other health.
Job growth was largest in hospitals,education (other than higher education), and other health.
Causes Count: the eConomiC Power of California’s nonProfit seCtor (2019) — CalnonProfits.org 21

nonprofit employers and workforce
growing more slowly than California employers in general
of nonprofits with paid staff it’s hard to draw a picture of a “typical” nonprofit with such a large gap between averages and medians, demonstrating the uneven distribution of staff among nonprofits. as shown below, while the average number of full time employees is 36, it is also the case that 50% of nonprofit employers have fewer than six employees.
Full time employees (20+ hours/week)
Part-time employees (less than 20 hours/week)
in addition, 47% of nonprofit survey respondents report utilizing independent contractors for services other than audits or legal.
Sources: California Employment Development Department, 2012 and 2016, Private Industry Quarterly Census of Employment and Wages (QECW), and IRS Business Master Files (BMF) of Registered 501(c) Exempt Organizations, 2011–2018
Change in nonprofit employers and average quarterly employment from 2012–2016
Fig
ur
e 7
Nonprofit employers
All California employers
+25%
+23%
Total wages paid
Average quarterly employment
Nonprofit employers
All California employers
+13%+10%
Number of Employees
Nonprofit employers
All California employers
+10%+10%
average and median full-time and part-time employees in nonprofits
source: California nonprofit survey (2018–2019)
fiG
Ur
E 8
AVERAGE: 36 MEDIAN: 6
MEDIAN: 2.5AVERAGE: 15
22 CausesCount:theeConomiCPowerofCalifornia’snonProfitseCtor(2019)—CalnonProfits.org

WaGEs anD BEnEfits
nonprofits provide
a range of employee benefits
with nearly 80% providing some level of health insurance
source: California nonprofit survey (2018–2019)
percent of California nonprofits providing certain employee benefits
fiG
Ur
E 9
Retirement PlanWithout employer contribution or only if employee contributes
Health BenefitsEmployer less than 50% of premium
Dental BenefitsEmployer less than 50% of premium
Holidays, Sick Pay, and/or Paid Time Off
Health BenefitsEmployer covers 50% or more of premium
Dental BenefitsEmployer covers 50% or more of premium
Retirement PlanWith employer contribution
Life Insurance
Long-term Disability
Parking or Commuting
92%
65%
53%
35%
45%
38%
30%
14%
14%
23%
Causes Count: the eConomiC Power of California’s nonProfit seCtor (2019) — CalnonProfits.org 23

People of Color
DiVErsEWorkforCE
California nonprofits employ a significantly higher percentage of women
and a slightly higher percentage of people of color than the overall civilian workforce
California employees
staff leadership
and in leadership positions, nonprofit percentages of women and people of color are more than twice as high as in the overall workforce.
overall leadership staff6 across all industries
overall6 leadership staff across all industries
Board leadership
fiG
Ur
E 1
2
3. https://www.labormarketinfo.edd.ca.gov/publications/labor-Market-analysis/calmr.pdf note: Data is updated monthly.
4. California nonprofit survey (2018–2019) — leaders were defined as individuals on management team.
5. report: Missing pieces: the 2018 Board Diversity Census of Women and Minorities on fortune 500 Boards. alliance for Board Diversity and Deloitte. https://www.catalyst.org/research/missing-pieces-report-the-2018-board-diversity-census-of-women-and-minorities-on-fortune-500-boards
6. U.s. Current population survey. 2018. Bureau of labor statistics. https://www.bls.gov/cps/cpsaat11.htm — includes nonprofit sector as part of “all industries.” leaders were defined as CEos, General and operations Managers.
Women
Women
Women
overall workforce4
overall workforce4
nonprofit workforce3
nonprofit leadership staff5
nonprofit Boards of Directors5
nonprofit Boards of Directors5
fortune 5006 Boards of Directors
fortune 5006 Boards of Directors
nonprofit leadership staff5
nonprofit workforce3
63%
73%
27%
56%
29%
31%
45%
28%
29%
23%
16%
12%
People of Color
People of Color
fiG
Ur
E 1
0fi
GU
rE
11
24 CausesCount:theeConomiCPowerofCalifornia’snonProfitseCtor(2019)—CalnonProfits.org

VolUntEErs
nonprofits can have significant impact in
their communities because of their volunteer workforce
While it’s clear that California nonprofits raise money, less visible is that they “raise” $16.6 billion each year8 by mobilizing volunteers to contribute unpaid hours.
although volunteers are sometimes seen as marginal to nonprofit work or dismissed as “envelope stuffers,” this study shows that volunteers are primarily involved in the core, direct
work of nonprofits, including helping people, caring for animals, and improving the environment.
*Does not include employment by nonprofits filing Form 990-EZ, 990-N. Missing values for volunteer and employee counts on Form 990 are excluded.
Sources: IRS Business Master Files (BMF) of Registered 501(c) Exempt Organizations, 2014-2018; and IRS Form 990 annual information returns, circa fiscal year 2016.
Fig
ur
e 1
3 Total volunteers and employees reported on Form 990 by California nonprofits in 2016 by expense levels (includes Higher Education and Hospitals)*
Volunteers in California
contribute the equivalent
of
full-time workers8
331,058
Volunteers bring both economic and intangible value to communities through nonprofits of all sizes and types. they care for people in hospice, raise critical program funds, advocate for clean water, serve as Cfos, museum docents, bus drivers, tax preparers, and surgical nurses.
Volunteers are the overlooked workforce that the nonprofit sector mobilizes and deploys. on average, nonprofits each work with 214 part-time volunteers and 19 full-time (more than 20 hours per week) volunteers.7
7. California nonprofit survey (2018–2019)
8. Volunteer and Civic life in america. 2018. Corporation for national and Community service. https://www.nationalservice.gov/serve
More than 4.8 million volunteers serve California’s communities
VOLuNtEERs PAID stAFF
Expenses Number of nonprofits
Total Median Median
Below $50,000 559 36,690 16 less than 1
$50,000 to $249,999 2,210 220,740 32 1
$250,000 to $999,999 4,406 663,939 40 7
$1M to $4.99M 4,142 1,488,727 40 27
$5M to $9.99M 1,046 488,845 50 87
$10M to $19.99M 779 521,612 61 166
$20M and above 901 1,405,402 100 469
TOTAL 14,043 4,825,955 40 13
Causes Count: the eConomiC Power of California’s nonProfit seCtor (2019) — CalnonProfits.org 25

What activities do volunteers do?
Fig
ur
e 1
4
Source: California Nonprofit Survey (2018–2019)
A great deal A moderate amount
9. Volunteer and Civic Life in America. 2018. Corporation for National and Community Service. https://www.nationalservice.gov/serve/and Volunteer and Civic Life in America. 2015. Corporation for National and Community Service. https://www.nationalservice.gov/vcla/state/California
California has
dropped to
47th from 34th
among the states
in 2014 in rates of
volunteering.
0% 20% 40% 60%
The percentage of
people volunteering
in California (25%)
is notably lower
than the national
average of 30%
Although the percentage
of adults volunteering
has risen slightly from
24% to 25%, total
volunteer hours
have decreased by an
alarming 25%, from 940
million hours in 2015 to
689 million hours in 2017.
42%
25%
23%
14%
12%
7%
17%
26%
22%
19%
17%
9%
But California’s volunteer workforce may be changing, given some cautionary trends in this critical, large, unpaid workforce:9
Troubling signs in volunteerism
Core program or service delivery (e.g., hospice care, theatre usher, trail maintenance, etc.)
Help raise awareness of the nonprofit
Fundraising activities
Administrative and/or technical tasks (e.g., recordkeeping, bookkeeping, writing a newsletter, building maintenance, etc.)
Social media and other technology-related activities
Advocacy activities (e.g., writing letters to elected officials, turning out for demonstrations, etc.)
26 CausesCount:theeConomiCPowerofCalifornia’snonProfitseCtor(2019)—CalnonProfits.org
Part 4
Disparities and Equity
Differences and disparities among geographic areas: wide and getting wider
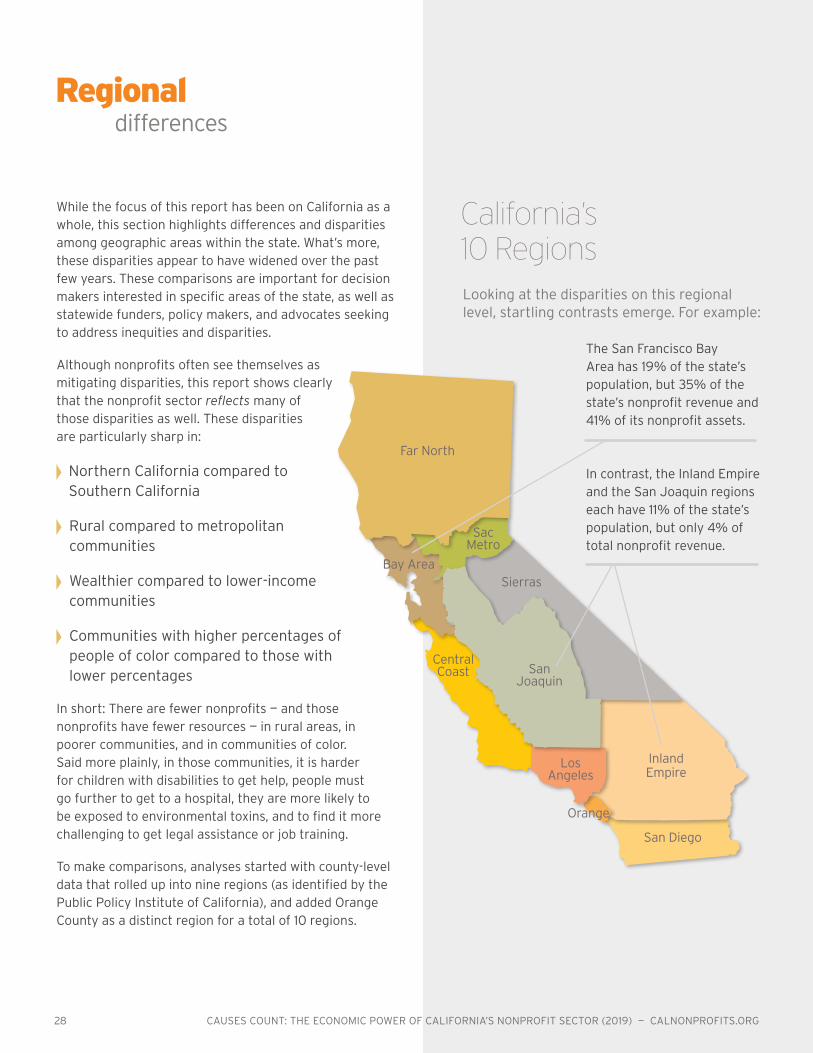
While the focus of this report has been on California as a whole, this section highlights differences and disparities among geographic areas within the state. What’s more, these disparities appear to have widened over the past few years. these comparisons are important for decision makers interested in specific areas of the state, as well as statewide funders, policy makers, and advocates seeking to address inequities and disparities.
although nonprofits often see themselves as mitigating disparities, this report shows clearly that the nonprofit sector reflects many of those disparities as well. these disparities are particularly sharp in:
northern California compared to southern California
rural compared to metropolitan communities
Wealthier compared to lower-income communities
Communities with higher percentages of people of color compared to those with lower percentages
in short: there are fewer nonprofits — and those nonprofits have fewer resources — in rural areas, in poorer communities, and in communities of color. said more plainly, in those communities, it is harder for children with disabilities to get help, people must go further to get to a hospital, they are more likely to be exposed to environmental toxins, and to find it more challenging to get legal assistance or job training.
to make comparisons, analyses started with county-level data that rolled up into nine regions (as identified by the public policy institute of California), and added orange County as a distinct region for a total of 10 regions.
Regional differences
Far North
Sac Metro
Sierras
San Joaquin
Los Angeles
San Diego
Orange
CentralCoast
Inland Empire
Bay Area
California’s 10 Regions
the san francisco Bay area has 19% of the state’s population, but 35% of the state’s nonprofit revenue and 41% of its nonprofit assets.
in contrast, the inland Empire and the san Joaquin regions each have 11% of the state’s population, but only 4% of total nonprofit revenue.
looking at the disparities on this regional level, startling contrasts emerge. for example:
28 CausesCount:theeConomiCPowerofCalifornia’snonProfitseCtor(2019)—CalnonProfits.org

Fig
ur
e 1
5
northern California
southern California
some counties have more than six times the nonprofit revenue per capita than other counties
total revenue dollars per 1,000 residents by county for 501(c)(3) public charity organizations filing irs forms 990 and 990-EZ (excludes Higher Education and Hospitals)
Sources: IRS Business Master Files (BMF) of Registered 501(c) Exempt Organizations, 2014–2018; and IRS Form 990 and 990-EZ annual information returns, circa fiscal year 2016.
$3,000 and above
$1,500 – $2,999
$1,000 – $1,499
$500 – $999
less than $500
Dollars per resident
Colusa
Glenn
Kings
Mariposa
Modoc
Sacramento
SanBernardino
Shasta
Tulare
Alpine
Merced
Mono
Monterey
Nevada
Orange
Placer
Riverside
SanBenito
Amador
Butte
Calaveras
el Dorado
Fresno
Humboldt
Imperial
Inyo
Kern
Lake
Lassen
Madera
San LuisObispo
Siskiyou
Stanislaus
Tehama
Trinity
Tuolumne
Yolo
Yuba
Sutter
LosAngeles
Ventura
Marin
Santa Clara
San Diego
Alameda
Mendocino
Plumas
Sierra
DelNorte
Santa Cruz
Contra Costa
Solano
NapaSonoma
San Joaquin
San Francisco
San Mateo
Santa Barbara
Causes Count: the eConomiC Power of California’s nonProfit seCtor (2019) — CalnonProfits.org 29
Nonprofit dollars per
resident
4,583273451
1,49175897
1,553405936
1,6081,4392,676
8352,486
953536704
1,1452,8391,0425,332
6013,637
7421,2821,0541,7523,6601,7642,1552,4053,517
5913,132
4161,4393,008
14,071904
2,1002,5525,5615,2322,6681,9044,340
974551
2,102820
1,152421999
1,081749
1,2321,353
818
County
AlamedaAlpineAmadorButteCalaverasColusaContra CostaDel NorteEl DoradoFresnoGlennHumboldtImperialInyoKernKingsLakeLassenLos AngelesMaderaMarinMariposaMendocinoMercedModocMonoMontereyNapaNevadaOrangePlacerPlumasRiversidesacramentosan Benitosan Bernardinosan Diegosan Franciscosan Joaquinsan Luis Obisposan Mateosanta Barbarasanta Clarasanta CruzshastasierrasiskiyousolanosonomastanislaussuttertehamatrinitytularetuolumneVenturaYoloYuba

Fig
ur
e 1
6
Region
Number of nonprofits with gov’t funding
Percent of nonprofits with gov’t funding Population
Residents per nonprofit with gov’t funding
Bay Area 1,988 34% 7,407,608 3,726
Los Angeles 1,403 24% 10,704,409 7,630
san Diego 497 8% 3,318,325 6,677
sacramento Metro 429 7% 2,202,519 5,134
Central Coast 368 6% 1,401,861 3,809
san Joaquin 329 6% 3,898,404 11,849
Inland Empire 314 5% 4,326,291 13,778
Far North 284 5% 1,116,000 3,930
Orange 225 4% 3,100,622 13,781
sierras 51 1% 163,982 3,215
TOTAL 5,888 100% 37,640,021 6,393
Disparities between regions are perhaps easier to understand in foundation giving and in individual donations. But government funding reflects these same disparities. figure 16 shows that more nonprofits in the Bay area receive government funding and there are fewer residents per nonprofit with government funding than most other regions. in other words, there is more government funding available per resident in the Bay area.
to understand a region’s nonprofit resources, two measures are often used in this report. one is “total nonprofit revenue” which refers to the financial resources that the total of all nonprofits in that region obtain — including fees, government funds, individual giving, foundation and corporate grants, and so forth. the other is “nonprofit revenue per capita,” which divides total nonprofit revenue by the number of residents in that region.
Government funding: Deep disparities in how funds are distributed
Government funding to California nonprofits by region
Sources: 2016 Annual Registration Renewal Fee Report (RRF-1); IRS Form 990/990EZ Returns, circa 2016. Includes government grants from all levels of government.
30 CausesCount:theeConomiCPowerofCalifornia’snonProfitseCtor(2019)—CalnonProfits.org
Fig
ur
e 1
7
*Rounded to nearest $100; totals may not add up due to rounding.
Source: Foundation Center, 2019 Based on all grants of $10,000 or more awarded by the FC 1000 – a set of 1,000 of the largest U.S. private and community foundations by giving. For community foundations, both donor-advised grants and discretionary grants are included when provided by the foundation. Grants to U.S.-based private and community foundations are excluded to avoid double-counting grant dollars awarded. Grants to individuals are not included in the sample.
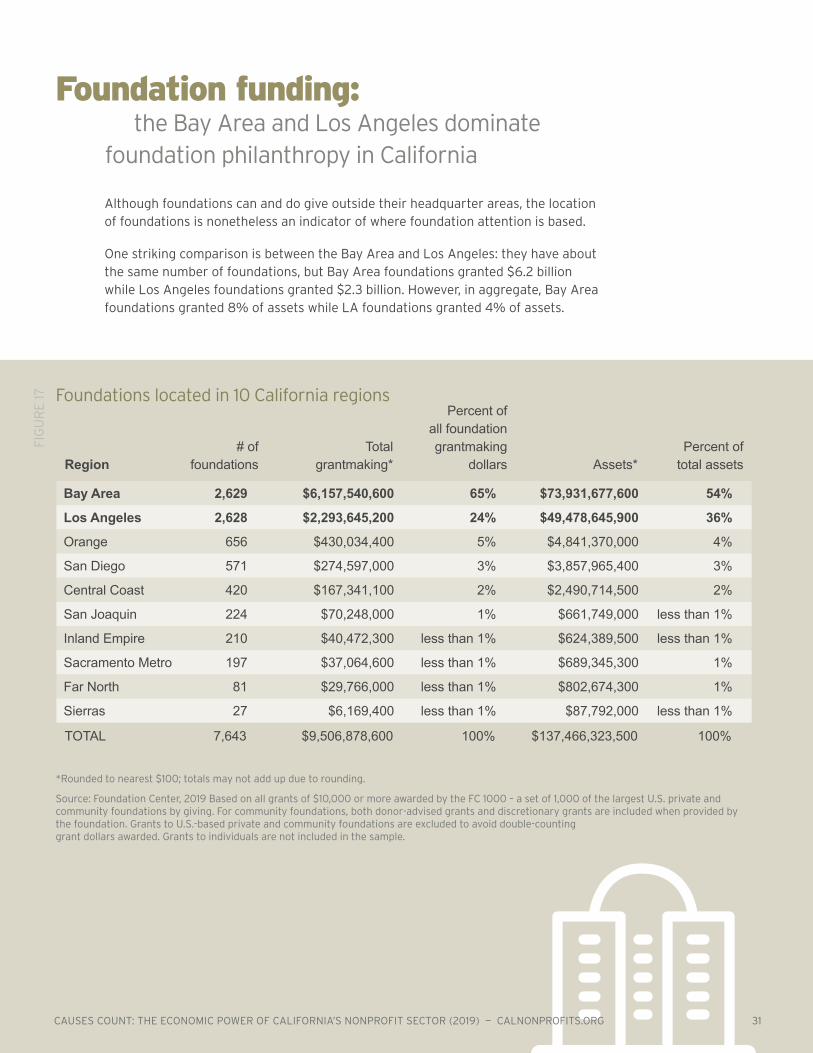
Foundation funding: the Bay Area and Los Angeles dominate foundation philanthropy in California
Region# of
foundationstotal
grantmaking*
Percent of all foundation grantmaking
dollars Assets* Percent of
total assets
Bay Area 2,629 $6,157,540,600 65% $73,931,677,600 54%
Los Angeles 2,628 $2,293,645,200 24% $49,478,645,900 36%
Orange 656 $430,034,400 5% $4,841,370,000 4%
san Diego 571 $274,597,000 3% $3,857,965,400 3%
Central Coast 420 $167,341,100 2% $2,490,714,500 2%
san Joaquin 224 $70,248,000 1% $661,749,000 less than 1%
Inland Empire 210 $40,472,300 less than 1% $624,389,500 less than 1%
sacramento Metro 197 $37,064,600 less than 1% $689,345,300 1%
Far North 81 $29,766,000 less than 1% $802,674,300 1%
sierras 27 $6,169,400 less than 1% $87,792,000 less than 1%
tOtAL 7,643 $9,506,878,600 100% $137,466,323,500 100%
foundations located in 10 California regions
although foundations can and do give outside their headquarter areas, the location of foundations is nonetheless an indicator of where foundation attention is based.
one striking comparison is between the Bay area and los angeles: they have about the same number of foundations, but Bay area foundations granted $6.2 billion while los angeles foundations granted $2.3 billion. However, in aggregate, Bay area foundations granted 8% of assets while la foundations granted 4% of assets.
Causes Count: the eConomiC Power of California’s nonProfit seCtor (2019) — CalnonProfits.org 31

the northern California nonprofit community has more resources
Revenues and assets per capita of nonprofits filing Form 990/990EZ in Northern and Southern California (excludes Higher Education and Hospitals)
When analyzing nonprofits that filed form 990 or 990-EZ, 47% of nonprofits are located in northern California, and the remaining 53% in southern California. (see map on page 29 for counties considered northern and southern in this study.)
figure 18 illustrates several different measures associated with nonprofits in these two regions, including the percentages of nonprofits, revenue, and assets. northern California nonprofits generate $3,245 in revenue for every person living in the region, while nonprofits in southern California generate $2,322 in revenue per capita. similarly, northern California nonprofits hold more assets per capita ($6,317) than southern California ($3,845).
northern California vs. southern California:
Disparities growing
locationnumber of nonprofits
% of total
total revenue (in billions)
% of total revenue
total assets (in billions)
% of total assets
revenue per capita
assets per capita
north 20,592 47% $49.2 47% $95.8 52% $3,245 $6,317
south 23,533 53% $54.5 53% $90.3 48% $2,322 $3,845
total/aVG 44,125 100% $103.8 100% $186.1 100% $2,684 $4,815
trend analyses between 2012 and 2016 reveal that these gaps between northern and southern California are increasing in terms of the number of residents per public charity and assets per capita but the gap is shrinking in terms of revenue per capita.
the southern California nonprofit community grew faster in revenue since 2012, with a 31% increase per capita compared to 28% in northern California.
However, perhaps skewed by asset growth in schwab Charitable fund and the silicon Valley Community foundation (both in northern California), northern California nonprofit assets grew 38% per capita while southern California nonprofit assets grew 31% per capita.
northern California
southern California
northern California nonprofits generate $3,245 in revenue for every person
southern California nonprofits only generate $2,322 for every person
northern California nonprofits hold $6,317 in assets for every person
southern California nonprofits only hold $3,845 for every person
vs.vs.
For example:
Sources: IRS Business Master Files (BMF) of Registered 501(c) Exempt Organizations, 2014–2018; and IRS Form 990 and 990-EZ annual information returns, circa fiscal year 2016; US Census, American Community Survey by ZIP Code Tabulation Area (ACS 5-year ZCTA estimates, 2012 and 2016)
Fig
ur
e 1
8
32 CausesCount:theeConomiCPowerofCalifornia’snonProfitseCtor(2019)—CalnonProfits.org
Note: totals may not add up due to rounding.
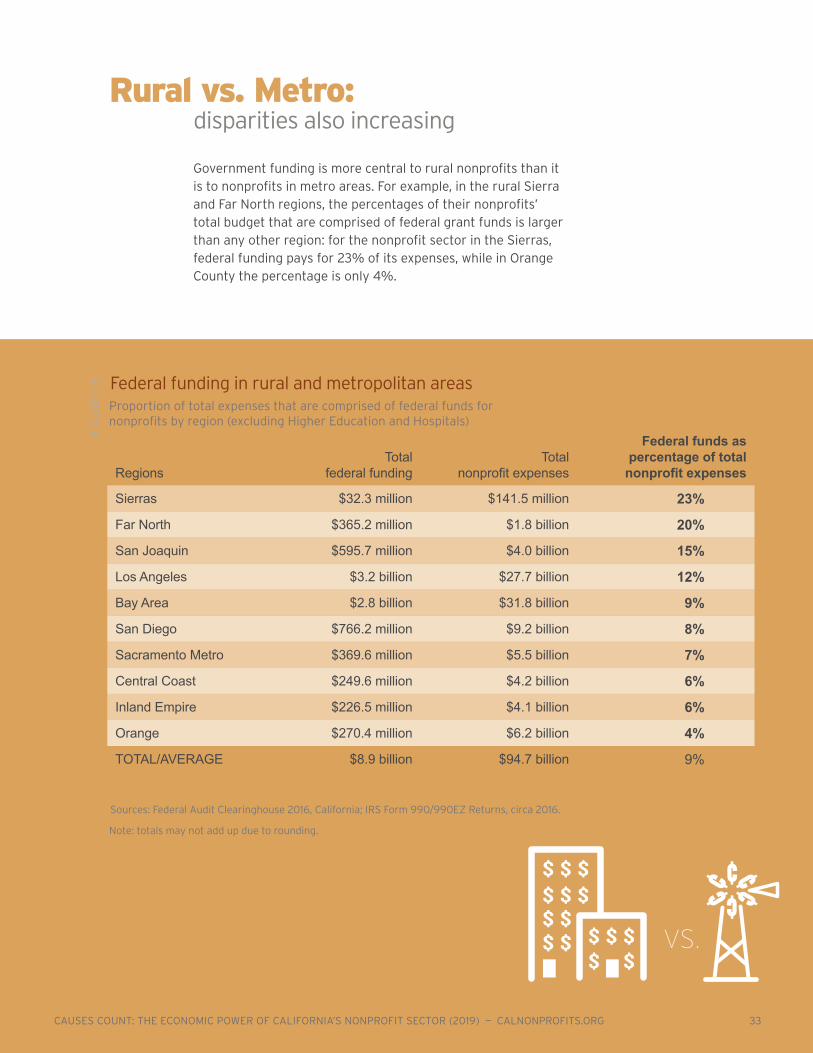
Regionstotal
federal fundingtotal
nonprofit expenses
Federal funds as percentage of total
nonprofit expenses
sierras $32.3 million $141.5 million 23%
Far North $365.2 million $1.8 billion 20%
san Joaquin $595.7 million $4.0 billion 15%
Los Angeles $3.2 billion $27.7 billion 12%
Bay Area $2.8 billion $31.8 billion 9%
san Diego $766.2 million $9.2 billion 8%
sacramento Metro $369.6 million $5.5 billion 7%
Central Coast $249.6 million $4.2 billion 6%
Inland Empire $226.5 million $4.1 billion 6%
Orange $270.4 million $6.2 billion 4%
tOtAL/AVERAGE $8.9 billion $94.7 billion 9%
Sources: Federal Audit Clearinghouse 2016, California; IRS Form 990/990EZ Returns, circa 2016.
Rural vs. Metro: disparities also increasing
Federal funding in rural and metropolitan areas
Fig
ur
e 1
9
Government funding is more central to rural nonprofits than it is to nonprofits in metro areas. For example, in the rural Sierra and Far North regions, the percentages of their nonprofits’ total budget that are comprised of federal grant funds is larger than any other region: for the nonprofit sector in the Sierras, federal funding pays for 23% of its expenses, while in Orange County the percentage is only 4%.
Proportion of total expenses that are comprised of federal funds for nonprofits by region (excluding Higher Education and Hospitals)
vs.
Causes Count: the eConomiC Power of California’s nonProfit seCtor (2019) — CalnonProfits.org 33

Disparities between metro and rural areas growing wider
Sources: CalNonprofits (circa 2012), NCCS Core Files (circa 2012; excludes higher education and hospital organizations)and American Community Survey (ACS 5-year estimates, 2012)
2012 Metro 2016 Metro 2012 rural 2016 rural
% of population 98% 98% 2% 2%
# of nonprofits 42,446 42,704 1,490 1,421
% of nonprofits 97% 97% 3% 3%
total revenue $76.1 billion $102.4 billion $1.1 billion $1.3 billion
% of revenue 99% 99% 1% 1%
revenue per resident $2,086 $2,708 $1,272 $1,592
Fig
ur
e 2
0
rural nonprofits work with
sharply fewer resources than nonprofits in metropolitan areas
there are fewer people in rural parts of California, but to serve them nonprofits have notably less revenue per person than their metropolitan counterparts. specifically, nonprofits in metro areas have 41% more revenue per capita than nonprofits in rural areas.
trend analyses reveal that these gaps between rural and metropolitan areas are increasing. in both 2012 and 2016,
98% of California’s population was located in metro areas and 2% in rural areas. But in 2012, rural areas had $1,272 per resident compared to $2,086 in metro areas. in 2016, rural areas had $1,592 per resident compared to $2,708 per resident in metro areas. in other words, for every dollar per resident in 2012 that metropolitan areas had, rural areas had 61 cents. now they have 59 cents.
34 CausesCount:theeConomiCPowerofCalifornia’snonProfitseCtor(2019)—CalnonProfits.org
Fig
ur
e 2
1
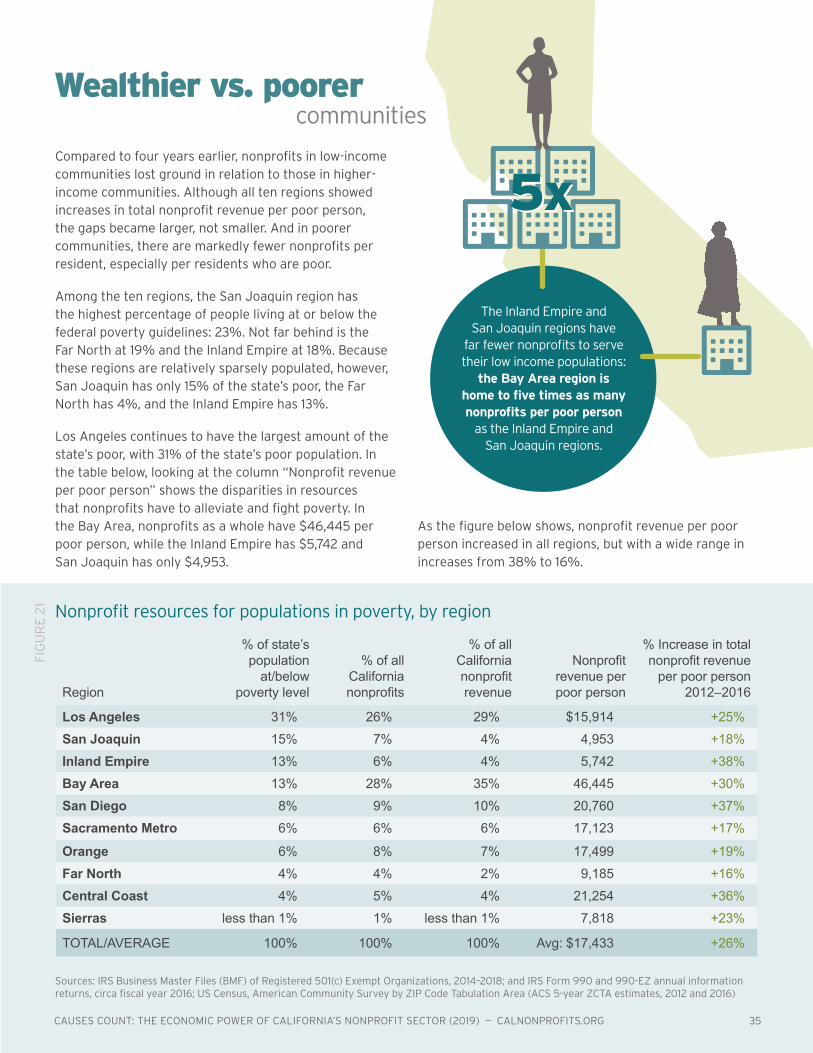
Compared to four years earlier, nonprofits in low-income communities lost ground in relation to those in higher-income communities. although all ten regions showed increases in total nonprofit revenue per poor person, the gaps became larger, not smaller. and in poorer communities, there are markedly fewer nonprofits per resident, especially per residents who are poor.
among the ten regions, the san Joaquin region has the highest percentage of people living at or below the federal poverty guidelines: 23%. not far behind is the far north at 19% and the inland Empire at 18%. Because these regions are relatively sparsely populated, however, san Joaquin has only 15% of the state’s poor, the far north has 4%, and the inland Empire has 13%.
los angeles continues to have the largest amount of the state’s poor, with 31% of the state’s poor population. in the table below, looking at the column “nonprofit revenue per poor person” shows the disparities in resources that nonprofits have to alleviate and fight poverty. in the Bay area, nonprofits as a whole have $46,445 per poor person, while the inland Empire has $5,742 and san Joaquin has only $4,953.
Wealthier vs. poorer communities
the inland Empire and san Joaquin regions have
far fewer nonprofits to serve their low income populations:
the Bay Area region is home to five times as many nonprofits per poor person
as the inland Empire and san Joaquin regions.
Region
% of state’s population
at/below poverty level
% of all California nonprofits
% of all California nonprofit revenue
Nonprofit revenue per poor person
% Increase in total nonprofit revenue
per poor person 2012–2016
Los Angeles 31% 26% 29% $15,914 +25%
San Joaquin 15% 7% 4% 4,953 +18%
Inland Empire 13% 6% 4% 5,742 +38%
Bay Area 13% 28% 35% 46,445 +30%
San Diego 8% 9% 10% 20,760 +37%
Sacramento Metro 6% 6% 6% 17,123 +17%
Orange 6% 8% 7% 17,499 +19%
Far North 4% 4% 2% 9,185 +16%
Central Coast 4% 5% 4% 21,254 +36%
Sierras less than 1% 1% less than 1% 7,818 +23%
tOtAL/AVERAGE 100% 100% 100% Avg: $17,433 +26%
nonprofit resources for populations in poverty, by region
sources: irs Business Master files (BMf) of registered 501(c) Exempt organizations, 2014–2018; and irs form 990 and 990-EZ annual information returns, circa fiscal year 2016; Us Census, american Community survey by Zip Code tabulation area (aCs 5-year ZCta estimates, 2012 and 2016)
as the figure below shows, nonprofit revenue per poor person increased in all regions, but with a wide range in increases from 38% to 16%.
5x
Causes Count: the eConomiC Power of California’s nonProfit seCtor (2019) — CalnonProfits.org 35
Fig
ur
e 2
2
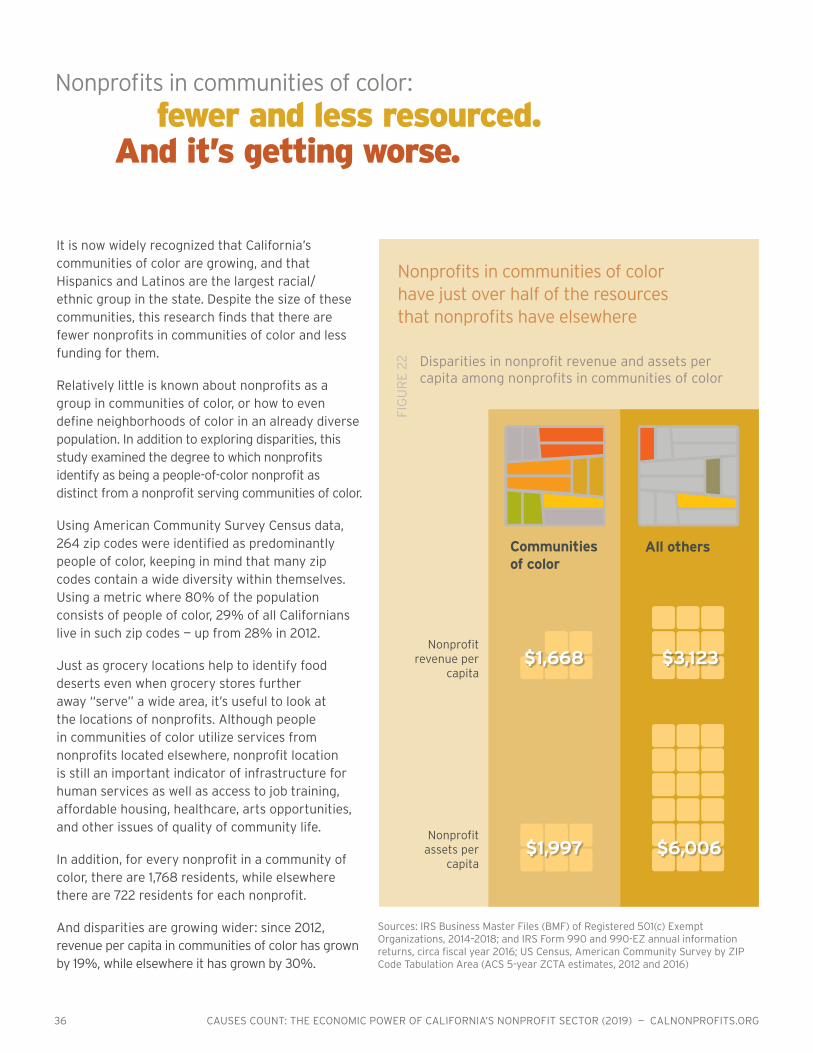
Nonprofits in communities of color have just over half of the resources that nonprofits have elsewhere
Disparities in nonprofit revenue and assets per capita among nonprofits in communities of color
Communities of color
All others
Nonprofit revenue per
capita
Nonprofit assets per
capita$1,997
$3,123
sources: irs Business Master files (BMf) of registered 501(c) Exempt organizations, 2014–2018; and irs form 990 and 990-EZ annual information returns, circa fiscal year 2016; Us Census, american Community survey by Zip Code tabulation area (aCs 5-year ZCta estimates, 2012 and 2016)
it is now widely recognized that California’s communities of color are growing, and that Hispanics and latinos are the largest racial/ethnic group in the state. Despite the size of these communities, this research finds that there are fewer nonprofits in communities of color and less funding for them.
relatively little is known about nonprofits as a group in communities of color, or how to even define neighborhoods of color in an already diverse population. in addition to exploring disparities, this study examined the degree to which nonprofits identify as being a people-of-color nonprofit as distinct from a nonprofit serving communities of color.
Using american Community survey Census data, 264 zip codes were identified as predominantly people of color, keeping in mind that many zip codes contain a wide diversity within themselves. Using a metric where 80% of the population consists of people of color, 29% of all Californians live in such zip codes — up from 28% in 2012.
Just as grocery locations help to identify food deserts even when grocery stores further away “serve” a wide area, it’s useful to look at the locations of nonprofits. although people in communities of color utilize services from nonprofits located elsewhere, nonprofit location is still an important indicator of infrastructure for human services as well as access to job training, affordable housing, healthcare, arts opportunities, and other issues of quality of community life.
in addition, for every nonprofit in a community of color, there are 1,768 residents, while elsewhere there are 722 residents for each nonprofit.
and disparities are growing wider: since 2012, revenue per capita in communities of color has grown by 19%, while elsewhere it has grown by 30%.
nonprofits in communities of color:
fewer and less resourced. And it’s getting worse.
$1,668
$6,006
36 CausesCount:theeConomiCPowerofCalifornia’snonProfitseCtor(2019)—CalnonProfits.org

Fig
ur
e 2
3 Percent of nonprofits who serve communities of color
14%
64%
When looking at communities of color, often no distinction is made between a mainstream service provider that serves that community, and a service provider that has come from and is led by people from that community. Both are valuable. Nonprofits in and of communities of color typically play many more roles than simply service provider: they are important employers, training grounds for young people, and apprenticeships for leadership in fundraising, management, and navigating complex environments. Perhaps most overlooked is their role as power brokers for the community with local government, local business, and philanthropy.
We asked nonprofits how their organizations identify and which communities they proactively serve. The 1,222 responses are a start towards a better understanding of these nonprofits.
Of the California nonprofits surveyed, 14% identify as a community of color nonprofit, and 64% of nonprofits report serving communities of color.
Further research on nonprofits that identify as community of color nonprofits — and how such communities interact with all the nonprofits that serve them — would be important for better understanding by nonprofits, funders, and policymakers.
Nonprofit Organizations of Color
Identify as a community-of-color nonprofit
Report serving people in communities of color
Source: California Nonprofit Survey (2018-2019). N=1,222
Percent of nonprofits who serve communities of color
Causes Count: the eConomiC Power of California’s nonProfit seCtor (2019) — CalnonProfits.org 37

Where California nonprofits get their money, and how it’s changing
Part 5
Nonprofit Finances Count

*Excludes Hospitals and Higher Ed because government funding is underreported on IRS Form 990 for these two subsectors. Percent of nonprofit revenue that comes from the government is likely higher because Medicare/Medi-Cal is underreported.
Sources: IRS Business Master Files (BMF) of Registered 501(c) Exempt Organizations, 2014-2018; and IRS Forms 990 and 990-EZ annual information returns, circa fiscal year 2016. Portions of government program service revenue estimates based on IRS Statistics of Income (SOI) weighted sample of Form 990, 2004-2007.
Sources of revenues of 501(c)(3) public charities filing Form 990/990EZ in CA c. FY 2016 (Excludes Religion, Higher Ed, Hospitals)*
an economic impact report such as this one appropriately focuses on economic activity outside the nonprofit community. But the economic engines in each separate nonprofit are important to understand as well.
California nonprofits are growing in revenue. from field to field and from large to small they employ dramatically different revenue models — relying more on earned fees and government funding than is commonly believed.
Where do California nonprofits obtain their funds?this section will first describe where nonprofits actually get their funding. then we will take a closer look at government funding to better understand the relationship and interdependence between nonprofits and government.
Based on an analysis of estimates derived from form 990 data,10 the percent of program service revenue and the percent of government contributions have remained fairly consistent between 2008 and 2016.
10. portions of government program service revenue estimates based on irs statistics of income (soi) weighted sample of form 990, 2004-2007.
Contrary to common perception, the largest sources of nonprofit revenue are fees for service and government
3%3%
30%
27%
Fig
ur
e 2
4
Fees for service and program revenue
Other income
Individual donations, foundation grants,
corporate grants
Investment and Asset Sales
Government
37%
Causes Count: the eConomiC Power of California’s nonProfit seCtor (2019) — CalnonProfits.org 39

Fig
ur
e 2
5
Sources: IRS Business Master Files (BMF) of Registered 501(c) Exempt Organizations, 2014-2018; and IRS Forms 990 and 990-EZ annual information returns, circa fiscal year 2016.
Hos
pital
s
Hospitals
1%
Env
ironm
ent
Inte
rnat
ional
Hig
her
Ed
uca
tio
n
1%6% 3%
%= Percent of total
sector revenue= Percent of total
number of nonprofits
%
Hea
lth
, oth
er
10%
Hu
man
ser
vice
s
34%
20%
Ed
uca
tio
n, o
ther
Art
s, c
ult
ure
, an
d h
um
anit
ies
13%
Mu
tual
, Pu
blic
an
d
So
ciet
al B
enefi
t
12%
Co
mm
un
ity
Fou
nd
atio
n
1%
3%
12%
1%2%
6%
11%
1% 1%
9%
53%
the graph below shows that while arts and culture nonprofits represent 13% of the number of nonprofits, they bring in only 2% of the sector’s revenue. in contrast, hospitals are only 1% of the nonprofit sector by count, but they hold 53% of the sector’s revenue.
subsector size
vs. subsector revenue
percent of all nonprofits compared to percent of revenue, by subsector(not including private foundations and commercially-affiliated Donor-advised fund sponsors)
40 CausesCount:theeConomiCPowerofCalifornia’snonProfitseCtor(2019)—CalnonProfits.org
0% 50% 100%
Contributions Governmentprogram revenue
investment income
other income
small and large nonprofits have different revenue pictures
Sources of revenues of 501(c)(3) public charities filing Form 990/990EZ in California by expenses (excludes Religion, Higher Education, and Hospitals)
Fig
ur
e 2
6
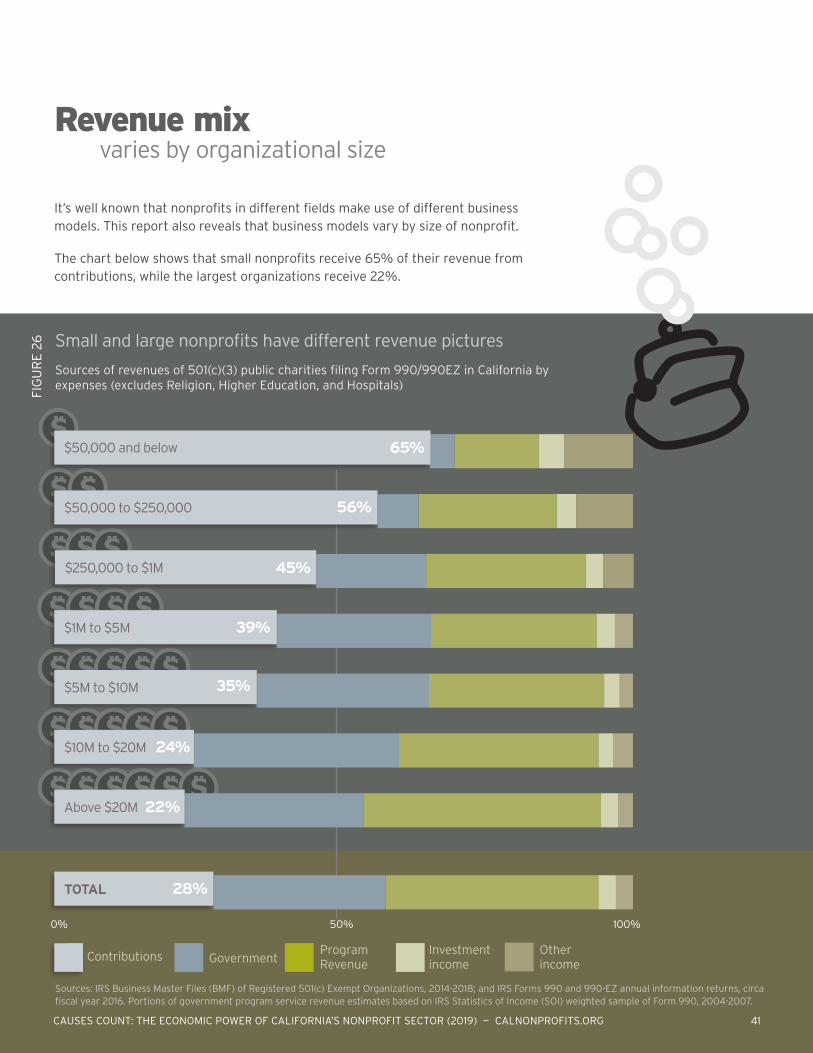
it’s well known that nonprofits in different fields make use of different business models. this report also reveals that business models vary by size of nonprofit.
the chart below shows that small nonprofits receive 65% of their revenue from contributions, while the largest organizations receive 22%.
Revenue mix varies by organizational size
$50,000 and below 65%
$50,000 to $250,000 56%
$250,000 to $1M 45%
$1M to $5M 39%
$5M to $10M 35%
$10M to $20M 24%
Above $20M 22%
ToTal 28%
sources: irs Business Master files (BMf) of registered 501(c) Exempt organizations, 2014-2018; and irs forms 990 and 990-EZ annual information returns, circa fiscal year 2016. portions of government program service revenue estimates based on irs statistics of income (soi) weighted sample of form 990, 2004-2007.
Causes Count: the eConomiC Power of California’s nonProfit seCtor (2019) — CalnonProfits.org 41
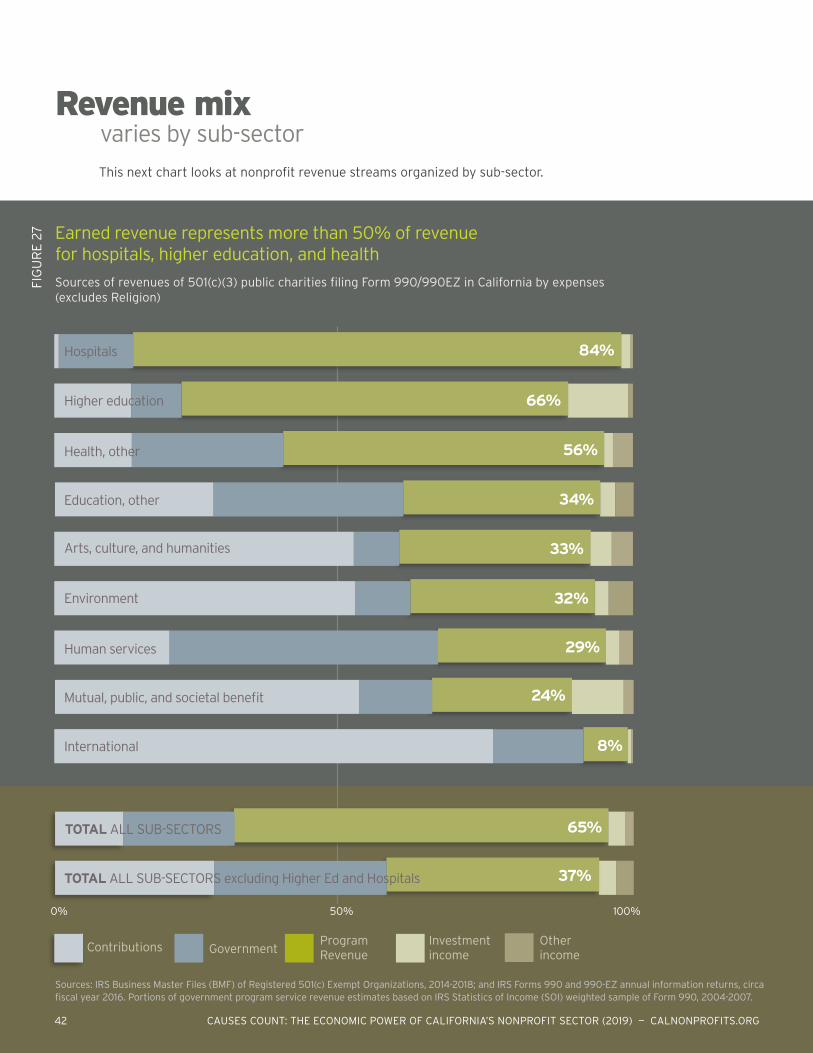
this next chart looks at nonprofit revenue streams organized by sub-sector.
Revenue mix varies by sub-sector
sources: irs Business Master files (BMf) of registered 501(c) Exempt organizations, 2014-2018; and irs forms 990 and 990-EZ annual information returns, circa fiscal year 2016. portions of government program service revenue estimates based on irs statistics of income (soi) weighted sample of form 990, 2004-2007.
Contributions Governmentprogram revenue
investment income
other income
Earned revenue represents more than 50% of revenue for hospitals, higher education, and health
Sources of revenues of 501(c)(3) public charities filing Form 990/990EZ in California by expenses (excludes Religion)
Fig
ur
e 2
7
0% 50% 100%
Hospitals 84%
Higher education 66%
Health, other 56%
Education, other 34%
Arts, culture, and humanities 33%
Environment 32%
Human services 29%
Mutual, public, and societal benefit 24%
International 8%
ToTal ALL SUb-SEctorS 65%
ToTal ALL SUb-SEctorS excluding Higher Ed and Hospitals 37%
42 CausesCount:theeConomiCPowerofCalifornia’snonProfitseCtor(2019)—CalnonProfits.org

los angeles, far north and sierras experienced the least growth in revenues.
Bay area, Central Coast,
and sierras rely more heavily
on contributed revenues than
most other regions.
nonprofit finance trends by subsector
nonprofit finance trends by region
nonprofits in California have exhibited strong annual growth in total revenues across all regions, ranging from 4.4% to 10.4%.
annual growth in revenues outpaced expenses, resulting in 5.5% growth in net revenues across nonprofits in 5 of the 10 regions.
largest growth in program revenues took place in orange,11
followed by san Diego and inland Empire.
public charities within the Central Coast,
sierras, los angeles, and inland Empire
experienced annual declines in net
revenues.
11. reflects the merger of four southern California physician groups serving 5 major hospitals and related ancillary health service organizations (primarily in orange and la) into a single nonprofit in 2010 called Memorial Health services Group (Ein 352391110).
California’s nonprofits are growing in total revenue and in net revenue, but very unevenly. some highlights:
Trends in nonprofit finances
All subsectors grew in contributions, program revenue and total revenue,
except for international organizations (which conversely had the highest percent increase in number of organizations).
Growth
Health organizations (other than Hospitals)
have shifted toward a greater reliance on earned revenues through program services (up from 61% to 71% of total revenues over 10 years) and away from contributed revenues (down from 31% in 2006 to 24% in 2016).
HealtH Orgs
Greatest growth in revenues over 10 years was found in National donor Advised Funds
and Community foundations, followed by Health organizations (other than Hospitals) and Education organizations (other than Higher Education).
DaFs
Expenses outpaced revenues by the widest margin in Arts organizations,
resulting in an annual decline of 6.5% in net revenues over the period.
arts
Causes Count: the eConomiC Power of California’s nonProfit seCtor (2019) — CalnonProfits.org 43

approximately half of nonprofit leaders surveyed reported a change in their funding in the past 12 months (see figure 28). three out of ten nonprofit leaders reported a decrease in federal funding while four out of ten reported an increase in state funding.
nonprofit leaders report
funding has changed
48%
43%
47%
50%
43%
23% 22%
28%
35%
Source: California Nonprofit Survey (2018-2019). N = 467.
Fig
ur
e 2
8
33%
18%
26%
20%
39%
27%
40%
20%
0%
While most funding sources are relatively stable, nonprofits report decreases in federal funding and increases in state funding
Percentage of nonprofits reporting funding changes, by source.
FEDERAL GOVERNMENT
STATE OF CAliFOrniA
Donations from inDiviDuals
Funding has decreased Funding has increased
Funding has remained about
the same
FoundationsCounty and other loCal government
44 CausesCount:theeConomiCPowerofCalifornia’snonProfitseCtor(2019)—CalnonProfits.org
A deep interdependency
Part 6
Government and Nonprofits

the government-nonprofit relationship has some inherently contradictory aspects: on the one hand, nonprofits are often partnering with government to serve their communities, and on the other hand, advocating to government on behalf of their communities. similarly, government has two different stances with nonprofits: governments fund nonprofits in services, and also serve as regulators of nonprofits.
to see the two-way interdependence, consider just two data points:
Government relies on nonprofits to provide 32% of Medi-Cal services, just one example of nonprofits delivering services for government.
nonprofits rely on government funding for 30% of the nonprofit sector’s total revenue.
in addition to healthcare, the state of California uses nonprofits as strategic elements of delivery systems in human services, education, environment, the arts, and animal welfare.
although nonprofits are often seen as “dependent” on government funding, the reality is that these levels of funding reflect the degree to which government is dependent on nonprofits.
MEDi-Cal sErViCEs
nonprofit rEVEnUE30% 32%
Government revenue to nonprofits primarily comes in the form of federal, state and local grants, Medicare and Medi-Cal (known as Medicaid by the federal government) payments, and as contracts to provide scientific research and development for a government agency. Because of limitations in available data, it has not been possible to report the exact breakdown of government funding, but Medicare/Medi-Cal funding makes up the largest amount of funding to nonprofits, followed by grants, and then contracts.
the partnership between government and California nonprofits is so central to both sectors that it deserves its own discussion in this report.
note: the terms “grants” and “contracts” are frequently conflated and the terms are used differently at different levels of government. for example, the federal government distinguishes them by whether the beneficiary is the public (grants) or the government (contracts). in contrast, states and counties use the term contract to describe their agreements with nonprofits and other entities to administer services often funded through grants. in ordinary conversation the terms are often used interchangeably.
grants < > contracts
46 CausesCount:theeConomiCPowerofCalifornia’snonProfitseCtor(2019)—CalnonProfits.org

although government represents the single largest type of revenue for the nonprofit sector as a whole, government is in fact many distinct revenue channels. these flows are complex and difficult to report because few government agencies track funding by institutional recipient.
flows of government funding to nonprofits
How government funds flow
to nonprofits: through multiple, intertwining channels
$
$
$
$
$ $
$
$ $
funds may originate at federal, state, or local (i.e., county, city, water district, etc.) level and can go directly to nonprofit organizations, or can pass through multiple levels of government before getting to nonprofit organizations. a nonprofit can obtain a contract with a county that includes federal pass-throughs, state-pass throughs, county dedicated funds, and county general funds. and sometimes nonprofits receive money from other nonprofits that have contracts directly with government agencies.
fiG
Ur
E 2
9
GovernmentFederal
GovernmentSTaTe
GovernmentlOCal
nOnprOFiTS
LEGENDSolid line: direct payments
Dashed line: indirect payments and pass-through fundsGovernment revenUeS
(various sources including taxes, bond proceeds, fees, etc.)
Causes Count: the eConomiC Power of California’s nonProfit seCtor (2019) — CalnonProfits.org 47

federal grant funding to California nonprofit organizations (excludes Higher Education, Hospitals, and religion)**
$1.47B (17%)
$8.87B
$5.74B (65%)
$1.07B (12%) $0.59B (7%)
Fig
ur
e 3
0
FederAl dollArS
GovernmentFederal
nonprofits
figure 30 shows that $8.87 billion of federal grant funding (24% of $39 billion*) went to nonprofits. of this $8.87 billion, two-thirds ($5.74 billion) of federal funding went directly to nonprofits and one-third ($3.12 billion) went to state or local government or other entities and then passed through to nonprofits.
Federal funding of almost $9B
comes to nonprofits through different channels
source: federal audit Clearinghouse, 2016. https://harvester.census.gov/facweb
**Excludes Medi-Cal (Medicaid) which is categorized as a grant but is not consistently reported in the federal audit Clearinghouse. see Medicare/Medi-Cal analysis on page 53. note: percentages may not add up to 100% due to rounding.
*$39B is the total funding that comes to California from the federal government.
LEGEND
Solid line: direct payments
Dashed line: indirect payments and pass-through funds
NUMBERS OF GRANTS Excluding hOSpiTAlS ANd hiGhER Eddirect: 5,515 State: 2,623 local Government: 2,806 Other: 2,967
AdditionAl funding:
GoVErnMEntStAte
GoVErnMEntloCAl
EntitiEsotHer
HIgHer ed$6.88B
HoSPItAlS$0.56B
48 CausesCount:theeConomiCPowerofCalifornia’snonProfitseCtor(2019)—CalnonProfits.org
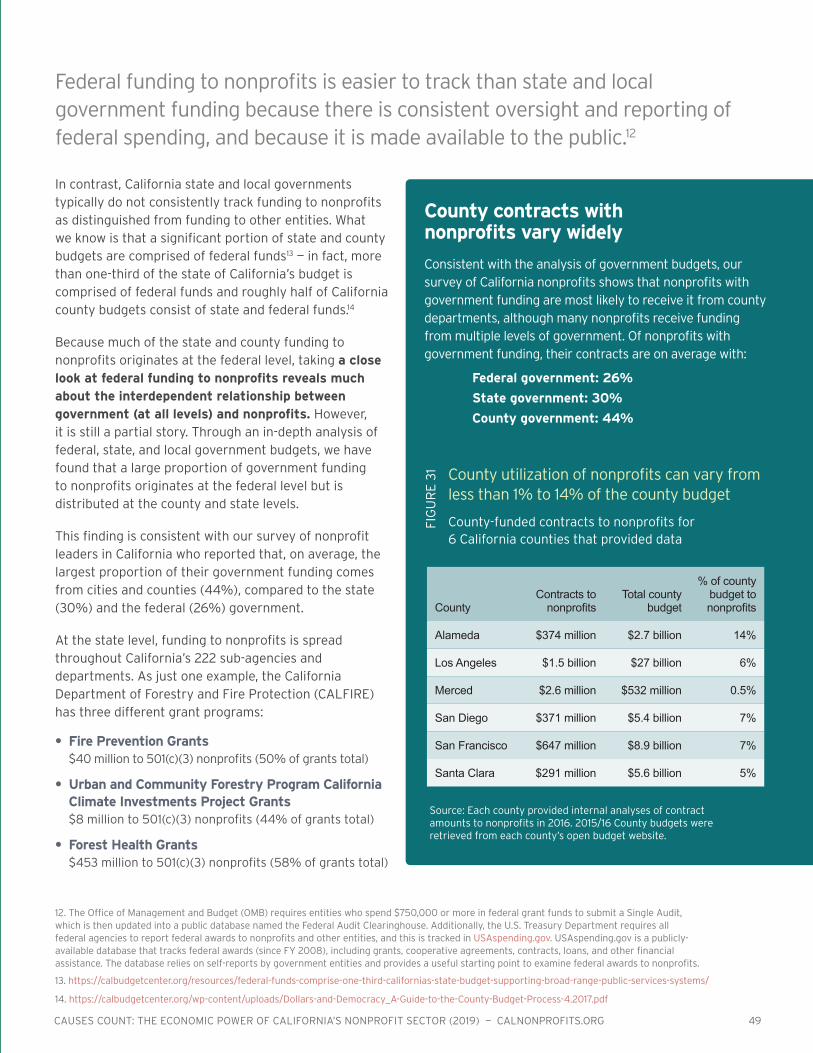
Fig
ur
e 3
1
in contrast, California state and local governments typically do not consistently track funding to nonprofits as distinguished from funding to other entities. What we know is that a significant portion of state and county budgets are comprised of federal funds13 — in fact, more than one-third of the state of California’s budget is comprised of federal funds and roughly half of California county budgets consist of state and federal funds.14
Because much of the state and county funding to nonprofits originates at the federal level, taking a close look at federal funding to nonprofits reveals much about the interdependent relationship between government (at all levels) and nonprofits. However, it is still a partial story. through an in-depth analysis of federal, state, and local government budgets, we have found that a large proportion of government funding to nonprofits originates at the federal level but is distributed at the county and state levels.
this finding is consistent with our survey of nonprofit leaders in California who reported that, on average, the largest proportion of their government funding comes from cities and counties (44%), compared to the state (30%) and the federal (26%) government.
at the state level, funding to nonprofits is spread throughout California’s 222 sub-agencies and departments. as just one example, the California Department of forestry and fire protection (CalfirE) has three different grant programs:
• Fire Prevention grants $40 million to 501(c)(3) nonprofits (50% of grants total)
• Urban and Community Forestry Program California Climate Investments Project grants $8 million to 501(c)(3) nonprofits (44% of grants total)
• Forest Health grants $453 million to 501(c)(3) nonprofits (58% of grants total)
federal funding to nonprofits is easier to track than state and local government funding because there is consistent oversight and reporting of federal spending, and because it is made available to the public.12
12. the office of Management and Budget (oMB) requires entities who spend $750,000 or more in federal grant funds to submit a single audit, which is then updated into a public database named the federal audit Clearinghouse. additionally, the U.s. treasury Department requires all federal agencies to report federal awards to nonprofits and other entities, and this is tracked in Usaspending.gov. Usaspending.gov is a publicly-available database that tracks federal awards (since fY 2008), including grants, cooperative agreements, contracts, loans, and other financial assistance. the database relies on self-reports by government entities and provides a useful starting point to examine federal awards to nonprofits.
13. https://calbudgetcenter.org/resources/federal-funds-comprise-one-third-californias-state-budget-supporting-broad-range-public-services-systems/
14. https://calbudgetcenter.org/wp-content/uploads/Dollars-and-Democracy_a-Guide-to-the-County-Budget-process-4.2017.pdf
County contracts with nonprofits vary widely
Consistent with the analysis of government budgets, our survey of California nonprofits shows that nonprofits with government funding are most likely to receive it from county departments, although many nonprofits receive funding from multiple levels of government. of nonprofits with government funding, their contracts are on average with:
Federal government: 26%
State government: 30%
County government: 44%
Source: Each county provided internal analyses of contract amounts to nonprofits in 2016. 2015/16 County budgets were retrieved from each county’s open budget website.
CountyContracts to
nonprofitstotal county
budget
% of county budget to nonprofits
Alameda $374 million $2.7 billion 14%
Los Angeles $1.5 billion $27 billion 6%
Merced $2.6 million $532 million 0.5%
san Diego $371 million $5.4 billion 7%
san Francisco $647 million $8.9 billion 7%
santa Clara $291 million $5.6 billion 5%
County-funded contracts to nonprofits for 6 California counties that provided data
County utilization of nonprofits can vary from less than 1% to 14% of the county budget
Causes Count: the eConomiC Power of California’s nonProfit seCtor (2019) — CalnonProfits.org 49
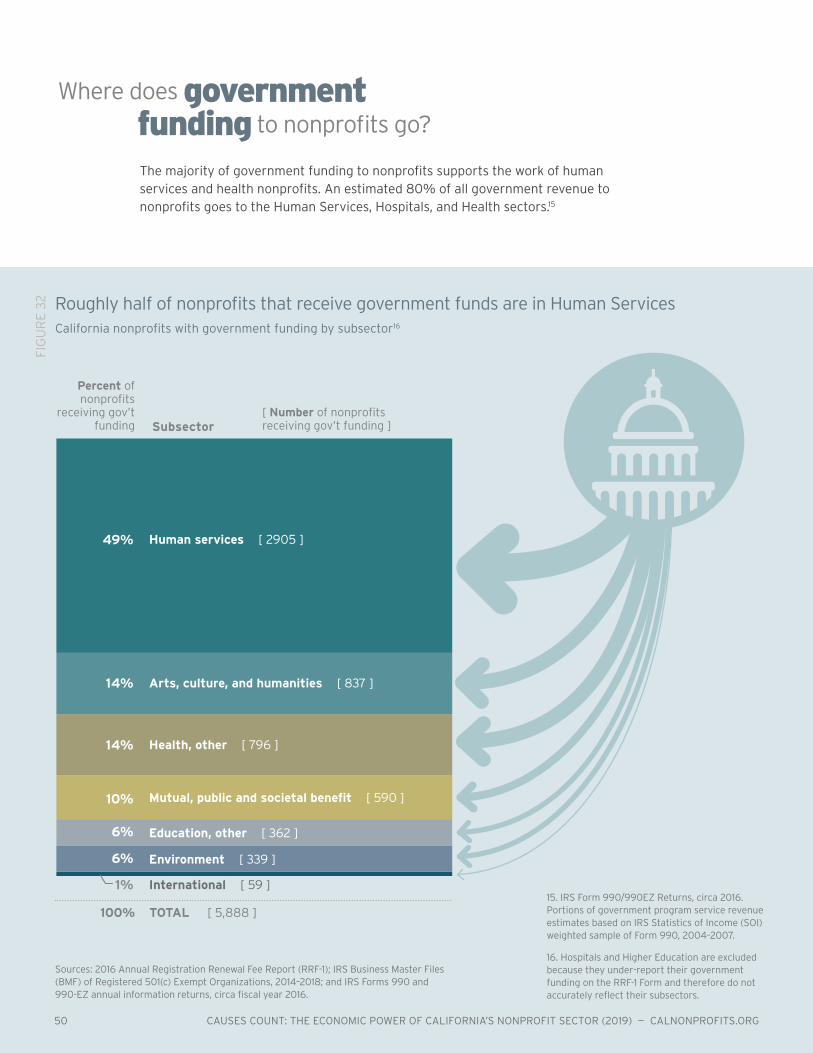
Sources: 2016 Annual Registration Renewal Fee Report (RRF-1); IRS Business Master Files (BMF) of Registered 501(c) Exempt Organizations, 2014–2018; and IRS Forms 990 and 990-EZ annual information returns, circa fiscal year 2016.
15. IRS Form 990/990EZ Returns, circa 2016. Portions of government program service revenue estimates based on IRS Statistics of Income (SOI) weighted sample of Form 990, 2004–2007.
16. Hospitals and Higher Education are excluded because they under-report their government funding on the RRF-1 Form and therefore do not accurately reflect their subsectors.
the majority of government funding to nonprofits supports the work of human services and health nonprofits. an estimated 80% of all government revenue to nonprofits goes to the Human services, Hospitals, and Health sectors.15
Where does government funding to nonprofits go?
Roughly half of nonprofits that receive government funds are in Human Services California nonprofits with government funding by subsector16
Fig
ur
e 3
2
Human services [ 2905 ]
Arts, culture, and humanities [ 837 ]
Health, other [ 796 ]
Mutual, public and societal benefit [ 590 ]
education, other [ 362 ]
environment [ 339 ]
International [ 59 ]
Subsector
Percent of nonprofits
receiving gov’t funding
[ Number of nonprofits receiving gov’t funding ]
49%
14%
14%
10%
6%
6%
1%
100% TOTAL [ 5,888 ]
50 CausesCount:theeConomiCPowerofCalifornia’snonProfitseCtor(2019)—CalnonProfits.org
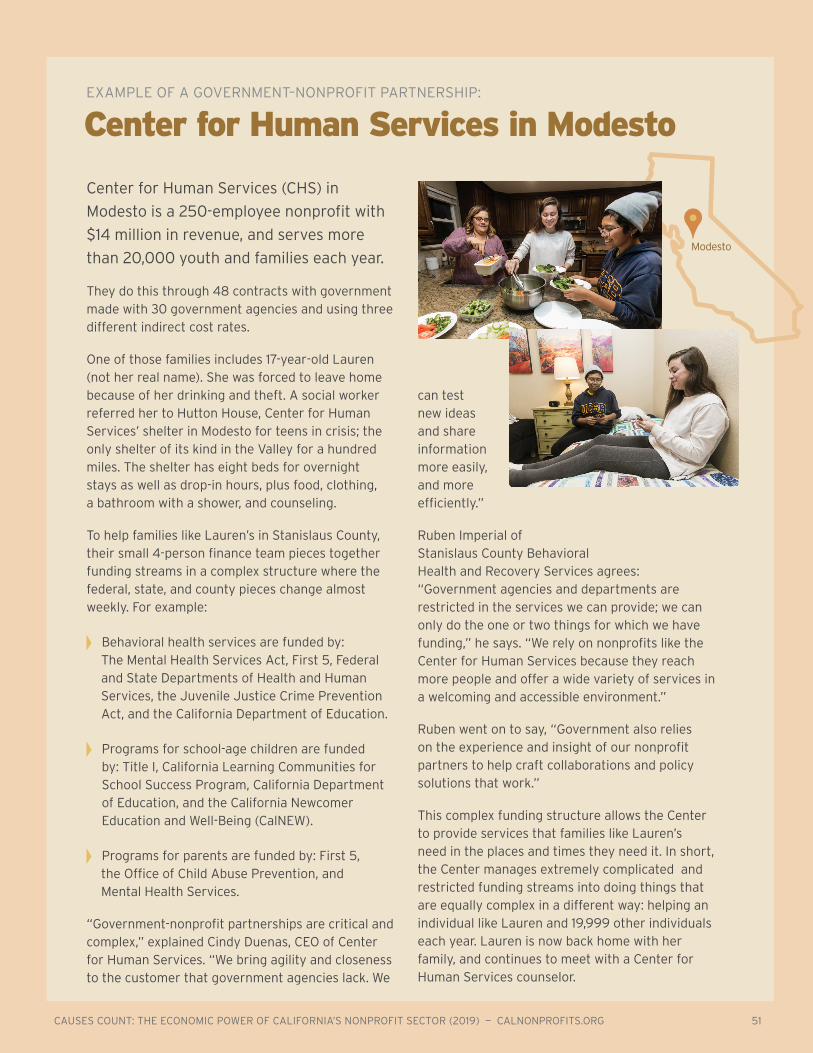
Center for Human Services (CHS) in
Modesto is a 250-employee nonprofit with
$14 million in revenue, and serves more
than 20,000 youth and families each year.
They do this through 48 contracts with government made with 30 government agencies and using three different indirect cost rates.
One of those families includes 17-year-old Lauren (not her real name). She was forced to leave home because of her drinking and theft. A social worker referred her to Hutton House, Center for Human Services’ shelter in Modesto for teens in crisis; the only shelter of its kind in the Valley for a hundred miles. The shelter has eight beds for overnight stays as well as drop-in hours, plus food, clothing, a bathroom with a shower, and counseling.
To help families like Lauren’s in Stanislaus County, their small 4-person finance team pieces together funding streams in a complex structure where the federal, state, and county pieces change almost weekly. For example:
Behavioral health services are funded by: The Mental Health Services Act, First 5, Federal and State Departments of Health and Human Services, the Juvenile Justice Crime Prevention Act, and the California Department of Education.
Programs for school-age children are funded by: Title I, California Learning Communities for School Success Program, California Department of Education, and the California Newcomer Education and Well-Being (CalNEW).
Programs for parents are funded by: First 5, the Office of Child Abuse Prevention, and Mental Health Services.
“Government-nonprofit partnerships are critical and complex,” explained Cindy Duenas, CEO of Center for Human Services. “We bring agility and closeness to the customer that government agencies lack. We
ExamplE of a govErnmEnt–nonprofit partnErship:
Center for Human Services in Modesto
Modesto
can test new ideas and share information more easily, and more efficiently.”
ruben imperial of stanislaus County Behavioral Health and recovery services agrees: “Government agencies and departments are restricted in the services we can provide; we can only do the one or two things for which we have funding,” he says. “We rely on nonprofits like the Center for Human services because they reach more people and offer a wide variety of services in a welcoming and accessible environment.”
ruben went on to say, “Government also relies on the experience and insight of our nonprofit partners to help craft collaborations and policy solutions that work.”
this complex funding structure allows the Center to provide services that families like lauren’s need in the places and times they need it. in short, the Center manages extremely complicated and restricted funding streams into doing things that are equally complex in a different way: helping an individual like lauren and 19,999 other individuals each year. lauren is now back home with her family, and continues to meet with a Center for Human services counselor.
Causes Count: the eConomiC Power of California’s nonProfit seCtor (2019) — CalnonProfits.org 51

Federal funding of California nonprofits (excluding Hospitals and Higher Education)
Source: Federal Audit Clearinghouse 2016, California (Excludes Medicare and Medi-Cal).
Fig
ur
e 3
3
Fig
ur
e 3
4
Figure 34 shows that the largest federal grants to California nonprofits funded programs for low-income individuals and families to support housing, preschool, nutrition, and foster care. The Federal Health and Human Services, Housing and Urban Development, and U.S. Food and Agriculture agencies funded the largest grants to nonprofits.
Sources: Federal Audit Clearinghouse 2016, California (Excludes Medicare and Medi-Cal); IRS Business Master Files (BMF) of Registered 501(c) Exempt Organizations, 2014–2018; and IRS Forms 990 and 990-EZ annual information returns, circa fiscal year 2016.
A closer look at
total federal funding
Percent of total federal funding
$5,841,061,000 66%
1,339,270,000 15%
766,306,000 9%
668,428,000 8%
156,455,000 2%
52,194,000 0.6%
47,211,000 0.5%
$8,870,925,000 100%
More than 80% of federal dollars to nonprofits
are in Human Services and Health
suBsECtOR
Human services
Health (other)
Education (other)
Public and societal benefit
International
Arts, culture, and humanities
Environment
tOtAL
largest federally-funded grant programs to nonprofits
direct to Nonprofits
$1.1B HUD supportive Housing for the Elderly
$658M HUD section 8 Housing Choice Voucher program
$388M HHs Head start Child Development program
State Pass-through to Nonprofits
$156M HHs foster Care title iV
$143M UsDa Child and adult food Care program
$122M UsDa special supplemental nutrition program for Women, infants, and Children (WiC)
local Pass-through to Nonprofits
$150M HUD Home investment partnership program
$148M HUD Community Development Block Grant
$95M HHs Headstart Child Development program
$86M HHs temporary assistance for needy families (tanf)
Human Services
of fEDEral fUnDinG
81%
52 CausesCount:theeConomiCPowerofCalifornia’snonProfitseCtor(2019)—CalnonProfits.org

Sources: 2014 CMS Health Expenditures by State of Residence. CMS. 2018. Hospital Compare Datasets: Hospital General Information and Home Health Care Agencies; CMS. 2015. Nursing Home Data Compendium; 2012 U.S. Economic Census Survey
Fig
ur
e 3
5
Health care nonprofits support the work of the government by providing a significant portion of medical services funded through Medicare and Medi-Cal. Medicare is a federally-funded health insurance program for individuals 65 years or older and Medi-Cal is a federal- and state-funded health insurance program for very low-income individuals. In 2014, Medicare/Medi-Cal spending totaled $127 billion in California and an estimated one-third (approximately $36.7 billion) of Medicare/Medi-Cal spending was received by nonprofits to provide services.*
A closer look at
*Note, this is a conservative estimate. Medicare/Medi-Cal spending is calculated on a per-person basis, but there is no available data on the percent of CA “beds” or “individuals served” that are at a nonprofit and so the estimate was derived based on the percent of health care agencies that receive Medicare/Medi-Cal by organization type. Medicare and Medi-Cal spending have increased significantly since 2014 but these data are the most recent Medicare spending data available by state of residence and broken down by health-organization type.
largest federally-funded grant programs to nonprofits
direct to Nonprofits
$1.1B HUD supportive Housing for the Elderly
$658M HUD section 8 Housing Choice Voucher program
$388M HHs Head start Child Development program
State Pass-through to Nonprofits
$156M HHs foster Care title iV
$143M UsDa Child and adult food Care program
$122M UsDa special supplemental nutrition program for Women, infants, and Children (WiC)
local Pass-through to Nonprofits
$150M HUD Home investment partnership program
$148M HUD Community Development Block Grant
$95M HHs Headstart Child Development program
$86M HHs temporary assistance for needy families (tanf)
Estimated 2014 Medicare/Medi-Cal spending in California nonprofits
Health Care
for years, both nonprofits and legislators have struggled with the difficulty in finding grant opportunities for which nonprofits are eligible. With more than 40 state agencies making grants to nonprofits — often through multiple sub-departments — 64% of nonprofit survey respondents reported that an inability to find opportunities was a significant barrier for them in obtaining state funding.
in 2018, California association of nonprofits (Calnonprofits) sponsored aB 2252 — authored by assemblymember Monique limón — to create a one-stop portal on which all state grant opportunities would be posted. passed with strong bipartisan support, the project is now being developed by the California state library working with Calnonprofits to ensure the portal is comprehensive, searchable, and nonprofit-friendly. launch is anticipated in July 2020. www.grants.ca.gov
How do nonprofits find state grant opportunities?
Causes Count: the eConomiC Power of California’s nonProfit seCtor (2019) — CalnonProfits.org 53
$65 billion in California Medicare
26%($16.9 billion)
to nonprofits to provide services
NONPROFITs
$62 billion in California Medi-Cal
32%($19.9 billion)to nonprofits to provide services
NONPROFITs

percent of California nonprofits that received government funding by expenses (excluding Higher Education and Hospitals)
Fig
ur
e 3
6
49%
41%
21%
38%
1%6%
46%
as figure 36 shows, roughly half of organizations with expenses of $10 million or more received government funding compared to only 6% of organizations with expenses under $250,000. the nonprofits that received government funding account for almost half of the sector’s revenue and one-third of its assets.17
nonprofits with large budgets have more access to government funding and rely on it as a significant source of revenue. the findings suggest that few nonprofits can grow large without government funding.
17. 2016 Annual Registration Renewal Fee Report (RRF-1); IRS Form 990/990EZ Returns, circa 2016.
Sources: Annual Registration Renewal Fee Report (RRF-1); IRS Business Master Files (BMF) of Registered 501(c) Exempt Organizations, 2014–2018; and IRS Forms 990 and 990-EZ annual information returns, circa fiscal year 2016.
$50,000 to $250,000
$250,000 to $1M
$1M to $5M
$5M to $10M
$10M to $20M
Above $20M
$50,000 and below
nonprofit’s AnnuAl EXpEnsEs:
few nonprofits can grow large without
government funding
54 CausesCount:theeConomiCPowerofCalifornia’snonProfitseCtor(2019)—CalnonProfits.org
nonprofit overhead Project20
it’s time to change how we think about nonprofit overhead.
18. https://www.usaspending.gov/#/download_center/award_data_archive Data include contracts made to nonprofits with California marked as the place of performance.
19. USAspending.gov is a publicly-available database that tracks federal awards (since FY2008), including grants, cooperative agreements, contracts, loans, and other financial assistance. The database relies on self-reports by government entities and provides a useful starting point to examine federal awards to nonprofits. However, it is limited because: 1) it only tracks direct federal funding and does not account for the federal funding that passes through state and local government to nonprofits, and 2) it is known to have data quality issues. For these reasons, USASpending was not used to calculate federal grant awards. Data is circa 2016.
although in casual usage
the terms government
“grants” and “contracts”
are typically used
interchangeably, federal
contracts are awarded to
nonprofit organizations
to carry out services that
directly benefit the government agency. the U.s.
treasury requires all federal agencies to report
federal awards through Usaspending.gov19 which
is the source used here to track federal contracts
to nonprofits.
according to Usaspending.gov, $44.8 billion in
federal contracts were awarded in California,
and an estimated 3% ($1.5 billion) were
awarded directly to nonprofit organizations.
of the $1.5 billion awarded to nonprofits, 75%
($1.1 billion) were awarded to the following
three Public and Societal Benefit research
organizations: Aerospace Corporation, SrI
International, and rANd. these nonprofits
were contracted primarily to conduct research
and development in the areas of space, science,
and defense.
Research for this Causes Count study
is consistent with prior CalNonprofits
research on overhead and nonprofit
contracts with government.21 A 2017 study
found that of 670 nonprofit-government
contracts surveyed, 20% had indirect
cost rates of less than 3%, and 34% had
indirect cost rates of less than 10%.
The study revealed that the consequences
of insufficient payments are serious not
just for the individual nonprofit contractor,
but for the nonprofit supply chain through
which public services are provided.
Nonprofits reported compensating
strategies including raising private
funds to fill the gap; underfunding their
infrastructure (such as accounting and
compliance), technology, and facilities;
and an inability to offer competitive wages
for employees. Insufficient payments also
make it harder for nonprofits to scale up;
if a government agency wants to expand
the contract, the nonprofit must also face
the daunting prospect of raising more
private money.
20. https://calnonprofits.org/programs/overhead
21. Two-Legged Stool: New Findings from California on Nonprofits and Overhead, by Nancy Berlin, Jan Masaoka, and Mary Jo Schumann, in Nonprofit Policy Forum, ARNOVA, 2017. https://www.degruyter.com/downloadpdf/j/npf.2017.8.issue-2/npf-2017-0003/npf-2017-0003.pdf
Federal Contracts with California Nonprofits18
Causes Count: the eConomiC Power of California’s nonProfit seCtor (2019) — CalnonProfits.org 55

Percent of nonprofit leaders (receiving government funding) who report problems with government funding (those who chose 3 or 4 ratings on a 1 =”No Problem” to 4=“Major Problem” scale)
although the nonprofit sector makes heavy use of government funds, a survey of nonprofit leaders throughout California revealed difficulties for nonprofits in managing their government funding. as figure 37 shows, across all levels of government, approximately two-thirds of nonprofits who receive government funding identified insufficient payments to cover full costs as a moderate/major problem. the time required for bidding and reporting were also identified as problems for roughly half of respondents across all levels of government.
Challenges for nonprofits who receive government funding
time required for application or bid process 54%
More than 2/3 of nonprofits report that government payments do not cover the full costs of contracted servicesMore than 2/3 of nonprofits report that government payments do not cover the full costs of contracted services
Fig
ur
e 3
7
Payments do not cover full cost of contracted program/services 68%
Changes or modifications to already approved contracts/grants 37%
long negotiating periods 36%
late payments from the government agency 44%
time required for reporting 53%
Source: California Nonprofit Survey (2018-2019)
56 CausesCount:theeConomiCPowerofCalifornia’snonProfitseCtor(2019)—CalnonProfits.org
Part 7
Foundations and Nonprofit Economics

22. Circa 2016.
notably, during the study period, California nonprofits imported $1.5 billion from out-of-state foundations. in contrast, California foundations exported $2.2 billion to out of state areas.
While foundations are not the primary focus of this report, their activity is considered here as it relates to nonprofit economic activity and impact.
tHEsE inClUDE:
Private foundations — tax-exempt 501(c)(3) charitable organizations that are usually created through substantial donations from a single individual, a family, or a business and where funds and programs are managed by their own trustees or directors. key types of private foundations:
Family and private foundations — must spend at least 5% of their assets each year in the form of grants and their own activities, or pay an excise tax
Corporate foundations — must pay out at least 5% of their assets each year in the form of grants and their own activities or pay an excise tax
Operating foundations — have no payout requirement; but they must spend at least 85% of adjusted net income or minimum investment returns to carry out their own charitable activities (known as the “income test”)
Community foundations — tax-exempt 501(c)(3) public charitable organizations that support the
needs of an identified community from funds that they maintain and administer on behalf of
multiple donors. the best known are those that identify with a county or region,
while some community foundations are issue-based or constituency-based, such as the Women’s foundation of California or the latino Community foundation.
The
Foundation
Center reports
that there are
7,643
foundations
in California.22
58 CausesCount:theeConomiCPowerofCalifornia’snonProfitseCtor(2019)—CalnonProfits.org
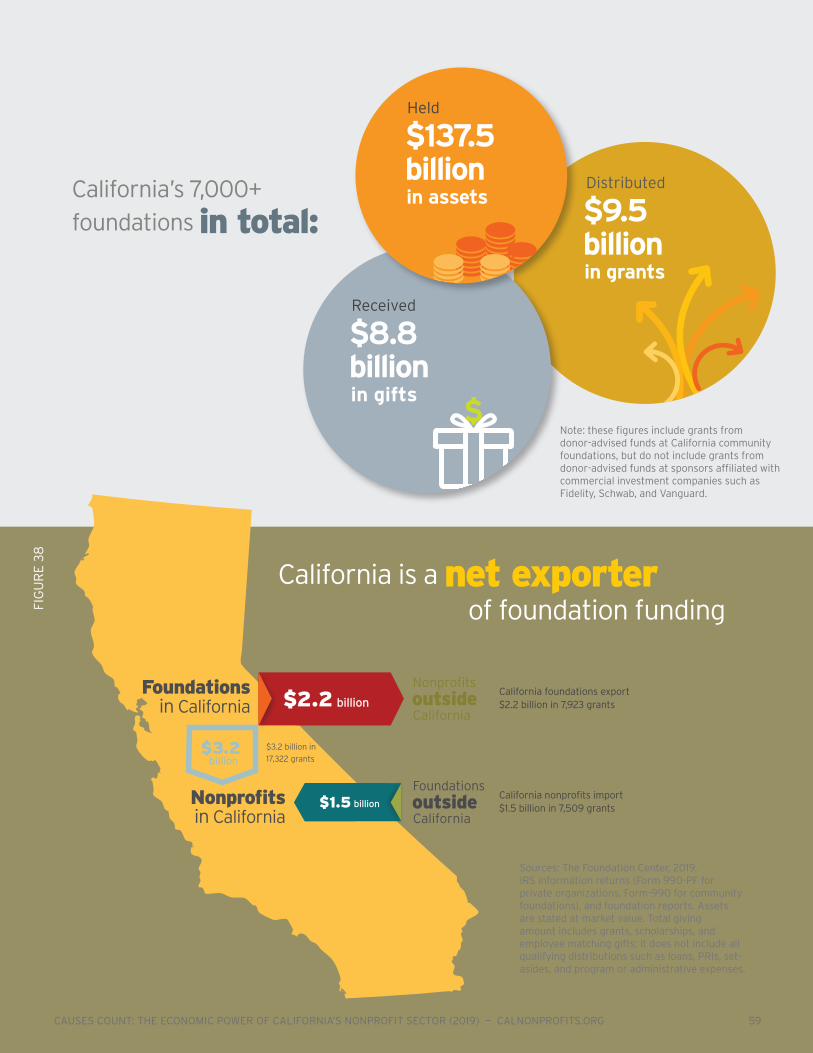
Distributed
$9.5 billion in grants
received
$8.8 billion in gifts
Fig
ur
e 3
8
California foundations export $2.2 billion in 7,923 grants
$3.2 billion in
17,322 grants
outsideNonprofits
California
Foundations in California
Nonprofits in California
$2.2 billion
California nonprofits import $1.5 billion in 7,509 grantsoutside
Foundations
California$1.5 billion
California is a net exporter of foundation funding
$3.2 billion
California’s 7,000+
foundations in total:
Held
$137.5 billion in assets
note: these figures include grants from donor-advised funds at California community foundations, but do not include grants from donor-advised funds at sponsors affiliated with commercial investment companies such as fidelity, schwab, and Vanguard.
Sources: The Foundation Center, 2019. IRS information returns (Form 990-PF for private organizations, Form-990 for community foundations), and foundation reports. Assets are stated at market value. Total giving amount includes grants, scholarships, and employee matching gifts; it does not include all qualifying distributions such as loans, PRIs, set-asides, and program or administrative expenses.
Causes Count: the eConomiC Power of California’s nonProfit seCtor (2019) — CalnonProfits.org 59

17,332 = number of grants of $10,000 or more awarded by Ca foundations to Ca orgs
grants awarded by California foundations
7,509 = number of grants of $10,000 or more awarded by non-Ca foundations to Ca orgs
grants awarded by non-California foundations
religion=57/43social sciences=43/57agriculture=72/28
Fig
ur
e 4
0 Health and education nonprofits receive the largest amount of grant dollars from both California and non-California foundations
Grantmaking
Distributions
$0 $500M $1B $1.5BGrant DistriBUtions in Dollars
79% / 21% Health
62% / 38% education
72% / 28% Human Services
80% / 20% Sports & recreation
81% / 19% other / Unknown
43% / 57% Social Sciences
48% / 52% Public Safety
57% / 43% religion
52% / 48% Public Affairs
47% / 53% Human rights
40% / 60% International relations
51% / 49% Science & engineering
78% / 22% Arts & Culture
67% / 33% environment & Animals
72% / 28% Agriculture, Fishing and Forestry
61% / 39% Information & Communications
56% / 44% Community & economic development
73% / 27% Philanthropy & Nonprofit Management
CA non-CA
Source: Foundation Center, 2019 Based on all grants of $10,000 or more awarded by the FC 1000 – a set of 1,000 of the largest U.S. private and community foundations by giving. For community foundations, discretionary grants are included and donor-advised grants when provided by the foundation. Grants to U.S.-based private and community foundations are excluded to avoid double-counting grant dollars awarded. Grants to individuals are not included in the sample.
60 CausesCount:theeConomiCPowerofCalifornia’snonProfitseCtor(2019)—CalnonProfits.org

Top 25 California foundations that fund California nonprofits
TOP25
the top 25 California foundations granted 81% of foundation dollars to California nonprofits, and made 65% of the grants. the chart below shows dollars and grants awarded to California and non-California grantees.
top 25 California foundations awarding grants of $10,000 or more
Name Type*
Total dollars awarded to CA and non-CA grantees %
Number of grants of $10K or more
1 silicon Valley Community Foundation CF $952,669,672 28.0 2,940
2 David and Lucile Packard Foundation PF 278,935,665 8.2 397
3 California Endowment PF 188,225,252 5.5 1,199
4 William and Flora Hewlett Foundation PF 130,938,670 3.8 274
5 California Community Foundation CF 110,726,530 3.3 844
6 san Francisco Foundation CF 107,039,176 3.1 896
7 s.D. Bechtel, Jr. Foundation PF 83,568,611 2.5 158
8 Google Foundation INC 70,440,660 2.1 16
9 James Irvine Foundation PF 66,308,347 1.9 168
10 Carl Victor Page Memorial Foundation PF 65,216,515 1.9 3
11 William K. Bowes, Jr. Foundation PF 60,044,449 1.8 136
12 Gordon and Betty Moore Foundation PF 56,082,205 1.6 57
13 East Bay Community Foundation CF 48,300,401 1.4 373
14 Ahmanson Foundation PF 47,146,441 1.4 423
15 Eli & Edythe Broad Foundation PF 46,476,510 1.4 50
16 Orange County Community Foundation CF 42,822,735 1.3 520
17 san Diego Foundation CF 41,286,094 1.2 819
18 Marin Community Foundation CF 38,758,918 1.1 563
19 Weingart Foundation PF 27,686,100 0.8 248
20 Annenberg Foundation PF 27,614,574 0.8 336
21 Blue shield of California Foundation INC 27,295,653 0.8 402
22 sobrato Family Foundation PF 26,450,300 0.8 133
23 Conrad N. Hilton Foundation PF 24,792,940 0.7 98
24 California Wellness Foundation PF 24,310,850 0.7 106
25 Heising-simons Foundation PF 23,522,872 0.7 103
TOTAL Of TOp 25 fOuNDATIONS 2,616,660,140 76.8 11,262
fiG
Ur
E 4
1
source: the foundation Center, 2019. Based on grants of $10,000 or more awarded by the fC 1000 — a set of 1,000 of the largest U.s. foundations by giving. for community foundations, when the information was provided by the foundations, discretionary grants distinguished from grants made from donor-advised funds. Grants to other foundations are excluded to avoid double-counting grant dollars awarded. Grants to individuals are not included. Grants from donor-advised funds at commercially affiliated donor-advised fund sponsors are not included as they are not reported in foundation data.
*pf=private/family foundation; Cf=Community foundation; inC=Corporate foundation
Causes Count: the eConomiC Power of California’s nonProfit seCtor (2019) — CalnonProfits.org 61
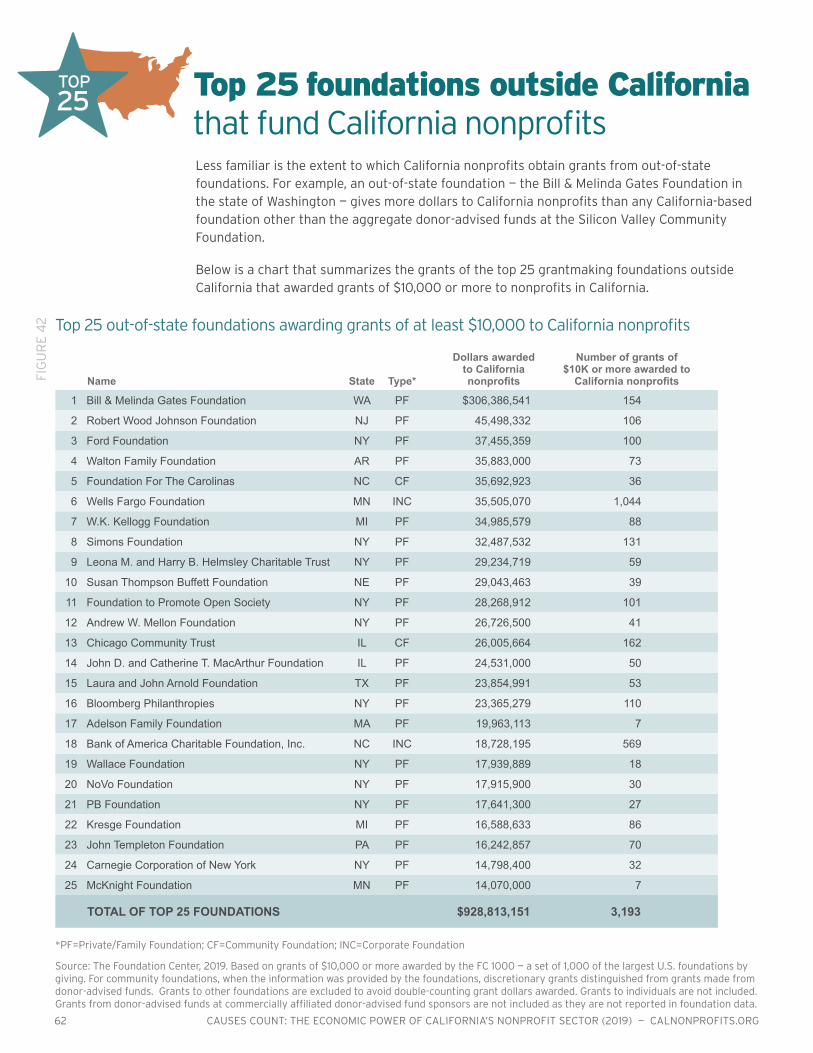
less familiar is the extent to which California nonprofits obtain grants from out-of-state foundations. for example, an out-of-state foundation — the Bill & Melinda Gates foundation in the state of Washington — gives more dollars to California nonprofits than any California-based foundation other than the aggregate donor-advised funds at the silicon Valley Community foundation.
Below is a chart that summarizes the grants of the top 25 grantmaking foundations outside California that awarded grants of $10,000 or more to nonprofits in California.
25TOP
Name State Type*
Dollars awarded to California nonprofits
Number of grants of $10K or more awarded to
California nonprofits
1 Bill & Melinda Gates Foundation WA PF $306,386,541 154
2 Robert Wood Johnson Foundation NJ PF 45,498,332 106
3 Ford Foundation NY PF 37,455,359 100
4 Walton Family Foundation AR PF 35,883,000 73
5 Foundation For the Carolinas NC CF 35,692,923 36
6 Wells Fargo Foundation MN INC 35,505,070 1,044
7 W.K. Kellogg Foundation MI PF 34,985,579 88
8 simons Foundation NY PF 32,487,532 131
9 Leona M. and Harry B. Helmsley Charitable trust NY PF 29,234,719 59
10 susan thompson Buffett Foundation NE PF 29,043,463 39
11 Foundation to Promote Open society NY PF 28,268,912 101
12 Andrew W. Mellon Foundation NY PF 26,726,500 41
13 Chicago Community trust IL CF 26,005,664 162
14 John D. and Catherine t. MacArthur Foundation IL PF 24,531,000 50
15 Laura and John Arnold Foundation tX PF 23,854,991 53
16 Bloomberg Philanthropies NY PF 23,365,279 110
17 Adelson Family Foundation MA PF 19,963,113 7
18 Bank of America Charitable Foundation, Inc. NC INC 18,728,195 569
19 Wallace Foundation NY PF 17,939,889 18
20 NoVo Foundation NY PF 17,915,900 30
21 PB Foundation NY PF 17,641,300 27
22 Kresge Foundation MI PF 16,588,633 86
23 John templeton Foundation PA PF 16,242,857 70
24 Carnegie Corporation of New York NY PF 14,798,400 32
25 McKnight Foundation MN PF 14,070,000 7
TOTAL Of TOp 25 fOuNDATIONS $928,813,151 3,193
top 25 out-of-state foundations awarding grants of at least $10,000 to California nonprofits
*pf=private/family foundation; Cf=Community foundation; inC=Corporate foundation
source: the foundation Center, 2019. Based on grants of $10,000 or more awarded by the fC 1000 — a set of 1,000 of the largest U.s. foundations by giving. for community foundations, when the information was provided by the foundations, discretionary grants distinguished from grants made from donor-advised funds. Grants to other foundations are excluded to avoid double-counting grant dollars awarded. Grants to individuals are not included. Grants from donor-advised funds at commercially affiliated donor-advised fund sponsors are not included as they are not reported in foundation data.
Top 25 foundations outside California that fund California nonprofits
fiG
Ur
E 4
2
62 CausesCount:theeConomiCPowerofCalifornia’snonProfitseCtor(2019)—CalnonProfits.org

How much do nonprofits
rely on foundation funding?
42% of nonprofits 48% of nonprofits 5% 5%
Fig
ur
e 4
3
Donor-advised funds and foundation dataAlthough many nonprofits view a donation from a donor-advised fund (DAF) as a foundation grant, DAFs are not foundations. The numbers of DAF sponsors, DAF accounts, and donations transferred from DAFs are so large that they make it difficult to analyze the data on foundation giving.
For example, for the fiscal year ending 2017, the Silicon Valley Community Foundation reported total assets of $12.6 billion, of which $11.4 billion was in donor-advised funds — effectively controlled by DAF account holders rather than by the foundation. The Foundation’s reports on grants made do not separate out grants that donors made from their DAF accounts and grants made with the Foundation’s “own” funds.
nearly three-quarters (72%) of California nonprofits report receiving foundation funds within the last 12 months. But only 5% report that foundation funds represent more than 75% of their revenue. in many parts of the nonprofit community, foundation influence and presence are greater than would be suggested by the percentage of nonprofit revenue that comes from foundations.
less than 10% revenue comes from foundations
10%-50% revenue
comes from foundations
51%-75% revenue
comes from foundations
More than 75% revenue comes from foundations
for 90% of nonprofits, foundation funds represent 50% or less of their revenue
percent of nonprofit revenue coming from foundations source: California nonprofit survey (2018–2019)
Causes Count: the eConomiC Power of California’s nonProfit seCtor (2019) — CalnonProfits.org 63

Part 8
Nonprofits, Public Confidence, and Advocacy

Californians appreciate nonprofits for services but also that nonprofits stand up for values and work to reduce inequality
percent of California respondents who agreed/strongly agreed (4–5 ratings on a 1–5 scale) with the following statements about nonprofits:
nonprofits not only serve their communities,
they speak out for them as well. nonprofits engage in public dialogue; staff and volunteer leaders meet with public officials, participate in policy coalitions, speak at hearings, and take positions on policy matters that affect their constituents.
in turn, Californians value their nonprofits, and give nonprofits higher marks than business or government both in spending money wisely and working efficiently.
85% improve quality of life
78% stand for values
60% reduce inequality
79% play a major role in making our communities better places to live
77% Develop innovative services for communities
75% Express community values
72% Express the spirit of the community
68% Mobilize the community
67% Encourage art and culture in communities
90% Help the needy and vulnerable
46% Help people like me
19% Help people who don’t deserve help
77% fill a gap left by government
72% fill a gap left by private business and corporations
only 1% said nonprofits are not important to society.
71%
source: California resident survey (2018-2019)
of Californians believe nonprofits are very or extremely important to society
Causes Count: the eConomiC Power of California’s nonProfit seCtor (2019) — CalnonProfits.org 65
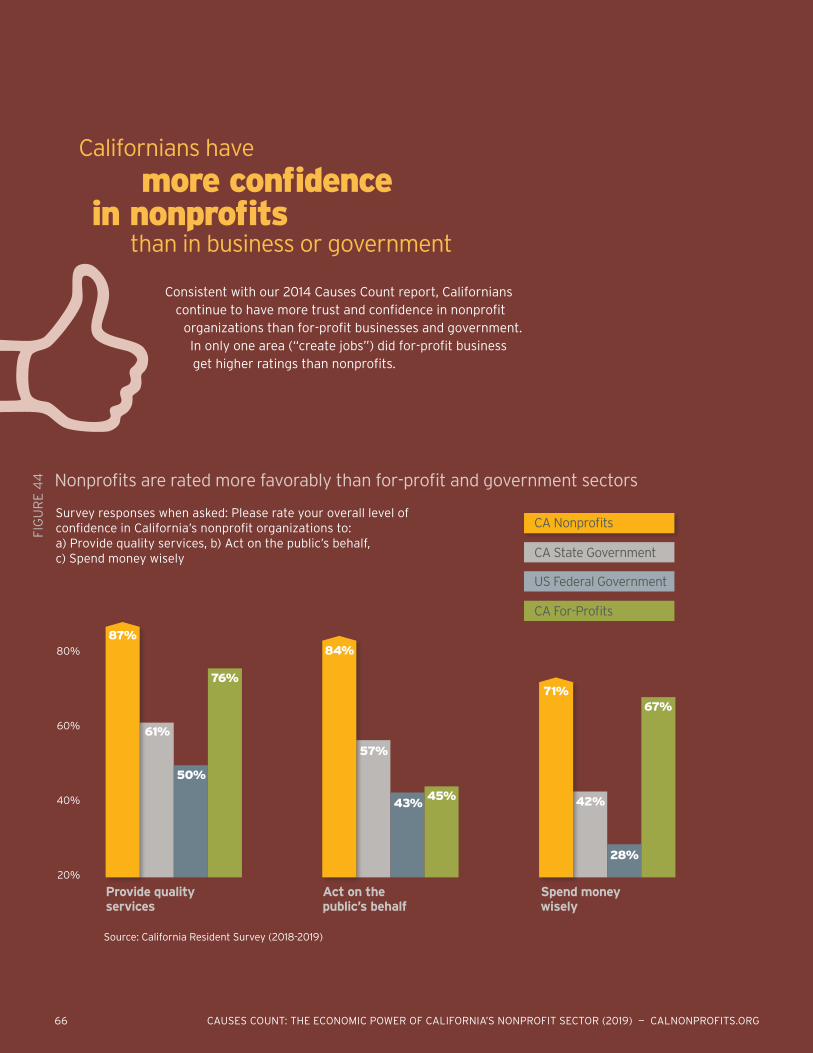
Californians have
more confidence in nonprofits than in business or government
Consistent with our 2014 Causes Count report, Californians continue to have more trust and confidence in nonprofit
organizations than for-profit businesses and government. in only one area (“create jobs”) did for-profit business get higher ratings than nonprofits.
80%
60%
40%
20%
Survey responses when asked: Please rate your overall level of confidence in California’s nonprofit organizations to: a) Provide quality services, b) Act on the public’s behalf, c) Spend money wisely
Fig
ur
e 4
4 nonprofits are rated more favorably than for-profit and government sectors
Source: California Resident Survey (2018-2019)
CA Nonprofits
US Federal Government
CA For-Profits
CA State Government
Provide quality services
87%
61%
50%
76%
Act on the public’s behalf
84%
57%
43%45%
Spend money wisely
71%
42%
28%
67%
66 CausesCount:theeConomiCPowerofCalifornia’snonProfitseCtor(2019)—CalnonProfits.org
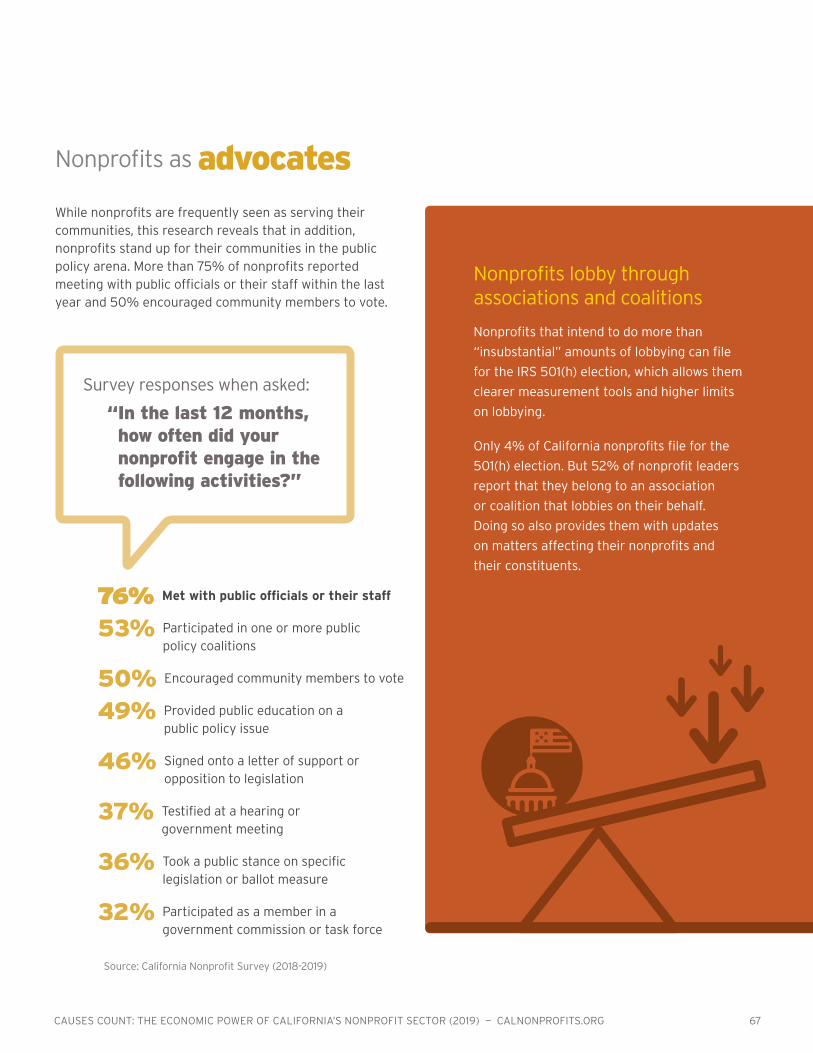
source: California nonprofit survey (2018-2019)
76% Met with public officials or their staff
53% participated in one or more public policy coalitions
50% Encouraged community members to vote
49% provided public education on a public policy issue
46% signed onto a letter of support or opposition to legislation
37% testified at a hearing or government meeting
36% took a public stance on specific legislation or ballot measure
32% participated as a member in a government commission or task force
nonprofits as advocatesWhile nonprofits are frequently seen as serving their communities, this research reveals that in addition, nonprofits stand up for their communities in the public policy arena. More than 75% of nonprofits reported meeting with public officials or their staff within the last year and 50% encouraged community members to vote.
Survey responses when asked:
“�In�the�last�12�months,�how�often�did�your�nonprofit�engage�in�the�following�activities?”�
nonprofits lobby through associations and coalitions
nonprofits that intend to do more than
“insubstantial” amounts of lobbying can file
for the irs 501(h) election, which allows them
clearer measurement tools and higher limits
on lobbying.
only 4% of California nonprofits file for the
501(h) election. But 52% of nonprofit leaders
report that they belong to an association
or coalition that lobbies on their behalf.
Doing so also provides them with updates
on matters affecting their nonprofits and
their constituents.
Causes Count: the eConomiC Power of California’s nonProfit seCtor (2019) — CalnonProfits.org 67
ConCluding Commments from Calnonprofits
From hidden in plain sight… In this study, California’s nonprofit sector is found to be a powerful
economic driver. With one million employees, millions more
volunteers, and generating 15% of the State GDP, nonprofits not
only contribute to California’s economy, but are key partners to
government and communities.
But while people know the after-school sports their kids attend, their
church’s food pantry, the local theatre, Sesame Street, the nearby
university, the SPCA, the Latino health clinic, the fight for clean water,
Alcoholics Anonymous and Wikipedia, they may not realize these are
all part of the community of nonprofits.
And because nonprofits arise from their communities, the nonprofit
sector enjoys a high degree of public confidence — more than either
for-profit businesses or government — to act ethically, to work
efficiently, and to reduce inequalities.
68 CausesCount:theeConomiCPowerofCalifornia’snonProfitseCtor(2019)—CalnonProfits.org

P.S.
…to a seat at the tablenonprofits bring in more than $40 billion dollars to California
from out-of-state. these funds come from the federal
government, from out-of-state foundations, and from
individual donors around the world who observe and value
the leadership role of California’s nonprofits. By recognizing
the economic power of nonprofits, leaders in government,
business, philanthropy and nonprofits can find a path to new,
mutual goals in expanding regional economic activity, rather
than focusing only on redistributing assets within the region.
and within the nonprofit sector, nonprofits and foundations
must look more closely at the startling disparities among
regions, between rural and metro areas, between predominantly
white communities and those that are predominantly of color,
and between wealthier and poorer neighborhoods.
California’s nonprofit community — acknowledging what we
already do — can do much more. We are using our economic
power, our staff and volunteers, and our visions in powerful
work, standing up for California and Californians.
the Causes Count team looks forward to your comments. Email us at [email protected].
Causes Count: the eConomiC Power of California’s nonProfit seCtor (2019) — CalnonProfits.org 69
Causes Count: The Economic Power of California’s Nonprofit Sector is based on research conducted between July 2018 and april 2019, when the research team dug deep and wide to obtain new, reliable, valid, and up-to-date information about the topics addressed in this report. the result uniquely combines multiple data sources, some reflecting different points in time and different inclusionary criteria. readers should take note of the data source, year, and other specifics for each chart and table.
MorE aBoUt MEtHoDoloGY: a comprehensive description of the methods, data sources, and limitations of this study is available in an online technical appendix, calnonprofits.org/publications/causes-count/methodology
Data for this report draws
on multiple sources
IrS tax exempt and government entities (te/ge) and Statistics of Income (SoI)
Much of this study relies on detailed analysis of irs Business Master file extracts of exempt organizations (Eo BMf); and irs form 990, 990-EZ, 990-pf and 990-n returns filed by nearly 145,200 California-based 501(c)(3) public charities and 43,300 other 501(c) exempt organizations for circa fiscal years 2012 through 2016 as of october, 2018, representing the latest fiscal year information available at the time of this study.
datalake Nonprofit research (datalake.net)
primary data sources were irs form 990, 990-EZ, and 990-n electronic (e-file) return and exempt organization registration data archives compiled and analyzed by Datalake, llC. subsector classifications used in this report are based on groupings of national taxonomy of Exempt Entities (ntEE) codes assigned by Datalake.
Candid (candid.org)
Data about the number of foundations, as well as their assets and grantmaking were generated by Candid (formerly Guidestar and foundation Center), which also provided digitized irs form 990 paper returns when e-file returns were not available.
California employment development department (edd)
the California EDD supplied the nonprofit labor and wage data, as well as information about the gender and racial/ethnic diversity of California industries. these data are derived from the U.s. Bureau of labor statistics Quarterly Census of Employment and Wages (QCEW).
two new survey instruments
• The California Resident Survey polled 1,603 California residents to learn about their awareness and perceptions of nonprofits.
• The California Nonprofit Survey polled 1,227 California nonprofit leaders on topics such as staffing, finances, and advocacy.
U.S. Census Bureau
information about the California population was derived from the 2012 and 2016 american Community survey 5-Year Estimates.
government funding data
information about government funding was derived from: federal audit Clearinghouse, Usaspending.gov, Center for Medicare and Medicaid services, California Budget & policy Center, individual data requests from the following counties: alameda, los angeles, Merced, san Diego, san francisco, and santa Clara, and the California nonprofit survey.
Causes Count: the economic Power of California’s Nonprofit Sector
the first Causes Count (2014) publication also serves as a data source for this report.
70 CausesCount:theeConomiCPowerofCalifornia’snonProfitseCtor(2019)—CalnonProfits.org
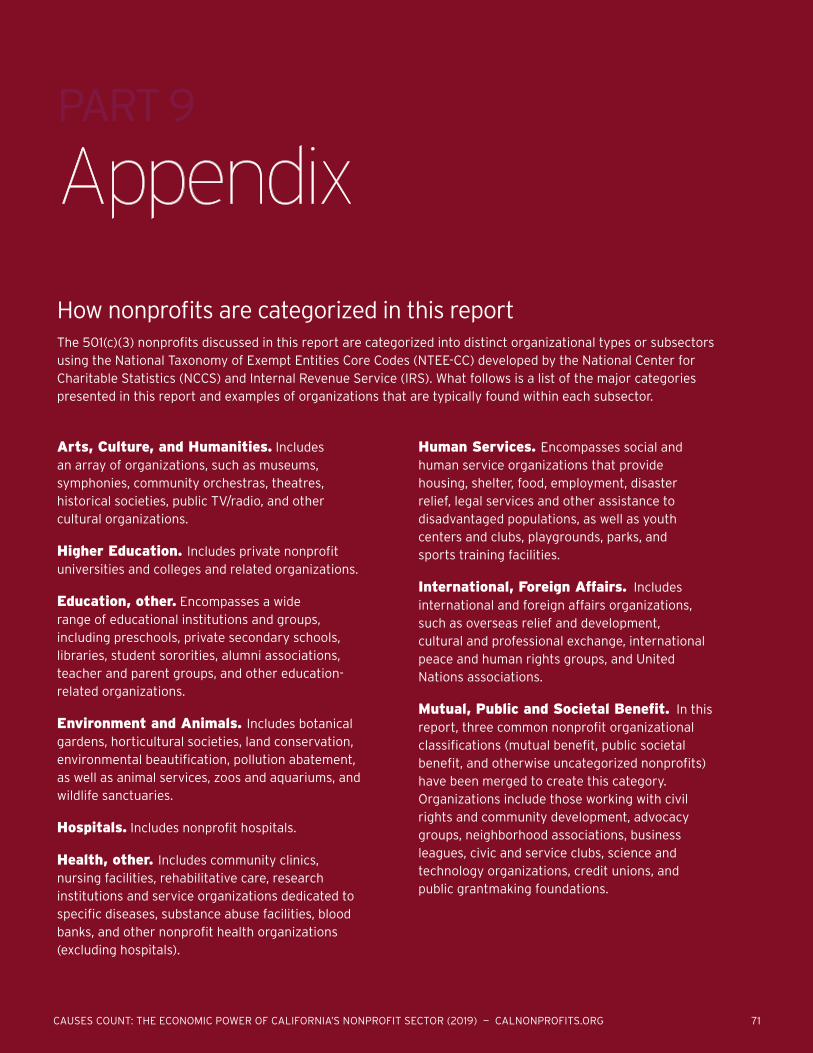
Part 9
Appendix
How nonprofits are categorized in this report
Arts, Culture, and Humanities. Includes an array of organizations, such as museums, symphonies, community orchestras, theatres, historical societies, public TV/radio, and other cultural organizations.
Higher Education. Includes private nonprofit universities and colleges and related organizations.
Education, other. Encompasses a wide range of educational institutions and groups, including preschools, private secondary schools, libraries, student sororities, alumni associations, teacher and parent groups, and other education-related organizations.
Environment and Animals. Includes botanical gardens, horticultural societies, land conservation, environmental beautification, pollution abatement, as well as animal services, zoos and aquariums, and wildlife sanctuaries.
Hospitals. Includes nonprofit hospitals.
Health, other. Includes community clinics, nursing facilities, rehabilitative care, research institutions and service organizations dedicated to specific diseases, substance abuse facilities, blood banks, and other nonprofit health organizations (excluding hospitals).
Human Services. Encompasses social and human service organizations that provide housing, shelter, food, employment, disaster relief, legal services and other assistance to disadvantaged populations, as well as youth centers and clubs, playgrounds, parks, and sports training facilities.
International, Foreign Affairs. Includes international and foreign affairs organizations, such as overseas relief and development, cultural and professional exchange, international peace and human rights groups, and United Nations associations.
Mutual, Public and Societal Benefit. In this report, three common nonprofit organizational classifications (mutual benefit, public societal benefit, and otherwise uncategorized nonprofits) have been merged to create this category. Organizations include those working with civil rights and community development, advocacy groups, neighborhood associations, business leagues, civic and service clubs, science and technology organizations, credit unions, and public grantmaking foundations.
The 501(c)(3) nonprofits discussed in this report are categorized into distinct organizational types or subsectors using the National Taxonomy of Exempt Entities Core Codes (NTEE-CC) developed by the National Center for Charitable Statistics (NCCS) and Internal Revenue Service (IRS). What follows is a list of the major categories presented in this report and examples of organizations that are typically found within each subsector.
Causes Count: the eConomiC Power of California’s nonProfit seCtor (2019) — CalnonProfits.org 71

© Copyright California Association of Nonprofits, 2019. All rights reserved.
Design by TraversoSantana.com
Tessa Tinkler, Senior Research AssociateThe Nonprofit InstituteUniversity of San Diego5998 Alcalá ParkSan Diego, CA 92110(619) 260-2918
Christine Metropoulos, Project CoordinatorCalifornia Association of Nonprofits870 Market Street Suite 985San Francisco, CA 94102www.calnonprofits.org/[email protected](800) 776-4226
Contact information
To contact the Principal Investigator and research team:
For printed copies of this report, more information, or to invite a speaker to your area to present its findings, contact: