the e ect of international relations on tradeeconweb.ucsd.edu/~kheilman/pdfs/boycott052015.pdf ·...
TRANSCRIPT

The Effect of International Relations on TradeEvidence from International Trade Boycotts
Kilian Heilmann†
May 7, 2015
Abstract
I estimate the impact of international conflict on bilateral trade relations usingseveral incidents of politically motivated boycotts: The boycott of Danish goods byMuslim countries following the Muhammad Comic Crisis in 2005/2006, the Chineseboycott of Japanese goods in response to the Senkaku/Diaoyu Island conflict in 2012,the boycotts of French products in the US over the Iraq War in 2003, and Turkey’s boy-cott of Israel over the Gaza conflict in 2014. The results from difference-in-differencesand the synthetic control group method show that boycotts can have strong negativeeffects on bilateral trade both in goods and services. I estimate an average one-yeartrade disruption of 18.8% in the case of Denmark, 2.7% for Japan, and 1.7% of Frenchimports, where in the latter two cases this effect is only short term. For all boycottinstances, this is only a minor share of overall exports of the boycotted country overthe same period. In the Iraq and Gaza war boycott, there is a reciprocal negative ef-fect on the boycotted countries’ imports from the boycotter. Product-level results arein line with intuition: Boycotts are most effective for consumer goods and especiallyhighly-branded signature export goods such as Japanese cars, and they have at most atemporary effect on intermediates and capital goods. An event study on Japanese stockmarket returns suggests that the Chinese boycott depressed stock values of explicitlyboycotted Japanese only temporarily.
JEL classification: F14, F51, F52
Keywords: Consumer boycotts; International trade; International political economy;Economic diplomacy
1 Introduction
Trade policy has long been a popular tool in relations between states. Trade agreements
can strengthen inter-state relations and a large literature in political science has worked on
international trade’s role in promoting peace (e.g. Gartzke et al. 2001, Barbieri 2002, and
†University of California, San Diego. Department of Economics, 9500 Gilman Drive #0508 , La Jolla,CA 92093, USA. Tel: +1-858-228-7661. Email: [email protected].
1
Li and Reuveny 2011). At the same time, international trade can be used as a policy means
in the case of conflict through sanctions, embargoes, and boycotts. Trade boycotts between
countries are a special form of these policy tools. They have been used throughout history
to punish or coerce specific behavior among trading partners. Examples of international
boycotts include the repeated boycotts of Japanese goods by China throughout the 1930s
in response to the Japanese invasion (Lauterpacht 1933), the boycott of Israel by the Arab
League after formation of the Jewish state in 1948, the worldwide boycott movement in
protest of South Africa’s apartheid system in the late 1950s, and the consumer boycott
against French products over nuclear testing in the 1990s. Most recently, the importance
of international trade boycotts has been underlined by Russia’s state-led import ban of
agricultural products from Europe in response to sanctions over Russian interference in
neighboring Ukraine.
These events share the common characteristic that they are not motivated by economic
rationale, for example by inferior product quality, but by political events. In contrast to
the more frequent boycotts against specific firms, such as the boycott against Shell in 1995,
they are directed against entire countries. They seem to become an option when other
means of coercion, such as war or the severing of diplomatic relationships appear to be
infeasible. The latter boycotts of the 21st century appear to be a simple continuation
of earlier practices, but several developments portend an increase in the importance of
boycotts as policy tools and warrant further research.
In a world characterized by less violence and decreasing tolerance for militarized conflict
between states (Pinker 2011), trade policy is the prevailing tool to carry out international
disputes.1 In addition, international trade has surged over the past decades, making boy-
cotts potentially more harmful to trading partners. This is especially true since the nature
of trade has changed from a simple exchange in final goods to a system of international
production sharing. The advent of the internet has also changed international relations and
the importance of governments. Being able to communicate and coordinate their actions
online, consumer boycotts enable the public to become a political agent in international
relations. In the case of the Chinese consumer boycott against Japan in 2012 that I study
in this paper, the internet may have played a crucial role in organizing the boycott, with
the Chinese government having limited control over the reaction on the streets. This raises
questions on how governments and the populace interact when it comes to foreign relations
(Weiss 2013 and 2014) and how different regime types favor the emergence of consumer
boycotts.
1Besides boycotts, this also includes trade sanctions. While not the focus of this paper, the prevalenceof trade policy in solving international conflicts is reflected in the recent economic sanctions against Iranand North Korea.
2
An important question is whether these new types of boycotts are effective. Besides
through a reduction in import demand they might hurt international trade through putting
business partners at personal risk when traveling, through latent government intervention
or even through the boycotted country’s refusal to export in response to the aggression.
Similarly, boycotts can fail in many dimensions. At first, if the boycotted country’s ex-
porters can easily redirect their sales to domestic or other foreign markets, the potential
economic loss may be small. Secondly, even if disrupted exports hurt the exporting coun-
try significantly, boycotts are a costly tool, since the boycotting country is also giving up
on its gains from trade. This is even more true in a world characterized by increasing
international integration of production, often within firms (Zeile 1997). Today trade is not
primarily in final goods anymore, but the share of processing trade is rising. If production
of the boycotting country depends heavily on imports from the boycotted country, this
will raise the costs of the boycott, and it might render it an incredible threat. Further-
more, consumer-led trade boycotts rely on collective action that can be difficult to organize.
Friedman (1999) and John and Klein (2003) study consumer boycotts and their inherent
small-agent problem, i.e. the success of the boycott depends on a mass of participants,
but every individual’s impact and motivation to join in is low. To explain that consumer
boycotts do happen, they propose a variety psychological motivations, such as guilt and
self-esteem or simply an exaggerated sense of one’s own effectiveness. These theoretical
studies suggest that consumer-organized boycotts are short-lived.
The empirical literature on the impact of boycotts on international trade has found
contradicting results, mainly from boycotts in the aftermath of the Iraq War of 2003.
Michaels and Zhi (2010) estimate that bilateral trade deteriorated by about 9% in 2002-03
when France’s favorability rating in the US fell sharply over its refusal of an intervention
in Iraq. Pandya and Venkatesan (2013), using supermarket scanner data, find that brands
that are perceived as being French lose market shares in weeks with high media attention of
the same boycott. They estimate the implied costs of this boycott to be similar to the costs
of an average product recall. For the same period, Clerides et al. (2013) find a significant
but short-lived drop in sales of US soft drinks in the Middle East, but cannot find a similar
effect on other goods. Both these studies are based on local sales and do not investigate the
effect on trade. Davis and Meunier (2011) study quarterly trade relationships between the
US and France as well as between China and Japan for the years 1990-2006, thus including
the boycott of French goods. They do not find any significant link between negative events
involving these countries and the level of goods exchanged, but find that trade as well as
foreign direct investment continued to grow sharply in the period studied.
Besides the focus on explicitly announced boycotts, there is a new literature studying the
relationship between other political conflicts and international economic relations. Fuchs
and Klann (2013) study countries’ trade with China if they officially receive the Dalai Lama.
3

China perceives any formal relations with the Tibetan spiritual leader as an interference
into internal political affairs and threatens countries that do so with a reduction of trade.
The authors find a significant negative short-term effect of state visits on trade volumes
and confirm that, even though the effect dies out after one year, countries are willing to use
trade as a tool to enforce their political will. Fisman et al (2014) and Govella and Newland
(2010) study the effects of Sino-Japanese conflicts in the 21st century on the stock market
value of Japanese firms using an event study approach. They find that stocks of Japanese
companies with a high share of sales to China lose value compared to companies with a
low exposure to China.
The aim of this paper is to evaluate the effectiveness of international trade boycotts
and to quantify their impact on trade relationships. The contribution of this paper that
distinguishes it from previous studies is threefold: At first, I use data at monthly frequency
and product-level detail, allowing for an analysis of both short and long-term effects for
different product groups. This allows me to estimate different impacts for consumer and
intermediate goods that can give insight on the question of who is driving the boycotts.
Secondly, I apply the synthetic control group methodology to construct data-driven coun-
terfactuals that account for omitted variable bias. Finally, I extend the analysis to three
unstudied boycotts that I claim are exogenous to unobserved trade-related shocks and can
be used to identify the effect of these boycotts. They are the boycott of Danish goods after
the Muhammad Comic crisis in 2005/2006, the Chinese boycott of Japanese goods in the
aftermath of the Senkaku/Diaoyu Island conflict in 2012, and Turkey’s boycott of Israel
over the Gaza conflict in 2014. The first two conflicts were sparked by random events car-
ried out by private agents, came along rather unexpected, and thus provide identification
to measure the effectiveness of boycotts.
The results suggest that there is strong heterogeneity in the response between the
boycotting countries, with an average one-year reduction in imports of about 18.8%, 2.7%,
1.7% of total trade in the Muslim boycott case, Senkaku conflict, and the US consumer
boycott against France respectively. I do not find a negative effect for Turkish imports from
Israel following the Gaza war in 2014, but instead observe that Israel reduces its imports
from Turkey by 12.3%. Product-level analysis shows that the impact is concentrated in
consumer goods and especially in highly branded goods such as Japanese cars. I find
only minor effects for intermediates and capital goods, being consistent with the notion
that international trade boycotts are mainly carried out by consumers and not by firms
or governments. This is confirmed by results from the multi-country Muhammad Comic
boycott that countries with a higher press freedom boycott more, indicating consumers
find it easier to organize and participate in boycotts in open regimes. While the estimated
disruption in imports from the boycotted country can be large, the fraction as total exports
of the boycotted country is low in both boycott cases (0.4% for Denmark, 0.5% for Japan,
4

and 0.4% for the US). This suggests that even though an individual firm of the boycotted
country might be hit hard, the overall effect on the export sector is small.
The paper is organized as follows: Section 2 provides background information on the
events studied while section 3 outlines the empirical implementation. Section 4 presents
the findings on both an aggregate and product-level data. Section 5 concludes.
2 Background
In this section, I provide background information on the international conflicts used
in the study and describe the events leading up to the boycotts as well as their political
consequences.
2.1 Muhammad Cartoon Crisis
On September 30, 2005 the Danish newspaper Jyllands-Posten published a series of
cartoons depicting Islamic prophet Muhammad in an unfavorable manner, the most striking
one showing him with a bomb in his turban.2 Not only is the depiction of the prophet
forbidden in several branches of Islam, but Muslims felt that the comics equated them
to terrorists, thus the comics had a religious as well as political dimension. Even though
Danish Muslims protested the publication from the very beginning, it was not until early
2006 that the controversy became international after the comics had been reprinted in
Arabic newspapers. Violent protests sparked in many Middle Eastern countries, leading
the ambassadors of several Muslim countries to unsuccessfully demand an official apology
by the Danish government and prosecution of the cartoon artists.
The months of January and February 2006 saw further escalation of the conflict with
Western embassies being attacked in Damascus, Beirut, and Tehran, leaving several dozen
people dead. With the Danish government refusing an official apology, religious leaders
in Saudi Arabia called for a boycott of Danish goods on January 26, 2006, publishing a
boycott list of Danish firms.3 Soon other Muslim countries joined the boycott. The French
supermarket chain Carrefour preemptively removed Danish goods from its shelves in the
Middle East and several Danish food producers, such as Arla Foods, reported large losses.4
At the same time, a counter-boycott campaign called “Buy Danish” was called for, but it
2For a detailed narrative of the events, see Jensen (2008).3Examples of these lists can be found on http://shariahway.com/boycott/index.htm.4http://www.nytimes.com/2006/01/31/international/middleeast/31danish.html? r=0.
5
remains unclear whether this campaign gained enough media attention to have any large
scale effects.5
The scandal about the Muhammad cartoons eventually lost public attention and the
protests calmed down, though several incidents in later years were linked to the cartoons,
e.g. the 2008 and 2010 attempts to assassinate the creator of the most controversial of the
cartoons which could be prevented by police.
2.2 Senkaku/Diaoyu Islands Conflict
The Senkaku (in Japanese) or Diaoyu (in Chinese) Islands are a small group of islets
unsuited for settlements in the East China Sea approximately 170 km North-East of Taiwan.
In the aftermath of the First Sino-Japanese War (1884-85) and the subsequent invasion of
Taiwan, Japan began to survey the islands and claimed them as its territory. After the
Treaty of San Francisco formally established peace after World War II, Japan ceded all
its claims to Taiwan and the nearby Okinawa islands came under US control. When the
Okinawa islands were returned to Japan in 1972, it tacitly took control of the Senkaku
islands as well and retains a military presence on the islands until today.
In 1968, possible oil reserves were found in the area surrounding the Senkaku/Diaoyu
islands leading to claims of both Mainland China and the Republic of China (Taiwan) to
the islets that were rejected by Japan, leaving the territorial conflict remained unsolved. It
was not until the 2000s when several incidents brought the Senkaku/Diaoyu conflict back
to public attention. Between 2006 and 2011 several activist groups from Mainland China,
Taiwan and Hong Kong arrived at the islands to proclaim Chinese sovereignty and were
expelled by the Japanese navy immediately.
While these events worsened Japanese-Chinese relationships, the conflict only escalated
after Japan announced to purchase the islands from their private owner in August 2012 and
de facto established sovereignty over the archipelago. This led to anti-Japanese protests
in several Chinese cities that later turned violent. Japanese businesses in China were
attacked and protesters called for a boycott of Japanese goods. Japanese-Chinese relations
deteriorated drastically when further naval standoffs near the disputed islands occurred,
leading to worldwide fears over a military conflict. While the dispute has calmed down
and lost media attention, the major issue is still unresolved and remains a major problem
in Japanese-Chinese relations.
5http://www.foxnews.com/story/2006/02/16/muslim-boycotts-hurt-danish-firms/.
6
2.3 US-American Consumer Boycott of France
The months preceding the invasion of Iraq by US-led forces in March 2003 caused
widespread conflicts in international relations. While some European countries supported
action against Saddam Hussein’s regime, others, notably France and Germany, vocally
opposed any intervention that was not backed by the UN. France’s favorability ratings in
the US began to plummet starting in February 2003 and conservative media outlets called
for boycotts of French goods to punish the perceived betrayal of a supposedly close ally.
Relations between the two states deteriorated so much that even Congress’s food menu was
officially relabeled French fries as “freedom fries”.6
2.4 Turkey’s Boycott of Israel
On July 8th 2014, the long-lasting conflict between Israel and the Palestinians esca-
lated again when Israeli military launched airstrikes on Gaza after heavy shelling of Israeli
territory by Hamas. Two weeks later, the Israeli Defense Force led a ground invasion into
the Gaza strip to destroy smuggling tunnels which resulted in the death of more than 2,000
Palestinians, around 1,500 of them being civilians7. Public outcry over the humanitar-
ian toll of the conflict sparked anti-Israel protests in Turkey with Turkish prime minister
equating Israel’s actions to genocide. The Turkish trade union TESK launched a boycott
call against Israel in late July. At the same time, polls in Israel showed that Israelis were
boycotting Turkey and especially its holiday destinations.
3 Methodology
To evaluate the impact of the boycotts on trade, I estimate difference-in-differences
models of logged exports from the boycotted country Yj,t to destination country j at time
t at monthly frequency. I include the typical gravity regressors GDP and distance and
control for a time trend and monthly fixed effects.8 The regression equation is given by
Yj,t = α+β1 Treatj+β2 Postt+β3 Treatj×Postt+β4 logGDPt+β5 log distj+β6t+εj,t. (1)
6While US consumers were boycotting French products, the US itself became the victim of a boycottmovement. The eventual invasion of Iraq triggered a boycott movement against US-American products inthe Middle East. Clerides et al (2013) report the existence of boycott lists of American brands and finda negative effect of US softdrink sales in the Middle East, but are unable to detect a similar effect fordetergents.
7Source: OCHAOPT(http://reliefweb.int/sites/reliefweb.int/files/resources/annual humanitarian overview 2014 english final.pdf)
8For data on population-weighted bilateral distance between trading partners, I use the gravity datasetfrom CEPII. (http://www.cepii.fr/anglaisgraph/bdd/gravity.htm)
7

The difference-in-differences approach might suffer from omitted variable bias if im-
portant determinants of trade are not controlled for. Despite the empirical success of
parsimonious gravity equations in the cross-section, this relationship describes long-time
averages and in the short-term, there may be many more unobserved confounding factors,
such as a country’s industry composition. To avoid this problem and to consistently con-
struct a suitable control pool, I follow the synthetic control group method first used in
Abadie and Gardeazabal (2003) and later further developed in Abadie et al. (2010, 2014).
The synthetic control group method follows a pragmatic data-driven approach to choose
the right control group by creating a weighted average of all the available control units.
The weights are chosen such that the synthetic control group resembles the actual treat-
ment unit in both the outcome variable as well as in any known explanatory characteristics
in the pre-treatment period. The idea behind the method is to indirectly control for any
unobserved factor by matching on previous outcomes. An estimate for the treatment effect
can then be calculated by the difference between treatment unit and the synthetic control
unit in the post-treatment period.
One problem of the synthetic control group methodology is the inability to calculate
standard errors. In practice, the fit between treatment group and the synthetic control
group in the pre-boycott period will not be perfect, but subject to idiosyncratic shocks
captured in the error term εj,t. This will bring randomness into the estimate of the treat-
ment effect βt. The exact distribution of the estimate depends on the unobserved parameter
vector λt and therefore cannot be computed. A pragmatic ad-hoc approach to evaluate
the significance of the parameter estimates is to compare them to the prediction error in
the pre-boycott period. The intuition is that if the synthetic control group fits the actual
treatment unit poorly before the boycott happened, this would undermine the confidence
in the estimate of the treatment effect. If the fit between the actual treatment country and
its synthetic control, however, is close in the pre-boycott period, we can be more confident
in assuming that any divergence after the treatment is actually caused by the boycott and
not due to unrelated shocks.
I formalize this idea by testing for a structural break in the time series of the error term
εj,t and test the model εj,t =∑6
k=1 ρkεj,t−k+βj , t+uj , t against the simple alternative εj,t =∑6k=1 ρkεj,t−k + ut. The six-month autoregressive specification and inclusion of clustered
standard errors allows for the possibility of a correlation over time and between countries.
In specific, I report p-values of an F-test with the null hypothesis H0 :∑T0+d
t=T0+1 βt = 0
where d denotes the horizon of the effect.
To complement the analysis, I also perform placebo tests that traditionally have been
used in the context of synthetic control groups. There are two dimensions where a placebo
test can detect wrongful inference: Within a single time series, a random assignment of a
8

treatment time should not break the close fit between actual and synthetic control group
and should not produce large estimates of the treatment effect. If both series deviate even
though there is no boycott, then this should warn us that the synthetic control group is
merely picking up unrelated idiosyncratic effects. Furthermore, we can estimate the same
treatment effect for the control countries. If these countries are indeed unaffected by the
boycott, the synthetic control group method should not find large treatment effects. If
however the control countries seem to be negatively affected by the boycott, this would
hint to mis-specification in the model and would greatly undermine our confidence in the
method.
4 Results
This section presents the data sources, descriptive statistics, and the estimation results
of both the difference-in-differences and synthetic control group methods for each boycott
case.
4.1 Mohammad Cartoon Crisis
4.1.1 Data and Descriptive Statistics
I use data from the online portal of Statistics Denmark.9 This dataset covers Danish
export values in local Danish krona (DKK) to virtually all trade partners at monthly
frequency at the two-digit and five-digit SITC classification from the late 1980s onward.
Unsurprisingly, being a small country, imports from Denmark make up only a small share
of the Muslim world’s total trade. On average, only 0.29% of all imported goods of the 34
countries with at least 75% Muslim population10 stem from Denmark. Similarly, Danish
exports to the Muslim world as a share of its total exports are relatively small accounting
for 2.66% of Danish exports to all trading partners in 2004. Even the biggest Muslim
trading partner, Saudi Arabia, accounted for less than half a percent of Danish exports in
2004 (see Table 15 in the appendix).
Examining export values from Denmark to the boycotting countries shows that monthly
trade data is characterized by high volatility, seasonal patterns, and possibly changing time
trends. It is not uncommon that Danish exports to these countries increase by a multitude
over one month or that trade completely collapses even in the pre-boycott period. The
9http://www.dst.dk.10For the exact list of these countries, see Table 14 in the appendix.
9
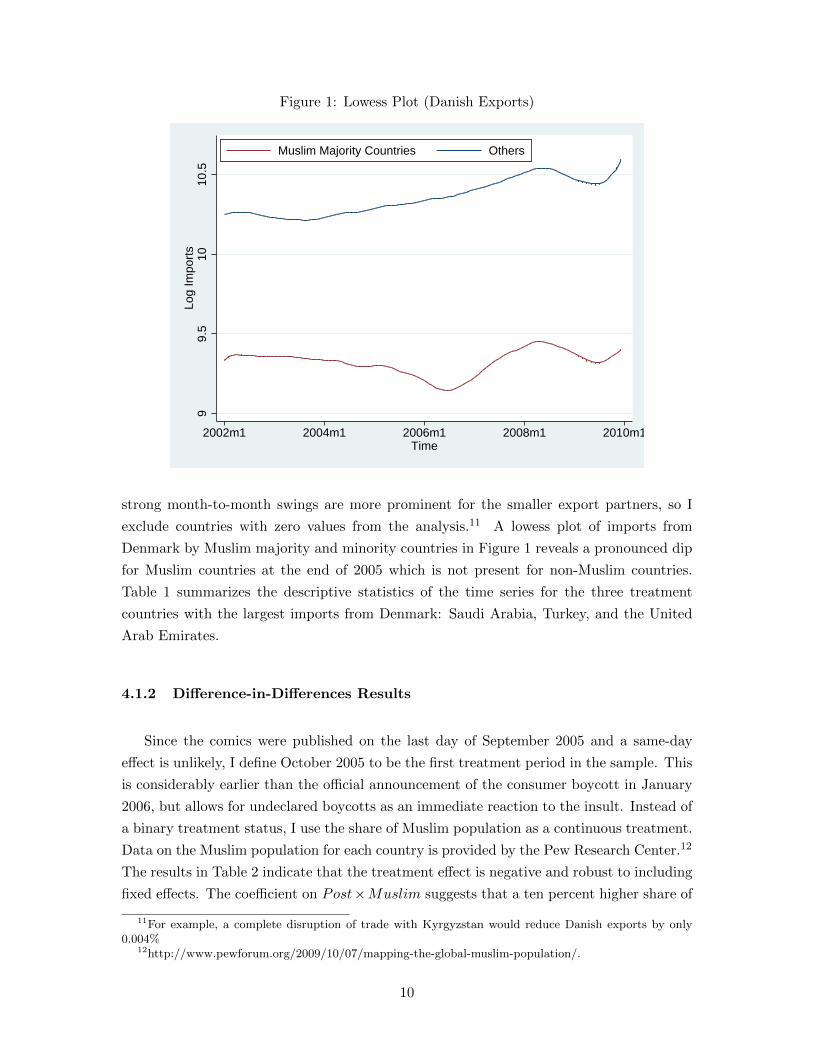
Figure 1: Lowess Plot (Danish Exports)
99.
510
10.5
Log
Impo
rts
2002m1 2004m1 2006m1 2008m1 2010m1Time
Muslim Majority Countries Others
strong month-to-month swings are more prominent for the smaller export partners, so I
exclude countries with zero values from the analysis.11 A lowess plot of imports from
Denmark by Muslim majority and minority countries in Figure 1 reveals a pronounced dip
for Muslim countries at the end of 2005 which is not present for non-Muslim countries.
Table 1 summarizes the descriptive statistics of the time series for the three treatment
countries with the largest imports from Denmark: Saudi Arabia, Turkey, and the United
Arab Emirates.
4.1.2 Difference-in-Differences Results
Since the comics were published on the last day of September 2005 and a same-day
effect is unlikely, I define October 2005 to be the first treatment period in the sample. This
is considerably earlier than the official announcement of the consumer boycott in January
2006, but allows for undeclared boycotts as an immediate reaction to the insult. Instead of
a binary treatment status, I use the share of Muslim population as a continuous treatment.
Data on the Muslim population for each country is provided by the Pew Research Center.12
The results in Table 2 indicate that the treatment effect is negative and robust to including
fixed effects. The coefficient on Post×Muslim suggests that a ten percent higher share of
11For example, a complete disruption of trade with Kyrgyzstan would reduce Danish exports by only0.004%
12http://www.pewforum.org/2009/10/07/mapping-the-global-muslim-population/.
10

Table 1: Descriptive Statistics (Log Danish Exports)
Country Saudi Arabia Turkey UAE Aggregate
Mean (in DKK) 176,710 205,965 129,765 1,036,268Standard Deviation 31,738 87,048 37,468 188,399Std Dev as Mean 18.0% 42.3% 28.9% 18.2%Minimum 100,143 77,810 82,677 710,530Maximum 272,301 462,941 422,072 1,596,562Min % Change -33.0% -60.2% -54.4% -29.1%Max % Change 67.8% 92.6% 194.7% 46.9%Seasonality p-value 0.37 0.32 0.68 N/A
Statistics over the pre-boycott period October 2000 to September 2005.
Seasonality p-value is the p-value of a F-test testing for joint significance
of monthly indicator variables in a linear time series regression.
Muslim population reduces imports from Denmark by 3.7%. The elasticities with respect to
GDP and distance have the expected positive and negative signs respectively. The negative
coefficient on the share of Muslim population indicates that the treatment countries in
general import less from Denmark than similar non-Muslim countries. Controlling for
potentially endogenous exchange rate fluctuations, the treatment effect is still significant,
but reduced to 2.2%.
Heterogeneity among the boycotting countries allows me to investigate the importance
of different regime types for the effectiveness of the boycott. Consumer-organized boycotts
are only possible if the populace is able to interact and draw masses to its cause. I estimate
a triple difference model by interacting the treatment effect with a variable measuring the
freedom of press as reported by Reporters Sans Frontieres in the Quality of Government
database.13 The coefficient on the triple interaction term in column (4) suggests that
Muslim countries with a one-unit higher press freedom score reduce their imports from
Denmark by an additional 1.18%. This suggests that more open countries allow for more
organized action of their people and this strengthens the theory of the conflict being a
consumer boycott.14 In column (5), I interact the treatment effect with elasticities of
substitution at the five-digit SITC level as measured by Broda and Weinstein (2006). This
addition shows no significant effect on the boycott. If at all, highly substitutable goods are
boycotted less, but the coefficient is imprecisely estimated.
To analyze the potentially heterogeneous effects on different product groups, I break
up the analysis into three main product types: Consumer goods, intermediate goods, and
13http://qog.pol.gu.se/data14In regressions not reported here, I show that this result is robust against using alternative governance
indicators such as the Polity IV score that ranks countries according to constitutional and practical criteria.
11

Table 2: Muhammad Comic Crisis: Results
Dependent Variable: Danish Exports(1) (2) (3) (4) (5)
log GDP 0.950∗∗∗ 0.455∗∗∗ 0.511∗∗∗ 0.491∗∗∗ 0.258∗
(0.0366) (0.115) (0.111) (0.112) (0.147)
log Distance -0.880∗∗∗
(0.0787)
Post 0.043 0.065∗ 0.049 -0.166 0.691∗∗∗
(0.0389) (0.0376) (0.037) (0.129) (0.072)
Muslim -0.106(0.179)
Post × Muslim -0.370∗∗∗ -0.302∗∗∗ -0.217∗∗ 0.204 -0.457∗∗∗
(0.098) (0.091) (0.090) (0.215) (0.175)
log Exchange Rate -0.015(0.085)
Press Freedom -0.0024(0.0047)
Post × Press Freedom 0.0039∗∗
(0.0019)
Press Freedom × Muslim -0.0006(0.0116)
Post × Press Freedom × Muslim -0.0118∗∗
(0.0049)
Elasticity (in 100) -0.00801(0.00509)
Post × Elasticity 0.00298(0.00487)
Elasticity × Muslim 0.00595(0.0138)
Post × Elasticity × Muslim 0.0159(0.0155)
Country Fixed Effects No Yes Yes Yes YesTrend and Month FE Yes Yes Yes Yes YesN 13,518 13,518 10,267 12,954 5,037,984adj. R2 0.857 0.944 0.959 0.943 0.113
Standard errors in parentheses (clustered at country level)∗ p < 0.10, ∗∗ p < 0.05, ∗∗∗ p < 0.01
12
capital goods.15 Unlike consumer goods which merely reduce consumption, a boycott of
intermediate and capital goods may have direct effects on the economy of the boycotting
country if it depends heavily on foreign inputs. This drives up the cost of the boycott and we
expect a weaker effect for these goods if countries choose their boycott strategy rationally.
In addition, knowing which goods are boycotted allows to gain some insight about who is
the main driver behind the boycott. If the boycott is mainly consumer-driven, we should
expect a higher trade disruption in consumer goods as compared to non-consumer goods.
A large effect for non-consumer goods would suggest that local producers engage in the
boycott as well or that governments restrict imports indiscriminately.
The results show the heterogeneity of the treatment effect for the different product
types. While there is no statistically significant treatment effect for intermediate goods, we
observe that a ten percent higher Muslim population is associated with a 6.5% and 2.8%
drop in consumer and capital goods imports from Denmark respectively. This confirms that
the boycott was most effective for products that individual consumers purchase and suggests
that while capital goods are also affected, the nature of the boycott is primarily a consumer
boycott. The difference between capital and intermediate goods might be explained by the
fact that capital goods tend to be branded and are thus easier to recognize as of Danish
origin than intermediate goods. I also use yearly data from the International Trade Centre
on trade in services and analyze its response to the boycott. The negative effect is very
strong at 4.8% suggesting that Muslim countries readily reduced travel, communication,
financial and other services from Denmark. This is not surprising as compared to trade in
goods, trade in services requires more personal interaction between people in the conflict
parties.
To answer the question whether the boycott announcement caused a two-way trade
disruption, that is whether Danish consumers retaliated against the Muslim states, I apply
the above methodology to Danish import data. The results in Table 18 indicate that the
Danish did not boycott. While the estimates indicate a reduction in imports from Muslim
countries after the comics were published, the standard errors are too high to conclude that
there was a significant effect. Anecdotal evidence from newspaper articles also suggests that
the boycott was a one-way trade disruption.
15Where available, I use the Broad Economic Categories (BEC) classification developed by the UNStatistics Department to categorize SITC5 codes. Trade codes that are not available in the BEC werecoded by my own judgment in close concordance with the logic of the BEC classification. The completeconversion table can be found in the online appendix.
13
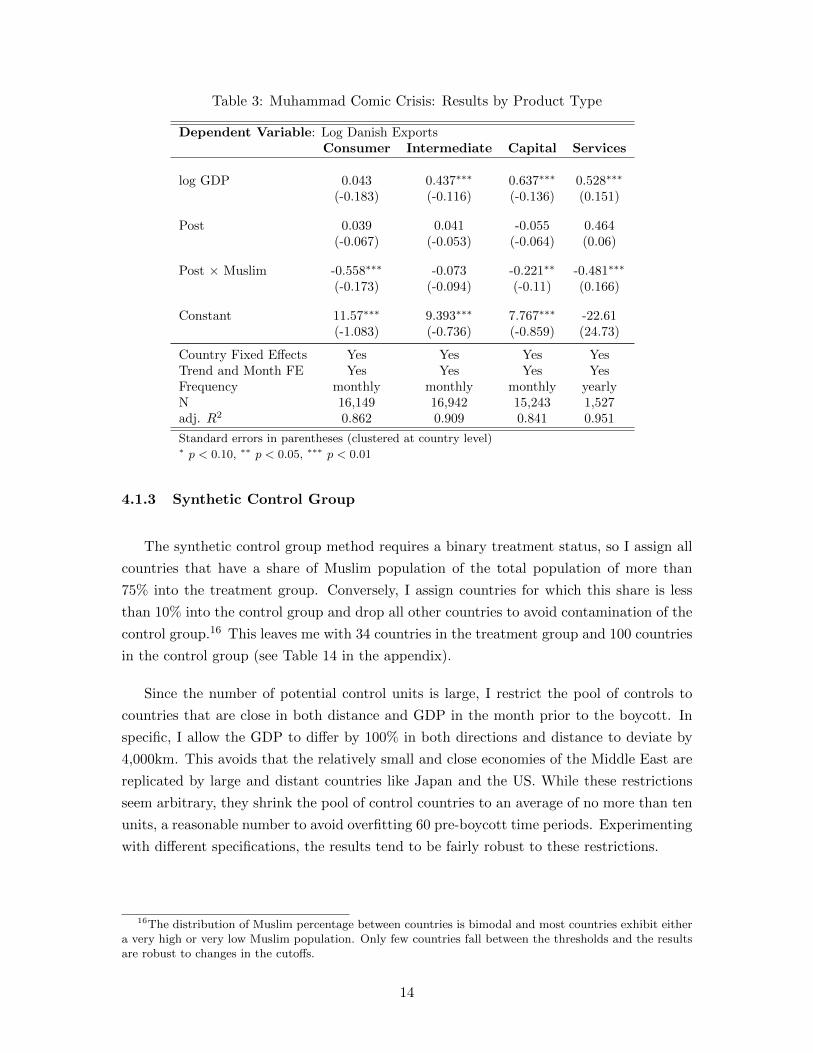
Table 3: Muhammad Comic Crisis: Results by Product Type
Dependent Variable: Log Danish ExportsConsumer Intermediate Capital Services
log GDP 0.043 0.437∗∗∗ 0.637∗∗∗ 0.528∗∗∗
(-0.183) (-0.116) (-0.136) (0.151)
Post 0.039 0.041 -0.055 0.464(-0.067) (-0.053) (-0.064) (0.06)
Post × Muslim -0.558∗∗∗ -0.073 -0.221∗∗ -0.481∗∗∗
(-0.173) (-0.094) (-0.11) (0.166)
Constant 11.57∗∗∗ 9.393∗∗∗ 7.767∗∗∗ -22.61(-1.083) (-0.736) (-0.859) (24.73)
Country Fixed Effects Yes Yes Yes YesTrend and Month FE Yes Yes Yes YesFrequency monthly monthly monthly yearlyN 16,149 16,942 15,243 1,527adj. R2 0.862 0.909 0.841 0.951
Standard errors in parentheses (clustered at country level)∗ p < 0.10, ∗∗ p < 0.05, ∗∗∗ p < 0.01
4.1.3 Synthetic Control Group
The synthetic control group method requires a binary treatment status, so I assign all
countries that have a share of Muslim population of the total population of more than
75% into the treatment group. Conversely, I assign countries for which this share is less
than 10% into the control group and drop all other countries to avoid contamination of the
control group.16 This leaves me with 34 countries in the treatment group and 100 countries
in the control group (see Table 14 in the appendix).
Since the number of potential control units is large, I restrict the pool of controls to
countries that are close in both distance and GDP in the month prior to the boycott. In
specific, I allow the GDP to differ by 100% in both directions and distance to deviate by
4,000km. This avoids that the relatively small and close economies of the Middle East are
replicated by large and distant countries like Japan and the US. While these restrictions
seem arbitrary, they shrink the pool of control countries to an average of no more than ten
units, a reasonable number to avoid overfitting 60 pre-boycott time periods. Experimenting
with different specifications, the results tend to be fairly robust to these restrictions.
16The distribution of Muslim percentage between countries is bimodal and most countries exhibit eithera very high or very low Muslim population. Only few countries fall between the thresholds and the resultsare robust to changes in the cutoffs.
14

To calculate the value of the foregone trade, I simply add up the treatment effects of
all treatment countries for each month and calculate the percentage loss as a share of total
trade levels. Table 4 shows the estimated aggregate percentage reduction for a period of
three, twelve, and 24 months. The results indicate that there was a statistically significant
fall in imports from Denmark in the treatment countries which is robust to changes in
the specification of the control group and sampling frequency. My preferred estimate in
column (1) with all three predictors for the 19 treatment countries that take up at least
0.02% of all Danish exports shows that the short-term reduction in imports reaches 12.4%
after three months. The boycott then intensifies to a 18.8% trade loss within one year;
after that the impact is reduced to 14.7% after 24 months.
Table 4: Estimated Treatment Effect (Synthetic Control)
(1) (2) (3) (4) (5) (6) (7)
3 Months -12.4% -11.8% -9.1% -16.6% -15.1% -13.7% -8.7%(.0000) (.0000) (.0000) (.0000) (.0000) (.0000) (.0000)
12 Months -18.8% -17.6% -16.0% -19.3% -20.9% -19.3% -18.5%(.0000) (.000) (.0000) (.0000) (.0000) (.0000) (.0000)
24 Months -14.7% -13.7% -11.1% -14.6% -16.1% -15.2% -13.2%(.0019) (.0000) (.0000) (.0001) (.0000) (.0000) (.0000)
GDP 100% 100% none 100% 100% 100% 100%Distance 4000km 4000km none 4000km 4000km 4000km 4000kmFrequency monthly monthly monthly quarterly monthly monthly monthlyExcluded none none none none GDP Distance LagsControls 9.5 8.1 14.7 8.0 9.4 9.4 23.2Correlation 40.2% 32.7% 62.7% 62.8% 38.3% 36.7% 5.9%CV 40.8% 67.8% 36.2% 26.6% 41.2% 41.5% 50.5%Countries 19 29 19 19 19 19 19
Excluded: Variable excluded from the matching procedure.
Controls: Average number of control countries per treatment country.
Correlation: Average value of correlation coefficient in the pre-treatment period between treatment
and synthetic control.
CV: Average value of coefficient of variation.
Countries: Number of treatment countries.
p-values in parentheses.
Including the ten smaller Muslim countries introduces more noise to the without chang-
ing the results much. Releasing the restrictions on the control pool significantly increases
the average number of control countries from 9.5 to 14.7 and consequently the average pre-
period correlation, leading to slightly lower estimates of the treatment effect. Using quar-
terly instead of monthly data, the reduction in noise leads to a similar high pre-treatment
fit. While the short-term estimates are slightly higher, the treatment effect after 24 months
remains basically the same. To further strengthening the robustness of the results, I shut
down one predictive variable (GDP, distance, previous trade levels) at a time in columns
15

(5) - (7). While the short-term results differ slightly, the long-term effects after 24 months
are close to the baseline result of -14.7%.
The results by country depicted in Table 16 in the appendix show strong heterogeneity
between the different Muslim countries. Some larger export partners like Algeria, Egypt,
Kuwait, and Saudi Arabia see a strong and persistent negative effect, while some countries
even show a positive reaction. Most notably, the second and third largest Danish trading
partners Turkey and UAE show no reaction to the boycott at any time horizon. Figure 2
maps the geographical distribution of the estimated treatment effect.
Figure 2: Spatial Distribution of Treatment Effect
Legend
Countries
Controls
Below -25%
-25% to -5%
-5% to +5%
+5% to +20%
+20% to +45%
More than +45%
Not Included
Adding up the estimates for all countries, I calculate the total disruption of trade due to
the boycott to be about 0.51 billion DKK after three months, 2.86 billion DKK after twelve
months, and 4.28 billion DKK after two years. The US-Dollar equivalents after taking into
account fluctuations of the exchange rate are 198 million USD after three months, 444
million USD after one year, and 758 million USD after two years.
While the percentage loss for all the Muslim countries combined is sizable, this loss is
marginal when compared to the total exports of Denmark. Over the period from October
2005 to September 2007, Danish exports to all its trading partners summed to 1.08 trillion
DKK (185 billion USD). The implied overall disruption of trade caused by the boycott is
then only 0.4% of all Danish exports during this period. While the boycott might have hit
individual Danish companies hard, the effect on the total Danish export sector is negligible.
16

Product-level Results To assess the treatment effect by product type, I first add up
the Danish exports to all the treatment countries and then separate them by product type.
Table 3 shows the realized and counterfactual log Danish imports of each classification.
Consistent with the boycott being consumer-driven, I see the largest relative decline in
consumer goods with long-term reductions in this category of 27.5% and 24.8% after one
and two years respectively. This suggests that the publication of the comics itself did not
cause a major consumer reaction, but only after the official boycott announcement did
imports from Denmark decline.
Figure 3: Realized and Counterfactual Trade Levels by Class
−60 −40 −20 0 20 4018.5
19
19.5
20
Log
Con
sum
er E
xpor
ts
Comics
BoycottRealized ConsumerSynthetic Consumer
−60 −40 −20 0 20 4019
19.5
20
20.5
Log
Inte
rmed
iate
Exp
orts
Comics
BoycottRealized IntermediateSynthetic Intermediate
−60 −40 −20 0 20 4018
18.5
19
19.5
20
20.5
Months since Boycott
Log
Cap
ital E
xpor
ts
Comics
BoycottRealized CapitalSynthetic Capital
−60 −40 −20 0 20 4014
14.5
15
15.5
16
16.5
17
17.5
18
Months since Boycott
Log
Oth
er E
xpor
ts
Comics
BoycottRealized OthersSynthetic Others
For non-consumer goods, the reaction is less strong and in many cases not statistically
significant. Danish capital goods exports to the Muslim world seem to decline marginally
in the short and medium run, but the large prediction errors render this result statistically
insignificant. Over two years, this decline is reduced to less than 2%. For intermediate
goods, we do see a significant reduction in imports from Denmark of about 9.0% and 10.9%
after 3 and 12 months respectively. The reduction for these goods is reduced to 1.7% after
two years. This is inconsistent with the idea of a pure consumer boycott and could be
explained by nationalistic sentiment of business owners or official trade restrictions such as
complicating the processing of imports at custom offices.
17
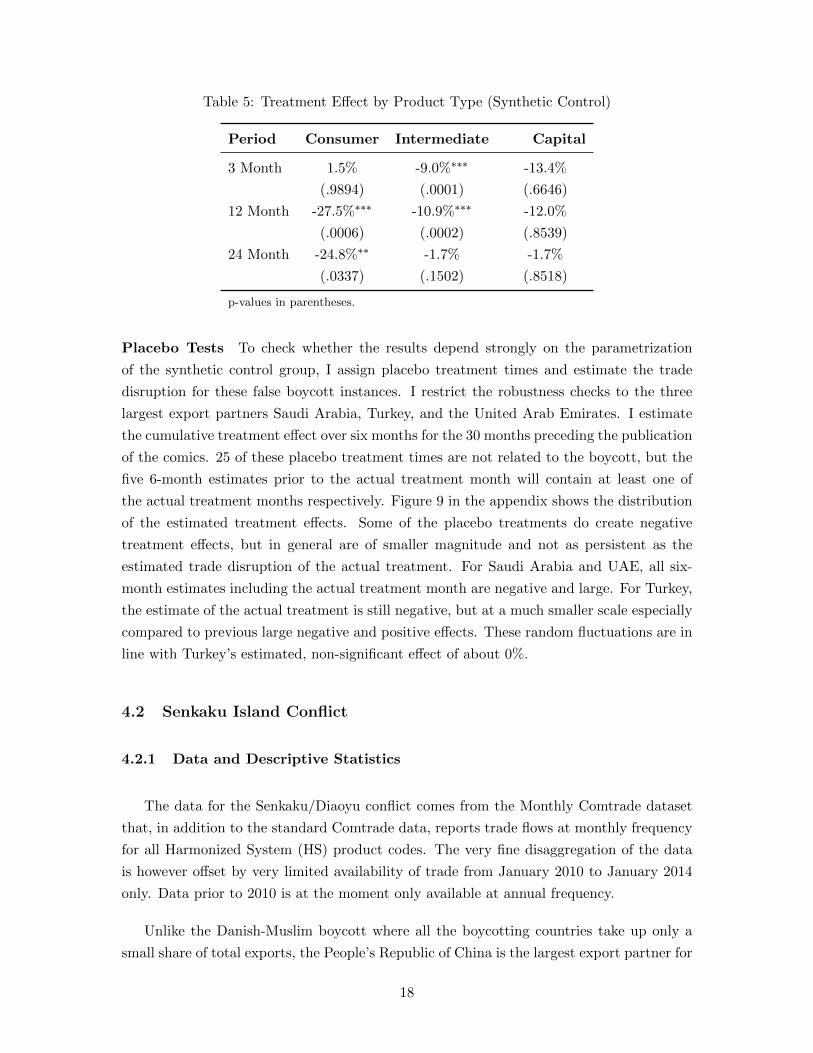
Table 5: Treatment Effect by Product Type (Synthetic Control)
Period Consumer Intermediate Capital
3 Month 1.5% -9.0%∗∗∗ -13.4%
(.9894) (.0001) (.6646)
12 Month -27.5%∗∗∗ -10.9%∗∗∗ -12.0%
(.0006) (.0002) (.8539)
24 Month -24.8%∗∗ -1.7% -1.7%
(.0337) (.1502) (.8518)
p-values in parentheses.
Placebo Tests To check whether the results depend strongly on the parametrization
of the synthetic control group, I assign placebo treatment times and estimate the trade
disruption for these false boycott instances. I restrict the robustness checks to the three
largest export partners Saudi Arabia, Turkey, and the United Arab Emirates. I estimate
the cumulative treatment effect over six months for the 30 months preceding the publication
of the comics. 25 of these placebo treatment times are not related to the boycott, but the
five 6-month estimates prior to the actual treatment month will contain at least one of
the actual treatment months respectively. Figure 9 in the appendix shows the distribution
of the estimated treatment effects. Some of the placebo treatments do create negative
treatment effects, but in general are of smaller magnitude and not as persistent as the
estimated trade disruption of the actual treatment. For Saudi Arabia and UAE, all six-
month estimates including the actual treatment month are negative and large. For Turkey,
the estimate of the actual treatment is still negative, but at a much smaller scale especially
compared to previous large negative and positive effects. These random fluctuations are in
line with Turkey’s estimated, non-significant effect of about 0%.
4.2 Senkaku Island Conflict
4.2.1 Data and Descriptive Statistics
The data for the Senkaku/Diaoyu conflict comes from the Monthly Comtrade dataset
that, in addition to the standard Comtrade data, reports trade flows at monthly frequency
for all Harmonized System (HS) product codes. The very fine disaggregation of the data
is however offset by very limited availability of trade from January 2010 to January 2014
only. Data prior to 2010 is at the moment only available at annual frequency.
Unlike the Danish-Muslim boycott where all the boycotting countries take up only a
small share of total exports, the People’s Republic of China is the largest export partner for
18

Table 6: Descriptive Statistics (Japanese Exports)
Country PR China Taiwan Hong Kong
Mean (in USD) 12,800,000 4,175,000 3,502,000Standard Deviation 1,378,000 363,400 362,700Std Dev as Mean 10.8% 8.7% 10.4%Minimum 9,626,000 3,090,000 2,674,000Maximum 15,420,000 4,770,000 4,149,000Min % Change -30.4% -25.2% -29.4%Max % Change 32.6% 22.9% 39.2%Seasonality p-value 0.01 0.00 0.00Share of Japanese Exports 19.2 6.2 5.2Japanese hare of Total Imports 11.8 19.6 8.8
Statistics over the pre-boycott period January 2010 to August 2012.
Seasonality p-value is the p-value of a F-test testing for joint significance of monthly
indicator variables in a linear time series regression.
Japan in the pre-boycott period from January 2000 to August 2012. China alone accounts
for 19.23% of all Japanese exports. The Special Administrative Region of Hong Kong and
Taiwan17 report separate trade statistics. Including the trade with these entities, the total
percentage of exports to the Chinese-speaking world amounts to 30.8%
For the Japanese-Chinese trade data, the month-to-month fluctuations are lower but
can still reach percentage changes of more than 30% in either direction. The time series is
marked by a stark drop in March 2011, the effect of the devastating Tohoku earthquake and
tsunami that resulted in more than 50,000 deaths. Seasonality might be an issue especially
in the winter months in which trade appears to slow down and the F-test testing for the
joint significance of the monthly indicator variables suggests seasonal patterns.
4.2.2 Difference-in-Differences Results
For the Senkaku Island Crisis case, I identify three political entities that are potentially
affected by the boycott announcement: The People’s Republic of China, its Special Admin-
istrative Region (SAR) Hong Kong and the Republic of China (Taiwan). All these entities
claim sovereignty of the Diaoyu Islands and sent activists to them. I esimtate the model
in (1) where Chinesej is an indicator variable that takes the value of one if the country is
either China, Taiwan, or Hong Kong.
The results in Table 7 show that the treatment effect is negative in all specifications at -
12.7%. As before, the coefficients on GDP and distance have the expected signs and positive
17For political reasons, monthly trade data for Taiwan is not officially available in the Comtrade Monthlydataset, but can be inferred from the country code 490, “Other Asia, nes”.
19

results for Chinese indicate that Japan exports more to the treatment countries than to
similar non-Chinese countries to begin with. To analyze heterogeneity in the response
to the boycott, I re-estimate the model above for each Chinese country separately. The
estimates for the individual countries indicate that the results are mainly driven by the PR
China with a strong negative estimate of 29% whereas the Taiwan and Hong Kong show
smaller estimates of -6% and -16%. In the opposite direction, I do not find any effect for
Japan boycotting imports from China as seen in Table 18.
Table 7: Senkaku Crisis: Results
Dependent Variable: Log Imports from Japan
Countries All All PR China Hong Kong Taiwan
log GDP 0.881∗∗∗ 1.093∗∗∗ 1.427∗∗∗ 1.441∗∗∗ 1.420∗∗∗
(0.051) (0.281) (0.256) (0.257) (0.255)
log Distance -1.289∗∗∗
(0.238)
Post -0.131∗∗∗ -0.120∗∗∗ -0.120∗∗∗ -0.120∗∗∗ -0.120∗∗∗
(0.035) (0.037) (0.032) (0.032) (0.0318)
Chinese 1.114∗
(0.594)
Post × Chinese -0.127∗∗ -0.131∗∗ -0.292∗∗∗ -0.0647∗∗ -0.157∗∗∗
(0.054) (0.060) (0.0347) (0.0284) (0.0598)
Constant 7.406∗∗ -8.744 -15.57∗∗∗ -15.89∗∗∗ -15.44∗∗∗
(2.944) (5.407) (4.831) (4.849) (4.794)Country Fixed Effects No Yes Yes Yes YesTrend and Month FE Yes Yes Yes Yes YesN 7980 7980 5664 5664 5664adj. R2 0.73 0.95 0.96 0.96 0.96
Standard errors in parentheses (clustered at country level)∗ p < 0.10, ∗∗ p < 0.05, ∗∗∗ p < 0.01
4.2.3 Synthetic Control Group
The nature of Japanese trade with Mainland China creates challenges with the synthetic
control group method. As discussed above, Mainland China is not only Japan’s largest
export partner over the pre-treatment period but it is also geographically close. It is thus
at the end of the distribution of both outcome as well as explaining variables and it is
impossible to replicate its imports from Japan with a weighted average with the strong
restrictions on the weights given in equations (3) and (4). The other treatment units,
Taiwan and Hong Kong, have smaller shares of 6.2% and 5.2% respectively, but there are
still only two control countries that import more from Japan (USA and Korea). I therefore
20

relax the conditions of the weights to be in the unit interval and instead allow for arbitrary
weights.
To avoid overfitting, I restrict the number of control units to countries that have a
similar GDP.18 In general, a small number of countries is able to replicate the Chinese
trade patterns rather well according to the correlation coefficients in Table 8.
Figure 4: Realized and Counterfactual Japanese Exports to China
−35 −30 −25 −20 −15 −10 −5 0 5 10 1522.8
22.9
23
23.1
23.2
23.3
23.4
23.5
Months since Boycott
Log
Japa
nese
Exp
orts
Boycott
Realized ChinaSynthetic China
Figure 4 shows the realized and counterfactual exports from Japan to China on a log
scale. The strong decline in realized exports for about six months after the boycott is easily
visible and trade levels even fell below those that followed the devastating earthquake in
2011. Yet Chinese imports from Japan were on a downward trend and only a portion of
the decline can be attributed to the boycott, as the counterfactual trade figures implied by
the synthetic control group decline as well. The effect seems to die out after half a year
and then trade values catch up with the control unit. Table 8 shows this short term effect
with a highly significant three and six month effect that is not statistically significant at 12
months anymore. The total reduction in Japanese exports within one year of the boycott
amounts to 2.69% and is equivalent to 3.48 billion USD. This estimated trade disruption
amounts to a share of 0.5% of total Japanese exports over the same time period. As in
the case of the Muhammad Comic boycott, this is a rather small percentage of the total
Japanese export economy.
18In specific, the replicating country’s GDP should have at least 20% of GDP of the treatment countryand it should not exceed it by the factor 1.8. While arguably arbitrary, this creates control pools of around10 control countries.
21

For the other Chinese entities there is no significant negative effect, but Hong Kong
and Taiwan experience a positive reaction to the boycott. This hints towards substitution
of exports from Mainland China towards these entities, significantly reducing the overall
negative impact of the Mainland boycott. One can conclude that the boycott was effective
only in Mainland China and that the movement was unable to encourage Chinese people
in Taiwan and Hong Kong to participate in the boycott.
Table 8: Estimated Trade Disruption
Country Correlation 3 Months 6 Months 9 Months 12 Months
PR China 0.913 -10.39%∗∗∗ -9.09%∗∗ -3.59%∗ -2.69%
(.0021) (.0147) (.0854) (.1376)
Taiwan 0.840 0.87% 6.75%∗∗∗ 13.41%∗∗ 10.20%∗
(.2363) (.003) (.0388) (.0648)
Hong Kong SAR 0.917 5.15%∗∗∗ 3.00%∗∗∗ 9.28%∗∗∗ 7.03%∗∗∗
(.0030) (.0057) (.0007) (.0022)
Placebo
France 0.860 -2.48% -5.40% 1.43% 1.09%
(.3527) (.1029) (.958) (.7423)
Germany 0.860 3.57% 1.47% 0.20% 0.15%
(.0757) (.2998) (.7073) (.6525)
Russia 0.861 -10.59%∗∗∗ -7.88%∗∗ -0.19% -0.15%
(.0001) (.0199) (.2628) (.2901)
India 0.845 -1.02% 4.76%∗∗ -3.42% -2.56%
(.6073) (.032) (.5129) (.2121)
Thailand 0.883 8.78%∗∗∗ 11.30%∗∗∗ 6.94%∗ 5.21%
(.0003) (.006) (.051) (.1534)
UK 0.730 3.30% 7.12% -4.25% -3.16%
(.7451) (.9986) (.3841) (.2811)
USA 0.963 3.93%∗∗ 7.18%∗∗∗ 11.60%∗∗ 8.62%∗
(.039) (.0012) (.0163) (.0886)
Correlation is the pre-treatment correlation coefficient between treatment and synthetic control unit.
p-values in parentheses.
The short pre-boycott period does not allow for a sensible placebo assignment of the
treatment time. I instead estimate the treatment effect for the control countries that should
not be affected by the boycott. I calculate the percentage losses of Japanese imports to
the countries of France, Germany, Russia, India, Thailand, the UK, and the US which are
all major trading partners of Japan. The results in Table 8 show that for the majority of
the controls, the boycott did not have a significant effect on imports from Japan. Russia
is the exception as it shows a significant negative impact over a 6-month period. This
effect however disappears at the one-year window. The US and Thailand show a positive
reaction to the Chinese boycott, suggesting that the Japanese exporters substituted their
goods towards these countries.
22
4.2.4 Identifying Consumer Industries
Beyond dividing trade into consumer, intermediate, and capital goods the data allows
me to look at a more detailed product level to trace out the effect of the boycott for six-
digit HS categories.19 I make use of publications of the Chinese boycott movement itself to
identify consumer goods that are most prone to the boycott, i.e. goods that can be clearly
identified by Chinese consumers as being Japanese. These publications are two flyers that
were circulated on the internet at the height of the conflict and contain pictures of Japanese
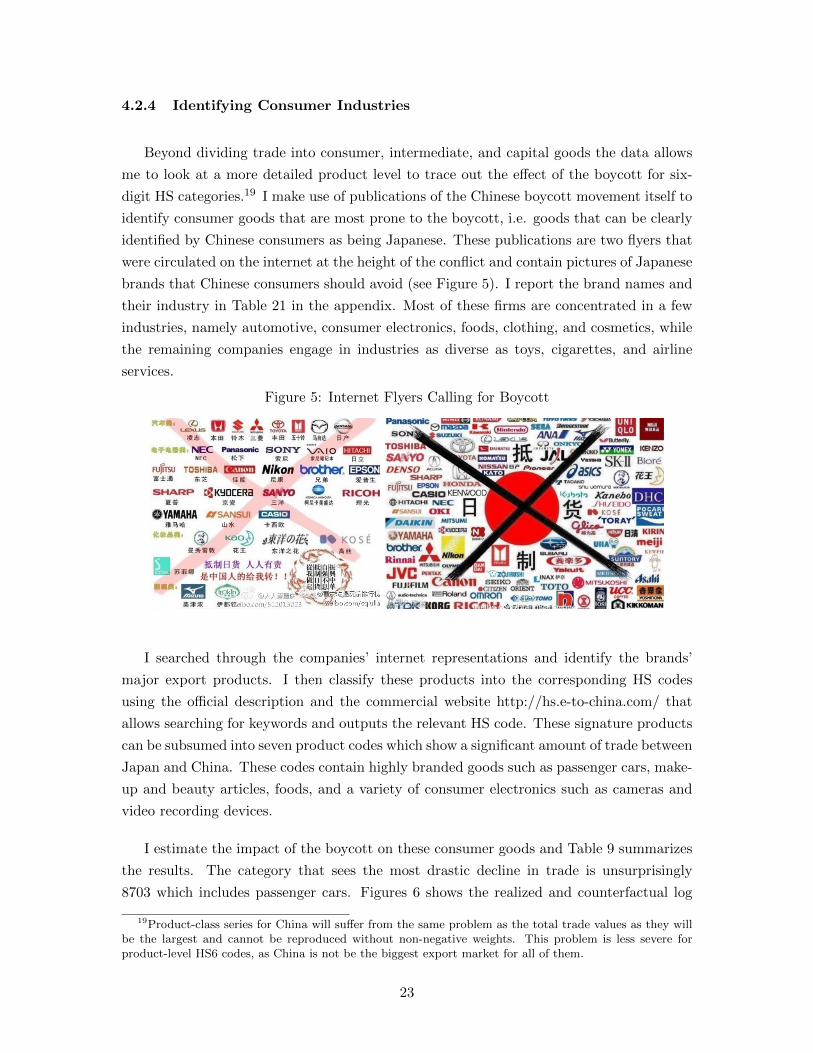
brands that Chinese consumers should avoid (see Figure 5). I report the brand names and
their industry in Table 21 in the appendix. Most of these firms are concentrated in a few
industries, namely automotive, consumer electronics, foods, clothing, and cosmetics, while
the remaining companies engage in industries as diverse as toys, cigarettes, and airline
services.
Figure 5: Internet Flyers Calling for Boycott
I searched through the companies’ internet representations and identify the brands’
major export products. I then classify these products into the corresponding HS codes
using the official description and the commercial website http://hs.e-to-china.com/ that
allows searching for keywords and outputs the relevant HS code. These signature products
can be subsumed into seven product codes which show a significant amount of trade between
Japan and China. These codes contain highly branded goods such as passenger cars, make-
up and beauty articles, foods, and a variety of consumer electronics such as cameras and
video recording devices.
I estimate the impact of the boycott on these consumer goods and Table 9 summarizes
the results. The category that sees the most drastic decline in trade is unsurprisingly
8703 which includes passenger cars. Figures 6 shows the realized and counterfactual log
19Product-class series for China will suffer from the same problem as the total trade values as they willbe the largest and cannot be reproduced without non-negative weights. This problem is less severe forproduct-level HS6 codes, as China is not be the biggest export market for all of them.
23

trade levels for Mainland China. Clearly visible is the massive drop in car imports and
although they catch up to the control group after about nine months, Japanese car exports
to China drop by a 32.3% within a single year. While the effect of the boycott is very clear
for vehicles, evidence for other product codes is not obvious. The estimated percentage
disruption in trade in highly-branded goods like beverages, beauty products, and cameras
is large, but in absolute values the estimates of a mere 12, 14, and 4 million USD for these
categories are dwarfed by the huge trade disruption of almost two billion USD for passenger
cars. The other product categories seem not to be negatively affected by the boycott.
Table 9: Estimated One Year Trade Disruption by HS Code (Synthetic Control)
HS Code Description in USD in % p-value
1902 Pasta 550,166 124.6% 0.173622 Beverages -12,884,956 -26.5% 0.26793304 Make-up -14,596,832 -7.7%∗∗ 0.02868508 Electromechanical tools 1,066,317 40.4%∗ 0.08558521 Videorecording apparatus 5,677,785 32.1% 0.96008703 Motor cars -1,888,019,883 -31.8%∗∗ 0.02959006 Still cameras -4,630,183 -26.1%∗∗ 0.0286
Notable is the lack of a negative reaction in the area of consumer electronics, even
though 34 Japanese companies in this sector were mentioned on the flyers. One explanation
could be the outsourcing of Japanese firms’ production to China. As it is well known,
China is the “world’s workshop” and produces consumer electronics under foreign brands
(Feenstra and Wei, 2009). If this is true, even though sales of Japanese-branded products
in China might decline, this will not show up in the trade data as these products are
manufactured in China.
4.2.5 Event Study
Even though a boycott does not appear in the trade data, it should affect companies’
profits and thus be reflected in their stock prices. Following Govella and Newland (2010),
I implement an event study for different incidents with daily market prices of 23 boycotted
firms and 12 domestic control firms using the market model with the Nikkei225 index as
the market proxy (MacKinley 1997).20
20The events include the announcement of the nationalization of the islands by the Japanese governmenton 11 September 2012 that most likely caused the boycott. I also use the onset of the actual protests onSeptember 17 as the beginning of the event period. In addition, I analyze the effect of the protests in frontof the Japanese embassy in Beijing on 15 August and a protest call by Chinese internet users on 20 August.The control countries are taken from “Japan’s Best Domestic Brands 2012”, published by Interbrand (2012),and have less than 10% foreign sales each. Most of these firms are engaged in non-traded services likebroadband telecommunication, construction, and real estate.
24

Figure 6: Realized and Counterfactual Japanese Exports (HS8703 Motor Cars)
−40 −30 −20 −10 0 10 2018
18.5
19
19.5
20
20.5
21
Months since Boycott
Log
Japa
nese
Car
Exp
orts
Boycott
Realized ChinaSynthetic China
Tohoko Earthquare
The event study results indicate that none of the events mentioned above had a sta-
tistically significant effect on the Japanese firms who were mentioned in the boycott calls.
Neither the start of the protests on August 20 nor the nationalization of the Senkaku Is-
lands, which is believed to be the main cause of the boycott, do affect stock market prices
significantly. This surprising results is most likely due to the fact that the treatment coun-
tries make up a big share of the market index. Plotting the cumulative abnormal returns in
Figure 10 in the appendix for both the treatment and control country and the market re-
turn shows that abnormal returns do not deviate much from zero until about seven trading
days after the boycott announcement, when both groups start to diverge. This coincides
with negative returns of the market index which tracks the treatment group pretty well.
The cumulative abnormal returns however start to converge again after 20 trading days
and eventually are close to zero. This suggests that the boycott did have a lagged effect
not only on the stock prices of Japanese firms mentioned in the boycott flyers but also on
the whole market index. This effect however is temporary and dies out after about one
month.
4.3 US-French Boycott
Data for the trade boycott that resulted from the Iraq War are taken from the US
Census Bureau’s Foreign Trade database that provides SITC-denoted import and export
data at monthly frequency. US-French trade relations are unbalanced: While France’s
25

share of US imports and exports amounts to only 2.4% and 2.8%, US shares of France’s
trade is much higher with 8% of imports and 8.1% of exports as measured in 2002.
For the French case, I estimate equation (1) for both US imports and exports. I set the
treatment timing to February 2003, the time when public opinion polls detected a sharp fall
in positive views of France in America. I exclude Middle Eastern states from the control
group to avoid contamination as there is mild evidence that some of these countries might
have involved in a boycott of US product over the Iraq War (Clerides et al 2013). The
results show that imports from France fell by almost 20% in the post-treatment period, a
result that is robust to the inclusion of country fixed effects. The effect is slightly smaller
for exports to France, which fell by about 16% indicating that the Iraq conflict did not
merely lead to an unilateral boycott, but that it seriously hurt trade relations in both
directions.
Table 10: Freedom Fries: Results
Dependent Variable US Imports from France US Exports to France(1) (2) (3) (4)
log GDP 0.847∗∗∗ 0.748∗∗∗ 0.866∗∗∗ 0.794∗∗∗
(0.043) (0.192) (0.040) (0.075)
log Distance -0.545∗∗ -1.284∗∗∗
(0.218) (0.203)
Post -0.106∗∗∗ -0.078∗ -0.073 -0.060(0.037) (0.040) (0.045) (0.045)
France -0.314 -0.366∗∗
(0.198) (0.172)
Post × France -0.197∗∗∗ -0.225∗∗∗ -0.164∗∗∗ -0.177∗∗∗
(0.053) (0.048) (0.027) (0.023)
Constant 0.754 -3.142 6.802∗∗∗ -3.892∗∗∗
(1.941) (1.996) (1.688) (0.814)Country Fixed Effects No Yes No YesTrend and Month FE Yes Yes Yes YesN 10219 10219 8924 8924adj. R2 0.708 0.952 0.744 0.964
Standard errors in parentheses (clustered at country level)∗ p < 0.10, ∗∗ p < 0.05, ∗∗∗ p < 0.01
The results however are not robust in the synthetic control group specification, where
we see much higher drop in US exports to France than in imports from it. Figure 7 shows
the gap in exports to France compared to the synthetic control group21 in the year following
the boycott announcement. This sums up to a 15% trade disruption equivalent to 3.020
21Notable is the high weight of Germany in the synthetic control group (Table20.) The inclusion ofGermany is somewhat questionable since the country itself was a major opponent of the Iraq War. However,Pandya and Venkatesan (2013) point out that the boycott was primarily directed against France and not
26

Table 11: Estimated Trade Disruption (Synthetic Control)
US Imports Exports Turkey Imports Exports
3 Months -4.3% -9.1% 3 Months 14.5% -10.5%(0.0399) (0.0052) (0.0550) (0.0774)
12 Months -1.7% -15.0% 6 Months 11.1% -12.3%(0.3242) (0.0001) (0.6285) (0.0000)
24 Months -2.8% -8.9%(0.2190) (0.0021)
p-values in parentheses.
billion USD, a share of 0.4% of all US exports during that time. The reduction in imports
instead is short-term and amounts to only 4.3% within the first three months. The one-
year estimate of -2.8% (or 493 million USD) is not statistically significant. This suggests
that the consumer boycott in the US was only a temporary shocks to imports, but that
it severely harmed exports through other channels. The possibilities include a consumer
boycott in France or governmental intervention. That the US administration is willing to
use commerce to punish can be seen by the policy to exclude French and other nations’
firms from reconstruction contracts in Iraq.22
Figure 7: Realized and Counterfactual Trade Levels (US)
−60 −40 −20 0 20 40 607.4
7.5
7.6
7.7
7.8
7.9
8
8.1
8.2
8.3
8.4
Boycott
Months since Boycott
Log
Impo
rts
US Imports
Realized FranceSynthetic France
−60 −40 −20 0 20 40 607
7.1
7.2
7.3
7.4
7.5
7.6
7.7
7.8
7.9
8
Boycott
Months since Boycott
Log
Exp
orts
US Exports
Realized FranceSynthetic France
against all the European countries that did not support the US in invading Iraq. In calculations not shownI find a similar effect if Germany is excluded from the controls.
22http://www.nytimes.com/2003/12/10/world/a-region-inflamed-the-reconstruction-pentagon-bars-three-nations-from-iraq-bids.html
27

4.4 Gaza
I use data for Turkish imports and exports from Comtrade Monthly with availability
until January 2015. In 2013, Israel only made up a small share of Turkish trade with 1%
of imports and 1.7% of exports. Turkey had a higher share with 3.3% and 3.8% of Israeli
imports and exports respectively.
The difference-in-differences results for the Gaza boycott in table 12 show a surprising
uptick in Turkish imports from Israel that is robust to the inclusion of fixed effects. The
synthetic control group approach confirms the positive effect, although statistical signifi-
cance holds only for the short period of the first three months after the Gaza war. Figure8
shows imports well above the synthetic control group until the very last period of available
data when imports drop sharply. In summary, the is no evidence of any reduction of Turk-
ish imports from Israel due to the crisis for a horizon of at least half a year and only future
availability of data will be able to draw a conclusion. Instead, we observe a pronounced
drop in exports to Israel of around 7.5% in the post-treatment period and the synthetic
control group confirms the strongly significant effect. Israeli consumers appear to be more
efficient at carrying out boycotts which again is confirmed by the synthetic control group
approach.
Table 12: Gaza: Results
Turkish Imports Turkish Exports(1) (2) (3) (4)
log Distance -0.198 -0.436∗∗∗
(0.152) (0.119)
Post -0.106∗∗∗ -0.105∗∗∗ -0.114∗∗∗ -0.114∗∗∗
(0.0346) (0.0351) (0.0274) (0.0276)
Israel 0.599∗∗∗ 1.387∗∗∗
(0.189) (0.129)
Post × Israel 0.221∗∗∗ 0.218∗∗∗ -0.0751∗∗∗ -0.0751∗∗∗
(0.0394) (0.0415) (0.0248) (0.0250)
Constant 17.02∗∗∗ 15.46∗∗∗ 15.76∗∗∗ 12.33∗∗∗
(1.487) (0.793) (1.165) (0.573)N 3717 3717 3904 3904adj. R2 0.025 0.879 0.178 0.926
Standard errors in parentheses (clustered at country level)∗ p < 0.10, ∗∗ p < 0.05, ∗∗∗ p < 0.01
28

Figure 8: Realized and Counterfactual Trade Levels (Turkey)
−50 −40 −30 −20 −10 0 1018
18.2
18.4
18.6
18.8
19
19.2
19.4
19.6
19.8
Boycott
Months since Boycott
Log
Impo
rts
Turkish Imports
Realized IsraelSynthetic Israel
−50 −40 −30 −20 −10 0 1018.6
18.7
18.8
18.9
19
19.1
19.2
19.3
19.4
19.5
Boycott
Months since BoycottLo
g E
xpor
ts
Turkish Exports
Realized IsraelSynthetic Israel
5 Conclusion
The analysis of the case studies has shown that boycotts can have a significant effect
on trade relations, and that political conflict has sizable spillovers to international trade.
There is no such thing as a typical reaction to a boycott, but the impact on trade is very
heterogeneous. Estimates of trade reductions in the range of 30% and 40% show that some
countries are very willing to carry out boycotts. However there are also many countries that
do not seem to boycott or even increase their trade with the boycotted country. Comparing
the results of the Danish-Muslim and the Japanese-Chinese boycotts, the similarities are
that they both cause one-time reductions in trade, reverting to previous levels after several
months. The boycotts are also impacting consumer goods much more than non-consumer
goods and countries with more open political regimes tend to boycott more. Both findings
are in line with the theory of boycotts being mainly consumer-driven with no or very
moderate official government assistance. This suggests that agents do take the economic
consequences of disrupting trade into account when choosing their conflict strategy, as
boycotting consumer goods is plausibly less costly to the boycotter than stopping the
import of intermediate and capital goods.
While the boycotts of Denmark and Japan appear to be one-directional with Danish
and Japanese imports from the boycotting countries being mostly stable, the US-French
dispute in 2003 and the Turkish-Israeli conflict in 2014 seem to have bilateral effects on
both imports and exports. This is indicative that the consumers in the boycotted country
29

retaliate against the perceived aggression and the results suggests that the impact of this
reverse boycott can be even larger than the initial boycott, especially in the case of Israel.
The US-French boycott nevertheless confirms the transient nature of the boycotts, while
the poor data availability for the very recent boycott of Turkey prevents a clear conclusion
on the nature of this event.
The boycotted countries in this analysis, Denmark, Japan, US, and Israel happen to be
well-diversified export economies. In the case of Denmark, the Muslim countries that are
prone to boycotting made up only a fraction of 2.6% of total exports. This a priori limits
the total impact of boycotts on the boycotted country’s export sector, so that even though
the trade disruption was large for some boycotting countries, overall exports declined by
only 0.4% in the case of Denmark. Very similar numbers hold true for the US where
France’s export share is 2.6% and the overall trade disruption is also 0.4%. The opposite
is the case for Japan, where the boycotting country, China, makes up almost one fifth
of total exports. The rather low estimate for the boycott effect however causes the total
trade disruption to be only 0.5%. One explanation for this rather small estimate is that
trade from Japan to China is still dominated by intermediate and capital goods. This
suggests that for exporting countries that have a diverse range of destinations and export
goods, the intended punishment effect of a boycott is likely not very effective, though a
boycott could be potentially more harmful to more specialized countries. The inability of
the empirical approach to account for substitution effects towards non-boycotting countries
is likely further strengthening this argument.
This conclusion is not necessarily true for firms within the boycotted country. While
the overall disruption of exports for both Denmark and Japan is low, some firms might
have suffered heavily. The event study approach on individual firms’ stock market prices,
however, shows that explicitly boycotted Japanese firms did experience large negative ab-
normal returns compared to domestic firms during the boycott, but that these relative
losses are reverted within a few weeks’ time. It is likely that these large companies serve
widely diversified markets with different products, so that a boycott by a single country is
not overly damaging.
6 Acknowledgements
I would like to thank Gordon Hanson, Marc Muendler, Eli Berman, Lawrence Broz,
Gordon McCord, Xinyi Zhang, Sieuwerd Gaastra, Koji Takahashi, Matthew Goldman, and
participants of the UCSD Third Year Paper sequence for helpful comments.
30

7 References
Abadie, Alberto, Alexis Diamond, and Jens Hainmueller (2010): Synthetic Control
Methods for Comparative Case Studies. Estimating the Effect of California’s Tobacco
Control Program, Journal of the American Statistical Association 105 (490), 493-505.
Abadie, Alberto, Alexis Diamond, and Jens Hainmueller (2014): Comparative Politics
and the Synthetic Control Method, American Journal of Political Science, Forthcoming.
Abadie, Alberto and Javier Gardeazabal (2003): The Economic Costs of Conflict. A
Case Study of the Basque Country, American Economic Review 93 (1), 113-132.
Barbieri, Katherine (2002): The Liberal Illusion. Does Trade Promote Peace? Ann
Arbor: University of Michigan Press.
Broda, Christian and David. E. Weinstein (2006): Globalization and the Gains from
Variety, Quarterly Journal of Economics 121 (2), 541-585.
Chavis, L. and P. Leslie (2009): Consumer Boycotts. The Impact of the Iraq War on
French Wine Sales in the U.S., Quantitative Marketing & Economics 7 (1), 37-67.
Clerides, Sofronis, Peter Davis, and Antonis Michis (2013): National Sentiment and
Consumer Choice. The Iraq War and Sales of US Products in Arab Countries, Rimini
Centre for Economic Analysis Working Paper Series 41/13.
Davis, Christina L. and Sophie Meunier (2011): Business as Usual? Economic Re-
sponses to Political Tensions, American Journal of Political Science 55 (3), 628-646.
Feenstra, Robert C. and Shang-Jin Wei (2009): Introduction to China’s Growing Role
in World Trade, NBER Working Paper 14716.
Fisman, Raymond, Yasushi Hamao, and Yongxiang Wang (2014): Nationalism and
Economic Exchange: Evidence from Shocks to Sino-Japanese Relations, NBER Working
Paper 20089.
Friedman, Monroe (1999): Consumer Boycotts. Effecting Change Through the Mar-
ketplace and the Media. New York, N.Y.: Routledge Publisher.
Fuchs, Andreas and Nils-Hendrik Klann (2013): Paying a Visit. The Dalai Lama Effect
on International Trade, Journal of International Economics 91 (1), 164-177.
Gartzke, Erik, Quan Li, and Charles Boehmer (2001): Investing in the Peace. Economic
Interdependence and International Conflict, International Organization 55 (2), 391-438.
31
Govella, Kristi and Sara Newland (2010): Hot Economics, Cold Politics? Reexamining
Economic Linkages and Political Tensions in Sino-Japanese Relations, APSA 2010 Annual
Meeting Paper.
Interbrand (2012): Japan’s Best Global Brands,
http://www.interbrandjapan-seminar.info, retrieved 2 February 2014.
Jensen, Hans Rask (2008): The Muhammed Cartoons Controversy and the Boycott of
Danish Products in the Middle East, European Business Review 20 (3), 275-289.
John, Andrew and Jill Klein (2003): The Boycott Puzzle. Consumer Motivations for
Purchase Sacrifice, Management Science 49 (9), 1196-1209.
Katz, Richard (2013): Mutual Assured Production. Why Trade Will Limit Conflict
between China and Japan, Foreign Affairs 92 (2), 9–15.
Lauterpacht, Hersch (1933): Boycott in International Relations, British Yearbook of
International Law 14, 125–140.
Li, Quan and Rafael Reuveny (2011): Does Trade Prevent or Promote Interstate Con-
flict Initiation?, Journal of Peace Research 48 (4), 437-453.
MacKinley, A. Craig (1997): Event Studies in Economics and Finance, Journal of
Economic Literature 35, 13-39.
Michaels, Guy and Xiaojia Zhi (2010): Freedom Fries, American Economic Journal:
Applied Economics 2 (3), 256-81.
Pandya, Sonal and Rajkumar Venkatean (2013): French Roast. Consumer Responses to
International Conflict - Evidence from Supermarket Scanner Data, SSRN Working Paper.
Pinker, Steven (2011): The Better Angels of our Nature, New York: Viking.
Weiss, Jessica Chen (2013). Authoritarian Signaling, Mass Audiences, and Nationalist
Protest in China. International Organization, 67, 1-35.
Weiss, Jessica Chen (2014): Powerful Patriots. Nationalist Protest in China’s Foreign
Relations, Oxford University Press.
Zeile, William J. (1997): U.S. Intrafirm Trade in Goods, Survey of Current Business 77
(2), 23-38.
32

Appendix
The Synthetic Control Group Methodology
Suppose that there are J + 1 units in a balanced dataset with T observations which
consists of one treatment unit and J potential control units. Denote the number of pre-
treatment periods as T0 and the first period with the treatment in place as T0+1. Without
loss of generality, we can define the first unit to be the treated unit and specify the units
2 . . . J + 1 to be the control units. If there are more treated units, one can simply remove
them from the data and repeat the same procedure for these units.
Assume that log export values Yj,t of the boycotted country to its trading partners j
are given by the following factor model
Yj,t = δt + θtXj + λtµj + βt boycottj,t + εj,t (2)
where δt is a time trend common to all export partners, θt and λt are (1 × r) and (1 ×F ) vectors of common factors, Xj and µj are and (r × 1) and (F × 1) vectors of factor
loadings, and εj,t is an iid error term with mean zero that captures idiosyncratic shocks.
The parameters of interest are {βt}Tt=T1that measure the dynamic impact of a boycott
captured by the dummy variable boycottj,t. The difference between Xj and µj is that the
former one is known to the econometrician and includes observable trade determinants
like GDP and bilateral distance while the latter factors are unobserved and might include
variables like industry composition and consumer preferences.
The ideal experiment to estimate the impact of the boycott would be to compare the
outcome of the boycotting country to the outcome of a non-boycotting country that has the
same factor loadings Xj and µj . However, this is infeasible for two reasons: Firstly, most
likely no such unit exists and secondly, µj is unobserved. While the former problem could be
resolved by a regression-based approach, the unknown factor loadings cause the regression
to be necessarily misspecified. Instead, the synthetic control group method constructs the
counter-factual as a weighted average of the available control countries.
Denote as Y Ij,t the counterfactual log value of the exports in case the boycott had not
happened. For all the countries in the control group, I assume that Y Ij,t = Yj,t for j = 2 . . . J
and all periods t = 1 . . . T . This implicitly assumes that there are no substitutions of exports
from boycott to non-boycott countries and is not realistic. If these substitutions happen,
the control group will be affected positively and the treatment effect will be upward biased.
However, the estimated treatment effect can still be interpreted as an upper bound of the
true causal effect of the boycott on exports. The goal is to construct the counterfactual
33

export levels for the boycott country so that we can obtain the estimator βt = Y1,t − Y I1,t
for the treatment effect at time t.
A synthetic control group is defined by a set of J weights wj for j = 2 . . . J + 1 that
determine a weighted average of the control units. The ideal synthetic control group would
match both the factors X and µ of the treatment unit, yet this is impossible since µ is
unobserved. However, Abadie et al. (2010) show that under mild regularity conditions, the
synthetic control group can only match µ if it also matches a long period of pre-treatment
outcome variables Yj,t. This motivates to choose the weights to minimize both the deviation
in the known characteristics X as well as the pre-treatment outcomes Yj,t.
Assume that there exist weights w∗j with∑J+1
j=2 w∗j = 1 and 0 < w∗j < 1 ∀ j = 2 . . . J +1
such that
J+1∑j=2
w∗jXj = X1 (3)
J+1∑j=2
w∗jYj,t = Y1,t ∀ t = 1 . . . T0, (4)
that is the synthetic control group resembles both the pre-treatment outcomes as well as
the known explanatory variables of the treatment unit perfectly. The restrictions on w∗jensure that no extrapolation outside the support of the data takes place.23
The model in (2) implies that for the synthetic control group it holds that
J+1∑j=2
w∗jYj,t = δt + θt
J+1∑j=2
w∗jXj + λt
J+1∑j=2
w∗jµj +J+1∑j=2
w∗j εj,t
and that the difference between the actual treatment unit and the synthetic control
group in the pre-treatment period t = 1 . . . T0 is
Y1,t −J+1∑j=2
w∗jYj,t︸ ︷︷ ︸= 0
= θt
X1 −J+1∑j=2
w∗jXj
︸ ︷︷ ︸
= 0
+λt
µ1 − J+1∑j=2
w∗jµj
+J+1∑j=2
w∗j (ε1,t − εj,t)
Rearranging, summing over all pre-treatment periods, and dividing by T0 yields
23This is the crucial difference to a regression-based construction of the counterfactual. Abadie et al.(2014) show that a regression-based counterfactual can be interpreted as a weighted average of the controlswith weights that also sum up to one, but allow for negative values or values larger than one.
34

µ1 − J+1∑j=2
w∗jµj
1
T0
T0∑t=1
λt = −J+1∑j=2
w∗j1
T0
T0∑t=1
(ε1,t − εj,t)
Note that as the number of pre-treatment periods T0 becomes large, the right hand side
of the equation goes to zero. As long as 1T
∑Tt=1 λt 6= 0 (that is the average effect of the
unobserved factors is not equal to zero over time), this implies that the difference in the
unobserved characteristics goes to zero as well.
This suggests to use∑J+1
j=2 w∗jYj,t as the counter-factual and subsequently calculate the
treatment effect as
βt = Y1,t −J+1∑j=2
w∗jYj,t ∀ t > T0
In practice however, one will not be able to find weights such that equations (3) and (4)
hold exactly. This is the case if the characteristics of the treatment country are not in the
convex hull of the characteristics of the control countries and thus cannot be replicated with
the restrictions on wj . In this case the weights are chosen such that the equations hold
approximately. Formally, define Zj = (Yj,1, Yj,2 . . . Yj,T0 , X′j)′ as the column vector that
stacks all export values for the pre-treatment period 1 . . . T0 and the known characteristics
of country j. Similarly, define the matrix ZC = [Z2 Z3 . . . ZJ+1] that collects these column
vectors for all the potential control countries.
The (J × 1) vector W ∗ is then the solution to the following minimization problem
W ∗ = arg minW
‖Z1 − ZCW‖ = arg minW
√(Z1 − ZCW )′ V (Z1 − ZCW ) (5)
for a given weighting matrix V . The choice of V allows to assign different importance to the
explanatory variables or specific pre-treatment outcomes. In order to reduce the deviation
between treatment and synthetic control group, the factors with the largest predictive
power should be given the highest relative weights.
If the number of pre-treatment periods T0 is small and the number of potential controls
J is large, the characteristics of the treatment unit will be mechanically replicated by a
combination of the control units. To circumvent this problem of overfitting, Abadie et
al. (2014) suggest restricting the pool of potential controls to countries that have similar
characteristics as the treatment country to break the spurious fit. Restricting the controls
to units that are “close” in terms of the characteristics also helps to reduce potential
interpolation bias.
35

Table 13: Composition of Synthetic Control Group I
Saudi Arabia UAE Turkey
Antigua and Barbuda 0.024 Antigua & Barbuda 0.012 Cape Verde 0.018Armenia 0.019 Finland 0.124 Croatia 0.09Congo, Republic 0.011 Iceland 0.029 Luxembourg 0.003Dominican Republic 0.039 Kenya 0.087 Moldova 0.044Greece 0.011 Croatia 0.163 Mongolia 0.033Haiti 0.001 Macao 0.007 Switzerland 0.01Ireland 0.104 Malta 0.045 Slovakia 0.011Jamaica 0.029 Mongolia 0.004 Slovenia 0.204Cape Verde 0.032 Nepal 0.001 Sweden 0.289Croatia 0.051 Thailand 0.142 Ukraine 0.251Moldova 0.029 Trinidad & Tobago 0.002 Hungary 0.045Nepal 0.025 Ukraine 0.084 Austria 0.003Norway 0.392 Zimbabwe 0.007Slovakia 0.058 Austria 0.292Sri Lanka 0.018Sweden 0.061Trinidad & Tobago 0.01Ukraine 0.043Venezuela 0.032Austria 0.012
Correlation 0.619 0.429 0.637
Correlation is the correlation coefficient between treatment and synthetic control group in the
pre-treatment period.
36

Figure 9: Treatment Effects of Placebo Treatment Times
−35 −30 −25 −20 −15 −10 −5 0 5−5
0
5x 10
5 Saudi Arabia
−35 −30 −25 −20 −15 −10 −5 0 5−2
−1
0
1
2
3
4x 10
5 Turkey
−35 −30 −25 −20 −15 −10 −5 0 5−2
−1
0
1
2x 10
5 United Arab Emirates
Cumulative estimated trade disruption in thousand DKK over 6 months for placebo treatment assignmentsfor the actual treatment (normalized to zero) and the 29 months prior to the actual treatment. The dashedline marks estimates for periods that include at least one actual treatment month.
37
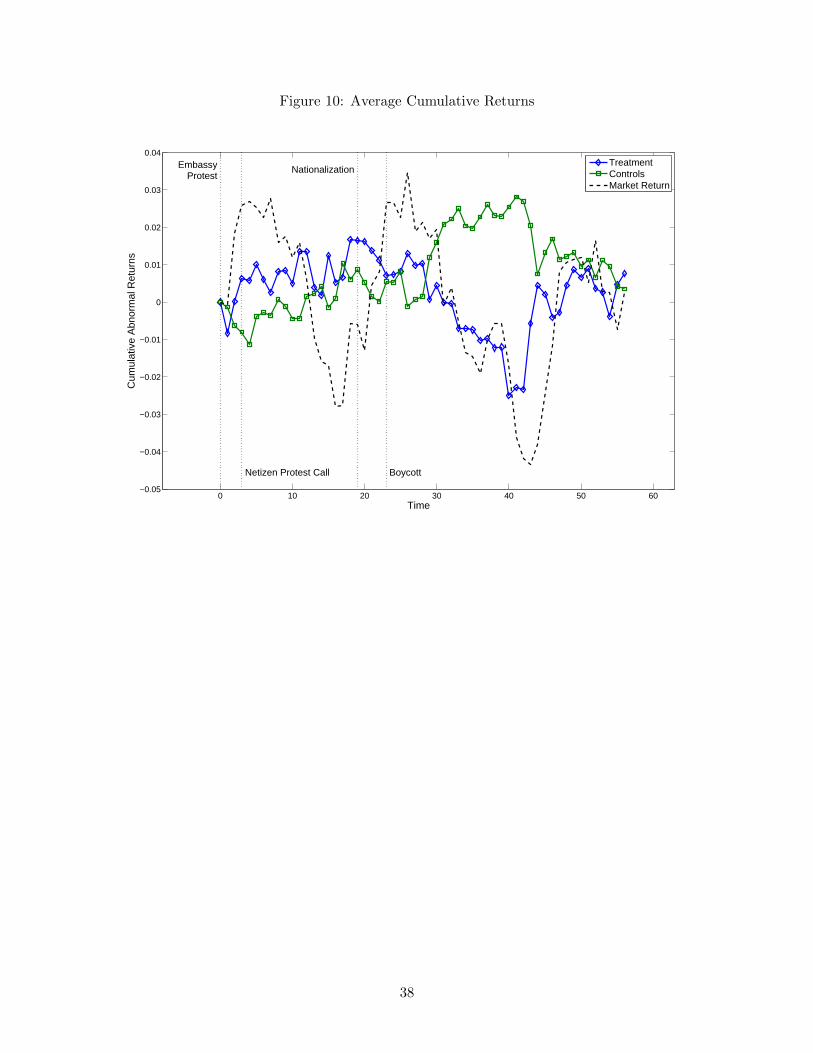
Figure 10: Average Cumulative Returns
0 10 20 30 40 50 60−0.05
−0.04
−0.03
−0.02
−0.01
0
0.01
0.02
0.03
0.04
Time
Cum
ulat
ive
Abn
orm
al R
etur
ns
Embassy Protest
Netizen Protest Call
Nationalization
Boycott
TreatmentControlsMarket Return
38

Table 14: Treatment and Control Countries (Muhammad Boycott)
Country and Share of Muslim Population
Treatment Countries N = 34
Afghanistan 99.8% Jordan 98.8% Saudi Arabia 97.1%Albania 82.1% Kuwait 86.4% Senegal 95.9%Algeria 98.2% Kyrgyzstan 88.8% Syria 92.8%Azerbaijan 98.4% Libya 96.6% Tajikistan 99.0%Bahrain 81.2% Maldives 98.4% Tunesia 99.8%Bangladesh 90.4% Mali 92.4% Turkey 98.6%Djibouti 97.0% Mauritania 99.2% Turkmenistan 93.3%Egypt 94.7% Morocco 99.9% United Arab Emirates 76.0%Gambia 95.3% Niger 98.3% Uzbekistan 96.5%Guinea 84.2% Oman 87.7% Yemen 99.0%Indonesia 88.1% Pakistan 96.4%Iran 99.6% Qatar 77.5%
Control Countries N = 100
Angola 1.0% France 7.5% Norway 3.0%Antigua & Barbuda 0.6% Gabon 9.7% Palau 0.0%Argentina 2.5% Germany 5.0% Panama 0.7%Armenia 0.0% Greece 4.7% P. New Guinea 0.0%Australia 1.9% Grenada 0.3% Paraguay 0.0%Austria 5.7% Guatemala 0.0% Peru 0.0%Barbados 0.9% Guyana 7.2% Philippines 5.1%Belarus 0.2% Haiti 0.0% Poland 0.1%Belgium 6.0% Honduras 0.1% Portugal 0.6%Belize 0.1% Hong Kong 1.3% Rwanda 1.8%Bhutan 1.0% Hungary 0.3% Samoa 0.0%Bolivia 0.0% Iceland 0.1% Slovakia 0.1%Botswana 0.4% Ireland 0.9% Slovenia 2.4%Brazil 0.1% Italy 2.6% South Africa 1.5%Burundi 2.2% Jamaica 0.0% South Korea 0.2%Cambodia 1.6% Japan 0.1% Spain 2.3%Canada 2.8% Kenya 7.0% Sri Lanka 8.5%Cape Verde 0.1% Laos 0.0% Swaziland 0.2%Central African Rep. 8.9% Latvia 0.1% Sweden 4.9%Chile 0.0% Lesotho 0.0% Switzerland 5.7%China 1.8% Lithuania 0.1% Thailand 5.8%Colombia 0.0% Luxembourg 2.3% Tonga 0.0%Congo, Republic 1.4% Macao 0.0% Trinidad & Tobago 5.8%Costa Rica 0.0% Madagascar 1.1% USA 0.8%Croatia 1.3% Malta 0.3% Ukraine 0.9%Czech Republic 0.0% Marshall Islands 0.0% United Kingdom 4.6%Dominica 0.2% Mexico 0.1% Uruguay 0.0%Dominican Republic 0.0% Moldova 0.4% Vanuatu 0.0%Ecuador 0.0% Mongolia 4.4% Venezuela 0.3%El Salvador 0.0% Namibia 0.4% Vietnam 0.2%Equatorial Guinea 4.1% Nepal 4.2% Zambia 0.4%Estonia 0.1% Netherlands 5.5% Zimbabwe 0.9%Fiji 6.3% New Zealand 0.9%Finland 0.8% Nicaragua 0.0%
Muslim Population as Percent of Total Population. Source: PEW Center
39

Table 15: Top Danish Export Partners and Import Shares
Rank Country Share of Freedom Polity IVDanish Exports Total Imports of Press Score
1 Germany 18.197% 0.81% 84.3 102 Sweden 13.207% 4.60% 90.3 103 United Kingdom 8.996% 0.57% 81.5 104 USA 5.998% 0.13% 83.6 105 Norway 5.745% 3.67% 90.5 10
26 Saudi Arabia 0.487% 0.40% 18 -1031 Turkey 0.426% 0.18% 47.8 733 UAE 0.325% 0.12% 28.8 -835 Iran 0.290% 0.26% 18.2 -645 Egypt 0.164% 0.22% 33.1 -348 Kuwait 0.121% 0.28% 45.5 -751 Indonesia 0.106% 0.08% 61.9 854 Algeria 0.101% 0.22% 36.5 257 Pakistan 0.074% 0.12% 39.4 -558 Morocco 0.071% 0.15% 38.4 -661 Libya 0.059% n/a 6.9 -762 Jordan 0.059% 0.18% 37.7 -263 Oman 0.056% 0.27% 28.8 -866 Yemen 0.052% 0.50% 24.8 -268 Bangladesh 0.042% 0.19% 36.5 669 Syria 0.038% 0.09% 18.9 -774 Qatar 0.029% 0.11% 37 -1075 Bahrain 0.029% 0.14% 28.5 -776 Afghanistan 0.028% n/a 25.7 n/a77 Tunesia 0.027% 0.12% 19.6 -486 Senegal 0.012% 0.11% 55.6 887 Azerbaijan 0.011% 0.08% 24.5 -793 Albania 0.008% 0.16% 49.6 996 Uzbekistan 0.007% n/a 11.3 -998 Maldives 0.007% 0.17% 38 n/a
104 Gambia 0.005% 3.30% 26.8 -5114 Guinea 0.004% 0.19% 31 -1115 Kyrgyzstan 0.004% 0.05% 74.3 3116 Mali 0.004% 0.16% 75.5 7118 Djibouti 0.003% n/a 31.2 2120 Turkmenistan 0.003% n/a 5.6 -9123 Niger 0.003% 0.25% 41.7 6131 Mauritania 0.002% 0.05% 40.6 -5133 Tajikistan 0.002% n/a 23.2 -3
Average Treatment 0.078% 0.291% 34.1 -2.3Subtotal Treatment 2.660%
Share of Danish Exports: Percentage of total Danish exports absorbed by country in 2004.
Share of Total Imports: Percentage of Danish imports as share of total imports.
Polity IV: Score assessing regime type from -10 (full autocracy) to +10 (full democracy).
40
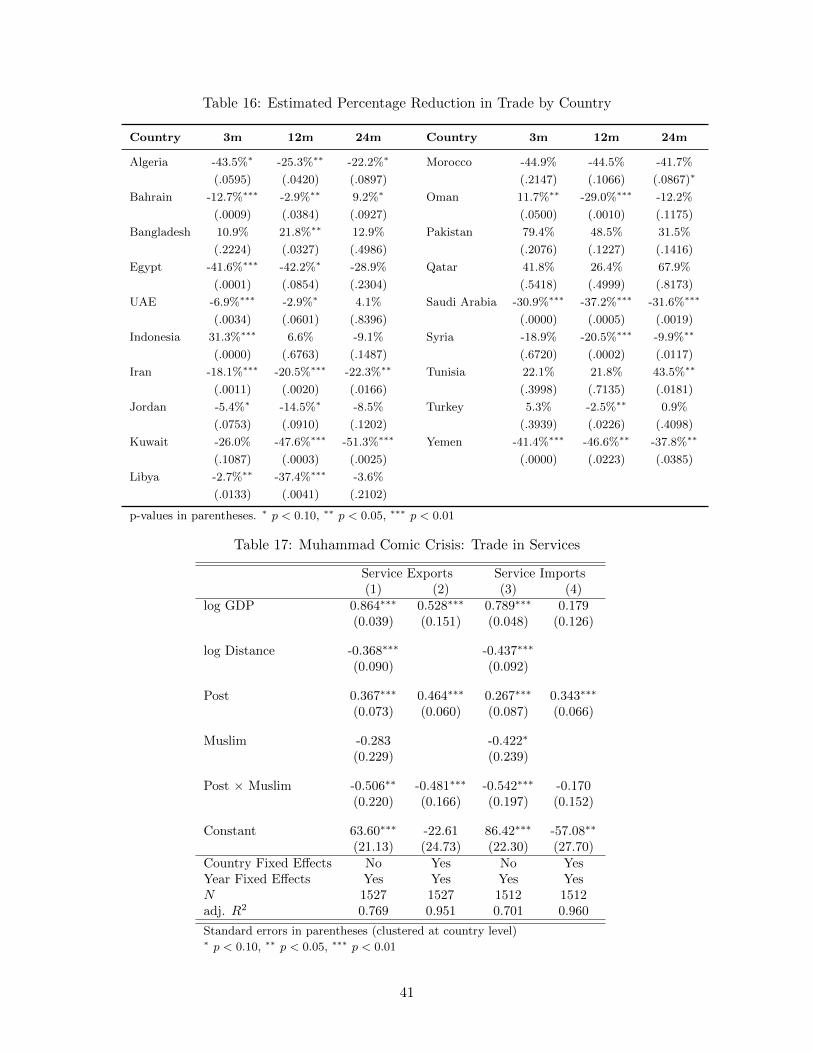
Table 16: Estimated Percentage Reduction in Trade by Country
Country 3m 12m 24m Country 3m 12m 24m
Algeria -43.5%∗ -25.3%∗∗ -22.2%∗ Morocco -44.9% -44.5% -41.7%
(.0595) (.0420) (.0897) (.2147) (.1066) (.0867)∗
Bahrain -12.7%∗∗∗ -2.9%∗∗ 9.2%∗ Oman 11.7%∗∗ -29.0%∗∗∗ -12.2%
(.0009) (.0384) (.0927) (.0500) (.0010) (.1175)
Bangladesh 10.9% 21.8%∗∗ 12.9% Pakistan 79.4% 48.5% 31.5%
(.2224) (.0327) (.4986) (.2076) (.1227) (.1416)
Egypt -41.6%∗∗∗ -42.2%∗ -28.9% Qatar 41.8% 26.4% 67.9%
(.0001) (.0854) (.2304) (.5418) (.4999) (.8173)
UAE -6.9%∗∗∗ -2.9%∗ 4.1% Saudi Arabia -30.9%∗∗∗ -37.2%∗∗∗ -31.6%∗∗∗
(.0034) (.0601) (.8396) (.0000) (.0005) (.0019)
Indonesia 31.3%∗∗∗ 6.6% -9.1% Syria -18.9% -20.5%∗∗∗ -9.9%∗∗
(.0000) (.6763) (.1487) (.6720) (.0002) (.0117)
Iran -18.1%∗∗∗ -20.5%∗∗∗ -22.3%∗∗ Tunisia 22.1% 21.8% 43.5%∗∗
(.0011) (.0020) (.0166) (.3998) (.7135) (.0181)
Jordan -5.4%∗ -14.5%∗ -8.5% Turkey 5.3% -2.5%∗∗ 0.9%
(.0753) (.0910) (.1202) (.3939) (.0226) (.4098)
Kuwait -26.0% -47.6%∗∗∗ -51.3%∗∗∗ Yemen -41.4%∗∗∗ -46.6%∗∗ -37.8%∗∗
(.1087) (.0003) (.0025) (.0000) (.0223) (.0385)
Libya -2.7%∗∗ -37.4%∗∗∗ -3.6%
(.0133) (.0041) (.2102)
p-values in parentheses. ∗ p < 0.10, ∗∗ p < 0.05, ∗∗∗ p < 0.01
Table 17: Muhammad Comic Crisis: Trade in Services
Service Exports Service Imports(1) (2) (3) (4)
log GDP 0.864∗∗∗ 0.528∗∗∗ 0.789∗∗∗ 0.179(0.039) (0.151) (0.048) (0.126)
log Distance -0.368∗∗∗ -0.437∗∗∗
(0.090) (0.092)
Post 0.367∗∗∗ 0.464∗∗∗ 0.267∗∗∗ 0.343∗∗∗
(0.073) (0.060) (0.087) (0.066)
Muslim -0.283 -0.422∗
(0.229) (0.239)
Post × Muslim -0.506∗∗ -0.481∗∗∗ -0.542∗∗∗ -0.170(0.220) (0.166) (0.197) (0.152)
Constant 63.60∗∗∗ -22.61 86.42∗∗∗ -57.08∗∗
(21.13) (24.73) (22.30) (27.70)Country Fixed Effects No Yes No YesYear Fixed Effects Yes Yes Yes YesN 1527 1527 1512 1512adj. R2 0.769 0.951 0.701 0.960
Standard errors in parentheses (clustered at country level)∗ p < 0.10, ∗∗ p < 0.05, ∗∗∗ p < 0.01
41
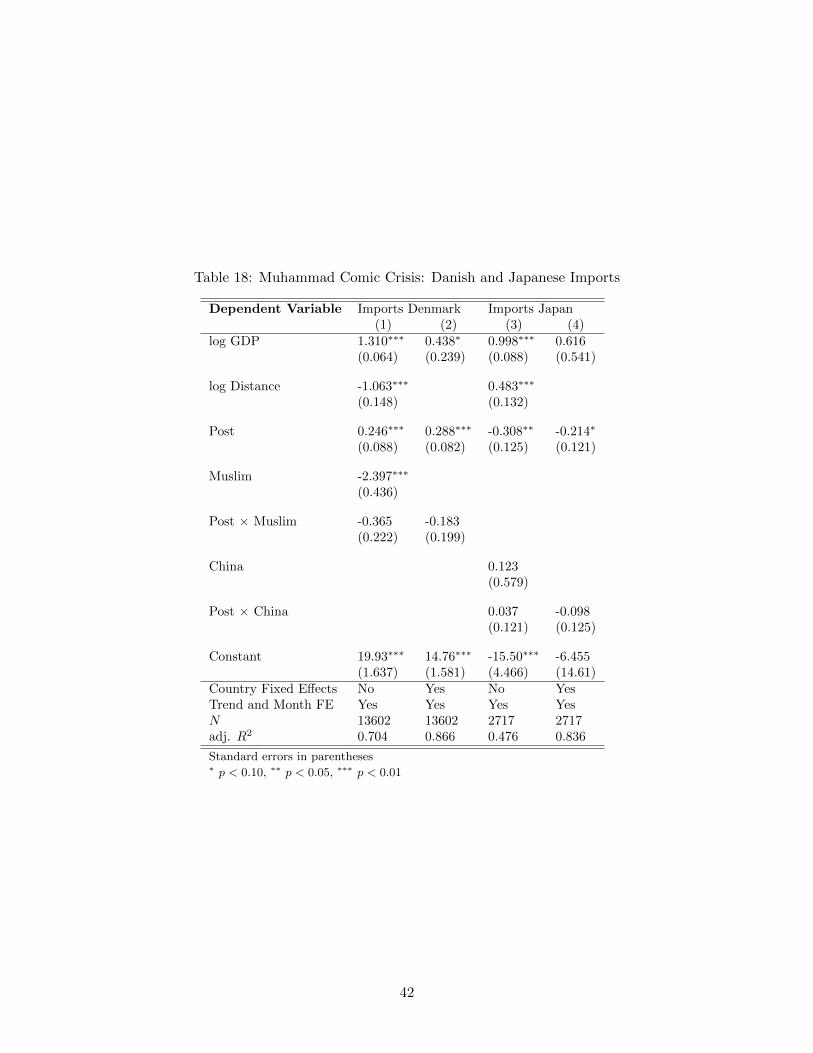
Table 18: Muhammad Comic Crisis: Danish and Japanese Imports
Dependent Variable Imports Denmark Imports Japan(1) (2) (3) (4)
log GDP 1.310∗∗∗ 0.438∗ 0.998∗∗∗ 0.616(0.064) (0.239) (0.088) (0.541)
log Distance -1.063∗∗∗ 0.483∗∗∗
(0.148) (0.132)
Post 0.246∗∗∗ 0.288∗∗∗ -0.308∗∗ -0.214∗
(0.088) (0.082) (0.125) (0.121)
Muslim -2.397∗∗∗
(0.436)
Post × Muslim -0.365 -0.183(0.222) (0.199)
China 0.123(0.579)
Post × China 0.037 -0.098(0.121) (0.125)
Constant 19.93∗∗∗ 14.76∗∗∗ -15.50∗∗∗ -6.455(1.637) (1.581) (4.466) (14.61)
Country Fixed Effects No Yes No YesTrend and Month FE Yes Yes Yes YesN 13602 13602 2717 2717adj. R2 0.704 0.866 0.476 0.836
Standard errors in parentheses∗ p < 0.10, ∗∗ p < 0.05, ∗∗∗ p < 0.01
42
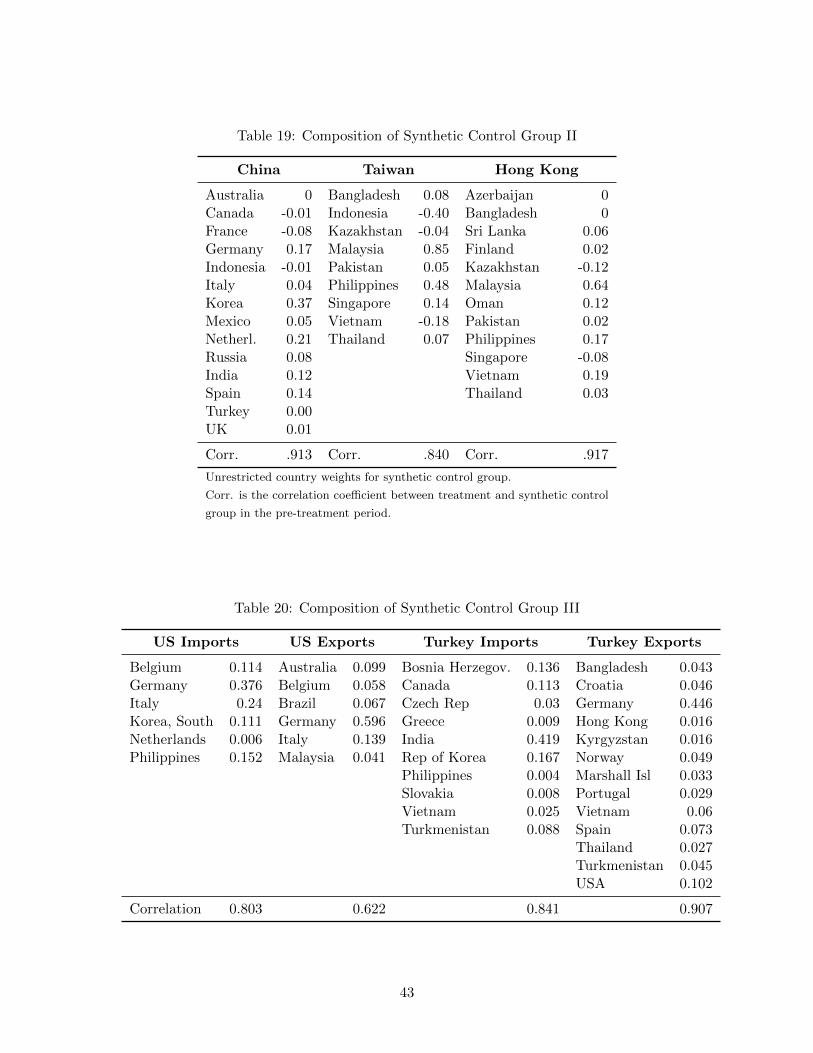
Table 19: Composition of Synthetic Control Group II
China Taiwan Hong Kong
Australia 0 Bangladesh 0.08 Azerbaijan 0Canada -0.01 Indonesia -0.40 Bangladesh 0France -0.08 Kazakhstan -0.04 Sri Lanka 0.06Germany 0.17 Malaysia 0.85 Finland 0.02Indonesia -0.01 Pakistan 0.05 Kazakhstan -0.12Italy 0.04 Philippines 0.48 Malaysia 0.64Korea 0.37 Singapore 0.14 Oman 0.12Mexico 0.05 Vietnam -0.18 Pakistan 0.02Netherl. 0.21 Thailand 0.07 Philippines 0.17Russia 0.08 Singapore -0.08India 0.12 Vietnam 0.19Spain 0.14 Thailand 0.03Turkey 0.00UK 0.01
Corr. .913 Corr. .840 Corr. .917
Unrestricted country weights for synthetic control group.
Corr. is the correlation coefficient between treatment and synthetic control
group in the pre-treatment period.
Table 20: Composition of Synthetic Control Group III
US Imports US Exports Turkey Imports Turkey Exports
Belgium 0.114 Australia 0.099 Bosnia Herzegov. 0.136 Bangladesh 0.043Germany 0.376 Belgium 0.058 Canada 0.113 Croatia 0.046Italy 0.24 Brazil 0.067 Czech Rep 0.03 Germany 0.446Korea, South 0.111 Germany 0.596 Greece 0.009 Hong Kong 0.016Netherlands 0.006 Italy 0.139 India 0.419 Kyrgyzstan 0.016Philippines 0.152 Malaysia 0.041 Rep of Korea 0.167 Norway 0.049
Philippines 0.004 Marshall Isl 0.033Slovakia 0.008 Portugal 0.029Vietnam 0.025 Vietnam 0.06Turkmenistan 0.088 Spain 0.073
Thailand 0.027Turkmenistan 0.045USA 0.102
Correlation 0.803 0.622 0.841 0.907
43
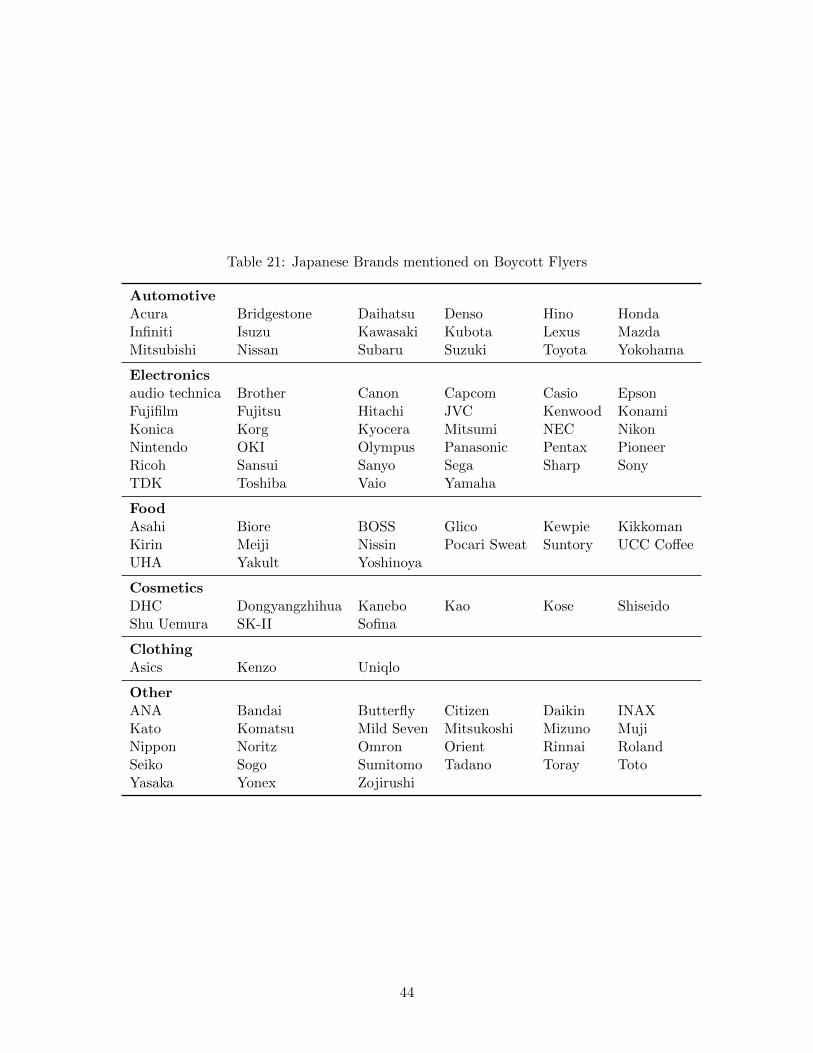
Table 21: Japanese Brands mentioned on Boycott Flyers
AutomotiveAcura Bridgestone Daihatsu Denso Hino HondaInfiniti Isuzu Kawasaki Kubota Lexus MazdaMitsubishi Nissan Subaru Suzuki Toyota Yokohama
Electronicsaudio technica Brother Canon Capcom Casio EpsonFujifilm Fujitsu Hitachi JVC Kenwood KonamiKonica Korg Kyocera Mitsumi NEC NikonNintendo OKI Olympus Panasonic Pentax PioneerRicoh Sansui Sanyo Sega Sharp SonyTDK Toshiba Vaio Yamaha
FoodAsahi Biore BOSS Glico Kewpie KikkomanKirin Meiji Nissin Pocari Sweat Suntory UCC CoffeeUHA Yakult Yoshinoya
CosmeticsDHC Dongyangzhihua Kanebo Kao Kose ShiseidoShu Uemura SK-II Sofina
ClothingAsics Kenzo Uniqlo
OtherANA Bandai Butterfly Citizen Daikin INAXKato Komatsu Mild Seven Mitsukoshi Mizuno MujiNippon Noritz Omron Orient Rinnai RolandSeiko Sogo Sumitomo Tadano Toray TotoYasaka Yonex Zojirushi
44