the eac-comesa-sadc tripartite free trade area: …
TRANSCRIPT

THE EAC-COMESA-SADC TRIPARTITE FREE TRADE AREA: IMPACT ON RWANDA 'S EXPORTS
Rwigema, P. C.
Page: - 1039 - The Strategic Journal of Business & Change Management. ISSN 2312-9492 (Online) 2414-8970 (Print). www.strategicjournals.com
Vol. 8, Iss. 2, pp 1039 – 1085. September 26, 2021. www.strategicjournals.com, ©Strategic Journals
THE EAC-COMESA-SADC TRIPARTITE FREE TRADE AREA: IMPACT ON RWANDA 'S EXPORTS
Rwigema, P, C.
Doctor, Member of East African Legislative Assembly (EALA), Rwanda
Accepted: September 23, 2021
ABSTRACT
Intra-African trade, which has remained under 12 per cent in the last decade, is low compared to other major
regions of the world. In January 2012, the African Union (AU) Summit of African Heads of State and
Government endorsed the theme of “Boosting Intra-African trade” and called on Member States, Regional
Economic Communities (RECs) and the AU Commission to promote industrial development with a view to
diversify economies and moving away from heavy reliance on traditional primary commodities for export.
Using disaggregate export and import statistics Harmonized System at the 6-digit level from BACI and
COMTRADE data sets between 1998 and 2009, measures of export diversification (using Harfindahl-Hirshman
Index) and intra-industry trade (using Grubel-Lloyd Index) are computed for Rwanda which is available from
National Institute of Statistics. The paper also reviewed the works of other researchers on the impact of trade
impacts on export performance in Rwanda. Secondary data was used for purposes of qualitative research. On
the other hand, the researcher used ex-ante descriptive tools to review Rwanda’s export situation and from
there drew conclusions on the potential of the Rwanda’s export performance with data coming from EAC,
COMESA, SADC and FTA and other data sources for purposes of quantitative analysis.Preliminary results
indicated that while both export diversification and intra-industry trade in Africa are generally low, there are
exception cases. In addition, a positive correlation between export diversification and intra-industry trade is
found for the sample of African countries. This has implication for policy dialogue suggesting that any future
trade policy designed to favor export diversification has positive implications for intra-industry trade and vice
versa. Other findings from the technical work provided two important contributions to the direction of
current trade policy dialogue on boosting Intra-African trade. First, export diversification and intra-industry
trade policies should not be treated in isolation. Second, we identified constraints towards export
diversification and intra-industry trade in Africa crucial towards better understanding and subsequently
developing effective program of actions for boosting Intra-African trade. Rwanda's economic performance in
the near future depends very much on the strategic investment programmes to improve its infrastructure, the
global demand for its exports, and the improved business climate and its effects on promoting private
investment. In order for Rwanda to overcome infrastructure bottlenecks and other supply-side constraints,
investment is needed in, inter alia, broadening access to electricity for the population by increasing
household grid-connectivity; the railway line to facilitate Rwanda's import/export trade; the construction of
an international airport in Bugesera; and in irrigation systems to promote agricultural productivity.

Page: - 1040 - The Strategic Journal of Business & Change Management. ISSN 2312-9492 (Online) 2414-8970 (Print). www.strategicjournals.com
How can Rwanda, which currently has one of the lowest levels of income and exports per capita in the world,
grow and diversify its economy in presence of significant constraints? Three basic commodities – coffee, tea,
and tin – made up more than 80 percent of the country’s exports through its history and still drive the bulk of
export growth today. Given Rwanda’s high population density and associated land scarcity, these traditional
exports cannot create enough jobs for its growing population, or sustainably drive future growth. Rwanda
needs new, scalable activities in urban areas. In this report, we identify a strategy for greater diversification
of exports in Rwanda that circumvents the key constraints and is separately tailored for regional and global
export destinations. Our results identified more than 100 tradable products that lie at Rwanda’s knowledge
frontier, are not intensive in Rwanda’s scarce resources, and economize on transportation costs. Our analysis
produces a vision of a more diversified Rwanda, which can be used as a guide for investment promotion
decisions. Based on the reviews and analyses, it was found that the impact of the Tripartite on Rwanda
export performance maybe small with regards to export performance. However, Rwanda stood to benefit
greatly from the tripartite by bringing transparency in the regional trade regime and harmonization of
policies. This will eventually bring about predictability in Rwanda trade agenda and help reduce trade costs.
Lastly, the study drew conclusions and offers policy recommendations on future measures to be taken with
the view of ensuring that Rwanda gains from the Tripartite. Given the heterogeneity of the effect of FTAs
across regions in Africa, it is important to structure negotiations to be region-specific to avoid the policy
overlaps of existing trade agreements within regions.
Keywords: Rwanda, Tripartite Free Trade Area, Free Trade Agreements; International Trade, Africa, COMESA
and Export performance
CITATION: Rwigema, P, C. (2021). The EAC-COMESA-SADC tripartite free trade area: Impact on Rwanda's
exports. The Strategic Journal of Business & Change Management, 8 (2), 1039 – 1085.
INTRODUCTION
On 22 October 2008, Heads of State and
Government of COMESA, EAC and SADC Member
countries met in Kampala, Uganda and agreed on
establishing a tripartite COMESA-EAC-SADC FTA.
This is in pursuit of the broader objectives of the
African Union to accelerate economic integration of
the continent. It also aims at achieving economic
growth, reduce poverty and attain sustainable
economic development. Among the specific
objectives of the tripartite FTA is to eliminate tariffs
and all barriers to trade in goods, to liberalise trade
in services, and to facilitate cross-border movement
of goods, services and investment. It is envisaged
that a tripartite FTA will create a larger market than
would any of the three Regional Economic
Communities (RECs) on their own thereby
increasing intraregional trade by enhancing
member countries’ exports. According to the
African Development Bank (2011), to date intra-
Africa trade remains low at just 11% of total trade
compared to 60% in the European Union, 52% in
Asia and 40% for North America. In 2010,
intraregional trade in COMESA stood at 4% of total
trade while that of EAC and SADC stood at 11.38%
and 9% respectively. However, the Tripartite FTA is
expected to consolidate the internal markets,
enhance intra-regional trade of the three RECs and
facilitate duty- and quota-free trade within the
common market, subject to rules of origin.
In January 2012, the African Union Summit of
African Heads of State and Government endorsed
the theme of Boosting Intra-African Trade‘, paving
the way towards fast-tracking a Continental Free
Trade area (CFTA) with a tentative timeframe of
2017. The January 2012 decision mandated UNECA,
The Strategic Journal of Business & Change Management. ISSN 2312-9492 (Online) 2414-8970 (Print).
www.strategicjournals.com
Page: 1041
AUC, AfDB and Member States to collaborate
closely towards the implementation of relevant
action plans at the national, regional and
continental levels on boosting intra-African trade
and the establishment of the CFTA. In particular,
the January 2012 Summit recognized the low level
of trade between African countries called upon
Member States, Regional Economic Communities
(RECs) and the AUC to promote industrial
development policy and value addition to diversify
African economies and thereby moving away from
heavy reliance on traditional primary exports.
In 2007, Rwanda joined the East African Community
(EAC). Rwanda is also a member of the Common
Market for Eastern and Southern Africa
(COMESA). Rwanda is the only nation in the region
to have concluded a Bilateral Investment Treaty
(BIT) with the United States. Rwanda has also
concluded a Trade and Investment Framework
Agreement (TIFA) with the United States. The most
recent meeting under the TIFA was in October
2019. In 2009, Rwanda became the newest
member of the Commonwealth and was scheduled
to host the Commonwealth Heads of Government
Meeting in 2020, but the meeting was postponed to
June 2021 due to COVID-19 outbreak. Rwanda
joined the OECD Development Center in 2019.
Africa is one of the world’s most biodiverse
regions,5 and many African countries have a
comparative advantage in the abundance and
variety of biological resources. Furthermore, a
majority of the population in Africa depends
directly upon biodiversity and ecosystem services
for their food and livelihoods,6 whereas natural
capital accounts for between 30 per cent and 50 per
cent of the total wealth of most African countries.
The creation of the African Continental Free Trade
Area (AfCFTA) through the entry into force of the
Agreement Establishing the AfCFTA (AfCFTA
Agreement), on 30 May 2019, presents important
opportunities for boosting intra-African trade and
promoting development that is environmentally,
socially and economically sustainable. The AfCFTA is
central to achieving the continental integration
envisioned in the Organization for African Unity’s
Treaty Establishing the African Economic
Community (Abuja Treaty) and the African Union’s
Agenda 2063: The Africa We Want (Agenda 2063). It
is also expected to drive the economic
transformation needed to foster the sustained and
inclusive growth required to help African countries
to implement the 2030 Agenda for Sustainable
Development (Agenda 2030) and achieve the
Sustainable Development Goals (SDGs) (UNCTAD,
2016a).
Dirk(2013) estimates the welfare effect of the
COMESA-SADC-EAC FTA, using a GLOBE CGE model
and GTAP data base. He finds that the FTA leads to
a welfare benefit of $578 million when they assume
a complete tariff liberalization between the three
blocs. The default GLOBE CGE model assumes full
employment . Their macro-closure rules fix
investment, and the current account balance. In
contrast to the above study , our model closure
uses the standard GTAP closure, and
unemployment closure - fixed wages within the
Tripartite Region – this is the way the model is used
to simulate for high levels of under- and un-
employment. Therefore, industries can hire as
many workers as they need following an economic
shock, without bidding up wages (Burfisher, 2011).
Rwanda’s production and export patterns today still
reflect to a large extent the circumstances of the
country’s history. The “land of the 1,000 hills” – a
small, landlocked country with a hilly terrain and
high elevation – Rwanda historically enjoyed higher
rates of population growth than other countries in
its region as altitude provided a natural shield
against tropical diseases such as malaria and the
relatively favorable climate provided good
conditions for certain types of agriculture (Prunier,
1995). Traditionally Rwandans earned their living
through small-scale farming and the herding of
cattle. While it provided certain benefits, its
landlocked location and high elevation also
rendered Rwanda relatively isolated and
commercial and trade linkages were
underdeveloped.

The Strategic Journal of Business & Change Management. ISSN 2312-9492 (Online) 2414-8970 (Print).
www.strategicjournals.com
Page: 1042
Dependence on a few commodities for its exports
represents a dangerous combination for Rwanda,
making the country vulnerable to commodity price
changes and weather shocks. Reports by World
Bank 2020 shows that Rwanda’s exports are to the
prices of three commodities: coffee, tea, and tin.
During the 1970s these benefitted from a price
boom and Rwanda recorded some of its highest
growth rates in GDP per capita. However in the
1980s the price of coffee plummeted. One of
Rwanda’s main tin mines closed. In the late 1980s a
series of unusual weather patterns caused a small-
scale famine in the countryside. As a result, exports
of goods and services fell precariously from a high
of 21 percent of GDP in 1979 to a low of 6 percent
of GDP in 1990. By the early 1990s Rwanda was
facing very difficult economic times. These
economic hardships exacerbated the political and
social tensions that existed in Rwanda which
ultimately lead to conflict and the tragic events of
the Rwandan genocide in 1994.
It is against this backdrop that this study attempts
to contribute to the current trade policy dialogue
on boosting intra-African trade in four aspects.
First, the study examines patterns of export
diversification for African economies. Second, a
measure of Intra-Industry trade for African
economies is estimated. Intra-industry trade is
understood as simultaneous import and export of
similar but differentiated goods. Third, the study
evaluates potential linkages between export
diversification and intra-industry trade in Africa.
Informed by the patterns of trade in African
economies, constraints towards export
diversification and intra-industry trade are
discussed and ways to overcoming these
constraints are explored.
Growth in Rwanda has also become increasingly
dependent on growth in its key trading partners.1
Its concentrated export base and heavy
dependency on foreign aid leaves the country
vulnerable to sharp global downturns and/or sharp
1 IMF (2012), Staff Report, p.14.
increases in commodity prices, which could affect
Rwanda's economy through the following channels:
slowdown in global demand for exports; reduction
in FDI; slowdown in tourism receipts and inward
remittances; and contraction of the foreign-aid
envelope. Similarly, rising fuel prices are a threat.
Export diversification and lower dependence on aid
would reduce Rwanda's vulnerability over the
medium to long-term.
The value of Rwandan exports increased by 3.8
percent while the volume of exports increased 40.6
percent year-on-year in 2019, reaching $1,164.5
million, according to the National Bank of Rwanda.
The increase in value was attributed to good
performance in non-traditional exports and re-
exports, partly offsetting a fall in traditional
commodity exports (coffee, tea, minerals,
pyrethrum, hides and skins) largely driven by
declining global prices. Commodities, particularly
gold, tin, tantalum, tungsten, tea, and coffee,
generated over 57 percent of Rwanda’s export
revenue, according to the National Institute of
Statistics Rwanda (NISR). Rwanda earned $86.3
million from tea exports in 2019, a 4.6 percent
decrease from 2018. Over the same period, coffee
accounted for $69.2 million worth of exports, up 0.2
percent from the previous year. Major markets for
coffee exports are the United States and Europe,
while the Middle East and Pakistan are the main
buyers of Rwandan tea. The value of Rwandan
exports of mineral products decreased by 31.3
percent between 2019 and 2018. Tourism is the
country’s leading foreign exchange earner, with
total revenues estimated at $438 million in 2017,
according to the Rwanda Development Board
(RDB). This is due to successes in leisure tourism as
well as rapid-growth in business tourism, also
known as Meetings, Incentives, Conferences and
Events (MICE).
Rwanda’s small industrial sector contributes around
19 percent to GDP and employs less than three
percent of the population. The services sector,
which includes tourism, generates almost half of
GDP (48 percent) and has grown at an average
The Strategic Journal of Business & Change Management. ISSN 2312-9492 (Online) 2414-8970 (Print).
www.strategicjournals.com
Page: 1043
annual rate of around eight percent in recent
years. Rwanda is highly import-dependent, and the
Rwandan government faces chronic and large
current account deficits. In 2019, imports totaled
$2.7 billion (an increase of 10.6 percent from the
$2.445 billion in imports registered in 2018) due to
ongoing large infrastructure projects and growing
industry. Import of capital and intermediary goods
increased by 17.8 percent and 16.0 percent
respectively, according to the National Bank of
Rwanda (BNR). In 2018, principal imports included
electrical machinery and parts; electronic
equipment and parts; machinery, appliances, and
parts; vehicles and accessories; cereals and other
foodstuffs; pharmaceutical products; cement and
construction equipment including iron and steel;
and energy and petroleum products. China,
Europe, Kenya, India, the United Arab Emirates, and
Tanzania are among Rwanda’s major suppliers.
U.S.-Rwanda bilateral trade has grown rapidly in
recent years. After Rwanda implemented new
higher tariffs on imports of secondhand clothing
and footwear in 2016, the U.S. government partially
suspended African Growth and Opportunities Act
(AGOA) benefits for apparel products from Rwanda,
effective May 2018. Many other Rwandan exports
to the United States are still eligible for trade
preferences under the Generalized System of
Preferences and AGOA. Rwandan exports to the
United States have grown significantly over the last
10 years. U.S.-Rwanda bilateral trade in 2019
totaled $64.5 million ($18.9 million in exports to
Rwanda, $45.6 million in imports from Rwanda) as
compared to $92.7 million ($25.3 million in exports
to Rwanda and $67.4 million in imports from
Rwanda) the year before; the decline was mostly
due to fewer aircraft parts exports to Rwanda. Top
U.S. exports to Rwanda include aircraft and parts;
mechanical and electrical machinery and related
parts; and medical, pharmaceutical, and scientific
equipment and products.
Less than four percent of Rwanda’s total exports of
goods went to the United States in 2019. In 2018,
$3.86 million in total Rwandan exports to the
United States came under AGOA, up from $2.16
million in 2017, 1.22 million in 2016 and $435,000
in 2015. Rwandan exports covered by AGOA
primarily consisted of apparel, travel goods,
handbags, and arts and crafts).
Rwanda is a member of the Northern Corridor
initiative, which includes Kenya, Uganda, South
Sudan, and Ethiopia as core members and the
Democratic Republic of the Congo (DRC), Burundi,
and Tanzania as observers. Rwanda is also at the
forefront of the Central Corridor initiative, which
also includes Burundi, DRC, Tanzania, and
Uganda. Unlocking some of the larger
infrastructure projects, such as rail transportation,
envisioned under these initiatives could help to
reduce the cost of conducting business and
transporting goods across the region.
Rwanda benefits from low violent crime rates; its
strong police and military provide a security
umbrella that minimizes potential criminal activity
and political conflicts.
Problem Statement
Rwanda is a developing country and geographically
landlocked country and also is considered the
fastest growing economy in East African Community
with a GDP of 9.80 billion (2018) compared to 9.137
billion USD (2017), thus the per capita GDP is
826.30 USD per year, and after that was 780.80 USD
last year, an increase over the previous reporting
4.2 percent (Planning, 2018-2019). In 2018
Rwanda’s total trade amounted to US$1,090.34
million, an increase of 9.16 percent over the fourth
quarter of 2017, Exports totaled US$ 169.91 million,
Imports totaled US$ 841.92 million and Re-exports
were valued at US$ 78.5 million (NISR, 2018).
Exports guarantee higher revenues and profits, on
the other side. Alternatively, they reduce
dependency on local markets since; the market
base will grow, leading only to a decrease of local
clients, in the case of growth in overseas markets
(Dickey D. &., 1979). If it is not, export are able to
minimize the effect of the market volatility,
business become more captive to financial change,

The Strategic Journal of Business & Change Management. ISSN 2312-9492 (Online) 2414-8970 (Print).
www.strategicjournals.com
Page: 1044
altering client requirements and seasonal
fluctuations in local economy (Dickey D. W., 1981).
Finally, and with regard to the advantages of
exports, it can be summarized that an increase in
export leads to an increase in the access to the
currencies, which increases the national income,
the turnover and surpluses of the state (Khan,
2012). This lead to the improvement in the
standard of living. Despite these export advantages,
they sometimes do not produce profitable
outcomes that do not add to the country’s greater
development, for several reasons, including: the
existence of competition is greater than expected,
the products is unpopular or popular in the markets
other, instability in the target country as a result of
wars or civil conflicts, weak media publicity and
definition exported product or other similar reasons
(Engle, 1987).
As far as imports are concerned, the weakness of
the country in meeting its own requirements is
usually expressed and made dependent and at the
expense of foreign nations (Karamanaj, 2014).
Imports lead, contrary to exports, to a local
currency departure and weaken the equilibrium of
trade so that economic growth will weaken (Serhat
Yuksel, 2016). However, and in some cases it is
considered the import source of economic growth,
especially if it includes hardware and electronic
equipment to help and contribute to the increase
and improvement of the investment, or include
products that require a production value of more
than imported (Hatem Hatef Abdulkadhim Altaee,
February 2016). Due to these reasons, the export
and import remains a controversial topic their
ability to influence the social and economic growth
of the countries.
Rwanda’s major economic challenges and
constraints in trade of both goods and services are
largely manifested in the supply-side constraints
and less in the demand side and on market
constraints, in particular in regards to goods trade.
These constraints mainly comprise “the productive
resources, entrepreneurial capacities and
production linkages which together determine the
capacity of a country to produce goods and
services. These productive capacities develop
through capital accumulation, technological
progress, and structural change.”14 Trade
liberalization alone, as past experience has shown
especially for LDCs, is not enough to help trade and
economic growth. Accumulation of resources,
including labour, human capital, physical capital,
land and natural resources; improvements in the
technologies for converting those resources into
goods and services; investments in effi cient public
infrastructure; and the innovation of new goods
and services15 are extremely important
complementary economic development factors that
need to be coherently developed in order to make
trade an effective engine for economic
development and poverty reduction. The
fundamentals for long-term growth are human
resources, physical infrastructure, macroeconomic
measures and the rule of law. The role of trade
policy in economic growth is largely auxiliary and of
an enabling nature: extremes of export taxation and
import restrictions can surely suffocate nascent
economic activity, but an open trade regime will not
on its own set an economy on a sustained growth
path. Too much focus on “outward orientation” and
“openness” can even be counterproductive if it
diverts policymakers’ attention away from the
fundamentals listed above and treats trade rather
than per capita income as a yardstick of success.
This requires a focus on a development-driven
trade policy approach, as opposed to an export-led,
trade-led or demand-led strategy. Such an approach
is proposed for Rwanda.
LITERATURE REVIEW
Trade creation and trade diversion
According to UNECA (2006), trade creation refers to
the increased level of trade that results from the
abolition of trade barriers within the FTA. According
to the assumptions of trade creation, the pattern of
trade heavily reflects the differences in comparative
advantage among member countries. Trade is said
to have been created when countries give up on the
production of goods and services that they produce

The Strategic Journal of Business & Change Management. ISSN 2312-9492 (Online) 2414-8970 (Print).
www.strategicjournals.com
Page: 1045
less efficiently in exchange for the same goods and
services produced more efficiently by a partner
country. Thus regional and global welfare is said to
have been enhanced when the changes introduced
by the FTA produce a shift in consumption from a
higher-cost domestic product to a lower-cost
partner-country product.
For trade creation to occur, certain conditions must
hold in the FTA. Robson (1984) states that trade
creation is more likely to occur when the economic
area of integration and the number of member
countries is large; tariffs and NTBs have been
reduced or eliminated as a result of the FTA; and
the economies of the integrated countries are
competitive, having comparable levels of
development and a complementary resource base.
Narayan et al. (2008) forecasted Fiji’s exports and
imports using ARIMA models with a data set
ranging over the period 1975 to 2002 and found out
that Fiji’s imports will outperform exports over the
period 2003 – 2020 and current account deficits will
escalate to approximately $934.4 million on
average over the 2003 – 2020 period. Khan (2011)
analyzed total imports of Bangladesh using SARIMA,
Holt-Winters’ and VAR models with a data set
ranging over the period July 1998 to July 2009 and
concluded that the VAR model outperforms other
models in forecasting total imports of Bangladesh.
Farooqi (2014) analyzed imports and exports of
Pakistan using the ARIMA approach with a data set
ranging over the period 1947 to 2013 and found out
that the ARIMA (2, 2, 2) and ARIMA (1, 2, 2) models
were suitable to forecast annual imports and
exports of Pakistan respectively. Lu (2015)
forecasted US total textiles and apparel export to
the world using Regression and ARIMA models with
a data set ranging over the period 1989 to 2014 and
found out that both Regression and ARIMA models
give nearly the same results but however suggested
that further research ought to explore the ANNs
technique since it has a better forecast ability.
Baxter and Srisaeng (2018) used the ANN approach
to predict Australia’s export air cargo demand,
employing a data set ranging over the period 1993
to 2016 and concluded that the ANN model is an
efficient tool for predicting Australia’s annual
export air cargo demand. Alam (2019) forecasted
exports and imports using ANNs and ARIMA
techniques, employing a data set ranging over the
period 1968 to 2017 and found out that the ANN
and ARIMA (1, 1, 2) and ARIMA (0, 1, 1) models are
suitable for predicting the total annual exports and
imports of the Kingdom of Saudi Arabia.
Determinants of Export Performance
An investigation conducted by UNCTAD (2005) on
the determinants of export performance of
developed and developed countries amplifies that,
export performance is determined by both foreign
market access (demand side) and supply side
factors. The study further explains that enhanced
market access can induce a supply response. An
important step in improving market access requires
the further lowering of trade barriers which actions
include tackling high tariffs and non-tariff barriers.
Supply-side capacity is strongly related to domestic
market structure and the institutional framework
with the main components being transport costs
and factors affecting cost of production. The supply-
side factors are domestic infrastructure which
includes availability of physical infrastructure,
ranging from roads and ports to energy and
telecommunications, macroeconomic environment,
foreign direct investment and institutions.
According to Fugazza (2004), determinants of
export performance can be split into internal and
external components. External factors relate to
market access conditions and other factors which
affect import demand. Other than trade barriers
and competition factors, foreign market access is
also determined by transportation costs, which
include geography and physical infrastructures. On
the other hand, internal factors refer to supply-side
conditions. Supply capacity is also affected by
locationrelated elements, which may for example,
affect access to raw materials and other resources.
It also depends upon factor costs such as labour and
capital. Beside resource endowment, factor costs
are essentially the outcome of economic policy and

The Strategic Journal of Business & Change Management. ISSN 2312-9492 (Online) 2414-8970 (Print).
www.strategicjournals.com
Page: 1046
the institutional environment. Access to technology
is also likely to affect the productivity of the
external sector, and can therefore be an important
determinant for export performance.
An important lesson to learn is that improving
market access through initiatives like FTAs without
simultaneously paying attention to supply
conditions is likely to be unproductive in terms of
export performance. The UNCTAD (2005) reports
that improved supply capacity has been the driving
force behind the export performance of successful
Asian countries. However, supply capacity appears
to have limited the export performance in most
African, Middle Eastern and Latin American
countries.
Tariffs
Tariffs pose a significant obstacle to intra-African
trade. Reducing them could have a range of positive
and negative effects for different actors in different
countries. For example, reducing tariffs will increase
market access for producers in exporting countries.
It will also expose producers in importing countries
to more competition (Stilwell, 2005, p.55).
Negotiations are ongoing on schedules of tariff
concessions,30 with members yet to submit the
initial tariff offers. Discussions about exemptions for
‘sensitive products’ are taking on a prominent role.
The agreed tariff negotiating modalities define
general liberalization of 90 per cent of products
over 5 years for developing countries and 10 years
for least developed countries (LDCs). Sensitive
products are subject to longer transition periods (10
years for developing countries, 13 years for LDCs)
making up to 7 per cent of tariff lines, with the
exclusion list products making up to 3 per cent (and
not exceeding 10 per cent of import value). Only
exclusion list products are exempt from
liberalization, so the liberalization coverage is 97
per cent (including sensitive products) (Ito, 2020,
p.44). The high threshold level was chosen out of
concern over the concentration of intra-African
trade on a limited number of products (Ito, 2020,
p.44).
It should be noted that the lists of non-sensitive,
sensitive, or excluded products are determined by
country, except for the members of the East African
Community (EAC), the Economic Community of
Central African States (ECCAS), the Economic
Community of West African States (ECOWAS) and
the Southern African Customs Union (SACU). A
common list is determined for the members of each
of the latter four regional groupings (UNECA, 2018).
The list of ‘sensitive products’ may contain certain
natural resources and agricultural commodities.
While the probability that BioTrade HS codes are
included in the ‘sensitive products’ list is quite low,
sensitive products may need to be analysed on a
case-by-case basis to check if any potential
BioTrade product is covered. The preparation of
initial tariff offers will require substantial work,
including technical analysis, and UNCTAD BioTrade
Initiative’s work on biodiversitybased HS codes may
help shine some light on the most important
biodiversity-based international trade flows and
related tariff lines. AfCFTA members should reflect
on how to enable BioTrade and the creation of
regional and continental biodiversity-based value
chains through targeted tariff reductions.
Theoretical Underpinnings of Export
Diversification and IntraIndustry Trade
According to White (2011), the underlying
economic theory of an FTA is that of comparative
advantage. Simply put, the theory postulates that in
an FTA, each country will ultimately specialize in
that activity where it has comparative advantage.
Trade Theories and Literature on Service Exports
Trade theories that explain services are incipient
because of their nature of non-storability and
largely invisibility. In the meantime, goods-specific
trade agreements can be applied albeit with
adjustments (Hindley and Smith, 1984; Deardorff,
1985). Therefore, traditional trade theories such as
absolute advantage, comparative advantage,
Heckscher-Ohlin, New Trade Theories and New
Trade Theories (see Geda (2012) for explanation of
each agreement) are relevant.
The Strategic Journal of Business & Change Management. ISSN 2312-9492 (Online) 2414-8970 (Print).
www.strategicjournals.com
Page: 1047
Empirically, various studies have applied the gravity
model to study bilateral trade in services. Nordås
and Rouzet, (2017) draw on the gravity model,
PPML regressions to estimate the effect of services
trade restrictiveness on bilateral exports and
imports in 12 sectors. The Services Trade
Restrictiveness Index (STRI) from the OECD
database ranges from 0 to 1 where 0 is the absence
of a restriction and 1 is complete restriction. It
covers five policy realms: restrictions on the
movement of natural persons; restrictions on
foreign establishment; regulatory transparency;
competition barriers and other discriminatory
measures. Other explanatory variables have been
include such as GDP from WDI, gravity data sets
from CEP11, RTAs from WTO RTA database
and intra-EEA (European Economic Area that are
deeper integrations compared to RTAs)
transactions. Findings reveal that service exports
rather than service imports are more sensitive to
restrictions. Lower exports and higher STRI scores
were more pronounced in telecommunications,
insurance, maritime transport, courier services and
legal services.
More so, heterogeneous regulatory policies among
trading partners escalated trade barriers while
reduction of trade barriers had larger positive
marginal impacts on exports for trading partners
with similar regulations. It was also evident that in
many service sectors there were less restrictions of
cross-border trade compared to natural movement
of people and foreign establishment where
restrictions were numerous. Heterogeneous non-
tariff barriers across countries have made it difficult
to estimate the effect of services trade regulations
in a comparable manner. Past studies either
observe trade in services patterns against a free
trade benchmark or rely on a measure services
trade restrictivenes covering few services sectors
hence inadequately estimating the extent of
restrictive service trade policies. In most cases, such
techniques apply for OECD countries unlike in
developing countries where disintegrated services
trade restrictive index and regulatory policy data is
unavailable (Borchert et.al, 2017). Therefore, trade
liberalization is an essential pro- competitive policy
tool in services trade.
Using the gravity model and running fixed effects
and OLS regressions, Kimura and Lee (2006)
examine the implications of different factors on
bilateral trade in services commensurate to
bilateral trade in goods between 10 OECD countries
and other 47 trade partners (OECD and non- OECD
countries) in 1999 and 2000. The study considers
bilateral service and goods trade (imports and
exports) as dependent variables while GDPs,
distance, remoteness, adjacency, regional trade
agreements, Economic Freedom index and
language have been included as explanatory
variables. Results of higher values of adjusted R2 for
services trade compared to goods trade ascertain
that gravity models are more suitable with trade in
services unlike trade in goods. Further, variability
was eminent in relation to the elasticities of the
independent variables between goods and services
trade. While the impact of geographical distance
and economic freedom was much stronger services
trade, the common border common variable had a
higher positive significant impact on goods trade.
However, common membership to regional
integrations had significant effects on both services
and goods trade. Lastly, regressed residuals of
service exports and good imports showcased a
complementary relationship between service
imports and good exports.
Van der Marel and Shepherd, (2013) investigate the
magnitude to which regional agreements and
regulations in services drive bilateral trade in
services with a key focus on sectoral level
regulations and impacts on sector-specific trade in
services using mirror data from the Trade in
Services Database, CEPII, World Bank STRB data and
De Sousa’s (2012) RTA data for the period 2005-
2010. R2 values of over 80 percent from the gravity
model (Poisson quasi-maximum likelihood
estimator) with fixed effects reinforce the gravity
model’s significant power in explain services trade.
Results reveal the nexus between restrictive

The Strategic Journal of Business & Change Management. ISSN 2312-9492 (Online) 2414-8970 (Print).
www.strategicjournals.com
Page: 1048
regulations and lower trade (except for mode 3
services) though the nexus strength is highly
dependent on particular sectors.
However, foreign establishments (mode 3) services
restrictions led to stronger trade flows originating
from substitution effects with cross-border trade
(mode 1). While the regional integration dummy
had positive significant effects on business services,
financial services and total trade, the coefficient
was insignificant for transport, insurance and
wholesale/retail trade services. Delving deeper to
access the additional thrust effect of advanced
trade agreements, the EU dummy was added to
complement the RTA dummy variable. The effect of
the RTA dummy was not significant indicating that
the RTA effect was largely dependent on EU’s
services trade promoting role. Therefore the study
sheds light on the essence of sector-specific
regulatory measures to compliment general
services regulatory issues in trade negotiations in
addition the crucial role played by different depths
and scopes of regional agreements.
Hellmanzik and Schmitz, (2016) access the
determinants of bilateral services trade for total
services trade as well as its subgroups like travel,
transport and computer services. The gravity model
constitutes independent variables such as time
zone differences, distance, contiguity, common law
indicators, common religion, common language,
migrants stock and most importantly, the key
variable of interest, virtual proximity obtained from
Chung’s (2011) data on bilateral hyperlinks. Virtual
proximate countries manifest if say Polish or
Swedish internet users create links from the United
States e.g. The Economist homepage. When the
Polish hyperlink indicator is higher than for Sweden,
ceteris paribus, Poland is considered to be virtually
proximate to the United States. Other control
variables such as RTA, colonial legacy, cultural
distance and common currency have been included
in the PPML and Instrumental Variable (IV)
robustness checks. The datasets are obtained from
various sources including OECD Statistics on
International Trade in Services, Eurostat, UN
Services Trade, CEPII, CIA Factbook and World Bank.
Findings reveal that aggregate services trade is
considerably higher for virtually-proximate nations
in
addition to most of the subsets of services trade.
Virtual proximity effects are more pronounced in
information sensitive services like communication,
IT, audiovisual services, insurance and financial
services. As such, the results amplify the role of
technology and internet in overshadowing the
proximity burden of information, transport and
transaction costs in services trade. Further, other
explanatory variables had heterogeneous effects on
the various subsector categories. With regards to
the EU membership, only travel services saw
significant positive outcomes that are associated
with the depth of EU policies in institutional
integration in addition to the elimination of travel
restrictive procedures.
Guillin, (2013) examines the impact of trade
agreements on the flow of services as well as
elucidating ‘depth’ in services i.e. degree of
liberalization in agreements by running a gravity
model on panel data with bilateral, time and
country fixed effects and first-difference (FD)
estimators for robustness tests for the period 1999-
2007. Findings from 11 services sectors for 36
exporters and 165 trade partners show that service
RTAs increase trade from 18-32%. Indeed depth
matters for trade in services as substantial impacts
on services trade were observed for high degree
service RTAs. Interestingly, sequencing services
trade agreements (negotiating goods trade through
CUs or FTAs and concluding with service trade
negotiations) does not induce trade more than
agreements that were signed simultaneously on
goods and services. This alludes to the fact that if
written service trade agreements exist in advance
incentives and strong commercial relationships to
liberalize services appear. Similar findings on the
positive impact of RTAs (including NAFTA and EU)
on both services and goods are portrayed by
(Ceglowski, 2006) in their gravity model for 1999-
2000 data. Park and Park, (2011)’s gravity
The Strategic Journal of Business & Change Management. ISSN 2312-9492 (Online) 2414-8970 (Print).
www.strategicjournals.com
Page: 1049
regression analysis show that trade creation effects
are sector specific for RTAs under Article V of
General Agreement on Trade in Services (GATS)
with intra-partner trade business services having
the greatest trade- enhancing effects and
transportation services having the lowest for
developed countries.
In a recent contribution, Álvarez et al. (2018) delve
into understanding whether institutional quality
matters for bilateral trade in primary,
manufacturing and services sectors using the
gravity model PPML regressions. Sector specific
variables (market share, sectoral prices, and labor
competitiveness), RTAs and gravity dataset
variables have been included as control variables.
Contrary to the previous studies, regional
agreements and interrelated contiguity have no
significant effects on services trade. This can be
attributed to the limited data availability for trade
in services. Nevertheless, institutional quality was a
key factor in services trade. Out of the six
World Governance Indicators (WGI), regulatory
quality exhibited the largest positive impact on
services trade while the coefficient of voice and
accountability was positive but insignificant. More
bilateral services trade was associated with
stronger institutions in the importing country
mainly because exporters will be appealed by
formal institutions where they face less uncertainty
and risk. Mitra et.al, (2018) also draw on the gravity
model to establish the effect of terrorism (number
of terrorist incidents in the origin and destination
country) on international air travel. While the
impact of small scale/non-fatal terrorist attacks had
significant negative impacts of passenger travel,
adverse effects of transnational terrorism attacks
on air travel were five times larger.
Geda and Yimer (2019) adopt a trade indices and
gravity model to establish the effects of AfCFTA
tariff reduction protocol on Africa’s intra-trade in
merchandise trade. Results from the gravity model
based on regional blocks show that membership to
COMESA, EAC and SADEC result to a trade creation
with coefficients of 0.599, 1.073 and 1.679
respectively. However, if only a single trading
partner belongs to the RECs and trade is within
North East and Southern Africa (NES), COMESA has
a positive and trade creation effect of 0.209 while
EAC and SADEC have negative effects but only EAC’s
effect is significant. Since overlapping membership
among the three RECs exists and most of the
members are in COMESA then COMESA’s trade
creation effects holds for NES, region. When one
trading partner belonging to COMESA trade with
the rest of Africa there is a diversion significant
trade diversion effect (0.3890). Combining all the
regional models to a single continental model,
reveals that greatest trade creation possibilities are
when the trading partners belong to SADEC (2.212),
EAC (1.945), ECOWAS (1.443) and COMESA (0.472)
respectively. Conversely, the trade indices approach
predicted a more trade diversion effects and limited
trade creation with the implementation of AfCFTA.
Merging the two approaches, trade indices and
gravity models predict a rise in Africa’s intra-trade
by close to 19%.
Other, CGE based models studies (ECA, 2012; Mold
and Mudwaya; 2016; Afreixm, 2018), amplify
AfCFTA’s positive impact on Africa’s intra-regional
goods trade. These prevailing predictions on the
positive impacts of AfCFTA on intra-regional goods
trade could also be extended to services trade
based on (Kimura and Lee, 2006) who showed that
RTAs boost both goods and services trade with
similar magnitudes.In addition, the positive impact
of RTAs were greater for service imports than good
imports, a proof that goods and services trade was
complimentary. Hence, RTAs need to include
services in negotiations as they increase trade in
services as much as trade in goods.
Export Diversification
Export expansion can be either through the
extensive margin—new products or new markets—
or the intensive margin—more of current products.
Export diversification is therefore understood as the
expansion of exports due to new products or new
markets—extensive margin. Amurgo-Pacheco and
Pierola (2008) provide a useful narrower definition

The Strategic Journal of Business & Change Management. ISSN 2312-9492 (Online) 2414-8970 (Print).
www.strategicjournals.com
Page: 1050
by discussing a geographic dimension with export
diversification via the extensive margin is the export
of new products to existing markets, old products
to new markets, and new products to new markets.
Export diversification and economic diversification
in general build resilience of poorer countries to
external economic shocks. Diversification is more
relevant today to Africa as the impact of the global
financial crisis affect both rich and poor economies
globally. For Africa, with its high dependence on
primary commodities and fluctuating world prices
on most primary goods, there is therefore a need
for Africa to pursue developmental strategies which
promote export diversification. In addition, Africa
requires high and sustained growth to make
progress in combating poverty. Export
diversification is widely seen as a positive trade
objective in sustaining economic growth (Brenton,
Newfarmer and Walkenhorst 2007). Delgado (1995)
argued that diversifying the agricultural export base
and diversifying the economy across sectors are
central to the long-run growth strategies in Africa
given the high concentration ratio of agricultural
exports (food and beverages typically account for
well over half of merchandise exports in non-oil
exporting African countries). Moreover, there is
convergence in the developmental literature that
growth requires structural transformation
(primary—manufacturing—services trade), hence
African economies must diversify production base
into high-value added production in order to
sustained economic growth 2 . Diversification is
sometimes claimed to be of importance not just for
resource-rich countries, but as a pre-requisite for
economic growth (Economic Commission for Africa,
2007).
Virtually every theory of international trade
predicts that a larger economy will export more in
absolute terms than a smaller economy.
Nevertheless, trade theories differ in predicting
how relatively larger economies export more
(Hummels and Klenow, 2005). One strand of
2 IMF (2012), Staff Report, p.14.
literature emphasizes on the export expansion
through the intensive margin, based on seminal
work by Armington (1969). Brenton et al. (2007)
argued that low income countries focus on greater
differentiation of existing products, rather than
attempting to diversify directly into new export
categories. On the other hand, some have argued
for the expansion of export via the extensive
margin, based on the influential work of Krugman
(1980). However, Hummels and Klenow (2005)
argue that neither the intensive margin hypothesis
by Armington (1969) nor Krugman‘s extensive
margin hypothesis fully explain international trade
patterns in developing countries and provided an
empirical framework dividing trade expansion into
both intensive and extensive. The authors argued
that consumer preferences for variety increases as
economic development increases, thereby
providing an incentive for export expansion in the
extensive margin. Their study found that larger
economies export higher volume of each goods
(intensive margin), export a higher variety of goods
(extensive margin3) and export higher quality
goods.
Imbs and Wacziarg (2003) found that the process of
diversification follows a two stage process (U-shape
relationship), in which growth in early stages of
development is accompanied by diversification,
until a turning point upon which the trend reverses
toward increasing specialization once more. Few
African economies are at the level of development
associated with the turning point towards
specialisation, suggesting that further growth on
the continent can lead to greater diversification.
This study adopts a measure of GDP per capita, and
there is faint evidence of this relationship in Africa,
although oil exporting economies with relatively
large GDPs but with poorly diversified exports are
anomalies inconsistent with the two-stage
diversification hypothesis. A recent finding (Spence
3 The study found that the extensive margin accounts for 62 per
cent of the greater exports of larger economies based on data from UNCTAD TRAINS collected from national statistical agencies of 76 importing countries covering all 227 exporting countries in 1995
The Strategic Journal of Business & Change Management. ISSN 2312-9492 (Online) 2414-8970 (Print).
www.strategicjournals.com
Page: 1051
and Karingi 2011) suggests that many African
countries are currently engaged in export activities
incommensurate with their level of development
and hence associated with significant opportunity
costs. An outcome based measure of export
sophistication 4 (EXPY) in which goods are weighted
according to the income of the exporting countries
is plotted against GDP. The main contribution of the
Hausmann, Hwang and Rodrik (2007) study which
proposed this measure is that future growth is
significantly influenced by current export
sophistication. Countries above the line such as
Liberia, Madagascar or Egypt can be thought of as
exporting products that are ‘richer‘ than they are,
and as such can expect higher growth in the future.
Nations such as Malawi, Ethiopia and Mali, which
are below the line and therefore exporting products
of lesser sophistication than those having
comparable incomes, will grow more slowly unless
they can move into exporting more sophisticated
goods.
Imbs and Wacziarg‘s (2003) U-shape relationship
was later verified for developing countries by
Cadot, Carrere and Strauss-Khan (2008). The later
study suggests that growth at the income levels of
most African economies should prompt
diversification. As developing economies grow,
consumption patterns change through Engel
effects, that is increased demand for a greater
variety of goods as income rises. A rising middle
class in Africa can be expected to demand a larger
variety of goods (AfDB, 2011). UNECA‘s work on
export diversification has reiterated the
justifications for diversification with respect to the
growth dynamics (UNECA and AUC, 2007, 2011;
Karingi and Spence, 2011).
Ben Hammouda et al. (2006) offer a richer analysis
of the diversification regimes in Africa, found that
there is little economic diversification despite
prolonged periods of peace and stability, some
African economies remain poorly diversified, such
4 Export sophistication is basically referring to diversification of
exports into new products (extensive margin products) and usually with higher value-added.
as Burkina Faso and Seychelles. Also, some African
economies—for instance, Mozambique and
Malawi—started the process but have not made
any significant breakthrough in diversifying
agricultural products and yet to diversify into the
higher value activities. Nonetheless, the authors
found that some African economies with deepened
diversification process are indeed engaging in
structural transformation in a sustainable manner.
Tunisia‘s horizontal diversifications into high value
activities and Madagascar‘s capture of vertical value
chains in clothing and apparels are exemplarily.
However, the study also found other African
economies who were backsliding in the
diversification process. Typically, African economies
which have struggled to move into new sectors is
due to rising commodity prices which leads to an
ever increasing concentration of exports, enclave
economies and Dutch disease effect5 . Guinea-
Bissau and Angola can be categorised by this
regime. Lastly, the study found that countries which
went through conflicts see their diversification
prospects negatively impacted. A category which
initially included countries like Liberia, Sierra Leone
and the Democratic Republic of Congo, have
positive diversification outcomes in more stable
years.
Export diversification through product
differentiation in Africa has not been subject to
extensive economic scrutiny. Brenton et al. (2007)
articulate a convincing case for low income
countries to focus on greater differentiation of
existing products, rather than attempting to
diversify directly into new export categories. This
stems from the observation that export growth at
the intensive margin is far more significant for
developing countries than that at the extensive
margin (i.e. export growth is dominated by
intensifying trade in existing products rather, than
undertaking new export activities – see Amurgo-
Pacheco and Pierola, 2007; Brenton and
Newfarmer, 2009). This may be linked to the fact
5 A negative relationship between increased exploitation of
natural resources and a decline in manufacturing sector
The Strategic Journal of Business & Change Management. ISSN 2312-9492 (Online) 2414-8970 (Print).
www.strategicjournals.com
Page: 1052
that the gains from developing new goods for
export are socialised through information spillovers,
yet the costs are private, leading to a suboptimal
level of innovation (Hausmann and Rodrik, 2003).
Moreover, when developing countries do undertake
extensive expansion, the survival rate is very low.
With imperfect information firms are ex ante
unaware of the profitability of entering foreign
markets, and evidence suggests that Africa is
particularly poor at sustaining export relationships
once they are created. Besedes and Prusa (2007)
show that African exports would have had a 3
percentage points higher growth rate if it had South
Korea's survival compared to a 1.8 percentage
points higher growth rate if it had South Korea's
deepening (growth of trade in surviving
relationships). For Malawi, just 35 percent of export
flows survive beyond one year (Brenton et al.,
2007). Investing in improving the quality of existing
products is further warranted on the grounds that
rich countries import more from countries that
produce higher quality goods (Hallack, 2006). In the
policy framework of new structural economics (Lin,
2010) export diversification is best achieved by
focusing on existing comparative advantage, where
industries are competitive, leading to the capture of
economic rents for reinvestment and subsequent
upgrading of endowments structures.
While this is suggestive of a need to prioritize
intensive expansion through greater differentiation,
Kilnger and Lederman (2006) and Cadot, Carrere
and Strauss-Khan (2008) show that the process of
diversification (as opposed to export growth) in low
income countries is driven by inside the frontier
innovation (emulations) and extensive expansion,
suggesting that African countries should undertake
new export activities if it is to succeed in
diversifying its exports, but that they should be in
industries in which there is already existing
expertise. In practice the dichotomy between
intensive and extensive expansion is of little
prescriptive utility as export growth and
diversification requires the upgrading of production
of existing exports and the undertaking of new
export activities. This implies that African
economies need to explore dynamic comparative
advantages10 when promoting diversification.
These are potential sectors outside Africa‘s main
comparative advantage sectors of primary
commodities and fuel. The role of developing the
manufacturing sector therefore is of crucial
importance. Structural adjustment is of course a
costly exercise and therefore indentifying the
potential success sectors is essential.
The quality of institutions also matters for
diversification. Rauch (2007) presents a model in
which institutional reforms is conducive to allowing
firms to enter higher value production activities and
improve the results of trade liberalization relative
to those targeted towards the lower value
production. Tybout‘s (2000) found that differences
between manufacturing efficiency in developing
country firms relative to developed country
counterparts are driven by low incomes in target
markets, detrimental macro-policies, high
transportation costs, bureaucracy, and poor rule of
law. Given the rising incomes and improved macro-
stability in many African economies, transportation
costs and improved rule of law emerge as policy
priorities. Improving intellectual property rights, in
particular, can help to privatize some of the positive
externalities generated by new exporters which
lead to sub-optimal innovation (Hausmann and
Rodrick, 2003). Greater adherence to international
metrology standards is crucial to ensure that
differentiated goods can be assessed on a level
playing field. With respect to infrastructure, its
negative impact on trade costs is well established
(Freund and Rocha, 2010; Limao and Venables,
2001).Cheaper international transit is also
associated with extensive expansion (Dennis and
Shepard, 2007; Pearson, 2010), while recent
evidence from Eastern Europe shows it is also a
driver of product quality (Harding, 2009). Karingi
and Spence (2011) also found infrastructure to be a
significant determinant of both productivity and
export sophistication in the African context.

The Strategic Journal of Business & Change Management. ISSN 2312-9492 (Online) 2414-8970 (Print).
www.strategicjournals.com
Page: 1053
Overall, while the literature on export
diversification have argued for the prioritization of
intensive or extensive margins respectively or both,
we put forward an argument that there is a case for
African countries to pursue export expansion
through the intensive margin—through product
differentiation—and also extensive margin
conditional on existing industries competitiveness
to compete in foreign markets.
Trade and Trade Policy in Rwanda
Rwanda runs a negative trade balance, but shows a
balance of payments surplus. The currency outflow
due to a negative current account is more than
offset by the inflow of foreign currency thanks to
the positive capital account. The country is thus
able to sustain its negative trade balance with the
inflow of foreign currency originating from capital
and financial inflows, mostly represented by official
development assistance (ODA). On average, since
2005, ODA has amounted to around 70–80 per cent
of Rwanda’s negative trade balance.
Rwanda’s historically negative trade balance is
explained by the significant reliance of the country’s
formal sector on imported goods as compared to
limited exports. In past years this significant trade
imbalance has increased Rwanda’s reliance on
external sources of financing, such as aid, while
rendering the economy particularly vulnerable to
fluctuation in terms of trade. In 2011, Rwanda’s
exports amounted to US$466 million compared to
over US$2 billion of imports, resulting in a trade
deficit of US$1.55 billion, 24 per cent of the
country’s GDP (National Bank of Rwanda, 2012a).
Rwanda’s main export flows are determined by a
limited number of commodities, namely tea, coffee,
tin ores, niobium, tantalum, and tungsten ores.
These few products generated over 60 per cent of
export earnings in 2011. On the other hand, as a
consequence of limited domestic production of
consumer and capital goods, import flows cover a
large variety of product classes
The immediate origins and destinations of external
trade are mostly neighboring countries such as the
United Republic of Tanzania, Kenya, and the
Democratic Republic of the Congo. This is the result
of Rwanda’s landlocked status, as trade flows need
to reach neighboring port facilities before entering
the national market or being shipped towards other
destinations. The main export route for Rwandan
merchandise is via Mombasa Port in Kenya,
followed by the Port of Dar-es-Salaam in the United
Republic of Tanzania. However, a significant share
of Rwandan exports is also directed to Uganda,
which, being landlocked itself, serves as a trading
platform in the eastern part of the Democratic
Republic of the Congo. This reliance on foreign
infrastructure constitutes a major impediment for
the development of Rwanda’s international trade
with non-neighboring partners not only because of
high transportation costs and long shipment time,
but also because of the dependence on often
inadequate infrastructure, poor administrative
procedures, and, ultimately, the risk of operating in
potentially unstable countries.
In 2006, Rwanda joined the EAC Customs Union, a
large trade bloc unifying Burundi, Kenya, Rwanda,
the United Republic of Tanzania, and Uganda in a
common free trade area. The EAC common market
made an important contribution to Rwandan trade
flows to and from neighboring countries, increasing
the country’s trade integration with local markets.
However, significant non-tariff barriers such as
product standards and packaging still reduce
Rwanda’s effective ability to export to key overseas
markets such as the European Union and the United
States, as well as regionally. Such barriers also
constitute a major impediment to the country’s
efforts to reposition its exports towards higher
levels of the value chain, a necessary step for
reducing its exposure to commodity price
fluctuations.

The Strategic Journal of Business & Change Management. ISSN 2312-9492 (Online) 2414-8970 (Print).
www.strategicjournals.com
Page: 1054
Table 1: Rwanda Balance of payments
Reference Last Previous Units Frequency
Exports of Goods and Services 2020 1,855,000,000,000 2,031,000,000,000 RWF
Imports of Goods and Services 2020 3,442,000,000,000 3,365,000,000,000 RWF
Balance of Goods 2019 -1,472,821,521 -1,154,517,937 USD
Current Account Balance 2019 -1,253,742,220 -978,437,757 USD
Exports of Goods 2019 1,231,810,067 1,129,625,985 USD
Imports of Goods 2019 2,704,631,588 2,284,143,923 USD
Real Exports of Goods and Services 2017 1,290,000,000,000 966,000,000,000 NCU
Real Imports of Goods and Services 2017 2,641,000,000,000 2,398,000,000,000 NCU
Source: IMF, 2021
Trade Flows of Goods
Rwanda’s participation in international trade grew
steadily during the past decade: both imports and
exports showed rapid and sustained improvement,
recording average annual growth rates of 17 per
cent over the last 11 years.
During the same period the trade balance
deteriorated, decreasing from a negative value of
US$238 million in 2000 to minus US$1,550 million in
2011. Relative to the country’s GDP, Rwanda’s trade
deficits increased from about 10 per cent in 2000 to
25 per cent in 2011, mainly as a result of the higher
increase of trade inflows with respect to the
national output.
Table 2: Trade in Rwanda
Rwanda Trade Last Previous Highest Lowest Unit
Balance of Trade -226.40 -191.40 -100.59 -1268.30 USD Million
Current Account -1234.87 -1253.74 99.12 -1352.50 USD Million
Current Account to GDP -8.70 -7.80 1.80 -15.90 percent of GDP
Imports 343.30 334.50 1859.00 156.90 USD Million
Exports 116.95 143.15 590.80 37.16 USD Million
Capital Flows -733.20 -402.30 426.80 -814.60 USD Million
Terrorism Index 3.75 2.95 3.94 0.42
Foreign Direct Investment 99.92 384.46 384.46 99.92 USD Million
External Debt 3010.00 2452.60 3010.00 511.20 USD Million
Source: National Institute of Statistics 2020 Year report.

The Strategic Journal of Business & Change Management. ISSN 2312-9492 (Online) 2414-8970 (Print).
www.strategicjournals.com
Page: 1055
Merchandise exports
Rwanda’s exports are represented by the country’s
main cash crops, coffee and tea, and by the
extraction sector. In 2011, coffee and tea amounted
to 30 per cent of the country’s total exported
goods, while minerals accounted for about one-
third. Figure 2 presents the evolution of the three
major export commodities as a share of total
exports. The contribution of crop exports to trade
outflows decreased from 80 per cent in 1999 to 30
per cent in 2011. Over the same period, mineral
exports rose to represent 33 per cent of total
outbound shipments by 2011, starting from less
than 10 per cent in 1998.
Table 2 shows the evolution of values and volumes
of Rwanda’s main exports from 1998 to 2011.
Coffee production for export varied throughout the
time sample, with large variations but with no clear
upward trend, fluctuating at around 16,000 tons.
Ninety per cent of coffee production, the vast
majority of it Arabica, is exported before roasting.
The export value for coffee is greatly affected by
market unit price volatility, which largely
determines the year-on-year value fluctuation of
coffee exports. The sector for years showed a lack
of dynamism as a consequence of a deterioration of
quality. This was due partially to loss of soil fertility
and plantation aging, but more substantially by a
lack of producer organization18 and by loose
quality controls.
Tea has historically been the second most
important export crop after coffee. The sector
employs 53,000 workers directly and is a source of
revenue for over one million people (Republic of
Rwanda, 2011c). The country’s tea industry is
robust, benefiting from favorable climatic
conditions and good soil quality. Over 90 per cent of
Rwandan tea production is exported. Roughly
three-quarters of the entire Rwandan tea
production is sold at the Mombasa tea auction,19
while the remaining part is sold directly to private
customers; the selling price in Mombasa serves as a
reference for setting prices to private clients. Export
destinations for tea are the United Kingdom for
“prime” grade tea, Egypt and Pakistan for medium
grades, and South Africa, Sudan, and Yemen for
lower grades.
Since the early 2000s, the coffee and tea sectors
have undergone significant transformations, with a
focus on increased production and productivity, and
on the penetration of markets for higher-value
products. As regards coffee, Rwanda has made
significant progress from standard or ordinary-
grade coffee to specialty coffee production. Prior to
2001, Rwanda was unknown on the specialty coffee
market; its coffee exports essentially consisted of
bulk commercial grades sold at a discount from
US$0.10 to US$0.20 per pound below the prevailing
New York Commodity Exchanges “C” market price.
By 2006, Rwanda had turned into a specialty coffee
origin that supplied specialty roasters and large
retail chains in the United States and Europe
(USAID, 2006). The amount of specialty (fully-
washed) coffee increased from 1 to 20 per cent of
production from 2002 to 2007 (Republic of Rwanda,
2008b). In 2006, specialty coffee was sold by Coffee
Washing Stations (CWS) at a premium of 45 cents
per pound over the New York “C” price. By 2007,
Rwandan-branded coffees were a standard
Starbucks offering in Europe and the Middle East
(Republic of Rwanda, 2008b).
The tea sector has similarly re-oriented towards
highquality and niche tea markets – branded tea,
highquality tea, and diversified tea. In particular,
Rwanda is gradually pursuing a migration from bulk
CTC (crush, tear, curl) black tea, the majority of
which is sold at auction, to targeted sales of higher-
value products (orthodox teas, which attract a
premium of up to 75 per cent over CTC tea, green
teas, and blended and packaged teas), sold over the
counter directly to buyers with whom strong
relationships have been built (Republic of Rwanda,
2008a).

The Strategic Journal of Business & Change Management. ISSN 2312-9492 (Online) 2414-8970 (Print).
www.strategicjournals.com
Page: 1056
Table 3: Performance in Rwanda’s formal exports
2016 2017 2018 2019 2020
I. Share of exports Traditional products 48.5 50.7 45.7 38.8 29.4
Export crops 21.4 15.7 15.4 19.7 16.4 Coffee 10.3 7.8 8.3 9.1 7.9
Tea 11.1 7.9 7.2 10.6 8.5 Minerals 23.0 32.1 28.1 17.2 11.6
Cassiterite 9.0 8.7 9.9 5.0 4.7 Coltan 9.6 19.1 14.5 9.7 5.3 Wolfram 4.4 4.3 3.7 2.5 1.6
Others 4.1 2.8 2.2 1.9 1.5 Other products 33.2 30.1 31.4 35.2 40.5
Informal cross border exports 17.2 15.6 14.9 15.8 16.4
Reexports 18.3 19.2 22.9 26.0 30.1 II. Change in value
Traditional products -5.1 24.2 -7.1 -19.8 -17.4 Export crops -8.6 -12.8 1.0 20.7 -9.4
Coffee -18.4 -9.8 8.7 4.0 -5.7
Tea 2.9 -15.6 -6.7 40.0 -12.5 Minerals -10.1 65.9 -9.9 -42.1 -26.6
Cassiterite -45.4 15.5 17.8 -52.4 1.6 Coltan 47.5 136.5 -22.1 -36.8 -40.0 Wolfram 63.9 14.4 -11.5 -34.8 -31.5
Others 98.6 -17.0 -19.7 -19.9 -15.9 Other products 56.9 8.1 7.1 6.0 25.3
Informal cross border exports 42.5 7.4 -1.7 0.8 12.6 Reexports 189.8 25.0 22.5 7.6 26.1 Total 27.3 19.0 2.9 -5.5 9.0
III. Change in volume Traditional products 4.8 6.8 -3.5 0.5 -5.5
Export crops 0.3 3.9 -5.8 12.5 -1.0
Coffee 89 17.7 -20.1 17.7 -0.8 Tea -5.4 -6.4 7.9 8.9 -1.1
Minerals -14.9 27.2 9.3 -30.5 -10.2 Cassiterite -33.3 5.6 21.6 -35.4 -7.7 Coltan 28.6 115.4 -6.6 -28.3 -23.1
Wolfram 74.0 26.7 -0.2 -19.4 -3.8 Source: NISR, World Bank staff calculations
Empirical Evidence on the Impact of Economic
Integration
Empirical studies of economic integration can be
divided into partial equilibrium analyses,
computable general equilibrium (CGE) models and
econometric studies. Although not without their
detractors, computable general equilibrium
approaches are generally preferable because of the
way they attempt to capture the complex
interaction between and within sectors to the
stimulus of trade liberalisation measures. In a
partial equilibrium setting, such interactions on
relative prices and factor utilization between
sectors are lost. Hence in this brief review we will
focus firstly on econometric studies, and then on
computable general equilibrium studies.
The Strategic Journal of Business & Change Management. ISSN 2312-9492 (Online) 2414-8970 (Print).
www.strategicjournals.com
Page: 1057
Econometric studies of trade liberalization have
focused on the extent to which trade liberalisation
has affected economic growth, exports and import
flows, and the trade balance. Most initial studies
resoundingly endorsed trade liberalisation as a way
of enhancing economic growth and development.
Wacziarg and Welch (2003) studied the relationship
between economic integration and economic
growth, over the period 1950-1998 and found that
countries that liberalized trade regimes experienced
on average an increase in annual rates of growth
1.5 percentage points higher compared to the pre-
liberalisation period. The post-liberalisation
increase in investment was between 1.5 and 2.5
percentage points and that liberalisation raised the
trade to GDP ratio on average by five percentage
points. Felbermayr (2005) used a dynamic Panel
Data model to test for evidence of a Trade-Income
relationship and found a strong positive effect of
openness on income growth. Emiko Fukase (2010)
analyzed the relationship between openness,
education and economic growth using a series of
panel data techniques, using data for 106 countries
over the period 1969 to 2004 and found that trade
openness had had a positive effect on economic
growth.
On the other hand, Rodriguez and Rodrik (2000)
reviewed a number of empirical studies, including
Dollar (1992), Ben-David (1993), Sachs and Warner
(1995), and Edwards (1998), and they found no
evidence of a robust positive relationship between
open trade policies and economic growth.
SantosPaulino and Thirlwall,(2004) estimated the
effect of trade liberalisation on export growth,
import growth, the balance of trade and the
balance of payments for a sample of 22 developing
countries that had adopted trade liberalisation
policies since the mid-1970s. Although they found
that liberalisation stimulated export growth, it also
raised import growth by more, leading to a
worsening of the balance of trade and payments
which constrained the growth of output.
In contrast, Wu and Zeng (2008) studied the impact
of trade liberalisation on imports, exports, and
overall trade balance for developing countries and
found strong and consistent evidence that trade
liberalisation resulted in higher imports and
exports, but no robust evidence that liberalisation
had a negative impact on the trade balance. Among
the African-specific studies, Jones and Morrissey
(2008) studied the impact of liberalisation on
imports. They compared imports of liberalizing
countries to non-liberalizing countries in Africa and
found no evidence to suggest that imports
increased disproportionately after liberalisation.
Allaro (2012) examined the impact of trade
liberalisation on Ethiopia's trade balance using the
data over the period 1974 to 2009, and found that
trade liberalisation led to a worsening trade balance
as a result of a rapid increase in imports in Ethiopia.
How do these results compare with those
generated by CGE models? In the 1990s, CGE
models were used widely to estimate large welfare
gains from the trade liberalization achieved under
the Uruguay Round. The OECD, along with others,
predicted global welfare gains in the order of
US$200 billion, approximately a third of which
would accrue to developing countries. In hindsight,
however, it appears that these estimates were
excessively optimistic.. According to subsequent
estimates, 70 per cent of the gains from the
Uruguay Round would go to the developed
countries; more importantly, the remaining 30 per
cent would be captured by few large export-
oriented developing countries. Indeed, the 48
leastdeveloped countries (LDCs) could be worse off
by some US$600 million a year within the first six
years of the Uruguay Round (1995–2001), with SSA
worse off by US$1.2 billion (UNDP, 1997, cited by
Charlton and Stiglitz, 2005, p. 47).
Using the GTAP 6.0 CGE trade model, Fosu and
Mold (2008) simulate a complete global
liberalization scenario to measure the distribution
of gains across countries. The global welfare gains
amounted to only US$94 billion or a mere 0.3 per
cent of world GDP. However, the gains for SSA are
even smaller - the estimated welfare gain of
US$259 million is equivalent to only 0.08 per cent of
The Strategic Journal of Business & Change Management. ISSN 2312-9492 (Online) 2414-8970 (Print).
www.strategicjournals.com
Page: 1058
SSA GDP. In per capita terms, this represents a
welfare gain for SSA equivalent to 36 cents per
capita on a one-off basis. Moreover, even these
results hinge on the inclusion of South Africa within
the group of 12 SSA regions. Excluding South Africa,
the welfare result is a loss for SSA of US$579
million. The conclusion is that SSA stands to gain
relatively little from any further global trade
liberalization
Recent Macroeconomic Developments
Growth in 2016 slowed down to around 6 percent,
reflecting the need to address growing external
imbalances through fiscal restraint and greater
exchange rate flexibility. This was further magnified
by supply shocks due to drought, and the weak
prices for Rwandan exports throughout 2016. In the
first quarter of 2017, growth further performance in
agriculture and construction. The key outcomes of
2016 and the first quarter of 2017 include the
reversal of growing external imbalances and
maintaining single-digit inflation amid food price
shocks and a sizable exchange rate depreciation.
With respect to the economy’s production side, the
growth in all key economic sectors slowed down.
Agriculture grew by 3.9 percent in 2016 compared
to 5 percent in 2015 largely reflecting unfavourable
weather conditions. In the first quarter of 2017, the
growth in agriculture further slowed down to 2.6
percent. Growth in the industrial activities slowed
to 6.8 percent in 2016 from 8.9 percent in 2015,
reflecting weaker performance in construction
sector. In the first quarter of 2017, manufacturing
and mining maintained their annualized growth rate
at 6.8 and 7.7 percent respectively, while
construction contracted by 0.2 percent following
the completion of large investment projects in
2016. Growth in services slowed down from 10.4
percent in 2015 to 7.4 percent in 2016 on the back
of relatively weak growth in private consumption.
The annualized growth rate in services in the first
quarter of 2017 was 6 percent.
On the demand side, Rwanda saw a slowdown in
growth rates of both consumption and investments
in 2016. Growth in private consumption slowed as a
result of depreciation of the exchange rate, while
the government largely maintained the rate of
growth in public consumption of recent years.
Investment growth also slowed down, mostly as a
result of slow growth in public investments as part
of authorities’ adjustment program and fiscal
restraint for 2016 and 2017. In this context, the
developments in 2016 and in the first months
of 2017 illustrated the large extent to which the
growth in Rwanda depends on public investments.
With respect to net exports, the volume growth in
exports outperformed import growth but the trade
balance continued to widen in 2015, albeit slower
than in 2015. Data from the first quarter of 2017,
however, indicate that the widening trend of
external imbalances has been already reversed.
In terms of prices, Rwanda experienced inflationary
pressures from multiple sources in 2016, including
the supply shock from the drought that affected
East Africa and the Horn, and the pass-through
from exchange rate depreciation. Inflation,
historically at low single digits, increased to 7.3
percent at the end of 2016 further climbing to 8.1
percent in February 2017 before slowing down to
4.8 percent in June 2017. Food prices that grew by
double digits were the main drivers of high inflation
registered in Rwanda between July 2016 and May
2017. Rural areas were more vulnerable to price
pressures than urban areas because of a larger
share of food items in the consumption basket.
The environment for monetary and fiscal policies in
2016 and in the first months of 2017 was affected
by several factors including weaker global and
regional growth, inflationary pressures, and the
need for external adjustment stemming from
widening external imbalances in previous years. The
policy response consisted of a greater exchange
rate flexibility that resulted in about 10 percent
depreciation in 2016, fiscal restraint largely through
controlling capital expenditures, and maintaining a
stable monetary policy rate throughout most of
2016. These policies, supported by a new IMF
program launched in mid-2016, helped to slow
down the widening of external imbalances and

The Strategic Journal of Business & Change Management. ISSN 2312-9492 (Online) 2414-8970 (Print).
www.strategicjournals.com
Page: 1059
return to a path of foreign exchange reserve
accumulation.
Export prices for commodities recovered partly in
the first quarter of 2017 helping traditional exports
to somewhat reverse the negative trend of recent
years. Performance of non-traditional exports
remained strong in 2016 and in the first quarter of
2017. Tourism continued to perform strongly, both
in 2016 and in the first quarter of 2017. As for
imports, the growth rate in 2016 was subdued as
part of the adjustment program while food imports
remained strong, on the back of food shortages as a
result of the drought.
Productivity and Structural Transformation
Patterns
The growth slowdown of 2016 and 2017 driven by
the drought, weak export prices and fiscal restraint
to address growing external imbalances can be seen
as a temporary phenomenon. At the same time,
long-term productivity patterns examined in this
report point to several factors that, if not
addressed, may depress Rwanda’s growth
potential.
Structural transformation, characterised by an
inter-sectoral movement of labour from subsistence
agriculture mostly to the service sector, has been
the main driver of growth since the early 2000s. The
growth in productivity within economic sectors
played a smaller role. Service sector has contributed
to the growth in productivity as it absorbed labor
from agriculture and most of the entrants to the job
market. Within-sector productivity growth in non-
tradable services was not high, highlighting the
limits of these services in driving the long-term
growth. While manufacturing sector demonstrated
high productivity growth in recent years, it
attracted a negligible fraction of the total increase
in the labour force. Creating enabling environment
for a greater labour absorption capacity in
manufacturing, coupled with an improved
productivity in agriculture, will be key for sustaining
growth in the medium to long-term.
With respect to the patterns in total factor
productivity (TFP), it appears that TFP growth has
slowed recently with capital accumulation
becoming the main driver of growth. In this context,
the surge in public investment of 2013- 2015 helped
to maintain a high growth rate. The recent
slowdown underscores the dependence of the
economy on government-led investment. There is
only limited scope to further increase public
investment as it can lead to debt accumulation and
thus cannot be sustainable in long-term. This
highlights the importance of the more efficient use
of available investment resources to underpin
strong TFP and, ultimately, economic growth. For
the private investment, evidence points that
allocation of capital investment to housing, hotels
and restaurants where the expected payoffs are yet
to materialise could be one of the factors behind
the slowdown in TFP growth. Going forward,
creating conditions that encourage the private
sector to channel investment resources to the
tradable sector where the potential for productivity
growth is high will be key for sustaining a high
growth rate in long run.
Macroeconomic Outlook and Risks
The impact of fiscal restraint and supply shocks will
be felt throughout 2017. As agriculture recovers
during the year growth may be higher than in the
first quarter of 2017 but still well below the
historical average of around eight percent per
annum. Tapering food price shock and a lower
inflation would allow monetary policy to become
more accommodative. The fiscal policy stance in the
second half of 2017 will also be more expansionary.
However, persistent external imbalances and
elevated public debt will constrain the use of
macroeconomic instruments in the medium term.
In macroeconomic management, the authorities
will be guided by the need to maintain adequate
foreign exchange reserves and maintain Rwanda’s
status of low risk of debt distress.
Returning to a higher growth trajectory in 2018 is
attainable, although there are risks. In the medium
term, economic activity will benefit from the

The Strategic Journal of Business & Change Management. ISSN 2312-9492 (Online) 2414-8970 (Print).
www.strategicjournals.com
Page: 1060
expected recovery of prices of traditional exports,
including minerals, tea, and coffee. A more
competitive exchange rate will support the non-
traditional tradable activities under the “Made in
Rwanda” initiative. On balance, the outlook in
agriculture is positive, although adverse climatic
events pose risks. Overall, medium to long term
outlook will depend on the extent to which the
private sector will move to invest in the tradable
sectors with higher growth and productivity
potential. Other risks to growth are associated with
weak external environment, regional tensions, and
regional security outlook.
Analysis of Export Sector Performance
From a very low base, Rwanda’s exports have
increased four-fold in the last decade from just
US$400 million in 2007 to US$1.6 billion in 2016.
Rwanda’s exports are more diversified with the
growth of services, re-exports and small-scale cross-
border trade. Exports to the region, and especially
to the DRC and to the EAC countries, mainly as re-
exports and through small-scale cross-border trade
contributed the bulk of export growth for Rwanda.
However, non-tariff barriers including cumbersome
customs procedures, export bans and roadblocks
continue to impede the growth of intra-regional
trade.
Traditional agricultural exports – tea, coffee, and
minerals – are still important export earners but
overall performance has been mixed in recent
years. Traditional exports currently generate less
than half of the total exports earnings, while a
decade ago Rwanda’s exports exclusively consisted
of these traditional goods. Export volumes of coffee
have been stagnant while the volume of tea
production has nearly doubled, although with
muted economic impact given low value addition.
Declining prices and low production of traditional
minerals has also substantially affected export
earnings.
Non-traditional merchandise exports have emerged
in Rwanda, offsetting mixed performance of
traditional sectors. Other minerals, agriculture, and
manufacturing, that generated only US$4 million in
2004 reached US$155 million in 2016. Re-exports
and small-scale exports mainly to DRC and to the
EAC region also made a substantial contribution to
export growth. Although re-exports do not generate
substantial value added and jobs, they enable local
clusters of economic activity that can be built upon.
Services exports are concentrated in traditional
sectors of tourism and transport but exports in
high-productivity ICT and financial services have
started. Continued efforts to diversity tourism
products will help to reduce the risk of over-
dependence on traditional tourism which currently
accounts for 29 percent of total exports.
Firm-level analysis of exporters in Rwanda reveals
that the number of exporters has increased but the
size of exporting firms is smaller than those in
regional peer countries. Exports are concentrated in
a few exporters but such concentration is similar to
the levels found in countries with the same level of
development. Rwandan exporting firms are on
average less diversified, both in terms of the
number of exported products as well as the number
of destination markets. Over 50 percent of
exporting firms export only a single product to a
single destination. The majority of firms serve only
the regional-market (EAC and DRC) and the average
value of exports per exporter to regional markets is
much smaller than that of firms who export to the
rest of the world.
The challenges of small exporting firms are survival
and growth in the export markets. There is a high
degree of churning of firms with high entry and exit
rates. Exporting firms that import intermediate
inputs are on average more diversified in terms of
both export product as well as destinations than
pure exporters.
This emphasizes the need for continued efforts to
reduce barriers to imports and improve trade
logistics. For Rwanda, facilitating imports of inputs,
including through effective management of
exchange rate policy, is a key element in promoting
export diversification. The analysis also reveals that
growth of exports is driven by incumbent firms that

The Strategic Journal of Business & Change Management. ISSN 2312-9492 (Online) 2414-8970 (Print).
www.strategicjournals.com
Page: 1061
have managed to proceed past the initial survival
stage. This suggests that measures that assist new
exporters to survive will have longer-term pay-offs
in terms of greater export growth.
Table 4: Rwanda selected macroeconomic indicators
2016 2017 2018 2019 2020
(Annual percentage change, unless otherwise indicated) GDP growth rate 8.8 4.7 7.6 8.9 5.9
Agriculture 6.5 3.3 6.6 5.0 3.9 Industry 8.4 9.3 11.0 8.9 6.8 Services 11.6 5.2 7.0 10.4 7.1
Consumer price index End of period 3.9 3.6 2.1 4.5 7.3
Period average 6.3 4.2 1.8 2.5 5.7 Money and credit
Broad money (M3) 34.8 11.1 19.6 30.0 7.8
Credit to the private sector 14.1 15.6 19.0 21.1 7.5 Policy rate (end of period) 7.5 7.0 6.5 6.5 6.3
Exchange rate (Rwf/US$) End of period 631.4 670.1 694.4 747.4 819.8 Period average 614.3 646.7 682.8 720.0 787.8
General government budget1 (Percent of GDP, unless otherwise indicated)
Revenue and grants 25.3 23.5 25.8 25.0 24.5 Total revenue 14.3 15.7 16.6 17.7 18.5
Total grants 11.0 7.8 9.1 7.3 5.9 Total expenditure and net lending 26.5 28.4 29.7 29.9 27.9
Current expenditure 14.8 13.5 15.0 14.7 15.1 Capital expenditure 11.6 12.0 13.7 13.6 11.5 Net lending 0.0 2.9 1.0 1.6 1.4
Overall deficit Including grants -1.5 -5.2 -4.2 -4.8 -3.9
Excluding grants -12.5 -13.0 -13.4 -12.2 -9.8 Financing 1.4 5.2 4.2 4.8 3.9
Foreign financing 2.3 7.2 2.0 3.3 3.6
Domestic financing -0.9 -2.0 2.2 1.5 0.3 External sector
Goods exports (goods and services) 15.1 16.8 16.4 18.4 19.0 Goods imports (goods and services) 32.6 32.1 33.2 35.6 37.0 Current account balance -10.2 -7.3 -11.8 -13.4 -14.4
Gross international reserves (million US$) 850.3 1,070.0 950.8 922.3 1,001.5 Source: NISR, World Bank staff calculation
Obstacles and Challenges facing TFTA:
Although there are noticeable potential of the new
TFTA, there are also numbers of obstacles or
challenges need to be faced in order to achieve
these potentials. Those obstacles could be
summarized as follow:
First: the three RECs are at different stages of
integration in the way that may influence the
negotiation process. COMESA launched a free trade
area in 2000 and a custom union in 2009. And
parallel to negotiation of TFTA, there is still an
ongoing negotiations process within the COMESA in
joining the free trade area and the custom union 6 .
The members of COMESA agreed on a list of
6 Uganda and Ethiopia agreed to join COMESA free trade area only in December 2014.

The Strategic Journal of Business & Change Management. ISSN 2312-9492 (Online) 2414-8970 (Print).
www.strategicjournals.com
Page: 1062
sensitive products where current tariff rates are
determined as common external tariff within a
transition period of three years can be extended
with additional two years. EAC was established in
2000. In 2005 EAC members Tanzania, Kenya, and
Uganda formed a custom union transformed in
2010 to a common market. Rwanda and Burundi
who joined EAC in 2007 are also parts of the custom
union and common market since 2009. SADC was
formed in 1992. In 2008 a free trade area was
established including the southern African Custom
Union SACU members who allow tariff free imports
from other SADC members. The agreement is based
on minimum conditions where full trade
liberalization is only provided on 85% of intra trade
within SADC (Riedel, 2014).
Second: the existence of trade barriers, especially
non-tariff barriers, as a consequence of inadequate
implementation of agreed commitments within the
three RECs. This could undermine the gain that
could be delivered from existing and future
intraregional trade areas. Beside those barriers
there are also the restrictive rules of origin which
are applied in each REC that hinder cross border
trade. Such rules have been manipulated to achieve
protectionist objectives and promote rent seeking
behaviour rather than those of preventing trade
deflection. Restrictive rules of origin discourage
competitiveness investment in regional value added
activities such as textile and clothing and agro
processing sectors. The rules of origin for COMESA
and EAC are almost the same as they are based on
the general value added rule of 35% for local
contents (with some exceptions in the case of
COMESA) 7 or cost, insurance and freight (c.i.f)
value rule of 60% of costs of imported production
material. Some member countries applied different
rules of origin, for example Egypt applies high rate
of 45% value added rue on local materials. SADC
rules of origin are significantly different and more
complicated than those applied in the other two
7 COMESA has an exception for goods of particular importance,
requiring only a minimum of 25% of imported manufacturing materials.
RECs. SADC adopted “made-to-measure” product-
specific rules of origin which uses a variety of
methods for determining eligibility (Kalenga, 2013).
According to (Brenton, 2004), SADC rules of origin
are complex and not supportive to enhance intra-
regional trade and competitiveness.
The rules of origin are not the only non-tariff
barriers in those RECs. Kenya for example imposes
stringent technical regulations on sugar imports
affecting sugar exports from Mauritius; Zimbabwe
facing difficulties in exporting milk products to
Zambia due to difficulties in obtaining import
permits; and milk trade between Kenya and Zambia
being affected by non-tariff barriers prevalence. In a
study conducted by (World Bank, 2011), the non-
tariff barriers reduce SADC intra trade by about 3.3
billion USD.
Third: there is also the problem of high
transportation cost and inadequate infrastructure
that limited the potential gains of this agreement.
This is beside the inefficient administrative
procedures at border crossing, and other costs
incurred within domestic policy and regulatory
environments that are considered as the most
important constraint to Intra-African trade.
Forth: the problem of dual membership that
affecting the potentials of trade agreements within
and between the three RECs. Such overlapping
membership is considered as one of the main
factors that inhibited the full potential of their
ability to stimulate intra-regional trade. The region
of TFTA has the most regional integration initiatives
in Africa, including the East African Community
(EAC), the intergovernmental Authority on
Development (IGAD), the Common Market for
Eastern and Southern Africa (COMESA), the
Southern African Development Community (SADC),
the Southern African Custom Union (SACU) and the
Indian Ocean Commission (IOC). The legal and
institutional situation became more complicated
knowing that COMESA, EAC and SADC’s integration
goals and strategies are similar, and in particular,
they are all operating under different rules of origin

The Strategic Journal of Business & Change Management. ISSN 2312-9492 (Online) 2414-8970 (Print).
www.strategicjournals.com
Page: 1063
and trade instruments, countering the objectives of
facilitating and simplifying trade(Kalenga, 2013).
METHODOLOGY
Dominant models of economic growth assume that
growth requires the accumulation of physical
capital, human capital, and increases in the
productivity of these factors of production.
However to this day we do not fully know what
exactly constitutes or determines productivity.
Hausmann and Hidalgo (2011) introduce the idea
that the productivity of a country can be
understood by looking at the ubiquity and
complexity of the goods that it is able to produce.
To observe what countries produce the authors use
international trade data compiled by the United
Nations (Comtrade). Their analysis of the data over
a long time period shows that as countries grow,
they diversify their export baskets. That is, rather
than abandoning what they made in the past,
countries continue to add new products to their
export mix. In general, developed economies export
a wide range of products while developing
countries export only a few. Moreover, developed
countries tend to export products that are relatively
complex and rare (made by few other countries)
while developing countries tend to export products
that are relatively simple and ubiquitous (made by
many countries).
Econometric model
The empirical model for studying the influence of
trade agreements on services export flows is the
gravity model. This model was originally applied by
Tinbergen (1962) in the context of international
trade. However, it was not founded on economic
theory. As a result, theory-consistent gravity models
have been developed over time.
Starting with Anderson (1979) and Bergstrand
(1985) who used the concepts of Constant Elasticity
of Substitution (CES) and product differentiation to
derive models in which bilateral trade flows rely on
transport costs and income. The gravity model was
later based on inter alia monopolistic competition
(Anderson and Van Wincoop, 2003), Hecksher-Ohlin
theory (Deardorff, 1998), Ricardian theory (Eaton et
al., 2002), and heterogenous firm theory (Chaney,
2008; Helpman et al., 2008).
Our model took note of these improvements.
Particularly, incorporation of multilateral resistance
terms by Anderson and Van Wincoop (2003). The
baseline model is presented in equation 1 as
follows:
𝛾
𝑒
Where T𝑎𝑏 represents value of trade flows
between country a and b. 𝑎 is the GDP of country
a (exporter) and 𝑏 is the GDP for country b
(importer). 𝑎𝑏 is the distance between the two
countries. 𝛾, 𝛼, 𝛽 𝑎𝑛𝑑 𝜃 are parameters to be
estimated. 𝑍𝑎𝑏,𝑡 includes additional covariates
(time zone differences, common language, common
currency, contiguity, Preferential Trade Agreement
(PTA), Free Trade Agreement (FTA), Customs Union
(CU), and Common Market (CM)) together with
multilateral resistance terms. 휀𝑎𝑏 is the error term.
Log-linearizing equation 1 leads to:
𝑙𝑛 𝑙𝑛𝛾 𝛼𝑙𝑛 𝛽𝑙𝑛 𝛿𝑙𝑛 𝜃𝑍
𝑙𝑛휀
Equation 2 is an OLS model. As proved by Silva and
Tenreyro (2006; 2011), this equation has two major
problems. First, it omits zero bilateral trade values
upon log-linearization. This is because the natural
logarithim of zero is undefined. Second, the error
term tends to be heteroscedastic which leads to
biased estimates. Therefore, Silva and Tenreyro
(2006; 2011) propose the PPML approach as a
remedy.
PPML approach assumes a non-negative integer or
count dependent variable (trade flows) (Cameron
and Trivedi, 2005). It is presented as follows:
[ (𝑙𝑛𝛾 𝛼𝑙𝑛 𝛽𝑙𝑛 𝛿𝑙𝑛 𝜃𝑍
𝑙𝑛휀 )]
Where 𝑎𝑏 = [1, 𝑙𝑛 𝑎, 𝑙𝑛 𝑏,𝐼𝑛 𝑎𝑏, 𝑍𝑎𝑏].
Parameters 𝑙𝑛𝛾, 𝛼, 𝛽, δ 𝑎𝑛𝑑 𝜃 are obtained by
running a poisson regression model of services
exports (total and categories) on 𝑎𝑏. The trade
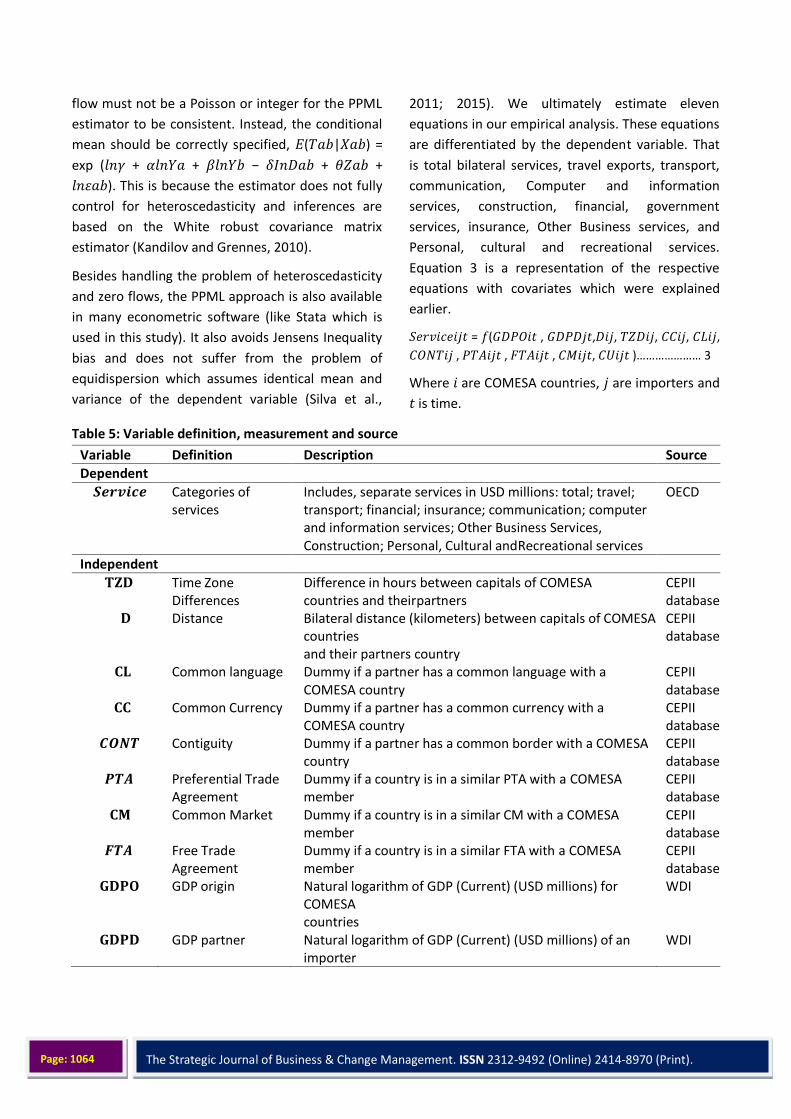
The Strategic Journal of Business & Change Management. ISSN 2312-9492 (Online) 2414-8970 (Print).
www.strategicjournals.com
Page: 1064
flow must not be a Poisson or integer for the PPML
estimator to be consistent. Instead, the conditional
mean should be correctly specified, 𝐸( 𝑎𝑏| 𝑎𝑏) =
exp (𝑙𝑛𝛾 + 𝛼𝑙𝑛 𝑎 + 𝛽𝑙𝑛 𝑏 − 𝛿𝐼𝑛 𝑎𝑏 + 𝜃𝑍𝑎𝑏 +
𝑙𝑛휀𝑎𝑏). This is because the estimator does not fully
control for heteroscedasticity and inferences are
based on the White robust covariance matrix
estimator (Kandilov and Grennes, 2010).
Besides handling the problem of heteroscedasticity
and zero flows, the PPML approach is also available
in many econometric software (like Stata which is
used in this study). It also avoids Jensens Inequality
bias and does not suffer from the problem of
equidispersion which assumes identical mean and
variance of the dependent variable (Silva et al.,
2011; 2015). We ultimately estimate eleven
equations in our empirical analysis. These equations
are differentiated by the dependent variable. That
is total bilateral services, travel exports, transport,
communication, Computer and information
services, construction, financial, government
services, insurance, Other Business services, and
Personal, cultural and recreational services.
Equation 3 is a representation of the respective
equations with covariates which were explained
earlier.
𝑆𝑒𝑟𝑣𝑖𝑐𝑒𝑖𝑗𝑡 = 𝑓(𝐺 𝑃𝑂𝑖𝑡 , 𝐺 𝑃 𝑗𝑡, 𝑖𝑗, 𝑍 𝑖𝑗, 𝐶𝐶𝑖𝑗, 𝐶𝐿𝑖𝑗,
𝐶𝑂𝑁 𝑖𝑗 , 𝑃 𝐴𝑖𝑗𝑡 , 𝐹 𝐴𝑖𝑗𝑡 , 𝐶𝑀𝑖𝑗𝑡, 𝐶𝑈𝑖𝑗𝑡 )………………… 3
Where 𝑖 are COMESA countries, 𝑗 are importers and
𝑡 is time.
Table 5: Variable definition, measurement and source
Variable Definition Description Source
Dependent
𝑺𝒆𝒓𝒗𝒊𝒄𝒆 Categories of services
Includes, separate services in USD millions: total; travel; transport; financial; insurance; communication; computer and information services; Other Business Services, Construction; Personal, Cultural and Recreational services
OECD
Independent
𝐓𝐙𝐃 Time Zone Differences
Difference in hours between capitals of COMESA countries and their partners
CEPII database
𝐃 Distance Bilateral distance (kilometers) between capitals of COMESA countries and their partners country
CEPII database
𝐂𝐋 Common language Dummy if a partner has a common language with a COMESA country
CEPII database
𝐂𝐂 Common Currency Dummy if a partner has a common currency with a COMESA country
CEPII database
𝑪𝑶𝑵𝑻 Contiguity Dummy if a partner has a common border with a COMESA country
CEPII database
𝑷𝑻𝑨 Preferential Trade Agreement
Dummy if a country is in a similar PTA with a COMESA member
CEPII database
𝐂𝐌 Common Market Dummy if a country is in a similar CM with a COMESA member
CEPII database
𝑭𝑻𝑨 Free Trade Agreement
Dummy if a country is in a similar FTA with a COMESA member
CEPII database
𝐆𝐃𝐏𝐎 GDP origin Natural logarithm of GDP (Current) (USD millions) for COMESA countries
WDI
𝐆𝐃𝐏𝐃 GDP partner Natural logarithm of GDP (Current) (USD millions) of an importer
WDI
The Strategic Journal of Business & Change Management. ISSN 2312-9492 (Online) 2414-8970 (Print).
www.strategicjournals.com
Page: 1065
Model specification
Usually econometric models of exports focus on the
demand side, with two main explanatory variables:
the level of external demand, with a positive effect
on exports, and the relative price of the country in
relation with the external market. Our approach
includes other relevant variables such as the level of
GDP of the country as a variable that represents the
supply side and has a positive effect, the level of
private consumption of the country, as a variable
that represents internal demand and has a negative
effect on exports, and a variable related with the
educational level of the population, as a measure of
the changes in quality of production and
organisation.
The variables included in Model 1 are the following:
EXP90it= Exports of goods and services of country i
in year t, in billions of dollars at the price levels and
exchange rates of 2000.
DEXTit = External Demand, measured by the sum of
the real value of GDP in the other 24 OECD
countries in year t, in B$90.
GDP90it = Internal Supply, measured by the real
value of GDP in country i and year t, in B$90.
IPRit = Index of Prices Ratio, measured by the ratio
between the external index of prices of exports of
each country and the external index of exports of
the USA.
TYRit/TYRUt = ratio between the average years of
schooling of adult population of each country in
comparison with the corresponding value of this
variable in the USA. This variable is an indicator of
relative quality of production and socio-economic
organisation.
The Index of prices ratio is measured by the ratio
between the index of external prices of exports of
each country, IPEXX, and that variable in the USA:
(1) IPRit =IPEXXit/IPEXXUt
The index of external prices of exports of a country
is the ratio between the index of internal prices of
exports, IPINX, and the index of the exchange rate,
the index of the exchange rate being the ratio
between the exchange rate in year t, ERit, and the
same variable in the base year. The base year is
1990 in this case.
(2) IPEXXit = IPINXit / IERit, where IERit = ERit/Erio
As the exchange rate is in units of currency in each
country by US$, the variable IER is equal to unity for
the USA and in that country the index of external
prices is equal to the index of internal prices.
Relation (2) has an important role in explaining the
international variations of the exchange rate, as
shown in several models such as those analysed in
Guisan(2003). Model 1 is a dynamic log-linear
model, expressed in the form of a mixed dynamic
model, including among the explanatory variables,
besides the lagged value of the dependent variable,
the increases in the natural logarithms of DEXT,
GDP90, and IPR, as well as the indicator of changes
in quality, measured by the educational distance in
relation with the USA.

The Strategic Journal of Business & Change Management. ISSN 2312-9492 (Online) 2414-8970 (Print).
www.strategicjournals.com
Page: 1066
RESULTS FROM REVIEWS
Dependent Variable: LOG(EXP90?)
Method: Least Squares
Date: 15/09/21 Time: 13:35
Sample: 1995Q1 2006Q4
Included observations: 47
Variable Coefficient Std. Error t-Statistic Prob.
LOG(EXP90?) 0.272108 0.036629 7.428806 0.0000
C 3.667400 0.121038 30.29951 0.0000
R-squared 0.550841 Mean dependent var 4.557891
Adjusted R-squared 0.540859 S.D. dependent var 0.169738
S.E. of regression 0.115014 Akaike info criterion -1.445896
Sum squared resid 0.595275 Schwarz criterion -1.367167
Log likelihood 35.97856 Hannan-Quinn criter. -1.416270
F-statistic 55.18715 Durbin-Watson stat 0.864319
Prob(F-statistic) 0.000000
The model performs very well: the goodness of fit is
high, all the coefficients are significantly different
from zero and have the adequate signs, and the
lagged value of the explained variable has a
coefficient near one. The hypothesis of
homogeneity of parameters between individual
countries is tested in Guisan(2003) with satisfactory
results, and the model shows good forecasting
accuracy as we shall see in the next section, where
we compare this model with other interesting
models of foreign trade, in relation with predictive
capacity.
Export Growth Decomposition
The change in aggregate Rwanda export between
year 𝑡 𝑘 and year t, 𝐸 can be decomposed into
the change due to increases or decreases in export
at the existing exporting firms (i.e., intensive
margin), the increase due to entry of new exporting
firms, and the decrease in the due to the exit of
existing exporters.
𝐸 ∑ 𝐸 ∑𝐸 ∑𝐸
Where 𝐸 is the change in Rwanda export
between year t-k and year t, C is the set of
continuing exporters that are active in export
markets in both t-k and t, E is the set of entering
exporters that are active in export markets in t but
not in t-k, and X is the set of exiting exporters that
are active in export markets in t-k but not in t.
The change in exports shipped by continuing
exporters can be further decomposed into new
destinations, dropped destinations, and continuing
destinations. The decomposition of export growth
of continuing firms along the destination
dimension.
∑ 𝐸 ∑ 𝐸 ∑ 𝐸 ∑ 𝐸
where 𝐸 is the growth in exports of
continuing exporters in Rwanda between t-k and t,
CD is the set of continued destinations that are
The Strategic Journal of Business & Change Management. ISSN 2312-9492 (Online) 2414-8970 (Print).
www.strategicjournals.com
Page: 1067
served in both t-k and t, XD is the set of new
destinations that are served in t but not in t-k, and
XD is the set of dropped destinations that are
served in t-k but not in t.
Finally, the exports of continuing firms in their
continued destinations along the product
dimension can be decomposed as:
∑ 𝐸 ∑ 𝐸 ∑ 𝐸 ∑ 𝐸
Where 𝐸
is the growth in exports of continuing exporters in
their continued destinations t and t-k, CP is the set
of continued HSs 4-digit products that are exported
in both t-k and t, EP is the set of new products that
are exported in t but not in t-k, and XP is the set of
dropped products that are exported in t-k but not in
t.
We now test for the determinants of productivity
among manufacturing firms in Rwanda. Here we
use the standard Cobb-Douglas production function
which assumes constant returns to scale and
diminishing returns to capital and labor (where α
and β lie between 0 and 1) and can be specified as:
Y = Kα Lβ
Where Y is output (value added), K is capital
(replacement cost of capital) and L is labor
(number of employees). Taking logarithms on
both sides, we get:
log Y = α log K + β log L
If we subtract log L from both sides, we get:
log Y – log L = α log K + β log L - log L
Let us assume that α + β = 1 + θ. If θ =
0, then we have constant returns to
scale, if θ > 0, we have increasing
returns to scale and if θ < 0, then
diminishing returns to scale.
Using this assumption, we can rewrite the
equation above as:
log (Y/L) = α log
K + (β-1) log L
substituting (β-1) as (θ-α), this equation can be
further rewritten as:
log (Y/L) = α log
(K/L) + θ log L
which states that log output per worker is a
function of log capital per worker and log
employment. The co-efficient for the
employment variable will give us estimates on
returns to scale.
Regressing this equation will give us:
log (Y/L) = α1 +
α2 log (K/L)i +
α3 log Li + ui
where the error term ui captures total factor
productivity. We now assume that TFP is
dependent on various firm characteristics like
location, firm age, worker’s and manager’s
education levels etc. and plug these variables into
the production function and estimate using a
linear regression method with robust standard
errors. The equation can be specified as:
lvadl = α1 + α2 lkli + α3 lemp + α4 anyfori + α5
firmagei + α6 kigalii + α7 mgmalei + α8
mgeduci + α9 avgeduci + α10 crediti + α11 solei +
α12 exporti + εi
The coefficients on the various dummies
can be interpreted as effects on total
factor productivity (see table 6), provided
the residual εi is uncorrelated with the
independent variables.

The Strategic Journal of Business & Change Management. ISSN 2312-9492 (Online) 2414-8970 (Print).
www.strategicjournals.com
Page: 1068
Table 6: Results of the productivity estimation (Manufacturing firms)
lvadl Coef. Std. Err. t P>t
lkl 0.3425 0.0758 4.52 0.00
lemp -0.0639 0.1709 -0.37 0.71
mgeduc 0.0050 0.3465 0.01 0.99
avgeduc 0.0198 0.0406 0.49 0.63
firmage -0.0142 0.0153 -0.93 0.36
mgmale 0.4490 0.4842 0.93 0.36
kigali 0.9527 0.4119 2.31 0.02
export 0.7309 0.5496 1.33 0.19
anyfor 1.2600 0.4803 2.62 0.01
sole 0.1421 0.4041 0.35 0.73
credit 0.2818 0.3456 0.82 0.42
Source: Data Computation
Four important findings come out of this
estimation. Firstly, firms with any foreign
ownership are 3.5 times more productive than
Rwandan owned firms. Foreign firms may bring
with them a higher skill set as well as knowledge
about the market which gives them an advantage
over their counterparts. This finding suggests that
encouraging FDI in the manufacturing sector in
Rwanda can be quite beneficial.
Secondly, firms located in Kigali City are 2.6 times
more productive than those located anywhere else
in the country. Being located in the capital city
gives firms more access to skilled employees, better
infrastructure, and access to information. As per
the Business and Investment Climate Survey (2008)
businesses in Kigali report an easier time recruiting
and training personnel than do businesses in other
parts of the country.
Thirdly, firms who export are twice more productive
than non-exporters, however this result is only
significant at the 20% level. This obviously begs the
question - do firms raise their productivity by
exporting or do more productive firms export? The
answer is often difficult to empirically determine
and the Learning to Compete project in Rwanda has
a separate paper dedicated to this question. For
now, we know that there might be productivity
differences between exporters and non-exporters in
Rwanda.
Lastly, we find no evidence of increasing returns to
scale among manufacturing firms in Rwanda. At
present, the data does not allow us to test for
increasing returns to scale in different sub-sectors in
the manufacturing sector (e.g., agro-processing, light
manufacturing etc.). What probably explains the
better performance of large firms in Rwanda is their
high stock of capital per worker and their propensity
to be foreign owned and exporters.
Exports Estimation
As per the Rwanda Industrial Survey, only 14% of
firms exported in the year 2019. Exports play a
central role in achieving the medium- and long-term
economic goals of Rwanda ($900 per capita income
by 2020). As mentioned in the previous section,
Rwanda is at present a net importer and depends on
volatile commodity products like tea, coffee, and
minerals for the majority of its product-based export
revenues. The following are the reasons cited by
firms for not being able to export in 2019.
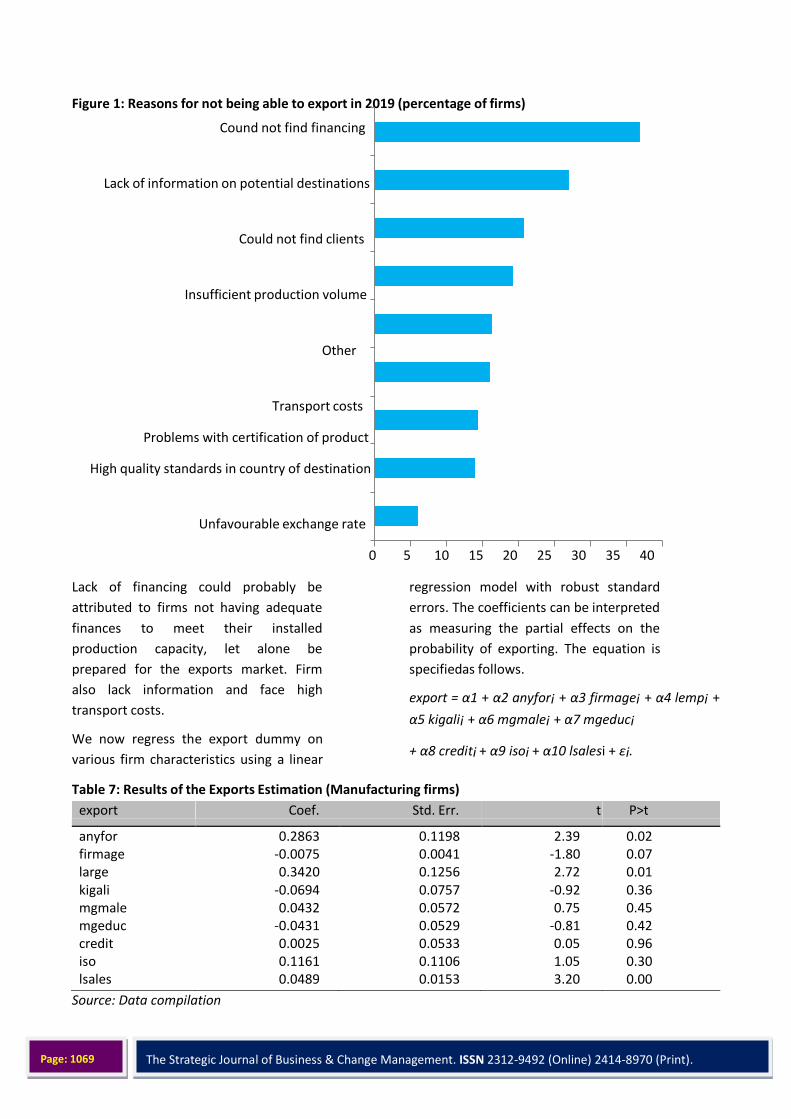
The Strategic Journal of Business & Change Management. ISSN 2312-9492 (Online) 2414-8970 (Print).
www.strategicjournals.com
Page: 1069
Figure 1: Reasons for not being able to export in 2019 (percentage of firms)
Cound not find financing
Lack of information on potential destinations
Could not find clients
Insufficient production volume
Other
Transport costs
Problems with certification of product
High quality standards in country of destination
Unfavourable exchange rate
0 5 10 15 20 25 30 35 40
Lack of financing could probably be
attributed to firms not having adequate
finances to meet their installed
production capacity, let alone be
prepared for the exports market. Firm
also lack information and face high
transport costs.
We now regress the export dummy on
various firm characteristics using a linear
regression model with robust standard
errors. The coefficients can be interpreted
as measuring the partial effects on the
probability of exporting. The equation is
specified as follows.
export = α1 + α2 anyfori + α3 firmagei + α4 lempi +
α5 kigalii + α6 mgmalei + α7 mgeduci
+ α8 crediti + α9 isoi + α10 lsalesi + εi.
Table 7: Results of the Exports Estimation (Manufacturing firms)
export Coef. Std. Err. t P>t
anyfor 0.2863 0.1198 2.39 0.02 firmage -0.0075 0.0041 -1.80 0.07 large 0.3420 0.1256 2.72 0.01 kigali -0.0694 0.0757 -0.92 0.36 mgmale 0.0432 0.0572 0.75 0.45 mgeduc -0.0431 0.0529 -0.81 0.42 credit 0.0025 0.0533 0.05 0.96 iso 0.1161 0.1106 1.05 0.30 lsales 0.0489 0.0153 3.20 0.00
Source: Data compilation
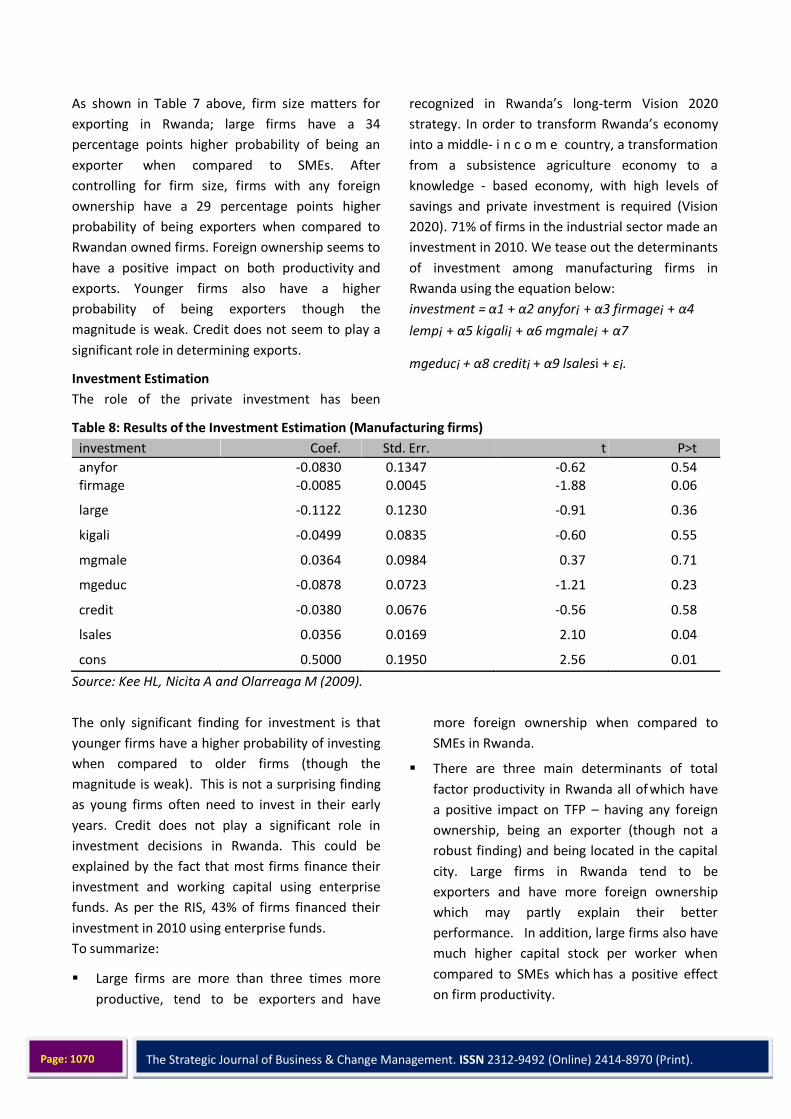
The Strategic Journal of Business & Change Management. ISSN 2312-9492 (Online) 2414-8970 (Print).
www.strategicjournals.com
Page: 1070
As shown in Table 7 above, firm size matters for
exporting in Rwanda; large firms have a 34
percentage points higher probability of being an
exporter when compared to SMEs. After
controlling for firm size, firms with any foreign
ownership have a 29 percentage points higher
probability of being exporters when compared to
Rwandan owned firms. Foreign ownership seems to
have a positive impact on both productivity and
exports. Younger firms also have a higher
probability of being exporters though the
magnitude is weak. Credit does not seem to play a
significant role in determining exports.
Investment Estimation
The role of the private investment has been
recognized in Rwanda’s long-term Vision 2020
strategy. In order to transform Rwanda’s economy
into a middle- i n c o m e country, a transformation
from a subsistence agriculture economy to a
knowledge - based economy, with high levels of
savings and private investment is required (Vision
2020). 71% of firms in the industrial sector made an
investment in 2010. We tease out the determinants
of investment among manufacturing firms in
Rwanda using the equation below:
investment = α1 + α2 anyfori + α3 firmagei + α4
lempi + α5 kigalii + α6 mgmalei + α7
mgeduci + α8 crediti + α9 lsalesi + εi.
Table 8: Results of the Investment Estimation (Manufacturing firms)
investment Coef. Std. Err. t P>t
anyfor -0.0830 0.1347 -0.62 0.54 firmage -0.0085 0.0045 -1.88 0.06
large -0.1122 0.1230 -0.91 0.36
kigali -0.0499 0.0835 -0.60 0.55
mgmale 0.0364 0.0984 0.37 0.71
mgeduc -0.0878 0.0723 -1.21 0.23
credit -0.0380 0.0676 -0.56 0.58
lsales 0.0356 0.0169 2.10 0.04
cons 0.5000 0.1950 2.56 0.01
Source: Kee HL, Nicita A and Olarreaga M (2009).
The only significant finding for investment is that
younger firms have a higher probability of investing
when compared to older firms (though the
magnitude is weak). This is not a surprising finding
as young firms often need to invest in their early
years. Credit does not play a significant role in
investment decisions in Rwanda. This could be
explained by the fact that most firms finance their
investment and working capital using enterprise
funds. As per the RIS, 43% of firms financed their
investment in 2010 using enterprise funds.
To summarize:
Large firms are more than three times more
productive, tend to be exporters and have
more foreign ownership when compared to
SMEs in Rwanda.
There are three main determinants of total
factor productivity in Rwanda all of which have
a positive impact on TFP – having any foreign
ownership, being an exporter (though not a
robust finding) and being located in the capital
city. Large firms in Rwanda tend to be
exporters and have more foreign ownership
which may partly explain their better
performance. In addition, large firms also have
much higher capital stock per worker when
compared to SMEs which has a positive effect
on firm productivity.
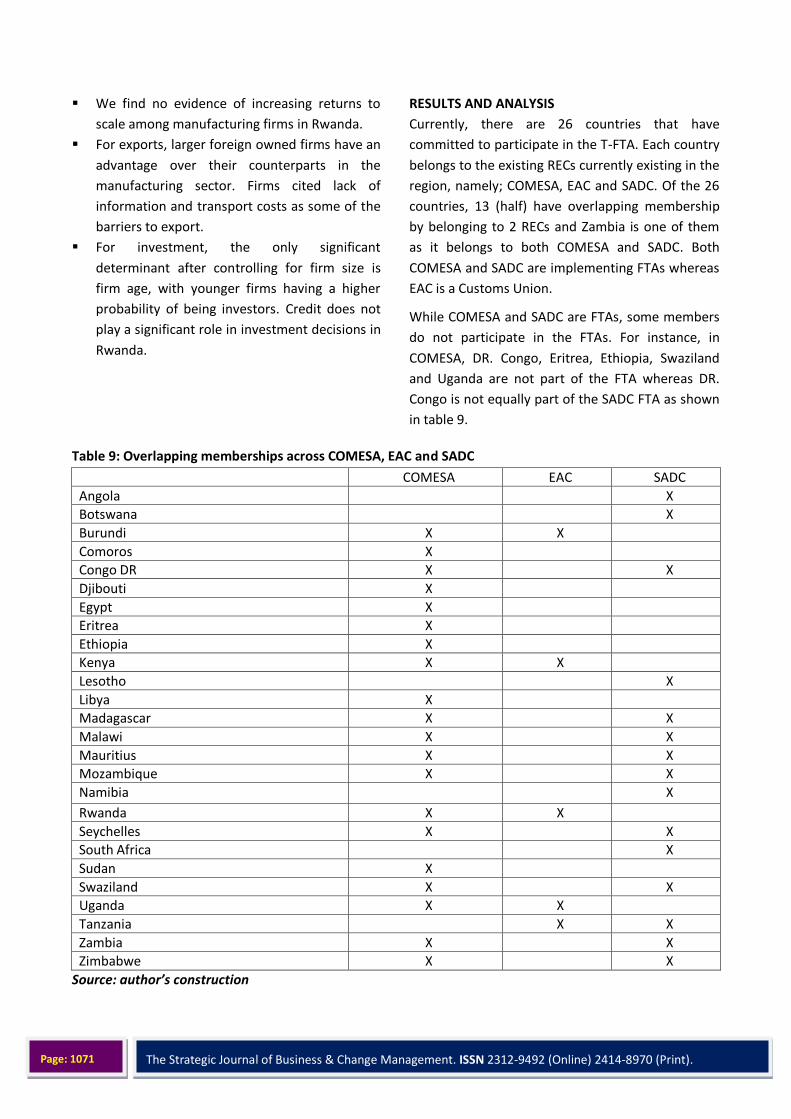
The Strategic Journal of Business & Change Management. ISSN 2312-9492 (Online) 2414-8970 (Print).
www.strategicjournals.com
Page: 1071
We find no evidence of increasing returns to
scale among manufacturing firms in Rwanda.
For exports, larger foreign owned firms have an
advantage over their counterparts in the
manufacturing sector. Firms cited lack of
information and transport costs as some of the
barriers to export.
For investment, the only significant
determinant after controlling for firm size is
firm age, with younger firms having a higher
probability of being investors. Credit does not
play a significant role in investment decisions in
Rwanda.
RESULTS AND ANALYSIS
Currently, there are 26 countries that have
committed to participate in the T-FTA. Each country
belongs to the existing RECs currently existing in the
region, namely; COMESA, EAC and SADC. Of the 26
countries, 13 (half) have overlapping membership
by belonging to 2 RECs and Zambia is one of them
as it belongs to both COMESA and SADC. Both
COMESA and SADC are implementing FTAs whereas
EAC is a Customs Union.
While COMESA and SADC are FTAs, some members
do not participate in the FTAs. For instance, in
COMESA, DR. Congo, Eritrea, Ethiopia, Swaziland
and Uganda are not part of the FTA whereas DR.
Congo is not equally part of the SADC FTA as shown
in table 9.
Table 9: Overlapping memberships across COMESA, EAC and SADC
COMESA EAC SADC
Angola X
Botswana X
Burundi X X
Comoros X
Congo DR X X
Djibouti X
Egypt X
Eritrea X
Ethiopia X
Kenya X X
Lesotho X
Libya X
Madagascar X X
Malawi X X
Mauritius X X
Mozambique X X
Namibia X
Rwanda X X
Seychelles X X
South Africa X
Sudan X
Swaziland X X
Uganda X X
Tanzania X X
Zambia X X
Zimbabwe X X
Source: author’s construction

The Strategic Journal of Business & Change Management. ISSN 2312-9492 (Online) 2414-8970 (Print).
www.strategicjournals.com
Page: 1072
NOTE: COMESA (19) countries include: Burundi,
Comoros, Congo, Dem Rep., Djibouti, Egypt, Eritrea,
Ethiopia, Kenya, Libya, Madagascar, Malawi,
Mauritius, Rwanda, Seychelles, Sudan, Swaziland,
Uganda, Zambia, and Zimbabwe.
Rwanda has become the fifth country to ratify the
tripartite Free Trade Area Agreement (TFTA).
Members of the Lower House of the Rwanda
Parliament approved the draft law for the
ratification of the agreement on Wednesday, July
10, 2019. The TFTA was launched on 15 June 2015
in Egypt by the Common Market for Eastern and
Southern Africa (COMESA), the East African
Community (EAC), and the Southern African
Development Community (SADC).
Based on the current membership in the 3 RECs, it
is clear that Rwanda is already trading with each of
the 26 countries envisaged to be members of the T-
FTA either through COMESA or SADC trade regimes.
Rwanda’s Formal External Trade in Goods
This section provides an overview of Rwanda’s total
trade in goods covering the period from first
quarter 2018 to the third quarter of 2020, on a
quarterly basis. In the third quarter of 2020,
Rwanda’s total trade was US$ 1486.45 million, an
increase of 27.53 percent over the third quarter of
2019 and an increase of 46.69 percent from US$
1013.36 million in the preceding quarter (second
quarter of 2020).
The latest available country-specific data from 2019
shows that 89.4% of products exported from
Rwanda were bought by importers in: the
Democratic Republic of Congo (32.1% of the global
total), United Arab Emirates (29.6%), Uganda
(5.3%), Switzerland (4.6%), Pakistan (3.4%), United
Kingdom (3.3%), Burundi (also 3.3%), Singapore
(2.6%), South Sudan (1.7%), Belgium (1.4%), United
States (1.1%) and Kenya (1%).
From a continental perspective, 46.5% of Rwanda’s
exports by value were delivered to fellow African
countries while 40.2% were sold to importers in
Asia. Rwanda shipped another 12% worth of goods
to Europe.
Smaller percentages went to North America (1.2%),
Oceania’s New Zealand and Australia (0.1%), and
Latin America excluding Mexico but including the
Caribbean (0.02%). Given Rwanda’s population of
12.7 million people, its total $335.7 million in 2020
exports translates to roughly $30 for every resident
in the Central African nation.
Figure 2 below summarizes the balance of Rwanda’s
formal trade in goods. Year-over-year, the deficit on
traded goods decreased by 2.52 percent, from the
same period in 2019. Total imports of goods
constitute 65.82 percent of total trade in goods
(US$ 978.31 million), while domestic exports
constituted 28.85 percent (US$ 428.78 million) and
re-exports constituted 5.34 percent (US$ 79.36
million).
Figure 2: Value of Rwanda's Formal External Trade in Goods, 2018Q1-2020Q3
Source: NISR with raw data from RRA/Customs Department

The Strategic Journal of Business & Change Management. ISSN 2312-9492 (Online) 2414-8970 (Print).
www.strategicjournals.com
Page: 1073
Compared to the second quarter of 2020, the third
quarter of 2020 registered an increase in values of
97.40 percent, with total domestic exports
estimated at US$ 428.78 million. Year over-year,
domestic exports’ values increased also by 93.68
percent compared to the same quarter of 2019.
Trade Partners
Rwanda’s key destination markets of exports during
the third quarter of 2020 were the United Arab
Emirates (US$ 297.09 million, 62.29 percent share),
Turkey (US$ 29.02 million, 6.77 percent share), the
Democratic Republic of Congo (US$ 26.82 million,
6.26 percent share), United Kingdom (US$ 7.90
million, 1.84 percent share) and United States of
America (US$ 7.82 million, 1.82 percent share).
Together, these five countries accounted for US$
368.66 million; that is 85.98 percent share of total
value of domestic exports. Figure 2 summarizes
these figures from quarter one of 2018 up to the
third quarter of 2020
Figure 3: Rwanda’s key export partners, 2018Q1-2020Q3
Source: NISR with raw data from RRA/Customs Department
East African Community Partner States
In the third quarter of 2020, Rwanda’s domestic
exports to the East African Community Partner
States was estimated at US$ 11.77 million, around 3
percent of total domestic exports value see
appendix 6.8b. Of these, about 56.35 percent were
destined to Uganda (US$ 6.63 million). Domestic
exports’ values to EAC Partner States increased by
33.92 percent in comparison with the second
quarter of 2020 and by 90.03 percent when
compared to the same quarter of 2019. In terms of
exports to EAC partner states, Kenya stood at the
second place with domestic exports from Rwanda
valued at US$ 2.75 million.
Figure 4: Exports to EAC Partner States, 2018Q1-2020Q3
Source: NISR with raw data from RRA/Customs Department.

The Strategic Journal of Business & Change Management. ISSN 2312-9492 (Online) 2414-8970 (Print).
www.strategicjournals.com
Page: 1074
Trade with Selected Regional Economic
Organizations
At the more granular four-digit Harmonized Tariff
System code level, coffee represents Rwanda’s
most valuable exported product at 20.7% of the
country’s total. In second place was live bovine
cattle (16.8%) trailed by gold (16.1%), niobium and
zirconium ores or concentrates (13.5%), tin ores or
concentrates (6.2%), flour, meal, starch or malt
extract food preparations (2.1%), fresh or dried
flowers for bouquets or ornamental purposes
(1.7%), tungsten ores and concentrates (1.4%),
unwrought lead (1.3%) then vegetable saps and
extracts (also 1.3%).
In macroeconomic terms, Rwanda’s total exported
goods represent an estimated .01% of its overall
Gross Domestic Product for 2020 ($29.6 billion
valued in Purchasing Power Parity US dollars). That
0.01% for exports to overall GDP in PPP for 2020
compares to roughly 1% for 2019. Those
percentages suggest a relatively decreasing reliance
on products sold on international markets for
Rwanda’s total economic performance, albeit based
on very short timeframe. Another key indicator of a
country’s economic performance is its
unemployment rate. Rwanda’s unemployment rate
was 17% at January 2021, down from 13.1% at
January 2020 according to Trading Economics.
Common Market for Eastern and Southern Africa
During the third quarter of 2020, Rwanda’s total
trade with the Common Market for Eastern and
Southern Africa (COMESA) Member States was US$
296.54 million compared to US$ 251.47 million
registered in the same quarter of 2019 and US$
184.32 million registered in the second quarter of
2020. Exports to COMESA Member States increased
by 95.08 percent in 20209Q3 when compared to
the same quarter of 2019 and by 43.88 compared
to the second quarter of 2020. Imports from
COMESA Member States increased by 53.72
percent in 2020Q3 when compared to the same
quarter of 2019 and by 87.24 percent when
compared to the second quarter of 2020. On the re-
exports side, Rwanda registered revenues
estimated at US$ 77.94 million during the third
quarter of 2020 from COMESA Member States; a
decrease of 32.06 percent in value terms against
the same quarter of 2019 and an increase of 27.36
percent when compared to the second quarter of
2020. Thus, a deficit in trade balance of US$ 61.51
million has been registered during the 2020Q3
against a surplus of US$ 74.61 million during the
same quarter of 2019 and a decrease of US$ 6.91
million registered in the second quarter of 2020.
Communauté Economique des Pays de Grands Lacs
During the third quarter of 2020, total exports to
Communauté Economique des Pays de Grands Lacs
(CEPGL) Member States (Burundi and the
Democratic Republic of Congo), including re-
exports, totalized US$ 103.68 million and total
imports were US$ 2.84 million. Therefore, the trade
in goods surplus with CEPGL member states totaled
US$ 100.84 million compared to US$ 92.93 million
registered in the same quarter of 2019 and to US$
76.13 million in the second quarter of 2020.
Economic Community of West African States
(ECOWAS)
During the third quarter of 2020, total exports to
the Economic Community of West African States
(ECOWAS) Member Countries, including re-exports,
totalized US$ 0.14 million and the total imports
were US$ 36.98 million. Therefore, the trade in
goods deficit with ECOWAS Member States
extended to US$ 36.84 million from the deficit of
US$ 18.64 million in the same quarter of 2019.
Southern African Development Community
Rwanda’s total trade with the Southern African
Development Community (SADC) Member States
totaled US$ 378.69 million during the third quarter
of 2020 compared to US$ 243.83 million in the third
quarter of 2019 and US$ 214.83 million during the
first quarter of 2020. Year-over-year, domestic
exports to the SADC increased by 63.24 percent,
from 17.75 US$ million in the third quarter of 2019
to US$ 28.98 million in the third quarter of 2020;
while total imports increased by about 85.40
The Strategic Journal of Business & Change Management. ISSN 2312-9492 (Online) 2414-8970 (Print).
www.strategicjournals.com
Page: 1075
percent, from US$ 147.00 million to US$ 272.53
million.
Over the same period, re-exports decreased by 2.39
percent, from US$ 79.08 million to 77.19 US$
million. Therefore, the trade in goods deficit with
SADC totaled US$ 166.36 million compared to a
deficit of US$ 50.16 million during the same quarter
of 2019 and to a deficit of US$ 28.20 million in the
second quarter of 2020.
CONCLUSIONS AND RECOMMENDATIONS
The paper identified three key constraints to export
diversification and intra-industry trade in Africa.
First, while African countries have a comparative
advantage on primary commodities (including
agricultural products), the average tariff barriers
faced by African exports of agricultural are quite
high. In addition, African LDCs impose very high
tariffs on their imports of intermediate goods which
are crucial for the expansion of intra-industry trade
and export diversification in Africa.
Second, we find that Africa encounters higher
average tariff rates on goods traded within the
continent than when exported to the rest of the
world.
Third, constraints in trade in services are less
pronounced. These constraints need to be
addressed in a systematic manner, ensuring that
efforts towards boosting export diversification and
intra-industry trade in Africa is undeterred.
As stated at the beginning of this report, the aim of
the study was to investigate intra-industry trade
and export diversification in the PTA/COMESA sub-
region. There is no doubt that the tripartite FTA
provides enormous opportunities for regional
development through deeper integration and
enhanced market access. From the results of the
data and information that has been analysed, it is
evident that the COMESA-EAC-SADC Tripartite FTA
will have a larger impact on Rwanda’s export
performance. In 2015 the member states of the
three major African RECs: COMESA, EAC and SADC
agreed on establishing a common TFTA which is
considered as an important milestone towards
Africa Continental trade integration. This paper
analyzes the impact of regional integration among
TFTA countries and evaluates the economic
potentials of this agreement.
Firstly, since Rwanda is already trading with all the
T-FTA countries, there is much increase in market
size for the countries in terms of population. This is
despite the inclusion of the countries that are not
yet fully participating in the current FTAs that
Rwanda is a member to.
Secondly, although there are great potentials
associated with TFTA for the whole region. The
gains from such agreement are not equally
distributed. South Africa and Egypt appears to be
the bigger winners of this agreement due to the
structural characteristics of their economy that
makes them able to achieve welfare gains from
African trade agreement within their region or
outside.
Thirdly, FTAs are observed to have the greatest
positive effect on exports of total, travel, transport,
government, communication, financial and Other
Business Services. The tripartite will lead to
increased exports and imports within the region as
a result of realignment of demand and supply
within the region, increased aggregate demand in
the region will result in increased industrial
production across the region as new firms join the
regional market. The distribution of changes in
production will vary between different countries
both within and between sectors.
Fourthly, results from the PPML estimator of the
gravity model indicate that whereas Free Trade
Area (FTA) agreements are likely to boost service
exports by COMESA members within the African
region, deeper trade agreements-where depth is
evaluated in terms of whether a trade agreement
has more provisions for member states and
guarantee lesser trade restictions- have the greater
effect on services exported. Deep trade agreements
include Common Markets and Customs Unions
The Strategic Journal of Business & Change Management. ISSN 2312-9492 (Online) 2414-8970 (Print).
www.strategicjournals.com
Page: 1076
whereas AfCFTA is an example of a Free Trade
Agreement.
Lastly, in terms of the linkages between intra-
industry trade and export diversification in the
African sample, we found that an increase in export
diversification is positively correlated to intra-
industry trade and vice versa.
The study recommended that in order to gain from
the T-FTA, Rwanda must position itself so as to
integrate and gain from the regional trade
opportunities that the T-FTA promises. Key
recommendations are that;
Rwanda must come up with a robust initiative
to address the supply side constraints facing
exporters in the country. Key is to work at
improving the economic supporting
infrastructures with the aim of improving the
country’s competitiveness.
Rwanda should develop strategies to move
towards improved industrialization and value
addition
Rwanda should reform its trade policy regime
and position itself in such a way that it will gain
from the T-FTA. The reforms should aim at
building a competitive export sector that can
utilize the regional opportunities. Other
objectives of the reforms should be to
mainstream trade in the whole national
development agenda in all sectors of the
economy.
Efforts to diversify exports should be stepped
up and the country must develop niches within
the region including services.
It should be better to note that the tripartite would
lead to increased exports and imports within the
region as a result of realignment of demand and
supply within the region, increased aggregate
demand in the region will result in increased
industrial production across the region as new firms
join the regional market. The distribution of
changes in production will vary between different
countries both within and between sectors.
REFERENCES
AFDB. (2016). African Regional Integration Report 2016. Addis Abbaba: African Development Bank.
Amiti, Mary, & Konings, Jozef (2007), Trade Liberalization, Intermediate Inputs, and Productivity: Boosting
Exports through intermediate goods.
Angwenyi, V. (2016). The Tripertite Free Trade Area: A Step Closer to the African Economic Community? In
M. B. (eds), European Yearbook of International Economic law. Switzerland: Springer International
Publishing.
Brenton et al (2011), Risky Business: Poor Women Cross-Border Traders in the Great Lakes Region of Africa.
World Bank.
Brenton, Cardot and Pierola (2012), Pathways to African Export Sustainability, World Bank.
Collier, P. (2012). Aid dependency: How can Rwanda move toward self-sustained growth in coming years.
International Growth Centre.
Dimaranan, B. a. (2008). The COMESA Customs Union: A Quantitative Assessment. GTAP 11th Annual
Conference. Helsinki.
EAC (2015), Status for the Elimination of Non-Tariff Barriers in the East Africa Community as of September
2015.
EAC (2014), Trade Report.
Fernandes, Freund and Pierola (2015), Exporter Behavior, Country Size and Stage of Development Evidence
from the Exporter Dynamics Database.

The Strategic Journal of Business & Change Management. ISSN 2312-9492 (Online) 2414-8970 (Print).
www.strategicjournals.com
Page: 1077
Gathani, S., & Stoelinga, D. (2012). Understanding Rwanda’s Export Sectors. International Growth Centre
working paper.
GoR, (2016), AGOA Implementation Plan.
GoR, (2015), BNR Foreign Private Capital in Rwanda.
GoR, BNR (2017), Monetary Policy and Financial Stability Statement (2017).
GoR, MINICOFIN, Rwanda Annual Economic Report, 2014/2015.
GoR, NAEB Annual Report 2014-2015.
GoR, Nation Cross-Border Strategy (2011-2017).
GoR, National Export Strategy II.
GoR, National strategy for the Elimination of Non-Tariff Barriers (2011).
GoR, Private Sector Development Strategy (2013-2018).
Hallren, R. a. (2017). An Introduction of Prtial Equilibrium Modelling of Trade Policy (Vols. Working Paper
201707B). Washington, DC.: International Trade Commission.
Hausmann, R., & Hidalgo, C. a. (2011). The network structure of economic output. Journal of Economic
Growth, 16(4), 309–342. doi:10.1007/s10887-011-9071-4
Hausmann, R., Hidalgo, C., Bustos, S., Coscia, M., Chung, S., Jimenez, J., Simoes, A., et al. (2011). Atlas of
Economic Complexity. Cambridge, MA: Puritan Press.
Hidalgo, C. (2011). Discovering Southern and East Africa’s Industrial Opportunities.
Hidalgo, C. A., Klinger, B., Barabási, A.-L., & Hausmann, R. (2007). The Product Space Conditions the
Development of Nations. Science, 317(5837), 482–487.
Hausmann, Ricardo, Dani Rodrik, and Andrés Velasco. "Growth diagnostics." The Washington consensus
reconsidered: Towards a new global governance (2008): 324-355.
IGC, Raising Exports and Attracting FDI in Rwanda (2016).
ITC, Rwanda: Company Perspectives – An Itc Series on Non-Tariff Measures 2014.
Jensen, H. G. (2011). The TRipartite Free TRade Agreemnet: A Computer Anaysis of the Impact. In R. a.
Sandrey, Cape to Cairo An Assessment of the Tripartite Free Trade Area. Stellenbosch, South Africa:
Trade Law Center for Southern Africa.
Kalenga, P. (2013). Making the Tripartite FTA Work: Issues and Prospects. Trade Law Center.
Mevel, S. a. (2012). Deeping Regional Integration in Africa: A Computable General Equilibrium Assessment of
the Establishment of Continental Free Trade Area followed by a Continental Customs Union. 7th
African Economic Conference. Kigali.
Mold, A. a. (2016). Modelling the Economic Impact of the Tripartite Free Trade Area: Its Implications for the
Economic Geography of Southern, Eastern and Northern Africa. Journal of African Trade (3), 5784.
Oloruntoba, S. O. (2017). Breaking the Incubus? The Tripartite Free Trade Agreements and the Prospects of
Developmental Integration in Africa. In J. O. O. Akanle, The Development of Africa. Springer
International Publishing.

The Strategic Journal of Business & Change Management. ISSN 2312-9492 (Online) 2414-8970 (Print).
www.strategicjournals.com
Page: 1078
Petros, S. (2011). Towards a COMESA, EAC and SADC Tripartite Free Trade Area. Harare, Zimbabwe: Trades
Centre.
Pierola and Freund, The Origins and Dynamics of Export Superstars (2016).
Riedel, J. a. (2014). The Trade Potential of the COMESAEACSADC Tripartite: A Comparitive Analysis.
Willenbockel, D. (2014). An ExAnte General Equilibrium Analysis of the COMESA EAC SADC Tripartite Free
Trade Agreement. International Conference on Economic Modeling. Bali.
World Bank. (2011). Harnessing Regional Integration for Trade and Growth in Sub-Saharan Africa.
Washington DC: World Bank.
World Bank, Rwanda Agriculture Sector Risk Assessment (2015).
World Bank, Rwanda Economic Update, Leveraging Regional Integration (2012).
World Bank, Rwanda Jobs and Employment Study (2015).
World Bank, Africa's Pulse: An analysis of issues shaping Africa's economic future (2016).
APPENDICES
Appendix 1: Summary of External Merchandise Trade, 2019Q1 – 2020Q3
Value: US$ Million Shares in percentages 2019Q1 2019Q2 2019Q3 2019Q4 2020Q1 2020Q2 2020Q3 2019Q
1 2019Q 2019Q
3 2019Q4
2020Q1
2020Q2 2020Q3
Exports of goods 227.13 268.28 341.61 328.69 290.20 279.86 508.13 24.27 26.53 29.31 26.92 24.05 27.62 34.18
Domestic exports 142.47 179.03 221.38 241.36 207.95 217.21 428.78 15.22 17.70 18.99 19.77 17.23 21.43 28.85
Re-exports 84.66 89.24 120.23 87.33 82.25 62.65 79.36 9.05 8.82 10.32 7.15 6.82 6.18 5.34
Imports of goods 708.67 743.12 823.94 892.38 916.68 733.50 978.31 75.73 73.47 70.69 73.08 75.95 72.38 65.82
A. Total Exports (f.o.b.)
227.13 268.28 341.61 328.69 290.20 279.86 508.13
B. Total Imports (c.i.f.) 708.67 743.12 823.94 892.38 916.68 733.50 978.31
Total Value of Trade (A+B)
935.80
1,011.39
1,165.56 1,221.07
1,206.89
1,013.36 1,486.45
100.00 100.00 100.00 100.00 100.00 100.00 100.00
Balance of Trade (A-B) -481.54 -474.84 -482.33 -563.68 -626.48 -453.64 -470.18
Source: NISR with raw data from RRA/Customs
Appendix 2: Exported goods, 2019Q1 – 2020Q3 (Value: US$ Million) Year and Period 2019Q1 2019Q2 2019Q3 2019
Q4 2020Q1 2020Q2 2020Q3
SITC SECTION COMMODITY DESCRIPTION/ TOTAL ESTIMATES 142.47 179.03 221.38 241.36
207.95 217.21 428.78
0 Food and live animals 62.45 77.55 66.16 64.65
59.54 49.82 64.96
1 Beverages and tobacco 0.14 0.25 0.05 0.04 0.07 0.02 0.02
2 Crude materials, inedible, except fuels 39.49 34.72 22.02 26.18
24.59 18.06 23.75
3 Mineral fuels, lubricants and related materials 1.13 17.27 0.13 0.13 0.09 0.11 0.14
4 Animals and vegetable oils, fats & waxes 0.02 0.03 0.15 0.05 0.08 0.10 0.13
5 Chemicals & related products, n.e.s. 1.45 0.74 0.79 0.57 1.32 1.22 1.62
6 Manufactured goods classified chiefly by material
8.04 16.64 7.11 6.72 7.57 6.76 11.84
7 Machinery and transport equipment 3.95 5.00 2.07 2.24 4.74 1.80 2.27
8 Miscellaneous manufactured articles 2.39 3.45 4.05 4.91 2.76 2.26 7.02
9 Other commodities & transactions, n.e.s 23.37 23.37 118.84 135.87
107.19 137.06 317.01
Source: NISR with raw data from RRA/Custom

The Strategic Journal of Business & Change Management. ISSN 2312-9492 (Online) 2414-8970 (Print).
www.strategicjournals.com
Page: 1079
Appendix 3: Exported goods, shares in percentage 2019Q1- 2020Q3
Year and Period 2019Q1 2019Q2 2019Q3 2019Q4 2020Q1 2020Q2 2020Q3
SITC SECTION COMMODITY DESCRIPTION/ TOTAL ESTIMATES 100.00 100.00 100.00 100.00 100.00 100.00 100.00
0 Food and live animals 43.84 43.32 29.88 26.78 28.63 22.94 15.15
1 Beverages and tobacco 0.10 0.14 0.02 0.02 0.04 0.01 0.00
2 Crude materials, inedible, except fuels 27.72 19.39 9.95 10.85 11.83 8.31 5.54
3 Mineral fuels, lubricants and related materials 0.80 9.65 0.06 0.05 0.04 0.05 0.03
4 Animals and vegetable oils, fats & waxes 0.02 0.02 0.07 0.02 0.04 0.05 0.03
5 Chemicals & related products, n.e.s. 1.02 0.41 0.36 0.24 0.63 0.56 0.38
6 Manufactured goods classified chiefly by material 5.64 9.29 3.21 2.78 3.64 3.11 2.76
7 Machinery and transport equipment 2.77 2.79 0.93 0.93 2.28 0.83 0.53
8 Miscellaneous manufactured articles 1.68 1.93 1.83 2.04 1.33 1.04 1.64
9 Other commodities & transactions, n.e.s 16.41 13.06 53.68 56.29 51.55 63.10 73.93
Source: NISR with raw data from RRA/Customs
Appendix 4: Imported goods, 2019Q1- 2020Q3 (Value: US$ Million)
Year and Period 2019Q1 2019Q
2
2019Q
3
2019Q
4
2020Q1 2020Q
2
2020Q3
SITC SECTION COMMODITY DESCRIPTION/ TOTAL ESTIMATES
708.67 743.12 823.94 892.38 916.68 733.50 978.31
0 Food and live animals 89.96 81.99 98.90 120.66 108.51 97.37 104.58
1 Beverages and tobacco 6.42 6.95 6.95 6.75 6.60 4.42 4.47
2 Crude materials, inedible, except fuels 16.29 20.44 18.12 16.80 17.32 19.54 17.71
3 Mineral fuels, lubricants and related materials 127.18 134.89 143.28 127.07 149.14 76.08 61.35
4 Animals and vegetable oils, fats & waxes 31.56 28.17 19.33 22.47 33.97 23.02 26.68
5 Chemicals & related products, n.e.s. 95.37 80.83 93.00 85.62 108.94 77.75 104.17
6 Manufactured goods classified chiefly by material 125.08 127.75 138.11 145.96 132.92 103.42 170.91
7 Machinery and transport equipment 163.55 190.37 125.81 168.17 185.48 133.07 143.06
8 Miscellaneous manufactured articles 47.05 66.51 61.97 60.90 64.04 40.05 55.33
9 Other commodities & transactions, n.e.s 0.00 0.00 111.40 127.95 109.76 158.77 281.48
Source: NISR with raw data from RRA/Customs
Appendix 5: Imported goods, shares in percentage 2019Q1-2020Q3
Year and Period 2019Q1 2019Q
2
2019Q
3
2019Q
4
2020Q1 2020Q
2
2020Q3
SITC SECTION COMMODITY DESCRIPTION/ TOTAL ESTIMATES 100.00 100.00 100.00 100.00 100.00 100.00 100.00
0 Food and live animals 12.69 11.03 12.00 13.52 11.84 13.27 10.69
1 Beverages and tobacco 0.91 0.93 0.84 0.76 0.72 0.60 0.46
2 Crude materials, inedible, except fuels 2.30 2.75 2.20 1.88 1.89 2.66 1.81
3 Mineral fuels, lubricants and related materials 17.95 18.15 17.39 14.24 16.27 10.37 6.27
4 Animals and vegetable oils, fats & waxes 4.45 3.79 2.35 2.52 3.71 3.14 2.73
5 Chemicals & related products, n.e.s. 13.46 10.88 11.29 9.59 11.88 10.60 10.65
6 Manufactured goods classified chiefly by material 17.65 17.19 16.76 16.36 14.50 14.10 17.47

The Strategic Journal of Business & Change Management. ISSN 2312-9492 (Online) 2414-8970 (Print).
www.strategicjournals.com
Page: 1080
7 Machinery and transport equipment 23.08 25.62 15.27 18.85 20.23 18.14 14.62
8 Miscellaneous manufactured articles 6.64 8.95 7.52 6.82 6.99 5.46 5.66
9 Other commodities & transactions, n.e.s 0.00 0.00 13.52 14.34 11.97 21.65 28.77
Source: NISR with raw data from RRA/Customs
Appendix 6: Re-exported goods, 2019Q1- 2020Q3 (Value: US$ Million)
Year and Period 2019Q
1
2019Q
2
2019Q3 2019Q
4
2020Q
1
2020Q
2
2020Q3
SITC
SECTION
DESCRIPTION/ TOTAL ESTIMATES 84.66 89.24 120.23 87.33 82.25 62.65 79.36
0 Food and live animals 17.35 20.65 48.76 23.69 21.51 21.83 24.34
1 Beverages and tobacco 1.21 1.71 1.16 1.08 0.80 0.70 1.16
2 Crude materials, inedible, except fuels 5.36 4.32 5.06 4.08 3.69 3.68 6.03
3 Mineral fuels, lubricants and related materials 32.47 35.76 36.25 31.22 27.96 14.67 18.89
4 Animals and vegetable oils, fats & waxes 10.89 9.59 8.40 8.49 8.85 9.46 8.85
5 Chemicals & related products, n.e.s. 3.41 2.97 3.08 3.67 3.77 2.77 3.29
6 Manufactured goods classified chiefly by material 3.01 3.71 5.90 3.63 3.65 2.68 7.04
7 Machinery and transport equipment 7.56 7.30 8.11 7.05 8.25 4.54 4.77
8 Miscellaneous manufactured articles 3.27 3.16 3.34 4.08 3.77 2.33 4.49
9 Other commodities & transactions, n.e.s 0.00 0.00 0.00 0.00 0.00 0.00 0.00
Source: NISR with raw data from RRA/Customs
Appendix 7: Re-exported goods, shares in percentage 2019Q1- 2020Q3
Year and Period 2019Q
1
2019Q2 2019Q
3
2019Q4 2020Q
1
2020Q2 2020Q3
SITC SECTION DESCRIPTION/ TOTAL ESTIMATES
100.00 100.00 100.00 100.00 100.00 100.00 100.00
0 Food and live animals 20.49 23.14 40.56 27.13 26.16 34.84 30.67
1 Beverages and tobacco 1.43 1.92 0.97 1.23 0.97 1.11 1.46
2 Crude materials, inedible, except fuels 6.33 4.84 4.21 4.67 4.49 5.88 7.59
3 Mineral fuels, lubricants and related materials 38.35 40.07 30.15 35.75 33.99 23.42 23.80
4 Animals and vegetable oils, fats & waxes 12.86 10.75 6.99 9.72 10.76 15.10 11.15
5 Chemicals & related products, n.e.s. 4.03 3.33 2.56 4.20 4.59 4.43 4.14
6 Manufactured goods classified chiefly by
material 3.56 4.15 4.91 4.15 4.44 4.28 8.87
7 Machinery and transport equipment 8.93 8.18 6.74 8.08 10.03 7.24 6.02
8 Miscellaneous manufactured articles 3.86 3.54 2.78 4.67 4.59 3.72 5.66
9 Other commodities & transactions, n.e.s 0.00 0.00 0.00 0.00 0.00 0.00 0.00
Source: NISR with raw data from RRA/Customs
Appendix 8: Top twenty domestic exports partners, 2019Q1-2020Q3 (Value: US$ Million)
Year and Period 2019Q1 2019Q2 2019Q3 2019Q4 2020Q1 2020Q2 2020Q3
COUNTRY OF DESTINATION 142.47 179.03 221.38 241.36 207.95 217.21 428.78
United Arab Emirates 15.91 34.93 131.44 149.90 118.26 118.16 297.09
Turkey 0.20 0.23 0.28 0.17 0.23 25.79 29.02
Congo, The Democratic Republic Of 15.16 14.30 16.15 16.47 19.80 17.53 26.82

The Strategic Journal of Business & Change Management. ISSN 2312-9492 (Online) 2414-8970 (Print).
www.strategicjournals.com
Page: 1081
United Kingdom 5.78 8.13 13.01 10.66 4.47 5.43 7.90
United States 2.47 1.28 2.80 5.89 1.93 1.49 7.82
Uganda 6.02 21.95 0.27 0.40 5.47 4.47 6.63
Pakistan 10.19 10.18 9.90 9.01 10.87 9.39 6.49
Singapore 9.13 7.29 5.99 7.43 4.30 3.19 5.24
Belgium 2.30 2.40 4.65 5.20 3.57 3.23 4.74
China 6.32 0.96 6.67 1.12 1.58 0.85 4.08
India 1.33 1.46 1.86 2.00 1.46 1.64 3.75
Switzerland 18.32 9.44 7.32 8.62 3.21 2.45 3.21
Hong Kong 3.34 4.25 0.58 1.51 7.01 2.90 3.18
Netherlands 1.51 1.13 1.68 1.03 1.62 1.58 3.08
Kenya 13.02 6.64 0.62 0.39 0.97 1.76 2.75
Egypt 0.99 1.35 1.74 2.39 3.27 1.86 2.19
Kazakhstan 1.49 1.53 2.30 2.09 2.11 1.59 1.76
Tanzania, United Republic Of 0.36 0.96 1.02 1.11 0.43 0.65 1.60
Russian Federation 0.96 1.32 0.36 0.45 1.04 1.43 1.03
Malaysia 1.44 0.88 0.46 0.79 0.20 0.24 0.97
Source: NISR with raw data from RRA/Customs
Appendix 9: Top twenty domestic exports partners, shares in percentage, 2019Q1-2020Q3
Year and Period 2019Q1 2019Q2 2019Q3 2019Q4 2020Q1 2020Q2 2020Q3
COUNTRY OF DESTINATION 100.00 100.00 100.00 100.00 100.00 100.00 100.00
United Arab Emirates 11.17 19.51 59.37 62.11 56.87 54.40 69.29
Turkey 0.14 0.13 0.13 0.07 0.11 11.87 6.77
Congo, The Democratic Republic Of 10.64 7.99 7.30 6.82 9.52 8.07 6.26
United Kingdom 4.06 4.54 5.88 4.41 2.15 2.50 1.84
United States 1.74 0.71 1.27 2.44 0.93 0.68 1.82
Uganda 4.22 12.26 0.12 0.17 2.63 2.06 1.55
Pakistan 7.15 5.69 4.47 3.73 5.23 4.32 1.51
Singapore 6.41 4.07 2.71 3.08 2.07 1.47 1.22
Belgium 1.61 1.34 2.10 2.16 1.72 1.49 1.11
China 4.43 0.54 3.01 0.46 0.76 0.39 0.95
India 0.93 0.82 0.84 0.83 0.70 0.75 0.87
Switzerland 12.86 5.27 3.31 3.57 1.54 1.13 0.75
Hong Kong 2.34 2.38 0.26 0.63 3.37 1.34 0.74
Netherlands 1.06 0.63 0.76 0.43 0.78 0.73 0.72
Kenya 9.14 3.71 0.28 0.16 0.46 0.81 0.64
Egypt 0.70 0.75 0.79 0.99 1.57 0.86 0.51
Kazakhstan 1.05 0.85 1.04 0.87 1.01 0.73 0.41
Tanzania, United Republic Of 0.25 0.53 0.46 0.46 0.21 0.30 0.37
Russian Federation 0.68 0.74 0.16 0.19 0.50 0.66 0.24
Malaysia 1.01 0.49 0.21 0.33 0.09 0.11 0.23
Source: NISR with raw data from RRA/Customs
Appendix 10: Top twenty imports by country of origin, 2019Q1- 2020Q3 (Value: US$ Million)
Year and Period 2019Q1 2019Q2 2019Q3 2019Q4 2020Q1 2020Q2 2020Q3

The Strategic Journal of Business & Change Management. ISSN 2312-9492 (Online) 2414-8970 (Print).
www.strategicjournals.com
Page: 1082
COUNTRY OF ORIGIN 739.97 822.60 823.94 892.38 916.68 733.50 978.31
Tanzania, United Republic Of 36.97 54.61 72.87 104.16 59.49 67.49 213.34
China 148.74 140.62 154.76 183.93 200.38 115.39 165.06
Kenya 42.11 57.47 90.31 87.75 78.65 77.37 135.36
India 75.01 69.55 58.74 70.56 92.34 61.56 54.09
United Arab Emirates 54.32 62.56 61.11 66.51 87.52 41.17 49.05
South Africa 11.55 10.81 55.94 42.46 48.18 30.33 45.29
Burkina Faso 0.01 0.00 18.25 0.04 16.02 57.02 36.03
Cameroon 0.00 0.01 17.45 48.01 45.31 28.98 23.66
Egypt 6.83 6.29 10.02 14.63 9.02 8.58 22.22
Belgium 12.80 8.24 11.03 11.63 19.40 22.87 16.94
Russian Federation 7.54 3.91 12.76 12.39 5.63 11.85 16.88
United States 14.92 22.30 8.34 7.97 21.99 14.93 15.86
Switzerland 28.45 26.89 35.00 23.71 26.10 23.61 15.77
Indonesia 15.79 18.28 8.76 15.01 22.69 17.70 14.07
Germany 15.66 46.04 13.20 17.37 12.94 15.34 13.29
Turkey 16.05 37.35 7.97 13.65 12.62 11.78 13.10
Hong Kong 5.74 5.73 3.82 4.37 6.99 5.44 9.33
Japan 11.78 5.90 6.59 5.49 5.85 3.20 8.00
Pakistan 9.18 5.53 7.59 13.59 16.49 11.69 7.61
France 6.51 7.43 8.32 7.06 7.91 10.32 7.33
Source: NISR with raw data from RRA/Customs
Appendix 11: Top twenty imports by country of origin, shares in percentage 2019Q1-2020Q3
Year and Period 2019Q1 2019Q2 2019Q3 2019Q4 2020Q1 2020Q2 2020Q3
COUNTRY OF ORIGIN 100.00 100.00 100.00 100.00 100.00 100.00 100.00
Tanzania, United Republic Of 5.00 6.64 8.84 11.67 6.49 9.20 21.81
China 20.10 17.09 18.78 20.61 21.86 15.73 16.87
Kenya 5.69 6.99 10.96 9.83 8.58 10.55 13.84
India 10.14 8.45 7.13 7.91 10.07 8.39 5.53
United Arab Emirates 7.34 7.61 7.42 7.45 9.55 5.61 5.01
South Africa 1.56 1.31 6.79 4.76 5.26 4.13 4.63
Burkina Faso 0.00 0.00 2.21 0.00 1.75 7.77 3.68
Cameroon 0.00 0.00 2.12 5.38 4.94 3.95 2.42
Egypt 0.92 0.76 1.22 1.64 0.98 1.17 2.27
Belgium 1.73 1.00 1.34 1.30 2.12 3.12 1.73
Russian Federation 1.02 0.48 1.55 1.39 0.61 1.62 1.73
United States 2.02 2.71 1.01 0.89 2.40 2.04 1.62
Switzerland 3.84 3.27 4.25 2.66 2.85 3.22 1.61
Indonesia 2.13 2.22 1.06 1.68 2.47 2.41 1.44
Germany 2.12 5.60 1.60 1.95 1.41 2.09 1.36
Turkey 2.17 4.54 0.97 1.53 1.38 1.61 1.34
Hong Kong 0.78 0.70 0.46 0.49 0.76 0.74 0.95
Japan 1.59 0.72 0.80 0.62 0.64 0.44 0.82
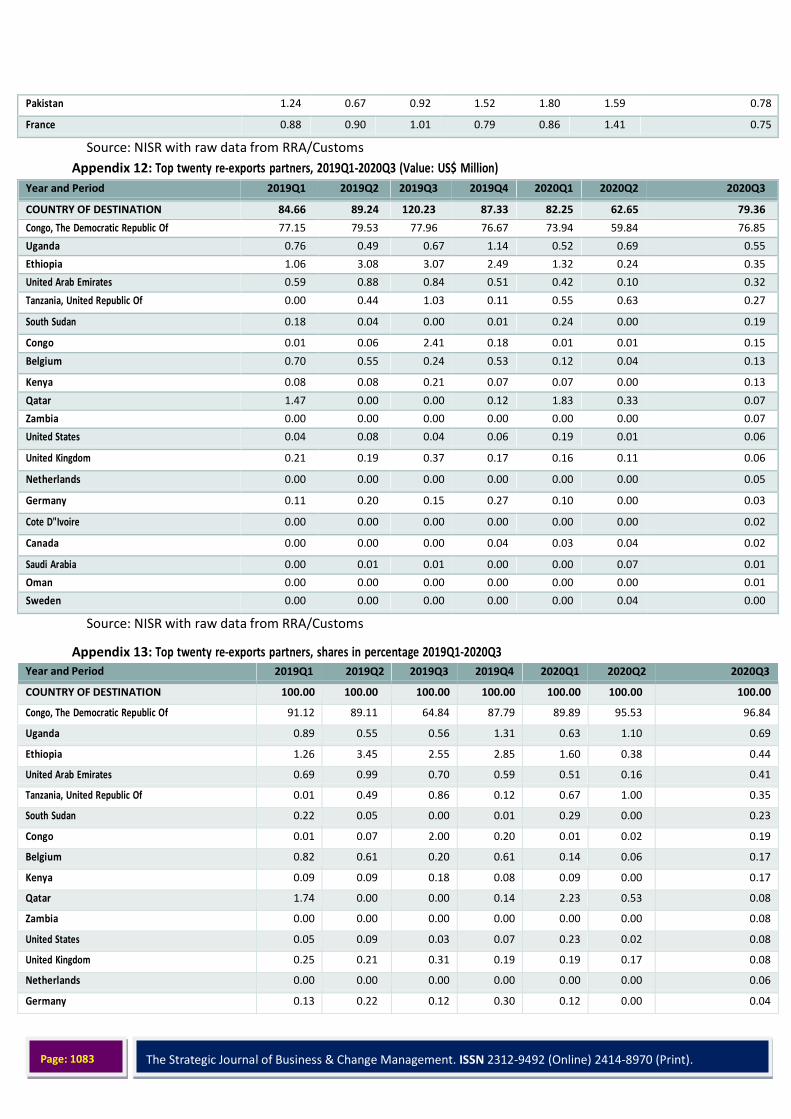
The Strategic Journal of Business & Change Management. ISSN 2312-9492 (Online) 2414-8970 (Print).
www.strategicjournals.com
Page: 1083
Pakistan 1.24 0.67 0.92 1.52 1.80 1.59 0.78
France 0.88 0.90 1.01 0.79 0.86 1.41 0.75
Source: NISR with raw data from RRA/Customs
Appendix 12: Top twenty re-exports partners, 2019Q1-2020Q3 (Value: US$ Million)
Year and Period 2019Q1 2019Q2 2019Q3 2019Q4 2020Q1 2020Q2 2020Q3
COUNTRY OF DESTINATION 84.66 89.24 120.23 87.33 82.25 62.65 79.36
Congo, The Democratic Republic Of 77.15 79.53 77.96 76.67 73.94 59.84 76.85
Uganda 0.76 0.49 0.67 1.14 0.52 0.69 0.55
Ethiopia 1.06 3.08 3.07 2.49 1.32 0.24 0.35
United Arab Emirates 0.59 0.88 0.84 0.51 0.42 0.10 0.32
Tanzania, United Republic Of 0.00 0.44 1.03 0.11 0.55 0.63 0.27
South Sudan 0.18 0.04 0.00 0.01 0.24 0.00 0.19
Congo 0.01 0.06 2.41 0.18 0.01 0.01 0.15
Belgium 0.70 0.55 0.24 0.53 0.12 0.04 0.13
Kenya 0.08 0.08 0.21 0.07 0.07 0.00 0.13
Qatar 1.47 0.00 0.00 0.12 1.83 0.33 0.07
Zambia 0.00 0.00 0.00 0.00 0.00 0.00 0.07
United States 0.04 0.08 0.04 0.06 0.19 0.01 0.06
United Kingdom 0.21 0.19 0.37 0.17 0.16 0.11 0.06
Netherlands 0.00 0.00 0.00 0.00 0.00 0.00 0.05
Germany 0.11 0.20 0.15 0.27 0.10 0.00 0.03
Cote D"Ivoire 0.00 0.00 0.00 0.00 0.00 0.00 0.02
Canada 0.00 0.00 0.00 0.04 0.03 0.04 0.02
Saudi Arabia 0.00 0.01 0.01 0.00 0.00 0.07 0.01
Oman 0.00 0.00 0.00 0.00 0.00 0.00 0.01
Sweden 0.00 0.00 0.00 0.00 0.00 0.04 0.00
Source: NISR with raw data from RRA/Customs
Appendix 13: Top twenty re-exports partners, shares in percentage 2019Q1-2020Q3
Year and Period 2019Q1 2019Q2 2019Q3 2019Q4 2020Q1 2020Q2 2020Q3
COUNTRY OF DESTINATION 100.00 100.00 100.00 100.00 100.00 100.00 100.00
Congo, The Democratic Republic Of 91.12 89.11 64.84 87.79 89.89 95.53 96.84
Uganda 0.89 0.55 0.56 1.31 0.63 1.10 0.69
Ethiopia 1.26 3.45 2.55 2.85 1.60 0.38 0.44
United Arab Emirates 0.69 0.99 0.70 0.59 0.51 0.16 0.41
Tanzania, United Republic Of 0.01 0.49 0.86 0.12 0.67 1.00 0.35
South Sudan 0.22 0.05 0.00 0.01 0.29 0.00 0.23
Congo 0.01 0.07 2.00 0.20 0.01 0.02 0.19
Belgium 0.82 0.61 0.20 0.61 0.14 0.06 0.17
Kenya 0.09 0.09 0.18 0.08 0.09 0.00 0.17
Qatar 1.74 0.00 0.00 0.14 2.23 0.53 0.08
Zambia 0.00 0.00 0.00 0.00 0.00 0.00 0.08
United States 0.05 0.09 0.03 0.07 0.23 0.02 0.08
United Kingdom 0.25 0.21 0.31 0.19 0.19 0.17 0.08
Netherlands 0.00 0.00 0.00 0.00 0.00 0.00 0.06
Germany 0.13 0.22 0.12 0.30 0.12 0.00 0.04

The Strategic Journal of Business & Change Management. ISSN 2312-9492 (Online) 2414-8970 (Print).
www.strategicjournals.com
Page: 1084
Cote D"Ivoire 0.00 0.00 0.00 0.00 0.00 0.00 0.03
Canada 0.00 0.00 0.00 0.04 0.03 0.07 0.03
Saudi Arabia 0.00 0.01 0.01 0.00 0.00 0.11 0.02
Oman 0.00 0.00 0.00 0.00 0.00 0.00 0.02
Sweden 0.00 0.00 0.00 0.00 0.00 0.06 0.00
Source: NISR with raw data from RRA/Customs
Appendix 14: Trade with selected Economic Organizations, 2019Q1-2020Q3 (Value: US$ Million)
Economic Block Flow 2019Q1 2019Q2 2019Q3 2019Q4 2020Q1 2020Q2 2020Q3
EAC
Export 27.53 55.97 6.19 5.15 14.21 8.79 11.77
Import 118.89 113.56 164.30 192.57 138.66 144.89 348.72
Re-export 2.57 3.65 34.33 5.27 3.75 1.71 1.14
CEPGL
Export 21.24 38.61 16.63 16.62 22.18 17.55 26.83
Import 5.19 4.67 4.48 4.00 3.06 1.65 2.84
Re-export 78.69 82.14 80.78 80.61 76.30 60.24 76.85
COMESA
Export 36.84 66.68 20.28 20.61 34.12 27.50 39.57
Import 99.89 78.42 116.46 120.10 100.37 95.61 179.02
Re-export 80.98 86.35 114.73 85.07 78.22 61.20 77.94
COMMON WEALTH Export 43.05 55.09 34.68 32.99 29.91 27.43 36.66
Import 249.60 223.34 332.19 397.62 367.05 295.57 506.66
Re-export 1.23 1.46 32.01 1.56 1.37 1.48 1.10
ECOWAS
Export 0.80 1.08 0.32 0.07 0.53 0.45 0.11
Import 0.43 0.40 18.96 0.80 17.09 57.49 36.98
Re-export 0.00 0.00 0.00 0.00 0.00 0.00 0.02
SADC
Export 16.12 15.53 17.75 18.44 20.47 18.34 28.98
Import 63.02 80.08 147.00 164.71 119.85 107.02 272.53
Re-export 77.30 80.17 79.08 76.81 74.50 60.48 77.19
EU
Export 14.28 16.66 23.99 23.75 12.38 14.91 18.64
Import 91.41 95.78 68.14 70.88 74.51 79.73 73.90
Re-export 1.02 0.93 0.76 0.97 0.38 0.18 0.27
Source: NISR with raw data from RRA/Customs
Appendix 15: Trade with selected Economic Organizations, shares in percentage 2019Q1-2020Q3
Economic Block Flow 2019Q1 2019Q2 2019Q3 2019Q4 2020Q1 2020Q2 2020Q3
EAC
Export 19.33 31.26 2.80 2.13 6.83 4.04 2.74
Import 16.78 15.28 19.94 21.58 15.13 19.75 35.65
Re-export 3.04 4.09 28.55 6.03 4.56 2.73 1.44
CEPGL
Export 14.91 21.57 7.51 6.88 10.67 8.08 6.26
Import 0.73 0.63 0.54 0.45 0.33 0.23 0.29
Re-export 92.95 92.04 67.19 92.30 92.77 96.16 96.84
COMESA
Export 25.86 37.24 9.16 8.54 16.41 12.66 9.23
Import 14.10 10.55 14.13 13.46 10.95 13.04 18.30
Re-export 95.65 96.76 95.42 97.41 95.10 97.69 98.22
COMMON WEALTH
Export 30.22 30.77 15.67 13.67 14.38 12.63 8.55
Import 35.22 30.05 40.32 44.56 40.04 40.30 51.79
Re-export 1.45 1.63 26.62 1.78 1.66 2.37 1.39
ECOWAS
Export 0.56 0.60 0.14 0.03 0.26 0.21 0.03
Import 0.06 0.05 2.30 0.09 1.86 7.84 3.78
Re-export 0.00 0.00 0.00 0.00 0.00 0.00 0.03
Export 11.32 8.67 8.02 7.64 9.85 8.44 6.76
Import 8.89 10.78 17.84 18.46 13.07 14.59 27.86
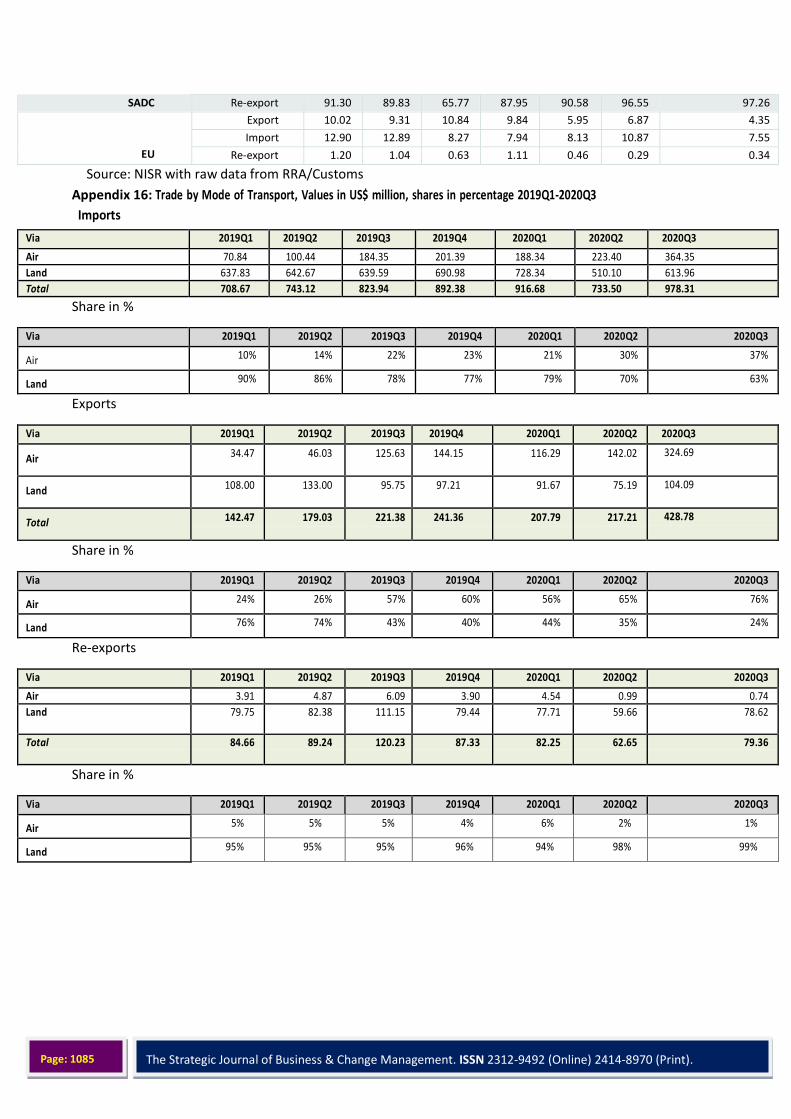
The Strategic Journal of Business & Change Management. ISSN 2312-9492 (Online) 2414-8970 (Print).
www.strategicjournals.com
Page: 1085
SADC Re-export 91.30 89.83 65.77 87.95 90.58 96.55 97.26
EU
Export 10.02 9.31 10.84 9.84 5.95 6.87 4.35
Import 12.90 12.89 8.27 7.94 8.13 10.87 7.55
Re-export 1.20 1.04 0.63 1.11 0.46 0.29 0.34
Source: NISR with raw data from RRA/Customs
Appendix 16: Trade by Mode of Transport, Values in US$ million, shares in percentage 2019Q1-2020Q3
Imports
Via 2019Q1 2019Q2 2019Q3 2019Q4 2020Q1 2020Q2 2020Q3
Air 70.84 100.44 184.35 201.39 188.34 223.40 364.35
Land 637.83 642.67 639.59 690.98 728.34 510.10 613.96
Total 708.67 743.12 823.94 892.38 916.68 733.50 978.31
Share in %
Via 2019Q1 2019Q2 2019Q3 2019Q4 2020Q1 2020Q2 2020Q3
Air 10% 14% 22% 23% 21% 30% 37%
Land 90% 86% 78% 77% 79% 70% 63%
Exports
Via 2019Q1 2019Q2 2019Q3 2019Q4 2020Q1 2020Q2 2020Q3
Air 34.47 46.03 125.63 144.15 116.29 142.02 324.69
Land 108.00 133.00 95.75 97.21 91.67 75.19 104.09
Total 142.47 179.03 221.38 241.36 207.79 217.21 428.78
Share in %
Via 2019Q1 2019Q2 2019Q3 2019Q4 2020Q1 2020Q2 2020Q3
Air 24% 26% 57% 60% 56% 65% 76%
Land 76% 74% 43% 40% 44% 35% 24%
Re-exports
Via 2019Q1 2019Q2 2019Q3 2019Q4 2020Q1 2020Q2 2020Q3
Air 3.91 4.87 6.09 3.90 4.54 0.99 0.74
Land 79.75 82.38 111.15 79.44 77.71 59.66 78.62
Total 84.66 89.24 120.23 87.33 82.25 62.65 79.36
Share in %
Via 2019Q1 2019Q2 2019Q3 2019Q4 2020Q1 2020Q2 2020Q3
Air 5% 5% 5% 4% 6% 2% 1%
Land 95% 95% 95% 96% 94% 98% 99%