the economic and budget outlook: an update august …
TRANSCRIPT

THE ECONOMIC AND BUDGET OUTLOOK:AN UPDATE
AUGUST 1998
The Congress of the United StatesCongressional Budget Office

NOTES
Unless otherwise indicated, all years referred to in Chapter 1 and Appendix A are calendar years,and all years in other chapters and Appendix B are fiscal years.
Some figures in this report indicate periods of recession by using shaded vertical bars. The barsextend from the peak to the trough of the recession.
Unemployment rates throughout the report are calculated on the basis of the civilian labor force.
The economic projections presented in this report differ slightly from those published in CBO’s July15, 1998, Economic and Budget Outlook for Fiscal Years 1998-2008: A Preliminary Update becausethey incorporate data released by the Bureau of Economic Analysis on July 31. The budgetprojections are unchanged from those presented in the preliminary report.
Numbers in the text and tables may not add up to totals because of rounding.
ERRATA
In the print version of this report, the economic forecast for calendar year 1998 shown in Table1-2 was incorrect. (That forecast was correct, however, in Summary Table 2 and Tables 1-5 and1-7.) This electronic version contains a corrected Table 1-2.

This study and other CBO publications are available at CBO's Web site:
http://www.cbo.gov/
Preface
This volume is one of a series of reports on the state of the economy and the budget that theCongressional Budget Office (CBO) issues each year. It satisfies the requirement of section202(e) of the Congressional Budget Act of 1974 for CBO to submit periodic reports to the
Committees on the Budget with respect to fiscal policy and to provide baseline projections of thefederal budget. In accordance with CBO's mandate to provide objective and impartial analysis, thereport contains no recommendations.
The analysis of the economic outlook presented in Chapter 1 was prepared by the Macroeco-nomic Analysis Division under the direction of Robert Dennis and John F. Peterson. MatthewSalomon wrote the chapter, with substantial contributions from Robert Arnold, Juann Hung, andKim Kowalewski. Michael Simpson carried out the economic forecast and projections. DavidBrauer, Ed Gamber, Douglas Hamilton, Mark Lasky, Angelo Mascaro, Benjamin Page, FrankRussek, Kent Smetters, John Sturrock, Jan Walliser, and Christopher Williams provided commentsand background analysis. David Arnold and Ezra Finkin provided research assistance.
The baseline outlay projections were prepared by the staff of the Budget Analysis Divisionunder the supervision of Paul N. Van de Water, Robert Sunshine, Priscilla Aycock, Tom Bradley,Paul Cullinan, Peter Fontaine, James Horney, and Michael Miller. The revenue estimates wereprepared by the staff of the Tax Analysis Division under the supervision of Frank Sammartino andRichard Kasten. Jeffrey Holland wrote Chapter 2. Frank Sammartino and Richard Kasten wroteChapter 3. Matthew Salomon and David Brauer wrote Appendix A, and Jennifer Winkler wroteAppendix B. James Horney wrote the summary of the report.
An early version of the economic forecast underlying this report was discussed at a meetingof CBO's Panel of Economic Advisers. Members of the panel are Alan Auerbach, Martin Bailey,Jagdish Bhagwati, Michael Boskin, Barry P. Bosworth, Robert Dederick, Martin Feldstein,Robert J. Gordon, Robert E. Hall, Marvin Kosters, Anne Krueger, N. Gregory Mankiw, AllanMeltzer, William Nordhaus, Rudolph Penner, James Poterba, Robert Reischauer, Sherwin Rosen,Joel Slemrod, John Taylor, and James Tobin. Andrew Abel, Martin Barnes, James Glassman, andLawrence Kudlow attended as guests. Although these outside advisers provided considerableassistance, they are not responsible for the contents of this document.
Sherry Snyder supervised the editing of the report, and Kathryn Quattrone supervised pro-duction. Major portions were edited by Sherry Snyder, Melissa Burman, Leah Mazade, and Chris-tian Spoor. The authors owe thanks to Marion Curry, Linda Lewis Harris, Denise Jordan, DorothyKornegay, and Simone Thomas, who assisted in the preparation of the report. Kathryn Quattroneprepared the report for final publication, with assistance from Martina Wojak-Piotrow. LaurieBrown prepared the electronic versions for CBO’s Web site.
June E. O'NeillDirector
August 1998


Contents
SUMMARY ix
ONE THE ECONOMIC OUTLOOK 1
The Current State of the Economy 2The Economic Forecast for 1998 and 1999 15The Economic Projection for 2000 Through 2008 20Uncertainty in the Economic Outlook 24
TWO THE BUDGET OUTLOOK 33
An Improved Bottom Line 34Changes in Projections Since March 36Revenue and Spending Projections 40The Federal Sector of the National Income
and Product Accounts 42
THREE THE REVENUE OUTLOOK 49
Key Factors in Projecting Revenues 51Revenue Estimates for 1999 and 2000 54The Longer-Term Revenue Outlook 56
APPENDIXES
A Evaluating CBO’s Record of Economic Forecasts 63
B Sequestration Update Report for Fiscal Year 1999 79
C Major Contributors to the Revenue and SpendingProjections 85
vi THE ECONOMIC AND BUDGET OUTLOOK: AN UPDATE August 1998
TABLES
S-1. The Budget Outlook Under Current Policies x
S-2. Comparison of CBO’s Summer and January 1998Economic Projections for Calendar Years 1998-2008 xi
S-3. Changes in CBO Budget Projections Since March 1998 xiv
S-4. CBO Baseline Budget Projections, Assuming Compliancewith Discretionary Spending Caps xvi
1-1. The CBO Forecast for 1998 and 1999 2
1-2. The CBO Economic Projection for Calendar Years 1998-2008 16
1-3. The CBO Economic Projection for Fiscal Years 1998-2008 17
1-4. Key Assumptions for the Projection of Potential Output 21
1-5. Comparison of CBO’s Summer and January 1998Economic Projections for Calendar Years 1998-2008 25
1-6. Comparison of CBO’s and Other Economists’ Forecasts for 1998 and 1999 28
1-7. Comparison of CBO’s and Other Economists’ Projectionsfor Calendar Years 1998-2008 29
2-1. The Budget Outlook Under Current Policies 35
2-2. Changes in CBO Budget Projections Since March 1998 38
2-3. CBO Budget Projections, Assuming Compliance withDiscretionary Spending Caps 41
2-4. CBO Projections of Discretionary Outlays, AssumingCompliance with Discretionary Spending Caps 42
2-5. CBO Projections of Mandatory Spending,Including Deposit Insurance 43
2-6. CBO Projections of Federal Interest Costs and Debt 44
2-7. Relationship of the Budget to the Federal Sectorof the National Income and Product Accounts 45
2-8. Projections of Receipts and Expenditures Measuredby the National Income and Product Accounts 46
3-1. CBO Revenue Projections 51
3-2. Comparison of CBO’s July and January 1998 Projectionsof Federal Revenues for Fiscal Year 1998 52

CONTENTS vii
3-3. Revenues, by Source, Since Fiscal Year 1985 55
3-4. Average Annual Growth Rates of Income and Revenues for1959-1997 and Projected Through 2008 58
3-5. CBO Projections for Individual, Corporate, and SocialInsurance Receipts and Their Tax Bases 59
A-1. Comparison of CBO, Administration, and Blue Chip Forecastsof Two-Year Average Growth Rates for Real Output 71
A-2. Comparison of CBO, Administration, and Blue Chip Forecastsof Two-Year Average Inflation Rates in the ConsumerPrice Index 72
A-3. Comparison of CBO, Administration, and Blue Chip Forecastsof Two-Year Average Interest Rates on Three-MonthTreasury Bills 73
A-4. Comparison of CBO, Administration, and Blue Chip Forecastsof Two-Year Average Long-Term Interest Rates 74
A-5. Comparison of CBO, Administration, and Blue Chip Forecastsof Two-Year Average Real Interest Rates on Three-MonthTreasury Bills 75
A-6. Comparison of CBO and Administration Projections of theTwo-Year Change in Wage and Salary DistributionsPlus Book Profits as a Share of Output 76
A-7. Comparison of CBO, Administration, and Blue Chip Projections of Five-Year Average Growth Rates forReal Output 77
B-1. CBO Estimates of Discretionary Spending Limitsfor Fiscal Years 1998-2002 82
B-2. Budgetary Effects of Direct Spending or ReceiptLegislation Enacted Since the Budget EnforcementAct of 1997 84
FIGURES
1-1. The Economic Forecast and Projection 3
1-2. Household Net Worth 4
1-3. Labor Productivity 6
1-4. Medical Care Inflation 7
1-5. Benefits per Hour 7

viii THE ECONOMIC AND BUDGET OUTLOOK: AN UPDATE August 1998
1-6. Corporate Profits, Interest Costs, andHealth Benefit Costs 8
1-7. Volatility in the Core Rate of CPI Inflation 9
1-8. The Personal Saving Rate 9
1-9. The U.S. Dollar Exchange Rate andImport Price Inflation 13
1-10. Commodity and Crude Oil Prices 13
1-11. Changes in the Prices of Key Computer Components 14
1-12. Tightness in the Labor Market and Wage Growth 15
1-13. Real Inventory Stocks 20
1-14. Trade Deficit 20
1-15. Business Fixed Investment 22
2-1. Debt Held by the Public as a Share of GDP 33
2-2. Total and On-Budget Deficit or Surplus 36
3-1. Federal Revenues as a Share of GDP 49
3-2. Annual Growth of Federal Revenues and GDP 50
3-3. Annual Growth of Taxable Capital Gains Realizations 53
3-4. Annual Growth of Income and GDP 56
3-5. Revenues, by Source, as a Share of GDP 57
BOXES
1-1. The Cloud of the Asian Crisis Lingers On 10
1-2. The Impact of the Stock Market on the Economy 19
1-3. Revision of the National Income and Product Accounts 26
2-1. CBO’s Long-Term Budget Outlook 37

Summary
The Congressional Budget Office (CBO) projectsthat the federal budget for fiscal year 1998 willrecord a total surplus of $63 billion, or 0.8 per-
cent of gross domestic product (GDP). If current poli-cies remain unchanged, the surplus is expected to riseto $80 billion in 1999 and reach $251 billion (nearly 2percent of GDP) by 2008 (see Summary Table 1).Excluding the surplus in Social Security and the netoutlays of the Postal Service (both of which are legallyclassified as off-budget), CBO's new projections showan on-budget deficit of $41 billion in 1998, whichgives way to surpluses in 2002 and in 2005 through2008.
The budget outlook has improved significantly inthe past six months. Unexpectedly strong revenue col-lections by the Treasury in the first 10 months of fis-cal year 1998 are the major reason that CBO has gonefrom projecting a small deficit last January to estimat-ing a surplus of $63 billion today. The strength of1998 revenues, together with a slightly more optimis-tic economic outlook, also forms the basis for in-creases in CBO's projections of the surplus for 1999through 2008.
Based on collections through July, CBO believesthat 1998 revenues will total $1,717 billion—$38 bil-lion (2.2 percent) higher than CBO’s March estimateand $53 billion (3.2 percent) higher than the Januaryestimate. New economic data explain less than $7billion of the increase in the projection since January,while new legislation is responsible for $1 billion.That leaves $45 billion, almost all in revenues from
individual income taxes, to be explained by other fac-tors.
At this point, there is little firm informationabout the sources of income that produced the addedrevenues in 1998 and their implications for revenuegrowth in future years. Some of the factors that mightexplain the additional income are likely to be tempo-rary and would fade over several years. But others aremore permanent and could spur continuous revenuegrowth. After assessing the possible causes, CBO hasassumed that, on balance, the factors producing theadditional revenues in 1998 will continue to add a sim-ilar dollar amount to revenues in future years. Thatamount, however, raises projected revenues by in-creasingly smaller percentages over time.
Changes in the economic outlook also boost sur-pluses projected over the next decade. A smaller ex-pected decline in corporate profits as a share of GDPincreases projected revenues, and slightly lower real(inflation-adjusted) long-term interest rates after 2000reduce interest payments on the national debt. A re-duction in the projected rate of inflation—which holdsdown required cost-of-living increases, the growth ofMedicare costs, nominal interest rates, and assumedincreases in discretionary spending after 2002—sig-nificantly lowers projected outlays in the longer term.But lower inflation does not have a major impact onthe surplus because it also slows the growth of taxableincomes, leading to a reduction in projected tax reve-nues that offsets the reduction in outlays.

x THE ECONOMIC AND BUDGET OUTLOOK: AN UPDATE August 1998
Summary Table 1.The Budget Outlook Under Cu rrent P olicies (By fi scal year, in billions of doll ars)
Actual1997 1998 1999 2000 2001 2002 2003 2004 2005 2006 2007 2008
Total Deficit (-) or Surplus -22 63 80 79 86 139 136 154 170 217 236 251
Off-Budget Surplus 81 104 117 125 131 138 146 154 165 173 181 186
On-Budget Deficit (-) or Surplus(Excluding Social Security andPostal Service) -103 -41 -37 -46 -45 1 -10 a 5 44 55 64
SOURCE: Congressional Budget Office.
a. Less than $500 million.
CBO now expects lower outlays in 1998 than itprojected in March, but that decrease largely reflectstemporary factors that are not expected to reducespending in the future. Legislation enacted sinceMarch has lowered projected surpluses by a few bil-lion dollars a year—primarily reflecting higher spend-ing for transportation programs.
The Economic Outlook
The economy has continued to grow at a healthy pace,with low unemployment and subdued inflation. CBOprojects that growth will slow over the next few yearsand that the unemployment and inflation rates willgradually rise (see Summary Table 2). The currentoutlook is not dramatically different from CBO's lasteconomic projections, made in January, but small in-creases in real growth, somewhat lower inflation, prof-its that account for a larger share of GDP, and lowerreal long-term interest rates significantly affect thebudget's projected bottom line.
The Forecast for 1998 and 1999
The growth of real GDP is likely to slow to just over 2percent for the rest of calendar year 1998 and early1999, down from the 4 percent pace set during 1997and the 5.5 percent pace during the first quarter of
1998. Factors contributing to the slowdown include acontinuation of the recent increase in the real tradedeficit, a pickup in inflation, and weaker profits.
Demand for U.S.-produced goods and serviceshas been dampened by the economic contraction inAsia, as well as by an already strong dollar and slowlygrowing demand in Europe. It is likely that foreigntrade will continue to depress demand for U.S. goodsinto 1999.
The underlying rate of inflation—the increase inthe consumer price index (CPI) excluding energy andfood prices—is forecast to rise slightly over the nextyear and a half. Strong upward pressure on wages isexpected to contribute to that increase. In addition,some factors that have held down CPI growth over thepast two or three years are expected to have less of aneffect in the future. For example, import price defla-tion is expected to fade during 1999, and medical careinflation is forecast to bounce back from the low levelsof the past two years.
Corporate profits, which have stagnated since thethird quarter of last year, will remain under pressurethrough 1999. Rising wages and an expected increasein the growth of employee benefits will push thegrowth of total compensation higher at the same timethat sales growth slows. Some of those costs will bepassed on in the form of higher prices, but some willbe absorbed through lower profits.

SUMMARY xi
Summary Table 2.Comparison of CBO’s Summer and January 1998 Ec onomic Projections for Calendar Y ears 1998-2008
Actual1997
Forecast Projected1998 1999 2000 2001 2002 2003 2004 2005 2006 2007 2008
Nominal GDP(Billions of dollars)
Summer 1998 8,111 8,487 8,839 9,204 9,572 10,008 10,475 10,955 11,446 11,950 12,473 13,015January 1998 8,081 8,461 8,818 9,195 9,605 10,046 10,529 11,038 11,565 12,112 12,684 13,280
Nominal GDP(Percentage change)
Summer 1998 5.9 4.6 4.2 4.1 4.0 4.6 4.7 4.6 4.5 4.4 4.4 4.3January 1998 5.8 4.7 4.2 4.3 4.5 4.6 4.8 4.8 4.8 4.7 4.7 4.7
Real GDPa (Percentage change)
Summer 1998 3.9 3.4 2.2 1.9 1.8 2.4 2.5 2.4 2.3 2.3 2.2 2.2January 1998 3.7 2.7 2.0 1.9 2.0 2.1 2.3 2.3 2.2 2.2 2.2 2.1
GDP Price Indexb
(Percentage change)Summer 1998 1.9 1.2 2.0 2.2 2.1 2.1 2.1 2.1 2.1 2.1 2.1 2.1January 1998 2.0 2.0 2.2 2.3 2.4 2.4 2.5 2.5 2.5 2.5 2.5 2.5
Consumer Price Indexc
(Percentage change)Summer 1998 2.3 1.7 2.6 2.7 2.6 2.5 2.5 2.5 2.5 2.5 2.5 2.5January 1998 2.3 2.2 2.5 2.7 2.8 2.8 2.8 2.8 2.8 2.8 2.8 2.8
Unemployment Rate(Percent)
Summer 1998 4.9 4.6 4.7 5.1 5.5 5.7 5.7 5.7 5.7 5.7 5.7 5.7January 1998 4.9 4.8 5.1 5.4 5.6 5.8 5.9 5.9 5.9 5.9 5.9 5.9
Three-Month TreasuryBill Rate (Percent)
Summer 1998 5.1 5.1 5.2 4.8 4.6 4.4 4.4 4.4 4.4 4.4 4.4 4.4January 1998 5.1 5.3 5.2 4.8 4.7 4.7 4.7 4.7 4.7 4.7 4.7 4.7
Ten-Year TreasuryNote Rate (Percent)
Summer 1998 6.4 5.8 6.1 5.8 5.6 5.4 5.4 5.4 5.4 5.4 5.4 5.4January 1998 6.4 6.0 6.1 6.0 5.9 5.9 5.9 5.9 5.9 5.9 5.9 5.9
Tax Bases(Percentage of GDP)
Corporate profitsd
Summer 1998 10.1 9.6 9.4 9.2 8.8 8.6 8.5 8.5 8.4 8.3 8.3 8.3January 1998 9.9 9.7 9.2 8.8 8.5 8.3 8.2 8.1 8.0 7.9 7.8 7.7
Wage and salary disbursements
Summer 1998 48.0 48.7 48.8 48.7 48.8 48.7 48.7 48.7 48.7 48.7 48.7 48.7January 1998 48.0 48.4 48.5 48.6 48.6 48.6 48.6 48.7 48.8 48.8 48.8 48.8
Other taxable incomeSummer 1998 21.2 20.9 20.8 20.5 20.2 20.0 19.8 19.6 19.4 19.2 19.1 18.9January 1998 22.1 21.8 21.5 21.2 21.1 20.9 20.7 20.5 20.4 20.2 20.1 20.0
SOURCES: Congressional Budget Office; Department of Commerce, Bureau of Economic Analysis; Department of Labor, Bureau of LaborStatistics; Federal Reserve Board.
a. Based on chained 1992 dollars.
b. The GDP price index is virtually the same as the implicit GDP deflator.
c. The consumer price index for all urban consumers.
d. Corporate profits are the profits of corporations, adjusted to remove the distortions in depreciation allowances caused by tax rules and toexclude capital gains on inventories.

xii THE ECONOMIC AND BUDGET OUTLOOK: AN UPDATE August 1998
The anticipated rise in inflation may lead tohigher interest rates, but any increase is likely to bemild and temporary. If the Federal Reserve Board isuncertain about the pervasiveness of the slowdown ineconomic activity, an increase in inflation may promptit to raise short-term rates by the end of the year.Long-term rates may also pick up slightly. However,if economic growth slows to a 2 percent rate for 1999,short-term interest rates will probably ease back totheir current levels by the end of that year.
The Projection for 2000 Through 2008
CBO does not forecast cyclical economic effects be-yond two years. Instead, it calculates a medium-termpath of the economy that reflects the possibility ofbooms and recessions. That midrange path is thebaseline projection of the economy for 2000 through2008. Over that period, CBO expects real GDP togrow at an average rate of 2.3 percent a year, the CPIto increase at an average rate of 2.5 percent, andshort-term interest rates to average 4.5 percent.
The small variations in real GDP growth andother variables during that period that are apparent inSummary Table 2 do not stem from any assumptionsabout cyclical effects in those years. The slight dropin the projected growth rate of real GDP between 2002and 2008 reflects a demographic assumption thatgrowth of the labor force will slow in line with slowergrowth of the working-age population and an assump-tion that growth of investment will return to a lower,long-term trend. In order to achieve the projected av-erage values assumed over the 2000-2008 period with-out having a misleadingly sudden drop at the end of1999, CBO phases in reductions in inflation, interestrates, and profits as a share of GDP over the first fewyears of the projection period.
Changes Since January
CBO now forecasts that real GDP in 1998 will behigher than it anticipated in January and projects thatreal GDP will grow, on average, about 0.1 percentagepoint a year faster over the entire 1998-2008 periodthan was projected at that time.
Inflation, whether measured by the consumerprice index or the GDP price index, is lower this yearthan was forecast in January, largely because of adrop in energy prices. Inflation is expected to riseover the next two years, with the increase in the CPIprojected to grow from 1.7 percent in 1998 to 2.7 per-cent in 2000. However, the average growth rate forthe CPI from 2002 through 2008 is projected to be 2.5percent a year—about 0.3 percentage points lowerthan had been projected in January. Because ofchanges that the Bureau of Labor Statistics has madeor plans to make in how it measures the CPI, the 2.7percent inflation projected for 2000 is comparable to3.4 percent inflation calculated on the basis of themeasurement techniques used before 1995. The Fed-eral Reserve Board is unlikely to be satisfied with in-flation at that rate over a long period; thus, CBO as-sumes that inflation will be lower, on average, after2000.
The GDP price index is also projected to increaseat a slower pace than CBO anticipated in January.That assumption of lower inflation significantly re-duces both nominal GDP and the total national incomeand product account (NIPA) tax base in the latteryears of the projection period. As a share of GDP,however, the total tax base is higher in the current pro-jection than it was in January. Corporate profits as ashare of GDP in 1998 and 1999 are similar to the pre-vious forecast, but the projection for subsequent yearsis significantly higher than before (although the sharestill drops over time). CBO increased that projectionbecause of lower projected interest rates, which reducethe debt-service costs of companies and boost profits.The projection for wages and salaries as a share ofGDP has changed little since January.
Nominal interest rates are lower than previouslyprojected because of the assumed decline in inflation.The outlook for inflation-adjusted short-term interestrates is unchanged from January. However, inflation-adjusted long-term rates are projected to be lower be-cause of the larger projected federal surpluses.
Uncertainty of the Outlook
One source of errors in predicting the future perfor-mance of the economy is data on its recent perfor-

SUMMARY xiii
mance. Reported data on GDP and the components ofnational income are regularly revised, sometimes byquite large amounts. Because forecasts necessarilydepend on the economic data that are currently avail-able, the likelihood of revisions to those data increasesthe uncertainty of any forecast.
In addition, there is a risk that future events willcause a significant divergence from the path laid out inthe new forecast. The economy could be more ad-versely affected by the Asian crisis than CBO as-sumes; the tightness of the labor market could cause asignificant jump in the rate of inflation; or the stockmarket could drop precipitously. Conversely, theAsian crisis could have little additional effect on theUnited States; productivity growth might remainhigher than CBO anticipates, which would permit acontinuation of rapid noninflationary growth andstronger profits; or labor force participation ratesmight again increase rapidly, easing pressures on thelabor market for a few years. Such alternative out-comes could have a substantial effect on the budget,increasing or decreasing its bottom line by $100 bil-lion or more in a single year.
The Budget Outlook
In March, CBO projected that the total federal budgetwould show a surplus of $8 billion in fiscal year 1998—the first surplus in almost 30 years—but warnedthat the final budget numbers for the year could quiteeasily show a small deficit or a larger surplus. Withactual spending and revenues reported for more thanthree-quarters of the fiscal year, a surplus this year isnow virtually certain, and CBO has boosted its projec-tion of that surplus to $63 billion (see Summary Table3). Moreover, the improvement in the budget outlookfor 1998—primarily associated with higher-than-an-ticipated revenues—seems likely to carry over to fu-ture years as well. Assuming that policies remain un-changed, CBO projects that the surplus will generallyincrease over the next 10 years, reaching $251 billion(1.9 percent of GDP) in 2008.
Although the total budget is expected to show ahealthy surplus in 1998, CBO expects that there willstill be an on-budget deficit. On-budget revenues
(which by law exclude revenues earmarked to SocialSecurity) are projected to be $41 billion less than on-budget spending (which excludes spending for SocialSecurity benefits and administrative costs and the netoutlays of the Postal Service, but includes generalfund interest payments to the Social Security trustfunds). By 2002, and in 2005 through 2008, the bud-get will be in surplus even when off-budget revenuesand spending are excluded from the calculation.
Changes Since March
Actual revenues for 1998 reported by the Treasuryhave been higher and actual outlays have been lowerthan CBO had projected in March. Revenues nowseem likely to reach $1,717 billion this year, $38 bil-lion (2.2 percent) higher than the March estimate and$53 billion (3.2 percent) higher than CBO projected inJanuary. CBO also expects total outlays of $1,654billion this year, $18 billion (1.1 percent) less thanprojected in March.
The additional revenues in 1998 have led CBO toboost its projection of revenues in later years becauseat least some of the factors that have pushed up in-comes and 1998 tax revenues will probably continueto have an impact. The reductions in 1998 spending,by contrast, result largely from temporary factors andhave little effect on CBO's projections of spendingbeyond 1998.
CBO's spending and revenue projections incorpo-rate the effects of legislation enacted since March, butthose effects are relatively small. Changes promptedby CBO's new economic projections have had a largereffect on the budget projections, but not nearly aslarge as the revisions stemming from the increased1998 revenues. The most significant change in theeconomic outlook is a decline in projected inflation,but that change has a limited impact on projected sur-pluses because it lowers both spending and revenues.
Changes in Projected Revenues. In January, CBOpredicted that revenues would total $1,665 billion in1998. That projection was based on actual collectionsreported through November, economic data availableat that time, and CBO's forecast of economic activitythrough the rest of the year. In March, actual collec-

xiv THE ECONOMIC AND BUDGET OUTLOOK: AN UPDATE August 1998
tions reported through January led CBO to raise itsprojection to $1,680 billion. Based on actual collec-tions reported through July, revised economic data,and a new economic forecast, CBO now expects totalcollections of $1,717 billion for the year. Revisions todata on aggregate wages and salaries, corporate prof-its, and other variables reported in the national incomeand product accounts, and to CBO's forecast of thoseNIPA variables, explain only about $7 billion of the$53 billion increase in projected revenues since Janu-ary. Legislation enacted since March explains an ad-ditional $1 billion of the increase. That leaves a $45billion increase in expected revenues to be explainedby other factors.
What is known from the data on actual collec-tions is that the $45 billion increase in the projectionresults almost entirely from additional individual in-come tax receipts. However, available data providevirtually no information about the sources of the in-creased income that generated those tax collections. Awell-founded explanation of the unexpected revenueswould require detailed information from tax returnsabout the particular sources of income and other fac-tors that generated tax liabilities in calendar years1997 and 1998. But such information is availableonly through 1996. Sufficient data on 1997 incomesand tax liabilities will not be available until late thisyear, and data on 1998 liabilities will not be availableuntil late 1999.
Summary Table 3.Changes in CBO Budget Projections Since M arch 1998 (By fiscal year, in billions of doll ars)
1998 1999 2000 2001 2002 2003 2004 2005 2006 2007 2008
March 1998 Total Budget Surplus 8 9 1 13 67 53 70 75 115 130 138
ChangesLegislative
Revenues 1 1 a -1 -1 -1 -1 1 1 1 1Outlaysb -1 -3 -4 -4 -4 -3 -2 -1 -1 a 1
Subtotal b -2 -4 -5 -5 -4 -4 b 1 1 2
EconomicRevenues 7 13 15 5 a -3 -10 -17 -24 -33 -43Outlays 1 9 10 12 16 24 32 40 48 56 63
Subtotal 8 22 25 17 16 21 22 24 23 23 21
TechnicalRevenues 30 48 50 51 49 50 49 51 52 52 55Outlaysb
Other than debt service 16 -1 a -1 -1 a -2 -1 a 1 1Debt service 1 4 7 10 13 16 19 22 26 30 34
Subtotal 48 51 57 61 61 66 65 72 78 83 90
Total Changes 55 71 78 73 72 82 84 96 102 106 113
Summer 1998 Total Budget Surplus 63 80 79 86 139 136 154 170 217 236 251
Memorandum:Total Change in Revenues 38 62 65 56 48 46 37 35 29 20 13Total Change in Outlays 18 9 13 17 23 37 46 61 73 86 99
SOURCE: Congressional Budget Office.
a. Less than $500 million.
b. Increases in outlays are shown with a negative sign because they reduce surpluses.

SUMMARY xv
How the 1998 revenue surge should influenceprojections of future revenues depends on which of anumber of possible factors were actually responsiblefor the unexplained revenues, and to what extent. Forexample, if subsequent revisions reveal that incomes inthe recent past were higher than has been reported inthe NIPA data, that discrepancy could have an effectthat grows over time at roughly the rate of the pro-jected growth in incomes. But other likely factors,such as a surge in capital gains realizations and ajump in the incomes of higher-income taxpayers asso-ciated with recent stock market gains, could have adiminishing effect on future revenue growth.
Faced with limited information about the weightsto give to the various possibilities, CBO has chosen amiddle path. Its projections assume that the factorsboosting revenues in recent years will neither fade rap-idly nor produce increasing amounts of revenues.That assumption, along with small changes resultingfrom other adjustments, generates the technicalchanges to revenues shown in Summary Table 3.(Technical changes are those that are not attributableto legislation or the economy.)
CBO also revised its revenue projections to re-flect legislation enacted since March, primarily theInternal Revenue Service Restructuring and ReformAct of 1998. Those changes increase revenues insome years, decrease them in others, and boost themby a total of $3 billion over the 1998-2008 period.
Changes in CBO's economic projections affectedrevenues much more substantially than did legislation.Over the next few years, the revised economic as-sumptions increase revenues by as much as $15 billiona year. But after 2002, the revised outlook reducesrevenues by amounts that grow to $43 billion in 2008.Slightly higher real GDP and a not-quite-as-sharp de-cline in corporate profits as a share of GDP boost pro-jected revenues. However, lower projected inflationpushes down nominal GDP and incomes, resulting in adrop in revenues that more than offsets those upwardeffects after 2002. Because lower inflation alsopushes down spending, that reduction in revenues doesnot have a major impact on the budget surplus.
Changes in Projected Outlays. CBO anticipates that1998 outlays will be $18 billion lower than projectedin March. About $5 billion of that reduction occurs in
discretionary spending. A supplemental appropriationbill enacted in May boosted discretionary outlays byan estimated $1 billion, but that increase was morethan offset by slower-than-anticipated spending for anumber of programs.
Lower projected mandatory spending in 1998accounts for the remaining $12 billion in decreasedoutlays. More than $1 billion of that reflects eco-nomic effects—unemployment and interest rates thatare lower than previously anticipated. Legislation en-acted since March has had virtually no effect on netmandatory spending. Thus, the leftover $11 billionreduction in projected mandatory spending is attribut-able to other, technical factors. More than $3 billionof the reduction is in Medicare, largely the result of adecision by the Health Care Financing Administrationto slow the processing of payments to health care pro-viders.
Lower outlays in 1998 have not led to a reduc-tion in projected spending in 1999 through 2008. The1998 reductions largely reflect one-time events thateither have no impact on future spending or are likelyto increase it. For example, the slowdown in the pro-cessing of Medicare payments will lower 1998 spend-ing but will have little or no effect on spending in fu-ture years, since the amount saved in any year becauseof the delay will roughly equal the amount that is car-ried over to that year from the previous year.
Legislation enacted since March has increasedprojected spending over the 1999-2008 period by atotal of $23 billion. Most of that increase stems fromthe additional spending provided by the TransportationEquity Act for the 21st Century, enacted in June.
Changes in CBO's economic projections havereduced projected spending by amounts that grow to$63 billion by 2008. A slight reduction in anticipatedreal long-term interest rates produces savings in inter-est on the national debt. Much more significant, how-ever, are the reductions in spending that result fromlower projected inflation. Lower inflation holds downthe size of required cost-of-living adjustments for ben-efit programs such as Social Security, slows thegrowth of Medicare spending, and by lowering nomi-nal interest rates, curbs spending for interest on thedebt. Since CBO's projections assume that discretion-ary spending will grow at the rate of inflation after the
xvi THE ECONOMIC AND BUDGET OUTLOOK: AN UPDATE August 1998
statutory caps on such spending expire in 2002, thedecline in projected inflation also reduces discretionaryspending projected for 2003 through 2008. Lowerinflation has a small effect on the surplus, however,because it reduces revenues by at least as much asoutlays.
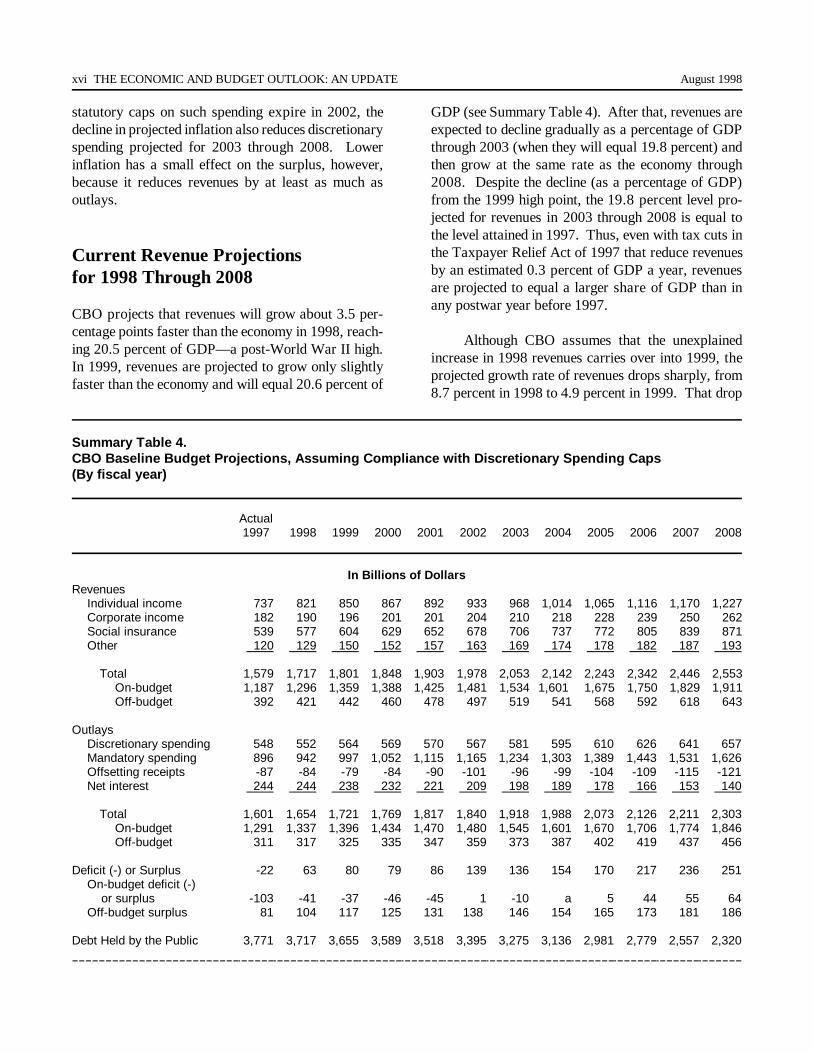
Current Revenue Projections for 1998 Through 2008
CBO projects that revenues will grow about 3.5 per-centage points faster than the economy in 1998, reach-ing 20.5 percent of GDP—a post-World War II high.In 1999, revenues are projected to grow only slightlyfaster than the economy and will equal 20.6 percent of
GDP (see Summary Table 4). After that, revenues areexpected to decline gradually as a percentage of GDPthrough 2003 (when they will equal 19.8 percent) andthen grow at the same rate as the economy through2008. Despite the decline (as a percentage of GDP)from the 1999 high point, the 19.8 percent level pro-jected for revenues in 2003 through 2008 is equal tothe level attained in 1997. Thus, even with tax cuts inthe Taxpayer Relief Act of 1997 that reduce revenuesby an estimated 0.3 percent of GDP a year, revenuesare projected to equal a larger share of GDP than inany postwar year before 1997.
Although CBO assumes that the unexplainedincrease in 1998 revenues carries over into 1999, theprojected growth rate of revenues drops sharply, from8.7 percent in 1998 to 4.9 percent in 1999. That drop
Summary Table 4.CBO Base line Budget Projections, Assuming Compliance with Di scret ionary Spe nding Caps (By fiscal year)
Actual1997 1998 1999 2000 2001 2002 2003 2004 2005 2006 2007 2008
In Billions of DollarsRevenues
Individual income 737 821 850 867 892 933 968 1,014 1,065 1,116 1,170 1,227Corporate income 182 190 196 201 201 204 210 218 228 239 250 262Social insurance 539 577 604 629 652 678 706 737 772 805 839 871Other 120 129 150 152 157 163 169 174 178 182 187 193
Total 1,579 1,717 1,801 1,848 1,903 1,978 2,053 2,142 2,243 2,342 2,446 2,553On-budget 1,187 1,296 1,359 1,388 1,425 1,481 1,534 1,601 1,675 1,750 1,829 1,911Off-budget 392 421 442 460 478 497 519 541 568 592 618 643
OutlaysDiscretionary spending 548 552 564 569 570 567 581 595 610 626 641 657Mandatory spending 896 942 997 1,052 1,115 1,165 1,234 1,303 1,389 1,443 1,531 1,626Offsetting receipts -87 -84 -79 -84 -90 -101 -96 -99 -104 -109 -115 -121Net interest 244 244 238 232 221 209 198 189 178 166 153 140
Total 1,601 1,654 1,721 1,769 1,817 1,840 1,918 1,988 2,073 2,126 2,211 2,303On-budget 1,291 1,337 1,396 1,434 1,470 1,480 1,545 1,601 1,670 1,706 1,774 1,846Off-budget 311 317 325 335 347 359 373 387 402 419 437 456
Deficit (-) or Surplus -22 63 80 79 86 139 136 154 170 217 236 251On-budget deficit (-) or surplus -103 -41 -37 -46 -45 1 -10 a 5 44 55 64Off-budget surplus 81 104 117 125 131 138 146 154 165 173 181 186
Debt Held by the Public 3,771 3,717 3,655 3,589 3,518 3,395 3,275 3,136 2,981 2,779 2,557 2,320

SUMMARY xvii
is attributable in part to economic factors—the growthin taxable incomes is projected to slow to 4.1 percentin 1999, down from 5.8 percent in 1998. The rest co-mes from assuming that the factors responsible for theunexplained revenues in 1998 will add the sameamount to 1999 revenues. Should those factors in-crease in strength, revenues would rise at a faster rate.However, if the unexplained revenues in 1998 resultedlargely from temporary factors, the rate of growth ofrevenues in 1999 could decline more precipitously.
Even if revenues continue to grow rapidly in1999, CBO believes the rate of growth will eventuallyslow. Because of the scheduled tax cuts provided by
the Taxpayer Relief Act, and because corporate prof-its are expected to fall as a share of GDP, CBO pro-jects that over the next 10 years, the average growthrate of revenues will be slightly lower than the growthrate of the economy. Revenues are projected to growat the same rate as GDP from 2003 through 2008.During that period, individual income tax revenueswill grow faster than GDP because tax brackets areindexed for inflation but not for changes in real in-come, which boosts the effective tax rate as real in-come grows. But excise tax revenues will grow moreslowly than GDP because many rates are fixed innominal terms.
Summary Table 4.Continued
Actual1997 1998 1999 2000 2001 2002 2003 2004 2005 2006 2007 2008
As a Percentage of GDPRevenues
Individual income 9.3 9.8 9.7 9.5 9.4 9.4 9.3 9.3 9.4 9.4 9.5 9.5Corporate income 2.3 2.3 2.2 2.2 2.1 2.1 2.0 2.0 2.0 2.0 2.0 2.0Social insurance 6.8 6.9 6.9 6.9 6.9 6.8 6.8 6.8 6.8 6.8 6.8 6.8Other 1.5 1.5 1.7 1.7 1.7 1.6 1.6 1.6 1.6 1.5 1.5 1.5
Total 19.8 20.5 20.6 20.3 20.1 20.0 19.8 19.8 19.8 19.8 19.8 19.8On-budget 14.9 15.4 15.5 15.2 15.0 15.0 14.8 14.8 14.8 14.8 14.8 14.8Off-budget 4.9 5.0 5.0 5.0 5.0 5.0 5.0 5.0 5.0 5.0 5.0 5.0
OutlaysDiscretionary spending 6.9 6.6 6.4 6.2 6.0 5.7 5.6 5.5 5.4 5.3 5.2 5.1Mandatory spending 11.2 11.2 11.4 11.5 11.8 11.8 11.9 12.0 12.3 12.2 12.4 12.6Offsetting receipts -1.1 -1.0 -0.9 -0.9 -0.9 -1.0 -0.9 -0.9 -0.9 -0.9 -0.9 -0.9Net interest 3.1 2.9 2.7 2.5 2.3 2.1 1.9 1.7 1.6 1.4 1.2 1.1
Total 20.1 19.7 19.7 19.4 19.2 18.6 18.5 18.3 18.3 18.0 17.9 17.9On-budget 16.2 15.9 15.9 15.7 15.5 14.9 14.9 14.8 14.7 14.4 14.4 14.3Off-budget 3.9 3.8 3.7 3.7 3.7 3.6 3.6 3.6 3.6 3.5 3.5 3.5
Deficit (-) or Surplus -0.3 0.8 0.9 0.9 0.9 1.4 1.3 1.4 1.5 1.8 1.9 1.9On-budget deficit (-) or surplus -1.3 -0.5 -0.4 -0.5 -0.5 b -0.1 b b 0.4 0.4 0.5Off-budget surplus 1.0 1.2 1.3 1.4 1.4 1.4 1.4 1.4 1.5 1.5 1.5 1.4
Debt Held by the Public 47.3 44.3 41.7 39.3 37.1 34.3 31.6 28.9 26.3 23.5 20.7 18.0
SOURCE: Congressional Budget Office.
a. Deficit of less than $500 million.
b. Deficit or surplus of less than 0.05 percent of GDP.

xviii THE ECONOMIC AND BUDGET OUTLOOK: AN UPDATE August 1998
Current Outlay Projections for 1998 Through 2008
In dollar terms, total outlays are projected to growfrom $1,654 billion in 1998 to $2,303 billion in 2008.But as a percentage of GDP, they are projected to de-cline throughout the period—from 19.7 percent ofGDP in 1998 to 17.9 percent in 2008.
Net interest, which was the fastest-growing cate-gory of spending in the 1980s, is now projected to de-cline from $244 billion (2.9 percent of GDP) in 1998to $140 billion (1.1 percent of GDP) in 2008 as pro-jected surpluses reduce the stock of debt held by thepublic by $1.4 trillion. Discretionary spending is pro-jected to increase from $552 billion to $657 billionover that period but to shrink relative to the size of theeconomy—from 6.6 percent of GDP to 5.1 percent.By contrast, mandatory spending is expected to in-crease both in nominal terms (from $942 billion to$1,626 billion) and as a percentage of GDP (from11.2 percent to 12.6 percent).
Conclusion
An unexpected increase in revenues in 1998 has virtu-ally ensured that the total federal budget will be bal-anced for the first time in almost 30 years, and nothingcurrently visible on the horizon seems to threaten areturn to deficits in the near term if policies remainunchanged.
If any of a number of assumptions that CBO hasmade turn out to be off the mark, however, budgetoutcomes may be quite different than projected even ifthere are no changes in policy. For instance, it is pos-sible that the economy will be more robust than ex-pected or that the unexplained revenue effect will growover time, in which case the budget outlook will bemuch brighter than CBO currently projects. If in-stead, CBO's economic projections prove to be just alittle too optimistic, surpluses may be much lower thananticipated, while a recession similar to that of theearly 1990s may even produce a deficit. Likewise,surpluses may be lower than projected if the factorsthat produced the unexpected revenues in 1998 fadeaway quickly.
The budget outlook can improve or deterioraterapidly, in part because changes in the fiscal positionof the government tend to feed on themselves, produc-ing larger changes in the same direction. In the pastfew years, for example, a virtuous cycle has helpedimprove the budget outlook. Initial reductions in thedeficit have reduced the federal debt below what hadbeen anticipated. That reduction in the debt reducedfederal interest costs, which further reduced the defi-cit, and so on. But a reversal of those changes couldinitiate a vicious cycle—with increasing debt and in-creasing interest costs—that could eliminate the pro-jected surpluses. In the face of those uncertainties, thecurrent budget projections represent CBO's estimate ofthe middle of the range of likely outcomes.

Chapter One
The Economic Outlook
The U.S. economy has perfomed better in recentyears than it has in decades. Since 1994,growth in the economy’s productive capacity
has been accelerating, and the unemployment rate hasdropped to its lowest level since 1970. The underlyingrate of inflation has fallen to its lowest level in morethan 30 years and has been remarkably stable.
Few analysts predicted such a stunning economicperformance. By the same token, however, few ana-lysts today regard such strong growth without acceler-ating inflation as sustainable. The CongressionalBudget Office (CBO) believes that economic growthwill slow in the next few years and inflation will risemodestly.
In CBO’s forecast, real (inflation-adjusted) grossdomestic product (GDP) grows by an average of 2.9percent from the fourth quarter of 1997 to the fourthquarter of 1998 and by 2.1 percent from 1998 to 1999(see Table 1-1). The unemployment rate is expectedto average 4.6 percent this year and to rise onlyslightly, to 4.7 percent, next year. Owing to a small1.4 percent increase in the first half of 1998, the con-sumer price index (CPI) is expected to grow by only1.9 percent from the fourth quarter of 1997 to thefourth quarter of 1998, rising to 2.7 percent in 1999.Despite that increase in inflation, interest rates arelikely to remain close to their current levels. Thethree-month Treasury bill rate is forecast at 5.1 per-cent in 1998 and 5.2 percent in 1999. The 10-yearTreasury note rate is forecast to average 5.8 percent in
1998—just above its level at midyear—rising slightly,to 6.1 percent, in 1999.
For the years beyond 1999, CBO considers arange of possibilities for the path of the economy, tak-ing account of the possibility of booms and recessions,and chooses the middle of that range. In CBO's pro-jection for 2000 through 2008, growth of real GDPaverages 2.3 percent a year, and CPI inflation aver-ages 2.5 percent a year (see Figure 1-1). The unem-ployment rate averages 5.7 percent after 2001. Short-term interest rates are assumed to average 4.4 percentafter 2001; long-term interest rates stabilize at 5.4 per-cent.
That outlook represents CBO’s judgment of themost likely outcome for the economy, but it is by nomeans the only possible outcome. For one thing, allforecasts are prone to error—in the past, CBO’s fore-cast errors have been comparable with those of theAdministration and the Blue Chip consensus ofprivate-sector forecasts (see Appendix A). Moreover,the basic assumptions on which CBO’s outlook is con-ditioned may turn out to be incorrect. For example,the outlook would worsen if the Asian crisis turned outto be more severe than CBO anticipates. Alterna-tively, the outlook would improve over the near term ifthe favorable conditions that have subdued inflation inrecent years remained more effective than CBO ex-pects. Although such outcomes now appear less likelythan the realization of CBO’s basic assumptions, ifthose alternatives occurred, they could have a signifi-cant impact on the economy.

2 THE ECONOMIC AND BUDGET OUTLOOK: AN UPDATE August 1998
Table 1-1.The CBO Forecast for 1998 and 1999
Actual1997
Forecast1998 1999
Fourth Quarter to Fourth Quarter(Percentage change)
Nominal GDP 5.6 4.3 4.2Real GDPa 3.8 2.9 2.1GDP Price Indexb 1.7 1.4 2.1Consumer Price Indexc 1.9 1.9 2.7
Calendar Year Average(Percent)
Growth of Real GDPa 3.9 3.4 2.2Unemployment Rate 4.9 4.6 4.7Three-Month Treasury Bill Rate 5.1 5.1 5.2Ten-Year Treasury Note Rate 6.4 5.8 6.1
SOURCES: Congressional Budget Office; Department of Commerce, Bureau of Economic Analysis; Department of Labor, Bureau of LaborStatistics; Federal Reserve Board.
a. Based on chained 1992 dollars.
b. The GDP price index is virtually the same as the implicit GDP deflator.
c. The consumer price index for all urban consumers.
The Current State of the Economy
The recent performance of the U.S. economy has beentruly exceptional. That performance stems from acombination of favorable factors, some temporary andothers more enduring. Sharp declines in the prices ofimports and computers have temporarily lowered in-flation. Slower growth in the cost of medical care andcost-cutting efforts by U.S. businesses have also tem-porarily reduced inflationary pressures and boostedcorporate profits and stock market values. Good eco-nomic policy has contributed to a stable economic en-vironment, which, with the rise in the stock market,has bolstered consumer and business confidence. Inaddition, a weakening of foreign economies hasspurred capital inflows from abroad, lowering U.S.interest rates. High stock market values, low interest
rates, and strong confidence have encouraged busi-nesses to invest in plant and equipment, thus raisingthe productivity and wages of U.S. workers and theprofitability of U.S. firms.
One legacy of the economy’s recent performanceis slightly faster growth of potential GDP in comingyears. Because of the good inflation record, CBO haslowered its estimate of the nonaccelerating inflationrate of unemployment (the unemployment rate that isconsistent with stable inflation). The boom in capitalspending has significantly increased the growth of thenation’s capital stock. That development has raisedCBO’s estimate of the growth of potential GDP overthe next decade.
Nevertheless, the economy is showing many ofthe signs associated with the late stages of an expan-sion. Labor markets are stretched tight: since 1993,growth in the number of people employed has ex-

CHAPTER ONE THE ECONOMIC OUTLOOK 3
0
4
8
12
1980 1985 1990 1995 2000 2005
Inflation a
Percentage Change
Actual Projected
-3
0
3
6
9
1980 1985 1990 1995 2000 2005
Growth of Real GDPPercent
Actual Projected
0
2
4
6
8
10
1980 1985 1990 1995 2000 2005
Unemployment RatePercent
Actual Projected
Unemployment Rate
NAIRUb
12
16
0
4
8
1980 1985 1990 1995 2000 2005
Interest RatesPercent
Actual Projected
Ten-YearTreasury Notes
Three-Month Treasury Bills
Figure 1-1.The Economic Fo recast and Projection
SOURCES: Congressional Budget Office; Department of Labor, Bureau of Labor Statistics; Department of Commerce, Bureau of EconomicAnalysis; Federal Reserve Board.
NOTE: All data are annual values. Growth rates are year over year.
a. The consumer price index for all urban consumers. The treatment of home ownership in that index changed in 1983. The inflation series in thefigure uses a consistent definition of home ownership throughout.
b. CBO’s estimate of the nonaccelerating inflation rate of unemployment.
ceeded growth in the labor force (the number of peopleworking or actively seeking work). The unemploy-ment rate is well into the range associated with a risein inflation, and as a result, wage growth has acceler-ated. Meanwhile, skyrocketing equity prices have left
stock market values at record levels, and decliningresidential vacancy rates have led to an upturn inproperty values and rental rates. In addition, credithas become increasingly available, as evidenced bygrowth in some measures of the money supply and in

4 THE ECONOMIC AND BUDGET OUTLOOK: AN UPDATE August 1998
0
4.0
4.5
5.0
5.5
6.0
1945 1955 1965 1975 1985 1995
Ratio to Disposable Personal Income
Net Worth
Net WorthMinus Equities andMutual Funds
bank lending. Those developments may prevent theeconomy from performing as well over the next twoyears as it has recently.
Recent Economic Growth
During the past three years, real GDP has risen at anaverage rate of 3.7 percent a year—well above theestimated noninflationary potential growth of the econ-omy. However, inflation has not increased. In fact,the underlying rate of CPI inflation hovered at 2.4 per-cent in the first half of 1998, the same rate that pre-vailed in 1997 and below the 2.7 percent it posted in1996. With such low inflation, the Federal ReserveBoard has not found it necessary to raise interest ratessince 1997, even though the unemployment rate hasdropped to 4.5 percent. Moreover, over the past twoyears, the U.S. budget has moved from a deficit to asubstantial surplus, thereby converting a significantdrain on national saving into a source of financing forprivate investment.
Growth in both consumption and investment hascontributed to the strength of economic growth duringthe past three years. Consumption has grown by 3.7percent a year, substantially faster than disposablepersonal income; consequently, the personal sav-ing rate has dropped over those years to 0.6 percent.One factor fueling the strength of consumption is anenormous increase in the net worth of households since1994, largely the result of a 138 percent rise in thestock market since then (see Figure 1-2). The perfor-mance of investment has been even more dramaticthan that of consumption. Real spending on nonresi-dential construction has increased only slightly fasterthan GDP over the past four years, but real investmentin equipment has increased much faster (by 13.2 per-cent a year since 1994), reflecting especially large pur-chases of computers and communications equipment.
By most measures, the economy has remainedstrong this year. Quarterly growth of real GDP hasbeen choppy, reflecting the effects of a large swing ininventories and the strike against General Motors.Averaged over the first half of the year, however, realGDP has posted a solid advance, growing by 3.5 per-cent at an annual rate. Moreover, final sales have ac-celerated. Real final sales of goods and services grew
by 4.1 percent over the past two quarters, comparedwith 3.5 percent in 1997. Real domestic purchaseshave accelerated even more sharply this year, growingat a 5.8 percent pace during the first half of 1998.
So far, the major drag on growth in demand hasbeen the worsening of the trade balance. But domesticdemand will probably also have to slow down to re-store a balance between demand and supply. The nec-essary adjustment could be quite painless—the sought-for “soft landing” might occur without much action bythe Federal Reserve. That could turn out not to be thecase, but it is difficult now to pinpoint what, if any-thing, might go wrong.
The Labor Market and Wage Costs
Since 1993, the number of people employed has grown0.5 percentage points faster, on average, than the laborforce, and the unemployment rate has fallen below thenonaccelerating inflation rate of unemployment, orNAIRU. The pressure on the supply of labor has re-sulted in some increases in real wages. But the effectsof those wage gains on the overall rate of price infla-tion have been tempered by an acceleration in thegrowth of productivity, a relatively low rate of capac-
Figure 1-2.Household Net Worth
SOURCES: Congressional Budget Office; Department of Com-merce, Bureau of Economic Analysis; Federal ReserveBoard.
CHAPTER ONE THE ECONOMIC OUTLOOK 5
ity utilization, and a spate of special factors that havehelped subdue overall inflation. Even so, neither thesize of the working-age population nor the rate of la-bor force participation is likely to increase enough tosupport the current rate of employment growth with-out some rise in inflation.
Labor Force Growth. Growth in the labor force iscontributing less to the growth of the economy’s pro-ductive capacity than it used to. From World War IIuntil 1990, the size of the labor force increased by anaverage of 1.8 percent a year, accounting for a signifi-cant share of the estimated growth of potential GDP inthat period. That increase reflected both the growth ofthe working-age population (from natural increase andimmigration) and a substantial rise in the percentageof the working-age population that wanted to work.Since 1990, however, annual growth in the labor forcehas averaged only 1.1 percent.
The entry of new workers accelerated when thebaby boomers joined the labor force, but the youngestbaby boomers are now 33 and are already experiencedworkers. The people now entering the labor force forthe first time belong to the smaller “baby-bust” gener-ation. That demographic change, combined with ananticipated slowdown in immigration in coming years(compared with the past decade), leads CBO to expectonly relatively modest increases in the working-agepopulation.
The labor force participation rate (the labor forceas a percentage of the working-age population) alsoincreased before 1990, but that rate is now risingmuch more slowly. The proportion of men in the la-bor force drifted downward over a long period, reflect-ing earlier retirement, lower labor force participationamong the less educated as their prospects declined,and more time spent in school. The trend toward ear-lier retirement among male workers appears to havehalted, but the relative returns from greater educationand skills continue to increase school enrollments andpostpone entry into the labor force. Until about 1990,the falling proportion of working-age men in the laborforce was more than offset by the large increase in theproportion of working-age women. (The participationrate for women between the ages of 25 and 54 rosefrom 40 percent in the 1950s to 77 percent in 1997.)That increase has slowed dramatically since 1990,which is perhaps not surprising given that women’s
participation in the labor force is now closer to that ofmen. During the 1990s, the bulk of the growth in thelabor force has come from population growth.1
With such a slow natural increase in theworking-age population, and only a modest increase inlabor force participation, the growth of employmenthas lowered the unemployment rate. It has also drawnsome people into jobs who had not reported on surveysthat they were looking for work. If employment con-tinues to grow that way in the future, it will probablybecome increasingly expensive, as employers boost thewages they offer to lure workers into their jobs. Wagepressures are already intensifying—over the first halfof this year, the employment cost index (ECI) grew atan average annual rate of 4 percent, 0.5 percentagepoints more than in 1997. So far, the costs of higherwage growth have been largely offset for employers byincreases in productivity growth and declines in thecost of medical insurance. But those offsetting factorsmay no longer prove sufficient to keep the upwardpressure from wages on employers’ costs in checkover the next two years.
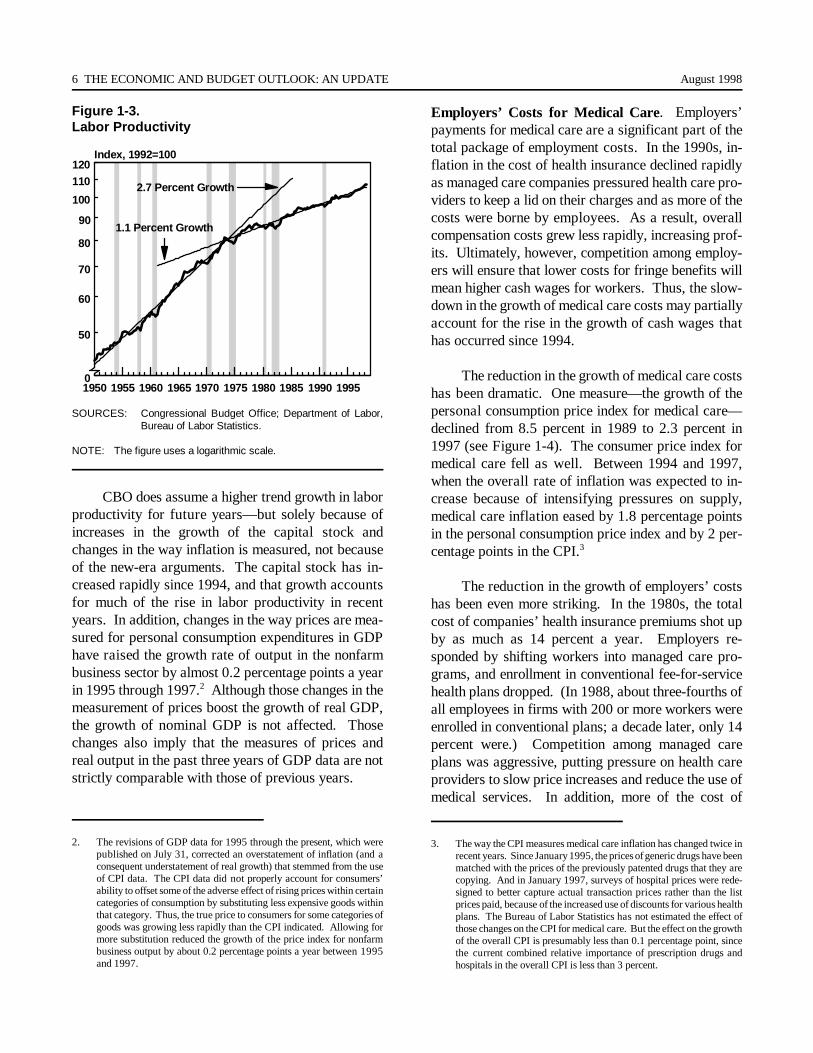
Productivity Growth. The measured trend forgrowth in labor productivity has consistently beenabout 1.1 percent since 1973, averaged over variousbusiness cycles (see Figure 1-3). That same 1.1 per-cent trend rate also seems to characterize the growthof productivity since the most recent business-cyclepeak in 1990. The behavior of productivity growthhas been somewhat unusual in this latest cycle, how-ever. After shooting upward, as expected, early in therecovery, growth in labor productivity slumped from1993 through 1995, before bouncing back in 1996 and1997 to grow by 1.9 percent. Some analysts claimthat the recent growth in excess of the 1.1 percenttrend is an indication that the trend growth of laborproductivity has increased. They argue that the econ-omy has entered a new era—that an acceleration intechnological change (specifically in information tech-nology), an increase in competitive pressures, and areduction in government involvement in economiesworldwide will cause trend productivity growth to begreater in the future than it was from 1973 to 1995.
1. Changes in the techniques used to collect labor force data have alsocontributed to the slower growth in the estimated labor force. See A.E.Polivka and S.M. Miller, The CPS After the Redesign: Refocusing theEconomic Lens, Working Paper No. 269 (Department of Labor,Bureau of Labor Statistics, March 1995).
6 THE ECONOMIC AND BUDGET OUTLOOK: AN UPDATE August 1998
0
50
60
70
80
90
100
110120
1950 1955 1960 1965 1970 1975 1980 1985 1990 1995
Index, 1992=100
2.7 Percent Growth
1.1 Percent Growth
Figure 1-3.Labor Productivity
SOURCES: Congressional Budget Office; Department of Labor,Bureau of Labor Statistics.
NOTE: The figure uses a logarithmic scale.
CBO does assume a higher trend growth in laborproductivity for future years—but solely because ofincreases in the growth of the capital stock andchanges in the way inflation is measured, not becauseof the new-era arguments. The capital stock has in-creased rapidly since 1994, and that growth accountsfor much of the rise in labor productivity in recentyears. In addition, changes in the way prices are mea-sured for personal consumption expenditures in GDPhave raised the growth rate of output in the nonfarmbusiness sector by almost 0.2 percentage points a yearin 1995 through 1997.2 Although those changes in themeasurement of prices boost the growth of real GDP,the growth of nominal GDP is not affected. Thosechanges also imply that the measures of prices andreal output in the past three years of GDP data are notstrictly comparable with those of previous years.
Employers’ Costs for Medical Care. Employers’payments for medical care are a significant part of thetotal package of employment costs. In the 1990s, in-flation in the cost of health insurance declined rapidlyas managed care companies pressured health care pro-viders to keep a lid on their charges and as more of thecosts were borne by employees. As a result, overallcompensation costs grew less rapidly, increasing prof-its. Ultimately, however, competition among employ-ers will ensure that lower costs for fringe benefits willmean higher cash wages for workers. Thus, the slow-down in the growth of medical care costs may partiallyaccount for the rise in the growth of cash wages thathas occurred since 1994.
The reduction in the growth of medical care costshas been dramatic. One measure—the growth of thepersonal consumption price index for medical care—declined from 8.5 percent in 1989 to 2.3 percent in1997 (see Figure 1-4). The consumer price index formedical care fell as well. Between 1994 and 1997,when the overall rate of inflation was expected to in-crease because of intensifying pressures on supply,medical care inflation eased by 1.8 percentage pointsin the personal consumption price index and by 2 per-centage points in the CPI.3
The reduction in the growth of employers’ costshas been even more striking. In the 1980s, the totalcost of companies’ health insurance premiums shot upby as much as 14 percent a year. Employers re-sponded by shifting workers into managed care pro-grams, and enrollment in conventional fee-for-servicehealth plans dropped. (In 1988, about three-fourths ofall employees in firms with 200 or more workers wereenrolled in conventional plans; a decade later, only 14percent were.) Competition among managed careplans was aggressive, putting pressure on health careproviders to slow price increases and reduce the use ofmedical services. In addition, more of the cost of
2. The revisions of GDP data for 1995 through the present, which werepublished on July 31, corrected an overstatement of inflation (and aconsequent understatement of real growth) that stemmed from the useof CPI data. The CPI data did not properly account for consumers’ability to offset some of the adverse effect of rising prices within certaincategories of consumption by substituting less expensive goods withinthat category. Thus, the true price to consumers for some categories ofgoods was growing less rapidly than the CPI indicated. Allowing formore substitution reduced the growth of the price index for nonfarmbusiness output by about 0.2 percentage points a year between 1995and 1997.
3. The way the CPI measures medical care inflation has changed twice inrecent years. Since January 1995, the prices of generic drugs have beenmatched with the prices of the previously patented drugs that they arecopying. And in January 1997, surveys of hospital prices were rede-signed to better capture actual transaction prices rather than the listprices paid, because of the increased use of discounts for various healthplans. The Bureau of Labor Statistics has not estimated the effect ofthose changes on the CPI for medical care. But the effect on the growthof the overall CPI is presumably less than 0.1 percentage point, sincethe current combined relative importance of prescription drugs andhospitals in the overall CPI is less than 3 percent.

CHAPTER ONE THE ECONOMIC OUTLOOK 7
Health Benefits
-5
0
5
10
15
20
25
1980 1982 1984 1986 1988 1990 1992 1994 1996 1998
Percentage Change from Previous Year
Total Benefits
0
2
4
6
8
10
12
14
1975 1980 1985 1990 1995
Percentage Change from Previous Year
Consumer Price Index for Medical Care
Personal Consumption Price Index for Medical Care
Figure 1-4.Medical Care Inflation
SOURCES: Congressional Budget Office; Department of Labor,Bureau of Labor Statistics; Department of Commerce,Bureau of Economic Analysis.
health care appears to have been shifted from employ-ers to current and retired workers. As a result of thosechanges, the per-employee cost of medical insurancepremiums, which grew by 13 percent in 1989, did notgrow at all in 1997 (see Figure 1-5). The drop in thegrowth of those costs has helped businesses offset theincreasing growth of wages, keeping the growth ofunit labor costs low. That in turn has helped subdueinflation and strengthen profits.
Recent evidence suggests that the deceleration inmedical costs is nearing an end. Inflation in the CPIfor medical care has begun to pick up—in the firsthalf of this year, the index increased at an average an-nual rate of 3.7 percent, up nearly 1 percentage pointfrom the 1997 rate. Moreover, as managed care plansbecome the dominant form of health care coverage, theability to further reduce growth in medical costs byshifting workers to such plans becomes more limited.
The NAIRU. CBO bases its estimate of the nonac-celerating inflation rate of unemployment on an analy-sis of the relationship between unemployment and in-flation using a model known as the Phillips curve. Inthat model, inflation tends to rise if the unemploymentrate is below the NAIRU and tends to fall if the rate isabove the NAIRU.
The unemployment rate is now well below mostestimates of the NAIRU. Some analysts argue that thefact that inflation has not yet sped up is evidence thatthe NAIRU is temporarily very low, perhaps as low asthe unemployment rate (although few would suggestthat such a low NAIRU could persist). That argumentis equivalent to CBO’s view, which is that the fortu-nate concurrence of a strong dollar, low medical careinflation, and falling oil and computer prices has tem-porarily offset the price pressures coming from thelow unemployment rate.
CBO has, however, lowered its estimate of theNAIRU to 5.6 percent from the 5.8 percent used inlast January’s forecast. That revision stems largelyfrom an update of the econometric equation used tocompute the NAIRU. Including more recent data inthe equation lowers the estimated NAIRU and movesCBO’s estimate closer to the consensus estimate ofother economists. That revision, however, does notalter CBO’s view that labor markets are extremelytight.
Emerging Pressures on Wage Costs. The funda-mental concern about wage costs is that, with littleslack remaining in the labor market, they could begin
Figure 1-5.Benefits per Hour
SOURCE: Department of Labor, Bureau of Labor Statistics.
NOTE: These numbers come from the employment cost index fortotal benefits and for health benefits in private industry.

8 THE ECONOMIC AND BUDGET OUTLOOK: AN UPDATE August 1998
0
4
6
8
10
12
1970 1975 1980 1985 1990 1995
Percentage of GDP
Health Benefit Costsc
Interest Costs b
Corporate Profitsa
to accelerate more rapidly. Until recently, the spurt inproductivity growth and declining costs of medicalcare to employers have offset the rising cost of cashwages, protecting profits and preventing higher wagesfrom spilling over into higher prices. Although stillgrowing rapidly, productivity has not accelerated overthe past three quarters, allowing accelerating growthin wages and medical costs to catch up. Whether theeconomy will slow enough to contain the increase inwage costs remains to be seen.
The Boom in Capital Spending
Growth of real business expenditures for plant andequipment has outpaced growth of GDP by more than6 percentage points since 1993. The supply of capitalhas increased with demand as businesses have beenable to find ready internal and external sources of fi-nance. As a result, capital costs have remained rela-tively low, and, most important, the current expansionhas substantially enhanced the economy’s productivecapacity.
Capital Spending. Since 1993, real business spend-ing on plant and equipment has increased by morethan 9 percent a year. Moreover, the percentage ofthat investment going to replace worn-out plant andequipment has declined steadily for the past five years.As a result, net investment in plant and equipment hasgrown by about 25 percent a year since 1993. Thatfour-year performance is stronger than the growth dur-ing any other four-year period since the 1960s. Re-markably, the boom in capital spending on plant andequipment has reduced the rate of capacity utilizationlate in the expansion, when it would have been ex-pected to increase. The boom has also contributed tothe recent spurt in productivity growth.
The sources of that boom are not hard to find.The most important one has been the high level of cor-porate profits, which has boosted internal sources offinance for businesses and given them an incentive toincrease capacity by adding to their capital. Corpo-rate profits were already rising rapidly because of thedramatic decline in corporate debt burdens after the1990-1991 recession (see Figure 1-6). They receivedfurther boosts from the lower cost of productive inputsand the decline in employer-paid health insurance
costs since 1994 and from the spurt in productivity in1996. Only late last year did the growth of corporateprofits begin to show signs of faltering, as growth ofcompensation costs exceeded growth of productivity.
A second, related factor in the capital spendingboom has been the low and stable cost of capital forbusinesses. Increases in stock prices have dramati-cally lowered the corporate sector’s cost of capital. Atthe same time, the rate of inflation has remained lowand remarkably stable (see Figure 1-7). That in-creased stability not only lowers the risk premiumsinherent in the cost of equity and bond finance but alsomakes the real cost of capital more predictable, thusreducing the "market risk" associated with any capitalinvestment. That is, if investors can be relatively surethat capital costs will fluctuate only slightly, they willbe better able than they would in a more turbulent en-vironment to assess, and possibly more willing to un-dertake, costly and often irreversible multiyear invest-ment projects. The increased stability of capital costs
Figure 1-6.Corporate Profits, Interest Costs, andHealth Benefit Costs
SOURCES: Congressional Budget Office; Department of Com-merce, Bureau of Economic Analysis.
a. The ratio of economic profits to nominal GDP.
b. The ratio of interest paid by businesses to nominal GDP.
c. The ratio of employer payments for health insurance to nominalGDP.

CHAPTER ONE THE ECONOMIC OUTLOOK 9
0
0.5
1.0
1.5
2.0
2.5
3.0
3.5
4.0
1960 1965 1970 1975 1980 1985 1990 1995
Percentage Points
0
2
4
6
8
10
12
1960 1965 1970 1975 1980 1985 1990 1995
Percentage of Disposable Personal Income
Figure 1-7.Volatility in the Core Rate of CPI Inflation
SOURCES: Congressional Budget Office; Department of Labor,Bureau of Labor Statistics.
NOTE: Volatility is measured using the annual averages of monthlyestimates of the standard deviation of the underlying rate ofinflation in the consumer price index (CPI), conditional oninformation prior to that month. The technique used for esti-mating the monthly volatility measures is described in G.William Schwert, "Why Does Stock Market Volatility ChangeOver Time?" Journal of Finance, vol. 44, no. 5 (December1989), pp. 1115-1153.
has undoubtedly contributed to the endurance of theboom in capital spending.
That boom has also been spurred by astonishingadvances in high-tech assets, particularly computers.Adjusted for quality improvements, computer priceshave been plummeting, which enables businesses tobuy a great deal of computing power for relativelylittle outlay. Other high-tech goods, such as computerperipherals and communications equipment, have alsoseen price declines and rapid real increases in demand,although not quite as dramatic as those for computers.
The Supply of Financial Capital. Aside from highercorporate profits, the increase in demand for capitalgoods has been financed from sources that would nothave been expected just a few years ago. Personalsaving has remained remarkably low through the cur-rent expansion, limiting that source of capital finance.But a sharp reversal of the federal government’s bud-get deficit and increased inflows of capital fromabroad have increased the sources of funds availablefor investment. In the absence of those sources, the
rapid acceleration of demand for capital in recentyears might have increased the cost of capital morequickly than has occurred.
Personal saving, generally a major source of fi-nancing for investment, has not contributed as muchas might be expected to the growth in the supply ofcapital. As a percentage of disposable personal in-come, the personal saving rate hit an all-time low of0.6 percent in the second quarter of 1998 (see Figure1-8). Much of that decline can be attributed to thestrength of the stock market. If people perceive them-selves to be getting richer through the market's rise,they are more willing to incur debt, which reducesoverall personal saving. In addition, the way the na-tional income and product accounts (NIPAs) measurepersonal income does not include capital gains distrib-uted to households. As a result, when capital gainsdistributions are high, people may base their consump-tion decisions on a substantially greater income than ismeasured in the NIPAs, and the saving rate is likely todecline.
A budget deficit of $107 billion in 1996 hasgiven way to an anticipated surplus of $63 billion thisyear. Does the emergence of that surplus simply re-flect the temporary strength of an economy at the topof a business cycle, or is it a more permanent improve-
Figure 1-8.The Personal Saving Rate
SOURCES: Congressional Budget Office; Department of Com-merce, Bureau of Economic Analysis.

10 THE ECONOMIC AND BUDGET OUTLOOK: AN UPDATE August 1998
ment? The tax increases and restraints on spendingimposed in recent budget agreements have played arole in improving the budgetary picture, but they areinsufficient to explain the extent of that improvement.Sorting out the temporary influences of the businesscycle is particularly difficult because the reasons forthe recent surge in revenues are not completely under-stood (see Chapter 3).
Although the source of the budgetary improve-ment is still somewhat mysterious, its impact on na-tional saving is less so. Eliminating the deficit haslowered the federal government's borrowing require-ment, thus freeing up loanable funds for the boom in
domestic investment and offsetting a substantial partof the shortfall in personal saving.
Capital inflows from investors overseas haveprovided the other major source of financing to meetthe increased demand for domestic investment. For-eign investors have increasingly sought the security ofU.S. capital markets, particularly over the past year,as Asia's troubles have mounted and Japan’s economyhas sunk further into its apparently intractable diffi-culties (see Box 1-1). Capital inflows provided 8 per-cent of the funds for U.S. investment in 1997 and 10percent in the first half of 1998.
Box 1-1.The Cloud of the Asian Crisis Lingers On
More than a year has passed since the economic crisiserupted in Asia, but the region's woes are far fromover. Demand and activity in much of Asia continueto weaken. Consumption is falling and unemploy-ment rising, not only in Indonesia, South Korea, andThailand, but also, to a lesser extent, in Hong Kong,Malaysia, China, and Japan. Even the economies ofTaiwan and Singapore have been dragged down bythe weakness in the rest of the region.
The hardest-hit country has been Indonesia,where gross domestic product (GDP) is projected toplummet by more than 10 percent this year. Thatpainful adjustment has sparked political unrest, whichled to the toppling of the longtime ruler, GeneralSuharto. The situation is less dire in South Korea andThailand, but the road to recovery in those countriesis still a rocky one. Malaysia and Hong Kong arenow in recession as well; and although China is not,its growth has slowed markedly. China is also crip-pled by the huge volume of bad loans in its bankingsystem and is threatened by rising unemployment,deflationary pressure, the collapse of competing cur-rencies, and the fallout from a massive restructuringof state enterprises.
How the postcrisis adjustment unfolds in Asiawill depend to a significant extent on developments inthe Japanese economy and currency. News from Ja-pan, however, does not bode well for a speedy recov-ery in the region.
Japan is now mired in its most severe recessionsince the end of World War II. Real GDP fell at anannual rate of 5.3 percent in the first quarter of 1998,after contracting 1.5 percent in the previous quarter.The jobless rate hit a postwar peak of 4.1 percent inMay. Bankruptcies are also at an all-time high. Wor-ries about jobs and the fragility of financial institu-tions have made consumers unwilling to spend. Busi-nesses, struggling under a mountain of debt and ex-cess capacity, are slashing investment, and exports tothe rest of Asia are falling. The massive volume ofbad loans in the banking system (probably far largerthan the official estimate of 77 trillion yen, or 15 per-cent of GDP) has resulted in a credit crunch, eventhough the Bank of Japan has kept the official dis-count rate at just 0.5 percent since September 1995.Commercial banks not only have been unwilling tolend but also have begun raising effective rates on theloans they do make to compensate for credit risk.
Unless something is done soon to spur demandin Japan, the rise in effective lending rates in themidst of price deflation could deepen the recessioneven further. In the spring, the government passed arecord fiscal stimulus package (worth 16 trillion yen,about 3 percent of GDP) for fiscal year 1998, includ-ing a tax cut of about 4 trillion yen (0.8 percent ofGDP) over the 1998-1999 period. It also earmarked30 trillion yen (about $215 billion) for protecting de-positors and stabilizing the financial system andpledged to create a "bridge-bank" scheme that would

CHAPTER ONE THE ECONOMIC OUTLOOK 11
Although reliance on foreigners to supply fundsfor investment helps the U.S. economy avoid painfuladjustments over the short run, it has a long-run draw-back. What the United States borrows from foreignersmust eventually be repaid, so the additional investmentmade possible by the capital inflows does not add sig-nificantly to the future well-being of U.S. residents.Nor does it provide as fruitful a base for U.S. taxationas would investment based on domestic saving, sinceincomes to foreigners largely escape U.S. taxes.
Financial Markets and Monetary Policy
Low and stable price inflation—in concert with soar-ing stock prices, greater capital inflows, and cautiousmonetary policy—has contributed to a stable eco-nomic environment that has bolstered consumer andbusiness confidence. That favorable environment hasbeen called a "virtuous cycle" because in some ways itfeeds on itself, at least for a time. As optimistic valua-tions in the stock market are rationalized by strong
Box 1-1.Continued
resolve the problems of failing banks and maintainlending to financially healthy borrowers. More re-cently, Japan’s new government has proposed otherstimulative measures, hoping to restore enough con-sumer and corporate confidence to trigger a recovery.
Reflecting Japan’s desperate economic condi-tion, the yen has depreciated sharply relative to thedollar. It is likely to weaken further if more capitalleaves the country in search of higher rates of returnabroad. A weaker yen could prove disastrous for theother Asian countries struggling to recover from theirslumps, even though it may be what Japan needs tohelp reflate its own economy.
As the fallout of the Asian crisis increasinglyhits the rest of the world, the outlook for globalgrowth is likely to be precarious for the rest of 1998.Some key emerging economies that depend heavily onforeign capital—such as Brazil, Mexico, and Russia—will be especially challenged. Mexico has alreadytightened money-market conditions and announcedthree sets of budget cuts in response to the inflationdangers posed by a weakening currency and fallingexport revenues. For its part, Russia has been strug-gling desperately to protect the ailing ruble by raisinginterest rates to unsustainable levels.
Partly because of the spillover effect of the Asiancrisis, growth in North America is expected to slownoticeably. Real economic activity in Canada andMexico is showing signs of slowing to more sustain-able rates in 1998 after above-trend growth in 1997.
Solid employment growth will continue to bolsterconsumer spending in both countries, but their ex-ports to the United States will be further squeezed bycheaper Asian imports. The recent strike againstGeneral Motors and the resulting two-month shut-down of GM assembly operations may have dealt anadditional setback to manufacturing output in Mexicoand Canada.
Fortunately, low inflation in Europe and theUnited States gives policymakers there some scope tobe less restraining. And the fact that business cyclesaround the world are not synchronized right now willcontinue to help stabilize the global economy.
Domestic demand in Europe is unmistakablypicking up, even though the pace of improvement var-ies among sectors and countries. European exportersare experiencing a sharp slowdown in their sales toAsia, but that drag has not crimped the momentum ofgrowth. The economic upturn in Europe is beingfueled by low real interest rates, competitive curren-cies, and the end of fiscal tightening. Moreover,years of weak spending in the region have left consid-erable pent-up demand for durable goods. In addi-tion, unemployment has been falling almost every-where in Europe. That powerful combination shouldcarry the upturn well beyond this year. And nextyear, the region’s fiscal policy may even become stim-ulative, despite urgings by the newly established Eu-ropean Central Bank for member countries to furtherreduce their structural budget deficits.

12 THE ECONOMIC AND BUDGET OUTLOOK: AN UPDATE August 1998
corporate earnings, investment is stimulated, confi-dence is fueled, and those repercussions lead to evenhigher valuations of future corporate performance.Moreover, soaring confidence has made foreignersmore willing to invest in dollar-denominated assets,thereby raising the U.S. dollar and helping to ease in-flationary pressures.
The abundance of credit and favorable terms infinancial markets have further reinforced the virtuouscycle. With the reduction in the federal demand forcredit, banks and other lenders have redeployed theirloanable funds aggressively toward private-sector bor-rowers; spurred by low interest rates and a strongstock market, the demand for credit has responded vig-orously. The boost in lending has been reflected inaccelerated growth of the measures of the money sup-ply known as M2 and M3—and has not gone unno-ticed by the Federal Reserve. Although the centralbank does not target those money measures officially,it does establish benchmark ranges for them, and thegrowth rates of M2 and M3 have exceeded the upperlimits of their respective ranges since the middle of1997. In its midyear report to the Congress, the Fed-eral Reserve recognized the possibility that M2 andM3 could be growing too fast to be consistent withlow inflation.4
The Federal Reserve has, however, focused onmaintaining the federal funds rate at a level it per-ceives to be consistent with the objectives of low infla-tion and sustainable long-term growth. By that mea-sure, monetary policy has been exceptionally steady.The federal funds rate has not changed since it wasraised slightly—by 25 basis points (or 0.25 percentagepoints) to 5.5 percent—in March 1997. The successof Federal Reserve policy, along with the decline infederal borrowing, has undoubtedly helped reduce ex-pectations of inflation. As a result, long-term interestrates, which are most affected by those expectations,have fallen substantially over the past year. Withother short-term rates held steady by the unchangedfederal funds rate, the spread between the rates on 10-year Treasury notes and three-month Treasury billshas narrowed, suggesting that investors expect infla-
tion to remain steady and relatively low for the fore-seeable future. Barring such shocks as a dramaticworsening of the Asian crisis or a sudden collapse inU.S. stock prices, the Federal Reserve is expected toraise short-term rates only slightly through the nearterm.
Favorable Price Developments
Three positive developments in the area of prices have—independently of each other—made it possible forthe economy to post rapid noninflationary growth rateseven as labor markets have tightened over the pastfour years. First, the appreciation of the U.S. dollarand a corresponding decline in import prices haveopened up low-cost sources of supply to U.S. produc-ers, thereby keeping the costs of basic and semimanu-factured inputs low in this country. Second, an accel-eration in the decline of computer prices has dampenedinflationary pressures over the past several years.Third, the lower rate of increase in medical care costs,already mentioned as a factor holding down employers'costs, has had a direct impact on prices. Taken to-gether, those developments have probably lowered theoverall rate of inflation in the GDP price index bymore than a percentage point per year since 1994.
Reduced Import Prices. Since mid-1995, the dollarprices of merchandise imports other than petroleumand computers have fallen at an average rate of 2.9percent a year. During the same period, the overallprice of imported goods and services fell at an averageannual rate of 4.0 percent, the sharpest sustained de-cline since the 1950s.
The decline in import prices was well timed. Justas the productive capacity of the U.S. economy wasbeginning to be stretched thin, world economies weak-ened, thus strengthening the relative position of theUnited States and causing the value of the dollar torise against other currencies. Early on, the dollar rosebecause the Canadian and European economies weak-ened and uncertainties emerged about the future Euro-pean single currency. In 1997, just as those countriesbegan to recover more briskly, the Asian crisis burston the scene, further propelling the dollar’s ascent (seeFigure 1-9). A strong dollar helps lower the cost offoreign supplies in the United States.
4. Board of Governors of the Federal Reserve System, Monetary PolicyReport to the Congress Pursuant to the Full Employment andBalanced Growth Act of 1978 (July 21, 1998).

CHAPTER ONE THE ECONOMIC OUTLOOK 13
-10
0
10
20
30
40
50
0
0.80
1.00
1.20
1.40
1.60
1970 1975 1980 1985 1990 1995
Percentage Change from Previous Year
Exchange Rate(Right scale)
Import Price Inflation (Left scale)
Level
a
b
0
220
240
260
280
300
320
0
10
15
20
25
30
35
40
1980 1985 1990 1995
Index, 1967=100 Dollars per BarrelCommodity PriceIndex for All Commodities(Left scale)
Refiner's Acquisition Cost of Imported Crude Oil (Right scale)
Weak worldwide demand also kept commodityprices down precisely at the time that U.S. demandwas accelerating. Commodity prices have fallen at anaverage annual rate of 2.5 percent since mid-1995.That decline has depressed domestic commodity-producing sectors such as agriculture, but it hasproved to be a bonus for U.S. manufacturers.
An additional disinflationary impulse arrived inearly 1997 when oil prices began to fall. Since then,the price of imported crude oil has dropped from morethan $20 per barrel to less than $13 (see Figure 1-10).That decline appears to reflect both demand and sup-ply factors. On the demand side, the weakness inAsian economies has lessened their demand for oil.On the supply side, the United Nations relaxed itssanctions on Iraqi oil production in 1997 and furtherincreased Iraq’s quota for 1998. Moreover, improvedtechniques for deep-sea petroleum extraction havelowered production costs per barrel for many oil pro-ducers.
Figure 1-9.The U.S. Dollar Exchange Rate andImport Price Inflation
SOURCES: Congressional Budget Office; Department of Com-merce, Bureau of Economic Analysis; Federal ReserveBoard.
a. A trade-weighted measure of the exchange value of the U.S. dol-lar relative to the currencies of the G-10 nations.
b. The rate of change in the chain-weighted price index for importstaken from the national product accounts.
Figure 1-10.Commodity and Crude Oil Prices
SOURCES: Congressional Budget Office; Knight-Ridder Financial.
Accelerated Decline in Computer Prices. Alreadyon the decline for more than a decade, computer pricesbegan to plunge at a faster rate in 1995, further lower-ing the overall rate of inflation. Throughout the 1980sand into the early 1990s, the extraordinarily rapidpace of technological innovation lowered quality-adjusted computer prices at double-digit rates. Be-tween 1983 and 1994, for example, the prices of com-puters exported or sold to domestic businesses de-clined by approximately 13 percent a year, and theprices of those sold to households fell by more than 15percent. Since 1995, those prices have plummetedeven faster, dropping at an average annual rate ofabout 23 percent and 30 percent, respectively. CBOestimates that the accelerated decline in computerprices has lowered the overall rate of GDP price infla-tion by 0.2 percentage points a year since 1995.
The fundamental reason for declining computerprices is the technological innovation that lets manu-facturers squeeze ever more onto a computer chip,vastly increasing its power and speed in relation to itscost. However, excess production capacity amongmanufacturers of memory chips also contributed to a46 percent decline in the price of those chips in 1996(see Figure 1-11). The market for memory chips ishighly competitive, and the industry has undergoneperiodic episodes of overcapacity and undercapacity.Currently, the chip industry has excess capacity

14 THE ECONOMIC AND BUDGET OUTLOOK: AN UPDATE August 1998
-80
-60
-40
-20
0
20
1975 1980 1985 1990 1995
Memory Chips
Microprocessors
Percentage Change from Previous Year
Figure 1-11.Changes in the Prices of Key Computer Components
SOURCES: Congressional Budget Office; Department of Com-merce, Bureau of Economic Analysis.
(which depresses prices), but that situation is notlikely to persist.
Intensified competition among suppliers of mi-croprocessors has depressed their prices by more than60 percent a year since 1995. That reduction is alsolikely to be a one-time occurrence, as competitionpushes prices down to the levels that are technologi-cally feasible. But determining whether the increasedcompetition has reached those levels is difficult.
Deceleration in Medical Costs. The reduction in in-flation for medical care costs has reduced overall in-flation. Its biggest impact is in the NIPA price mea-sures: the GDP price index and the personal con-sumption price index. Medical care expendituresmake up more than 12 percent of GDP and about 15percent of personal consumption; changes in prices formedical care, therefore, have a large direct weight onthose overall measures. The deceleration in the cost ofmedical care has lowered the rate of inflation in theGDP price index by an average of 0.2 percentagepoints a year since 1994. That reduction reflects theimpact on employers' costs for medical insurance, gov-ernment costs, and employees' out-of-pocket and un-covered expenses.
Effects on the overall CPI have been smaller,however, in part because they reflect only out-of-pocket costs. (The relative importance of medicalcosts was about 7 percent before the January 1998rebenchmarking of the CPI and is now about 5 per-cent.) In addition, the CPI measures of medical careinflation themselves declined by less than the NIPAmeasures.5 As a result, the impact of the decline inmedical costs on CPI inflation has been an averagereduction of 0.1 percentage point a year since 1995.
Signs of Inflationary Pressures
To varying degrees, each of those favorable price de-velopments is showing signs of dissipating. Moreover,growth in productivity is not likely to accelerate fur-ther. As those mitigating factors run their course, theeconomy will be more vulnerable than in recent yearsto the growing labor-market pressures that threaten toincrease the overall rate of inflation.
By their nature, none of the favorable price de-velopments of the past few years could be expected tosubdue overall inflation indefinitely. Medical careinflation is already showing signs of increasing.Moreover, the dollar will not appreciate forever—eventually, the rising trade deficit will overwhelm thefactors pushing the dollar up. In fact, the dollar maynow be slowing its rate of appreciation. Over the firsthalf of 1998, a measure of the dollar’s exchange valuerelative to the currencies of the G-10 countries rose atan annual rate of 5.9 percent, compared with 10.3 per-cent in 1997. Even if the dollar had already stoppedrising, however, the lagged effects of its recent appre-ciation would keep import prices declining, albeit at adiminishing rate, probably through this year and thenext.
The prognosis for the accelerated deflation incomputer prices is harder to judge—projecting the rateof future declines in those prices is at least as difficultas predicting the technological advances and competi-
5. The CPI and the personal consumption price index use differentmeasures of medical care inflation. Since the mid-1990s, the personalconsumption price index for the bulk of medical care expenditures hasbeen based on the producer price measures, which use different surveytechniques than the CPI and which include prices that the governmentpays for Medicare and Medicaid patients.

CHAPTER ONE THE ECONOMIC OUTLOOK 15
-2
-1
0
1
2
3
4
5
1985 1987 1989 1991 1993 1995 1997
Percentage Points
Unemployment Gap
Wage Growth
b
a
tive pressures that might spawn them. Preliminarydata for the first half of this year suggest a more mod-erate rate of decline than was the case in recent years,but it is really too soon to be sure.
Without those factors, the economy is likely toshow clearer signs of overheating. Labor markets arenow extremely tight. The unemployment rate is lowerthan it has been since early 1970, and it has been wellwithin the inflationary range since mid-1996. Wagepressures are intensifying: growth of the ECI for pri-vate wages and salaries accelerated to a 4 percent an-nual rate during the first half of 1998. Rising unitlabor costs—the result of stronger growth in wagesand benefits without any further acceleration in pro-ductivity growth—increase pressure on profits and,ultimately, on product prices.
The Economic Forecast for 1998 and 1999
CBO believes that the stage is set for a modest slow-ing in the growth of real GDP and slight increases ininflation and interest rates (see Tables 1-2 and 1-3).However, the economy has considerable momentumand is unlikely to weaken severely in the near term.Because consumption will probably remain strong fora few more quarters, real GDP growth for the rest of1998 and early 1999 is likely to ease only slightlyfrom its recent pace. But the worsening trade deficit,rising inflation, and weaker profit growth this year willundermine GDP growth and cause a small rise in in-terest rates and slower investment growth. Thosechanges, in turn, are likely to slow the growth of em-ployment and consumption by the middle of next year.
Taxable Incomes
The share of GDP accounted for by wage and salarydisbursements is expected to rise this year and remainbasically unchanged next year. That slight rise re-flects the pressure of tight labor markets on laborcompensation. The unemployment rate has droppedabout a percentage point since the middle of 1996, andthe growth in wages has picked up as the unemploy-
ment rate has fallen (see Figure 1-12). CBO estimatesthat the point at which upward wage pressures buildbecause of labor-market tightness is an unemploymentrate of about 5.6 percent; the recent pickup in wagegrowth supports that view.
After a spectacular rise between early 1993 and1997, corporate profits as a share of GDP are ex-pected to fall in 1998 and 1999. Profits have beensqueezed recently between higher labor costs and com-panies’ efforts to avoid raising prices in the face ofstrong competition at home and abroad.
Unit labor costs did not accelerate as much aswages during 1996 and 1997, however, since laborproductivity growth also increased and growth in thebenefits component of labor compensation eased. Butneither a resurgence in productivity nor a weakness inbenefits is likely to keep profits from being affected byincreasing wages in the near future. Rising benefits
Figure 1-12.Tightn ess in the Labor Market and Wage Growth
SOURCES: Congressional Budget Office; Department of Labor,Bureau of Labor Statistics.
a. Percentage change from previous year in the employment costindex.
b. The difference between the unemployment rate and CBO’s esti-mate of the nonaccelerating inflation rate of unemployment(NAIRU). A negative value for the unemployment gap indicatesthat an acceleration in inflation is more likely than not.

16 THE ECONOMIC AND BUDGET OUTLOOK: AN UPDATE August 1998
Table 1-2.The CBO Economic Projection for Calendar Y ears 1998-2008
Actual1997
Forecast Projected1998 1999 2000 2001 2002 2003 2004 2005 2006 2007 2008
Nominal GDP(Billions of dollars) 8,111 8,487 8,839 9,204 9,572 10,008 10,475 10,955 11,446 11,950 12,473 13,015
Nominal GDP(Percentage change) 5.9 4.6 4.2 4.1 4.0 4.6 4.7 4.6 4.5 4.4 4.4 4.3
Real GDPa
(Percentage change) 3.9 3.4 2.2 1.9 1.8 2.4 2.5 2.4 2.3 2.3 2.2 2.2
GDP Price Indexb
(Percentage change) 1.9 1.2 2.0 2.2 2.1 2.1 2.1 2.1 2.1 2.1 2.1 2.1
Consumer Price Indexc
(Percentage change) 2.3 1.7 2.6 2.7 2.6 2.5 2.5 2.5 2.5 2.5 2.5 2.5
Unemployment Rate(Percent) 4.9 4.6 4.7 5.1 5.5 5.7 5.7 5.7 5.7 5.7 5.7 5.7
Three-Month Treasury Bill Rate (Percent) 5.1 5.1 5.2 4.8 4.6 4.4 4.4 4.4 4.4 4.4 4.4 4.4
Ten-Year Treasury Note Rate (Percent) 6.4 5.8 6.1 5.8 5.6 5.4 5.4 5.4 5.4 5.4 5.4 5.4
Tax Bases(Billions of dollars)
Corporate profitsd 818 816 831 845 841 861 892 927 960 997 1,038 1,083Wage and salary
disbursements 3,890 4,135 4,311 4,487 4,667 4,877 5,101 5,332 5,570 5,814 6,069 6,333Other taxable
income 1,717 1,772 1,841 1,887 1,936 2,000 2,072 2,147 2,221 2,299 2,380 2,465
Tax Bases(Percentage of GDP)
Corporate profitsd 10.1 9.6 9.4 9.2 8.8 8.6 8.5 8.5 8.4 8.3 8.3 8.3Wage and salary
disbursements 48.0 48.7 48.8 48.7 48.8 48.7 48.7 48.7 48.7 48.7 48.7 48.7Other taxable
income 21.2 20.9 20.8 20.5 20.2 20.0 19.8 19.6 19.4 19.2 19.1 18.9
SOURCES: Congressional Budget Office; Department of Commerce, Bureau of Economic Analysis; Department of Labor, Bureau of LaborStatistics; Federal Reserve Board.
a. Based on chained 1992 dollars.
b. The GDP price index is virtually the same as the implicit GDP deflator.
c. The consumer price index for all urban consumers.
d. Corporate profits are the profits of corporations, adjusted to remove the distortions in depreciation allowances caused by tax rules and to excludecapital gains on inventories.

CHAPTER ONE THE ECONOMIC OUTLOOK 17
Table 1-3.The CBO Economic Projection for Fi scal Years 1998-2008
Actual1997
Forecast Projected1998 1999 2000 2001 2002 2003 2004 2005 2006 2007 2008
Nominal GDP(Billions of dollars) 8,002 8,397 8,748 9,115 9,475 9,894 10,357 10,834 11,322 11,822 12,341 12,878
Nominal GDP(Percentage change) 5.9 4.9 4.2 4.2 4.0 4.4 4.7 4.6 4.5 4.4 4.4 4.4
Real GDPa
(Percentage change) 4.0 3.6 2.4 2.0 1.8 2.3 2.5 2.4 2.4 2.3 2.2 2.2
GDP Price Indexb
(Percentage change) 1.9 1.3 1.8 2.1 2.1 2.1 2.1 2.1 2.1 2.1 2.1 2.1
Consumer Price Indexc
(Percentage change) 2.6 1.7 2.4 2.8 2.7 2.5 2.5 2.5 2.5 2.5 2.5 2.5
Unemployment Rate(Percent) 5.1 4.6 4.7 5.0 5.4 5.7 5.7 5.7 5.7 5.7 5.7 5.7
Three-Month TreasuryBill Rate (Percent) 5.0 5.1 5.3 4.9 4.6 4.5 4.4 4.4 4.4 4.4 4.4 4.4
Ten-Year TreasuryNote Rate (Percent) 6.5 5.7 6.0 5.9 5.6 5.5 5.4 5.4 5.4 5.4 5.4 5.4
Tax Bases(Billions of dollars)
Corporate profitsd 803 817 826 844 841 854 884 919 951 988 1,028 1,072Wage and salary
disbursements 3,823 4,082 4,267 4,443 4,619 4,822 5,044 5,274 5,510 5,752 6,004 6,266Other taxable
income 1,703 1,753 1,827 1,876 1,923 1,983 2,054 2,128 2,202 2,279 2,359 2,444
Tax Bases(Percentage of GDP)
Corporate profitsd 10.0 9.7 9.4 9.3 8.9 8.6 8.5 8.5 8.4 8.4 8.3 8.3Wage and salary
disbursements 47.8 48.6 48.8 48.7 48.8 48.7 48.7 48.7 48.7 48.7 48.7 48.7Other taxable
income 21.3 20.9 20.9 20.6 20.3 20.0 19.8 19.6 19.5 19.3 19.1 19.0
SOURCES: Congressional Budget Office; Department of Commerce, Bureau of Economic Analysis; Department of Labor, Bureau of LaborStatistics; Federal Reserve Board.
a. Based on chained 1992 dollars.
b. The GDP price index is virtually the same as the implicit GDP deflator.
c. The consumer price index for all urban consumers.
d. Corporate profits are the profits of corporations, adjusted to remove the distortions in depreciation allowances caused by tax rules and to excludecapital gains on inventories.

18 THE ECONOMIC AND BUDGET OUTLOOK: AN UPDATE August 1998
are also likely to temper growth in corporate profits.Medical care inflation is already higher in 1998 thanin 1997, and growth in employers’ costs for medicalbenefits is likely to pick up soon.
The expected stagnation of profits, however,should have little effect on the growth of the federaltax base, since much of the softness in profits will bereplaced by an increase in wage and salary growth.The tax base should grow along with GDP in the shortterm.
In recent years, the problem of projecting incomehas been confounded by a sizable discrepancy in thenational income and product accounts. The design ofthe accounts stems from the basic principle that what-ever money is spent in the economy as the result ofdemand for goods and services is, at the same time,received by someone as income. In principle, the sumof all expenditures should equal the sum of all income.Because the Bureau of Economic Analysis uses differ-ent sources of data to estimate the expenditure andincome sides of the accounts, some discrepancy be-tween total expenditures and total income is inevitable.But since 1997, measures of total income have ex-ceeded those of total expenditures by an average of 0.7percent of GDP. CBO assumes that the discrepancy(measured relative to GDP) will rise in 1998 and 1999before declining moderately.
Households
Buoyed by strong employment growth, rising realwages, spectacular gains in wealth, and soaring confi-dence, households began 1998 with a burst of con-sumption. Overall real consumption accelerated dur-ing the first half of this year, as did all of the broadcategories of consumption. Purchases of durablegoods posted an especially strong rise.
Although small, short-term movements in house-holds’ wealth are unlikely to have appreciable effectson their patterns of consumption, increases like theones that have occurred steadily for several years aresure to encourage consumers that they can save lessout of their disposable income and still meet theirlong-term saving requirements. Some analysts haveestimated that the wealth effect on consumption may
by itself have added about a quarter of a percentagepoint per year to real GDP in each of the past threeyears (see Box 1-2).6
The housing boom of 1997 has persisted into1998. Continued growth in household incomes andwealth has combined with low financing costs to keepdemand for housing strong. In the first half of 1998,sales of existing homes grew by 18.8 percent, andsales of new homes grew by 20.4 percent. The espe-cially warm winter allowed building to proceed withminimal interruptions. As a result, real residentialinvestment has been increasing at an average annualrate of about 14.4 percent for the past six months.
That pace should slacken somewhat later thisyear and through 1999 as the economy slows andlong-term interest rates begin to inch up. Moreover,lower rates of household formation among the popula-tion of prime first-time home buyers (people ages 25to 34) will blunt housing growth into the medium term.
Businesses
Following a stunning advance in 1997 of about 14percent, real business investment entered 1998 at aneven faster pace. Much (though by no means all) ofthat acceleration in late 1997 and early 1998 camefrom a dramatic swelling in business inventories.During that period, equipment investment—which hasbeen the mainstay of the current expansion—grewmore quickly while nonresidential construction de-clined.
Real purchases of business equipment grew by12.1 percent in 1997, the most since 1984. Thatgrowth was fairly broad based, with investments inassets ranging from communications equipment to of-fice furnishings posting banner performances. Lead-ing the advance were computers and peripheral equip-ment (42.0 percent growth in 1997) and aircraft (35.8percent growth in 1997).
6. That estimate, which is based on NIPA data from before the most recentrevision, possibly understates the wealth effect on consumption becausethe unrevised data included capital gains distributions—which arestrongly associated with increased household wealth and possibly withincreased consumption—within the income effect.

CHAPTER ONE THE ECONOMIC OUTLOOK 19
The current environment of robust growth in de-mand, relatively low and unusually stable real interestrates, and soaring returns on corporate equity has beena boon for equipment investment. With profits grow-ing at double-digit rates until recently, businesses havefaced few financing constraints during the expansion.Besides investing in physical plant and equipment,corporations have been undertaking mergers and ac-quisitions with a renewed vigor and engaging in stockrepurchases on a relatively large scale.
Business purchases of structures grew by a re-spectable 7.1 percent in 1997. Taken together withtheir growth in 1995 and 1996, that marked the stron-gest three-year advance since 1982. For the most part,nonresidential construction is far less sensitive to thevicissitudes of the business cycle than is equipmentinvestment. Almost half of last year’s growth in non-residential construction came from a 14.0 percent in-crease in office construction. Much of the rest camefrom construction of hospitals, schools, and other in-stitutional buildings.
Box 1-2.The Impact of the Stock Market on the Economy
The sharp increase in corporate stock prices since1994 has played a significant role in boosting theeconomy. Between December 1994 and May 1998,the Standard & Poor’s 500 stock-price index (a broadgauge of stock prices) more than doubled, rising byalmost 144 percent. Of course, the increase in thestock market reflects the good performance of corpo-rate profits and the overall economy during the pastthree years. But that increase has also spurred theeconomy because it has boosted personal consumptionexpenditures (by raising the value of householdwealth) and business investment (by lowering the costof equity finance for businesses). It may also havespurred the economy indirectly by raising consumerand business confidence.
An increase in the value of household wealthincreases personal consumption expenditures becausethe rise in wealth means that consumers do not needto save as much to achieve their saving goals. Thedecline of the personal saving rate in the past fewyears may be an indication of that effect. Empiricalestimates find that consumer spending increases be-tween 1 cent and 5 cents for every extra dollar ofwealth, with the response taking from one to threeyears to complete. Although that response is notlarge, the recent increase in wealth was substantial, sothe impact on consumer spending has been notice-able. For example, some analysts have estimated thatthe rise in household wealth has raised gross domesticproduct (GDP) by 0.25 percentage points a year forthe past three years.
An increase in stock values relative to the levelof corporate earnings encourages business investmentbecause firms can finance less attractive investmentprojects yet remain profitable. A decline in theearnings-to-price ratio means that investors are will-ing to accept a smaller return on their equity invest-ments (perhaps in hopes of realizing spectacular capi-tal gains later). By paying less for funds, firms caninvest in lower-returning assets. For the companiesin the Standard & Poor’s 500 index, the averageearnings-to-price ratio (a measure of the return onstocks and the cost of equity finance) fell from 6.7percent in December 1994 to 3.6 percent in March1998. That decline, combined with the drop in long-term interest rates, has had a small but positive im-pact on business investment.
Over the next few years, however, the stock mar-ket may not be able to continue spurring the economy.Many analysts believe that the growth of corporateearnings, and hence the growth of stock prices, willslow this year. Some analysts consider stocks over-valued (by at least 20 percent at midyear) and foreseeoutright declines in prices. Fewer gains, or even siz-able declines, in stock prices would probably haveonly modest effects on the economy in the short term,primarily because such effects are typically spread outover time. Moreover, a modest retreat by the stockmarket would lessen pressure on the Federal ReserveBoard to slow the economy with higher interest rates.But a precipitous drop in stock prices could have alarger-than-expected impact in the near term if con-sumer and business confidence fell severely.

20 THE ECONOMIC AND BUDGET OUTLOOK: AN UPDATE August 1998
0
0.170
0.175
0.180
0.185
0.190
0.195
0.200
1960 1965 1970 1975 1980 1985 1990 1995
Ratio to Sales
-0.5
0
0.5
1.0
1.5
2.0
2.5
3.0
3.5
1980 1985 1990 1995
Percentage of GDP
Growth in inventories outpaced growth in finalsales last year but slowed this year. Current indicatorssuggest that most of the inventory correction may havetaken place in the second quarter of 1998. The resolu-tion of the General Motors strike should cause auto-mobile inventories to rise in the immediate future, andinventories of commodities that have accumulated be-cause of the worldwide decline in prices are likely todiminish only gradually over the near term. Even withlast year’s rapid buildup, however, inventory stocksdid not seem to be out of line with estimates of long-term sales (see Figure 1-13).
Foreign Trade
After rising substantially for the past two years, theU.S. trade deficit for goods and services is likely towiden further this year and into next year, mostly as aresult of the direct and indirect effects of the Asianeconomic crisis. By mid-1998, the trade deficit bal-looned to $167 billion, or 2 percent of GDP—thehighest it has been in a decade (see Figure 1-14). Astrong U.S. economy and declining import prices haveactually held down the trade deficit as a share of GDP.
Real exports have stagnated over the past yearwhile the growth of imports has accelerated. U.S. ex-
Figure 1-13.Real Inventory Stocks
SOURCES: Congressional Budget Office; Department of Com-merce, Bureau of Economic Analysis.
Figure 1-14.Trade Deficit
SOURCES: Congressional Budget Office; Department of Com-merce, Bureau of Economic Analysis.
ports to Asia have been declining steadily since thesecond quarter of 1997, and more recently, exports toother regions have begun to slow as well. Among thereasons for that slowdown are that Latin Americannations are being forced to curb spending because ofanxiety in global financial markets, and oil-exportingcountries are reducing their spending in response tolower oil revenues. U.S. exports to Europe are alsosoftening as the strong dollar renders them less com-petitive than Asian products. Since the dollar is likelyto remain strong in a still-jittery global financial envi-ronment and the United States remains attractive forinvestment, the divergent paths of import and exportgrowth will become even more pronounced in the nearfuture. The U.S. trade deficit is thus likely to be aneven greater drag on overall economic growth for therest of this year and at least part of 1999.
The Economic Projection for 2000 Through 2008
The exceptional performance of the U.S. economyover the past several years has improved the economicoutlook through 2008. The boom in capital spendingby businesses during the current expansion is pro-

CHAPTER ONE THE ECONOMIC OUTLOOK 21
jected to continue, though at a slower rate, into thenext decade, increasing the nation’s stock of capitaland raising the growth of potential GDP. Althoughthe temporary factors now holding down inflation willdissipate, the trend in the inflation rate is projected toremain low. Interest rates are also projected to staylow, reflecting the effects of both increased nationalsaving from the elimination of the federal budget defi-cit and reduced short-term volatility in the inflationrate. Between 1997 and 2008, annual growth of realGDP will average 2.3 percent, CBO projects, some-what below the 2.5 percent rate projected for potential
GDP during the same period. Unemployment is pro-jected to average 5.4 percent through 2008, and CPIinflation is expected to average 2.5 percent.
Beyond the first two years, CBO’s 10-year pro-jection is not a forecast of the ups and downs of theeconomy but rather an extension of historical trends inthe factors that underlie the trend growth of realGDP—factors such as the growth of the labor force,the growth of productivity, the rate of national saving,and the composition of national income.
Table 1-4.Key Assumpt ions for the Projection of Potential Output
Average Annual Growth Rate
1949-1997 1949-1960 1960-1969 1969-1980 1980-1990 1990-1997
CBOProjection,1997-2008
Overall Economy
Working-Age Population 1.3 0.8 1.4 2.0 1.1 1.0 1.0a
Potential Labor Force 1.7 1.0 1.6 2.7 1.6 1.1 1.0
Potential Labor Force Productivityb 1.6 2.7 2.5 0.6 1.0 0.9 1.2New Price Indexes n.a. n.a. n.a. n.a. n.a. 0.1 0.2
Potential Real GDP 3.2 3.8 4.2 3.3 2.6 2.2 2.5Real GDP 3.3 3.9 4.6 2.8 2.9 2.5 2.3
Nonfarm Business Sector
Potential Employment 1.8 1.2 1.8 2.7 1.7 1.4 1.1Potential Hours Worked 1.5 1.0 1.4 2.0 1.6 1.3 1.1
Capital Input 3.7 3.4 4.3 4.1 3.6 2.8 4.1Potential TFP 1.3 2.0 2.0 1.1 0.5 0.7 0.9
Potential Labor Productivityc 1.9 2.7 2.9 1.7 1.0 1.1 1.7Potential Real Output 3.4 3.8 4.3 3.8 2.7 2.5 2.9
SOURCE: Congressional Budget Office using data from the Department of Labor, Bureau of Labor Statistics, and the Department of Commerce,Bureau of Economic Analysis.
NOTES: The years marking the ends of historical periods (except 1997) are years in which the business cycle peaked.
n.a. = not applicable; TFP = total factor productivity.
a. Projection for 1997-2006.
b. Growth in potential output per labor force member.
c. Growth in potential output per hour (in the nonfarm business sector).

22 THE ECONOMIC AND BUDGET OUTLOOK: AN UPDATE August 1998
0
8
9
10
11
12
13
14
1950 1955 1960 1965 1970 1975 1980 1985 1990 1995
Percentage of Potential GDP
Economic Growth
CBO projects that real GDP will grow somewhat moreslowly than potential GDP between 1997 and 2008.The assumption underlying the projection is that ac-tual output will eventually average 0.2 percentagepoints below potential GDP—a gap equal to the aver-age difference between actual and potential GDP dur-ing the postwar period. Using that gap as a target forthe projection period is meant to allow for the averagelikelihood of booms or busts in real GDP during thenext 10 years. Since actual GDP was almost 1.5 per-cent above potential GDP in 1997, it must grow moreslowly than potential for a while so as to reach its his-torical relationship with potential GDP. CBO as-sumes that the historical gap will be restored in 2002,and afterward, that real GDP will grow at the samerate as potential, on average.
Potential GDP is projected to grow slightly fasterthan its 2.2 percent rate of the 1990s, but slower thanits average rate during the entire postwar period (seeTable 1-4 on page 21). That projection stems directlyfrom projections for the supply factors that underliepotential GDP: demographic changes will lead toslower growth in the labor force (relative to both theearly 1990s and the entire postwar period), while thecapital spending boom of recent years will partly off-set the labor force slowdown.
Labor Supply. CBO assumes that the potential, orcyclically adjusted, labor force will grow in tandemwith the working-age population, averaging a 1 per-cent annual advance between 1997 and 2008. Thatgrowth is considerably slower than the average for thepast 40 years. As noted earlier, the growth of theworking-age population, which swelled with the influxof the baby boomers during the 1960s and 1970s, hasmoderated in recent years. CBO’s projection is in linewith the trend that has prevailed over the past two de-cades.7
Figure 1-15.Business Fixed Investment
SOURCES: Congressional Budget Office; Department of Com-merce, Bureau of Economic Analysis.
NOTE: Business fixed investment represents investment in plantand equipment. It does not include investment in invento-ries.
The labor force participation rate is also assumedto flatten, stabilizing at about 67 percent of theworking-age population (close to its 1997 level). Dur-ing the 1960s and 1970s, the labor force expandedeven more rapidly than the working-age population asever-increasing numbers of women joined the laborforce, pushing up the overall participation rate. CBOfollows the projections of the Bureau of Labor Statis-tics and other private and government forecasters inassuming that the upward climb in participation rateshas largely ended.
Capital Input. Business investment in plant andequipment has been extremely strong during the cur-rent expansion, leading to a very rapid increase in thestock of productive capital (see Figure 1-15). CBOprojects that investment will grow at an average rateof about 5 percent between 1997 and 2008, whichtranslates into an average increase of 4.1 percent inthe stock of productive capital during the same pe-riod.8 That increase is considerably higher than the
7. CBO’s labor force projection also includes an adjustment for the effectsof welfare reform. Based on an analysis of caseloads and of legislationpassed in 1996, CBO estimated that welfare reform would spur about600,000 people to enter the labor force who otherwise would not havedone so. CBO estimates that about half of that effect has alreadyoccurred, so it adds 300,000 people to the projected labor force betweenmid-1998 and 2008.
8. CBO’s measure of capital input is based on the data for real net capitalstocks published by the Bureau of Economic Analysis. It is an indexthat accounts for the fact that different types of capital assets (such asequipment, structures, and inventories) have different marginalproductivities.
CHAPTER ONE THE ECONOMIC OUTLOOK 23
growth of capital input witnessed during the early1990s.
Total Factor Productivity. Total factor productivity(TFP) is defined as growth in output beyond what isattributable to growth in labor and capital.9 CBO pro-jects that cyclically adjusted total factor productivitywill grow at an average rate of 0.9 percent per yearthrough 2008. That rate is higher than the trend ratesince the early 1980s solely because of changes in theway prices are measured. The trend in TFP over thepast two business cycles has been 0.6 percent, but be-cause the change in price measurement reduces mea-sured inflation for nonfarm business output by about0.3 percentage points compared with previous years,the trend growth in TFP will be greater by thatamount. When combined with the projections for cap-ital input and hours worked, the projection for TFPimplies an acceleration in the growth of potential laborproductivity, from 1.1 percent during the early 1990sto 1.7 percent during the projection period.
CPI Adjustments. As discussed in previous CBOreports, the projection for economic growth includes atechnical adjustment to allow for changes that the Bu-reau of Labor Statistics has made since 1995 and willmake in 1999 in the way it calculates the consumerprice index. Those changes are projected to lower thegrowth of the GDP price index by about 0.2 percent-age points a year through 2008. (The technical adjust-ments are discussed below with CBO’s inflation pro-jections.) Those changes in method will not affectnominal GDP, but they imply that the estimate of po-tential real GDP is 0.2 percentage points a year higherbetween 1997 and 2008 than it would have been withno revision to the inflation measure.
Unemployment and Inflation
Both the unemployment and inflation rates are pro-jected to rise slightly during the projection period.Slower growth over the next 10 years (that is, growthbelow potential) implies an increase in unemployment.CBO projects that the unemployment rate will rise
slowly until it reaches a plateau at 5.7 percent,roughly 0.1 percentage point above CBO’s estimate ofthe NAIRU. Nevertheless, the unemployment rate willremain below the level of the NAIRU through 2001,adding to the buildup of inflationary pressure that al-ready exists. At the same time, CBO expects that thesupply-side factors that have restrained inflation dur-ing the past few years will gradually dissipate, allow-ing inflation to increase, albeit mildly, over the next 10years. CBO projects that inflation as measured by theCPI will average 2.5 percent per year after 2001,while inflation in the GDP price index will average 2.1percent.
CBO’s projection for inflation incorporates thehost of methodological changes that the Bureau of La-bor Statistics is making in its measurement of theCPI.10 Those changes include rebenchmarking theconsumption weights (which was implemented in1998), as well as switching to geometric aggregationto calculate price changes within major categories andusing a more effective sample design (both of whichwill be implemented in 1999). CBO estimates that thenet effect of those changes will be to lower the mea-sured rate of CPI inflation by 0.7 percentage points by2002. Some of the changes do not affect the GDPprice index; growth of the GDP price deflator will belowered by 0.2 percentage points.
Interest Rates
CBO expects real interest rates to decline graduallyover the next decade, with short- and long-term rateseach falling about 150 basis points from their 1997levels. After 2002, the real rate on three-month Trea-sury bills is projected to average about 2 percent andthe 10-year Treasury note rate about 3 percent. Thoselevels are some 20 to 30 basis points above the levelsthat prevailed during the late 1950s and early 1960s.That discrepancy reflects CBO’s assessment thatworldwide supplies of loanable funds are somewhatscarcer today than they were then, largely because ofgovernment budget pressures overseas.
9. The more traditional measure of productivity—labor productivity—isdefined as the growth in output above what is attributable to growth intotal hours worked.
10. For more details about the changes, see Congressional Budget Office,The Economic and Budget Outlook: Fiscal Years 1999-2008 (January1998), Box 1-2, pp. 8-9.
24 THE ECONOMIC AND BUDGET OUTLOOK: AN UPDATE August 1998
Taxable Incomes
Projections of federal revenue are linked closely toprojections of national income. However, differentcomponents of income are taxed at different rates, andsome are not taxed at all. Thus, the distribution ofnational income among the various components is oneof the most important parts of CBO's economic pro-jection. Wage and salary disbursements and corporateprofits are of special interest because they are taxed atthe highest effective rates.
Together, wage and salary disbursements andcorporate profits are projected to decline as a share ofGDP by about 1 percentage point between 1997 and2008. Underlying that projection is a mild increase inthe wage and salary share, which is more than offsetby a decline in the profit share.
The share of wages and salaries will increaseover the 10-year horizon, moving from 48 percent ofGDP in 1997 to average 48.7 percent in the years after1999—roughly equal to the average level from theearly 1970s through the mid-1990s. That increase of0.7 percentage points is quite small compared with thehistorical variation in the wage and salary share. Be-tween 1946 and 1997, the standard deviation of theshare was 1.8 percentage points. Both economic the-ory and long-run empirical studies have suggested thatthe share of labor compensation in income is likely toremain fairly constant over long periods.
CBO projects that the profit share of income willdecline by 1.8 percentage points between 1997 and2008, from 10.1 percent to 8.3 percent, thus offsettingabout half of its rise between 1986 and 1997. Thesame economic theories and empirical studies that pre-dict a stable long-run wage share also predict that thecapital share of income will remain fairly constantover long periods. Corporate profits are only one partof capital income (others include businesses’ interestpayments and depreciation), but they are among themost sensitive to the business cycle. Thus, some de-cline from recent levels is inevitable; CBO expects theprofit share to return to its average of the 1970s.Even after that decline, however, profits as a share ofGDP will remain well above the level that prevailedduring the 1980s—a decade in which soaring debt
burdens severely limited the profitability of corpora-tions.
Uncertainty in the Economic
Outlook
The economy’s remarkable performance during thepast few years has surprised many forecasters. Thecurrent economic expansion is more than seven yearsold—the third longest of the postwar period—yet realGDP and employment have continued to grow rapidlywithout a resurgence of inflation. Although it istempting to believe that such a good economic perfor-mance will continue, both CBO and the consensus ofprivate forecasters believe that the most likely out-come is an economic slowdown and a rise in inflation.A considerable amount of uncertainty surrounds thatoutlook, however, and the actual performance of theeconomy could be somewhat better or much worse.
Changes in CBO’s Economic OutlookSince January
Because of strong growth and continued low inflationin the first half of 1998, the forecast for this year andnext is a little brighter than CBO predicted last Janu-ary (see Table 1-5). The expected growth of real GDPis modestly higher, and GDP price inflation lower, forboth 1998 and 1999. Those changes largely resultfrom a recent revision of the NIPAs (see Box 1-3).The unemployment rate is also slightly lower for bothyears, whereas interest rates are lower only for 1998.Various tax bases have also been revised upwardslightly for both years.
Beyond 1999, a combination of faster growth ofreal GDP and slower inflation results in slightlyslower projected growth of nominal GDP, and conse-quently a modestly lower dollar level of GDP in 2008.The faster growth of real GDP arises from continuedstrong investment by businesses in plant and equip-ment.
The reduction in the forecast for inflation in 1998results largely from an unanticipated drop in the price

CHAPTER ONE THE ECONOMIC OUTLOOK 25
Table 1-5.Comparison of CBO’s Summer and January 1998 Ec onomic Projections for Calendar Y ears 1998-2008
Actual1997
Forecast Projected1998 1999 2000 2001 2002 2003 2004 2005 2006 2007 2008
Nominal GDP(Billions of dollars)
Summer 1998 8,111 8,487 8,839 9,204 9,572 10,008 10,475 10,955 11,446 11,950 12,473 13,015January 1998 8,081 8,461 8,818 9,195 9,605 10,046 10,529 11,038 11,565 12,112 12,684 13,280
Nominal GDP(Percentage change)
Summer 1998 5.9 4.6 4.2 4.1 4.0 4.6 4.7 4.6 4.5 4.4 4.4 4.3January 1998 5.8 4.7 4.2 4.3 4.5 4.6 4.8 4.8 4.8 4.7 4.7 4.7
Real GDPa (Percentage change)
Summer 1998 3.9 3.4 2.2 1.9 1.8 2.4 2.5 2.4 2.3 2.3 2.2 2.2January 1998 3.7 2.7 2.0 1.9 2.0 2.1 2.3 2.3 2.2 2.2 2.2 2.1
GDP Price Indexb
(Percentage change)Summer 1998 1.9 1.2 2.0 2.2 2.1 2.1 2.1 2.1 2.1 2.1 2.1 2.1January 1998 2.0 2.0 2.2 2.3 2.4 2.4 2.5 2.5 2.5 2.5 2.5 2.5
Consumer Price Indexc
(Percentage change)Summer 1998 2.3 1.7 2.6 2.7 2.6 2.5 2.5 2.5 2.5 2.5 2.5 2.5January 1998 2.3 2.2 2.5 2.7 2.8 2.8 2.8 2.8 2.8 2.8 2.8 2.8
Unemployment Rate(Percent)
Summer 1998 4.9 4.6 4.7 5.1 5.5 5.7 5.7 5.7 5.7 5.7 5.7 5.7January 1998 4.9 4.8 5.1 5.4 5.6 5.8 5.9 5.9 5.9 5.9 5.9 5.9
Three-Month TreasuryBill Rate (Percent)
Summer 1998 5.1 5.1 5.2 4.8 4.6 4.4 4.4 4.4 4.4 4.4 4.4 4.4January 1998 5.1 5.3 5.2 4.8 4.7 4.7 4.7 4.7 4.7 4.7 4.7 4.7
Ten-Year TreasuryNote Rate (Percent)
Summer 1998 6.4 5.8 6.1 5.8 5.6 5.4 5.4 5.4 5.4 5.4 5.4 5.4January 1998 6.4 6.0 6.1 6.0 5.9 5.9 5.9 5.9 5.9 5.9 5.9 5.9
Tax Bases(Percentage of GDP)
Corporate profitsd
Summer 1998 10.1 9.6 9.4 9.2 8.8 8.6 8.5 8.5 8.4 8.3 8.3 8.3January 1998 9.9 9.7 9.2 8.8 8.5 8.3 8.2 8.1 8.0 7.9 7.8 7.7
Wage and salary disbursements
Summer 1998 48.0 48.7 48.8 48.7 48.8 48.7 48.7 48.7 48.7 48.7 48.7 48.7January 1998 48.0 48.4 48.5 48.6 48.6 48.6 48.6 48.7 48.8 48.8 48.8 48.8
Other taxable incomeSummer 1998 21.2 20.9 20.8 20.5 20.2 20.0 19.8 19.6 19.4 19.2 19.1 18.9January 1998 22.1 21.8 21.5 21.2 21.1 20.9 20.7 20.5 20.4 20.2 20.1 20.0
SOURCES: Congressional Budget Office; Department of Commerce, Bureau of Economic Analysis; Department of Labor, Bureau of LaborStatistics; Federal Reserve Board.
a. Based on chained 1992 dollars.
b. The GDP price index is virtually the same as the implicit GDP deflator.
c. The consumer price index for all urban consumers.
d. Corporate profits are the profits of corporations, adjusted to remove the distortions in depreciation allowances caused by tax rules and toexclude capital gains on inventories.

26 THE ECONOMIC AND BUDGET OUTLOOK: AN UPDATE August 1998
Box 1-3.Revision of the National Income and Product Accounts
In late July, the Bureau of Economic Analysis (BEA)released a comprehensive revision of the national in-come and product accounts (NIPAs). Such revisions,which usually affect the most recent three years ofdata, incorporate new and more complete source dataand are designed to improve the accuracy of the ac-counts. Less commonly, the three-year revisionssometimes include new definitions of certain data se-ries or entirely new estimating methods, leading tolarger revisions than usual. The recent revision in-corporated a number of significant new definitions.
Two changes in particular stand out. First, BEAaltered the way the accounts treat capital gains distri-butions made by mutual fund companies. Capitalgains are increases in the value of existing assetsrather than income that derives from current produc-tion, so they should be excluded from NIPA-basedmeasures of income (since the NIPAs are designed tomeasure current production and the correspondingincome). As a result, BEA changed dividend pay-ments in the national accounts to exclude capitalgains distributions by mutual funds. That redefinitionsharply reduced the level of dividends in the accountsand increased, by the same amount, the estimate ofearnings retained by corporations. The redefinitioncontributed to a sharp drop in the personal saving rate(down from 3.9 percent to 2.1 percent in 1997) butleft the national and private saving rates unaffected.
Second, several of the price deflators, particu-larly for many categories of personal consumptionexpenditures (PCE), were changed. Those changesdramatically reduced the measured rate of inflation inthe NIPAs since 1995. Revisions to the PCE deflatorswere prompted by new source data and the use of newtypes of price indexes that allow for substitution byconsumers among different goods and services. As aresult, growth in the gross domestic product (GDP)price index, which had averaged 2.1 percent a yearbetween the end of 1994 and early 1998, was reviseddownward to show an average increase of 1.8 percentduring that period. That revision mirrored the down-ward revision in the growth of the price index forconsumer expenditures, which went from an averageof 2.0 percent a year during that period to 1.7 percent.
The introduction of the new type of price indexcaused about half of the downward revision to infla-tion since 1995. That technical adjustment is similarto ones made by the Bureau of Labor Statistics to re-duce bias in the consumer price index. The adjust-ment permanently lowers the measured rate of infla-tion and raises real growth by an equal amount, leav-ing nominal GDP unaffected.
The economic assumptions published in thisreport largely, though not completely, reflect BEA'srevisions. To account for the technical adjustment inthe price index, the Congressional Budget Office(CBO) raised the growth rate of potential GDP in re-cent years and in its projection, reduced the projectedgrowth rate of the GDP price index, and raised theprojected growth rate of real GDP compared with thepreliminary projection published on July 15. How-ever, the revisions in nominal GDP and in most in-come categories that matter for projecting revenueswere insignificant. The substantial revision in per-sonal dividend income, noted above, simply bringsthe NIPA measure of dividends closer to what peopleactually report on their tax returns as dividend in-come. Thus, the revisions incorporated in CBO’seconomic assumptions do not have any implicationsfor projections of revenues, outlays, or the budget sur-plus.
The NIPA revisions do, however, pose a prob-lem that will have to be addressed in future reports.The revisions imply that both real GDP and potentialGDP were larger in the first half of 1998 than previ-ously thought, but real GDP was increased by morethan potential, so the gap between the two widened.Specifically, GDP was assumed to be about 2.3 per-cent above potential, but the recent revisions put itabout 3.0 percent above CBO’s revised estimate ofpotential GDP. That discrepancy can have one ofthree ramifications for the economic outlook: the gapmight be narrowed or eliminated by more rapidgrowth of GDP than CBO now assumes; the gapmight be narrowed or eliminated if it turns out thatpotential GDP should be revised upward by more thanCBO has already done; or the widened gap might per-sist, increasing inflation more rapidly than CBO cur-rently forecasts. Additional evidence and analysiswill be necessary to determine which of those possibleimplications of the revisions is most likely.

CHAPTER ONE THE ECONOMIC OUTLOOK 27
of oil during the first half of this year. Beyond 1998,the lower inflation projection reflects a revised judg-ment. In consultation with its Panel of Economic Ad-visers, CBO concluded that the Federal Reserve wasunlikely to tolerate as high an inflation rate over a longperiod as CBO previously projected. Of course, pre-cisely what level of inflation the central bank wouldtolerate and could maintain is a guess. In any event,the difference in the inflation projection has only a lim-ited impact on the budget projections described inChapters 2 and 3 because it affects revenues and out-lays in ways that largely offset one another.
The reduction in projected short-term interestrates results from the lower projection of inflation.The lower projected long-term rates result from theassumption that the yield curve will be flatter, partlybecause of the larger projected federal surpluses.11
Comparison with Other Forecasts and Projections
CBO’s current forecast is similar to the forecasts ofthe Blue Chip consensus (the average of the 50 privateforecasters surveyed in Blue Chip Economic Indica-tors, published by Capitol Publications), the Adminis-tration, and the Federal Reserve Board. All expectslower growth of real GDP and higher inflation by1999. Beyond 1999, CBO’s projections are similar tothose of the Administration and the Blue Chip consen-sus, though its projections for interest rates are lower.
The Forecast Through 1999. The differences amongthe forecasts are generally small (see Table 1-6).CBO expects slower growth for real GDP over thetwo-year period than either the Blue Chip or the Fed-eral Reserve, but slightly faster growth than the Ad-ministration. The Administration’s forecast was pre-pared much earlier than CBO’s, however, before thedata showing extraordinary growth during the firstquarter of 1998 were released.
Forecasts for CPI inflation are very similar for1998 but show greater variation for 1999. CBO’sinflation forecast for next year is the highest and theAdministration’s is the lowest (0.6 percentage pointsbelow CBO’s). Likewise, the differences in the fore-casts for interest rates are trivial for 1998 but morenoticeable for 1999, particularly for 10-year Treasurynotes. The Administration does not expect an increasein the 10-year rate in 1999, whereas CBO and theBlue Chip consensus do.
The differences in the forecasts for unemploy-ment are fairly small. The Administration predicts thehighest unemployment rate (5.0 percent by 1999), con-sistent with the fact that its inflation forecasts are thelowest of the four.
The Projection Beyond 1999. The largest differ-ences between CBO’s projection and those of the Ad-ministration and the Blue Chip consensus appear ininterest rates (see Table 1-7). CBO’s estimates arelower than those of the other two—almost 0.7 percent-age points lower than the Blue Chip’s.
The estimates of real GDP growth are quite simi-lar in the three projections, while CBO’s estimate ofCPI inflation lies between those of the other two. Al-though CBO’s growth rates for real GDP are lower inthe first part of the projection period, the averagegrowth of real GDP between 1998 and 2004 (the lastyear in the Blue Chip projection) is the same as theAdministration’s and slightly lower than the BlueChip’s.
Specific Risks and Alternative Scenarios
The most likely outcome for the economy in the nextfew years is a soft landing, with slower growth and amild up-tick in inflation, but that is not the only possi-ble outcome. The economy could fall into a period ofslower growth or outright recession originating from avariety of causes. Or it could continue to grow rapidlywithout a significant rise in inflation if other favorableprice shocks occur or if the economy has entered anew era of faster productivity growth.
11. The yield curve is the relationship formed by plotting the yields ofotherwise comparable fixed-income securities against their terms ofmaturity. Typically, yields increase as maturities lengthen. If the rateof that increase becomes smaller, the yield curve is said to haveflattened.

28 THE ECONOMIC AND BUDGET OUTLOOK: AN UPDATE August 1998
Table 1-6.Comparison of CBO’s and Other Economists’ Fo recasts for 1998 and 1999
Actual1997
Forecast1998 1999
Fourth Quarter to Fourth Quarter(Percentage change)
Nominal GDPCBO 5.6 4.3 4.2Blue Chip 5.6 4.6 4.7Federal Reservea 5.6 4.5 to 5.0 4.25 to 5.0Administration 5.6 4.2 4.1
Real GDPb
CBO 3.8 2.9 2.1Blue Chip 3.7 3.0 2.4Federal Reservea 3.7 3.0 to 3.25 2.0 to 2.5Administration 3.7 2.4 2.0
GDP Price Indexc
CBO 1.7 1.4 2.1 Blue Chip 1.8 1.6 2.2 Administration 1.8 1.7 2.0
Consumer Price Indexd
CBO 1.9 1.9 2.7Blue Chip 1.9 1.7 2.5Federal Reservea 1.9 1.75 to 2.0 2.0 to 2.5Administration 1.9 1.6 2.1
Average Level in the Fourth Quarter(Percent)
Unemployment RateCBO 4.7 4.6 4.8Blue Chip 4.7 4.5 4.7Federal Reservea 4.7 4.25 to 4.5 4.5 to 4.75Administration 4.7 4.8 5.0
Calendar Year Average(Percent)
Three-Month Treasury Bill RateCBO 5.1 5.1 5.2Blue Chip 5.1 5.1 5.2Administration 5.1 5.0 4.9
Ten-Year Treasury Note RateCBO 6.4 5.8 6.1Blue Chip 6.4 5.6 5.8Administration 6.4 5.6 5.6
SOURCES: Congressional Budget Office; Department of Commerce, Bureau of Economic Analysis; Department of Labor, Bureau of LaborStatistics; Capitol Publications, Inc.; Office of Management and Budget; Federal Reserve Board.
a. The Federal Reserve figures are the ranges—known as the central tendency—that include the majority of the forecasts of members of the FederalOpen Market Committee and other Federal Reserve Bank presidents.
b. Based on chained 1992 dollars.
c. The GDP price index is virtually the same as the implicit GDP deflator.
d. The consumer price index for all urban consumers.

CHAPTER ONE THE ECONOMIC OUTLOOK 29
Table 1-7.Comparison of CBO’s and Other Economists’ Projections for Calendar Y ears 1998-2008
Actual1997
Forecast Projected1998 1999 2000 2001 2002 2003 2004 2005 2006 2007 2008
Nominal GDP (Percentage change)
CBO 5.9 4.6 4.2 4.1 4.0 4.6 4.7 4.6 4.5 4.4 4.4 4.3Blue Chip 5.8 4.9 4.5 4.7 4.8 5.0 5.1 5.0 n.a. n.a. n.a. n.a.Administration 5.8 4.7 4.0 4.2 4.4 4.6 4.6 4.7 4.7 4.6 4.6 4.6
Real GDPa
(Percentage change)CBO 3.9 3.4 2.2 1.9 1.8 2.4 2.5 2.4 2.3 2.3 2.2 2.2Blue Chip 3.8 3.3 2.3 2.2 2.2 2.4 2.5 2.5 n.a. n.a. n.a. n.a.Administration 3.8 2.9 2.0 2.0 2.1 2.4 2.4 2.4 2.4 2.4 2.4 2.3
GDP Price Indexb
(Percentage change)CBO 1.9 1.2 2.0 2.2 2.1 2.1 2.1 2.1 2.1 2.1 2.1 2.1Blue Chip 2.0 1.5 2.1 2.4 2.6 2.5 2.5 2.5 n.a. n.a. n.a. n.a.Administration 2.0 1.7 2.0 2.1 2.2 2.2 2.2 2.2 2.2 2.2 2.2 2.2
Consumer Price Indexc
(Percentage change)CBO 2.3 1.7 2.6 2.7 2.6 2.5 2.5 2.5 2.5 2.5 2.5 2.5Blue Chip 2.3 1.7 2.4 2.7 2.7 2.8 2.7 2.7 n.a. n.a. n.a. n.a.Administration 2.3 1.6 2.1 2.2 2.3 2.3 2.3 2.3 2.3 2.3 2.3 2.3
Unemployment Rate(Percent)
CBO 4.9 4.6 4.7 5.1 5.5 5.7 5.7 5.7 5.7 5.7 5.7 5.7Blue Chip 4.9 4.5 4.7 5.3 5.5 5.6 5.4 5.4 n.a. n.a. n.a. n.a.Administration 5.0 4.7 5.0 5.2 5.4 5.4 5.4 5.4 5.4 5.4 5.4 5.4
Three-Month TreasuryBill Rate (Percent)
CBO 5 1 5.1 5.2 4.8 4.6 4.4 4.4 4.4 4.4 4.4 4.4 4.4Blue Chip 5.1 5.1 5.2 5.1 5.2 5.1 5.1 5.1 n.a. n.a. n.a. n.a.Administration 5.1 5.0 4.9 4.8 4.7 4.7 4.7 4.7 4.7 4.7 4.7 4.7
Ten-Year Treasury Note Rate (Percent)
CBO 6.4 5.8 6.1 5.8 5.6 5.4 5.4 5.4 5.4 5.4 5.4 5.4Blue Chip 6.4 5.6 5.8 6.0 6.1 6.1 6.1 6.1 n.a. n.a. n.a. n.a.Administration 6.4 5.6 5.6 5.6 5.6 5.6 5.6 5.6 5.6 5.6 5.6 5.6
SOURCES: Congressional Budget Office; Department of Commerce, Bureau of Economic Analysis; Department of Labor, Bureau of LaborStatistics; Capitol Publications, Inc.; Office of Management and Budget; Federal Reserve Board.
NOTES: The Blue Chip forecast, which is issued monthly, is from July 1998, and the projection, which is issued semiannually, is from March 1998.
n.a. = not available.
a. Based on chained 1992 dollars.
b. The GDP price index is virtually the same as the implicit GDP deflator.
c. The consumer price index for all urban consumers.

30 THE ECONOMIC AND BUDGET OUTLOOK: AN UPDATE August 1998
Early Recession. A number of ways exist in whichthe economy could slow during the rest of 1998 andperhaps fall into recession next year. One way is asevere decline in the stock market. Some analysts be-lieve that the market was overvalued by 20 percent atmidyear. If corporate profits turned out to be weakerthan many analysts expect, the stock market mightsuffer a dramatic decline, which could cause busi-nesses and consumers to scale back their spendingplans.
Another route to recession might be higher realinterest rates. Inflation could be greater than expectedif the economy continued to grow rapidly or if the tem-porary factors restraining inflation dissipated fasterthan anticipated. Higher inflation could spur the Fed-eral Reserve to raise the federal funds rate as a way toslow the economy and bring inflation back down. Al-though the Federal Reserve has had an exemplary re-cord of managing monetary policy in recent years,mistakes are always possible, and if the federal fundsrate was raised too far too quickly, the economy couldbe pushed into recession.
A further slump in exports might also slow theeconomy more than expected. That could happen ifthe recession in Japan depressed the region further andstrengthened the dollar even more than it already has.
Extension of the Low-Inflation Boom. A continua-tion of the recent favorable developments might allowthe economy to keep growing strongly through the endof 1999 or into 2000 without a resurgence of inflation-ary pressure. Continued low inflation in medicalprices and declines in computer and oil prices wouldhelp keep a lid on the inflation rate for a time. Aquick end to the economic problems in Asia mightspur U.S. exports, and thus output growth, in the nearterm. However, such developments would only pushback the date at which the economy would start toslow down.
Higher Trend in Productivity Growth: The New-Era Argument. CBO’s forecast and projection couldturn out to be pessimistic if the new-era argumentproved correct. Some analysts maintain that theUnited States and many other economies have under-gone, and will continue to undergo, major structuralchanges that in essence will cause the trend in produc-
tivity growth to be significantly higher over the next10 years than it has been for the past 20.
The trend in the growth of labor productivity be-tween 1973 and 1997 was 1.1 percent a year, andCBO’s projection incorporates an average growth rateof 1.7 percent a year. Labor productivity is assumedto be higher than the trend for two reasons: the capitalstock has grown rapidly in recent years, which willspur labor productivity growth, and the methodologi-cal changes to the CPI will increase the measuredgrowth of real output (and hence of productivity) by0.2 percentage points per year compared with the his-torical period.
The proponents of the new era argue that thespread of free-market principles, the reduction of tradebarriers and increased international trade, the disman-tling of regulations and government enterprises, theaccelerated pace of technological change in general(and the information-based nature of technologicalchange in particular), and the decline in marginal taxrates are likely to foster stronger productivity growthfor many years to come. They do not argue that reces-sions will not occur or that productivity will not varywith changes in output growth, but they maintain thatthe trend in productivity will be higher—perhaps asmuch as 1 percentage point higher than CBO as-sumes.12 That implies a trend in productivity growthsimilar to the one that prevailed in the United Statesbetween 1956 and 1973.
Clearly, if such a trend came to pass, it wouldcause CBO’s projection to be radically pessimistic.The trend in real wage growth would be much higher,prices and profits would not be under pressure in thenear term, and the federal budget surplus—in the ab-sence of any legislative response—would be muchgreater. Inflation could be pushed lower by such apersistently favorable supply shock, and estimates ofthe NAIRU would fall as the country experienced ad-ditional years of low inflation with low unemployment.However, there is no evidence in current data that
12. Many economists believe that the measurement of productivity growthis biased downward because the measurement of price change is biasedupward. That problem should not be confused with the arguments ofthe new-era proponents, who maintain that the trend in productivity,even as it is currently measured, will be higher than CBO assumes.

CHAPTER ONE THE ECONOMIC OUTLOOK 31
would justify such an acceleration in productivitygrowth.
The Year 2000 Problem. Another risk that is diffi-cult to assess is the year 2000 problem—the possibil-ity of economic disruptions stemming from the poten-tial failure of some computer software and memorychips to recognize the year 2000. In the early days ofsoftware development, programmers often used twodigits to signify the year; when such software attemptsto deal with 2000, it will assume that the year is 1900.Problems have already surfaced. Some cash registerswill not accept credit cards with expiration dates in2000 or later, and a year 2000 test caused a safetymechanism to shut down an offshore oil-drilling plat-form. Lawsuits have been filed in connection withsome of those problems.
The issue has many ramifications. Corporate in-vestment in computers and software has been stimu-lated by concern over this problem, and although someof the investment is not productive (in the sense that itsimply avoids a problem rather than enhancing pro-ductivity), the reassessment of computer systems will
probably, on balance, help productivity in the longrun.
Another aspect is the threat to the U.S. and inter-national payments system. Although large U.S. finan-cial institutions are probably in good shape, many for-eign banks and smaller U.S. institutions have not pre-pared for the problem. Check clearing and securitiestrading in this country will not be disrupted, but Euro-pean institutions are preoccupied with the conversionto the single European currency, and Japanese banksdo not appear to be analyzing the vulnerability of theirsystems.
In spite of all the possible ways the problemcould upset the economy, CBO expects that the dis-ruption will be relatively small and brief. The growthof productivity and output will most likely be slowedby 0.1 percentage point or less in 1999 and 2000 asfirms and governments divert resources into checking,correcting, and litigating the problem, but there will beno sudden contraction of economic activity in eitheryear.

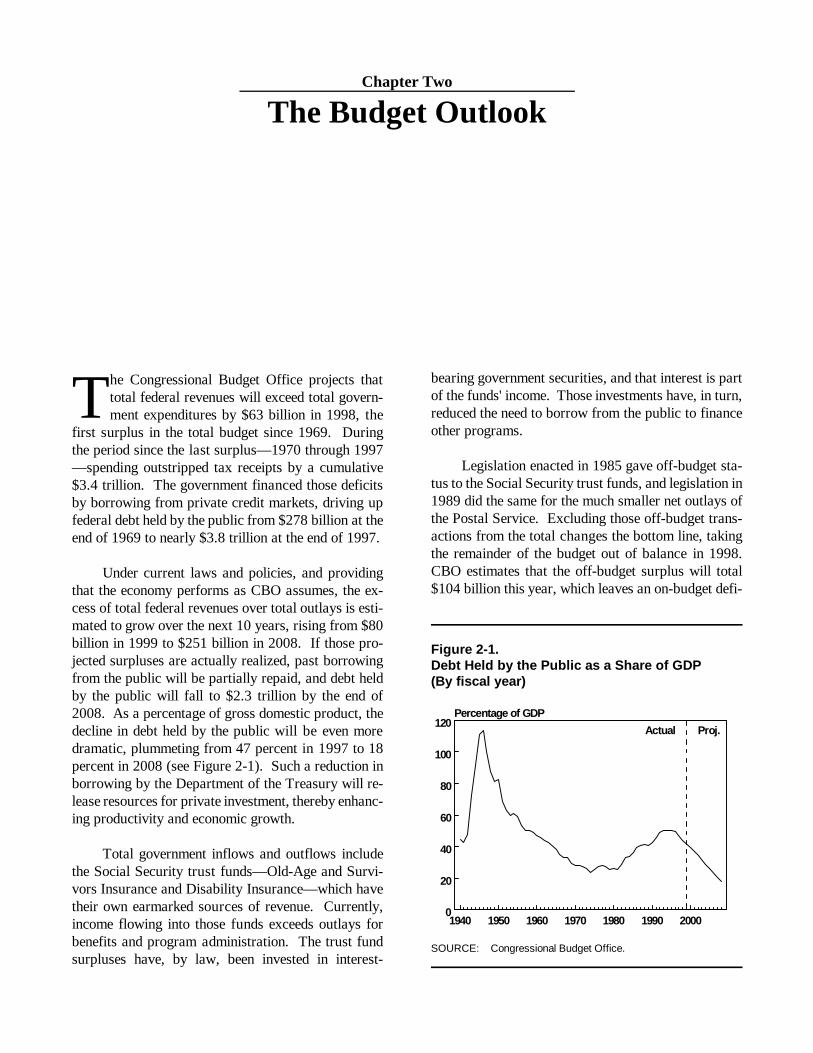
1940 1950 1960 1970 1980 1990 20000
20
40
60
80
100
120Percentage of GDP
Actual Proj.
Chapter Two
The Budget Outlook
The Congressional Budget Office projects thattotal federal revenues will exceed total govern-ment expenditures by $63 billion in 1998, the
first surplus in the total budget since 1969. Duringthe period since the last surplus—1970 through 1997—spending outstripped tax receipts by a cumulative$3.4 trillion. The government financed those deficitsby borrowing from private credit markets, driving upfederal debt held by the public from $278 billion at theend of 1969 to nearly $3.8 trillion at the end of 1997.
Under current laws and policies, and providingthat the economy performs as CBO assumes, the ex-cess of total federal revenues over total outlays is esti-mated to grow over the next 10 years, rising from $80billion in 1999 to $251 billion in 2008. If those pro-jected surpluses are actually realized, past borrowingfrom the public will be partially repaid, and debt heldby the public will fall to $2.3 trillion by the end of2008. As a percentage of gross domestic product, thedecline in debt held by the public will be even moredramatic, plummeting from 47 percent in 1997 to 18percent in 2008 (see Figure 2-1). Such a reduction inborrowing by the Department of the Treasury will re-lease resources for private investment, thereby enhanc-ing productivity and economic growth.
Total government inflows and outflows includethe Social Security trust funds—Old-Age and Survi-vors Insurance and Disability Insurance—which havetheir own earmarked sources of revenue. Currently,income flowing into those funds exceeds outlays forbenefits and program administration. The trust fundsurpluses have, by law, been invested in interest-
bearing government securities, and that interest is partof the funds' income. Those investments have, in turn,reduced the need to borrow from the public to financeother programs.
Legislation enacted in 1985 gave off-budget sta-tus to the Social Security trust funds, and legislation in1989 did the same for the much smaller net outlays ofthe Postal Service. Excluding those off-budget trans-actions from the total changes the bottom line, takingthe remainder of the budget out of balance in 1998.CBO estimates that the off-budget surplus will total$104 billion this year, which leaves an on-budget defi-
Figure 2-1.Debt Held by the Public as a Sh are of GDP(By fiscal year)
SOURCE: Congressional Budget Office.
34 THE ECONOMIC AND BUDGET OUTLOOK: AN UPDATE August 1998
cit of $41 billion. The on-budget deficit is projected togive way to surpluses in 2002 and in 2005 through2008.
By any measure, CBO's outlook for the federalbudget has improved significantly since March. Onthe basis of actual data for the first nine months offiscal year 1998, CBO has raised its estimate of thisyear's total budget surplus by $55 billion. Revenueshave been adjusted upward by $38 billion (a 2 percentincrease), and outlays have been adjusted downwardby $18 billion (a 1 percent decrease).
Only a very small part of those adjustments canbe ascribed to a divergence from CBO's earlier eco-nomic forecast. On the outlay side, the revisions stemlargely from an array of one-time occurrences. On therevenue side, they may be the result of such factors asunexpected growth in partnership income and bonuses,increases in payouts from pension plans, and the tim-ing of capital gains realizations. The precise factorsthat have generated the higher-than-expected growth inrevenues seen in 1998 will not be known for anothertwo years, because many taxpayers have not yet filedtheir detailed returns for 1997 and 1998 returns willnot be filed until next year. In projecting revenuegrowth for 1999 through 2008, CBO assumed thatsome of the factors causing the changes during thepast year would persist or grow, whereas others woulddissipate. Overall, CBO projects about $50 billion peryear in additional receipts.
If any of a number of assumptions that CBO hasmade turn out to be off the mark, however, budgetaryoutcomes could be quite different from the projections,even without changes in policy by the Congress. Forinstance, if CBO's economic projection proved overlyoptimistic, surpluses could be much lower than antici-pated; a recession similar to that of the early 1990scould even produce a deficit for a few years. Like-wise, surpluses could be lower than projected if thefactors that produced the unexpected revenues in 1998faded quickly. Of course, the economy could also bemore robust than expected or the unexplained revenuesurge could grow over time—in those circumstances,the budget outlook would be much brighter than CBOcurrently projects. In any case, results for any oneyear that differ by $100 billion from current projec-tions are entirely possible.
Changes in the fiscal position of the governmenttend to feed on themselves, thereby producing largerchanges in the same direction. In the case of a "virtu-ous cycle," positive feedbacks occur as an initial shiftin the budget from deficit to surplus reduces the fed-eral debt. Outlays for interest are in turn reduced,which increases the surplus, and so on. Such a pro-cess is evident in CBO's new projections. By 2008,lower debt-service costs account for $44 billion of the$113 billion increase in CBO's projected surplus com-pared with the projections it released in March. But areversal of today's "virtuous" fiscal forces could initi-ate a so-called vicious cycle —in which interest rateswould probably rise and debt-service savings would bereduced. That kind of cycle might all too quicklyeliminate the budget surpluses that are now envi-sioned.
An Improved Bottom Line
Since the record total deficit of $290 billion in 1992,the federal budgetary picture has shown annual im-provement. From that high mark six years ago, thedeficit plunged to $22 billion last year. This year, it isvirtually certain that the total budget will be in surplus(see Table 2-1).
Under the assumptions of CBO's economic fore-cast and presuming that current policies remain thesame, the positive outlook for the budget is projectedto continue. CBO anticipates that the baseline totalsurplus will hover around $80 billion for each of thenext three years before rising to $139 billion in 2002.By 2008, the surplus is projected to reach $251 bil-lion.
Rapidly rising revenues account for much of theimprovement in the budgetary picture. Between 1992and 1997, annual revenues grew by $488 billion, or 45percent. As a percentage of GDP, revenues over thatperiod climbed from 17.8 percent to 19.8 percent. Byway of contrast, annual outlays grew only moderatelyover the 1992-1997 period, rising by $220 billion, or16 percent. As a share of GDP, outlays dipped from22.5 percent in 1992 to 20.1 percent in 1997. Overthe coming decade, the pace of revenue growth is ex-pected to slow to rates approximating those of GDP.

CHAPTER TWO THE BUDGET OUTLOOK 35
However, outlays are estimated to grow more slowlythan the economy, and as a result, surpluses are pro-jected to mount.
Although the total budget is expected to show ahealthy surplus in 1998, CBO still anticipates an on-budget deficit (see Figure 2-2). On-budget revenues(which by law exclude revenues earmarked for SocialSecurity) are projected to be $41 billion less than on-budget spending (which, again, excludes spending forSocial Security benefits and administrative costs aswell as the net outlays of the Postal Service). Thatfigure is down considerably from the $103 billion on-budget deficit recorded in 1997 and the record-high
$340 billion on-budget deficit in 1992. In 2002 andagain in 2005 through 2008, CBO projects, the budgetwill be balanced even when off-budget revenues andspending are excluded from the calculations. The on-budget surplus is projected to reach $64 billion in2008.
The two Social Security trust funds are currentlyrunning a combined surplus of about $100 billion ayear, which includes the income from interest on gov-ernment securities. By 2008, the annual Social Secu-rity surplus will approach $190 billion. Yet those sur-pluses will start to shrink when the baby boomers be-gin to retire. CBO's detailed estimates do not extend
Table 2-1.The Budget Outlook Under Cu rrent P olicies (By fi scal year)
Actual1997 1998 1999 2000 2001 2002 2003 2004 2005 2006 2007 2008
In Billions of Dollars
Total Deficit (-) or Surplus -22 63 80 79 86 139 136 154 170 217 236 251
On-Budget Deficit (-) or Surplus (Excluding Social Security and the Postal Service) -103 -41 -37 -46 -45 1 -10 a 5 44 55 64
Memorandum:Off-Budget Surplus
Social Security 81 105 117 126 130 138 146 154 165 173 181 186Postal Service a a a a 1 0 0 0 0 0 0 0
Total 81 104 117 125 131 138 146 154 165 173 181 186
Total Deficit (-) or Surplus If Discretionary Spending Was Frozen at the 2002 Level from 2003 to 2008 -22 63 80 79 86 139 150 184 217 282 320 355
As a Percentage of GDP
Total Deficit (-) or Surplus -0.3 0.8 0.9 0.9 0.9 1.4 1.3 1.4 1.5 1.8 1.9 1.9
On-Budget Deficit (-) or Surplus (Excluding Social Security and the Postal Service) -1.3 -0.5 -0.4 -0.5 -0.5 b -0.1 b b 0.4 0.4 0.5
SOURCE: Congressional Budget Office.
a. Less than $500 million.
b. Less than 0.05 percent.
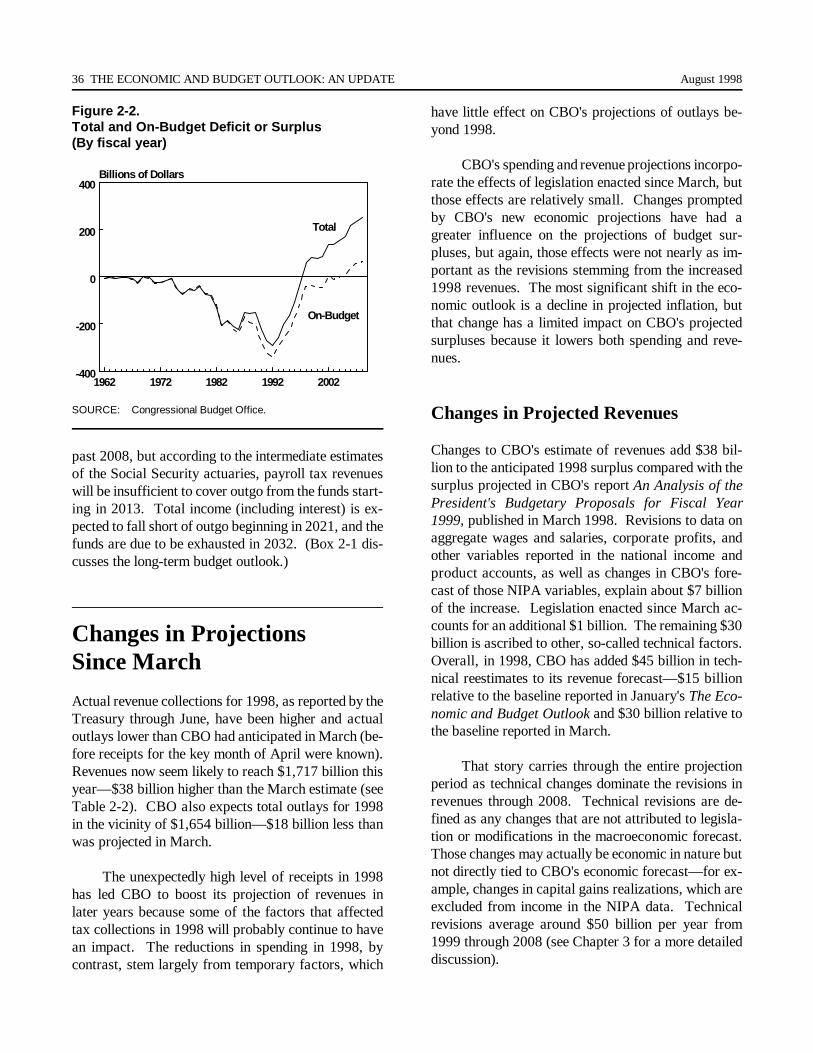
36 THE ECONOMIC AND BUDGET OUTLOOK: AN UPDATE August 1998
1962 1972 1982 1992 2002-400
-200
0
200
400Billions of Dollars
Total
On-Budget
Figure 2-2.Total and On-Budget Deficit or Surplus(By fiscal year)
SOURCE: Congressional Budget Office.
past 2008, but according to the intermediate estimatesof the Social Security actuaries, payroll tax revenueswill be insufficient to cover outgo from the funds start-ing in 2013. Total income (including interest) is ex-pected to fall short of outgo beginning in 2021, and thefunds are due to be exhausted in 2032. (Box 2-1 dis-cusses the long-term budget outlook.)
Changes in Projections Since March
Actual revenue collections for 1998, as reported by theTreasury through June, have been higher and actualoutlays lower than CBO had anticipated in March (be-fore receipts for the key month of April were known).Revenues now seem likely to reach $1,717 billion thisyear—$38 billion higher than the March estimate (seeTable 2-2). CBO also expects total outlays for 1998in the vicinity of $1,654 billion—$18 billion less thanwas projected in March.
The unexpectedly high level of receipts in 1998has led CBO to boost its projection of revenues inlater years because some of the factors that affectedtax collections in 1998 will probably continue to havean impact. The reductions in spending in 1998, bycontrast, stem largely from temporary factors, which
have little effect on CBO's projections of outlays be-yond 1998.
CBO's spending and revenue projections incorpo-rate the effects of legislation enacted since March, butthose effects are relatively small. Changes promptedby CBO's new economic projections have had agreater influence on the projections of budget sur-pluses, but again, those effects were not nearly as im-portant as the revisions stemming from the increased1998 revenues. The most significant shift in the eco-nomic outlook is a decline in projected inflation, butthat change has a limited impact on CBO's projectedsurpluses because it lowers both spending and reve-nues.
Changes in Projected Revenues
Changes to CBO's estimate of revenues add $38 bil-lion to the anticipated 1998 surplus compared with thesurplus projected in CBO's report An Analysis of thePresident's Budgetary Proposals for Fiscal Year1999, published in March 1998. Revisions to data onaggregate wages and salaries, corporate profits, andother variables reported in the national income andproduct accounts, as well as changes in CBO's fore-cast of those NIPA variables, explain about $7 billionof the increase. Legislation enacted since March ac-counts for an additional $1 billion. The remaining $30billion is ascribed to other, so-called technical factors.Overall, in 1998, CBO has added $45 billion in tech-nical reestimates to its revenue forecast—$15 billionrelative to the baseline reported in January's The Eco-nomic and Budget Outlook and $30 billion relative tothe baseline reported in March.
That story carries through the entire projectionperiod as technical changes dominate the revisions inrevenues through 2008. Technical revisions are de-fined as any changes that are not attributed to legisla-tion or modifications in the macroeconomic forecast.Those changes may actually be economic in nature butnot directly tied to CBO's economic forecast—for ex-ample, changes in capital gains realizations, which areexcluded from income in the NIPA data. Technicalrevisions average around $50 billion per year from1999 through 2008 (see Chapter 3 for a more detaileddiscussion).

CHAPTER TWO THE BUDGET OUTLOOK 37
1990 2000 2010 2020 2030 2040 2050 2060 20700
50
100
150
200
250
300
350
Summer 1998Projections Without Surpluses
Percentage of GDP
May 1998Baseline Projections
Summer 1998Baseline Projections
Box 2-1.CBO’s Long-Term Budget Outlook
The Congressional Budget Office (CBO) projects ris-ing federal budget surpluses over the next 10 years.In the following decades, however, the budget willface mounting pressure as increasing numbers of thebaby-boom generation begin to draw benefits fromSocial Security and Medicare and federal health costsper beneficiary continue to rise faster than the averagewage. To analyze the magnitude of that pressure,CBO has produced long-term projections of the fed-eral budget.
In contrast to CBO’s 10-year projections, thelong-term projections extend many spending and rev-enue categories using simple rules based on historicalpatterns, not current law. For example, CBO assumesthat tax revenues and government purchases of goodsand services remain constant as a share of output.However, projections for the federal health and retire-ment programs, which account for most of the long-run pressure on the budget, are extrapolated on thebasis of the projections of the trustees of the Social
Long-Term Projections of Debtas a Share of GDP (By fiscal year)
SOURCE: Congressional Budget Office.
Security and Medicare trust funds. The trustees, indeveloping their projections, assume current law.1
CBO’s long-term projections indicate that theratio of federal debt to gross domestic product (GDP)will fall close to zero over the next two decades butwill then begin to rise, reaching 100 percent by 2048(see the figure below). That outlook represents animprovement over the projections made in May1998.2 At that time, CBO projected that debt wouldexceed 100 percent of GDP soon after 2040. The im-provement stems almost entirely from changes inCBO’s 10-year projections. If reductions in revenuesor increases in spending eliminated the surpluses pro-jected for the next 10 years, the outlook would be sig-nificantly worse—CBO projects that in those circum-stances, debt would rise above 100 percent of GDP by2032.
The degree of long-term imbalance in the budgetcan be summarized in a single number: the fiscalgap. The fiscal gap is the size of the immediate andpermanent revenue increase, or spending decrease,that would ensure that the debt-to-GDP ratio in 2070would be at the same level that it is today. CBO cur-rently estimates that the fiscal gap is 1.2 percent ofGDP. In May, CBO estimated that the fiscal gap was1.6 percent of GDP. Therefore, the improved 10-yearprojections for the budget have reduced the long-termimbalance by about one-quarter. If, however, the sur-pluses were eliminated, leaving the budget exactlybalanced over the next 10 years, the estimated fiscalgap would reach 2.4 percent of GDP.
1. See Congressional Budget Office, An Economic Model for Long-Run Budget Simulations, CBO Memorandum (July 1997), for adetailed description of the methodology CBO uses for its long-term projections.
2. Congressional Budget Office, Long-Term Budgetary Pressuresand Policy Options (May 1998). The projections in that publica-tion were based on CBO’s 10-year projections detailed in TheEconomic and Budget Outlook: Fiscal Years 1999-2008 (Janu-ary 1998).

38 THE ECONOMIC AND BUDGET OUTLOOK: AN UPDATE August 1998
Changes in CBO's economic projections also af-fect estimates of revenues, and over the next fewyears, the revised economic assumptions increasethose estimates by as much as $15 billion a year. Af-ter 2002, however, the revised outlook reduces reve-nues by amounts that grow to $43 billion in 2008.Those changes are the net outcome of certain factorsthat raise revenues and others that lower them. Forinstance, slightly higher real GDP and a slower declinein corporate profits as a share of GDP boost projectedrevenues in the next few years. But after 2002, lowerprojected rates of inflation push down nominal GDPand incomes, resulting in a drop in revenues that morethan offsets those upward effects. Because lower
inflation also pushes down spending, however, it doesnot have a major impact on the budget surplus.
Legislative changes, primarily resulting from theInternal Revenue Service Restructuring and ReformAct of 1998, are expected to increase revenues insome years and decrease them in others—but by nomore than $1 billion in any year.
Changes in Projected Outlays
CBO anticipates that 1998 outlays will be $18 billionlower than it projected in March. About $5 billion of
Table 2-2.Changes in CBO Budget Projections Since M arch 1998 (By fiscal year)
1998 1999 2000 2001 2002 2003 2004 2005 2006 2007 2008
March 1998 Baseline Surplus 8 9 1 13 67 53 70 75 115 130 138
ChangesLegislative
Revenues 1 1 a -1 -1 -1 -1 1 1 1 1Outlaysb -1 -3 -4 -4 -4 -3 -2 -1 -1 a 1
Subtotal a -2 -4 -5 -5 -4 -4 a 1 1 2
EconomicRevenues 7 13 15 5 a -3 -10 -17 -24 -33 -43Outlaysb 1 9 10 12 16 24 32 40 48 56 63
Subtotal 8 22 25 17 16 21 22 24 23 23 21
TechnicalRevenues 30 48 50 51 49 50 49 51 52 52 55Outlaysb
Other than debt service 16 -1 a -1 -1 a -2 -1 a 1 1Debt service 1 4 7 10 13 16 19 22 26 30 34
Subtotal 48 51 57 61 61 66 65 72 78 83 90
Total Changes 55 71 78 73 72 82 84 96 102 106 113
Summer 1998 Baseline Surplus 63 80 79 86 139 136 154 170 217 236 251
Memorandum:Total Change in Revenues 38 62 65 56 48 46 37 35 29 20 13Total Change in Outlays 18 9 13 17 23 37 46 61 73 86 99
SOURCE: Congressional Budget Office.
a. Less than $500 million.
b. Increases in outlays are shown with a negative sign because they reduce surpluses.

CHAPTER TWO THE BUDGET OUTLOOK 39
that reduction occurs in discretionary spending. Asupplemental appropriation bill enacted in Mayboosted discretionary spending by an estimated $1billion, but the increase was more than offset byslower-than-anticipated spending for a myriad of pro-grams. For instance, spending for highway construc-tion and maintenance is likely to be more than $1 bil-lion lower than CBO projected in March, largely be-cause of uncertainties and delays associated with thereauthorization of highway programs. In addition,spending for disaster relief is now expected to be $1billion less than previously estimated. Projectedspending for a variety of natural resources and envi-ronmental programs is also likely to drop by a total ofabout $1 billion. Estimated outlays for various otherdiscretionary programs have been reduced by smalleramounts.
Lower projected spending for mandatory pro-grams in 1998 accounts for the remaining $12 billiondip in outlays. More than $1 billion of that total re-flects economic effects—unemployment and interestrates that are lower than previously anticipated. Leg-islation enacted since March has had virtually no ef-fect on net mandatory spending.
Thus, the leftover $11 billion reduction in pro-jected mandatory spending is attributable to other,technical factors. More than $3 billion of the dropcomes from the Medicare program, largely as the re-sult of a decision by the Health Care Financing Ad-ministration to slow its processing of payments tohealth care providers. In addition, CBO has trimmednet outlays by nearly $2 billion because proceeds fromthe sale of the United States Enrichment Corporationwere received in 1998 rather than in 1999, as previ-ously projected. CBO had also assumed that $1.5 bil-lion would be paid in 1998 as part of the settlementstemming from the 1996 Supreme Court decision thatheld the federal government liable for losses that sav-ings and loan institutions incurred as a result of statu-tory changes affecting the definition of capital for reg-ulatory standards. It now appears that payments thisyear will be much less than $1.5 billion. CBO hasalso cut its estimates of spending for a variety of othermandatory programs.
Lower outlays in 1998 have not led to furthertechnical reductions in 1999 through 2008. Rather,
the 1998 reductions for the most part reflect one-timeevents that either have no impact on future spending orare likely to increase it. For example, the slowdown inMedicare payments will curtail 1998 spending buthave little or no effect on spending in future years,because the amount saved in any year as a result ofthe delay will roughly equal the amount of spendingthat is carried over from the previous year. However,as a result of technical revisions to its projections ofrevenues, CBO has lowered the amount of debt heldby the public that it anticipates in the future. Thatreduction in turn shrinks the government's estimatedinterest payments throughout the projection period.By 2008, such reductions total $34 billion.
Legislation enacted since March has increasedprojected spending over the 1999-2008 period by atotal of $23 billion. Most of that increase comes fromthe additional funds provided by the TransportationEquity Act for the 21st Century, which was enacted inJune. Additional spending for highways and masstransit was only partially offset by reductions in otherdiscretionary and mandatory spending. Most of themandatory savings arose from the overturning of a1997 decision by the Department of Veterans Affairsthat had made it easier for veterans who suffer fromsmoking-related diseases to qualify for compensationbenefits.
Changes in CBO's economic forecast have re-duced projected spending by amounts that grow to $63billion by 2008. By 2002, CBO anticipates that short-term interest rates will be 0.3 percentage points andlong-term rates 0.5 percentage points below its previ-ous forecast. Those changes push down projected netinterest payments by $10 billion in 2008. Reductionsin nominal interest rates are almost entirely the conse-quence of lower projected inflation. Lower inflationalso restrains the size of required cost-of-living adjust-ments for benefit programs such as Social Securityand slows the growth of Medicare spending. Further-more, since CBO's projections assume that discretion-ary spending will grow at the rate of inflation after thestatutory caps on such spending expire in 2002, thedecline in projected inflation also curbs expected dis-cretionary spending from 2003 through 2008.

40 THE ECONOMIC AND BUDGET OUTLOOK: AN UPDATE August 1998
Revenue and Spending Projections
CBO projects that revenues this year will reach a post-World War II high of 20.5 percent of GDP. Withoutany changes in policy, revenues are expected toslightly exceed that level next year before falling to along-run share of GDP that equals the revenue sharein 1997 (see Table 2-3).
CBO assumes that the unexplained increase in1998 revenues will carry over into 1999—thus boost-ing their share of GDP to 20.6 percent. Revenues areexpected to subside to 20.3 percent of GDP in 2000and to 19.8 percent by 2003. Most of that decline oc-curs because individual income taxes decline as ashare of output. After 2003, individual income taxreceipts as a share of GDP should climb steadily asgrowth in real incomes causes more income to betaxed at higher rates. Offsetting the rising share ofGDP stemming from individual income taxes is a de-cline in excise taxes relative to GDP. Those counter-balancing trends keep the total revenue share constantat 19.8 percent from 2003 through 2008. Over theentire 1998-2008 period, therefore, annual growth inrevenues is projected to match the 4.5 percent averagegrowth in nominal GDP.
On the other side of the ledger, outlays are pro-jected to grow more slowly than revenues, averaging3.4 percent annually from 1998 through 2008. In dol-lar terms, CBO expects total outlays to grow from$1,654 billion in 1998 to $2,303 billion in 2008. As apercentage of GDP, however, outlays are projected todecline throughout the period—from 19.7 percent ofGDP in 1998 to 17.9 percent in 2008.
Discretionary spending is currently restrainedthrough 2002 by an assortment of caps (see Appen-dix B). Those caps, if left intact, will hold totalgrowth of such spending to less than 3 percent from1998 through 2002. (In real terms, discretionary out-lays would be reduced by 7 percent.) After 2002,CBO assumes that discretionary spending will grow
at the rate of inflation. Even so, such spending is pro-jected to decline from 6.6 percent of GDP in 1998 to5.1 percent in 2008.
The Transportation Equity Act for the 21st Cen-tury created two additional sets of caps on budget au-thority and outlays: one set for highway spending andone for mass transit (see Table 2-4). Those caps arein addition to the caps on defense, domestic and inter-national, and violent crime reduction spending thatwere already in place. In 1999, all five sets of caps onbudget authority and outlays will be in effect. Then in2000, the number of sets of caps drops to four as de-fense is combined with domestic and internationalspending to form one category. In 2001 and 2002,violent crime reduction is merged with defense, domes-tic, and international spending under one set of capsfor all such programs. The separate caps on highwayand mass transit outlays extend through 2002.
Spending for entitlements and other mandatoryprograms, by far the largest spending category, is ex-pected to total $942 billion this year and is growingfaster than the economy. Fueling that growth are ex-penditures for Medicare and Medicaid, which togetherwith Social Security account for roughly three-quar-ters of all mandatory outlays (see Table 2-5 on page43). CBO projects that total mandatory spending willgrow from 11.2 percent of GDP in 1998 to 12.6 per-cent in 2008.
Net interest, which was the fastest-growing cate-gory of spending in the 1980s, is now expected to de-cline. As projected surpluses reduce the stock of debtheld by the public by $1.4 trillion, net interest willdrop from $244 billion (2.9 percent of GDP) in 1998to $140 billion (1.1 percent of GDP) in 2008 (seeTable 2-6 on page 44). Debt subject to limit, how-ever, is projected to continue rising through 2007 be-cause the surpluses that accrue to the Social Securitytrust funds and other accounts are expected to belarger than the surpluses tallied in the total budget.The debt limit, which currently stands at $5.95 trillion,should be sufficient until at least the middle of fiscalyear 2003.

CHAPTER TWO THE BUDGET OUTLOOK 41
Table 2-3.CBO Budget Projections, Assuming Compliance with Di scret ionary Spe nding Caps (By fi scal year)
Actual1997 1998 1999 2000 2001 2002 2003 2004 2005 2006 2007 2008
In Billions of DollarsRevenues
Individual income 737 821 850 867 892 933 968 1,014 1,065 1,116 1,170 1,227Corporate income 182 190 196 201 201 204 210 218 228 239 250 262Social insurance 539 577 604 629 652 678 706 737 772 805 839 871Other 120 129 150 152 157 163 169 174 178 182 187 193
Total 1,579 1,717 1,801 1,848 1,903 1,978 2,053 2,142 2,243 2,342 2,446 2,553On-budget 1,187 1,296 1,359 1,388 1,425 1,481 1,534 1,601 1,675 1,750 1,829 1,911Off-budget 392 421 442 460 478 497 519 541 568 592 618 643
OutlaysDiscretionary spending 548 552 564 569 570 567 581 595 610 626 641 657Mandatory spending 896 942 997 1,052 1,115 1,165 1,234 1,303 1,389 1,443 1,531 1,626Offsetting receipts -87 -84 -79 -84 -90 -101 -96 -99 -104 -109 -115 -121Net interest 244 244 238 232 221 209 198 189 178 166 153 140
Total 1,601 1,654 1,721 1,769 1,817 1,840 1,918 1,988 2,073 2,126 2,211 2,303On-budget 1,291 1,337 1,396 1,434 1,470 1,480 1,545 1,601 1,670 1,706 1,774 1,846Off-budget 311 317 325 335 347 359 373 387 402 419 437 456
Deficit (-) or Surplus -22 63 80 79 86 139 136 154 170 217 236 251On-budget deficit (-) or surplus -103 -41 -37 -46 -45 1 -10 a 5 44 55 64Off-budget surplus 81 104 117 125 131 138 146 154 165 173 181 186
Debt Held by the Public 3,771 3,717 3,655 3,589 3,518 3,395 3,275 3,136 2,981 2,779 2,557 2,320
As a Percentage of GDPRevenues
Individual income 9.3 9.8 9.7 9.5 9.4 9.4 9.3 9.3 9.4 9.4 9.5 9.5Corporate income 2.3 2.3 2.2 2.2 2.1 2.1 2.0 2.0 2.0 2.0 2.0 2.0Social insurance 6.8 6.9 6.9 6.9 6.9 6.8 6.8 6.8 6.8 6.8 6.8 6.8Other 1.5 1.5 1.7 1.7 1.7 1.6 1.6 1.6 1.6 1.5 1.5 1.5
Total 19.8 20.5 20.6 20.3 20.1 20.0 19.8 19.8 19.8 19.8 19.8 19.8On-budget 14.9 15.4 15.5 15.2 15.0 15.0 14.8 14.8 14.8 14.8 14.8 14.8Off-budget 4.9 5.0 5.0 5.0 5.0 5.0 5.0 5.0 5.0 5.0 5.0 5.0
OutlaysDiscretionary spending 6.9 6.6 6.4 6.2 6.0 5.7 5.6 5.5 5.4 5.3 5.2 5.1Mandatory spending 11.2 11.2 11.4 11.5 11.8 11.8 11.9 12.0 12.3 12.2 12.4 12.6Offsetting receipts -1.1 -1.0 -0.9 -0.9 -0.9 -1.0 -0.9 -0.9 -0.9 -0.9 -0.9 -0.9Net interest 3.1 2.9 2.7 2.5 2.3 2.1 1.9 1.7 1.6 1.4 1.2 1.1
Total 20.1 19.7 19.7 19.4 19.2 18.6 18.5 18.3 18.3 18.0 17.9 17.9On-budget 16.2 15.9 15.9 15.7 15.5 14.9 14.9 14.8 14.7 14.4 14.4 14.3Off-budget 3.9 3.8 3.7 3.7 3.7 3.6 3.6 3.6 3.6 3.5 3.5 3.5
Deficit (-) or Surplus -0.3 0.8 0.9 0.9 0.9 1.4 1.3 1.4 1.5 1.8 1.9 1.9On-budget deficit (-) or surplus -1.3 -0.5 -0.4 -0.5 -0.5 b -0.1 b b 0.4 0.4 0.5Off-budget surplus 1.0 1.2 1.3 1.4 1.4 1.4 1.4 1.4 1.5 1.5 1.5 1.4
Debt Held by the Public 47.3 44.3 41.7 39.3 37.1 34.3 31.6 28.9 26.3 23.5 20.7 18.0
SOURCE: Congressional Budget Office.a. Deficit of less than $500 million.b. Deficit or surplus of less than 0.05 percent of GDP.

42 THE ECONOMIC AND BUDGET OUTLOOK: AN UPDATE August 1998
Table 2-4.CBO Projections of Di scret ionary Outlays, Assum ing Compliance with Di scret ionary Spe nding Caps(By fiscal year, in billions of doll ars)
Actual1997 1998 1999 2000 2001 2002
Defense 272 270 268 a a aDomestic and International 252 258 265 a a aViolent Crime Reduction 2 4 5 6 a aHighways 19 19 22 24 26 27Mass Transit 3 2 4 5 5 6All Otherb n.a. n.a. n.a. 534 539 534
Total 548 552 564 569 570 567
SOURCE: Congressional Budget Office.
NOTE: n.a. = not applicable.
a. After these caps expire, this amount is reflected in the "All Other" category.
b. Represents all discretionary outlays that fall under the overall cap but are not governed by caps for particular categories in that year.
The Federal Sector of the National Income and Product Accounts
The projections summarized so far in this chapterdraw on the usual labels—revenues by source, outlaysby category—that are familiar to policymakers. Econ-omists, though, often use another approach for mea-suring the government's activities. The federal sectorof the national income and product accounts dividesthe government's spending and receipts into categoriesthat are conventionally used to analyze domestic pro-duction and income. That categorization allows ana-lysts to track the relationship between the governmentand other sectors of the economy.
Only a few major differences distinguish the NIPAversions of federal receipts and expenditures fromtheir counterparts in the budget. Netting and grossingadjustments move some collections, mainly those la-beled in the budget as offsetting receipts (such asMedicare premiums), from the spending to the receiptsside of the NIPAs (see Table 2-7 on page 45). Thebudget records most such collections as negative out-
lays because they do not result from the government'staxing power. Shifting them to the receipts side of theNIPA ledger offers a fuller picture of government re-ceipts, regardless of source, and does not affect thetotal deficit or surplus.
Macroeconomic analysis typically disregardstransactions that merely reflect the transfer of existingassets and liabilities and that do not contribute to cur-rent production. The NIPAs therefore exclude lendingand financial transactions that appear in the budget.Prominent among such adjustments are those for de-posit insurance outlays, cash flows for direct loansmade before credit reform, and the Federal Communi-cations Commission's auctions of portions of the elec-tromagnetic spectrum. Other, relatively minor factorsthat cause the NIPA and budget totals to diverge aregeographic adjustments (the exclusion of Puerto Rico,the Virgin Islands, and a few other areas from domes-tic economic statistics) and timing adjustments (suchas adjustments for irregular numbers of benefit checksor paychecks because of calendar quirks).
The NIPAs and the total budget also differ in theirtreatment of investment and capital consumption. Thetotal budget includes all federal government expendi-

CHAPTER TWO THE BUDGET OUTLOOK 43
Table 2-5.CBO Projections of Mandatory Spending, Including Deposit Insurance(By fiscal year, in billions of doll ars)
Actual1997 1998 1999 2000 2001 2002 2003 2004 2005 2006 2007 2008
Means-Tested Programs
Medicaid 96 101 109 115 123 131 141 152 165 179 194 210State Children's Health
Insurance Program a a 1 3 4 4 4 4 4 4 4 5Food Stamps 23 21 22 23 25 26 27 28 29 30 30 31Supplemental Security Income 27 27 28 29 31 33 35 37 42 41 39 45Family Supportb 17 18 21 22 23 23 24 24 25 25 25 26Veterans' Pensions 3 3 3 3 3 3 4 4 4 4 4 4Child Nutrition 8 9 9 10 10 11 11 12 12 13 13 14Earned Income Creditc 22 24 26 27 28 29 29 30 30 31 31 32Student Loans 4 3 4 4 5 5 5 5 5 5 5 6Other 4 4 5 5 6 6 6 7 7 8 8 9
Total 203 209 228 243 257 270 285 302 323 339 355 381
Non-Means-Tested Programs
Social Security 362 376 389 406 425 446 467 489 513 539 567 597Medicare 208 214 230 243 266 275 302 325 359 368 406 435
Subtotal 570 590 620 649 691 720 768 814 873 907 973 1,033
Other Retirement and DisabilityFederal civiliand 46 48 50 52 55 57 60 63 67 71 74 78Military 30 31 32 33 34 35 36 37 38 39 40 41Other 4 5 5 5 5 5 5 5 5 5 5 5
Subtotal 81 84 86 90 94 98 102 106 110 115 120 125
Unemployment Compensation 21 19 21 22 25 26 27 29 30 31 32 33
Deposit Insurance -14 -4 -4 -3 -2 -2 -1 -1 -1 -1 -1 -1
Other ProgramsVeterans' benefitse 19 21 21 22 22 23 23 24 26 25 23 25Farm price and income supports 6 8 7 6 5 5 5 5 5 5 5 5Social services 5 5 5 6 5 5 5 5 5 5 5 5Credit reform liquidating accounts -10 -7 a -6 -6 -6 -6 -6 -6 -6 -6 -6Other 17 17 14 24 25 26 26 26 24 24 25 26
Subtotal 37 44 47 52 51 52 53 53 54 52 51 55Total 694 733 769 810 859 895 949 1,001 1,066 1,105 1,176 1,245
Total
All Mandatory Spending 896 942 997 1,052 1,115 1,165 1,234 1,303 1,389 1,443 1,531 1,626
SOURCE: Congressional Budget Office.NOTE: Spending for the benefit programs shown above generally excludes administrative costs, which are discretionary. Spending for Medicare also
excludes premiums, which are considered offsetting receipts.a. Less than $500 million.b. Includes Temporary Assistance for Needy Families, Family Support, Aid to Families with Dependent Children, Job Opportunities and Basic Skills,
Contingency Fund for State Welfare Programs, Child Care Entitlements to States, and Children's Research and Technical Assistance.c. Includes outlays from the child credit enacted in the Taxpayer Relief Act of 1997.d. Includes Civil Service, Foreign Service, Coast Guard, and other retirement programs, and annuitants' health benefits.e. Includes veterans' compensation, readjustment benefits, life insurance, and housing programs.

44 THE ECONOMIC AND BUDGET OUTLOOK: AN UPDATE August 1998
tures, including purchases such as buildings and air-craft carriers, that could be considered investments.The NIPA version shows the current, or operating,account for the federal government; consequently,government investment is left out, and the govern-ment's consumption of fixed capital (depreciation) isincluded.
The NIPA federal sector generally portrays re-ceipts according to their sources and expenditures ac-cording to their purpose and destination (see Table2-8). Receipts are split into four large categories:personal tax and nontax receipts, tax accruals fromcorporate profits, indirect business tax and nontax
Table 2-6.CBO Projections of Fed eral Interest Costs and Debt (By fiscal year)
Actual1997 1998 1999 2000 2001 2002 2003 2004 2005 2006 2007 2008
Net Interest Outlays (Billions of dollars)
Interest on Gross Federal Debt(Gross interest)a 356 363 363 365 363 360 357 357 357 356 354 352
Interest Received by Trust FundsSocial Security -41 -46 -51 -57 -64 -70 -77 -84 -91 -99 -108 -117Other trust fundsb -64 -67 -67 -70 -72 -73 -75 -77 -79 -81 -84 -86
Subtotal -105 -113 -118 -128 -136 -143 -151 -161 -170 -180 -191 -202
Other Interestc -7 -6 -7 -6 -7 -7 -8 -8 -9 -9 -10 -10
Total 244 244 238 232 221 209 198 189 178 166 153 140
Federal Debt at the End of the Year (Billions of dollars)
Gross Federal Debt 5,370 5,475 5,594 5,721 5,845 5,927 6,021 6,102 6,174 6,205 6,223 6,222
Debt Held by Government AccountsSocial Security 631 736 853 978 1,108 1,246 1,392 1,547 1,712 1,885 2,066 2,252Other accounts 968 1,022 1,087 1,154 1,219 1,286 1,354 1,419 1,481 1,541 1,600 1,650
Subtotal 1,599 1,757 1,939 2,132 2,327 2,532 2,746 2,966 3,193 3,426 3,665 3,902
Debt Held by the Public 3,771 3,717 3,655 3,589 3,518 3,395 3,275 3,136 2,981 2,779 2,557 2,320
Debt Subject to Limitd 5,328 5,437 5,557 5,685 5,810 5,893 5,988 6,072 6,145 6,178 6,196 6,196
Federal Debt as a Percentage of GDP
Debt Held by the Public 47.3 44.3 41.7 39.3 37.1 34.3 31.6 28.9 26.3 23.5 20.7 18.0
SOURCE: Congressional Budget Office.
NOTE: Projections of interest and debt assume that discretionary spending will equal the statutory caps that are in effect through 2002 and will growat the rate of inflation in succeeding years.
a. Excludes interest costs of debt issued by agencies other than the Treasury (primarily the Tennessee Valley Authority).
b. Principally Civil Service Retirement, Military Retirement, Medicare, unemployment insurance, and the Highway and the Airport and Airway TrustFunds.
c. Primarily interest on loans to the public.
d. Differs from the gross federal debt primarily because most debt issued by agencies other than the Treasury is excluded from the debt limit.

CHAPTER TWO THE BUDGET OUTLOOK 45
Table 2-7.Relationship of the Budget to the Fed eral Sector of the Nat ional Income and Product Accounts(By fiscal year, in billions of doll ars)
Actual1997 1998 1999 2000 2001 2002 2003 2004 2005 2006 2007 2008
Receipts
Revenue (Budget basis)a 1,579 1,717 1,801 1,848 1,903 1,978 2,053 2,142 2,243 2,342 2,446 2,553
DifferencesNetting and grossing
Government contributionsfor employee retirement 71 72 73 76 78 80 82 85 87 90 93 96
Medicare premiums 20 21 23 25 28 31 34 38 42 46 50 54Deposit insurance premiums 5 b b b b b b b b b b bOther 7 3 4 1 1 1 1 -2 -2 -3 -4 -5
Geographic exclusions -3 -3 -3 -3 -3 -4 -4 -4 -4 -4 -4 -5Excise timing adjustments 1 6 -7 0 0 0 0 0 0 0 0 0Universal Service Fund Receipts -1 -3 -6 -9 -12 -13 -13 -13 -13 -14 -14 -14Other 12 1 6 7 6 6 7 7 7 7 7 7
Total 113 97 90 96 97 102 107 112 117 122 128 134
Receipts (NIPA basis) 1,692 1,814 1,891 1,944 2,000 2,080 2,160 2,254 2,360 2,464 2,574 2,687
Expenditures
Outlays (Budget basis)a 1,601 1,654 1,721 1,769 1,817 1,840 1,918 1,988 2,073 2,126 2,211 2,303
DifferencesNetting and grossing
Government contributionsfor employee retirement 71 72 73 76 78 80 82 85 87 90 93 96
Medicare premiums 20 21 23 25 28 31 34 38 42 46 50 54Deposit insurance premiums 5 b b b b b b b b b b bOther 7 3 4 1 1 1 1 -2 -2 -3 -4 -5
Lending and financial transactions 29 13 9 10 11 18 8 7 8 9 9 8Defense timing adjustment b -1 1 1 0 0 0 0 0 0 0 0Geographic exclusions -9 -10 -10 -11 -11 -11 -12 -12 -13 -13 -14 -15Treatment of investment and depreciation 10 10 9 9 8 9 7 6 4 3 1 bMandatory timing adjustments 0 0 0 0 -5 5 0 0 -14 9 6 0Universal Service Fund Payments -1 -2 -6 -9 -12 -13 -13 -13 -13 -14 -14 -14Other 4 -2 -2 -2 -2 -2 -2 -2 -2 -2 -2 -2
Total 136 105 102 100 97 118 105 107 96 124 125 123
Expenditures (NIPA basis) 1,737 1,759 1,823 1,869 1,914 1,957 2,023 2,095 2,169 2,249 2,335 2,425
Deficit or Surplus
Deficit (-) or Surplus (Budget basis)a -22 63 80 79 86 139 136 154 170 217 236 251
DifferencesLending and financial transactions -29 -13 -9 -10 -11 -18 -8 -7 -8 -9 -9 -8Defense timing adjustment b 1 -1 -1 0 0 0 0 0 0 0 0Geographic exclusions 7 7 7 7 8 8 8 9 9 9 10 10Treatment of investment and depreciation -10 -10 -9 -9 -8 -9 -7 -6 -4 -3 -1 bMandatory and excise
timing adjustments 1 6 -7 0 5 -5 0 0 14 -9 -6 0Universal Service Fund b -1 0 0 0 0 0 0 0 0 0 0Other 8 2 8 8 8 8 9 9 9 9 10 9
Total -23 -8 -12 -4 1 -16 2 5 21 -2 3 11
Deficit (-) or Surplus (NIPA basis) -45 55 68 75 86 123 137 159 191 215 239 262
SOURCE: Congressional Budget Office.a. Includes Social Security and the Postal Service.b. Less than $500 million.

46 THE ECONOMIC AND BUDGET OUTLOOK: AN UPDATE August 1998
Table 2-8.Projections of Receipts and Expe nditu res Measured by theNational Income and Product Accounts (By fi scal year, in billions of doll ars)
Actual1997 1998 1999 2000 2001 2002 2003 2004 2005 2006 2007 2008
Receipts
Personal Tax andNontax Receipts 754 835 873 890 916 958 994 1,040 1,092 1,143 1,198 1,257
Corporate ProfitsTax Accruals 206 211 217 223 221 224 231 241 250 262 274 287
Indirect Business Taxand Nontax Accruals 96 93 98 99 102 106 109 110 113 115 117 120
Contributions forSocial Insurance 637 675 703 733 760 792 826 863 905 944 985 1,024
Total 1,692 1,814 1,891 1,944 2,000 2,080 2,160 2,254 2,360 2,464 2,574 2,687
Expenditures
Purchases of Goods and ServicesDefense
Consumption 252 247 256 264 267 278 287 296 309 316 323 337Consumption of fixed capital 57 57 56 55 55 54 54 54 54 54 54 55
NondefenseConsumption 137 138 149 155 160 165 171 177 182 188 194 201Consumption of fixed capital 14 15 15 16 16 17 17 17 17 17 17 18
Subtotal 460 457 477 490 498 514 529 544 562 575 589 610
Transfer PaymentsDomestic 774 797 837 875 922 970 1,021 1,076 1,133 1,196 1,262 1,332Foreign 14 12 13 13 13 14 14 14 15 15 15 16
Subtotal 787 809 850 888 935 984 1,035 1,090 1,148 1,211 1,277 1,347
Grants-in-Aid to Stateand Local Governments 221 229 250 266 278 290 304 319 335 353 374 395
Net Interest 230 231 225 217 206 194 182 172 160 148 134 120Subsidies Less Current Surplus
of Government Enterprises 38 33 34 33 34 35 36 38 39 41 42 44Required Reductions in
Discretionary Spendinga n.a. n.a. -14 -26 -38 -60 -63 -68 -76 -78 -81 -91
Total 1,737 1,759 1,823 1,869 1,914 1,957 2,023 2,095 2,169 2,249 2,335 2,425
Memorandum :Deficit (-) or Surplus -45 55 68 75 86 123 137 159 191 215 239 262
SOURCE: Congressional Budget Office.
NOTE: n.a. = not applicable.
a. Unspecified reductions needed to comply with the statutory caps on discretionary spending.

CHAPTER TWO THE BUDGET OUTLOOK 47
accruals, and contributions for social insurance.Those labels summarize the nature of the collectionand the identity of the payer. The term "nontax" indi-cates that NIPA receipts include some charges, suchas fees and premiums, that are not generally treated asrevenues in the federal budget.
Federal spending can take the form of defenseand nondefense purchases (which enter directly intoGDP), transfers (most of which find their way intopersonal income and from there into consumption orsaving), grants to state and local governments (which
may end up as state and local purchases or transfers),net interest, and subsidies minus the current surplus ofgovernment enterprises such as the Postal Service andpublic housing authorities. Because of the discretion-ary spending caps that are mandated by law, requiredreductions in discretionary spending make up a finalcategory. The caps will limit future spending for pro-grams funded through the appropriation process. Al-though no one can predict how particular programswill fare, the deepest effects of the required reductionswill almost certainly be felt in the NIPA categories ofdefense and nondefense purchases and grants.

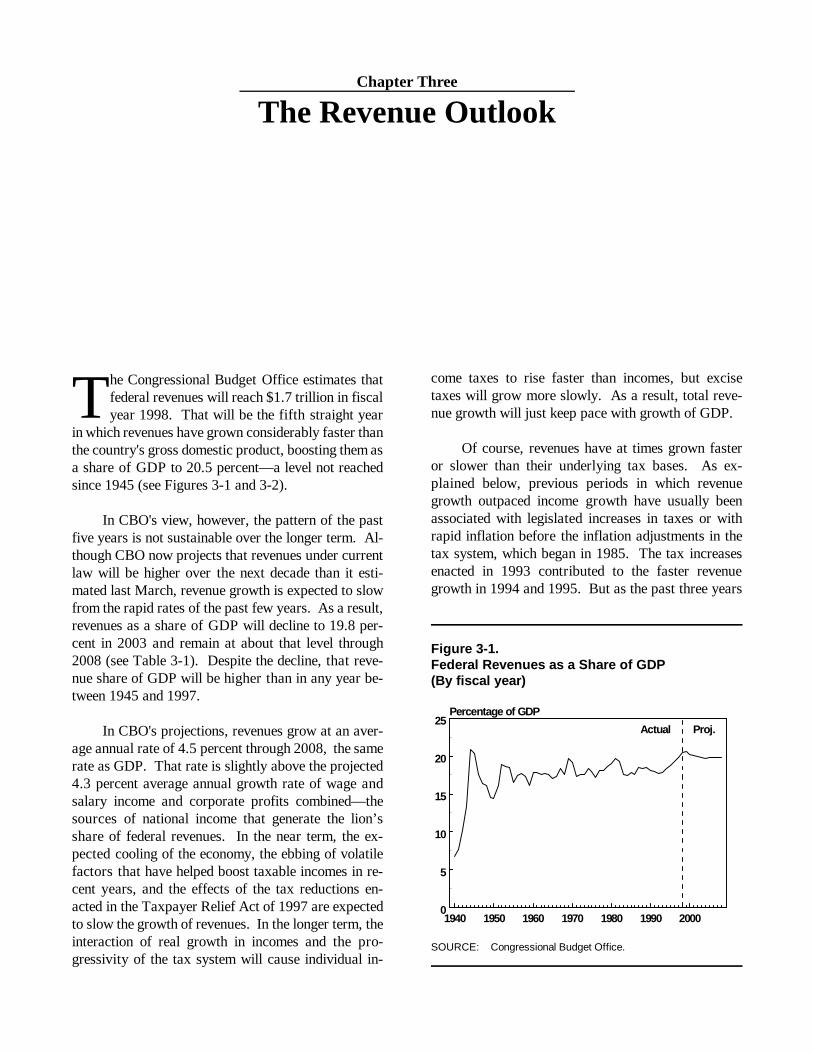
1940 1950 1960 1970 1980 1990 20000
5
10
15
20
25Percentage of GDP
Actual Proj.
Chapter Three
The Revenue Outlook
The Congressional Budget Office estimates thatfederal revenues will reach $1.7 trillion in fiscalyear 1998. That will be the fifth straight year
in which revenues have grown considerably faster thanthe country's gross domestic product, boosting them asa share of GDP to 20.5 percent—a level not reachedsince 1945 (see Figures 3-1 and 3-2).
In CBO's view, however, the pattern of the pastfive years is not sustainable over the longer term. Al-though CBO now projects that revenues under currentlaw will be higher over the next decade than it esti-mated last March, revenue growth is expected to slowfrom the rapid rates of the past few years. As a result,revenues as a share of GDP will decline to 19.8 per-cent in 2003 and remain at about that level through2008 (see Table 3-1). Despite the decline, that reve-nue share of GDP will be higher than in any year be-tween 1945 and 1997.
In CBO's projections, revenues grow at an aver-age annual rate of 4.5 percent through 2008, the samerate as GDP. That rate is slightly above the projected4.3 percent average annual growth rate of wage andsalary income and corporate profits combined—thesources of national income that generate the lion’sshare of federal revenues. In the near term, the ex-pected cooling of the economy, the ebbing of volatilefactors that have helped boost taxable incomes in re-cent years, and the effects of the tax reductions en-acted in the Taxpayer Relief Act of 1997 are expectedto slow the growth of revenues. In the longer term, theinteraction of real growth in incomes and the pro-gressivity of the tax system will cause individual in-
come taxes to rise faster than incomes, but excisetaxes will grow more slowly. As a result, total reve-nue growth will just keep pace with growth of GDP.
Of course, revenues have at times grown fasteror slower than their underlying tax bases. As ex-plained below, previous periods in which revenuegrowth outpaced income growth have usually beenassociated with legislated increases in taxes or withrapid inflation before the inflation adjustments in thetax system, which began in 1985. The tax increasesenacted in 1993 contributed to the faster revenuegrowth in 1994 and 1995. But as the past three years
Figure 3-1.Federal Revenues as a Share of GDP(By fiscal year)
SOURCE: Congressional Budget Office.

50 THE ECONOMIC AND BUDGET OUTLOOK: AN UPDATE August 1998
1960 1965 1970 1975 1980 1985 1990 1995 2000 2005-5
0
5
10
15
20
25Percentage Change from Previous Year
Actual ProjectedRevenue Growth
GDP Growth
demonstrate, revenues can grow faster than the taxbase even without those conditions being present. Forthat trend to continue, however, factors that are likelyto have boosted tax revenues—such as the surge incapital gains realizations and the jump in incomes ofhigher-income taxpayers—would have to continuegrowing at accelerated rates. That assumption is un-likely to be valid given the past patterns of change inthose volatile income sources, particularly when com-bined with the expected waning of the boom years ofthe 1990s that may well have sparked their rise.
With the benefit of actual data on tax receiptsreported by the Treasury for the first 10 months of thefiscal year, CBO now expects revenues to reach$1,717 billion in 1998. That amount is $38 billion, or2.2 percent, higher than CBO estimated last March(based on actual receipts through January) and $53billion, or 3.2 percent, higher than CBO’s Januaryestimate. The size of those tax collections, which tookmost observers by surprise, was the major factor influ-encing CBO's decision to increase projected revenuesin future years above the levels estimated in March.
Stronger-than-expected growth in the economycan account for just $7 billion of the $53 billion reve-nue underestimate in January, and new legislation ac-
counts for an additional $1 billion. That leaves $45billion unexplained. All of that $45 billion is associ-ated with unexpectedly strong growth in individualincome tax collections, but the particular sources ofincome responsible for the growth will not be knownfor another two years, when all the relevant tax returnshave been filed and processed.
After examining the limited data available, CBOconcludes that volatile sources of income, such asthose associated with the recent remarkable gains inthe stock market, are probably responsible for much ofthe recent rapid growth in individual income taxes.However, although the surge in those income sourcesis bound to falter, the timing of the change is uncer-tain. Moreover, other explanations point to factorsthat could spur continued growth of revenues. Facedwith insufficient information, CBO has chosen a mid-dle path and assumes that the additional 1998 reve-nues will continue at the same level in 1999 and be-yond. Adding the same amount to revenues each yearresults in an increasingly smaller percentage change inprojected revenues. That path, as with all revenueprojections, is uncertain, particularly in the absence ofcomplete information about the factors that have pro-duced the recent surge in revenues.
Figure 3-2.Annual Growth of Fed eral Revenues and GDP (By fiscal year)
SOURCE: Congressional Budget Office.
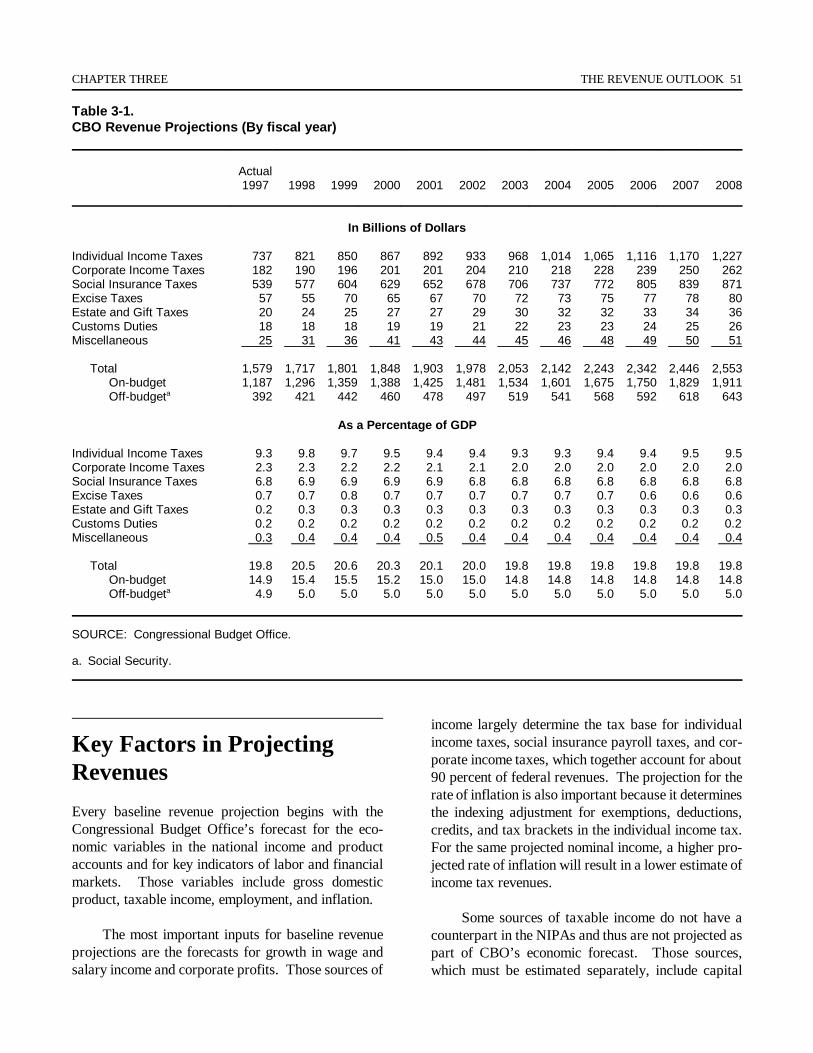
CHAPTER THREE THE REVENUE OUTLOOK 51
Table 3-1.CBO Revenue Project ions (By fi scal year)
Actual1997 1998 1999 2000 2001 2002 2003 2004 2005 2006 2007 2008
In Billions of Dollars
Individual Income Taxes 737 821 850 867 892 933 968 1,014 1,065 1,116 1,170 1,227Corporate Income Taxes 182 190 196 201 201 204 210 218 228 239 250 262Social Insurance Taxes 539 577 604 629 652 678 706 737 772 805 839 871Excise Taxes 57 55 70 65 67 70 72 73 75 77 78 80Estate and Gift Taxes 20 24 25 27 27 29 30 32 32 33 34 36Customs Duties 18 18 18 19 19 21 22 23 23 24 25 26Miscellaneous 25 31 36 41 43 44 45 46 48 49 50 51
Total 1,579 1,717 1,801 1,848 1,903 1,978 2,053 2,142 2,243 2,342 2,446 2,553On-budget 1,187 1,296 1,359 1,388 1,425 1,481 1,534 1,601 1,675 1,750 1,829 1,911Off-budgeta 392 421 442 460 478 497 519 541 568 592 618 643
As a Percentage of GDP
Individual Income Taxes 9.3 9.8 9.7 9.5 9.4 9.4 9.3 9.3 9.4 9.4 9.5 9.5Corporate Income Taxes 2.3 2.3 2.2 2.2 2.1 2.1 2.0 2.0 2.0 2.0 2.0 2.0Social Insurance Taxes 6.8 6.9 6.9 6.9 6.9 6.8 6.8 6.8 6.8 6.8 6.8 6.8Excise Taxes 0.7 0.7 0.8 0.7 0.7 0.7 0.7 0.7 0.7 0.6 0.6 0.6Estate and Gift Taxes 0.2 0.3 0.3 0.3 0.3 0.3 0.3 0.3 0.3 0.3 0.3 0.3Customs Duties 0.2 0.2 0.2 0.2 0.2 0.2 0.2 0.2 0.2 0.2 0.2 0.2Miscellaneous 0.3 0.4 0.4 0.4 0.5 0.4 0.4 0.4 0.4 0.4 0.4 0.4
Total 19.8 20.5 20.6 20.3 20.1 20.0 19.8 19.8 19.8 19.8 19.8 19.8On-budget 14.9 15.4 15.5 15.2 15.0 15.0 14.8 14.8 14.8 14.8 14.8 14.8Off-budgeta 4.9 5.0 5.0 5.0 5.0 5.0 5.0 5.0 5.0 5.0 5.0 5.0
SOURCE: Congressional Budget Office.
a. Social Security.
Key Factors in Projecting
Revenues
Every baseline revenue projection begins with theCongressional Budget Office’s forecast for the eco-nomic variables in the national income and productaccounts and for key indicators of labor and financialmarkets. Those variables include gross domesticproduct, taxable income, employment, and inflation.
The most important inputs for baseline revenueprojections are the forecasts for growth in wage andsalary income and corporate profits. Those sources of
income largely determine the tax base for individualincome taxes, social insurance payroll taxes, and cor-porate income taxes, which together account for about90 percent of federal revenues. The projection for therate of inflation is also important because it determinesthe indexing adjustment for exemptions, deductions,credits, and tax brackets in the individual income tax.For the same projected nominal income, a higher pro-jected rate of inflation will result in a lower estimate ofincome tax revenues.
Some sources of taxable income do not have acounterpart in the NIPAs and thus are not projected aspart of CBO’s economic forecast. Those sources,which must be estimated separately, include capital

52 THE ECONOMIC AND BUDGET OUTLOOK: AN UPDATE August 1998
gains realizations and distributions from pensions,401(k) plans, and individual retirement accounts(IRAs). CBO must also make separate estimates formany other items, including the growth in both adjust-ments to income (such as IRA contributions) and item-ized deductions. Having constructed the database forthe projection year, CBO estimates tax liabilities usinga detailed model of the tax rules for that year.
For all revenue sources, the next step after deter-mining liabilities is to estimate the payments based onthose liabilities. In the case of certain excise taxes,payment schedules are known, and the payment ofthose liabilities is quite predictable. In the case of in-come taxes, however, taxpayers have some discretion(within legal limits) about when and in what form topay those liabilities. Analysts must estimate howmuch of the individual income tax liability incurred ina particular calendar year will show up as payments inthe concurrent fiscal year (either through withholdingor through quarterly estimated payments) and howmuch will show up as final payments in April of thefollowing year. Analysts must also estimate the pay-ment pattern of corporations.
Actual revenues can thus differ from projectedrevenues for a number of reasons. First, the historicaleconomic data that are the starting point for the pro-jections are themselves subject to revision. In addi-tion, the economic forecast may turn out to be higheror lower than actual outcomes, and income reported ontax returns may grow at different rates than those fore-cast for aggregate economic variables. The projec-tions for other economic variables that are not re-ported in the NIPAs may also be off the mark. Even ifthe overall growth rate is forecast accurately, somesources of income may grow at different rates for dif-ferent taxpayers, which could affect tax liabilities; forexample, faster-than-average income growth forhigher-income taxpayers will boost revenues becausehigher income is taxed at higher rates. Finally, thetiming of tax payments may differ from what was ex-pected.
Revenues in 1998
Based on information through July, revenues in fiscalyear 1998 will most likely be $53 billion higher than
the $1,665 billion estimated last January (see Table3-2). An underestimate of individual income tax re-ceipts accounts for almost all of that discrepancy.Projections of the other sources of revenues were closeto the mark. Corporate income taxes appear to besomewhat lower than expected and social insurancetaxes somewhat higher, but those two forecasting er-rors are offsetting. In both cases, the difference be-tween the January estimate and the current estimate isattributable to small forecasting errors in the relevantcomponents of taxable income—corporate profits andwages.
The underestimate in the forecast of wages andsalaries, however, can account for only $8 billion ofthe expected $53 billion underestimate of individualincome tax receipts. One must look elsewhere for thesource of the remaining $45 billion.
Data on collections so far this year indicate thatthe additional individual income tax revenue camefrom taxes owed on both 1997 and 1998 incomes.
Table 3-2.Comparison of CBO’s July and January 1998Projections of Fed eral Revenues for Fiscal Year 1998 (In billions of doll ars)
CBO’s Projections
SourceJuly1998
January1998
Differ-ence
Individual Income TaxesWithheld 636 614 22Nonwithheld 284 255 29Refunds -99 -101 2
Subtotal 821 768 53
Corporate Income Taxes 190 197 -7
Social Insurance Taxes 577 573 5
Excise Taxes 55 55 0
All Other Revenue Sources 74 72 1
Total 1,717 1,665 53
SOURCE: Congressional Budget Office.

CHAPTER THREE THE REVENUE OUTLOOK 53
1955 1960 1965 1970 1975 1980 1985 1990 1995-100
-50
0
50
100Percentage Change from Previous Year
About one-third of the unexplained increase was infinal payments in April, which reflect tax liabilities onincome received in calendar year 1997; one-third wasin higher-than-expected withholding on 1998 incomes;and the other one-third was in higher-than-expectedestimated tax payments on 1998 liabilities, which arealso based on 1998 incomes. Because the additionalrevenues have come from liabilities for both 1997 and1998 and because the additional payments on 1998liabilities include both withheld and nonwithheld taxes,a number of factors are likely to have contributed toCBO’s underestimate in January.
The available data, however, provide virtually noinformation about the income that generated those taxcollections. A well-founded explanation of the unex-pected revenues would require detailed informationfrom tax returns about the particular sources of in-come and other factors that generated tax liabilities incalendar years 1997 and 1998. But such informationis available only through 1996. Because many tax-payers, especially those with high incomes, file forextensions beyond the April 15 filing date, sufficientdata on 1997 incomes and tax liabilities will not beavailable until late this year, after returns filed in Au-gust and October have been processed. Data on 1998liabilities will not be available until late 1999.
Evidence from Prior Years
This year is likely to be the third in a row in whichactual revenues have exceeded the amount CBO esti-mated in its winter baseline projections. Some of theexplanations for the additional revenues in the previ-ous two years could apply to the additional revenues in1998.
In January 1997, CBO underestimated tax lia-bilities for 1996 by about $25 billion, even thoughNIPA incomes for most of the year were known at thatpoint. Two factors account for that underestimate.First, estimates of income growth in 1996 based onincomes that were originally reported in the NIPAsturned out to be too low. Later revisions that the De-partment of Commerce made to reported incomesraised the estimated growth rate. The revised figuresfor 1996 would have generated an additional $5 billion
in revenues had those estimates been used instead ofthe originally reported estimates.
Second, there were a number of differences be-tween projected incomes and deductions and the datalater reported on 1996 tax returns. For example, in-come from partnerships and Subchapter S corpora-tions, which is highly concentrated among high-incometaxpayers and thus taxed at higher-than-average taxrates, rose 18 percent in 1996—much faster than pro-jected. Wages and salaries for high-income taxpayersgrew faster than average, boosting liabilities by almost$3 billion compared with what they would have been ifall wages had risen at the average rate. The growth indeductions, which was projected to keep pace withincome growth, lagged behind incomes. And pensionincome and distributions from IRAs and 401(k) plansgrew faster than projected.
Unexpectedly high realizations of capital gains incalendar year 1996, on which taxes were paid primar-ily in January and April of 1997, contributed about$15 billion in additional revenues. Taxable capitalgains realizations grew by 45 percent between 1995and 1996—a growth rate exceeded only twice duringthe past 40 years, in 1979 and 1986 (see Figure 3-3).
Figure 3-3.Annual Growth of T axable Capital GainsRealizations (By calendar year)
SOURCE: Congressional Budget Office.
NOTES: The spike in 1986—and the decline in 1987—occurredbecause taxpayers rushed to realize capital gains beforean increase in the tax rate took effect in 1987.
54 THE ECONOMIC AND BUDGET OUTLOOK: AN UPDATE August 1998
That growth was all the more extraordinary becausethe tax rate on capital gains did not change between1995 and 1996. If anything, taxpayers in 1996 mighthave anticipated a future rate reduction, giving theman incentive to defer realizations of past gains until thetax cut was enacted.
How should knowledge about the sources ofgrowth in liabilities in 1996 be used in projecting fu-ture revenues? The answer depends on which of thefactors at work in 1996 have continued into 1998 andwhether and to what extent they will continue in thefuture. If incomes in 1997 and 1998 turn out to behigher than has been reported in the NIPA data, thatdiscrepancy might produce an effect that grows overtime at roughly the rate of the projected growth in in-comes. The incomes of high-income taxpayers couldcontinue to rise more rapidly than average incomes,but they could also grow at the same rate or moreslowly, producing a constant or declining effect onfuture revenues. An increase in realizations of de-ferred income that has accumulated over a number ofyears—such as capital gains—is often a temporaryphenomenon, although the tax cuts enacted in 1997provided an additional boost to realizations as taxpay-ers responded to the lower tax rate on gains. Unlessthere is a change in tax law, realizations will probablynot continue to grow at their recent high rate, except inthe unlikely event that the stock market repeats its re-markable performance of recent years.
One source of the underestimate in 1996 seemslikely to have continued into 1997 and may contributeto growing amounts of revenue in the future. In recentyears, the growth rate of pension payouts and with-drawals from 401(k)s and individual retirement ac-counts has exceeded CBO’s estimates. Contributionsto 401(k)s and IRAs grew rapidly in the 1980s, andassets in those accounts accumulated as the stock mar-ket soared. The result is that withdrawals have beengrowing in the 1990s.
After assessing the possible alternatives, CBOhas assumed that, on balance, the factors likely tohave boosted incomes and tax revenues in recent yearswill neither continue to grow at the same pace nor rap-idly fade away. Thus, the additional revenues in 1998have been projected to continue over the next decadeat their 1998 level. That assumption, along with smallchanges resulting from other adjustments, generates
the technical changes to revenues discussed in Chapter2. CBO will reevaluate that assumption for next win-ter’s baseline using the data about 1997 taxable in-comes that will become available at the end of thisyear and taking into account the 1998 revisions to theNIPA statistics.
Several changes in tax provisions in 1998 hadonly a small effect on revenues. The Internal RevenueService Restructuring and Reform Act of 1998 willadd about $1 billion to corporate income tax revenuein 1998. The Congress did not extend severalrevenue-reducing tax provisions before they expiredon June 30, 1998, but that did not result in higher pro-jected revenues for 1998 in the current baseline be-cause CBO’s winter projections assumed their expira-tion. The expired provisions are the credit for re-search and experimentation, the Generalized System ofPreferences program, the work opportunity tax credit,a nonconventional fuels credit, and a provision thataffects allowable deductions for gifts made to privatefoundations.
Revenue Estimates for 1999 and 2000
CBO expects growth in revenues to outpace growth inGDP in 1999, pushing the revenue share of GDP to20.6 percent. But the rate at which revenues grow willslow considerably. Total revenues are likely to in-crease by 8.7 percent in 1998 but by only 4.9 percentin 1999 and 2.6 percent in 2000 (see Table 3-3).
All three of the major revenue sources—individ-ual and corporate income taxes and social insurancetaxes—contribute to the slowdown in revenue growthprojected for 1999. That drop is attributable in part toeconomic factors. The growth in the sum of wagesand profits is projected to fall to 4.1 percent in 1999,down from 6.5 percent in 1998. In recent years, thoseincomes have grown more rapidly than GDP, contrib-uting to the increase in taxes as a share of GDP. Butin 1999, incomes and GDP are projected to grow atabout the same rate (see Figure 3-4).
The rest of the drop in the growth rate of reve-nues comes from CBO’s assumption that the factors

CHAPTER THREE THE REVENUE OUTLOOK 55
that produced the unexpected revenues in 1998 willadd about the same dollar amount to revenues in 1999as they did in 1998. If, instead, that effect actuallygrows, revenues will rise at a faster rate. However, ifit turns out that the additional revenues resultedlargely from temporary factors in 1998, the growthrate of revenues may decline even more precipitouslythan projected in 1999.
The growth rate of individual income taxes isexpected to fall sharply between 1998 and 1999, from11.3 percent to 3.6 percent. The expected cooling ofthe economy, the assumption that the unexpected reve-nue in 1998 will continue at its 1998 level rather thangrow, and provisions in the Taxpayer Relief Act of1997 will all contribute to the slowdown.
Table 3-3.Revenues, by Source, Since Fiscal Year 1985
CorporateSocial
InsuranceExcise Taxes
and AllIndividual Income Taxes Income Taxes and Other Reve- Total
Fiscal Year Withheld Nonwithheld Totala Taxes Contributions nue Sources Revenues
In Billions of Dollars
1985 299 101 335 61 265 73 7341986 315 106 349 63 284 73 7691987 322 143 393 84 303 75 8541988 341 132 401 95 334 79 9091989 361 155 446 103 359 83 9911990 388 151 467 94 380 92 1,0321991 404 143 468 98 396 93 1,0551992 408 149 476 100 414 101 1,0911993 430 155 510 118 428 99 1,1541994 460 160 543 140 461 114 1,2591995 500 176 590 157 484 120 1,3521996 533 212 656 172 509 115 1,4531997 580 251 737 182 539 120 1,5791998b 636 284 821 190 577 129 1,7171999b 673 300 850 196 604 150 1,8012000b 698 299 867 201 629 152 1,848
Percentage Change from Previous Year
1986 5.3 4.6 4.3 3.0 7.1 0.2 4.81987 2.4 34.9 12.5 32.9 6.8 1.8 11.11988 5.9 -7.5 2.2 12.6 10.2 6.3 6.41989 5.8 17.1 11.1 9.3 7.5 4.4 9.01990 7.5 -2.3 4.8 -9.5 5.7 10.6 4.11991 4.1 -5.7 0.2 4.9 4.2 1.7 2.21992 1.0 4.7 1.7 2.2 4.5 8.9 3.41993 5.4 3.6 7.1 17.2 3.5 -2.4 5.81994 6.8 3.4 6.5 19.5 7.7 15.0 9.01995 8.7 9.8 8.7 11.8 5.0 5.6 7.41996 6.6 20.7 11.2 9.4 5.1 -3.9 7.51997 8.8 18.2 12.3 6.1 5.9 4.1 8.71998b 9.7 13.1 11.3 4.3 7.0 7.2 8.71999b 5.8 5.6 3.6 3.2 4.6 16.5 4.92000b 3.7 c 1.9 2.5 4.1 1.0 2.6
SOURCE: Congressional Budget Office.
a. Because it includes tax refunds, this total is less than the sum of withheld and nonwithheld individual income taxes.
b. Projected.
c. Less than 0.05 percent.

56 THE ECONOMIC AND BUDGET OUTLOOK: AN UPDATE August 1998
1960 1965 1970 1975 1980 1985 1990 1995 2000 20050
5
10
15Percentage Change from Previous Year
Actual Projected
Income Growth
GDP Growth
a
As the economy slows, wage growth is projectedto fall from 7.1 percent to 4.6 percent. The growth inthe amount of income taxes withheld from people’spaychecks—an amount that is based largely on thelevel of wages and salaries—should slow even morebecause there will be less “real bracket creep.” Evenwhen the tax system is indexed for inflation, bracketcreep occurs when real wages are increasing, becausethe tax rate on additional wages is higher than the av-erage tax rate on wages. A taxpayer in the 28 percentbracket, for example, will have all additional wagegrowth in excess of inflation taxed at 28 percent. Be-cause of personal exemptions, the standard deduction,and the 15 percent bracket, the tax on that taxpayer’stotal wages is less than 28 percent. Under the currentindividual income tax system, revenues increase byabout 1.5 percentage points for each percentage pointthat the growth in income per taxpayer exceeds theinflation rate. Thus, slower wage growth will lead to amore-than-commensurate slowdown in withheld taxes.
The Taxpayer Relief Act alone lowers the pro-jected growth rate of individual income taxes by nearly3 percentage points. The first payouts of the child andeducation credits enacted in 1997 are expected to in-crease refunds by about 25 percent between 1998 and1999. The act, however, has little effect on the overall
Figure 3-4.Annual Growth of Income and GDP(By fiscal year)
SOURCE: Congressional Budget Office.
a. Income is defined as wages and salaries plus corporate profits.
growth rate of revenues. A shift of about $7 billion inexcise tax payments from August and September 1998to October 1998, as permitted by the act, should boostexcise tax revenue in 1999, offsetting most of the re-duction in individual income taxes.
The weak projected growth of revenues in 2000results from several factors. The sum of wages andprofits is projected to grow even more slowly in 2000—by just 3.8 percent. In addition, the Taxpayer Re-lief Act is expected to shave about 1 percentage pointfrom the growth of total revenues. Projected individ-ual income taxes in 2000 reflect the expectation thatsome recipients of the new child and education creditswill adjust their withholding rates after they receivelarge refunds in the spring of 1999, dampening thegrowth in withheld taxes.
The Longer-Term Revenue Outlook
Unless tax laws change, revenues will continue to behistorically high as a percentage of GDP for the next10 years. CBO expects that to be the case despite lastyear’s tax cuts, which will lower revenues by about0.3 percent of GDP in 2000 and later years. Underbaseline assumptions, CBO projects that total reve-nues as a share of GDP will decline only slightly, from20.3 percent of GDP in 2000 to 19.8 percent in 2008.The projections assume that provisions scheduled toexpire in 1999 and later years will do so as specifiedin current law. In keeping with baseline rules spelledout in the Balanced Budget and Emergency DeficitControl Act of 1985, however, the projections assumethat excise taxes dedicated to trust funds will be ex-tended before they expire.
Some striking shifts have occurred in the compo-sition of revenues since 1960 (see Figure 3-5). One ofthe most visible shifts is the government's increasingreliance on receipts from social insurance taxes (nowabout 7 percent of GDP), which are largely generatedby the payroll taxes that fund Social Security andMedicare’s Hospital Insurance program. Legislationduring that period has expanded the payroll tax baseand raised the payroll tax rate. Another change is thegovernment’s diminishing reliance on receipts from

CHAPTER THREE THE REVENUE OUTLOOK 57
1960 1965 1970 1975 1980 1985 1990 1995 2000 20050
2
4
6
8
10
12Percentage of GDP
Actual Projected
Individual Income Taxes
1960 1965 1970 1975 1980 1985 1990 1995 2000 20050
2
4
6
8
10
12Percentage of GDP
Actual Projected
Social Insurance Taxes
1960 1965 1970 1975 1980 1985 1990 1995 2000 20050
2
4
6
8
10
12Percentage of GDP
Actual Projected
Corporate Income Taxes
1960 1965 1970 1975 1980 1985 1990 1995 2000 20050
2
4
6
8
10
12Percentage of GDP
Actual Projected
Excise Taxes
corporate income taxes and excise taxes (now about 2percent and 1 percent of GDP, respectively). Individ-ual income tax receipts, which contribute the most togovernment coffers, have fluctuated in the range of 8percent to 9 percent of GDP for three decades, butthey are likely to hit their highest level ever—9.8percent—in 1998. The two earlier peaks occurred in1969, when revenues were boosted by a temporarysurcharge to finance the Vietnam War, and in 1981,when revenues were pushed up because several yearsof high inflation had moved many people into highertax brackets.
Although revenues will increase more slowlythan in past decades, they will grow slightly faster
than incomes over the 1998-2008 period. From 1959through 1997, revenues increased at an average annualrate of 8.2 percent, compared with 7.6 percent forGDP and 7.4 percent for wages and profits (see Table3-4). Most of the revenue growth in excess of incomegrowth came about because of legislated increases inpayroll taxes, which rose at an average annual rate of10.6 percent over that period compared with 7.5 per-cent for all other taxes. With income growth expectedto slow from the rates of past decades for reasons dis-cussed in Chapter 1 (including much slower growth inthe labor force, slower growth in productivity than inthe 1960s, and much lower inflation than in the 1970sand 1980s), revenue growth must also slow.
Figure 3-5.Revenues, by Source, as a Share of GDP (By fiscal year)
SOURCE: Congressional Budget Office.

58 THE ECONOMIC AND BUDGET OUTLOOK: AN UPDATE August 1998
Individual Income Taxes
Individual income tax receipts are projected to declinefrom 9.8 percent of GDP in 1998 to 9.3 percent in2003 (see Table 3-5). A significant factor is that tax-able capital gains realizations are projected to returnto levels more consistent with the size of the economyand the current tax rate on gains. CBO expects thegrowth of the stock market to subside and the responseto last year’s cut in the tax rate on gains to be smallerafter the first year, which in turn will cause capitalgains tax receipts to rise more slowly than GDP be-tween 1997 and 2003.
After 2004, individual income tax receipts shouldbegin a slow, steady climb as a share of GDP, despitea decline in taxable personal income as a share ofGDP. Even when tax law is unchanged, individualreceipts tend to rise over time as a share of taxablepersonal income because income growth above therate of inflation causes more income to be taxed athigher rates.
Corporate Income Taxes
CBO projects that corporate income tax receipts willdecline as a share of GDP over the next five years,dropping from 2.3 percent in 1998 to 2.0 percent in2003. Receipts as a share of GDP will fall as risinglabor costs depress taxable corporate profits’ share ofGDP (see Table 3-5). That share is projected to fallfrom 6.8 percent of GDP, which is unusually high, to6.0 percent in 2003.
The average effective corporate tax rate is pro-jected to rise slightly in the next few years. The recentexpiration of the tax credit for research and experi-mentation and the expiration of several other credits inthe next few years will lead to a higher effective rate.In addition, total corporate profits are forecast to growrelatively slowly, with the result that more companiescan be expected to generate losses. In general, firmscannot use all of those losses to reduce tax liabilities,because the corporate income tax does not treat gainsand losses symmetrically. To the extent that such
Table 3-4.Average A nnual Growth Rates of Income and Revenues for 1959-1997 and Projected Thr ough 2008(By fiscal year, in percent)
Historical Projected1959-1969 1969-1979 1979-1989 1989-1997 1959-1997 1997-2008
Income
Nominal GDP 6.8 10.2 7.9 5.1 7.6 4.5
Wages, Salaries, and Corporate Profits 6.9 9.4 7.4 5.7 7.4 4.3
Revenue
Federal Revenues 9.0 9.5 7.9 6.0 8.2 4.5
Social Insurance 12.8 13.5 10.0 5.2 10.6 4.5
Other Taxes 8.2 8.2 6.9 6.4 7.5 4.5Income taxes 8.7 8.6 6.8 6.7 7.7 4.5Excise and other 5.9 5.5 7.3 4.8 5.9 4.4
SOURCE: Congressional Budget Office.
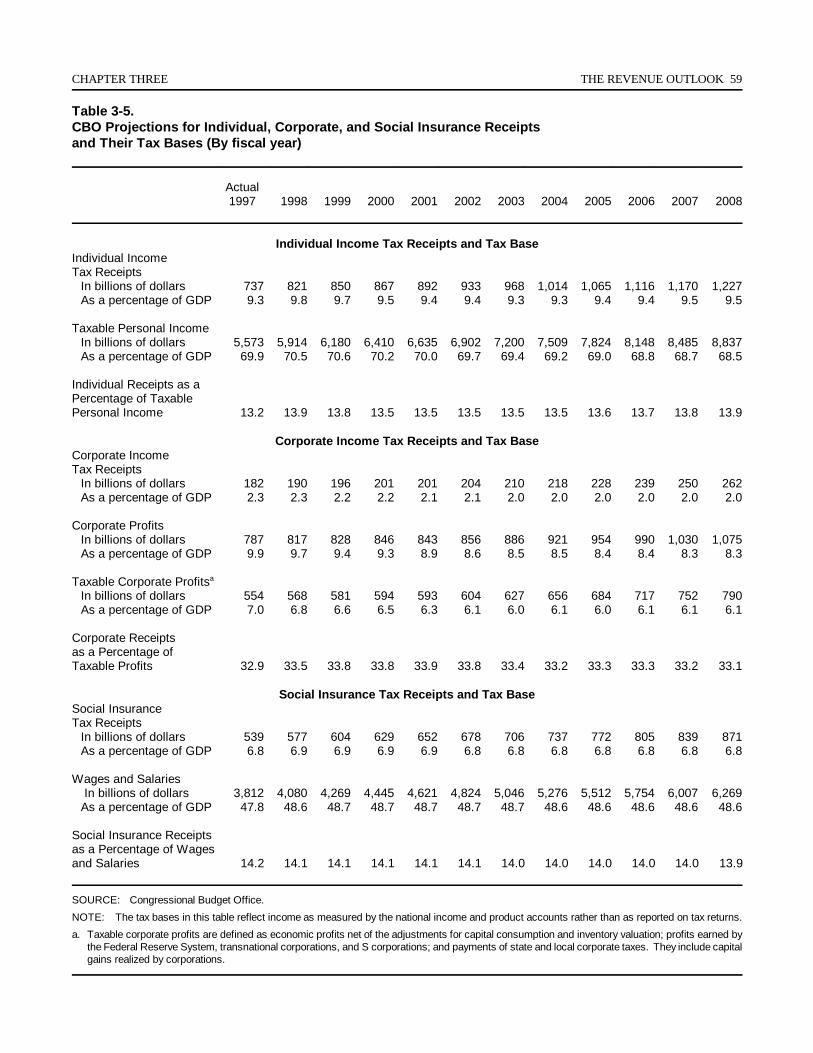
CHAPTER THREE THE REVENUE OUTLOOK 59
Table 3-5.CBO Projections for Individual, Corporate, and Social Insurance Receipts and Their Tax Bases (By fiscal year)
Actual1997 1998 1999 2000 2001 2002 2003 2004 2005 2006 2007 2008
Individual Income Tax Receipts and Tax BaseIndividual Income Tax Receipts
In billions of dollars 737 821 850 867 892 933 968 1,014 1,065 1,116 1,170 1,227As a percentage of GDP 9.3 9.8 9.7 9.5 9.4 9.4 9.3 9.3 9.4 9.4 9.5 9.5
Taxable Personal IncomeIn billions of dollars 5,573 5,914 6,180 6,410 6,635 6,902 7,200 7,509 7,824 8,148 8,485 8,837As a percentage of GDP 69.9 70.5 70.6 70.2 70.0 69.7 69.4 69.2 69.0 68.8 68.7 68.5
Individual Receipts as a Percentage of Taxable Personal Income 13.2 13.9 13.8 13.5 13.5 13.5 13.5 13.5 13.6 13.7 13.8 13.9
Corporate Income Tax Receipts and Tax BaseCorporate Income Tax Receipts
In billions of dollars 182 190 196 201 201 204 210 218 228 239 250 262As a percentage of GDP 2.3 2.3 2.2 2.2 2.1 2.1 2.0 2.0 2.0 2.0 2.0 2.0
Corporate ProfitsIn billions of dollars 787 817 828 846 843 856 886 921 954 990 1,030 1,075As a percentage of GDP 9.9 9.7 9.4 9.3 8.9 8.6 8.5 8.5 8.4 8.4 8.3 8.3
Taxable Corporate Profitsa
In billions of dollars 554 568 581 594 593 604 627 656 684 717 752 790As a percentage of GDP 7.0 6.8 6.6 6.5 6.3 6.1 6.0 6.1 6.0 6.1 6.1 6.1
Corporate Receiptsas a Percentage ofTaxable Profits 32.9 33.5 33.8 33.8 33.9 33.8 33.4 33.2 33.3 33.3 33.2 33.1
Social Insurance Tax Receipts and Tax BaseSocial Insurance Tax Receipts
In billions of dollars 539 577 604 629 652 678 706 737 772 805 839 871As a percentage of GDP 6.8 6.9 6.9 6.9 6.9 6.8 6.8 6.8 6.8 6.8 6.8 6.8
Wages and Salaries In billions of dollars 3,812 4,080 4,269 4,445 4,621 4,824 5,046 5,276 5,512 5,754 6,007 6,269As a percentage of GDP 47.8 48.6 48.7 48.7 48.7 48.7 48.7 48.6 48.6 48.6 48.6 48.6
Social Insurance Receiptsas a Percentage of Wages and Salaries 14.2 14.1 14.1 14.1 14.1 14.1 14.0 14.0 14.0 14.0 14.0 13.9
SOURCE: Congressional Budget Office.
NOTE: The tax bases in this table reflect income as measured by the national income and product accounts rather than as reported on tax returns.
a. Taxable corporate profits are defined as economic profits net of the adjustments for capital consumption and inventory valuation; profits earned bythe Federal Reserve System, transnational corporations, and S corporations; and payments of state and local corporate taxes. They include capitalgains realized by corporations.

60 THE ECONOMIC AND BUDGET OUTLOOK: AN UPDATE August 1998
losses reduce total profits without a proportionate re-duction in total tax payments, the average tax rate onprofits rises.
Beyond 2003, corporate income tax receipts willmaintain their share of GDP, CBO projects. Neithertaxable profits as a share of GDP nor the average taxrate is expected to change significantly.
Social Insurance Taxes
CBO expects social insurance tax receipts to trackGDP closely over the next decade (see Table 3-5).Wages and salaries are expected to maintain their1998 share of GDP through 2008. Over that period,social insurance receipts will decline slightly as a per-centage of wages and salaries and as a percentage ofGDP. The decline is largely attributable to two fac-tors. One is the projected steady erosion of unemploy-ment insurance receipts as states lower unemploymentinsurance tax rates in response to current low claimsand the resulting growth in the trust fund balances.The other factor is a continuation of the slight down-ward trend in the fraction of wages subject to Social
Security taxes. The scheduled expiration of the 0.2percent surtax in the federal unemployment tax in2008 will cause a slightly larger dip that year.
Excise Taxes
Excise taxes, a smaller source of revenues, are ex-pected to continue their long-term decline as a share ofGDP, falling to just over 0.6 percent by 2008 fromtheir 1997 level of 0.7 percent. Most excise taxes—those representing about 80 percent of total exciserevenues—are levied per unit of good or per transac-tion rather than as a percentage of value. Thus, theydo not grow in tandem with nominal incomes.
Excise taxes were increased by tax legislation in1997. The Taxpayer Relief Act restored aviationtaxes (which were about to expire) and raised themslightly. In addition, the Balanced Budget Act of 1997boosted cigarette taxes. Those changes moderate thelong-term decline in excise tax receipts. The baselinefor 2008 includes $21 billion from excise taxes thatare scheduled to expire before then but are assumed tobe extended.

Appendixes


Appendix A
Evaluating CBO’s Recordof Economic Forecasts
Since issuing its first forecast in 1976, the Con-gressional Budget Office has compiled a recordof economic predictions that compares favorably
with the track records of five Administrations and theconsensus forecasts of a sizable sample of private-sec-tor economists. Although the margin is slight, CBO'sforecasts have generally been closer than the Adminis-tration's to the actual values of several economic indi-cators that are important for projecting the budget.Moreover, during the 15 years for which comparisonsare possible, CBO's forecasts have been about as ac-curate as the average of the 50 or so forecasts thatmake up the Blue Chip consensus survey. ComparingCBO's forecasts with that survey suggests that whenCBO's economic predictions missed the mark by amargin wide enough to contribute to sizable misesti-mates of the deficit or surplus, those errors probablyreflected limitations that confronted all forecasters.
Those conclusions echo the findings of previousstudies published by the Congressional Budget Officeand other government and academic reviewers. Theyemerge from an evaluation of the accuracy of short-term forecasts for four economic indicators: growth inreal (inflation-adjusted) output, inflation in the con-sumer price index (CPI), interest rates on three-monthTreasury bills in both nominal and real terms, and in-terest rates on 10-year Treasury notes and Aaa corpo-rate bonds. In carrying out that evaluation, CBOcompiled two-year averages of its forecasts for thefour indicators and compared them with historical val-ues as well as with the corresponding forecasts of the
Administration and the Blue Chip consensus. CBOalso examined a measure of taxable incomes and com-pared it with the Administration’s forecasts.
Overall, the average errors in the Administra-tion's two-year forecasts were slightly greater than inCBO's. Both CBO and the Administration havetended to err on the side of optimism in their outputforecasts for the 1976-1997 period. The average fore-cast error for real growth was an overestimate, but themore recent forecasts have turned out to be pessimis-tic. On average, CBO has tended to neither overesti-mate nor underestimate inflation, whereas the Adminis-tration’s average error for inflation has been a slightunderestimate. The Administration has been moreoptimistic than CBO in forecasting nominal interestrates. Finally, CBO's forecasts appear to be about asaccurate as those of the Blue Chip consensus over theperiod for which comparable Blue Chip forecasts areavailable (1982-1996).
CBO's and the Administration's longer-term(five-year) projections of average growth in real out-put were generally optimistic. CBO's errors were usu-ally much smaller than the Administration's, however,no larger on average than those in its two-year fore-casts of real output. Again, CBO's projections wereabout as accurate as those of the Blue Chip consensusover the comparable period (1979-1993).
The differences among the three forecasts, how-ever, are not large enough to be statistically signifi-

64 THE ECONOMIC AND BUDGET OUTLOOK: AN UPDATE August 1998
cant. The small number of forecasts available foranalysis makes it difficult to distinguish meaningfuldifferences in their performance from those that mightarise randomly. The statistics presented here shouldnot be construed as reliable indicators of the futureperformance of any of the forecasters.
Sources of Data for the Evaluation
Evaluating CBO's forecasting record requires compil-ing the basic historical and forecast data for growth inreal output, CPI inflation, interest rates, and taxableincomes. Although each of those series has an impor-tant influence on budget projections, an accurate fore-cast of the two-year average growth in real output isthe most critical economic factor in accurately esti-mating the deficit or surplus for the upcoming budgetyear. Two-year average forecasts published in early1997 and 1998 could not be included in this evaluationbecause historical values for 1998 and 1999 are, ofcourse, not yet available. The data were thereforecompiled using forecasts published early in the years1976 through 1996.
Selection of Historical Data
Which historical data to use for the evaluation wasdictated by the availability of actual data and the na-ture of the individual forecasts examined. AlthoughCBO, the Administration, and Blue Chip all publishedthe same measure for real output growth, selecting ahistorical series was difficult because of periodicbenchmark revisions in the actual data.1 By compari-son, not all of the forecasters published the same mea-sures for CPI inflation and interest rates, but the selec-tion of historical data for those series was clear-cut.
Growth in Real Output. Historical two-year aver-ages of growth in real output were developed from
calendar year averages of the quarterly chain-typeannual-weighted indexes of real gross national product(GNP) and real gross domestic product (GDP) pub-lished by the Bureau of Economic Analysis (BEA).The fact that several real GNP and GDP series werediscontinued because of periodic benchmark revisionsmeant that they were unsuitable historical series. Forexample, during the 1976-1985 period, the three fore-casters published estimates for a measure of growth inreal GNP that was based on 1972 prices, which wasthe measure published by BEA at the time. In late1985, however, BEA discontinued the 1972-dollarseries and began to publish GNP on a 1982-dollar ba-sis. As a result, an official series of values for GNPgrowth in 1972 dollars is not available for the yearsafter 1984; thus, actual two-year average growth ratesare not available to compare with the forecasts madein early 1984 and 1985.
From 1986 to 1991, forecasters published esti-mates of growth in real GNP based on 1982 prices.BEA revised the benchmark again in the second halfof 1991; it discontinued the 1982-dollar GNP and be-gan to publish GNP on a 1987-dollar basis.2 Conse-quently, the historical annual series for 1982-dollarGNP is available only through 1990, and actual two-year average growth rates are not available for theforecasts made in early 1990 and 1991. The forecast-ers then published estimates of growth in real GDP ona 1987-dollar basis until 1995, when BEA made an-other switch, late in the year, to a chain-weighted mea-sure of GDP. Therefore, the historical annual seriesfor 1987-dollar GDP ends with the 1994 annual value,and actual two-year average growth rates are notavailable for the forecasts made in early 1994 and1995.
By periodically updating the series to reflectmore recent prices, BEA's benchmark revisions yield ameasure of real output that is more relevant for ana-lyzing contemporary movements in real growth. Butthe process makes it difficult to evaluate forecasts ofreal growth produced over a period of years for seriesthat are subsequently discontinued. The difficultiespresented by periodic revisions of the data are avoidedhere by using one of BEA's alternative measures of
1. Before 1992, CBO, the Office of Management and Budget, and BlueChip used gross national product to measure output. Beginning in early1992, however, all three forecasters began to publish forecasts andprojections of gross domestic product instead. 2. As of the 1992 benchmark revision, GDP replaced GNP as the central
measure of national output.

APPENDIX A EVALUATING CBO’S RECORD OF ECONOMIC FORECASTS 65
real GNP and GDP, the chain-type annual-weightedindex.3
CPI Inflation . Two-year averages of inflation in theconsumer price index were calculated from calendaryear averages of monthly data published by the Bu-reau of Labor Statistics. Before 1978, the bureaupublished only one consumer price index series, nowknown as the CPI-W (the price index for urban wageearners and clerical workers). In January 1978, how-ever, it began to publish a second, broader consumerprice index series, the CPI-U (the price index for allurban consumers). CBO's comparison of forecastsused both series.
Until 1992, the Administration published its fore-casts for the CPI-W, the measure used to index mostof the federal government's expenditures for entitle-ment programs. By contrast, for all but four of itsforecasts since 1979 (1986 through 1989), CBO basedits inflation forecast on the CPI-U, a more widely citedmeasure of inflation and the one now used to indexfederal income tax brackets. The Blue Chip consen-sus has always published its forecast of the CPI-U.Although both the CPI-U and CPI-W may be forecastwith the same relative ease, and annual fluctuations inthe two series are virtually indistinguishable, they dif-fer in some years. For that reason, CBO used histori-cal data for both series to evaluate the alternative fore-cast records.
Interest Rates. Two-year averages of nominal short-and long-term interest rates were developed from cal-endar year averages of monthly data published by theBoard of Governors of the Federal Reserve System.
The forecasts of short-term interest rates werecompared using historical values for two measures ofthe interest rate on three-month Treasury bills: thenew-issue rate and the secondary-market rate. TheAdministration forecasts the new-issue rate, whichcorresponds to the price of three-month bills auctionedby the Treasury Department—that is, it reflects theinterest actually paid on that debt. CBO forecasts thesecondary-market rate, which corresponds to the priceof the three-month bills traded outside the Treasury
auctions. Because such transactions occur continuallyin markets that involve many more traders than doTreasury auctions, the secondary-market rate providesan updated evaluation of the short-term federal debt bythe wider financial community. Blue Chip has alter-nated between those two rates; it published the new-issue rate from 1982 to 1985, switched to thesecondary-market rate during the 1986-1991 period,and then returned to the new-issue rate in 1992.Clearly, there is no reason to expect the two rates todiffer persistently; indeed, the differences betweentheir calendar year averages are minuscule.
The Congressional Budget Office likewise com-pared the various forecasts of long-term interest ratesusing historical values for two measures of long-termrates: the 10-year Treasury note rate and Moody'sAaa corporate bond rate. A comparison of forecastsis not possible before 1984 because not all of the fore-casters published projections of long-term interestrates before that year. For forecasts made in early1984 and 1985, CBO projected the Aaa corporatebond rate. Beginning with its early 1986 forecast,however, CBO switched to the 10-year Treasury noterate. The Administration has always published itsprojection for the 10-year Treasury note rate, but BlueChip has published the Aaa corporate bond rate.
CBO calculated separate historical values forreal short-term interest rates using the nominal short-term interest rate and inflation rate appropriate foreach forecaster. In each case, the two-year averagenominal interest rate was discounted by the two-yearaverage rate of inflation. The resulting real short-terminterest rates were very similar. Because there is noagreed-upon method for calculating real long-terminterest rates, they were not included in the evaluation.
Taxable Income. Through its influence on the projec-tion for federal revenues, the forecast for taxable in-come plays a critical role in determining the accuracyof the deficit projection. The income measure exam-ined here—wage and salary distributions plus thebook value of corporate profits—combines the twosources of income to which tax receipts are most sen-sitive. Because the effective rates of tax on wages (in-cluding payroll and income taxes) and corporate prof-its are nearly the same and because those tax ratesexceed the rate at which other income sources (such as3. For a discussion of this index, see Congressional Budget Office, The
Economic and Budget Outlook: An Update (August 1995), pp. 71-73.

66 THE ECONOMIC AND BUDGET OUTLOOK: AN UPDATE August 1998
interest income) are taxed, it is appropriate to considerwages and profits together.
Although the level of taxable income is the factorthat most directly affects federal revenues, historicalestimates of the levels of income are subject to sub-stantial statistical revision. As a result, using the lev-els of taxable income would distort the forecast com-parison. Instead, the forecasts are presented here aschanges in taxable income as a share of total income;the historical revisions, carried forward consistently toprojections, should not affect projections of revenues.Moreover, the shares formulation is closer to the con-cept that macroeconomists consider when they con-struct their forecasts.
Sources of Forecast Data
With the exception of the measures of taxable income,the evaluation used calendar year forecasts and pro-jections—which CBO has published early each yearsince 1976—timed to coincide with the publication ofthe Administration's budget proposals. The Adminis-tration's forecasts were taken from its budget in all butone case; the forecast made in early 1981 came fromthe Reagan Administration's revisions of PresidentCarter's last budget. The corresponding CBO forecastwas taken from CBO’s published analysis of PresidentReagan's budget proposals. That forecast did not in-clude the economic effects of the new Administration'sfiscal policy proposals.4
The average two-year forecasts of the Blue Chipconsensus survey, which are published monthly, weretaken from those published in the same month asCBO's forecasts. Because the Blue Chip consensusdid not begin publishing its two-year forecasts untilthe middle of 1981, the first consensus forecast avail-able for this comparison was published in early 1982.Average five-year projections, however, are publishedby Blue Chip only two or three times a year. All butone of its five-year projections used in this evaluationwere published in March; the 1980-1984 projectionwas published in May.
Since 1985, the Congressional Budget Office hasregularly included projections of economic profits andwage and salary disbursements in The Economic andBudget Outlook. Because book profits more closelyreflect the corporate profits tax base than do economicprofits, forecasts of book profits were extracted fromCBO's unpublished forecast files. Unpublished CBOforecasts are used for both profits and wages for the1980-1984 period.
Measuring Forecast Performance
Following earlier studies of economic forecasts, theevaluation of CBO's forecasts focused on two aspectsof their performance: statistical bias and accuracy.
Bias
The statistical bias of a forecast is the extent to whichthe forecast can be expected to differ from what actu-ally occurs. CBO's evaluation uses the mean error tomeasure statistical bias. That statistic—the arithmeticaverage of all the forecast errors—is the simplest andmost widely used measure of forecast bias. Becausethe mean error is a simple average, however, underes-timates and overestimates offset each other in calculat-ing it. As a result, the mean error imperfectly mea-sures the quality of a forecast—a small mean errorwould result if all the errors were small or if all theerrors were large but the overestimates and underesti-mates happened to balance out.
Accuracy
The accuracy of a forecast is the degree to which fore-cast values are narrowly dispersed around actual out-comes. Measures of accuracy more clearly reflect theusual meaning of forecast performance than does themean error. CBO’s evaluation uses two measures ofaccuracy. The mean absolute error—the average ofthe forecast errors without regard to arithmetic sign—indicates the average distance between forecasts andactual values without regard to whether individual
4. Another exceptional case occurred in early 1993, when the ClintonAdministration adopted CBO’s economic assumptions as the basis forits budget. As a result, the errors for the early 1993 forecast arevirtually the same for CBO and the Administration.

APPENDIX A EVALUATING CBO’S RECORD OF ECONOMIC FORECASTS 67
forecasts are overestimates or underestimates. Theroot mean square error—calculated by first squaringall the errors, then taking the square root of the arith-metic average of the squared errors—also shows thesize of the error without regard to sign, but it givesgreater weight to larger errors.
Measurement Issues
In addition to those three statistical indicators, thereare many other measures of forecast performance. Totest for statistical bias in CBO's forecasts, studies byanalysts outside CBO have used measures that areslightly more elaborate than the mean error. Thosestudies have generally concluded, as does this evalua-tion, that CBO's short-term economic forecasts do notcontain a statistically significant bias.5
In addition, a number of methods have been de-veloped to evaluate a forecast's efficiency. Efficiencyindicates the extent to which a particular forecastcould have been improved by using additional infor-mation that was at the forecaster's disposal when theforecast was made.6 The Blue Chip consensus fore-casts represent a wide variety of economic forecastersand thus reflect a broader blend of sources and meth-ods than can be expected from any single forecaster.The use of the Blue Chip predictions in this evaluationcan therefore be interpreted as a proxy for an efficientforecast. The fact that CBO's forecasts are about as
accurate as Blue Chip's is a rough indication of theirefficiency.
Such elaborate measures and methods, however,are not necessarily reliable indicators when the sampleof observations is small, such as the 21 observationsthat make up the sample of CBO's two-year forecasts.Small samples present three main types of problemsfor evaluating forecasts, including forecasts based onthe simple measures presented here. First, small sam-ples reduce the reliability of statistical tests that arebased on the assumption that the underlying popula-tion of forecast errors follows a normal distribution.The more elaborate tests of forecast performance allmake such an assumption about the hypothetical idealforecast with which the actual forecasts are compared.Second, in small samples, individual forecast errorshave a relatively large weight in the calculation ofsummary measures. The mean error, for example, canfluctuate in arithmetic sign when a single observationis added to a small sample. Third, the small samplemeans that CBO's track record cannot be used in astatistically reliable way to indicate either the directionor the size of future forecasting errors.
Apart from the general caution that should attendstatistical conclusions based on small samples, thereare several other reasons to view this evaluation ofCBO's forecasts with particular caution. First, theprocedures and purposes of CBO's and the Adminis-tration's forecasts have changed over the past 20 yearsand may change again in the future. For example, inthe late 1970s, CBO characterized its long-term pro-jections as a goal for the economy, whereas it nowconsiders its projections to be what will prevail on av-erage if the economy continues to reflect historicaltrends. Second, an institution's forecasting trackrecord may not foretell its future abilities because ofchanges in personnel or methods. Finally, forecasterrors increase when the economy is more volatile. Allthree forecasters made exceptionally large errors whenforecasting for periods that included turning points inthe business cycle.
CBO's Forecasting Record
This analysis evaluated the Congressional Budget Of-fice's forecasts over two-year and five-year periods.
5. Another approach to testing a forecast for bias is based on linearregression analysis of actual and forecast values. For details of thatmethod, see J. Mincer and V. Zarnowitz, "The Evaluation of EconomicForecasts," in J. Mincer, ed., Economic Forecasts and Expectations(New York: National Bureau of Economic Research, 1969). Thatapproach is not used here because of the small sample size. However,previous studies that have used it to evaluate the short-term forecasts ofCBO and the Administration have not been able to reject the hypothesisthat those forecasts are unbiased. See, for example, M.T. Belongia,"Are Economic Forecasts by Government Agencies Biased? Accurate?"Review, Federal Reserve Bank of St. Louis, vol. 70, no. 6 (November/December 1988), pp. 15-23.
6. For studies that have examined the relative efficiency of CBO'sforecasts, see Belongia, "Are Economic Forecasts by GovernmentAgencies Biased?"; and S.M. Miller, "Forecasting Federal BudgetDeficits: How Reliable Are U.S. Congressional Budget OfficeProjections?" Applied Economics, vol. 23 (December 1991), pp. 1789-1799. Although both of the studies identify series that might have beenused to make CBO's forecasts more accurate, they rely on statistics thatassume a larger sample than is available. Moreover, although statisticaltests can identify sources of inefficiency in a forecast after the fact, theygenerally do not indicate how such information can be used to improveforecasts when they are made.

68 THE ECONOMIC AND BUDGET OUTLOOK: AN UPDATE August 1998
The period of most interest for forecasters of the bud-get is two years. Because the Administration's andCBO's winter budget publications focus on the budgetprojection for the fiscal year beginning in the follow-ing October, an economic forecast that is accurate notonly for the months leading up to the budget year butalso for the budget year itself will provide the basis fora more accurate forecast of the budget balance. Afive-year period is used to examine the accuracy oflonger-term projections of growth in real output.
Short-Term Forecasts
Historically, the Congressional Budget Office's two-year forecasts are slightly more accurate than the Ad-ministration's and suffer from slightly less statisticalbias. In most cases, however, the differences aresmall. Furthermore, CBO's forecasts are about asaccurate as Blue Chip's average forecasts.
An accurate prediction of two-year growth inreal output is the most important factor in minimizingerrors when forecasting the deficit for the budget year.Accurate predictions of nominal output, inflation, andnominal interest rates are less important for such fore-casts now than they were in the late 1970s and early1980s. The reason is that given current law and thelevel of the national debt, inflation increases both reve-nues and outlays by similar amounts. Revenues in-crease with inflation because taxes are levied on nomi-nal incomes. Outlays increase because various entitle-ment programs are indexed to inflation and becausenominal interest rates tend to increase with inflation,which in turn raises the cost of servicing the federaldebt.7
Growth in Real Output. For the two-year forecastsmade between 1976 and 1996, CBO had a slightlybetter record than the Administration in predictinggrowth in real output (see Table A-1). On average,both CBO's and the Administration's forecasts tendedto be overestimates. CBO was closer to the actualvalue in 10 of the 21 forecasts made between 1976and 1996, the Administration was closer in seven peri-
ods, and both had identical errors in four periods.CBO's predictions of real growth made between 1982and 1996 were, on average, as accurate as those of theBlue Chip consensus.
Forecast errors tend to be larger when the econ-omy is more unstable. That tendency can be clearlyseen in the forecasts of real GNP growth by compar-ing the large errors for 1979 through 1983—when theeconomy went through its most turbulent recessionaryperiod of the postwar era—with the smaller errors re-corded for later years. Similarly, the recent businesscycle accounts for the large errors in the predictionsmade in the 1989-1991 period; during that time, theCongressional Budget Office's errors were onlyslightly larger than those of the Blue Chip consensus.
All three forecasters—CBO, the Administration,and Blue Chip—predicted two-year real GDP growthwith striking accuracy in their early 1992, 1993, and1994 forecasts. However, all three substantially un-derpredicted growth over the 1996-1997 period.
CPI Inflation . The records for forecasting the aver-age annual growth in the consumer price index over atwo-year period were very similar (see Table A-2).Both CBO and the Administration underestimated fu-ture inflation in their forecasts for 1977 through 1980,and both tended to overestimate it in their forecasts for1981 through 1986. The average measures of biasand accuracy were virtually the same for both. CBOwas closer to the actual value in seven of the 21 peri-ods, the Administration was closer in nine periods, andthe two forecasts had identical errors in five periods.For the 1982-1996 period, CBO's forecasts of infla-tion were as accurate as those of both the Administra-tion and Blue Chip. Moreover, the track records ofboth CBO and the Administration in predicting infla-tion seem to have improved in the 1990s.
Nominal Interest Rates. For the 1976-1996 fore-casts, CBO's record was about as accurate as the Ad-ministration's for nominal short-term interest ratesover a two-year period (see Table A-3). On average,the Administration tended to underestimate nominalshort-term interest rates; CBO's mean error was zeroover that period. CBO was closer to the true value in10 of the 21 periods, the Administration was closer in10 periods, and the two forecasters had identical errors
7. Rules of thumb for estimating the effect on the budget balance ofchanges in various macroeconomic variables are given in CongressionalBudget Office, The Economic and Budget Outlook: Fiscal Years1999-2008 (January 1998), pp. 97-100.

APPENDIX A EVALUATING CBO’S RECORD OF ECONOMIC FORECASTS 69
in one period. For the 1982-1996 period, however, theroot mean square error of CBO's forecasts wasslightly above those of the Administration and BlueChip, which means that CBO made a few relativelylarge errors (such as those in 1982 and 1983).
For the 1984-1996 forecasts of long-term interestrates, CBO did somewhat better than the Administra-tion (see Table A-4). The Administration tended tounderestimate rates, and its mean error was larger thanCBO's. In addition, the Administration's forecasts hada larger mean absolute error and root mean squareerror. CBO was closer to the true value in nine of the13 periods, the Administration was closer in three pe-riods, and the two forecasters had identical errors inone period.
The Congressional Budget Office's forecasts oflong-term interest rates were about as accurate asthose of the Blue Chip consensus. Both CBO andBlue Chip tended to overestimate long-term rates.CBO had a mean error of 0.2 percentage points com-pared with 0.3 percentage points for Blue Chip.
Real Short-Term Interest Rates. For the forecastsmade in 1976 through 1996, CBO had a slight edgeover the Administration in estimating real short-terminterest rates (see Table A-5). Again, the Administra-tion was more likely than CBO to underestimate inter-est rates, and its mean error was greater. CBO andthe Administration recorded similar mean absolute androot mean square errors. CBO's forecasts were closerto the actual value in 12 of the 21 periods, the Admin-istration's were closer in eight, and the two registeredidentical errors in one period. For forecasts made be-tween 1982 and 1996, CBO's errors were generallysimilar in both direction and magnitude to those of theBlue Chip consensus.
Taxable Income. One of the greatest sources of errorin forecasts of the deficit derives from projections oftaxable income. On average, both CBO and the Ad-ministration have been too optimistic in their projec-tions of the major components of taxable income (seeTable A-6).
In general, the most significant overstatement oftaxable income as a share of output took place in theearly 1980s, when both agencies substantially overes-
timated wages and profits. In part, that overstatementstems from legislation (the Accelerated Cost RecoverySystem of the Economic Recovery Tax Act of 1981)that allowed corporations to shunt income away fromtaxable categories (book profits) to nontaxable or tax-favored categories (capital consumption). As a resultof that legislation, which could not have been pre-dicted when the early forecasts were made, the shareof profits—and, hence, taxable income—was well be-low what it would have been in the absence of legisla-tion.
In recent years, however, both CBO and the Ad-ministration have significantly underestimated thechange in the wage and profit share. The rapid growthin corporate profits and dividends in both 1995 and1996 reported in the July 1997 revisions of the na-tional income and product accounts surprised mostanalysts.
Longer-Term Projections
In projecting real GNP growth for the more distantfuture, measured here as five years ahead, the Admin-istration's errors were larger than CBO's (see TableA-7). Although that comparative advantage for CBOdoes not directly affect the estimates of the deficit forthe budget year, accuracy in the longer term is obvi-ously important for budgetary planning over severalyears. Neither the Administration nor CBO, however,considers its projections to be its best guess about theyear-to-year course of the economy. The Administra-tion's projections each year are based on the adoptionof the President's budget as submitted, and for mostyears CBO has considered its projections an indicationof the average future performance of the economy ifmajor historical trends continue. Neither institutionattempts to anticipate cyclical fluctuations in the pro-jection period.
CBO's projections of longer-term growth in realoutput were closer to the actual value than the Admin-istration's in 13 of the 18 forecasts. The Administra-tion's projections showed an upward bias of 1.1 per-centage points compared with an upward bias of 0.7percentage points for CBO. Those biases occurredlargely because the projections made in early 1976through 1979, which CBO and the Administration pre-

70 THE ECONOMIC AND BUDGET OUTLOOK: AN UPDATE August 1998
sented as target rates of growth, did not incorporatethe recessions of 1980 and 1982. Through the subse-quent years of expansion until the most recent reces-sion, the upward bias was much smaller for the Ad-ministration's projections and even smaller for CBO's.Both CBO and the Administration have underpre-dicted long-term growth based on projections made inearly 1992 and early 1993. The only previous in-stance of underprediction in the long-term outlook oc-curred in the projections made in early 1983, when theeconomy was at a stage of the business cycle similarto that of the 1992 and 1993 projections.
The size of the root mean square errors for theentire period for CBO and, to a lesser extent, for theAdministration also resulted largely from errors inprojections made during the first four years. CBOwas more accurate in its winter projections made inthe 1980-1982 period but had a lesser edge in lateryears. Again, CBO's projections were about as accu-rate as those of the Blue Chip consensus over the com-parable period.

APPENDIX A EVALUATING CBO’S RECORD OF ECONOMIC FORECASTS 71
Table A-1.Comparison of CBO, Administration, and Blue Chip Forecasts of Two-Year AverageGrowth Rates for Real Output (By calendar year, in percent)
ActualChain-Type
Annual-1972 1982 1987 Weighted CBO Administration Blue Chip
Dollars Dollars Dollars Index Forecast Error Forecast Error Forecast Error
GNP1976-1977 6.7 4.8 4.8 5.1 6.2 1.1 5.9 0.8 a a1977-1978 5.2 5.0 4.7 5.0 5.5 0.5 5.1 0.1 a a1978-1979 3.9 3.9 3.8 4.2 4.7 0.5 4.7 0.5 a a1979-1980 1.3 1.1 1.1 1.4 2.7 1.4 2.9 1.5 a a1980-1981 1.1 0.9 0.5 0.9 0.5 -0.3 0.5 -0.3 a a1981-1982 0.2 -0.3 -0.4 -0.1 2.1 2.2 2.6 2.7 a a1982-1983 0.7 0.5 0.7 0.8 2.1 1.3 2.7 1.9 2.0 1.21983-1984 5.2 5.2 4.9 5.4 3.4 -2.0 2.6 -2.7 3.5 -1.91984-1985 b 5.1 4.4 5.1 4.7 -0.3 4.7 -0.4 4.3 -0.81985-1986 b 3.0 2.8 3.1 3.3 0.3 3.9 0.9 3.2 0.11986-1987 b 3.1 2.9 2.9 3.1 0.3 3.7 0.8 3.0 0.11987-1988 b 3.9 3.5 3.4 2.9 -0.5 3.3 -0.1 2.8 -0.51988-1989 b 3.5 3.3 3.6 2.4 -1.2 3.0 -0.6 2.1 -1.51989-1990 b 1.7 2.0 2.3 2.5 0.2 3.2 0.9 2.2 -0.11990-1991 b c 0.3 0.2 2.0 1.9 2.8 2.6 1.9 1.81991-1992 b c 0.7 0.8 1.6 0.8 1.4 0.6 1.2 0.4
GDPd
1992-1993 b c 2.7 2.5 2.6 0.1 2.2 -0.3 2.3 -0.21993-1994 b c 3.6 2.9 2.9 0 2.9 0 3.0 0.21994-1995 b c e 2.9 2.8 -0.1 2.9 0.1 2.8 01995-1996 b c e 2.9 2.4 -0.4 2.6 -0.2 2.6 -0.21996-1997 b c e 3.7 1.9 -1.7 2.2 -1.4 2.1 -1.6
Statistics for1976-1996
Mean error * * * * * 0.2 * 0.4 * *Mean absolute error * * * * * 0.8 * 0.9 * *Root mean square error * * * * * 1.1 * 1.3 * *
Statistics for1982-1996
Mean error * * * * * -0.1 * 0.1 * -0.2Mean absolute error * * * * * 0.7 * 0.9 * 0.7Root mean square error * * * * * 1.0 * 1.2 * 1.0
SOURCES: Congressional Budget Office; Office of Management and Budget; Capitol Publications, Inc., Blue Chip Economic Indicators; Depart-ment of Commerce, Bureau of Economic Analysis.
NOTES: Actual values are the two-year growth rates for real gross national product (GNP) and gross domestic product (GDP) last reported by theBureau of Economic Analysis, not the first reported values. Forecast values are for the average annual growth of real GNP or GDP over thetwo-year period. The forecasts were issued in the first half of the initial year of the period or in December of the preceding year. Errors(which are in percentage points) are forecast values minus actual values; thus, a positive error is an overestimate. The chain-type annual-weighted index of actual GNP or GDP was used in calculating the errors.
* = not applicable.
a. Two-year forecasts for the Blue Chip consensus were not available until 1982.
b. Data for 1972-dollar GNP and GDP are available only through the third quarter of 1985.
c. Data for 1982-dollar GNP and GDP are available only through the third quarter of 1991.
d. With the 1992 benchmark revision, GDP replaced GNP as the central measure of national output.
e. Data for 1987-dollar GNP and GDP are available only through the second and third quarters, respectively, of 1995.

72 THE ECONOMIC AND BUDGET OUTLOOK: AN UPDATE August 1998
Table A-2.Comparison of CBO, Administration, and Blue Chip Forecasts of Two-Year AverageInflation Rates in the Consu mer Price Index (By calendar year, in percent)
Actual CBO Administration Blue ChipCPI-U CPI-W Forecast Error Forecast Error Forecast Error
1976-1977 6.1 6.1 7.1 1.0 6.1 0 a a1977-1978 7.0 7.0 4.9 -2.1 5.2 -1.8 a a1978-1979 9.4 9.5 5.8 -3.7 6.0 -3.5 a a1979-1980 12.4 12.5 8.1 -4.3 7.4 -5.0 a a1980-1981 11.9 11.9 10.1 -1.8 10.5 -1.4 a a1981-1982 8.2 8.1 10.4 2.1 9.7 1.6 a a1982-1983 4.6 4.5 7.2 2.6 6.6 2.1 7.2 2.61983-1984 3.8 3.3 4.7 1.0 4.7 1.5 4.9 1.11984-1985 3.9 3.5 4.9 1.0 4.5 1.0 5.2 1.31985-1986 2.7 2.5 4.1 1.4 4.2 1.7 4.3 1.61986-1987 2.8 2.6 3.8 1.2 3.8 1.2 3.8 1.01987-1988 3.9 3.8 3.9 0.1 3.3 -0.5 3.6 -0.21988-1989 4.4 4.4 4.7 0.3 4.2 -0.2 4.3 -0.11989-1990 5.1 5.0 4.9 -0.1 3.7 -1.3 4.7 -0.41990-1991 4.8 4.6 4.1 -0.7 3.9 -0.7 4.1 -0.71991-1992 3.6 3.5 4.2 0.6 4.6 1.1 4.4 0.81992-1993 3.0 2.9 3.4 0.4 3.1 0.1 3.5 0.51993-1994 2.8 2.7 2.8 0.1 2.8 0.1 3.3 0.61994-1995 2.7 2.7 2.8 0.2 3.0 0.3 3.0 0.41995-1996 2.9 2.9 3.2 0.4 3.1 0.3 3.4 0.61996-1997 2.6 2.6 2.9 0.3 2.9 0.3 2.8 0.2
Statistics for1976-1996
Mean error * * * 0 * -0.1 * *Mean absolute error * * * 1.2 * 1.2 * *Root mean square error * * * 1.7 * 1.7 * *
Statistics for1982-1996
Mean error * * * 0.6 * 0.5 * 0.6Mean absolute error * * * 0.7 * 0.8 * 0.8Root mean square error * * * 0.9 * 1.0 * 1.0
SOURCES: Congressional Budget Office; Office of Management and Budget; Capitol Publications, Inc., Blue Chip Economic Indicators; Departmentof Labor, Bureau of Labor Statistics.
NOTES: Values are for the average annual growth of the consumer price index (CPI) over the two-year period. Before 1978, the Bureau of LaborStatistics published only one consumer price index series, now known as the CPI-W (the price index for urban wage earners and clericalworkers). In January 1978, however, the bureau began to publish a second, broader consumer price index series, the CPI-U (the priceindex for all urban consumers). For most years since 1979, CBO forecast the CPI-U; from 1986 through 1989, however, CBO forecast theCPI-W. The Administration forecast the CPI-W until 1992, when it switched to the CPI-U. Blue Chip forecast the CPI-U for the entireperiod. The forecasts were issued in the first half of the initial year of the period or in December of the preceding year. Errors (which are inpercentage points) are forecast values minus actual values; thus, a positive error is an overestimate.
* = not applicable.
a. Two-year forecasts for the Blue Chip consensus were not available until 1982.

APPENDIX A EVALUATING CBO’S RECORD OF ECONOMIC FORECASTS 73
Table A-3.Comparison of CBO, Administration, and Blue Chip Forecasts of Two-Year AverageInterest Rates on Three-Month Treasury B ills (By calendar year, in percent)
ActualNewIssue
SecondaryMarket
CBO Administration Blue ChipForecast Error Forecast Error Forecast Error
1976-1977 5.1 5.1 6.2 1.1 5.5 0.4 a a1977-1978 6.2 6.2 6.4 0.2 4.4 -1.8 a a1978-1979 8.6 8.6 6.0 -2.6 6.1 -2.5 a a1979-1980 10.8 10.7 8.3 -2.4 8.2 -2.6 a a1980-1981 12.8 12.7 9.5 -3.2 9.7 -3.1 a a1981-1982 12.4 12.3 13.2 0.9 10.0 -2.4 a a1982-1983 9.7 9.6 12.6 3.0 11.1 1.4 11.3 1.61983-1984 9.1 9.1 7.1 -2.0 7.9 -1.1 7.9 -1.21984-1985 8.5 8.5 8.7 0.3 8.1 -0.4 9.1 0.51985-1986 6.7 6.7 8.5 1.8 8.0 1.3 8.5 1.81986-1987 5.9 5.9 6.7 0.9 6.9 1.0 7.1 1.21987-1988 6.2 6.2 5.6 -0.6 5.5 -0.7 5.7 -0.51988-1989 7.4 7.4 6.4 -0.9 5.2 -2.1 6.1 -1.21989-1990 7.8 7.8 7.5 -0.3 5.9 -1.9 7.5 -0.31990-1991 6.5 6.4 7.0 0.6 6.0 -0.4 7.1 0.71991-1992 4.4 4.4 6.8 2.4 6.2 1.8 6.4 2.01992-1993 3.2 3.2 4.7 1.5 4.5 1.3 4.6 1.41993-1994 3.6 3.6 3.4 -0.2 3.4 -0.2 3.8 0.21994-1995 4.9 4.9 3.9 -1.0 3.6 -1.3 3.6 -1.31995-1996 5.3 5.2 5.9 0.7 5.7 0.4 6.1 0.91996-1997 5.0 5.0 4.8 -0.2 4.7 -0.3 5.0 0
Statistics for1976-1996
Mean error * * * 0 * -0.6 * *Mean absolute error * * * 1.3 * 1.4 * *Root mean square error * * * 1.6 * 1.6 * *
Statistics for1982-1996
Mean error * * * 0.4 * -0.1 * 0.4Mean absolute error * * * 1.1 * 1.1 * 1.0Root mean square error * * * 1.4 * 1.2 * 1.2
SOURCES: Congressional Budget Office; Office of Management and Budget; Capitol Publications, Inc., Blue Chip Economic Indicators; FederalReserve Board.
NOTES: Values are for the geometric averages of the three-month Treasury bill rates for the two-year period. The actual values are published by theFederal Reserve Board as the rate on new issues (reported on a bank-discount basis) and the secondary-market rate. CBO forecast thesecondary-market rate; the Administration forecast the new-issue rate. Blue Chip alternated between the two rates, forecasting the new-issue rate from 1982 to 1985, the secondary-market rate from 1986 to 1991, and the new-issue rate again beginning in 1992. The forecastswere issued in the first half of the initial year of the period or in December of the preceding year. Errors (which are in percentage points) areforecast values minus actual values; thus, a positive error is an overestimate.
* = not applicable.
a. Two-year forecasts for the Blue Chip consensus were not available until 1982.

74 THE ECONOMIC AND BUDGET OUTLOOK: AN UPDATE August 1998
Table A-4.Comparison of CBO, Administration, and Blue Chip Forecasts of Two-Year AverageLong-T erm Interest Rates (By calendar year, in percent)
Actual10-Year
NoteCorporateAaa Bond
CBO Administration Blue ChipForecast Error Forecast Error Forecast Error
1984-1985 11.5 12.0 11.9 -0.1 9.7 -1.8 12.2 0.21985-1986 9.1 10.2 11.5 1.3 10.6 1.5 11.8 1.71986-1987 8.0 9.2 8.9 0.9 8.7 0.7 9.9 0.81987-1988 8.6 9.5 7.2 -1.4 6.6 -2.0 8.7 -0.81988-1989 8.7 9.5 9.4 0.7 7.7 -1.0 9.8 0.31989-1990 8.5 9.3 9.1 0.6 7.7 -0.8 9.5 0.31990-1991 8.2 9.0 7.7 -0.5 7.2 -1.0 8.7 -0.31991-1992 7.4 8.5 7.8 0.4 7.3 -0.1 8.7 0.31992-1993 6.4 7.7 7.1 0.7 6.9 0.5 8.4 0.71993-1994 6.5 7.6 6.6 0.2 6.6 0.2 8.2 0.61994-1995 6.8 7.8 5.9 -0.9 5.8 -1.0 7.1 -0.71995-1996 6.5 7.5 7.3 0.8 7.5 1.0 8.6 1.11996-1997 6.4 7.3 6.2 -0.1 5.4 -0.9 6.2 -0.1
Statistics for1984-1996
Mean error * * * 0.2 * -0.4 * 0.3Mean absolute error * * * 0.7 * 1.0 * 0.6Root mean square error * * * 0.8 * 1.1 * 0.7
SOURCES: Congressional Budget Office; Office of Management and Budget; Capitol Publications, Inc., Blue Chip Economic Indicators; FederalReserve Board.
NOTES: Actual values are for the geometric averages of the 10-year Treasury note rates or Moody's corporate Aaa bond rates for the two-year periodas reported by the Federal Reserve Board. CBO forecast the 10-year Treasury note rate in all years except 1984 and 1985. The Adminis-tration forecast the 10-year note rate, but Blue Chip forecast the corporate Aaa bond rate. Data are only available beginning in 1984 becausenot all of the forecasters published long-term rate projections before then. The forecasts were issued in the first half of the initial year of theperiod or in December of the preceding year. Errors (which are in percentage points) are forecast values minus actual values; thus, apositive error is an overestimate.
* = not applicable.

APPENDIX A EVALUATING CBO’S RECORD OF ECONOMIC FORECASTS 75
Table A-5.Comparison of CBO, Administration, and Blue Chip Forecasts of Two-Year AverageReal Interest Rates on Three-Month Treasury B ills (By calendar year, in percent)
ActualNew SecondaryIssue Market CBO Administration Blue Chip
CPI-U CPI-W CPI-U CPI-W Forecast Error Forecast Error Forecast Error
1976-1977 -0.9 -0.9 -0.9 -0.9 -0.8 0.1 -0.6 0.3 a a1977-1978 -0.8 -0.7 -0.8 -0.7 1.5 2.2 -0.8 -0.1 a a1978-1979 -0.7 -0.8 -0.7 -0.8 0.2 1.0 0.1 0.9 a a1979-1980 -1.4 -1.5 -1.4 -1.5 0.2 1.7 0.7 2.2 a a1980-1981 0.8 0.9 0.7 0.8 -0.5 -1.2 -0.7 -1.6 a a1981-1982 3.8 4.0 3.7 3.9 2.6 -1.2 0.3 -3.7 a a1982-1983 4.8 4.9 4.7 4.9 5.0 0.3 4.2 -0.8 3.8 -1.01983-1984 5.1 5.7 5.1 5.6 2.2 -2.9 3.1 -2.6 2.9 -2.31984-1985 4.4 4.9 4.4 4.8 3.6 -0.8 3.4 -1.4 3.6 -0.81985-1986 3.9 4.1 3.9 4.1 4.2 0.3 3.6 -0.4 4.0 0.11986-1987 3.0 3.2 3.0 3.2 2.8 -0.4 3.0 -0.3 3.2 0.21987-1988 2.3 2.4 2.3 2.3 1.7 -0.6 2.1 -0.2 2.0 -0.31988-1989 2.8 2.9 2.8 2.9 1.7 -1.2 1.0 -1.9 1.8 -1.11989-1990 2.6 2.6 2.6 2.6 2.5 -0.2 2.1 -0.6 2.7 0.21990-1991 1.6 1.7 1.5 1.7 2.8 1.2 2.0 0.3 2.9 1.31991-1992 0.8 0.9 0.7 0.9 2.5 1.8 1.5 0.6 1.9 1.21992-1993 0.2 0.4 0.2 0.3 1.3 1.0 1.3 1.1 1.1 0.81993-1994 0.8 0.9 0.8 0.9 0.5 -0.3 0.6 -0.3 0.5 -0.41994-1995 2.1 2.2 2.1 2.1 1.0 -1.1 0.6 -1.6 0.5 -1.61995-1996 2.3 2.3 2.3 2.3 2.6 0.3 2.5 0.1 2.6 0.31996-1997 2.4 2.4 2.3 2.4 1.8 -0.5 1.7 -0.6 2.1 -0.3
Statistics for1976-1996 Mean error * * * * * 0 * -0.5 * * Mean absolute error * * * * * 1.0 * 1.0 * * Root mean square error * * * * * 1.2 * 1.4 * *
Statistics for1982-1996 Mean error * * * * * -0.2 * -0.6 * -0.2 Mean absolute error * * * * * 0.9 * 0.8 * 0.8 Root mean square error * * * * * 1.1 * 1.1 * 1.0
SOURCES: Congressional Budget Office; Office of Management and Budget; Capitol Publications, Inc., Blue Chip Economic Indicators; Departmentof Labor, Bureau of Labor Statistics; Federal Reserve Board.
NOTES: Values are for the appropriate three-month Treasury bill rate discounted by the respective forecast for inflation as measured by the changein the consumer price index. The forecasts were issued in the first half of the initial year of the period or in December of the preceding year.Errors (which are in percentage points) are forecast values minus actual values; thus, a positive error is an overestimate.
CPI-U = consumer price index for all urban consumers; CPI-W = consumer price index for urban wage earners and clerical workers; * = notapplicable.
a. Two-year forecasts for the Blue Chip consensus were not available until 1982.

76 THE ECONOMIC AND BUDGET OUTLOOK: AN UPDATE August 1998
Table A-6.Comparison of CBO and Administration Projections of the Two-Y ear Change in Wage andSalary Distr ibutions Plus Book Profits as a Sh are of Output (By calendar year, in percent)
CBO AdministrationActual Forecast Error Forecast Error
1980-1981 -3.1 -0.6 2.5 -1.3 1.81981-1982 -3.3 -2.6 0.7 -1.2 2.11982-1983 -1.9 -1.8 0.2 -1.7 0.31983-1984 -0.7 0 0.7 -1.0 -0.31984-1985 -0.5 -0.2 0.3 -0.2 0.41985-1986 -0.6 -0.6 0 -0.8 -0.21986-1987 1.6 1.0 -0.6 0.8 -0.81987-1988 2.7 0.9 -1.8 1.4 -1.31988-1989 -0.6 0.6 1.2 0.4 0.91989-1990 -1.2 0.4 1.6 0.7 1.91990-1991 -0.1 0.7 0.7 1.4 1.51991-1992 0 0.1 0.1 -0.1 01992-1993 0.1 1.0 0.9 1.4 1.31993-1994 0 0.5 0.5 0.5 0.51994-1995 1.7 0.2 -1.5 0.4 -1.31995-1996 1.9 -0.3 -2.2 -0.6 -2.61996-1997 1.1 -0.3 -1.5 0.8 -0.3
Statistics for1980-1996
Mean error * * 0.1 * 0.2Mean absolute error * * 1.0 * 1.0Root mean square error * * 1.2 * 1.3
SOURCES: Congressional Budget Office; Office of Management and Budget; Department of Commerce, Bureau of Economic Analysis.
NOTES: The forecasts were issued in the first half of the initial year of the period or in December of the preceding year. Errors (which are inpercentage points) are forecast values minus actual values; thus, a positive error is an overestimate. For the forecasts made between 1980and 1991, gross national product was used in calculating the shares; for the forecasts made in 1992 and later, gross domestic product wasused.
* = not applicable.

APPENDIX A EVALUATING CBO’S RECORD OF ECONOMIC FORECASTS 77
Table A-7.Comparison of CBO, Administration, and Blue Chip Projections of Five-Y ear AverageGrowth Rates for Real Output (By calendar year, in percent)
ActualChain-Type
Annual-1972 1982 1987 Weighted CBO Administration Blue Chip
Dollars Dollars Dollars Index Projection Error Projection Error Projection Error
GNP1976-1980 4.2 3.4 3.3 3.7 5.7 2.0 6.2 2.5 a a1977-1981 3.1 2.8 2.6 3.0 5.3 2.3 5.1 2.1 a a1978-1982 1.6 1.4 1.2 1.6 4.8 3.2 4.8 3.2 a a1979-1983 1.3 1.0 1.1 1.3 3.8 2.5 3.8 2.5 3.1 1.81980-1984 2.1 1.9 1.7 2.0 2.4 0.4 3.0 1.0 2.5 0.51981-1985 b 2.6 2.4 2.7 2.8 0 3.8 1.1 3.0 0.31982-1986 b 2.7 2.6 2.9 3.0 0.1 3.9 1.0 2.7 -0.11983-1987 b 4.0 3.7 3.9 3.6 -0.3 3.5 -0.5 3.5 -0.51984-1988 b 4.1 3.7 3.9 4.0 0 4.3 0.3 3.5 -0.51985-1989 b 3.3 3.1 3.2 3.4 0.1 4.0 0.7 3.4 0.11986-1990 b 2.8 2.7 2.9 3.3 0.5 3.8 0.9 3.1 0.31987-1991 b c 2.0 2.1 2.9 0.8 3.5 1.4 2.7 0.61988-1992 b c 1.9 2.0 2.6 0.5 3.2 1.2 2.5 0.51989-1993 b c 1.7 1.7 2.3 0.6 3.2 1.5 2.6 0.81990-1994 b c 1.9 1.7 2.3 0.6 3.0 1.2 2.4 0.71991-1995 b c d 1.9 2.3 0.4 2.5 0.6 2.0 0.0
GDPe
1992-1996 b c d 2.8 2.6 -0.2 2.7 -0.2 2.5 -0.41993-1997 b c d 3.1 2.8 -0.3 2.8 -0.3 2.8 -0.3
Statistics for1976-1993
Mean error * * * * * 0.7 * 1.1 * *Mean absolute error * * * * * 0.8 * 1.2 * *Root mean square error * * * * * 1.3 * 1.5 * *
Statistics for1979-1993
Mean error * * * * * 0.4 * 0.8 * 0.3Mean absolute error * * * * * 0.5 * 1.0 * 0.5Root mean square error * * * * * 0.8 * 1.1 * 0.6
SOURCES: Congressional Budget Office; Office of Management and Budget; Capitol Publications, Inc., Blue Chip Economic Indicators; Departmentof Commerce, Bureau of Economic Analysis.
NOTES: Actual values are for the five-year growth rates for real gross national product (GNP) and gross domestic product (GDP) last reported bythe Bureau of Economic Analysis, not the first reported values. Projected values are for the average growth of real GNP or GDP over thefive-year period. The majority of the projections were issued in the first quarter of the initial year of the period or in December of thepreceding year. Errors (which are in percentage points) are projected values minus actual values; thus, a positive error is an overestimate.The chain-type annual-weighted index of actual GNP or GDP was used in calculating the errors.
* = not applicable.
a. Five-year forecasts for the Blue Chip consensus were not available until 1979.
b. Data for 1972-dollar GNP are available only through the third quarter of 1985.
c. Data for 1982-dollar GNP are available only through the third quarter of 1991.
d. Data for 1987-dollar GNP and GDP are available only through the second and third quarters, respectively, of 1995.
e. With the 1992 benchmark revision, GDP replaced GNP as the central measure of national output.


Appendix B
Sequestration Update Reportfor Fiscal Year 1999
The Congressional Budget Office (CBO) believesit is too early to predict the likelihood of a dis-cretionary sequestration in fiscal year 1999.
The legislation affecting mandatory spending and rev-enues that has been adopted through August 7, 1998,would not trigger a pay-as-you-go (PAYGO) seques-tration.1
Discretionary SequestrationReport
The Balanced Budget and Emergency Deficit ControlAct (the Deficit Control Act) sets limits on discretion-ary spending and provides for across-the-board cuts—known as sequestration—if annual appropriations ex-ceed those limits. The caps are in effect through fiscalyear 2002.
Before enactment of the Transportation EquityAct for the 21st Century (TEA-21) in June, the DeficitControl Act split discretionary spending into three cat-egories for fiscal years 1998 and 1999: defense, non-defense, and spending to reduce violent crime. Sepa-rate limits applied to budget authority and outlays ineach category. For fiscal year 2000, the act combined
defense and nondefense spending into a single discre-tionary category and retained a separate category forviolent crime reduction. For fiscal years 2001 and2002, the act folded all three types of spending intoone discretionary category, so the limits would applyto total discretionary spending. (The joint explanatorystatement that accompanied the conference report onthe Balanced Budget Act of 1997 specified which cat-egory each appropriation account fell into.)
TEA-21 altered that structure by establishingtwo new caps that apply to outlays for specified high-way and mass transit programs (which had been in-cluded in the nondefense caps) beginning in 1999.TEA-21 also reduced the caps on nondefense spendingin 1999 and the caps on overall discretionary spendingin 2000, 2001, and 2002. Because the new caps onhighway and mass transit spending exceed the reduc-tions in the other caps, the amount of discretionaryoutlays allowed under the Deficit Control Act was in-creased by a total of $15.4 billion from 1999 through2002.
By law, the discretionary spending limits are ad-justed each year to account for such things as the en-actment of emergency appropriations and changes inbudgetary concepts and definitions. TEA-21 addedspecial adjustments for the transportation caps. It re-quires that the caps on highway spending be adjustedeach year in the sequestration preview report to reflectdifferences between current and future estimates of therevenues that will be attributed to the Highway Trust
1. This sequestration update report is a Congressional Budget Officereport to the Congress and the Office of Management and Budgetpursuant to section 254 of the Balanced Budget and Emergency DeficitControl Act.

80 THE ECONOMIC AND BUDGET OUTLOOK: AN UPDATE August 1998
Fund. The legislation also requires that both types oftransportation caps be adjusted each year to reflectany changes in technical estimates of the outlays thatwill result from the TEA-21 funding levels.
Under section 1024(b) of the Line Item Veto Act,the discretionary spending caps would have been ad-justed by the amount of any Presidential cancellationsof discretionary budget authority and outlays that werenot overturned by a Congressional disapproval bill.No line-item veto cancellations were ever reflected inthe caps, however, because the Supreme Court ruledthe Line Item Veto Act unconstitutional in June.
Differences Between the Limits inCBO's and OMB's Preview Reports
The Office of Management and Budget (OMB) esti-mates whether a sequestration is required to eliminatea breach of the discretionary spending limits. (CBO'sestimates are merely advisory.) As a result, CBO usesthe estimated limits in OMB's most recent sequestra-tion report—in this case, the preview report for fiscalyear 1999, published in February—as the startingpoint for the adjustments it is required to make in thissequestration update report for 1999.
The caps in the two agencies' preview reportsdiffered because of differing estimates of required ad-justments for changes in budgetary concepts and defi-nitions. CBO's estimate of the adjustment in the de-fense discretionary category for fiscal year 1999 waslower than OMB's by $68 million in budget authorityand $67 million in outlays (see Table B-1). CBO'sestimate of the adjustment in the nondefense discre-tionary category for 1999 was higher than OMB's by$254 million in budget authority and $297 million inoutlays. For 2000 through 2002, CBO's estimates forthe overall discretionary category were also slightlyhigher than OMB's.
Most of the differences resulted from differentestimates of changes in mandatory spending containedin fiscal year 1998 appropriation acts—particularlythe estimates of a provision in the 1998 Treasury andGeneral Government Appropriations Act to permitfederal employees, for a limited period of time, toswitch from the Civil Service Retirement System tothe Federal Employees Retirement System. Another
difference occurred because OMB reestimated the costof arrears that the United States owes to various multi-lateral development banks, whereas CBO did not. Thetwo agencies also had different estimates of changes indiscretionary spending contained in authorizing legis-lation (primarily the Balanced Budget Act of 1997).
In addition, OMB adjusted the defense andnondefense caps for 1999 to reflect the reclassificationof spending for the Formerly Utilized Sites RemedialAction Program from the natural resources and envi-ronment function in the budget to the national defensefunction. Since that reclassification did not affect to-tal discretionary spending, the caps on overall discre-tionary spending for 2000 through 2002 were not ad-justed.
Emergency Funding Made AvailableSince OMB's Preview Report
As required by law, CBO has also adjusted the discre-tionary spending limits to reflect emergency appropri-ations enacted since OMB's preview report. BetweenMarch and August, the Congress enacted emergencyappropriations totaling $5,448 million in 1998 budgetauthority. More than half of that amount ($2,832 mil-lion) was in the defense discretionary category, and theremainder ($2,616 million) was in the nondefense dis-cretionary category. The availability of some of thoseappropriations is contingent on their designation bythe President as emergency requirements. CBO in-cludes such appropriations in its cap adjustments be-cause no further action by the Congress is needed tomake them available.
Outlays from those emergency appropriationstotal $1,012 million in fiscal year 1998, $2,007 mil-lion in 1999, $1,136 million in 2000, $853 million in2001, and $412 million in 2002. The outlay caps forboth the defense and nondefense categories for 1998and 1999 are adjusted to reflect the emergency spend-ing for programs in those categories. Estimated emer-gency outlays for those programs also result in an in-crease in the caps on overall discretionary spendingfor 2000 through 2002. In addition, an emergencyappropriation for the federal-aid highway account trig-gers an increase in the caps on highway spending for1999 through 2002.

APPENDIX B SEQUESTRATION UPDATE REPORT FOR FISCAL YEAR 1999 81
CBO has also adjusted the limits on discretionaryspending for contingent emergency appropriations thatthe President has released since the publication ofOMB's preview report. That adjustment is necessarybecause CBO starts with the limits in OMB's previousreport, and those limits (unlike CBO's) include adjust-ments only for such appropriations that have alreadybeen released by the President. Since February, thePresident has released $100 million in 1998 contingentemergency appropriations for the Low Income HomeEnergy Assistance Program, which CBO estimateswill increase nondefense discretionary outlays by $50million in both 1998 and 1999.
Caps on Highway and Mass Transit Spending
As noted above, TEA-21 established two new capsbeginning in fiscal year 1999 that apply to outlays forspecified highway and mass transit programs; it alsoreduced the existing caps on nondefense spending in1999 and the caps on other discretionary spending in2000, 2001, and 2002. The highway category doesnot have a cap on budget authority because all of thespending in that category is controlled by the obliga-tion limitations set in appropriation bills, which do notcount as budget authority. Although spending formass transit is controlled by a combination of appro-priations and obligation limitations (which likewise arenot counted as budget authority), that category has nolimit on budget authority either. In his budget for fis-cal year 1999, the President proposed redefining trans-portation obligation limitations as budget authority forboth highway and mass transit spending, but that pro-posal has not been carried out.
Pay-As-You-Go Sequestration Report
The Deficit Control Act also contains a mechanism toensure that any legislative changes in direct spendingor receipts enacted since the Budget EnforcementAct of 1997 and before 2003 do not increase the defi-
cit. That mechanism is the PAYGO sequestration. Iflegislative changes enacted through the end of a ses-sion of Congress increase the deficit (or reduce a pro-jected surplus), a PAYGO sequestration is required atthe end of the session. Under the sequestration, man-datory programs (other than those specifically exempt)are cut by enough to eliminate the increase. ThePAYGO discipline applies to legislation enactedthrough 2002, but the sequestration procedure appliesthrough 2006 to eliminate any increase in the deficit ordecrease in a projected surplus caused by that legisla-tion.
Both CBO and OMB are required to estimate thenet change in the deficit that results from direct spend-ing or receipt legislation. As with the discretionaryspending limits, however, OMB's estimates determinewhether a sequestration is necessary. CBO has there-fore adopted the estimated effects of legislation fromOMB's preview report as the starting point for thisreport. In February, OMB estimated that the effect oflegislation enacted between the time of the Budget En-forcement Act and December 16, 1997, resulted in an$11 million increase in the deficit (actually, a reduc-tion in the surplus) in 1999. That estimate excludeschanges resulting from legislation enacted before theBudget Enforcement Act, because the act removed allavailable balances from the PAYGO scorecard. Inaddition, legislation enacted between the time ofOMB's November final sequestration report and De-cember 16, 1997, had a favorable effect of $153 mil-lion in 1998. (The balance for 1998 in OMB's finalreport is not available to offset increases in mandatoryspending or decreases in revenues in fiscal year 1999.)
Legislation enacted since OMB's February pre-view report has reduced the deficit by $598 million in1998 and $1,114 million in 1999, according to CBO'sestimates. When added to the amounts in OMB's re-port, the result is a favorable balance of $751 millionfor 1998 and $1,103 million for 1999 (see Table B-2).Thus, the Congress could enact legislation increasingmandatory spending or decreasing revenues by a totalof $1,854 million in 1998 and 1999 without triggeringa PAYGO sequestration. Those figures include thebudget year effect of all legislation on which the Con-gress completed action before its August recess.

82 THE ECONOMIC AND BUDGET OUTLOOK: AN UPDATE August 1998
Table B-1.CBO Estimates of Discret ionary Spe nding Limits for Fi scal Years 1998-2002 (In m illions of doll ars)
1998 1999 2000 2001 2002Budget Budget Budget Budget Budget
Authority Outlays Authority Outlays Authority Outlays Authority Outlays Authority Outlays
Total Discretionary SpendingLimits in CBO’s JanuaryPreview Report 528,006 557,643 533,006 561,115 537,156 564,794 541,989 564,198 551,023 560,478
Defense DiscretionaryCategorya
Spending limits in CBO'sJanuary preview report 269,000 267,124 271,502 266,568 * * * * * *
AdjustmentsTechnical differences from
OMB’s Februarypreview report 0 0 68 67 * * * * * *
Emergency 1998appropriations enactedsince OMB’s previewreport 2,832 612 0 1,644 * * * * * *
Spending limits as of August 15, 1998 271,832 267,736 271,570 268,279 * * * * * *
Nondefense DiscretionaryCategorya
Spending limits in CBO'sJanuary preview report 253,506 285,686 255,704 289,594 * * * * * *
AdjustmentsTechnical differences from
OMB’s Februarypreview report 0 0 -254 -297 * * * * * *
Emergency 1998appropriations enactedsince OMB’s preview report 2,616 400 0 254 * * * * * *
Contingent emergencyappropriationsdesignated sinceOMB’s preview report 100 50 0 50 * * * * * *
Reductions specified in TEA-21 * * -859 -25,144 * * * * * *
Spending limits as of August 15, 1998 256,222 286,136 254,591 264,457 * * * * * *
Violent Crime Reduction Categoryb
Spending limits in CBO's January preview report 5,500 4,833 5,800 4,953 4,500 5,554 * * * *
Adjustments 0 0 0 0 0 0 * * * *Spending limits as of
August 15, 1998 5,500 4,833 5,800 4,953 4,500 5,554 * * * *
(Continued)

APPENDIX B SEQUESTRATION UPDATE REPORT FOR FISCAL YEAR 1999 83
Table B-1.Continued
1998 1999 2000 2001 2002Budget Budget Budget Budget Budget
Authority Outlays Authority Outlays Authority Outlays Authority Outlays Authority Outlays
Overall Discretionary Categoryc
Spending limits in CBO's * * * * 532,656 559,240 541,989 564,198 551,023 560,478January preview report
AdjustmentsTechnical differences from
OMB's Februarypreview report * * * * -171 -111 -179 -125 -183 -132
Emergency 1998appropriations enactedsince OMB’s previewreport * * * * 0 1,097 0 827 0 397
Reductions specified inTEA-21 * * * * -859 -26,009 -859 -26,329 -859 -26,675
Spending limits as ofAugust 15, 1998 * * * * 531,626 534,217 540,951 538,571 549,981 534,068
Highway CategorySpending limits in TEA-21 * * d 21,885 d 24,436 d 26,204 d 26,977Adjustments (Emergency
1998 appropriations enacted since OMB’s preview report) * * d 109 d 39 d 26 d 15
Spending limits as of August 15, 1998 * * d 21,994 d 24,475 d 26,230 d 26,992
Mass Transit CategorySpending limits in TEA-21 * * d 4,401 d 4,761 d 5,190 d 5,709Adjustments * * d 0 d 0 d 0 d 0Spending limits as of
August 15, 1998 * * d 4,401 d 4,761 d 5,190 d 5,709
Total DiscretionarySpending Limits as of August 15, 1998 533,554 558,705 531,961 564,084 536,126 569,007 540,951 569,991 549,981 566,769
SOURCE: Congressional Budget Office.
NOTE: * = not applicable; OMB = Office of Management and Budget; TEA-21 = Transportation Equity Act for the 21st Century.
a. This category is folded into the overall discretionary category after fiscal year 1999.
b. This category is folded into the overall discretionary category after fiscal year 2000.
c. This category comprises defense and nondefense spending in fiscal year 2000, plus violent crime reduction spending in 2001 and 2002.
d. There are no limits on budget authority for the highway and mass transit categories. All of the spending in the highway category, and most of thespending in the mass transit category, is controlled by obligation limitations, which are not counted as budget authority.

84 THE ECONOMIC AND BUDGET OUTLOOK: AN UPDATE August 1998
Table B-2.Budget ary Effects of Direct Spe nding or Receipt LegislationEnacted Since the Budget Enfo rcement Act of 1997 (By fiscal year, in m illions of doll ars)
1998 1999 2000 2001 2002 2003
Total for OMB's February 1998 Preview Reporta -153 11 16 14 10 9
Legislation Enacted Since OMB's Preview ReportAn act to authorize the Secretary of Agriculture to convey certain lands and
improvements in the State of Virginia (P.L. 105-171) 0 -1 -1 0 0 0Transportation Equity Act for the 21st Century (P.L. 105-178)b,c -440 -392 249 320 194 133Care for Police Survivors Act of 1998 (P.L. 105-180) 1 1 1 1 1 1Agricultural Research, Extension, and Education Reform Act of
1998 (P.L. 105-185) 0 5 24 -50 -53 -33Agricultural Export Relief Act of 1998 (P.L. 105-194) 7 24 11 0 0 0Child Support Performance and Incentive Act of 1998 (P.L. 105-200) 0 -100 -55 -65 10 210Internal Revenue Service Restructuring and Reform Act of 1998
(P.L. 105-206)b,d -168 -659 -519 241 806 1,157Homeowners Protection Act of 1997 (P.L. 105-216) 2 2 0 0 0 0Credit Union Membership Access Act (P.L. 105-219)e 0 6 16 27 40 54
Increase or Reduction (-) in the Net Deficit -751 -1,103 -258 488 1,008 1,531
SOURCE: Congressional Budget Office.
NOTES: The following bills affected direct spending or receipts but did not increase or decrease the deficit by as much as $500,000 in any yearthrough 2003: Environmental Policy and Conflict Resolution Act of 1997 (P.L. 105-156); an act to consolidate certain mineral interests innational grasslands in Billings County, North Dakota (P.L. 105-167); Wireless Telephone Protection Act (P.L. 105-172); an act to amend theImmigration and Nationality Act to modify and extend the visa waiver pilot program (P.L. 105-173); Telemarketing Fraud Prevention Act of1997 (P.L. 105-184); U.S. Holocaust Assets Commission Act of 1998 (P.L. 105-186); Deadbeat Parents Punishment Act of 1998 (P.L.105-187); an act to validate certain conveyances in the City of Tulare, Tulare County, California (P.L. 105-195); National Drought Policy Actof 1998 (P.L. 105-199); an act to make a minor adjustment in the exterior boundary of the Devils Backbone Wilderness in the Mark TwainNational Forest, Missouri (P.L. 105-210); an act to award a Congressional gold medal to Nelson Rolihlahla Mandela (P.L. 105-215);Workforce Investment Act of 1998 (P.L. 105-220); an act to establish the United States Capitol Police Memorial Fund (P.L. 105-223); an actto provide for the conveyance of small parcels of land in the Carson National Forest and the Santa Fe National Forest, New Mexico, to thevillage of El Rito and the town of Jemez Springs, New Mexico (H.R. 434); Foreign Relations Authorization Act (H.R. 1757); Nazi WarCrimes Disclosure Act (S. 1379); and Emergency Farm Financial Relief Act (S. 2344).
OMB = Office of Management and Budget; P.L. = Public Law.
a. Section 254 of the Balanced Budget and Emergency Deficit Control Act of 1985, as amended by the Budget Enforcement Act of 1990, calls for alist of all the bills that are included in the pay-as-you-go calculation. Because the data in this table assume OMB’s estimate of the total change inthe deficit resulting from bills enacted through the date of its report, readers are referred to the list of those bills included in Tables 6 and 7 of theOMB Final Sequestration Report to the President and Congress issued on November 24, 1997, and in previous sequestration reports issued byOMB.
b. Change in outlays and receipts.
c. Pursuant to section 8102 of P.L. 105-178, the figures shown exclude direct spending and receipts from title VIII of this act.
d. Pursuant to section 3309 of P.L. 105-206, the figures shown exclude the effects of receipts that were designated as an emergency requirementunder section 252(e) of the Balanced Budget and Emergency Deficit Control Act.
e. The direct spending effects of this bill are excluded because they are related to guarantee commitments for deposit insurance, which are exemptfrom the pay-as-you-go procedures under the Balanced Budget and Emergency Deficit Control Act.

Appendix C
Major Contributors to theRevenue and Spending Projections
The following Congressional Budget Office analysts prepared the revenue and spending projections in thisreport:
Revenue Projections
Mark Booth Individual income taxesHester Grippando Customs duties, miscellaneous receiptsCarolyn Lynch Corporate income taxes, Federal Reserve System earningsNoah Meyerson Social insurance taxesLarry Ozanne Capital gains realizationsJohn Sabelhaus Estate and gift taxesSean Schofield Excise taxesDavid Weiner Individual income taxes
Spending Projections
Defense, International Affairs, and Veterans’ Affairs
Valerie Barton Military retirement, veterans’ educationShawn Bishop Veterans’ health care, military health careKent Christensen Defense (military construction, base closures)Jeannette Deshong Defense (military personnel, NATO expansion, and other international
agreements)Sunita D’Monte International affairs (conduct of foreign affairs and information exchange
activities), veterans’ housingRaymond Hall Defense (Navy weapons, missile defenses, atomic energy defense)Charles Riemann Veterans' compensation and pensionsDawn Sauter Intelligence programs and defense acquisition reformJoAnn Vines Defense (tactical air forces, bombers, Army)

86 THE ECONOMIC AND BUDGET OUTLOOK: AN UPDATE August 1998
Joseph Whitehill International affairs (development, security, international financial institutions)
Health
Tom Bradley MedicareJeanne De Sa Medicaid, State Children's Health Insurance ProgramCynthia Dudzinski Public Health Service, MedicareDorothy Rosenbaum Medicaid, State Children's Health Insurance Program
Human Resources
Valerie Baxter Food Stamps, child nutritionSheila Dacey Child Support Enforcement, Temporary Assistance for Needy FamiliesDeborah Kalcevic EducationJustin Latus Education, foster care, child careJosh O'Harra Human resourcesCarla Pedone Housing assistanceEric Rollins Federal Civilian Retirement, Supplemental Security IncomeKathy Ruffing Social SecurityChristi Hawley Sadoti Unemployment insurance, training programs, aging programs
Natural and Physical Resources
Gary Brown Water resources, other natural resources, regional developmentKim Cawley Energy, pollution control and abatement, Universal Service FundClare Doherty TransportationMark Grabowicz Justice, Postal ServiceKathleen Gramp Energy, science and space, spectrum auction receiptsMark Hadley Commerce, credit unionsVictoria Heid Conservation and land management, Outer Continental Shelf receiptsDavid Hull AgricultureCraig Jagger AgricultureJames Langley AgricultureKristen Layman Transportation, Indian affairs, disaster assistanceMary Maginniss Deposit insurance, legislative branchSusanne Mehlman Justice, Federal Housing Administration and other housing creditDavid Moore Spectrum auction receiptsDeborah Reis Recreation, water transportation, community developmentJohn Righter General governmentPhilip Webre Universal Service Fund
Other
Janet Airis Appropriation billsEdward Blau Authorization billsJodi Capps Appropriation billsBetty Embrey Appropriation billsKenneth Farris Computer supportMary Froehlich Computer support

APPENDIX C MAJOR CONTRIBUTORS TO THE REVENUE AND SPENDING PROJECTIONS 87
Vernon Hammett Computer supportJeffrey Holland Net interest on the public debtCatherine Mallison Appropriation billsTaman Morris Other interest, civilian agency payAlex Roginsky Computer supportRobert Sempsey Appropriation billsJennifer Winkler National income and product accounts