the economic benefits of sheath blight resistance in...
TRANSCRIPT

1
The Economic Benefits of Sheath Blight Resistance in Rice
Francis, Tsiboea, Lanier Nalleya*, Alvaro Duranda, Greg Thomab and Aaron Shewa
aDepartment of Agricultural Economics and Agribusiness, University of Arkansas. 217 Agricultural Building, Fayetteville, Arkansas 72704, USA.
bDepartment of Chemical Engineering, University of Arkansas. 3153 Bell Engineering. Tracy Dr, Fayetteville, Arkansas 72704, USA.
*Corresponding author: [email protected]
Working selected paper prepared for presentation at the Southern Agricultural Economics Association (SAEA) Annual Meeting, Mobile, Alabama, February 4‐7, 2017
Copyright 2016 by [Tsiboe, Nalley, Durand, Thoma and Shew]. All rights reserved. Readers may make verbatim copies of this document for non‐commercial purposes by any means, provided this copyright notice appears on all such copies.

2
Abstract
The most tangible outcome of a breeding program of any type is increased yield; however,
breeding for biotic stresses (maintenance breeding) generally results in pathogen resistance, which
can be viewed as mitigating potential crop losses. Economists tend to undervalue the opportunity
cost of this type of agricultural research. This study estimates the loss (volume and revenue) in
rice production in the Mid-South attributed to the presence of sheath blight, a common fungus in
the US. We then ask the counterfactual question: what would the implications be if sheath blight
was not present in US rice production. To do this we estimated the additional rice supply from
sheath blight resistance and entered it into the RiceFlow model. The RiceFlow model generates
global estimates of changes in rice price given an increase supply, as well as changes in consumer
and producer welfare. Finally, the counterfactual increased yield and decreased fungicide usage
from the absence of sheath blight were analyzed in a Life Cycle Assessment (LCA) model to assess
the environmental impact that would have resulted if sheath blight was not present. These results
provide insight on how potential genetic resistance to sheath blight could affect producer
livelihoods, food security, and environmental sustainability.

3
Introduction
Rice consumption accounts for more than half of the daily caloric intake of over three
billion people globally, most of which are located in rapidly growing low-income countries (Pareja
et al., 2011). Accordingly, rice supply must increase by approximately 30% to meet the projected
demand in 2050 (Mohanty, Wailes, and Chavez, 2010; Food and Agriculture Organization, 2015).
Because rice provides 21% of global human per capita energy and 15% of per capita protein
(International Rice Research Institute [IRRI] , 2013), even moderate supply shocks can have large
impacts on low-income rice consumers. For example, in 2008 when rice prices tripled due largely
to trade restrictions in India and Egypt, the World Bank estimated that an additional 105 million
people were pushed into poverty (World Bank, 2013). This event was occurred following a
reduction of only 8% in trade from 2007 (Childs, 2009).
While supply shocks typically manifest themselves through trade restrictions or abiotic
events such as drought and heat, biotic events such as disease and fungus can alter global supply.
In China alone, 15 to 20 million ha of rice are affected with Sheath Blight (Rhizoctonia solani)
annually, causing losses of up to six million tons (Xie et al. , 2008); equivalent to about 1% of
global rice production. Losses due to sheath blight (ShB) are estimated at 10% annually in India
and 20% in Thailand (Boukaew and Prasertsan, 2014). Average global yield losses attributable to
ShB range from 10-30% (Xie et al. , 2008), and can reach over 50% during years with severe
outbreaks (Qingzhong et al. , 2001). Unlike abiotic events which cannot be altered, losses from
biotic stresses in rice production such as rice ShB and rice blast (Magnaporthe oryzae) can be
reduced through both fungicide application and various levels of genetic resistance via rice
breeding programs.

4
Unlike rice blast for which there are resistant cultivars available to rice producers in the
United States, there are currently no available ShB resistant cultivars for commercial production.
This is mainly due to the lack of sources for resistance in cultivated and wild rice species
possessing ShB resistance traits (Brooks, 2007). As such, integrated measures of fungicide
treatment combined with moderately resistant varieties are the principle means to control ShB
globally; however, this is both expensive (for producers in low-income countries) and possess a
toxicity problem to the environment (for both low and high-income countries) (Baby and
Manibhushanrao, 1993; Qingzhong et al. , 2001).
The relatively high yields of American rice production ha-1 are partly attributed to the large
public investment in rice breeding, pathology, entomology and agronomy. However, U.S rice
production is still affected by various biotic stresses such as ShB. In the mid-south of the United
States (Arkansas, Louisiana and Mississippi) losses from ShB can be severe and prevalence can
be widespread. During the 2001 growing season, it was reported that 50-66% of Arkansas (the
largest rice producing state in the United States) rice fields were infected with ShB, subsequently
leading to yield losses between 5-15% (Tan et al. , 2007; Reddy MS, 2014).
Symptoms of ShB in rice production include, lesion formation on infected sheaths of lower
rice leaves which may lead to softness of the stem and subsequently stem lodging (Wu et al. ,
2012). The ShB fungus is spread on rice fields by lesion formation from tiller to tiller on an infected
plant or across water surface to nearby plants. The fungus is also spread across touching plant parts
(leaf to leaf), thus causing infections on adjoining plants. In addition, the fungus survives between
crops as “sclerotia” that can lie dormant in the soil for at least two to three years (University of
Arkansas Cooperative Extension Service [UACES], 2015). Furthermore, ShB severity is impacted

5
by, the ecology, development stage of rice at infection, cultural practices, excessive nitrogen
fertilizer rates at pre-flood, and cultivar resistance to ShB (D. E. Groth, Rush, and Hollier, 1992).
Breeding efforts for rice ShB resistance in the U.S and globally have not been fruitful to
date, as the fungus continuously evolves making even short term resistance difficult to achieve.
Historical planting of rice varieties in the Mid‐South of the U.S. from 2000-2014 indicate that only
3.91% -equivalent to 148,315 ha - of seeded area - were classified moderately-resistant to ShB
(Rice Technical Working Group [RTWG] , various years). The low incident of even moderately
resistant ShB cultivars has been partly attributed to the lack of source for resistant genes in both
domesticated rice and its related wild species (Hashiba, 1984; D. E. Groth, Rush, and Hollier,
1992). Of the twelve rice chromosomes identified, only one out of six quantitative trait loci
associated with ShB resistance appears to be independent of plant height, a morphological trait
associated with ShB resistance (Z. Li et al. , 1995). Accordingly, identifying genes that offer high
levels of partial ShB resistance and pyramiding these genes through biotechnology, could offer
complete ShB resistance (Pan et al. , 1999; Reddy MS, 2014). However, the speed with which this
can be achieved, which is important given that ShB continuously evolves, thorough breeding could
be constrained by current genetically modified food (GM) regulations.
In practice, plant breeding programs generally have two objectives; breeding for high
yields and breeding for resistance against biotic and abiotic stresses (maintenance breeding).
Whiles the former leads to tangible outcomes such as increased production ha-1, the later generally
results in pathogen resistance for a crop specimen which are often times less tangible. Thus, policy
makers tend to undervalue the opportunity cost of informative agricultural research, specifically
in maintenance breeding. Thus, this study sets out to quantify the economic and environmental
impact of ShB resistance in the Mid-South of the US.

6
From an economic/producer standpoint, ShB resistance allows for higher yields as genetic
yield potential is not undermined by ShB outbreaks and subsequent yield losses. Accordingly, the
economic impact of maintenance breeding, or maintaining yield at its genetic potential, can be as
great, if not greater than the impact of the genetic yield increases experienced by breeding
programs (Marasas, Smale, and Singh 2003). In addition, the literature as also shown that a lack
of maintenance breeding is causing a slower rate of rice yield increase in South Asia (Pan et al.
1999). Thus reinforcing the idea that if maintenance breeding programs are discontinued or
diminished, meeting the increasing demand for rice will be stifled globally.
While higher yields (and the mitigation of fungicide application) is beneficial to producers,
consumers also benefit as higher supplies lead to lower market prices. Many low-income countries
are highly price inelastic to movements in rice price as there are no substitutes for rice in many
cultures. The literature as shown that, a 50% increase in rice price would lead to at least 32 million
people falling back into poverty with the possibility of up to 100 million people (Asian
Development Bank, 2008; Ivanic and Martin, 2008). Conversely, any price reduction in rice could
have large positive impacts on alleviating poverty. While increased yield potential is becoming
increasingly difficult, breeding for pathogen resistance could be one way to increase supply
without increasing genetic yield potential.
Sheath blight resistance would also provide environmental benefits in the form of reduced
fungicide applications and greenhouse gas emissions associated with the production and
application of fungicide. The fungicides used in the mid-south to combat rice ShB are Quilt XcelTM
(active ingredients: 13.5% Azoxystrobin and 11.7% Propiconazole) and QuadrisTM (active
ingredient: 22.9% Azoxystrobin). These fungicides, given their toxicity levels for humans and
length of their residual effects could have adverse effects on human health and the environment.

7
Currently, rice producers who experience elevated costs and yield losses and consumers
who experience higher prices due to a diminished supply as a function of ShB, assume the costs
of the absence of ShB resistance. While the literature is rich on the economic impacts of breeding
programs for rice (Alpuerto, Norton, and Alwang, 2008; Annou, Wailes, and Cramer, 2000;
Guimaraes, 2009; Nalley and Barkley, 2010; Singh et al. , 2013) it is nearly void of the economic
impacts of rice maintenance breeding programs. Thus, we ask the counterfactual question, if all
cultivars in the mid-south were ShB resistant, benefits could be realized by producers, consumers,
and the environment? To do this, this study utilizes (1) county/parish-level rice varietal yields with
their associated ShB susceptibility rating and seeded area in Arkansas, Louisiana and Mississippi
for 2002-2014, (2) simulates ShB infection rates based off historical infection data and (3) from
those simulated infected hectares simulate yield loss based on historical yield loss data. From this,
we estimated the additional rice volume that would have been available in the absence of ShB for
2002-2014.
This estimated additional supply from ShB resistance was then put into the RiceFlow
model (Durand-Morat and Wailes, 2010) in order to answer the counterfactual question: what
would the implications be if ShB was not present in US rice production. The RiceFlow model
generates domestic and global estimates of changes in rice price given an increase supply, as well
as changes in consumer and producer welfare. Finally, the counterfactual increased yield and
decreased fungicide usage from the absence of ShB were analyzed in a Life Cycle Assessment
(LCA) model to assess the environmental impact that would have resulted if ShB and its associated
fungicide applications were not present. These comprehensive results provide insight on how
potential genetic resistance to ShB in the Mid-South could affect producer livelihoods, food
security via increased rice supply, and environmental sustainability. Furthermore, these estimates

8
provide important information to donors and breeding programs globally on the importance of not
just increasing genetic yield potential but maintaining it simultaneously.
Materials and Methods
Following similar studies in the literature (Nalley et al. , 2016), this study calculates the
potential benefit of genetic ShB resistance for rice production in Arkansas, Mississippi and
Louisiana using two ShB outbreak and response scenarios.1 Actual annual varietal planting area
was collected from RTWG (various years) for each rice- growing county/parish in Arkansas,
Louisiana, and Mississippi from 2002 to 2014. Additionally, annual varietal yield data for each
county/parish - viewed as “yield potential” -were also collected from university-run experiment
stations (Arkansas Agricultural Experiment Station [AAES], various years.; Louisiana State
University Agricultural Center [LSU AgCenter] , various years; Mississippi Agricultural and
Forester Experiment Station [MAFES], various years). The yields form the experiment stations
are viewed as “yield potential” because, the rice cultivars are grown in conditions that favor its
growth; with biotic and abiotic stresses effectively controlled, and with proper supply of nutrients
and water. Nonetheless, yields are often greater on experimental test plots than on producers’
fields, but the relative yield difference between varieties is comparable. According to Brennan
(1984), the most reliable sources of relative yields are cultivar trials outside of actual farm
observations.
Note that, for some years, data on county/parish specific varietal yields form the
experiment stations were missing. As such, for a given year in which no county/parish specific
1 In 2015, the percentage of US rice harvested in Arkansas, Louisiana, and Mississippi was 49.94%,16.12%, and 5.79%, respectively (United States Department of Agriculture 2016).

9
varietal yields were available, the annual county/parish average yield was used for that year. The
dataset consists of 47 rice varieties (8 hybrids and 39 conventional), 33 rice-growing counties in
Arkansas, 35 parishes in Louisiana, and 18 counties in Mississippi for a total of 5,733 yield
observations.
Sheath Blight Ratings
Annual ShB susceptibility ratings for each variety derived from historical observations of
test plots and in grower fields across each state, conducted by university-run experiment stations
were used in this study (AAES; LSU AgCenter; MAFES). Given that varieties can become more
susceptible to ShB over time as even partial genetic resistance can break down, the most recent
rating was used for each year. A Likert scale of ShB susceptibility is used by the University run
stations to classify rice cultivars as; Moderately Resistant (MR), Moderately Susceptible (MS),
Susceptible (S) and Very Susceptible (VS). In 2014, two verities seeded across the Mid-South of
the United States were rated as MR, seven as MS, eleven as S, and three as VS; and their respective
area sown are approximately equal to 32,000 ha, 219,000 ha, 419,000 ha, and 94,000 ha,
respectively. A list of ShB susceptibility rating by variety as of 2015 can be found on Table A1.
Sheath Blight Outbreak and Yield Loss Rate
It is common amongst University extension services to annually rate ShB susceptibility,
however, it is uncommon to obtain detailed reports ShB outbreaks, or their associated yield losses.
Extensive, systematic field-level yield and quality loss estimates due to rice ShB have not been
developed in the U.S. This is partly due to a lack of data on the numerous and often simultaneous
diseases affecting rice, as well as the underground damage associated with root diseases, and the
lack of qualitative information on distribution and severity on commercial fields. In addition, field-

10
level estimates of ShB loss have also been difficult to estimate. Often times outbreaks are contained
to one portion of a field and as such do not warrant the attention of extension agents to collect
extensive data. Crop consultants will typically scout for ShB and give producers recommendations
based on field observations. To our knowledge there is not an extensive database of locations or
magnitude of ShB outbreaks or losses in the Mid-South of the United States.
Whilst, ShB outbreak acreage are scarce in the literature, Norman and Moldenhauer
(various years) provide estimates of the annual percentage of sampled commercial rice fields
across Arkansas that required a fungicide application for ShB. According to Norman and
Moldenhauer (various years), on average from 2002 to 2014 19.05% of sampled commercial rice
fields across Arkansas were annually treated with fungicide application for ShB; with a maximum
of 31.89%. However, similar studies for Louisiana and Mississippi did not exist at the time of the
study, as such it was assumed that there were proportional fungicide applications in all three states
based on the Arkansas data. Ideally, state- specific distributions would be preferred given all three
states have different ecologies, cultural practices, and distribution of cultivar resistance. Thus,
using the Arkansas historical data reported by Norman and Moldenhauer (various years), a
triangular distribution with a mean of 19.05% truncated between 0.00% and 31.89% infected area
was used to simulate ShB infection rate.
The literature is also scarce regarding replicated field trials that document yield loss
associated with ShB on commonly cultivated rice varieties in the U.S. To illustrate, several studies
base on field experiments have analyzed varietal difference in ShB development and its associated
with yield loss at different levels of nitrogen fertilizer application, fungicide application, or both
(D. E. Groth and Bond, 2006; D. E. Groth, 2008; D. E. Groth and Bond, 2007; D. Li et al. , 2012;
Tang et al. , 2007; Savary, Castilla, and Elazegui, 1995; Andersson et al. , 2012). However, none

11
of these studies provide estimates of yield differences between ShB inoculated and un-inoculated
for the same variety or across different varieties. The overall findings from the aforementioned
studies are that, fungicide application improved canopy light interception rate, and grain filling
reduced the degree of ShB. Groth (2016) does provide typical yield losses associated with ShB for
the four susceptibility ratings normally used by extension services across the United States. Groth
(2016) indicates that typical yield losses associated ShB in the field are 15-25%, 10-20%, < 10%,
and 5-10% for rice varieties that are rated as VS, S, MS, and MR, respectively.
Given the lack of locational and varietal- specific rates of yield response to ShB, the
estimates put forth by Groth (2016) were used in this study to estimate yield losses based on ShB
susceptibility ratings as they were similar to the other two ranges +/- 15% put forth in the Mid-
South (Tan et al. , 2007; Reddy MS, 2014). Furthermore, because yield loss caused by ShB are
determined by the severity and timing of the infection, a static percentage yield loss would not be
appropriate in this study; as such, a simulated range of yield loss was developed based on
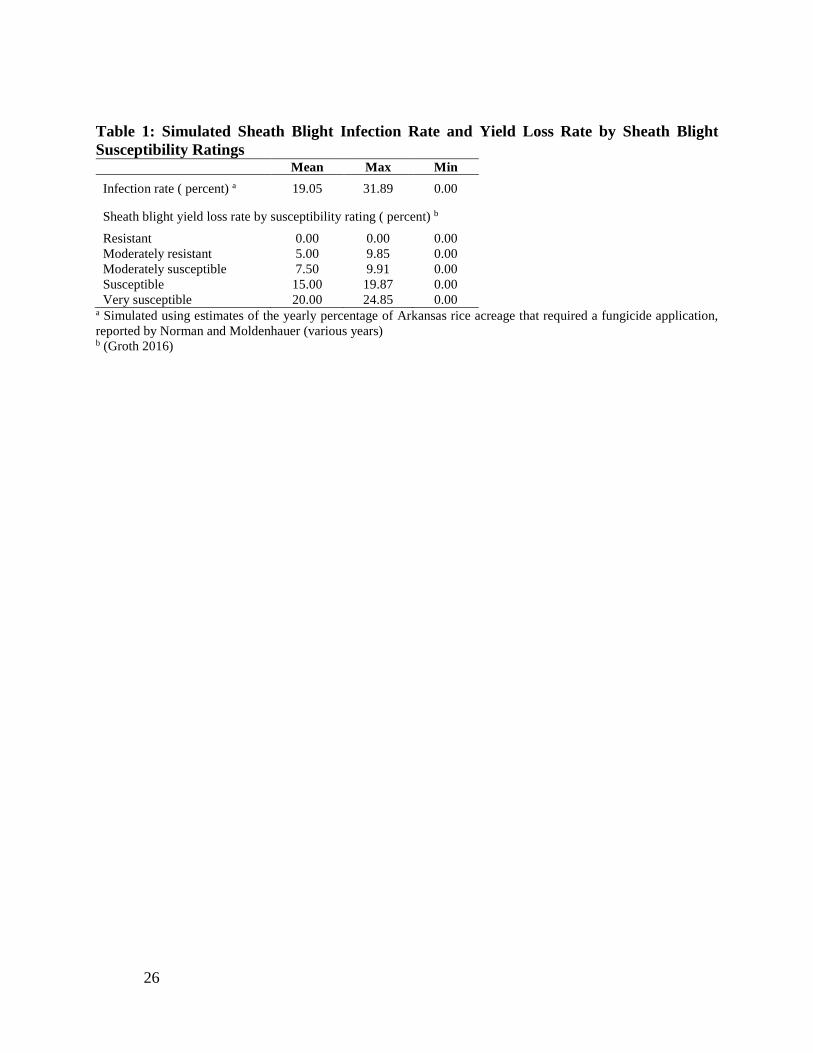
susceptibility rankings and empirical losses, as reported by Groth (2016). For each susceptibility
ranking, the study simulates its yield loss rate 1000 times, assuming a triangular distribution such
that the possible minimum and maximum of the simulations are equivalent to those reported by
Groth (2016). The mean percentage yield loss for the various ShB susceptibility ratings are: 0.00%,
5.00%, 7.50%, 15.00%, and 20.00%, for R, MR, MS, S, and VS, respectively (Table 1).
Cost of Sheath Blight Mitigation
The prices of the two most common fungicides (Quilt XcelTM and QuadrisTM) used in the
U.S. to combat rice ShB vary by retailer, region and are affected by dealer rebates. In 2015, the
average cost for Quilt Xcel to a rice producer was $46.23 liter-1 in the Arkansas Delta region
(Driggs, 2015). Comparatively, the average cost for Quadris was $72.65 liter-1. The recommended

12
application rate for Quilt Xcel for ShB is 1.56 l ha-1, and for Quadris, it is 0.77 l ha-1. Thus, the
estimated per application cost of Quadris is $72.13 ha-1, and for Quilt Xcel, it is US $55.79 ha-1.
Four crop dusting services in the Delta of Arkansas and Mississippi were contacted in
August, 2015, and the average aerial fungicide application charge ha-1was $19.77. Given that the
data does not exist on which fungicide producers actually used to mitigate ShB we assume that it’s
evenly split. As such, the average price of both fungicides (Quadris and Quilt Xcel), $63.96 ha-1,
was taken and then added to the cost of aerial application for a total cost per application of
fungicide of $83.73 ha-1. Finally, because both the historical cost of aerial application and
fungicide costs were prohibitive to obtain, they were assumed as constant across time, although
adjusted for inflation.
Sheath Blight Outbreak Scenario One
Scenario one simulates the area of rice produced in all three states that are infected with
ShB based on empirical data (Norman and Moldenhauer, various years). The infected area is then
treated with two applications of fungicide to mitigate this outbreak with no associated yield loss.
Extension recommendations suggest using two applications of fungicide for severe ShB conditions
on S and VS cultivars (UACES, 2015). Thus, scenario one mimics many rice producing years
where an outbreak occurs but either a producer or a crop consultant catches the fungi in its early
stages and its treated early and only costs are incurred not yield losses. Scenario one was modeled
as follows:
𝑇𝑇𝑇𝑇𝑡𝑡1 = 2𝑇𝑇ℎ𝜆𝜆∑ 𝐴𝐴𝑖𝑖𝑖𝑖𝑡𝑡𝑡𝑡 (1)
Where the annual total cost of ShB for scenario one (𝑇𝑇𝑇𝑇𝑡𝑡1) is the summation of all actual
historic hectares of susceptible rice varieties (i) sown in each rice-producing county/parish (l) in a
given year (t), multiplied by the simulated infection rate of ShB (λ), and twice the cost of fungicide

13
application per hectare (Ch). Equation (1) is a function of time; this is because county level varietal
distribution and the area sown to ShB susceptible varieties changes annually. In addition, all non-
ShB-resistant varieties have equal probabilities of infection. That is, each variety, regardless of
susceptibility ratings, has the equivalent probability of an infection based on historical data and
the simulations run in the model. Individual ratings effect probability of yield loss but not
probability of infection.
Blight Outbreak Outbreak Scenario Two
Scenario two simulates a corresponding yield loss associated with the infections simulated
in scenario one, based on the loss estimates put forth by Groth (2016). Similar to scenario one, the
infected areas are assumed to be associated with two applications of fungicide, but with an
associated yield loss which is a function of the ShB susceptibility rating. While a percentage yield
loss is simulated for each susceptible variety, it is recognized that each variety has a different yield
potential. As such, each variety’s average yield is denoted by county, as reported by each state’s
extension service (AAES; LSU AgCenter; MAFES). Thus a simulated 5% yield loss for two MS
varieties would be different given that the two varieties had different yield potentials. Scenario
two was modeled as follows:
𝑇𝑇𝑇𝑇𝑡𝑡2 = 𝑇𝑇𝑇𝑇𝑡𝑡1 + ∑ 𝛾𝛾𝑖𝑖𝑌𝑌𝑖𝑖𝑖𝑖𝑃𝑃𝑔𝑔𝑡𝑡𝑡𝑡 (3)
Total cost (for all three states) of ShB for scenario two (𝑇𝑇𝑇𝑇𝑡𝑡2) is the summation of the
annual, total cost simulated for scenario one (𝑇𝑇𝑇𝑇𝑡𝑡1), and the product of the yield associated with
variety i (𝑌𝑌𝑖𝑖𝑖𝑖), simulated yield loss rate due to ShB (𝛾𝛾𝑖𝑖), and the season-average farm price for rice
(Pgt), relevant to variety i. The price (Pgt), is measured in $ Mg-1 and aggregated at grain type level

14
(g = 0 for medium, g = 1 for long grain) as reported by United States Department of Agriculture
(2016). The variable 𝛾𝛾𝑖𝑖 is simulated a 1000 times.
Impact on the U.S. Rice Market
In order to assess the impact of rice ShB on the U.S. rice market according to the findings
reported for each scenario, the RiceFlow model (Durand-Morat and Wailes, 2010) is used.
RiceFlow is a multi-region, multi-product, spatial partial equilibrium model of the world rice
economy that is used extensively to assess different aspects of the global rice economy. For
instance, Thompson et al. (2015) used RiceFlow to assess the impact of the U.S. Liberty Link rice
contamination. Furthermore, Briones et al. (2012) and Wailes, Durand-Morat, and Diagne (2015)
have used the model to assess alternative rice policy options in Southeast Asia and West Africa,
respectively. In the model, the global rice economy is disaggregated into 73 regional markets and
9 rice commodities derived from the combination of rice type (long, medium, and fragrant rice)
and milling degree (paddy, brown, and milled rice), which allowed us to analyze the impact of
ShB on the prices consumers obtain in local markets.
We assume a completely fixed supply of land and limited mobility of land across rice types
in all countries. This, coupled with Leontief technology assumptions at each level of the production
tree, results in very inelastic output supply functions. Hence, the results presented in this study can
be understood as short-run outcomes controlling for potential supply-expansionary effects in other
countries induced by rice ShB outbreak in the U.S. The most up to date calibrated version of the
RiceFlow model is for production year 2013 and thus all results elicited from it will only be from
2013. Thus, RiceFlow is augmented with the counterfactual yield increases due to the elimination
of ShB and the subsequent producer and consumer surplus changes estimated.

15
Environmental Impacts of Sheath Blight Resistance
Following similar studies in the literature (Nalley et al. , 2016), we use a lifecycle
assessment (LCA) to provide a quantitative comparison of the cradle-to-farm gate environmental
benefits of rice ShB elimination in the Mid-South. The goal was to provide a comparison (rice
production with and without the presence of ShB) for the functional unit kg-1 of rice that is dried
to 12.5% moisture at the farm-gate ready for transportation to milling. The principal differences
between the scenarios are yield (loss associated with ShB infection) and fungicide application to
susceptible varieties. Sheath blight-susceptible varieties subject to infection rates and yield losses
are described on Table 1 and were subsequently sprayed with two applications of fungicide. The
inputs for each system in terms of land preparation, planting, fertilizer and pesticide application
(except as noted), and harvesting ha-1 were taken from the University of Arkansas extension
budgets (UACES, 2016) and used in the LCA.
The TRACI 2.1 LCA framework, which was developed by the US Environmental
Protection Agency for conditions in the United States, was used to estimate potential
environmental impacts arising from differences in production (Bare, Gloria, and Norris, 2006). In
order to minimize bias in the comparison between the two scenarios, a paired Monte Carlo
simulation approach was adopted using SimaPro 8.1, which selects variates from each unit process
in the supply chain and computes the difference between the two (ShB susceptible vs. resistance)
production systems. This approach ensures that additional variability from independent
simulations of the supply chains is not introduced.
From this methodology, the differences were ascertained between the ShB-prone and ShB
-resistant rice production from a holistic environmental standpoint. Most importantly this

16
methodology allows for testing for statistical differences and magnitudes for ten environmental
categories between ShB-prone and ShB -resistant rice production, ceteris paribus.
Results
Producer Impacts
Tables 3 and 4, present the results for the total (aggregated annual) economic cost of
scenarios one and two, Table 4 present the results for the U.S. rice market effects of ShB, and
Table 5 presents the results of the LCA. Monetary values throughout the paper are converted to
2014 monetary terms using annual CPI retrieved from (International Monetary Fund [IMF] 2016).
In scenario one, ShB infected hectares of rice were simulated and an associated cost was
estimated according to spraying these hectares twice with the appropriate fungicide at a cost of
$167.50 ha-1. 2 The results indicate that given an assumed infestation rate of 19.05%, the historical
mean of all susceptible varieties, applied to all ShB susceptible hectares, producers spend on
average $21.44 million on ShB mitigation annually. This can be viewed as a best case scenario as
there is no assumed yield loss and the costs are simply absorbed by the producer but there are no
supply effects in the market.
The results from scenario two shows that given an assumed infestation rate of 19.05%
applied to all ShB susceptible hectares, producers lose on average $68.48 million annually due to
ShB mitigation; thus a $47.04 million yield loss in in addition to the $21.44 million lost to ShB
mitigation. At the State level the annual average cost of ShB for scenario two are estimated at
$45.94 million, $14.66 million, and $7.88 million, respectively for Arkansas, Louisiana, and
2 Fungicide cost are adjusted for inflation.

17
Mississippi. The calculated potential economic loss as a share of the total value of rice production
in each state for the period 2002-2014 is estimated at 3.89%, 4.23%, and 4.57%, respectively, for
Arkansas, Louisiana, and Mississippi. 3 Overall, the potential economic loss due to ShB is
estimated at 4.03% for scenario two as a share of the total value of rice production in the Mid-
South, U.S. Furthermore, these yield losses have more than simple revenue implications for
producers. Reduced supply also affects consumers. As such the results from scenario two are
inputted into the RiceFlow model to calculate market price implications and subsequent consumer
welfare changes.
Consumer Impacts
We use the RiceFlow model to assess the market impact of ShB mitigation and its effect
on consumer prices. In other words, the simulation entails estimating the conditions in the rice
market in the absence of ShB. Table 4 below presents the results for the key selected variables
from the estimated counterfactual decreased costs and increased yields associated with ShB from
the scenarios. That is, we present the counterfactual results from Table 3 asking the question, “what
if the yield losses and increased costs of production calculated from scenario two did not exist?”
The cost savings due to lower fungicide use (scenarios 1 and 2) are small relative to the
total production cost, and consequently, the cost savings generate no significant changes in the
U.S. rice supply chain. However, U.S. consumers are expected to save an estimated $51 million
annually when the yield losses and mitigation costs are accounted for (scenario 2). Most of the
benefits are due to lower retail prices as aggregate rice demand changes only marginally. Most of
the benefits ($43 million) come from the consumption of long-grain rice, which undergoes a price

18
decrease of about $19 ton-1. These results suggest that ShB alleviation increases rice yields and
production, as well as subsequently lowers long-grain rice price.
In turn, ShB alleviation improves the competitiveness of U.S. rice and expands long-grain
exports by 101,000 Mg or 3.0% and all rice exports by 111,000 Mg or 2.4%. In other words, the
results suggest that the excess supply generated by the alleviation of rice ShB in the US could be
sufficient enough to feed 1.7 million people every year at the average per-capita consumption of
65 Kg. This suggestion is impressive considering the US is a small rice producer by global
standards and likely experiences less loss from ShB than the global average because of its ongoing
investment in production technology and management.
Environmental Impacts
The Study evaluated the environmental impacts associated with ShB through a
counterfactual argument. Specifically, we present comparisons of the current average condition in
which an acre of a susceptible variety is produced compared to a variety that is resistant to ShB.
The difference between the two groups is expressed in yield loss, whose probability is derived
from Table 1. The ranges for infection rate in yield loss of a susceptible variety are compared in
Table 4. The susceptible rating was chosen to analyze from all possibilities of susceptible ratings
(MR, MS, S and VS) because, in 2014, it accounted for the highest amount of acreage sown in the
Mid-South, 29.14%.
The cradle-to-farm gate LCA approach was followed in performing the comparison;
meaning that all inputs from production of fertilizers, through cultivation, harvest, and drying to a
moisture content of 12%, have been included. The only differences between the two scenarios
were yield differences and the elimination of fungicide usage for the resistant variety. Because
these differences are uni-directional, and no other differences between the scenarios were

19
introduced, the Monte Carlo simulations did not result in uncertainty regarding whether or not
there are benefits from the elimination of ShB. Notably, because there is uncertainty inherent in
the system model, there is also uncertainty in the mean values for both scenarios, but no uncertainty
that they are significantly different. The students t-tests show that for a pairwise comparison of
1000 simulations, the P value is less than 10-8 (Table 5).
These simulations show that the introduction of ShB resistance in rice production results
in lower global warming potential, carcinogenicity, ecotoxicity, eutrophication, fossil fuel
depletion, and smog and ozone depletion (Table 5). The negative results for non-carcinogens are
the result of modeling heavy metal uptake by the rice plants-the higher the yield, the greater the
uptake, which results in decreased ecotoxicity at the farm; however, there is high uncertainty in
these results, and we do not recommend any mitigation actions be taken on the basis of this result.
Importantly, in using the well-established categories defined by the TRACI 2.1 LCA framework,
it is evident from Table 5 that, ShB resistance in rice leads to multiple environmental
improvements, as compared to ShB -susceptible varietal production.
These results are important as agricultural scientists attempt to sustainably produce 70%
more calories for a growing human population, which is projected to be demanded by 2050 (Adhya
et al., 2014). The environmental benefits of ShB resistance highlight two important concepts. First,
by simply obtaining yield potential we improve our input use efficiency per unit of output and
lessen our environmental impact. Second, by breeding resistance to a pathogen we reduce the
environmental load of the fungicide that would have to be applied also lessening our environmental
impact Mg-1.
Discussion

20
The United Nations estimates that by 2050, global population would have increased by
33% to 9.6 billion. Because rice provides 21% of global human per capita energy and 15% of per
capita protein (IRRI, 2013), the moderate price/supply shocks can have large impacts on low-
income rice consumers. In comparison to other rice-producing countries, the U.S is a relatively
small producer supplying only 1.3% of the world’s rice; however, the U.S has been among the top
five rice exporters for several decades (Lakkakula et al. , 2015). Thus, any change in supply in the
U.S. market could have global ripple effects in terms of price and food security. This study has
illustrated that maintenance breeding, for the alleviation of ShB, could have significant impacts on
domestic rice producers, global rice consumers and thus food security. As the rice yield gap closes
and the yield ceiling approaches, maintenance breeding for pathogen resistance like ShB is one
way to increase food supply without increasing yield potential.
The objective of most breeding programs is to increase the yield celling, but with crops
such as rice and wheat which have not been approved for genetic modification in the U.S, the yield
ceiling is approaching quickly. This study indicates that there are still large gains to be made
through maintenance breeding that would not need to raise the yield ceiling. Most cost-benefit
analysis of breeding programs only focus on yield enhancements and not yield loss avoidance
through pathogen resistance. This study sheds economic and environmental light on the
importance of valuing yield loss avoidance.
As genetic gains for crops like rice and wheat continue on their increasing at a decreasing
rate pace, breeding programs may need to shift their focus from yield enhancement to yield loss
avoidance via biotic and abiotic stress resistance. The results of this study shed light on the fact
that not only are the economic effects of yield loss avoidance through breeding programs
significant but as are the environmental effects. This paper highlights two important aspects of

21
future breeding programs for potential donors or evaluators. First, while increasing yields should
be a priority moving forward, it should not be at the expense of maintenance breeding as that could
simply increase the yield gap. Second, to properly evaluate a breeding program, yield loss
avoidance from biotic and abiotic stress resistance must be estimated, else the program could be
vastly undervalued both from an economic and environmental perspective.
References
Adhya, K., B. Linquist, T.Searchinger, R. Wassmann and X. Yan. Wetting and drying: reducing greenhouse gas emissions and saving water from rice production. Working Paper, Installment 8 of Creating a Sustainable Food Future. Washington, DC: World Resources Institute, 2014. Available at: http://agritech.tnau.ac.in/ta/Agriculture/pdf/csa_pdf/Wetting_and_drying.pdf. Accessed Nov. 17, 2016.
Alpuerto, V., G. Norton and J. Alwang. Economic impact analysis of marker-assisted breeding in rice. American Agricultural Economics Association Annual Meeting, 1‑ 28, 2008. Available online at http://vtechworks.lib.vt.edu/handle/10919/34340. Accessed Nov. 1, 2016.
Andersson, H., S. Arpaia, D. Bartsch, J. Casacuberta, H. Davies, P. du Jardin and G.Flachowsky Scientific opinion addressing the safety assessment of plants developed through cisgenesis and intragenesis. EFSA Journal 10, no 2 (2012), 2561. doi:10.2903/j.efsa.2012.2561.
Annou, M., E. Wailes and G. Cramer. Economic analysis of adopting Liberty Link rice. Rice Situation and Outlook, 2000. Available online at http://usda.mannlib.cornell.edu/usda/ers/RCS-yearbook//2000s/2000/RCS-yearbook-11-29-2000.pdf Accessed Mar. 5, 2016.
Arkansas Agricultural Experiment Station (AAES). Arkansas Rice Performance Trials (ARPT). Various years; for 2002 to 2015 2015. Available online at http://arkansasvarietytesting.com/home/rice/. Accessed Apr. 8, 2016.
Asian Development Bank. Food Prices and Inflation in Developing Asia: Is Poverty Reduction Coming to an End?, 2008. Available online at http://www.adb.org/sites/default/files/publication/29075/food-prices-inflation.pdf. Accessed May 18, 2016.
Baby, U. and K. Manibhushanrao. Control of rice sheath blight through the integration of fungal antagonists and organic amendments. Tropical Agriculture 70(1993): 240‑ 244.
Bare, J., T. Gloria and G. Norris. Development of the method and U.S. normalization database for Life Cycle Impact Assessment and sustainability metrics. Environmental science & technology 40(2006): 5108‑5115.

22
Boukaew, S. and P. Prasertsan. Suppression of rice sheath blight disease using a heat stable culture filtrate from Streptomyces philanthi RM-1-138. Crop Protection 61(2014): 1‑ 10. doi:10.1016/j.cropro.2014.02.012.
Brennan, John. Measuring the Contribution of New Varieties to Increasing Wheat Yields. Review of Marketing and Agricultural Economics 52(1984): 175-195.
Briones, R., A. Durand-Morat, E. Wailes and E. Chavez. Climate Change and Price Volatility: Can We Count on the ASEAN Plus Three Emergency Rice Reserve? ADB Sustainable Development Working Paper Series 24,2012. Available online at http://www.adb.org/sites/default/files/publication/29971/adb-wp-24-climate-change-price-volatility.pdf Accessed Mar 4, 2016.
Brooks, Steven. Sensitivity to a Phytotoxin from Rhizoctonia solani Correlates with Sheath Blight Susceptibility in Rice. Phytopathology 97(2007): 1207‑1212. doi:10.1094/PHYTO-97-10-1207.
Childs, Nathan. Rice Situation and Outlook Yearbook/RCS-2008/February 2009, 2009. Available online at http://usda.mannlib.cornell.edu/usda/ers/RCS-yearbook/2000s/2009/RCS-yearbook-02-17-2009.pdf. Accessed Nov 2, 2016.
Driggs, K. Personal Communications with Agronomic Service Representative for Syngenta, Little Rock Arkansas. Communications August 27, 2015., 2015.
Durand-Morat, A. amd E. Wailes. Riceflow: A Multi-region, Multi-product, Spatial Partial Equilibrium Model of the World Rice Economy. University of Arkansas, Department of Agricultural Economics and Agribusiness, 1 juillet 2010. Available online at http://econpapers.repec.org/RePEc:ags:uarksp:92010. Accessed Oct 19, 2016.
Food and Agriculture Organization [FAO]. FAOSTAT. Food and Agriculture Organization of the United Nations, 2015. Available online at http://faostat.fao.org/. Accessed Oct. 31, 2016.
Groth, Don. Effects of cultivar resistance and single fungicide application on rice sheath blight, yield, and quality. Crop Protection 27(2008): 1125‑1130. doi:10.1016/j.cropro.2008.01.010.
Groth, D. and J. Bond. Effects of Cultivars and Fungicides on Rice Sheath Blight, Yield, and Quality. Plant Disease 91(2007): 1647‑1650. doi:10.1094/PDIS-91-12-1647.
Groth, D and J. Bond. Initiation of Rice Sheath Blight Epidemics and Effect of Application Timing of Azoxystrobin on Disease Incidence, Severity, Yield, and Milling Quality. Plant Disease 90(2006): 1073‑1076. doi:10.1094/PD-90-1073.
Groth, D., M. Rush and C. Hollier. Prediction of Rice Sheath Blight Severity and Yield Loss Based on Early Season Infection. Louisiana Agriculture - Louisiana Agricultural Experiment Station (USA), 1992. Available online at http://agris.fao.org/agris-search/search.do?recordID=US9333475. Accessed Sep. 3, 2016.
Groth, Don. Rice Sheath Blight Disease Management, 2016. Available online at http://www.lsuagcenter.com/~/media/system/e/7/c/9/e7c9e3c94769feffdd8a5283feed0687/sheathblightmanagement.pdf. Accessed Sep 7, 2016.
Guimaraes, E. Rice breeding. Cereals, 99‑ 126, 2009. doi:10.1007/978-0-387-72297-9.

23
Hashiba, T. Estimating method of severity and yield loss by rice sheath blight disease [Rhizoctonia solani]. Bulletin of the Hokuriku National Agricultural Experiment Station, 1984. Available online at http://agris.fao.org/agris-search/search.do?recordID=US201302012415. Accessed Oct. 4, 2016.
International Monetary Fund (IMF). International Financial Statistics (IFS). IMF elibrary Data, 2016. Available online at http://data.imf.org/?sk=5DABAFF2-C5AD-4D27-A175-1253419C02D1. Accessed Nov. 17, 2016.
International Rice Research Institute (IRRI). Rice knowledge bank, 2013. Available online at http://www.knowledgebank.irri.org/. Accessed May 8, 2016.
Ivanic, M. and W. Martin. Implications of higher global food prices for poverty in low-income countries. Agricultural Economics 39 (2008): 405‑416. doi:10.1111/j.1574-0862.2008.00347.x.
Lakkakula, P., B. Dixon, M. Thomsen, E. Wailes and D. Danforth. Global rice trade competitiveness: a shift-share analysis. Agricultural Economics 46(2015): 667‑676. doi:10.1111/agec.12162.
Li, D., Q.Tang, Y. Zhang, J. Qin, H. Li, L. Chen, S.i Yang, Y. .Zou and S.Peng. Effect of Nitrogen Regimes on Grain Yield, Nitrogen Utilization, Radiation Use Efficiency, and Sheath Blight Disease Intensity in Super Hybrid Rice. Journal of Integrative Agriculture 11(2012): 134‑143. doi:10.1016/S1671-2927(12)60791-60793.
Li, Z., S.Pinson, M. Marchetti, J. Stansel and W. Park. Characterization of quantitative trait loci (QTLs) in cultivated rice contributing to field resistance to sheath blight (Rhizoctonia solani). TAG. Theoretical and applied genetics. Theoretische und angewandte Genetik 91(995): 382‑388. doi:10.1007/BF00220903.
Louisiana State University Agricultural Center (LSU AgCenter). Louisiana Rice Production Handbook. Various years; 1999,2099, and 2014, s. d. Available online at http://www.lsuagcenter.com/portals/communications/publications/publications_catalog/crops_livestock/rice/rice-production-handbook1. Accessed on May 9, 2016.
———. Rice Varieties and Management Tips. Various years; 2003, 2014, 2015, and 2016. Available online at http://www.lsuagcenter.com/NR/rdonlyres/4F5F83A3-20FA-4391-813D-9BB69C54E99F/100040/pub2270RiceVarieties2015FINAL.pdf. Accessed May 3, 2016/
Marasas, C.., M. Smale and R. Singh. The economic impact of productivity maintenance research: Breeding for leaf rust resistance in modern wheat. Agricultural Economics, 29(2003):253‑263. doi:10.1016/S0169-5150(03)00052-5.
Mississippi Agricultural and Forester Experiment Station (MAFES). Mississippi Rice Variety Trials. Various years; for 2002 to 2015. Available online at http://www.mafes.msstate.edu/variety-trials/archive.asp#rice. Accessed Jun 3, 2016.
Mohanty, S., E. Wailes and E. Chavez. The global rice supply and demand outlook: the need for greater productivity growth to keep rice affordable. In Rice in the Global Economy, International Rice Research Institute (IRRI), 2010: 175‑ 87.

24
Nalley, L. and A. Barkley. Using portfolio theory to enhance wheat yield stability in low-income nations: An application in the Yaqui Valley of Northwestern Mexico. Journal of Agricultural and Resource Economics 35(2010): 334‑347.
Nalley, L., F. Tsiboe, A. Durand-Morat, A.Shew and G. Thoma. Economic and Environmental Impact of Rice Blast Pathogen (Magnaporthe oryzae) Alleviation in the United States. 2016. Forthcoming in the Public Library of Science (PLOS ONE).
Norman, R. and K Moldenhauer. B.R. Wells Arkansas Rice Research Studies. Various years; 2002-2014. Sous la direction de R Norman et K Moldenhauer, K, A. Arkansas Agricultural Experiment Station, s. d. Available online at http://arkansasagnews.uark.edu/1356.htm. Accssed Jul 4, 2016.
Pan, X., M. Rush, X. Sha, Q. Xie, S.Linscombe, S.Stetina and J. Oard. Major gene, nonallelic sheath blight resistance from the rice cultivars Jasmine 85 and Teqing. Crop Science 39(1999): 338‑346.
Pareja, L., A. Fernández-Alba, V. Cesio and H. Heinzen. Analytical methods for pesticide residues in rice. TrAC Trends in Analytical Chemistry 30(2011):270‑291. doi:10.1016/j.trac.2010.12.001.
Qingzhong, M., L. Zhiheng, W. Heying, Z. Shushen and W. Songhong. Research Progress in Rice Sheath Blight. Journal of Shenyang Agricultural University 32(2001): 376‑381.
Yellareddygari, S., M. Reddy, J. Kloepper, K. Lawerence and H. Fadamiro. Rice Sheath Blight: A Review of Disease and Pathogen Management Approaches. Journal of Plant Pathology & Microbiology 5(2014). doi:10.4172/2157-7471.1000241.
Rice Technical Working Group (RTWG). Rice Acreage Summaries. Proceedings of the Rice Technical Working Group (RTWG). Various years 2001-2014. CDROM, s. d.
Savary, S, N. Castilla and F. Elazegui. Direct and indirect effects of nitrogen supply and disease source structure on rice sheath blight spread. Phytopathology 85(1995): 959‑965.
Singh, H., S. Singh, U. Singh, J. Singh, N. Zaidi and S. Mohanty. Economic evaluation of Pusa Rice Hybrid 10 cultivation: A micro-economic evidence of Uttarakhand, India. Indian Journal of Traditional Knowledge 12(2013): 472‑477.
Tan, W., W. Zhang, Z. Ou, C. Li, G. Zhou, Z. Wang and L. Yin. Analyses of the Temporal Development and Yield Losses due to Sheath Blight of Rice (Rhizoctonia solani AG1.1a). Agricultural Sciences in China 6(2007): 1074‑1081. doi:10.1016/S1671-2927(07)60149-7.
Tang, Q., S. Peng, R. Buresh, Y. Zou, N. Castilla, T. Mew and X. Zhong. Rice varietal difference in sheath blight development and its association with yield loss at different levels of N fertilization. Field Crops Research 102(2007): 219‑227. doi:10.1016/j.fcr.2007.04.005.
Thompson, J., E.Wailes, A. Durand-Morat and A. Leister. Welfare Effects of U.S. Liberty Link Rice Contamination. Journal of Agricultural and Applied Economics 47(2015): 243‑259. doi:10.1017/aae.2015.7.
United States Department of Agriculture. (USDA) National Agricultural Statistics Service, Quick Stats 2.0, 2016. Available online at http://quickstats.nass.usda.gov/. Accessed Nov 2, 2016.

25
University of Arkansas Cooperative Extension Service (UACES). 2016 Crop Enterprise Budgets for Arkansas Field Crops Planted in 2016, 2016. Available online at http://uaex.edu/farm-ranch/economics-marketing/farm-planning/budgets/docs/budgets2016/Manuscript_2016.pdf. Accessed Mar. 17, 2016.
———. 2015. Rice Production Handbook, 2015. Available online at http://www.uaex.edu/publications/pdf/MP192/MP192.pdf. Accessed Mar 17, 2017.
Wailes, E., A. Durand-Morat and M. Diagne. Regional and National Rice Development Strategies for Food Security in West Africa. In Food Security in an Uncertain World (Frontiers of Economics and Globalization, Volume 15). Andrew Schmitz, P. Lynn Kennedy et Troy G. Schmitz. Emerald Group Publishing Limited, 2015: 255‑ 68. doi:10.1108/S1574-871520150000015025.
World Bank. Global Food Crisis Response Program, 2013. Available online at http://www.worldbank.org/en/results/2013/04/11/global-food-crisis-response-program-results-profile. Accessed Apr 26, 2016.
Wu, W., J. Huang, K. Cui, L. Nie, Q. Wang, F.Yang, F. Shah, F. Yao and S. Peng. Sheath blight reduces stem breaking resistance and increases lodging susceptibility of rice plants. Field Crops Research 128(2012): 101‑108. doi:10.1016/j.fcr.2012.01.002.
Xie, X., M. Xu, J. Zang, Y. Sun, L. Zhu, J. Xu, Y. Zhou and Z. Li. Genetic Background and Environmental Effects on QTLs for Sheath Blight Resistance Revealed by Reciprocal Introgression Lines in Rice. Acta Agronomica Sinica 34(2008): 1885‑1893. doi:10.1016/S1875-2780(09)60013-4.
26
Table 1: Simulated Sheath Blight Infection Rate and Yield Loss Rate by Sheath Blight Susceptibility Ratings
Mean Max Min Infection rate ( percent) a 19.05 31.89 0.00
Sheath blight yield loss rate by susceptibility rating ( percent) b
Resistant 0.00 0.00 0.00 Moderately resistant 5.00 9.85 0.00 Moderately susceptible 7.50 9.91 0.00 Susceptible 15.00 19.87 0.00 Very susceptible 20.00 24.85 0.00
a Simulated using estimates of the yearly percentage of Arkansas rice acreage that required a fungicide application, reported by Norman and Moldenhauer (various years) b (Groth 2016)

27
Table 2: Total Economic Cost of Sheath Blight Simulated Mitigation by Fungicide Application to all Susceptible Rice Hectares in the Mid-South (Arkansas, Louisiana and Mississippi): 2002-2014 a
Year
Rice area susceptible to sheath blight
(ha)b
Rice area infected with sheath blight (ha)c Mitigation cost for sheath
blight infected area ($)de
Mean Max Mean Max 2002 893,961 170,256 284,922 21,669,390 36,263,592 2003 821,557 156,466 261,846 20,438,397 34,203,531 2004 897,428 170,916 286,027 22,898,361 38,320,267 2005 928,665 176,865 295,983 24,287,767 40,645,428 2006 731,918 139,395 233,276 19,842,482 33,206,272 2007 702,628 133,816 223,941 19,720,733 33,002,525 2008 618,693 117,831 197,189 17,956,904 30,050,769 2009 786,007 149,696 250,515 22,812,994 38,177,406 2010 965,606 183,901 307,757 28,333,643 47,416,178 2011 621,071 118,284 197,947 18,818,269 31,492,258 2012 630,555 120,090 200,970 19,507,838 32,646,247 2013 578,421 110,161 184,354 18,079,433 30,255,820 2014 762,580 145,234 243,049 24,322,035 40,702,777 Avg. 764,545 145,609 243,675 21,437,557 35,875,621 Total 9,939,089 1,892,911 3,167,775 278,688,247 466,383,070
a Scenario one: Simulated sheath blight outbreak with probabilities from Table 1 on susceptible hectares are sprayed twice with fungicide (the average for Quilt Xcel and Quadris) with no associated yield loss. See Table A2 for state specific results b Annual area planted to sheath blight susceptible varieties in Arkansas, Louisiana and Mississippi (Proceedings of the Rice Technical Working Group, various years). c Simulated using infection rates shown on Table 1 and sheath blight susceptible hectares listed on this table d Areal fungicide application at a rate of 1.16 l ha-1 and at a cost $ 83.7338 ha-1 ($19.77 ha-1 for areal application and $63.96 ha-1 for fungicide) e Values in 2014 $; deflated with consumer price index retrieved from IMF (2015).

28
Table 3: Total Cost (Mitigation and Yield Loss) of Sheath Blight in the Mid-South: 2002-2014a
Year
Real season-
average rice price ($ Mg-1) b
Total yield loss on
sheath blight infected area (Mg)
Total yield loss on sheath blight infected area ($) c
Average total loss on sheath blight infested area ($) d
Medium grain
Long grain Medium
grain Long grain Mean Max Mean Max
2002 171.19 120.41 7,663 202,394 25,682,837 52,193,911 47,352,227 88,457,503 2003 282.01 215.62 9,712 204,949 46,930,287 93,364,005 67,368,684 127,567,536 2004 201.43 202.82 7,550 190,373 40,131,393 81,080,231 63,029,754 119,400,498 2005 253.62 195.09 4,906 238,238 47,722,211 95,704,458 72,009,977 136,349,886 2006 313.26 245.17 5,273 178,175 45,335,942 89,350,755 65,178,425 122,557,028 2007 367.51 312.13 9,801 149,232 50,181,241 97,957,249 69,901,973 130,959,774 2008 441.19 401.19 5,590 138,749 58,130,522 114,228,281 76,087,426 144,279,049 2009 381.94 324.12 13,648 140,176 50,645,916 98,032,474 73,458,910 136,209,880 2010 359.02 280.00 10,855 193,317 58,026,171 112,976,109 86,359,814 160,392,287 2011 331.79 287.71 22,546 112,141 39,744,916 79,705,366 58,563,185 111,197,624 2012 334.16 311.95 13,120 116,931 40,861,097 80,077,172 60,368,935 112,723,419 2013 346.89 337.44 12,422 118,539 44,308,512 86,810,247 62,387,945 117,066,067 2014 341.38 315.94 29,480 170,289 63,864,734 126,132,893 88,186,769 166,835,670 Avg. 317.34 273.05 11,736 165,654 47,043,521 92,893,319 68,481,079 128,768,940 Total - - 152,565 2,153,502 611,565,779 1,207,613,151 890,254,025 1,673,996,221
a Scenario two: All sheath blight susceptible hectares are infected with the simulated sheath blight rate on Table 1 and then subsequently sprayed twice with fungicide (the average for Quilt Xcel and Quadris) and an associated yield loss occurs dependent on the sheath blight resistance rate presented on Table 1. b NASS reports medium grain prices from 2002-2008 as USA average and prices and reports 2009-2014 prices as Mid-South (Arkansas, Louisiana, Mississippi, Missouri, and Texas) averages. Price data retrieved from NASS (2016). c Values in 2014 $; deflated with consumer price index retrieved from IMF (2015) d Calculated as the summation of the mitigation costs presented on Table 2 and the total yield loss from this table.

29
Table 4: Impact of Simulated Sheath Blight Infested Hectares in the Mid-South with Yield Loss on Selected U.S. Rice Market Variables in 2013
Variables All Rice Long Grain Rice Medium Grain Rice
Basea Counterb Change Basea Counterb Change Basea Counterb Change 1000 Mg, paddy basis 1000 Mg, paddy basis 1000 Mg, paddy basis
Production paddy rice 9.051 9.176 125 6.245 6.360 115 2.806 2.816 10 Change stock -147 -147 0 -101 -101 0 -46 -46 0 Export paddy rice 1.520 1.550 30 1.520 1.550 30 0 0 0 Domestic sales paddy rice 7.678 7.773 95 4.826 4.911 85 2.852 2.862 10 Export brown rice 341 345 4 65 66 1 276 279 3 Import brown rice 14 14 0 14 14 0 0 0 0 Domestic sales brown rice 7.351 7.442 91 4.775 4.859 84 2.576 2.583 8 Export milled rice 2.774 2.851 77 1.770 1.840 70 1.004 1.011 7 Import milled rice 856 844 -11 124 119 -6 1 1 0 Domestic demand milled ricec 5.432 5.435 3 3.129 3.137 8 1.573 1.573 0 Exports 4.636 4.746 111 3.355 3.456 101 1.281 1.290 10 Imports 869 858 -11 138 132 -6 1 1 0 Paddy farm gate ($ Mg-1)d 351 347 -4 337 333 -4 380 379 -1 Milled rice retail ($ Mg-1)d 2.397 2.383 -14 2.134 2.115 -19 2.683 2.676 -7 Farm gate production ($ million)d 3.173 3.191 18 2.107 2.124 17 1.066 1.067 1 Retail consumption ($ million)c,d 9.116 9.066 -51 4.677 4.634 -43 2.953 2.945 -8
a Simulates the domestic rice market as if all the cost increases and yield losses estimated in the scenario three were present. b Simulates the domestic rice market as if all the cost increases and yield losses estimated in the scenario three were eliminated. c For all rice, it includes 730 Mg-1 of fragrant rice imported in the benchmark. d Values in 2014 $; deflated with consumer price index retrieved from IMF (2015)

30
Table 5. Results of the Categories in the Life Cycle Analysis Comparison of Sheath Blight-Resistant Rice Production vs. Sheath Blight-Susceptible Rice Production, Based on 1000 Monte Carlo Simulations.
TRACI Impact category Units Description Resistant Susceptiblea P-value Acidification kg SO2 eq Terrestrial acidification
driven by acid gases 6.786E-03 6.988E-03 p<0.0001
Carcinogens CTUh Human toxicity units 1.093E-07 1.125E-07 p<0.0001 Ecotoxicity CTUe Ecosystems toxicity units 3.691E+01 3.800E+01 p<0.0001 Eutrophication kg N eq Freshwater and marine
eutrophication driven by nutrient runoff
5.320E-03 5.477E-03 p<0.0001
Fossil fuel depletion MJ surplus Nonrenewable energy consumption
1.026E+00 1.056E+00 p<0.0001
Global warming potential kg CO2 eq Accumulated greenhouse gas emissions (IPCC 2006 characterization factors)
1.555E+00 1.601E+00 p<0.0001
Non-carcinogens CTUh Human toxicity units -1.572E-07 -1.620E-07 p<0.0001 Ozone depletion kg CFC-11 Accumulated ozone-
depleting compounds emissions
1.133E-07 1.167E-07 p<0.0001
Respiratory effects kg PM2.5 eq
Primary and secondary particulate emissions
5.238E-04 5.393E-04 p<0.0001
Smog kg O3 eq Small forming potential 6.235E-02 6.420E-02 p<0.0001 a Yield loss (kg/ha) and probabilities associated with sheath blight-susceptible rice production are derived from Table 1. All inputs are assumed to be identical with the exception of one application of Quilt Xcel (13.5 percent Azoxystrobin and 11.7 percent Propiconazole) at a rate of 1.56 liters ha-1 and one application of Quadris (22.9 percent Azoxystrobin) at a rate of 0.77 liters ha-1 for sheath blight-infected varieties with probabilities given on Table 1. Method: TRACI 2.1 V1.03 / US 2008, confidence interval: 95 percent.