the economic contribution of australia’s copyright industries€¦ · surveys of particular...
TRANSCRIPT

Prepared byThe Allen Consulting GroupforAustralian Copyright CouncilandCentre for Copyright Studies
The Economic Contribution ofAustralia’s Copyright Industries


The Economic Contribution of Australia’s Copyright Industries i
Table of Contents
KEY FINDINGS ii
Section OneINTRODUCTION 1
Section Two
AUSTRALIA’S COPYRIGHT INDUSTRIES 2
Section ThreeTHE VALUE ADDED BY AUSTRALIA’S COPYRIGHT INDUSTRIES 4
Section FourEMPLOYMENT IN AUSTRALIA’S COPYRIGHT INDUSTRIES 8
Section Five
INTERNATIONAL TRADE IN COPYRIGHT MATERIAL 11
Appendix AMETHODOLOGY 15
Appendix BREFERENCES 20
© The Allen Consulting Group 2001
ISBN 1 875833 81 1
The Australian Copyright Council and the Centre for Copyright Studiesgratefully acknowledge the financial contribution to the production of thisreport by Australasian Performing Right Association, Australian RecordIndustry Association, Copyright Agency Limited and Screenrights.

ii The Economic Contribution of Australia’s Copyright Industries
Key Findings
Australia’s copyright industries can be classified into three clusters:
• the core industries encompass those industries that create copyright works as their primary product;
• the partial copyright industries are those in which only a portion of these industries’ product isassociated with the creation of copyright works; and
• the copyright distribution industries distribute copyright materials to businesses and consumers.
The division of the total copyright contribution between the three copyright clusters is shown in thefigure below.
The Relative Value of the Three Copyright Clusters (1999–2000)
Copyright Distribution Industries (24%)
Partial Copyright Industries (25%)
Core Copyright Industries (51%)
Source: IBISWorld
Economic Value
In 1999–2000 Australia’s copyright industries contributed $19.2 billion in industry gross product (IGP). Interms of value adding, this represented 3.3 percent of Australia’s Gross Domestic Product (GDP). Asshown in the figure below, the value-added contribution by Australia’s copyright industries is anincreasingly important component of the Australian economy.
Copyright Industries’ Value Add Contribution as a Percentage of GDP
Contribution
to GDP
1980-81 1985-86 1992-93 1995-96 1999-000%
1%
2%
3%
4%
Source: IBISWorld and Guldberg, H H (1994)
The Economic Contribution of Australia’s Copyright Industries iii
Over the period 1996–97 to 1999–2000 the copyright industries grew at an average annual growth rate of5.7 percent. This growth significantly exceeded the average annual growth rate of the total economy overthe same period (4.85 percent per year).
Employment
In June 2000 3.8 percent of Australia’s workforce (345,000 people) were employed in copyright industries.This is comparable to employment levels in sectors such as government administration and defence, andpersonal and other services.
Employment in the copyright industries has grown from around 312,000 in 1995–96 to nearly 345,000 in1999–2000, representing an average annual growth rate of 2.7 percent. This compares with the 2 percentaverage annual growth in employment over the economy as a whole.
Trade
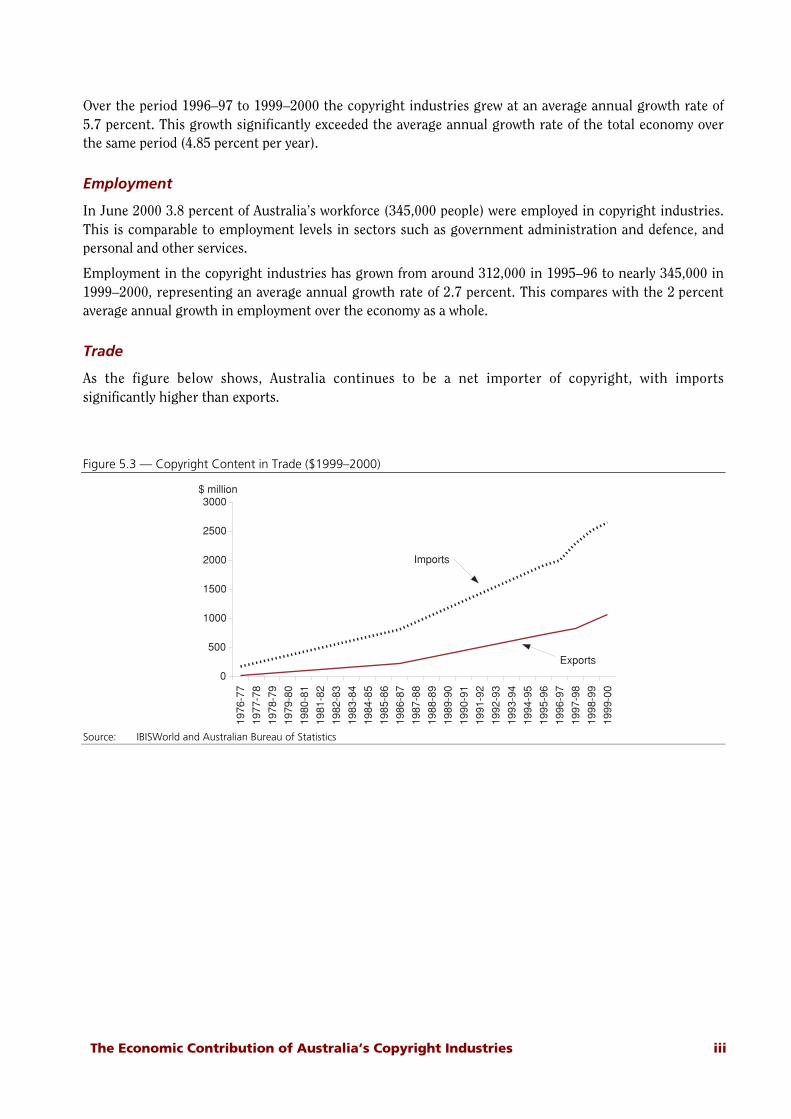
As the figure below shows, Australia continues to be a net importer of copyright, with importssignificantly higher than exports.
Figure 5.3 — Copyright Content in Trade ($1999–2000)
1976
-77
1977
-78
1978
-79
1979
-80
1980
-81
1981
-82
1982
-83
1983
-84
1984
-85
1985
-86
1986
-87
1987
-88
1988
-89
1989
-90
1990
-91
1991
-92
1992
-93
1993
-94
1994
-95
1995
-96
1996
-97
1997
-98
1998
-99
1999
-00
0
500
1000
1500
2000
2500
3000
Imports
Exports
$ million
Source: IBISWorld and Australian Bureau of Statistics

iv The Economic Contribution of Australia’s Copyright Industries
Consistent with assessment methodologies employed overseas, this report represents a best-practiceassessment of the economic importance of Australia's copyright industries. While changes in the ABS'sapproach to measuring the economic contributions of particular industries should make it easier tocompile future reports, to improve the accuracy of future reports will require significant governmentsupport and resourcing akin to that provided to other broadly based industries (eg, tourism's TourismSatellite Account).
Although Australia continues to remain a net importer of copyright material, the growth rate in exportscontinues to outstrip the growth rate of imports, but from a lower base. Over the period 1995–96 to1999–2000:
• export revenue from the core copyright sector increased by 44 percent, while the value of importsincreased by around 29 percent;
• export revenue from the distribution sector increased by 300 percent, while the value of importsincreased by around 77 percent; and
• these figures have contributed to a total growth rate in revenue from copyright materials in excess of36 percent, and a total growth rate of around 27 percent for revenues paid for copyright materials.
The Economic Contribution of Australia’s Copyright Industries 1
Section One
Introduction
While the value of copyright has traditionally been seen in cultural and social terms, the rise of theinformation economy1 and the services sector2 is changing this traditional perception so that copyright isincreasingly being seen as core infrastructure underpinning a number of Australian industries.
Despite this change in attitude, there has been little analysis of the economic value and importance ofAustralia’s copyright industries as a whole. While the Australian Bureau of Statistics (ABS) conductssurveys of particular copyright-intensive sectors on an infrequent basis, no wide-ranging analysis of theeconomic contribution of Australia’s copyright industries has been undertaken since 1994.3
In response to this lack of a contemporary broad-ranging study, The Allen Consulting Group wascommissioned by the Australian Copyright Council and the Centre for Copyright Studies to prepare thisindependent analysis of the importance of copyright industries to the Australian economy, focusingparticularly on the:
• contribution of the copyright industries to Australia’s Gross Domestic Product (GDP);
• share of national employment related to Australia’s copyright industries; and
• scale of international trade in copyright royalties and goods.
Even though the focus of this report is upon quantification of the copyright industries, it is important toremember that:
Figures [in economic studies] relate to the “copyright industry”. They cannot measure in terms ofeconomics the importance of the rights for the intellectual or cultural status of a country, their effects onthe development of art forms, learning, and the choice of preferences for media contents etc.
4
1 Australian Coalition of Service Industries and McKinsey & Company, australia.com: Australia's Future Online (Australian Coalition of
Service Industries, Melbourne, 1997).2 The Allen Consulting Group, Creating Value by Transforming Knowledge: Australia's Business and Professional Services Sector
(Department of Industry, Science and Resources and Austrade, Canberra, 2001).3 Guldberg, H H, Copyright: An Economic Perspective (2nd ed., Australian Copyright Council, Sydney, 1994).
4 Karnell, G, "Authors’ Rights and Copyright Economics" (1995) 26 International Review of Industrial Property and Copyright Law 193 at
195.

2 The Economic Contribution of Australia’s Copyright Industries
Section Two
Australia’s Copyright Industries
An important first step is to be clear as to precisely what constitutes Australia’s ‘copyright industries’.
2.1 Defining the Copyright Industries
A major problem in the preparation of this report has been the lack of comprehensive and robustinformation on the copyright (and other intellectual property) industries within Australia. Thesedifficulties largely arise because copyright-intensive industries cannot be neatly classified within theAustralian and New Zealand Standard Industrial Classification (ANZSIC) system used by the ABS, or theStandard Industrial Classification (SIC) system used by international bodies such as the Organisation forEconomic Co-operation and Development (OECD).
The identification of copyright industries is a difficult task, with activity spanning a number of industrydivisions, such as manufacturing, wholesale and retail trade, property and business services, cultural andrecreational services, and personal and other services. While portions of industries such as printing andrecorded media manufacturing are readily identifiable, the product of some portions of other industries,such as architecture and advertising, are often subsumed within broader industry categories.
In undertaking this study we have disaggregated Australia’s copyright industries into three clusters —core, partial and distribution copyright industries:
• the core industries encompass those industries that create copyright works as their primary product.These include the motion picture industry, the recording industry, the music publishing industry, thebook, journal and newspaper publishing industry, the computer software industry (including dataprocessing, business applications and interactive entertainment software on all platforms), music andtheatre productions, photography, commercial art and display services, and the radio, television andcable broadcasting industries;
• the second group comprises the partial copyright industries. Unlike the core industries, only a portionof these industries’ product is associated with the creation of copyright works. These industriesinclude paper stationery manufacturing (which includes the manufacturing of calendars, greetingcards, etc), architecture, surveying and advertising services; and
• the third group, distribution, includes the industries involved in the distribution of copyrightmaterials to businesses and consumers. These industries include portions of the wholesale and retailtrade sectors, information storage and retrieval services, film and video distribution, libraries,museums and video hire outlets.
Further information as to the composition of these three clusters is in Appendix A.

The Economic Contribution of Australia’s Copyright Industries 3
2.2 The Conservative Nature of the Definition of Australia’s CopyrightIndustries
Previous studies of copyright industries have been subject to a degree of criticism for establishingdefinitions that may be said to inflate the perceived value of copyright.5
A number of limitations and conservative assumptions suggest that such criticisms are not applicable withrespect to this study:
• the value of copyright in intermediate goods and services is not included. Many organisations producecopyright materials as intermediate goods which are not explicitly accounted for in official surveys.Examples may include internal databases, manuals for equipment and processes, teaching materials,movies, pictures, and so on;
• there is always the possibility that changes to firms and industry structures may cause shifts inestimates from year to year. For example, there is significant convergence within and across industrysectors, creating high-profile multi-disciplinary practices.6 This convergence can result in thereclassification of individual firms from one sector to another (eg, from software to hardware).Reclassification can also occur due to changes in the primary activities of a company’s establishments,as well as shifts in a firm’s organisational structure (eg, mergers and acquisitions, divestitures, etc).This has the potential to significantly alter industry totals for important economic variables;
• production of pirated copyright products is not included;
• copyright goods and services produced for an intention other than ‘sale’ (directly or indirectly) are notincluded. For example, over the past five or so years there has been a boom in the creation of Internethome pages by people as a hobby. While these pages are of some value as a consumption good, theirproduction is unpriced and hence unmeasured;7 and
• unlike the recent United States (US) copyright study, we have not included a fourth cluster ofcopyright industries associated with the manufacturing of computers, radios, televisions andconsumer recording and listening devices the copyright-related industries.8 This cluster was notincluded in this Australian study because the collection of data on these industries in Australia is notdisaggregated to a level which would result in credible figures.9
Given these limitations and conservative assumptions, the measures of the economic importance ofcopyright industries in this study will consistently understate the importance of copyright to theAustralian economy. This is regrettable, but is necessary given the data limitations and the need for areliable estimate.
5 Revesz, J, "Trade-Related Aspects of Intellectual Property Rights", Staff Research Paper (Productivity Commission, Canberra, 1999). See
also Ricketson, S, Intellectual Property Administration and Policy in Australia: An Examination of the Australian Situation, Past andPresent, and Recommendations for Future Change (Faculty of Law, Monash University, Melbourne, 2000).6 The Allen Consulting Group, "Creating Value by Transforming Knowledge: Australia's Business and Professional Services Sector"
(Department of Industry, Science and Resources and Austrade, Canberra, 2001).7 There are, however, some ways in which such works are captured in this study. For example, production by Internet Service Providers
(ISPs) is included, as they manage and host intellectual property, some of which will include these ‘hobby’ creations.8 Siwek, S E, Copyright Industries in the U.S. Economy: The 2000 Report (International Intellectual Property Alliance, Washington DC,
2000).9 In any event, these copyright-related industries are not major industries in Australia, and would be unlikely to make a significant
contribution to the findings.

4 The Economic Contribution of Australia’s Copyright Industries
Section Three
The Value Added by Australia’s CopyrightIndustries
In 1999–2000 Australia’s copyright industries contributed $19.2 billion in industry gross product (IGP) tothe nation’s GDP.10
Figure 3.1 illustrates the relative contributions of the three copyright clusters.
Figure 3.1 — The Relative Value of the Three Copyright Clusters (1999–2000)
Copyright Distribution Industries (24%)
Partial Copyright Industries (25%)
Core Copyright Industries (51%)
Source: IBISWorld
As shown in Figure 3.2, the contribution of Australia’s copyright industries has increased from $15.6billion in 1996–97 to $19.2 billion in 1999–2000, representing an average annual growth rate of5.7 percent. The major copyright sectors performed in the following ways:
• the contribution of the core copyright industries increased from around $7.9 billion in 1995–96 to$9.7 billion in 1999–2000, representing a 23 percent increase over this period;
• the partial copyright industries recorded the fastest growth rate (31 percent) between 1995–96 and1999–2000, increasing from $3.7 billion to in excess of $4.8 billion; and
• the contribution of the distribution industries increased from $4 billion in 1995–96 to $4.6 billion in1999–2000. This was the slowest growing sector of Australia’s copyright industries.
10
Section A2 in Appendix A explains why IGP was used as a measure in preference to industry value added (IVA).

The Economic Contribution of Australia’s Copyright Industries 5
Figure 3.2 — The Value of Australia’s Copyright Industries (1999–2000)
1994/95 1995/96 1996/97 1997/98 1998/99 1999/00$0
$2,000
$4,000
$6,000
$8,000
$10,000
$12,000
$14,000
$16,000
$18,000
$20,000
Core Copyright Industries
Partial Copyright Industries
Distribution Industries
$ Million
Source: IBISWorld
To provide some idea as to the relative contribution to the value of the copyright industries, Table 3.1breaks down the copyright industries’ gross product for 1999–2000.

6 The Economic Contribution of Australia’s Copyright Industries
Table 3.1 — Gross Industry Product for Copyright Component of Each Copyright Industry ($million 1999–2000)
Core Copyright Industries $M Partial Copyright Industries $M Copyright Distribution Industries $M
Newspaper Printing or Publishing 2,981 Printing 1,975 Newspaper, Book & StationaryRetailing
828
Free to Air TV 1,392 Architectural Services 538 Paper Product Wholesaling 650
Data Processing Services 950 Paper Stationery Manufacturing 526 Libraries 429
Television Services 926 Surveying Services 377 Motion Picture Exhibition 361
Film & Video Production 577 Advertising Services 245 Photographic Film Processing 328
Creative Arts 486 Services to Printing 241 Book & Magazine Wholesaling 269
Book and Other Publishing 425 Toy and Sporting GoodManufacturing
61 Film and Video Distribution 264
Other Periodical Publishing 371 Computer and Software Retailing 234
Radio Services 330 Museums 224
Recorded Media Manufacturing 318 Video Hire Outlets 180
Music & Theatre Production 266 Performing Arts Venues 134
Commercial Art & Display Services 238 Information Storage and RetrievalServices
131
Photographic Studios 172 Recorded Music Retailing 117
Internet Service Providers 121 Photographic Equipment Retailing 116
Pay TV 100 Photographic Equipment Wholesaling 106
Sound Recording Studios 26 Toy and Sporting Good Wholesaling 94
Services to the Arts 82
Toy and Game Retailing 36
Total Core 9,679 Total Partial 3,963 Total Distribution 4,583
Source: IBISWorld
Figure 3.3 sets out the average Industry Gross Product (IGP) growth rates by industry sector between1995–96 and 1999–2000. Although the various copyright industries are contained within the broaderindustry sectors, for comparison they have also been included as a separate category.
Figure 3.3 — Average Industry Growth Rates (1995–96 to 1999–2000)
Manufacturing
Cultural and Recreation Services
Mining
Retail Trade
Personal and Other Services
Agriculture, Forestry and Fishing
Wholesale Trade
Copyright Industries
Accommodation, Cafes and Restaurants
Construction
Property and Business Services
Finance and Insurance
Communication Services
0% 2% 4% 6% 8% 10% 12% 14%
Source: IBISWorld

The Economic Contribution of Australia’s Copyright Industries 7
Figure 3.3 shows that, with a growth rate of 5.7 percent, Australia’s copyright industries are one of thefastest-growing sectors of the economy. The growth experienced by the copyright industries has exceededthe average annual growth rate of the economy at large (4.85 percent per year), as well as of key sectorssuch as:
• agriculture, forestry and fishing (5.1 percent);
• wholesale trade (5.6 percent);
• personal and other services (4.4 percent); and
• cultural and recreation services (2.9 percent).
Figure 3.4 shows that the value-added contribution of Australia’s copyright industries continues toincrease (rising from 2.2 percent of GDP in 1980–81 to 3.3 percent in 1999–2000).11
Figure 3.4 — Copyright Industries’ Contribution to GDP
Contribution
to GDP
1980-81 1985-86 1992-93 1995-96 1999-000%
1%
2%
3%
4%
Source: IBISWorld and Guldberg, H H, Copyright: An Economic Perspective (2nd ed., Australian Copyright Council, Sydney, 1994)
These findings are comparable to similar studies conducted in other countries. For example:
• a US study found that in 2000, core, partial and distribution copyright industries accounted forapproximately 4.2 percent of GDP;12 and
• a New Zealand study found that in 1994 value-added associated with copyright (ie, non-design)industries as a percentage of GDP was between 3.2 and 3.3 percent.13
11
Comparisons are drawn with results presented in: Guldberg, H H and Candi, E, Copyright – An Economic Perspective (AustralianCopyright Council, Sydney, 1987); Guldberg, H H, Copyright: An Economic Perspective (2nd ed., Australian Copyright Council, Sydney,1994). Cross-study findings should be treated with caution, as different studies include different definitions of what precisely constitutes acopyright industry, different data sources and methods may be used, and different measures of value-adding contributions may be reliedupon.12
Siwek, S E, Copyright Industries in the U.S. Economy: The 2000 Report (International Intellectual Property Alliance, Washington DC,2000).

8 The Economic Contribution of Australia’s Copyright Industries
Section Four
Employment in Australia’s Copyright Industries
The identification of the number of employees in the copyright industries can be undertaken in two ways:
• by analysing the results of occupational classifications obtained from the ABS Census. While thisapproach, used in Guldberg’s 1994 study of employment in the Australian copyright industries, cangenerate meaningful observations about occupational employment levels and salaries, we consideredit inappropriate for this study given that the last Census was conducted in 1996 and would have datedsignificantly;14 or
• by analysing the results of the ABS’s regular labour force survey. This is the approach adopted for thisreport.
In June 2000 3.8 percent of Australia’s workforce are employed in copyright industries. When comparedwith Australia’s larger employment sectors — eg, retail trade (11.8 percent) and manufacturing(12.2 percent) — the copyright industries may appear relatively small. However, employment in thecopyright industries is comparable to employment levels in sectors such as government administrationand defence, and personal and other services.
As shown in Figure 4.1, employment in the copyright industries has grown from around 312,000 in1995–96 to nearly 345,000 in 1999–2000, representing a average annual growth rate of 2.7 percent.
Figure 4.1 — Employment in the Copyright Sector
1995/96 1996/97 1997/98 1998/99 1999/000
100
200
300
400
Core Copyright Industries
Partial Copyright Industries
Distribution Industries
Persons
('000)
Source: IBISWorld
13
Harris, F and Stroombergen, A, A Statistical Analysis of the Economic Contribution of Copyright Based Industries (Copyright Councilof New Zealand, Wellington, 1997).14
Another Census has recently been conducted, but the results were not available when this study was completed.

The Economic Contribution of Australia’s Copyright Industries 9
The major trends in copyright employment evident in the period 1995-96 to 1999–2000 are:
• the partial copyright sector experienced the fastest growth in employment, increasing from over63,000 to around 74,000 between 1995–96 and 1999–2000 (an average annual growth rate of4.4 percent);
• employment in the core copyright sector grew by nearly 20,000 between 1995–96 and 1999–2000 toreach nearly 148,000 persons; and
• growth in employment in the distribution copyright industries was minimal, even falling slightly in1997–98 and 1999–2000. To some degree this stagnation (and temporary decline) in employment inthe copyright distribution sector may be attributable to the uptake of e-commerce as a means ofdistributing copyright products.15
The employment growth has been driven by a number of factors, including:
• a 5.7 percent average annual growth rate in employment in the cultural and recreation servicessector, which includes a large number of copyright industries, such as:
• film and video production (growth of 13.7 percent per year);
• pay television (growth of 50 percent per year);
• copyright-intensive industries such as data processing (10.6 percent growth per year), computerconsultancy (12.2 percent growth per year) and information storage and retrieval services (17 percentgrowth per year) have been key drivers behind the 6.8 percent average annual growth in the propertyand business services sector.
Even with the overall growth in employment of the copyright sector undermined by the limited growth ofthe distribution industries, employment in the copyright industries is one of the fastest-growing sectors ofthe economy (see Figure 4.2).16 Employment in the copyright industries increased at an average annualrate of 2.7 percent over the period 1995–96 to 1999–2000 in comparison with the 2 percent averageannual growth rate attained in the Australian economy as a whole.17
Figure 4.2 — Average Annual Employment Growth (1995-96 to 1999-2000)
Agriculture, Forestry, and Fishing
Retail trade
Manufacturing
Personal and Other Services
Communication Services
Copyright Industries
Health and Community Services
Construction
Accommodation, Cafes and Restaurants
Cultural and Recreational Services
Property and Business Services
0% 2% 4% 6% 8%
Source: IBISWorld
15
See The Allen Consulting Group, E-Commerce Across Australia (National Office for the Information Economy and Department ofCommunications Information Technology and the Arts, Canberra, 2000).16
Although the various copyright industries are contained within the broader industry sectors, they have also been included as a separatecategory for comparison purposes.17
In 1994 Guldberg also found that total employment in Australia’s copyright occupations grew faster than the total workforce between1986 and 1991, by 1.9 percent per annum compared with 1.8 percent. Over this period computing professionals became the largest singlegroup, increasing at an annual rate of 8.6 percent from 40,000 to over 60,000. However, as previously established, only a proportion ofactivity is associated with the creation of copyright material; Guldberg acknowledged that “we cannot assume that every person engagesprimarily in copyright activities”. It is therefore highly likely that the inclusion of all employment in this, and other sectors, has resulted inoverestimates of the levels and subsequent growth rate in employment in copyright industries in Australia.

10 The Economic Contribution of Australia’s Copyright Industries
Comparison of these results with similar overseas studies are illuminating:
• the recent study for the US International Intellectual Property Alliance (IIPA) found that copyrightindustries in the US have created jobs at a much faster rate than many leading sectors of the USeconomy.18 In 1999 employment in the core copyright industries increased to around 5.7 percent ofthe US workforce.19 The growth in employment in copyright industries in the US is significantlyhigher than the growth rates experienced in Australia, with average annual growth rates between 1996and 1999 of 7 percent for core industries, 3.6 percent for partial industries and 2.9 percent fordistribution industries; and
• the 1997 study of New Zealand’s copyright industries reported that employment in copyrightindustries accounted for 1.8 percent of all employment in New Zealand in 1996. However, oncedesign-based occupations (ie, occupations not covered by copyright law in Australia) are excluded, thisfigure falls to 1.6 percent of all employment.
18
Siwek, S E, Copyright Industries in the U.S. Economy: The 2000 Report (International Intellectual Property Alliance, Washington DC,2000).19
With an adjustment to account for the inclusion of employment in the copyright-related industries, this figure is closer to 5.3 percent.

The Economic Contribution of Australia’s Copyright Industries 11
Section Five
International Trade in Copyright Material
With falling trade barriers and increasing cross-border trade facilitated by electronic distribution, it isincreasingly important to consider the nature of trade in the copyright industries.
To develop a bottom-line figure on the value of copyright imports and exports three steps are necessary.
The first step is to identify the trade in goods and services in the copyright sectors (ie, excluding royaltiesnot attached to goods or services).
Figure 5.1 shows the value of exports. Since 1995–96 exports of copyright merchandise have increased by$316 million, to reach a value of $1.2 billion in 1999–2000. This represents an average annual growth rateof around 9 percent. Noticeable trends include:
• 300 percent growth in exports of the distribution sector — we should not be carried away by thisphenomenal growth given the low base from which it started; and
• an increase of $256 million in exports of the core copyright sector. This was led by substantialincreases in the printing, publishing and recorded media industries (which includes the massproduction of computer software) and film and video production.
Figure 5.1 — Exports of Copyright Goods and Services ($million)
$582
$293
$4
$618
$319
$7
$659
$321
$10
$783
$302
$13
$839
$342
$16
1995-96 - $879m 1996-97 - $944m
1997-98 - $990m 1998-99 - $1.1b
1999-00 - $1.2bCore Copyright Industries
Partial Copyright Industries
Distribution Copyright Industries
Source: IBISWorld

12 The Economic Contribution of Australia’s Copyright Industries
In comparison, Figure 5.2 sets out merchandise imports of copyright material for the years 1995–96 to1999–2000.
Figure 5.2 — Imports of Copyright Goods and Services ($billion)
$2048
$629 $13
$1998
$642 $14
$2421
$680 $17
$2713
$690$20
$2645
$749 $23
1995-96 - $2.7b 1996-97 - $2.7b
1997-98 - $3.1b 1998-99 - $3.4b
1999-00 - $3.4bCore Copyright Industries
Partial Copyright Industries
Distribution Copyright Industries
Source: IBISWorld
As shown, imports increased by $728 million up to 1998–99, but actually decreased by around $6 millionto 1999–2000. This was due to a significant contraction in imports in the recorded media manufacturingsector, of around $150 million. Other significant trends include:
• an annual growth rate of 17 percent in the distribution sector; and
• an annual growth rate of around 4.8 percent in the partial copyright industries.

The Economic Contribution of Australia’s Copyright Industries 13
Although Australia continues to remain a net importer of copyright material, the growth rate in exportscontinues to significantly outstrip the growth rate of imports. For example, over the period 1995–96 to1999–2000:
• export revenue from the core copyright sector increased by 44 percent, while the value of importsincreased by around 29 percent;
• export revenue from the distribution sector increased by 300 percent, while the value of importsincreased by around 77 percent; and
• these figures have contributed to a total growth rate in revenue from copyright materials in excess of36 percent and a total growth rate of around 27 percent for revenues paid for copyright materials.
The second step is to identify the flow of copyright royalties (ie, those royalties not embedded in the priceof a physical good or service). With estimates of trade in royalties and licence fees reported annually by theABS,20 Table 5.1 shows the flows of copyright royalties.
The third step is to combine the merchandise and service flows with the royalty flows. This was done in amanner consistent with Revesz’ methodology.21
Table 5.1 — Trade in Royalties ($million)
1995–96 1996–97 1997–98 1998–99 1999–00
Royalty Income 260 268 307 370 444
Royalty Expenditure 490 601 636 710 843
Net Flow -230 -333 -327 -340 -399
Source: Australian Bureau of Statistics
20
See Australian Bureau of Statistics, "Balance of Payments and International Investment Position, Australia" Catalogue No. 5363.0(AGPS, Canberra, 1998–99).21
Revesz, J, "Trade-Related Aspects of Intellectual Property Rights", Staff Research Paper (Productivity Commission, Canberra, 1999).
14 The Economic Contribution of Australia’s Copyright Industries
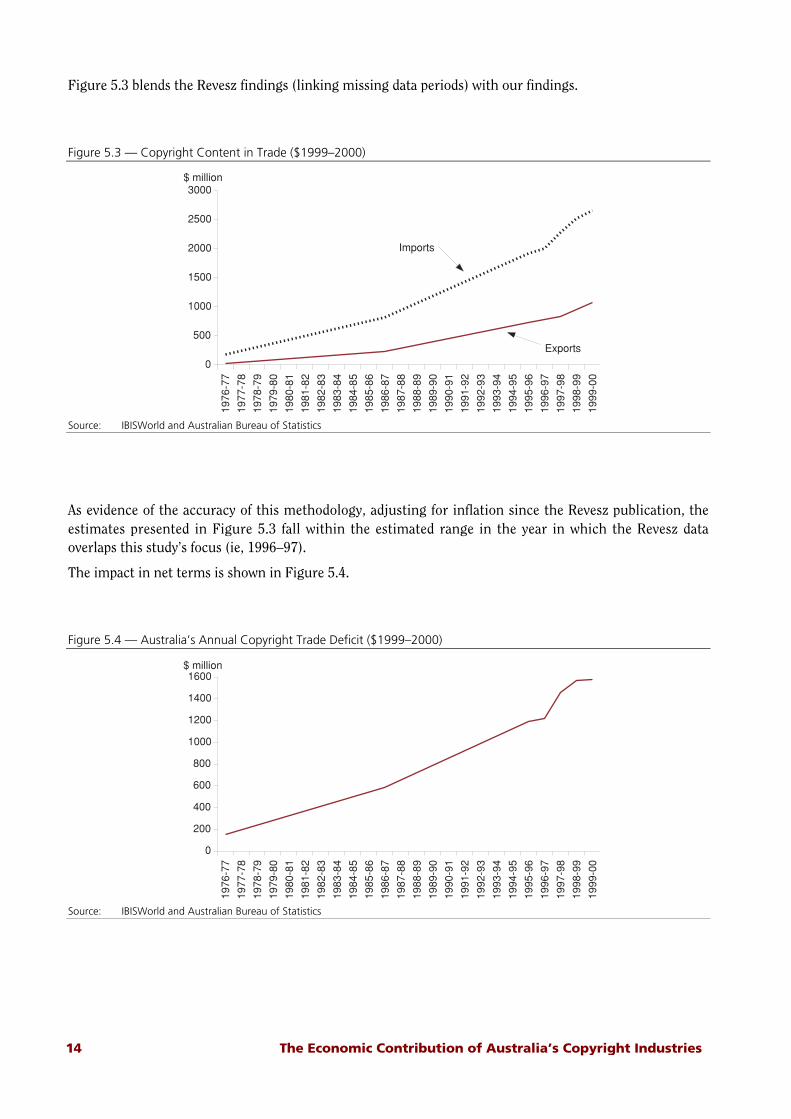
Figure 5.3 blends the Revesz findings (linking missing data periods) with our findings.
Figure 5.3 — Copyright Content in Trade ($1999–2000)
1976
-77
1977
-78
1978
-79
1979
-80
1980
-81
1981
-82
1982
-83
1983
-84
1984
-85
1985
-86
1986
-87
1987
-88
1988
-89
1989
-90
1990
-91
1991
-92
1992
-93
1993
-94
1994
-95
1995
-96
1996
-97
1997
-98
1998
-99
1999
-00
0
500
1000
1500
2000
2500
3000
Imports
Exports
$ million
Source: IBISWorld and Australian Bureau of Statistics
As evidence of the accuracy of this methodology, adjusting for inflation since the Revesz publication, theestimates presented in Figure 5.3 fall within the estimated range in the year in which the Revesz dataoverlaps this study’s focus (ie, 1996–97).
The impact in net terms is shown in Figure 5.4.
Figure 5.4 — Australia’s Annual Copyright Trade Deficit ($1999–2000)
1976
-77
1977
-78
1978
-79
1979
-80
1980
-81
1981
-82
1982
-83
1983
-84
1984
-85
1985
-86
1986
-87
1987
-88
1988
-89
1989
-90
1990
-91
1991
-92
1992
-93
1993
-94
1994
-95
1995
-96
1996
-97
1997
-98
1998
-99
1999
-00
0
200
400
600
800
1000
1200
1400
1600$ million
Source: IBISWorld and Australian Bureau of Statistics
The Economic Contribution of Australia’s Copyright Industries 15
Appendix A
Methodology
This section comments on the methodology employed in the preparation of this report and theassumptions made.
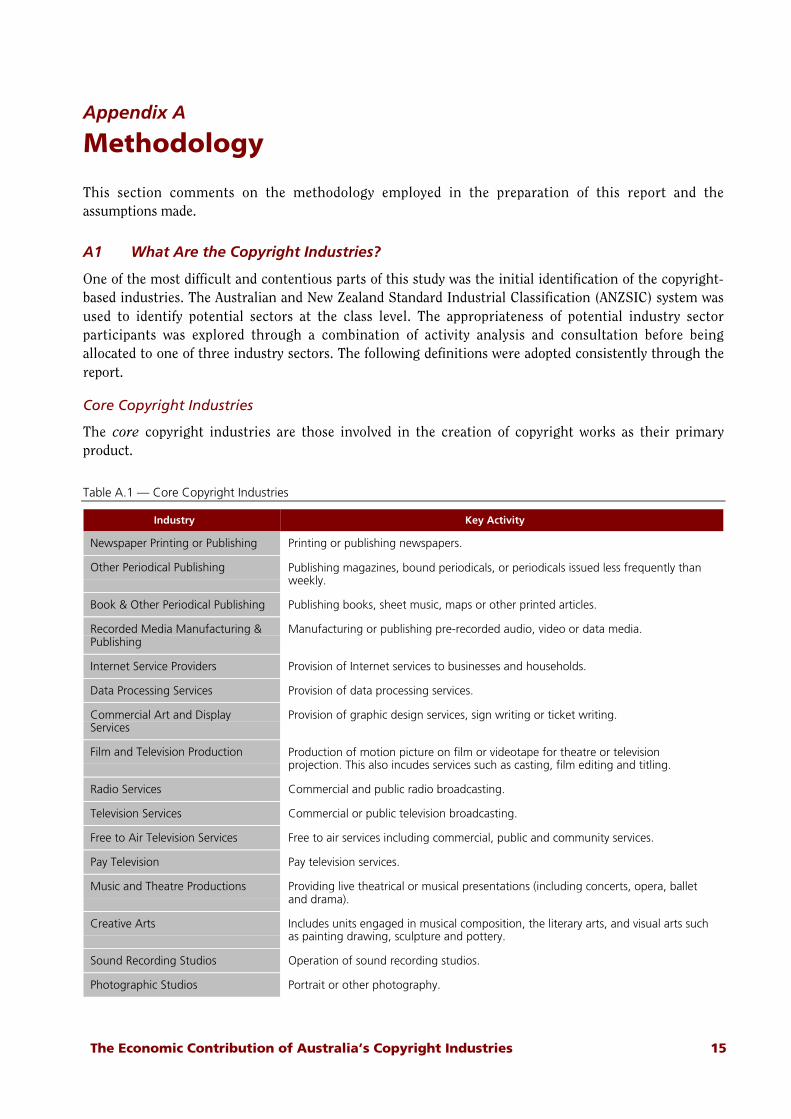
A1 What Are the Copyright Industries?
One of the most difficult and contentious parts of this study was the initial identification of the copyright-based industries. The Australian and New Zealand Standard Industrial Classification (ANZSIC) system wasused to identify potential sectors at the class level. The appropriateness of potential industry sectorparticipants was explored through a combination of activity analysis and consultation before beingallocated to one of three industry sectors. The following definitions were adopted consistently through thereport.
Core Copyright Industries
The core copyright industries are those involved in the creation of copyright works as their primaryproduct.
Table A.1 — Core Copyright Industries
Industry Key Activity
Newspaper Printing or Publishing Printing or publishing newspapers.
Other Periodical Publishing Publishing magazines, bound periodicals, or periodicals issued less frequently thanweekly.
Book & Other Periodical Publishing Publishing books, sheet music, maps or other printed articles.
Recorded Media Manufacturing &Publishing
Manufacturing or publishing pre-recorded audio, video or data media.
Internet Service Providers Provision of Internet services to businesses and households.
Data Processing Services Provision of data processing services.
Commercial Art and DisplayServices
Provision of graphic design services, sign writing or ticket writing.
Film and Television Production Production of motion picture on film or videotape for theatre or televisionprojection. This also incudes services such as casting, film editing and titling.
Radio Services Commercial and public radio broadcasting.
Television Services Commercial or public television broadcasting.
Free to Air Television Services Free to air services including commercial, public and community services.
Pay Television Pay television services.
Music and Theatre Productions Providing live theatrical or musical presentations (including concerts, opera, balletand drama).
Creative Arts Includes units engaged in musical composition, the literary arts, and visual arts suchas painting drawing, sculpture and pottery.
Sound Recording Studios Operation of sound recording studios.
Photographic Studios Portrait or other photography.

16 The Economic Contribution of Australia’s Copyright Industries
Partial Copyright Industries
Only a proportion of these industries’ activity is associated with the creation of copyright works. Theportion attributable to each industry was derived after:
• an analysis of the components that make up each sector and the scale of activity associated with eachcomponent;
• consideration of the ratios used in the New Zealand study of the copyright industries;22 and
• consultation with representative stakeholders (see section A3 in this appendix).
Table A.2 — Partial Copyright Industries
Industry Proportion ofActivity
Description
Printing 60% Commercial or job printing, including printing ontotextiles or other surfaces.
Services to Printing 95% Artwork preparation, bookbinding, phototypesetting,screenprinting manufacturing, etc.
Paper Stationery Manufacturing 90% Manufacturing of paper stationery including albums,calendars, games, greeting cards, etc.
Toy and Sporting Good Manufacturing 48% Manufacturing of sporting equipment (except vehicle,clothing and footwear) and toys made from all materialsexcept fur or leather.
Architectural Services 30% Architectural services.
Computer Consultancy Services 25% Includes computer consultancy services, computersystems analysis or computer programming services.
Surveying Services 75% Surveying services (excluding exploration surveyingservices on contract).
Advertising Services 33% Providing advertising (except sale of advertising space intheir own publications or broadcasts).
22
Harris, F and Stroombergen, A, A Statistical Analysis of the Economic Contribution of Copyright Based Industries (Copyright Councilof New Zealand, Wellington, 1997).
The Economic Contribution of Australia’s Copyright Industries 17
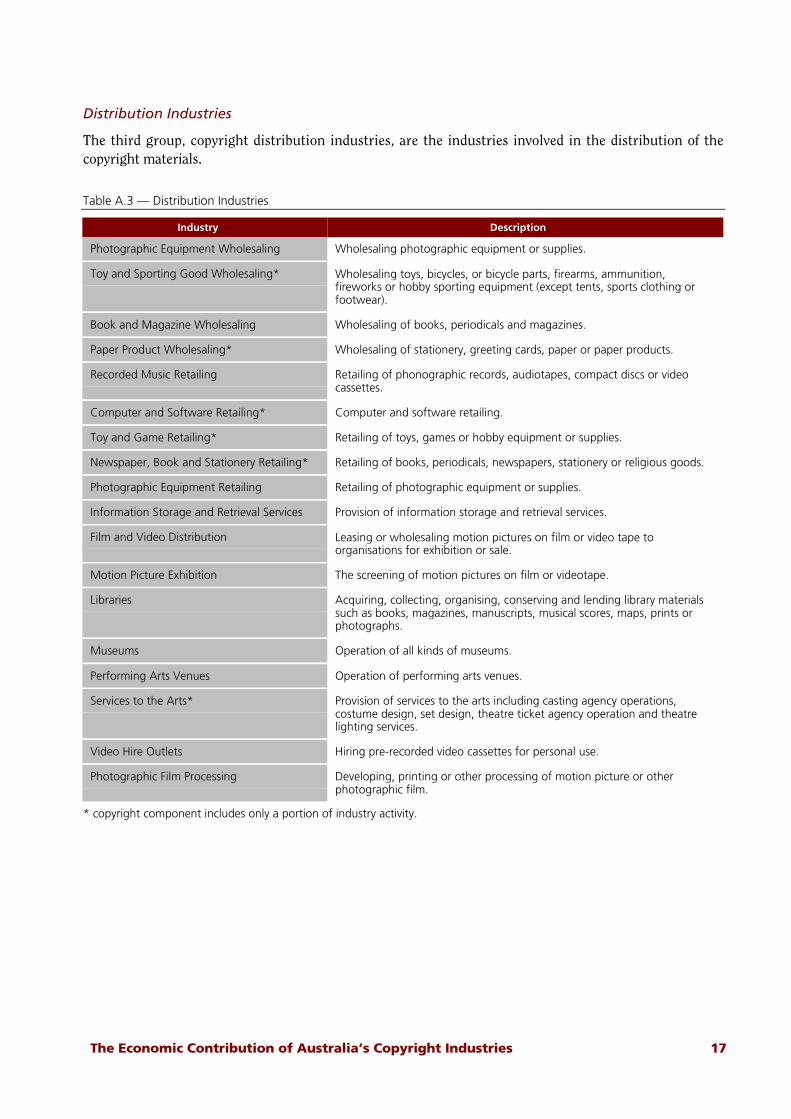
Distribution Industries
The third group, copyright distribution industries, are the industries involved in the distribution of thecopyright materials.
Table A.3 — Distribution Industries
Industry Description
Photographic Equipment Wholesaling Wholesaling photographic equipment or supplies.
Toy and Sporting Good Wholesaling* Wholesaling toys, bicycles, or bicycle parts, firearms, ammunition,fireworks or hobby sporting equipment (except tents, sports clothing orfootwear).
Book and Magazine Wholesaling Wholesaling of books, periodicals and magazines.
Paper Product Wholesaling* Wholesaling of stationery, greeting cards, paper or paper products.
Recorded Music Retailing Retailing of phonographic records, audiotapes, compact discs or videocassettes.
Computer and Software Retailing* Computer and software retailing.
Toy and Game Retailing* Retailing of toys, games or hobby equipment or supplies.
Newspaper, Book and Stationery Retailing* Retailing of books, periodicals, newspapers, stationery or religious goods.
Photographic Equipment Retailing Retailing of photographic equipment or supplies.
Information Storage and Retrieval Services Provision of information storage and retrieval services.
Film and Video Distribution Leasing or wholesaling motion pictures on film or video tape toorganisations for exhibition or sale.
Motion Picture Exhibition The screening of motion pictures on film or videotape.
Libraries Acquiring, collecting, organising, conserving and lending library materialssuch as books, magazines, manuscripts, musical scores, maps, prints orphotographs.
Museums Operation of all kinds of museums.
Performing Arts Venues Operation of performing arts venues.
Services to the Arts* Provision of services to the arts including casting agency operations,costume design, set design, theatre ticket agency operation and theatrelighting services.
Video Hire Outlets Hiring pre-recorded video cassettes for personal use.
Photographic Film Processing Developing, printing or other processing of motion picture or otherphotographic film.
* copyright component includes only a portion of industry activity.
18 The Economic Contribution of Australia’s Copyright Industries
A2 Measures of an Industry’s Economic Contribution
It is frequently argued that Industry Value Added (IVA) is the most appropriate measure for determiningan industry’s contribution to the economy.23
IVA is the net contribution of an industry to GDP after deducting the cost of raw materials, fuel, powerand other purchases from the industry’s turnover. Thus IVA largely consists of the wages and salaries andoperating surplus of an industry.
Although IVA is a well-recognised measure of an industry’s economic contribution, there are significantlimitations associated with its use in this study at this time:
• historically, the economic contribution of Australian industries has not been measured uniformlyacross all industry sectors, with the contribution of some industries prior to 1997–98 being reportedas Industry Gross Product (IGP) as opposed to IVA;24 and
• a lack of comprehensive and reliable data on IVA at the required ANZSIC class levels would haveundermined the accuracy of this study and distorted the estimated contribution of Australia’scopyright industries.
As a result of these limitations, the value of Australia’s copyright industries has been measured in thisreport in terms of Industry Gross Product (IGP).
There is a strong correlation between IGP and IVA. The relationship can be expressed in these terms:
IVA + intellectual property royalty expenses - intellectual property royalty income - computer softwareexpenses not capitalised by the business - selected indirect taxes
25 = IGP
There can be expected to be some difference between IVA and IGP. Indeed, we estimate that IGP is, onaverage, 94 percent of the IVA figure. In practice, however, people tend to refer to both IVA and IGP asmeasures of value adding, and in some instances refer to IGP and IVA interchangeably.
Comparisons with other industry sectors and the broader economy were undertaken using Chain VolumeMeasures with a reference year of 1999-2000 (the most recent data).
23
See Guldberg, H H, Copyright: An Economic Perspective (2nd ed., Australian Copyright Council, Sydney, 1994); Siwek, S E, CopyrightIndustries in the U.S. Economy: The 2000 Report (International Intellectual Property Alliance, Washington DC, 2000).24
For periods prior to 1997–98, estimates of IGP represented the measure of the contribution by some industries to gross domesticproduct (GDP). However, commencing with estimates for 1997–98, following the introduction of new international standards for measuringeconomic variables in these industries, IGP was replaced by the variable IVA. Thus reports subsequent to this should be able to accuratelyuse IVA as the basis for measurement.25
For manufacturing industries, the main types are fringe tax, payroll tax, land rates and land taxes.

The Economic Contribution of Australia’s Copyright Industries 19
A3 Data Sources
In compiling this report The Allen Consulting Group used published and unpublished data from a varietyof sources, including:
• the ABS; and
• IBISWorld — this private sector information provider supplements ABS statistics with a series ofongoing business surveys.
Supplementing these data sources, in order to provide an accurate estimate of the contribution ofcopyright industries to the Australian economy, The Allen Consulting Group consulted with a number ofindustry associations and other bodies, including:
• Advertising Federation of Australia;
• Association of Consulting Surveyors Queensland;
• Australasian Performing Right Association;
• Australia Council;
• Australian Bureau of Statistics;
• Australian Film Commission;
• Australian Film Finance Corporation;
• Australian Information Industry Association;
• Australian Institute of Professional Photography;
• Australian Interactive Multimedia Industry Association;
• Australian Record Industry Association;
• Australian Subscription TV & Radio Association;
• Australian Toy Association Limited;
• Australian Vice-Chancellors’ Committee;
• Consulting Surveyors Australia;
• Federation of Australian Radio Broadcasters;
• IBISWorld;
• Robert Turnbull Photography;
• Royal Australian Institute of Architects;
• Spatial Queensland; and
• Special Broadcasting Service (SBS).

20 The Economic Contribution of Australia’s Copyright Industries
Appendix B
References
Australian Bureau of Statistics, "Balance of Payments and International Investment Position, Australia",Catalogue No. 5363.0 (AGPS, Canberra, 1998-99).
Australian Coalition of Service Industries and McKinsey & Company, australia.com: Australia's FutureOnline (Australian Coalition of Service Industries, Melbourne, 1997).
Guldberg, H H and Candi, E, Copyright – An Economic Perspective (Australian Copyright Council,Sydney, 1987).
Guldberg, H H, Copyright: An Economic Perspective (2nd ed., Australian Copyright Council, Sydney,1994).
Harris, F and Stroombergen, A, A Statistical Analysis of the Economic Contribution of Copyright BasedIndustries (Copyright Council of New Zealand, Wellington, 1997).
Karnell, G, "Authors’ Rights and Copyright Economics" (1995) 26 International Review of IndustrialProperty and Copyright Law 193.
Revesz, J, "Trade-Related Aspects of Intellectual Property Rights", Staff Research Paper (ProductivityCommission, Canberra, 1999).
Ricketson, S, Intellectual Property Administration and Policy in Australia: An Examination of theAustralian Situation, Past and Present, and Recommendations for Future Change (Faculty of Law,Monash University, Melbourne, 2000).
Siwek, S E, Copyright Industries in the U.S. Economy: The 2000 Report (International IntellectualProperty Alliance, Washington DC, 2000).
The Allen Consulting Group, "Creating Value by Transforming Knowledge: Australia's Business andProfessional Services Sector" (Department of Industry, Science and Resources and Austrade, Canberra,2001).
---, E-Commerce Across Australia (National Office for the Information Economy and Department ofCommunications Information Technology and the Arts, Canberra, 2000).

