the economic costs of stunting - world...
TRANSCRIPT


The Economic Costs of Stunting and How to Reduce Them*
Emanuela Galasso and Adam Wagstaff with
Sophie Naudeau and Meera Shekar
Approved for Distribution by Kaushik Basu
September 22, 2016
DISCLAIMER: Policy Research Notes represent the views of the authors and do not necessarily represent WBG views or policy. The views expressed herein should be attributed to the authors and not to the WBG, its Board of Executive Directors, or its management.
Authors’ email addresses: [email protected] [email protected] [email protected] [email protected]
* This note was prepared under the supervision of Asli Demirguc-Kunt, Director of the Development Research Group. The authors thank Harold Alderman for his thorough review of the note, and Jishnu Das, Deon Filmer, Jed Friedman, Aart Kraay, Roberta Gatti, Julie McLaughlin and David Rosenblatt for helpful comments and conversations, Amer Hasan, Bruno Besbas, John Giles, Berk Ozler and Firman Witoelar for sneak previews of their ongoing work, and Imran Hafiz for help with the bibliography.
Policy Research Notes (PRNs) are prepared under the direction of the World Bank Chief Economist and Senior Vice President for Development Economics. PRNs combine and distill existing and new research to inform discussion on topical policy issues. They are aimed at a broad audience interested in economic policy.

Contents EXECUTIVE SUMMARY ......................................................................................................................................................... 5
I. INTRODUCTION .............................................................................................................................................................. 8
II. GLOBAL STUNTING LEVELS, TRENDS, AND TARGETS .................................................................................. 9
A. Levels of stunting around the world ............................................................................................................... 10
B. Trends in stunting and global targets ............................................................................................................. 10
III. THE COSTS OF STUNTING: PATHWAYS ........................................................................................................ 14
A. Costs associated with reduced cognitive capacity and educational attainment ........................... 14
B. Costs associated with reduced height ............................................................................................................ 16
C. Costs associated with impaired health........................................................................................................... 16
D. Costs associated with worse ‘marriage market’ outcomes .................................................................... 17
E. Overall costs to stunting in early childhood – previous studies .......................................................... 17
IV. ESTIMATES OF THE COSTS OF STUNTING .................................................................................................. 18
A. Methods ....................................................................................................................................................................... 18
B. Parameters ................................................................................................................................................................. 20
C. Results ................................................................................................................................................................ ......... 24
V. NUTRITION-SPECIFIC PROGRAMS AND THEIR EFFECTS – A REVIEW ................................................ 27
A. Nutrition-specific interventions – evidence on impacts on stunting ................................................ 27
B. Positive experiences with nutrition-specific programs .......................................................................... 31
C. Nutrition-specific interventions – evidence on impacts on cognition .............................................. 32
VI. THE ECONOMIC RETURNS TO A NUTRITION PROGRAM ...................................................................... 33
A. The Bhutta et al. nutrition package ................................................................................................................. 33
B. Methods ....................................................................................................................................................................... 34
C. Parameters ................................................................................................................................................................. 35
D. Results ......................................................................................................................................................................... 37
E. Sensitivity analysis ................................................................................................................................................. 41
F. Comparisons with other studies of returns to nutrition investments .............................................. 42
VII. NUTRITION-SENSITIVE PROGRAMS TO ADDRESS STUNTING ........................................................... 42
A. Safety net schemes ................................................................................................................................................. 45
B. Nutrition-sensitive agricultural interventions ........................................................................................... 45
C. Water, sanitation and hygiene (WASH) interventions ............................................................................ 46
VIII. LOWERING THE COSTS OF STUNTING AND RAISING THE RETURNS TO NUTRITION INTERVENTIONS ................................................................................................................................................................... 47
A. Reducing the effects of stunting by delivering ECD interventions to stunted children ............. 48

B. Synergies and scope economies between nutrition and ECD interventions .................................. 49
IX. Conclusions ................................................................................................................................................................ 49
Tables
Table 1: Review of estimates of effects of stunting on height, schooling and cognition, and their effects on earnings ................................................................................................................................................................ 21 Table 2: Assumptions in estimating the cost of childhood stunting................................................................. 24 Table 3: Costs of childhood stunting among today’s workforce ........................................................................ 25 Table 4: Summary of meta-analyses of effects of nutrition-specific interventions on stunting and height .......................................................................................................................................................................................... 30 Table 5: Evidence on the effects of selected nutrition interventions on cognition .................................... 33 Table 6: Assumptions in estimating returns to nutrition program .................................................................. 35 Table 7: Rates of return to nutrition project, by region ........................................................................................ 39 Table 8: Sensitivity of results to assumptions ........................................................................................................... 42 Table 9: Summary of meta-analyses of effects of nutrition-sensitive interventions on stunting and height ................................................................................................................................................................ .......................... 44
Figures Figure 1: Stunting rates, latest year ............................................................................................................................... 11 Figure 2: Long-term association between stunting and GNI per capita, and latest values ..................... 12 Figure 3: Annual percentage reduction or increase in stunting rate, 1995-2015 ...................................... 13 Figure 4: Trend in stunting and WHA/SDG target ................................................................................................... 14 Figure 5: Conceptual framework for analysis of stunting costs and causes ................................................. 14 Figure 6: Brain development in early life .................................................................................................................... 15 Figure 7: Costs of childhood stunting among today’s workforce ...................................................................... 26 Figure 8: Reductions in stunting among today’s children and their effects on childhood stunting rates among the workforce in later years ................................................................................................................... 37 Figure 9: Time path of per capita costs and benefits of the nutrition program .......................................... 38 Figure 10: Rates of return to nutrition project, by country ................................................................................. 40

EXECUTIVE SUMMARY 1. In 2014, according to UNICEF, WHO and the World Bank, 171 million children under the age of
five were stunted. Loosely-speaking this means they were excessively short for their age. Statistically-speaking it means their height-for-age z-score (HAZ, as it is known) was less than 2 standard deviations below the median of a healthy reference population.
2. Rates of stunting among under-fives vary considerably around the world, from 57% in Burundi to less than 2% in Chile. Stunting rates† decline with per capita income, but the elasticity with respect to per capita GDP (i.e., how much a 1% increase in GDP per capita reduces the proportion of children who are stunted) is fairly low, lower, for example, than the poverty elasticity with respect to per capita GDP. Some large low- and middle-income countries – notably India, Indonesia, Pakistan, and Nigeria – have high stunting rates.
3. The estimated number of stunted under-fives has been falling, but relatively slowly – at around 1.5% p.a. On current trends, the reduction between 2010 and 2025 will be 20%, just half of the 40% target reduction set by the 65th World Health Assembly and incorporated into the Sustainable Development Goals (SDGs). Reaching the 40% target would require more than a doubling of the annual rate of reduction in stunting – from the current historical rate of 1.5% to 3.4%. p.a. Some countries have been more successful than others in reducing stunting: Argentina, Brazil, China, Iran, Senegal, Peru and Vietnam have achieved quite fast reductions in stunting; Eritrea, Pakistan and Papa New Guinea, by contrast, have all seen increases in stunting.
4. Stunting in childhood matters because it is associated with adverse outcomes throughout the life cycle. The undernourishment and disease that cause stunting impair brain development, leading to lower cognitive and socioemotional skills, lower levels of educational attainment, and hence lower incomes. Health problems in terms of non-communicable diseases are more likely in later life, leading to increased health care costs. Stunting in childhood also leads to reduced stature in adulthood, which, due to the persistence of shortness over the lifetime, and the negative (and independent) effect of height on income, further reduces income in adulthood.
5. Stunting among children today reduces a country’s future income per capita. By the same token, a country’s per capita income today is lower to the extent that some of its workers today were stunted in childhood. The average rate of childhood stunting of the current workforce will reflect childhood stunting rates over the period from around 50 years ago to around 15 years ago. If those in the current workforce who were stunted in childhood had not been, they would not have suffered impaired cognitive development during childhood, they would not have received less education, and they would have grown to a regular height. Their income today would have been higher by a percentage that reflects the education penalty associated with childhood stunting, the returns to education, the adult height penalty to childhood stunting, and the returns to height.
6. By reviewing studies quantifying these penalties and returns, and by finding out the age distribution of current workers so we can find out what fraction of current workers were
† We use ‘stunting rate’ throughout as shorthand for the ‘prevalence of stunting’.

stunted in childhood, we can quantify – using the method of ‘development accounting’ – the per capita income penalty a country incurs for not having eliminated stunting when today’s workers were children. We estimate that, on average, this per capita income penalty is around 7%. Africa and South Asia incur larger penalties – around 9-10% of GDP per capita.
7. Childhood stunting reflects inadequate food intake and repeated bouts of disease. It is clear what mothers can do to avoid both. However, systematic reviews and meta-analyses of the literature suggest that interventions aimed at helping mothers (e.g. breastfeeding promotion, education about complementary feeding, provision of vitamins and micronutrients) have had fairly modest impacts on stunting, although they do affect child mortality. Moreover, scaling-up these ‘nutrition-specific’ interventions has also proven a challenge, although some countries have managed to do so with impressive results, including most recently Peru and Senegal. These interventions are, however, relatively inexpensive, and the impact of stunting on income is sufficiently large to make nutrition-specific programs a potentially worthwhile investment.
8. To explore this, we estimate the impacts on stunting and the rate-of-return to scaling-up to 90% coverage, over a period of 10 years, a package of 10 nutrition-specific interventions in 34 countries, using estimates of costs and stunting impacts from a study by Bhutta et al.1 We focus on the lifetime productivity impact, allowing for the interventions to affect income through cognition and not just stunting, but not accounting for the benefits of the interventions in terms of lives saved. We assume that in the absence of the program stunting would have continued to fall at 1.5% p.a., cognition would have stayed constant, and per capita income would have grown following IMF forecasts. We adopt the same assumptions about the effects of stunting on education and height, and about the returns to education and height, as in the aforementioned development accounting exercise. We assume that teenagers join the workface at age 17 and work for 40 years thereafter, and that, per Bhutta et al., the program will reduce stunting by 20%.
9. Our estimates suggest that implementing the Bhutta et al. program, and factoring in the annual trend decline of 1.5% p.a., will leave the stunting rate in 2025 at 36% below to its 2010 value – 4 percentage points shy of the 40% target reduction adopted by the 65th World Health Assembly. We estimate a rate-of-return for the 34 countries as a whole of 17%, with a benefit-cost ratio of 15:1. East Asia & Pacific has the highest rate of return (24%) reflecting the low per capita program cost, the high rate of return to education, the high initial GDP per capita, and the high GDP growth rate. Africa is the region with the lowest rate of return (15%) reflecting the high per capita program cost, the relatively low initial GDP per capita, and the relatively low GDP growth rate; these numbers are offset only partly by the relatively high rate of return to education in Africa. There are variations within regions, of course: India, for example, has a rate of return of 23% reflecting in part India’s low program cost and its high GDP growth rate.
10. We explore the sensitivity of our results to our assumptions. Halving the assumed program effect on stunting from 20% to 10% reduces the benefit-cost ratio to 8:1 and the rate-of-return to 14%. The rate of stunting in 2025 would only be 28% below its 2010 value, 12 percentage points shy of the target 40% reduction. Making drastically more conservative assumptions all around (in addition to halving the program effect on stunting, halving the program effect on cognition and halving the effects of stunting on education and height, and doubling the program cost) would reduce the benefit-cost ratio to 3:1 and the rate of return to 9.5%. Even these are quite respectable figures.
11. Achieving the World Health Assembly – SDG target seems likely to require more than ‘nutrition-specific’ interventions. A variety of ‘nutrition-sensitive’ interventions that tackle the underlying determinants of malnutrition have been suggested, including water and sanitation (and complementary behavior change interventions), agriculture interventions, and safety net schemes (especially those targeted at pregnant women and children after natural disasters, and agroclimatic and macroeconomic shocks). Here again, however, systematic reviews and meta-analyses point to modest effects on stunting. Nonetheless, it seems likely that reducing stunting by the percentage proposed by the 65th World Health Assembly will require a multipronged approach, involving both nutrition-specific and nutrition-sensitive interventions, within the context of a holistic approach to maternal and childhood nutrition, and strong government commitment and capacity.
12. Last, the costs of stunting are not a fixture. Policymakers may be able to reduce, or at least limit, the costs of stunting, through psychosocial stimulation and other interventions aimed at promoting cognitive, language and socio-emotional development, going beyond the first 1,000 days where the potential impacts of nutrition interventions on linear growth are greatest. Emerging evidence suggests that such interventions may help prevent stunted children from falling ever further behind their peers, and may even allow them to catch up.

I. INTRODUCTION In 2014, according to UNICEF, WHO and the World Bank, 171 million children under the age of five were stunted.2 Loosely-speaking this means they were excessively short for their age. Statistically-speaking it means their height-for-age z-score (HAZ, as it is known) was less than 2 standard deviations below the median of a healthy reference population.
Stunting in young children matters because it is it is associated with adverse outcomes in youth and adulthood – delayed schooling, poorer performance in school, less years of education, lower incomes and a greater risk of poverty. These associations are explained by three facts. First, children who are stunted in early childhood generally stay short as they grow up, and when they become adults earn less than taller people; they also marry shorter people who also earn less. Second, because stunting in early childhood often reflects inadequate nutrient intake (in utero and after birth) and infection, there are often long-term health consequences associated with stunting in early childhood: a higher incidence of chronic illnesses and as a result higher health expenditures. Third, undernutrition in childhood has ramifications for cognitive development. The body responds to inadequate nutrition by limiting physical growth, but before it does so, it limits the growth of the brain3 – this at a time when the brain is going through a crucial phase in its development. Inadequate nutrition at this stage in a child’s life can have severe and long-lasting effects, damaging the child’s chances of doing well at school and later on in the labor market. Stunting is thus a marker – and a very measurable one – of poor outcomes throughout the lifecycle across a number of domains of human development. Put simply, stunting is associated with long-term costs, both pecuniary and nonpecuniary.
Ensuring young children are well nourished, even before they are born, helps ensure they grow physically and mentally. Ensuring adequate nutrition for pregnant women and young children therefore yields a double set of benefits; moreover, these benefits keep flowing for the rest of the child’s life, and because they include higher wages, the payoff could be very large indeed. Investing in the nutrition of young children, whether through narrow nutrition-specific interventions or through broader ‘nutrition-sensitive’ interventions such as safety net programs, may well yield a very large economic return.
But there are also other ways that governments can help. First, because stunting is not always caused only by inadequate nutrition, governments can also work on these other causes to reduce stunting rates. Many of these will also yield benefits in terms of helping ensure a child’s uninterrupted cognitive and physical development: protecting young children from infection in the regular course of events and after natural disasters is a prime example. Second, there is scope to improve a child’s cognitive development and socioemotional skills through psychosocial stimulation interventions. Such interventions, delivered to stunted children, may help offset – at least partially – the effects of inadequate nutrition on a child’s cognitive development, thereby reducing the costs of stunting.
In this paper, we first discuss the past and likely future trends in stunting. We analyze the latest version of the multiagency malnutrition dataset to update 2013 estimates by the World Health Organization.4 We do this in the context of the 65th World Health Assembly and SDG target of a 40% reduction in the number of stunted children by 2025. We find large variations in stunting rates across countries, and large variations too in rates of change of stunting. We find that on current trends, stunting will have fallen by only 20% by 2025. We then assemble evidence on the costs of

stunting. We document how, through reduced height, an increased risk of chronic illness, inferior marriage market outcomes, and impaired cognitive capacity, stunting in early childhood translates into worse outcomes over the child’s lifetime. We attempt to quantify the costs of stunting, by asking how much lower a country’s per capita income is today because of a failure to eliminate stunting when today’s workers were children. We estimate that, on average, this per capita income penalty is around 7%. Africa and South Asia incur larger penalties – around 9-10% of GDP per capita.
Next we summarize the evidence on how governments can reduce the incidence of stunting through nutrition-specific interventions such as breastfeeding counselling. We present the findings of recent systematic reviews and meta-analyses, and estimate the rate-of-return to scaling up – over a period of 10 years – a package of 10 interventions to 90% coverage in 34 countries that together account for 90% of the world’s stunted children. We estimate a rate-of-return for the 34 countries as a whole of 17%, with a benefit-cost ratio of 15:1. With this program in place, the reduction in stunting by 2025 would be 36%. Halving the assumed program effect on stunting from 20% to 10% still leaves the program with a respectable estimated rate of return of 14%, but reduces the rate of reduction of stunting by 2025 to 28%.
Achieving the SDG target seems likely to require in addition ‘nutrition-sensitive’ interventions, such as water and sanitation (and complementary behavior change interventions), agriculture interventions, and safety net schemes (especially those targeted at pregnant women and children after natural disasters, and agroclimatic and macroeconomic shocks). We review the systematic reviews and meta-analyses of these.
Last, we explore the possibility that policymakers may be able to reduce, or at least limit, the costs of stunting, through psychosocial stimulation and other interventions aimed at promoting cognitive development. Emerging evidence suggests that such interventions may help prevent stunted children from falling ever further behind their peers, and may even allow them to catch up.
II. GLOBAL STUNTING LEVELS, TRENDS, AND TARGETS Measuring a child’s length or height is straightforward. The height and age data can then be marked on a growth chart derived from a well-nourished population to assess whether the child is stunted – less than two standard deviations below the median of the reference population.
Estimating the number of children worldwide who are stunted is less straightforward. The data for this exercise come from household surveys, which are typically conducted only every few years, so not every country has a survey in any one year. This means one cannot get an estimate for, say, 2010 simply by averaging the rates for countries with surveys in 2010. To complicate matters still further, some countries do not have a survey for any year.
For this paper, we have updated the 2012 WHO global estimates4 of stunting and trends therein using the September 2015 version of the Joint Child Malnutrition Estimates (JME) dataset jointly prepared by UNICEF, WHO and the World Bank Group.‡
‡ See http://data.unicef.org/jme_master_2015_127fcff.xlsx?file=jme_master_2015_127.xlsx&type=topics

A. Levels of stunting around the world Rates of stunting among under-fives vary considerably around the world – from 57% in Burundi to less than 2% in Chile (see Figure 1). Stunting rates decline with per capita income (see Figure 2), though the elasticity with respect to per capita GDP is fairly low – lower than the poverty elasticity with respect to per capita GDP, for example.5 Some large low- and middle-income countries – notably India, Indonesia, Pakistan, and Nigeria – have high stunting rates. There is, however, a lot of variation around the regression line (the correlation is around -0.55): Guatemala, India, Indonesia, Nigeria and South Africa all have higher-than-expected stunting rates, while China, the Dominican Republic and Senegal all have lower-than-expected stunting rates.5 Inequalities are also observed within countries, with poorer groups typically recording 2-3 times higher levels of stunting.6
B. Trends in stunting and global targets Some countries have been more successful than others in reducing stunting (Figure 3): Argentina, Brazil, China, Iran, Senegal, Peru and Vietnam have achieved quite fast reductions in stunting; Eritrea, Pakistan and PNG, by contrast, have all seen increases in stunting. Inequalities within countries have shown a high degree of persistence.6,7
In 2012, the sixty-fifth World Health Assembly (WHA) endorsed§ a target** for stunting: to reduce by 40% the number of stunted under-five children by 2025. This has been adopted as a goal for SDG 2: End hunger, achieve food security and improved nutrition, and promote sustainable agriculture.
Is the world on track to achieve this target? The September 2015 version of the JME dataset contains 124 countries with more than one survey – 14 more countries than used in the 2012 WHO exercise.4 Like WHO, we dropped surveys before 1995. We used the stunting rate and the under-five population to get the estimated number of under-fives who are stunted. We then estimated a fixed effects growth model (with countries as the fixed effects) to estimate the trend, and the predicted number of under-five stunted children in each year.†† Finally we summed this figure across the 124 countries each year to get the global estimate of stunted under-fives in that year.
Figure 4 shows our results. According to our estimates, the number of stunted under-fives has come down from 218 million in 1995 to 163 million in 2015. This represents a rate of reduction of 1.5% p.a.‡‡ On current trends, in 2030, when under the current SDG proposals malnutrition will have been ‘ended’, the number of stunted under-fives will actually be 131 million. The WHA target of a 40% reduction between 2010 and 2025 is quite ambitious. On current trends, the reduction between 2010 and 2025 will be just 20% not 40%. Reaching the 40% target would require more than a doubling of the annual rate of reduction in stunting – from the current historical rate of 1.5% to 3.4%. p.a.§§
§ See http://www.who.int/nutrition/topics/WHA65.6_resolution_en.pdf?ua=1 ** See http://apps.who.int/gb/ebwha/pdf_files/WHA65/A65_11-en.pdf †† The model is of the form: ln(Sit)=α+βt+ui+eit, where Sit is the number of stunted children in country i in year t, t is the year, ui is the country fixed effect, and eit the error term. The coefficient β is the growth rate, and the predicted number of stunted under-fives in year t is equal to 𝛼𝛼� + �̂�𝛽𝑡𝑡 + 𝑢𝑢�𝑖𝑖 , where 𝛼𝛼� denotes the estimate of α, etc. The country fixed effect model allows us to get an estimated stunting figure for every country for every year, including in years after 2014 for which we have no stunting data. ‡‡ This is somewhat smaller than the 1.8% estimated by WHO on the smaller dataset. §§ This is somewhat lower than that estimated by WHO (3.9%).

Figure 1: Stunting rates, latest year
Source: authors’ calculations from September 2015 version of the Joint Child Malnutrition Estimates (JME) dataset
11

Figure 2: Long-term association between stunting and GNI per capita, and latest values
Source: authors’ calculations from September 2015 version of the Joint Child Malnutrition Estimates (JME) dataset and WDI GNI per capita data
12

Figure 3: Annual percentage reduction or increase in stunting rate, 1995-2015
Source: authors’ calculations from September 2015 version of the Joint Child Malnutrition Estimates (JME) dataset
13

Figure 4: Trend in stunting and WHA/SDG target
Source: authors’ calculations from September 2015 version of the Joint Child Malnutrition Estimates (JME) dataset
III. THE COSTS OF STUNTING: PATHWAYS Figure 5 presents a conceptual framework for thinking about the causes, consequences and correlates of stunting. It helps understand the costs associated with stunting, as well as the opportunities for reducing these costs.
Figure 5: Conceptual framework for analysis of stunting costs and causes
Source: authors
A. Costs associated with reduced cognitive capacity and educational attainment Even before the slowdown in a child’s physical development in response to inadequate nutrition, there is an even greater and longer-lasting effect: the brain slows its growth.3 Some critical micronutrient deficiencies, particularly iron and iodine, are strongly associated with negative
0
50,000
100,000
150,000
200,000
250,000
1990 1995 2000 2005 2010 2015 2020 2025 2030 2035
No.
und
er-fi
ve ch
ildre
n st
unte
d (0
00s)
Estimated trend WHA/SDG Target
14

effects on the development of the brain. The significance of stunting (the focus of this note) thus goes well beyond stature or health more broadly: stunting is a warning that the child in question may be at serious risk of impaired brain development. Worse still, this is not just a temporary interruption after which the child returns to its normal development trajectory: significant brain development occurs during the first years of life, and early ‘insults’ to these biological processes arising from multiple risk factors (stunting, micronutrient deficiencies, stress and poor stimulation) can have long-term consequences on brain structural and functional capacity (Figure 6). 8 For instance, stunting in early childhood is associated with important alterations of the stress-sensitive system (and in particular the symphatetic-adrenomedullary SAM activity).9 Alterations in the stress response system are likely to affect the development of the prefrontal cortex, which is a brain region that involves attention and self-regulation, and that has been shown to play a critical role on school readiness early learning outcomes and socio-emotional skills.10 Importantly, the prefrontal cortex has a protracted period of maturation until adolescence, opening the room for interventions to shape higher cognitive and noncognitive functions for a longer window of time.
Figure 6: Brain development in early life
Note: Reproduced with permission from The Lancet 2007 369, 60-70DOI: (10.1016/S0140-6736(07)60032-4) 8. Further permission required for reuse.
This joint dependence of physical growth and cognitive development on nutrition accounts for the strong association between stunting in early life and indicators of cognitive capacity in later life. Height (and weight) gain during the first two years of life (but not later) has been found to have a longitudinal association with cognition in the COHORTS study conducted in Brazil, South Africa, Philippines, Guatemala 11. The onset (before 6 months of age) and the persistence of growth retardation have been found to be related to cognitive delays at age 8 or 11 in the Philippines.12 Severe stunting (HAZ≤-3SD) before the age of 2 in Jamaica was found to be associated with 1SD deficit in IQ at age 9.13 The same size effect was observed in Peru, while moderate stunting (HAZ≤-2SD) had an association of a 0.6SD deficit in IQ, suggesting dose response.14
Stunting is also negatively correlated with educational attainment, due likely to the link to cognitive capacity, but perhaps also due in part to the link to height. The longitudinal COHORTS study finds that that stunting is associated with 0.5 fewer years of schooling 11. Other studies15,16 find that early malnutrition causes delayed enrolment as well as lower ability to learn while in school.
These reductions in cognitive capacity and educational attainment translate into lower earnings in the labor market in adulthood.17 Estimates suggest that an additional year of schooling might
15

translate into a 5-11% increase in earnings: 18,19 Broader benefits are also likely beyond earnings, given that educational attainment are associated with less crime, greater civic participation, and health17,20, and it has effects on the nutrition and overall human capital of the next generation.
B. Costs associated with reduced height Stunting in early childhood has a direct causal effect on stature in adulthood, which has a direct causal effect on wages in adulthood. Several studies document the persistence of shortness throughout life. A study in Senegal21 found that the correlations between height in early childhood and early adulthood (18-23 years of age) were 0.46 for girls and 0.49 for boys. Similar results have been found in other studies.22,23 Structural estimates of height across different stages of childhood in India, which account for measurement error, show a high degree of persistence in height (albeit lower than 1) with a correlation of 0.7 between height at age 1 and height at age 8, increasing to 0.8 between height at age 1 and height at age 15.24
The degree of persistent is significant, but still leaves for the possibility of catch-up growth after the age of two25-28, with children who were stunted in childhood and who recovered from stunting having similar levels of cognition to non-stunted children.29 In addition, catch-up has to be weighed against a higher likelihood of adult chronic diseases, with high blood pressure, overweight observed during adolescents for children who experienced growth recovery after the age of two.30-
32
Several studies show that height is positively correlated with wages. In developing countries, at least, the effect of height on wages is attributable in part to workers sorting into occupations according to their height, depending on occupations’ requirements vis-à-vis strength vs. intelligence. A recent study found that among male workers in Mexico each centimeter in height is associated with 2% higher hourly earnings33; this after controlling for health and cognitive measures. In Indonesia, a study using panel data found that a 1% difference in height was related to a 2.3% increase in hourly earnings, controlling for sectoral and occupational choice, as well as (observed and unobserved) family background.34
Female adult height and stunting have important intergenerational consequences on fetal, newborn and child outcomes. Each centimeter of maternal birth length is associated with 0.2cm of child birth length, an important predictor of child stunting status35,36 and adult height11. Maternal stunting has also been associated with increased risk of intrauterine growth retardation, which may lead to fetal death or long term cognitive impairment37.
C. Costs associated with impaired health Stunting in early childhood is negatively correlated with health in adulthood. Malnutrition in utero and in early childhood has been linked to increased susceptibility to chronic illness in adulthood, such as obesity, cardiovascular diseases and diabetes.11 Evidence comes from seminal studies that tracked low birth weight infants into their adult years, as well as a number of studies comparing the health of middle-aged people born after and during the Dutch famine during World War II, China’s Great Leap Forward, and the Biafra famine.17
This extra risk of chronic illness leads to a reduction in welfare in its own right. But it also leads to lower earnings and higher cost of accessing and using health care services.14
16

Chronic exposure to contaminated environments due to poor water quality, sanitation and hygiene are strongly associated with stunting.38 Cumulative exposure to infection, as documented by repeated bouts of diarrhea up to the age of 24 months are associated with growth faltering. Recent research suggests that infection, including subclinical conditions, such as chronic asymptomatic inflammation and other physiological responses to environmental ‘insults’ may account for a much larger share of stunting than previously thought.4,39
D. Costs associated with worse ‘marriage market’ outcomes An analysis of data generated by a randomized nutrition intervention in Guatemala in the late 1950s and early 1970s found that HAZ and stunting at 36 months were associated with the education and height of the spouse.40 Stunted children thus suffer a double disadvantage – they acquire less human capital themselves, and end up marrying someone with a relatively low level of human capital. This means a lower household income than would be the case for a non-stunted individual.
E. Overall costs to stunting in early childhood – previous studies Given the multiple channels by which stunting affects adult income, and given that these costs accrue each year after starting work, the overall costs of being stunted in early childhood are likely to be quite large. One approach to seeing how large they actually are involves taking the various relationships, attaching a plausible magnitude from the literature, and then summing up to get the total cost.
Another – more direct – approach is to look at long-term studies that follow people from early childhood through to adulthood, and simply estimate the effect on income or earnings of an extra SD on HAZ at age 2, say, or of being stunted at age 2. Two datasets have been used for this purpose. One is the 1982 Pelotas (Brazil) Birth Cohort study.41 The cohort study included all children born in the city’s hospitals in 1982. At that time, almost all deliveries in the city took place at hospitals, so the sample is representative of the city. The other is the Institute of Nutrition of Central America and Panama Nutrition Trial Cohort (INCAP) study in Guatemala, which was originally an intervention trial in four villages conducted in 1969 and 1977.41 In both cases, children have been followed into adulthood, and researchers have analyzed the association between HAZ or stunting in early childhood and earnings or income in adulthood (ages 21-23 in the case of Brazil, and ages 25-42 in the case of Guatemala). In the case of Guatemala, the effects of unobservable variables can be better controlled for because the randomization in the original experiment can be used as an instrumental variable (IV).9
The Brazil cohort suggests a 1 SD increase in HAZ at 2 years raises annual income by 8% for both men and women.11 The same authors, using the same OLS method, obtain effects of 8% for men and 25% for women in Guatemala, giving a mean effect of 16%. A more recent study40 of the Guatemala data find a broadly similar effect for a 1 SD increase in HAZ at 3 years using OLS, and an effect of being stunted at age 3 of -14%. Larger effects are obtained using IV: -14% and -65% respectively. Broadly similar results are obtained for per capita household consumption: -9% and -66%.
9 There was also an earthquake that affected some villages and not others, and this is also used as an IV.
17

IV. ESTIMATES OF THE COSTS OF STUNTING In this section we present some new estimates of the costs of stunting. We ask how much lower a country’s per capita income is today as a result of some of its workers having being stunted in childhood. This is a backward-looking exercise, asking, in effect, what the costs are today of not having eliminated stunting in the past. A number of studies have asked how much lower today’s GDP is as a result of underinvestment in nutrition programs in the past (Alderman et al.42 provide a review), but none has looked specifically at the consequences of not having eliminated stunting.
In any year, the workforce comprises workers of different ages, typically with proportionally more young workers than old workers. Young workers are less likely to have been stunted in childhood than old workers – a worker aged 50, for example, has a probability of being stunted in childhood equal to the childhood stunting rate 50 almost years ago. The average rate of childhood stunting of the workforce will reflect childhood stunting rates over the period from around 50 years ago to around 15 years ago. If those in the current workforce who were stunted in childhood had instead not been stunted in childhood, they would not have suffered impaired cognitive development during childhood, they would not have received less education, and they would have grown to a regular height. Their income today would have been higher by a percentage that reflects the education penalty associated with childhood stunting, the returns to education, the adult height penalty to childhood stunting, and the returns to height.
By trawling the literature to find what each of these numbers seems to be, and by finding out the age distribution of current workers so we can find out what fraction of current workers were stunted in childhood, we can quantify the per capita income penalty a country incurs for having some of its workforce stunted in childhood. We estimate that, on average, the per capita income penalty from stunting is around 7% – per capita income in the developing world would have been 7% higher if nobody currently working had been stunted in childhood. Africa and South Asia incur larger penalties – around 9-10% of GDP per capita.
A. Methods We use a development accounting approach.43-46 The method has been used in the growth literature to explain how income differences across countries at one point in time can be explained by its proximate determinants, i.e. differences in factors (human and physical capital) and differences in the efficiency of these factors. Alternative approaches that assess the role of the factors (say human capital as proxied by schooling) on growth or GDP levels using cross-country regressions are very sensitive to the sample used or the estimation method used. It is also challenging to tackle the issue of endogeneity of factors in cross-country regressions. A set of studies in the macro literature has focused on calibration as an alternative to estimation, where the parameters of the production function are derived from microeconomic estimates. We follow the literature and assume that aggregate income can be represented by the Cobb-Douglas production function:
𝑌𝑌 = 𝐴𝐴 ∙ (𝑁𝑁𝑊𝑊 ∙ ℎ𝑘𝑘)𝛼𝛼𝐾𝐾1−𝛼𝛼
where Y is aggregate income (or GDP), A is a shift factor (or residual total factor productivity), NW is the number of workers, hk is human capital per worker, K is aggregate physical capital, and α is the elasticity of income with respect to aggregate human capital. If N is population, we can rewrite the production function in per capita terms as:
18
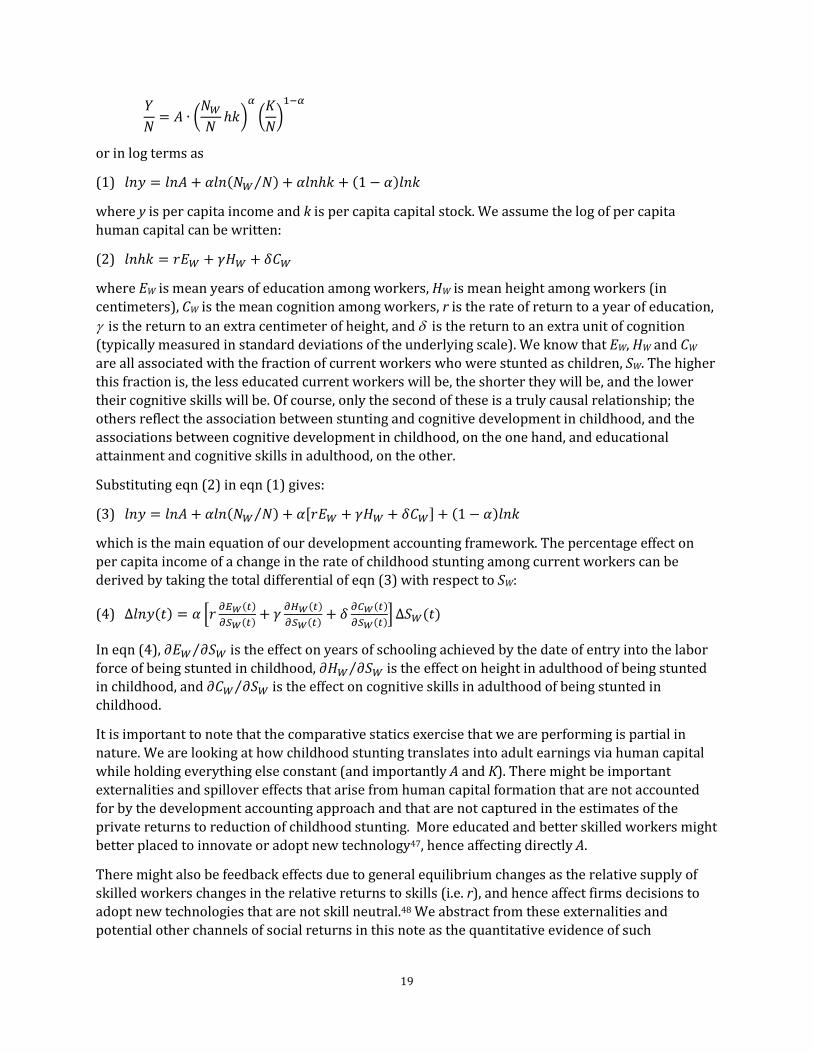
𝑌𝑌𝑁𝑁
= 𝐴𝐴 ∙ �𝑁𝑁𝑊𝑊𝑁𝑁
ℎ𝑘𝑘�𝛼𝛼�𝐾𝐾𝑁𝑁�1−𝛼𝛼
or in log terms as
(1) 𝑙𝑙𝑙𝑙𝑙𝑙 = 𝑙𝑙𝑙𝑙𝐴𝐴 + 𝛼𝛼𝑙𝑙𝑙𝑙(𝑁𝑁𝑊𝑊 𝑁𝑁⁄ ) + 𝛼𝛼𝑙𝑙𝑙𝑙ℎ𝑘𝑘 + (1 − 𝛼𝛼)𝑙𝑙𝑙𝑙𝑘𝑘
where y is per capita income and k is per capita capital stock. We assume the log of per capita human capital can be written:
(2) 𝑙𝑙𝑙𝑙ℎ𝑘𝑘 = 𝑟𝑟𝐸𝐸𝑊𝑊 + 𝛾𝛾𝐻𝐻𝑊𝑊 + 𝛿𝛿𝐶𝐶𝑊𝑊
where EW is mean years of education among workers, HW is mean height among workers (in centimeters), CW is the mean cognition among workers, r is the rate of return to a year of education, γ is the return to an extra centimeter of height, and δ is the return to an extra unit of cognition (typically measured in standard deviations of the underlying scale). We know that EW, HW and CW are all associated with the fraction of current workers who were stunted as children, SW. The higher this fraction is, the less educated current workers will be, the shorter they will be, and the lower their cognitive skills will be. Of course, only the second of these is a truly causal relationship; the others reflect the association between stunting and cognitive development in childhood, and the associations between cognitive development in childhood, on the one hand, and educational attainment and cognitive skills in adulthood, on the other.
Substituting eqn (2) in eqn (1) gives:
(3) 𝑙𝑙𝑙𝑙𝑙𝑙 = 𝑙𝑙𝑙𝑙𝐴𝐴 + 𝛼𝛼𝑙𝑙𝑙𝑙(𝑁𝑁𝑊𝑊 𝑁𝑁⁄ ) + 𝛼𝛼[𝑟𝑟𝐸𝐸𝑊𝑊 + 𝛾𝛾𝐻𝐻𝑊𝑊 + 𝛿𝛿𝐶𝐶𝑊𝑊] + (1 − 𝛼𝛼)𝑙𝑙𝑙𝑙𝑘𝑘
which is the main equation of our development accounting framework. The percentage effect on per capita income of a change in the rate of childhood stunting among current workers can be derived by taking the total differential of eqn (3) with respect to SW:
(4) ∆𝑙𝑙𝑙𝑙𝑙𝑙(𝑡𝑡) = 𝛼𝛼 �𝑟𝑟 𝜕𝜕𝐸𝐸𝑊𝑊(𝑡𝑡)𝜕𝜕𝑆𝑆𝑊𝑊(𝑡𝑡) + 𝛾𝛾 𝜕𝜕𝐻𝐻𝑊𝑊(𝑡𝑡)
𝜕𝜕𝑆𝑆𝑊𝑊(𝑡𝑡) + 𝛿𝛿 𝜕𝜕𝐶𝐶𝑊𝑊(𝑡𝑡)𝜕𝜕𝑆𝑆𝑊𝑊(𝑡𝑡)� ∆𝑆𝑆𝑊𝑊(𝑡𝑡)
In eqn (4), 𝜕𝜕𝐸𝐸𝑊𝑊 𝜕𝜕𝑆𝑆𝑊𝑊⁄ is the effect on years of schooling achieved by the date of entry into the labor force of being stunted in childhood, 𝜕𝜕𝐻𝐻𝑊𝑊 𝜕𝜕𝑆𝑆𝑊𝑊⁄ is the effect on height in adulthood of being stunted in childhood, and 𝜕𝜕𝐶𝐶𝑊𝑊 𝜕𝜕𝑆𝑆𝑊𝑊⁄ is the effect on cognitive skills in adulthood of being stunted in childhood.
It is important to note that the comparative statics exercise that we are performing is partial in nature. We are looking at how childhood stunting translates into adult earnings via human capital while holding everything else constant (and importantly A and K). There might be important externalities and spillover effects that arise from human capital formation that are not accounted for by the development accounting approach and that are not captured in the estimates of the private returns to reduction of childhood stunting. More educated and better skilled workers might better placed to innovate or adopt new technology47, hence affecting directly A.
There might also be feedback effects due to general equilibrium changes as the relative supply of skilled workers changes in the relative returns to skills (i.e. r), and hence affect firms decisions to adopt new technologies that are not skill neutral.48 We abstract from these externalities and potential other channels of social returns in this note as the quantitative evidence of such
19

externalities is an area of active research. As a consequence, the estimates presented in this exercise are likely to represent a lower bound of the costs associated with childhood stunting.
B. Parameters We need values for the parameters of eqn (4) to compute the costs of stunting. We set α equal to 0.666.43 For the returns to education parameter, r, we use the results from Montenegro and Patrinos49; we use their Table 3a which shows average returns across men and women for each World Bank region. We searched the literature for estimates of the remaining parameters: γ, the return to an extra centimeter of height; 𝜕𝜕𝐸𝐸𝑊𝑊 𝜕𝜕𝑆𝑆𝑊𝑊⁄ , the effect on years of schooling achieved by the date of entry into the labor force of being stunted in childhood; 𝜕𝜕𝐻𝐻𝑊𝑊 𝜕𝜕𝑆𝑆𝑊𝑊⁄ , the effect on height in adulthood of being stunted in childhood; and 𝜕𝜕𝐶𝐶𝑊𝑊 𝜕𝜕𝑆𝑆𝑊𝑊⁄ , the effect on cognition in adulthood of being stunted in childhood.
The results of the literature search are shown in Table 1. We averaged the parameter estimates across the studies, giving a weight of 5 to the estimates based on the COHORTS study since these estimates are derived from data from five developing countries (India, Guatemala, India, Philippines and South Africa). Panel A of the table provides micro estimates of the effect of having been stunted in childhood on adult and adolescent height, in centimeters 𝜕𝜕𝐻𝐻𝑊𝑊 𝜕𝜕𝑆𝑆𝑊𝑊⁄ , as well as the returns to height on earnings in the labor market (𝛾𝛾), conditional on years of schooling. Most estimates are drawn from longitudinal studies that have both stunting at childhood and earnings. The effects of being stunted in childhood on attained adult (or adolescent) height are very similar when looked at as unconditional associations, or as conditional associations, controlling for years of schooling and other socioeconomic characteristics. We take the mean estimate across all studies: moving from moderate stunting (defined as the height for age z-scores being below 2 standard deviations from the reference population) to non-stunting increases the height on average by 5.98 centimeters.
When looking at the height premium in the labor market, a number of studies have documented how height gets rewarded in the labor market, over and above schooling and cognition. The results are mainly from middle-income countries, and available only for men, to avoid having to model participation or selection into the labor market by females. On average, an additional centimeter in height translates into 1.7% higher wages in the labor market, after controlling for years of schooling, and sometimes cognition too.
The second panel B looks at the association of having been stunted in childhood and completed years of schooling: on average, being stunted in early childhood translates into 1.59 fewer years of schooling completed, which is reduced by about half when controlling for socioeconomic status and maternal education.
Finally, the left-hand columns in panel C summarize the estimates of the association between moderate stunting in childhood and cognitive deficits on the left-hand panel: the magnitude of the association is quantitatively important, with an average cognitive deficit of 0.625 standard deviations associated with moderate stunting. The right-side of panel C presents estimates of the conditional returns to cognition in the labor market, controlling for years of schooling and attained height, derived from longitudinal studies in middle-income countries, and available only for men, to avoid having to model participation or selection into the labor market by females.
20
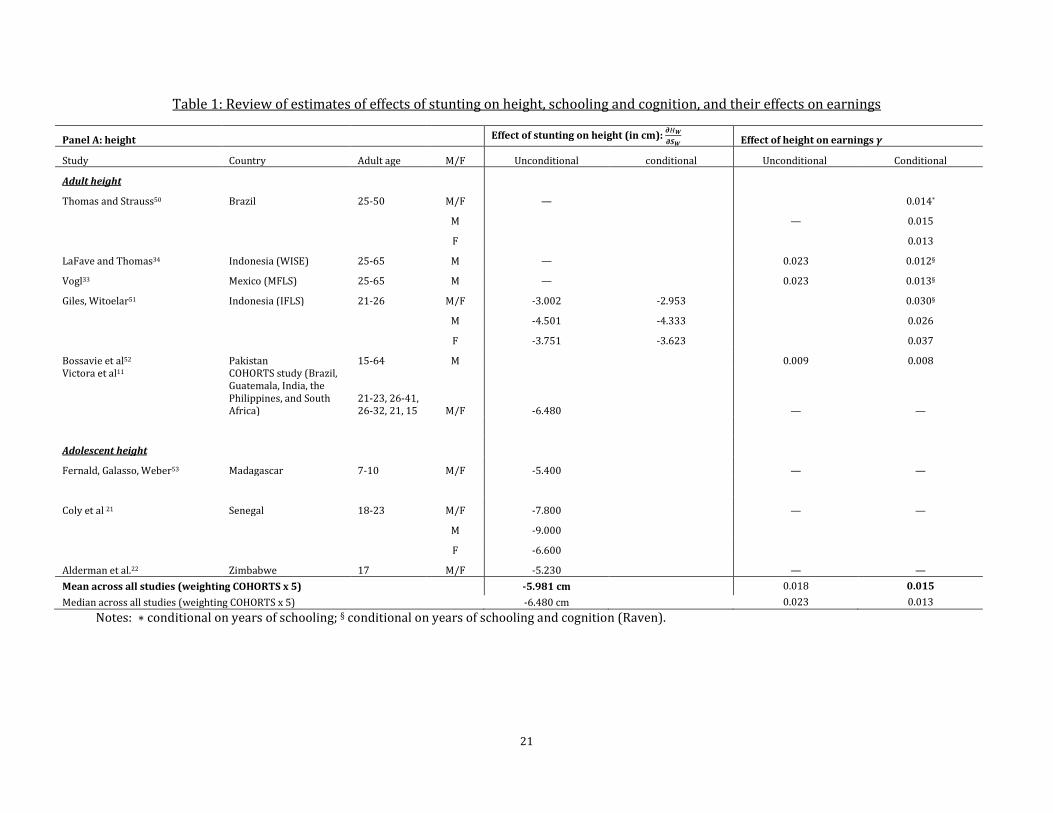
Table 1: Review of estimates of effects of stunting on height, schooling and cognition, and their effects on earnings
Panel A: height Effect of stunting on height (in cm): 𝝏𝝏𝐻𝐻𝑾𝑾𝝏𝝏𝑺𝑺𝑾𝑾
Effect of height on earnings 𝜸𝜸
Study Country Adult age M/F Unconditional conditional Unconditional Conditional
Adult height
Thomas and Strauss50 Brazil 25-50 M/F — 0.014*
M — 0.015
F 0.013
LaFave and Thomas34 Indonesia (WISE) 25-65 M — 0.023 0.012§
Vogl33 Mexico (MFLS) 25-65 M — 0.023 0.013§
Giles, Witoelar51 Indonesia (IFLS) 21-26 M/F -3.002 -2.953 0.030§
M -4.501 -4.333 0.026
F -3.751 -3.623 0.037
Bossavie et al52 Pakistan 15-64 M 0.009 0.008 Victora et al11 COHORTS study (Brazil,
Guatemala, India, the Philippines, and South Africa)
21-23, 26-41, 26-32, 21, 15 M/F -6.480 — —
Adolescent height
Fernald, Galasso, Weber53 Madagascar 7-10 M/F -5.400 — —
Coly et al 21 Senegal 18-23 M/F -7.800 — —
M -9.000
F -6.600
Alderman et al.22 Zimbabwe 17 M/F -5.230 — — Mean across all studies (weighting COHORTS x 5) -5.981 cm 0.018 0.015 Median across all studies (weighting COHORTS x 5) -6.480 cm 0.023 0.013
Notes: ∗ conditional on years of schooling; § conditional on years of schooling and cognition (Raven).
21

Panel B: years of schooling Effect of stunting on years of schooling 𝜕𝜕𝑬𝑬𝑾𝑾𝜕𝜕𝑆𝑆𝑊𝑊
Effect of years of schooling on earnings 𝑟𝑟
Study Country Adult age M/F Unconditional conditional Unconditional Conditional§ Giles, Witoelar51 Indonesia 21-26 M/F -0.717 -0.583 0.050
M -0.418
F -0.620 -0.043
Pitt, Rosenzweig and Hassan54 Bangladesh 20-49 M/F — 0.042
LaFave and Thomas34 Indonesia 25-65 M — 0.083
Vogl33 Mexico (MFLS) 25-65 M 0.073
Martorell et al55 COHORTS study (India, Guatemala, Philippines, South Africa)
21-23, 26-41, 26-32, 21, 15
M/F -1.840 -0.920 —
Alderman, Hoddinott and Kinsey22
Zimbabwe 17 M/F -1.240 —
Mean across all studies (weighting COHORTS x 5) -1.594 years -0.864 years
Median across all studies (weighting COHORTS x 5) -1.840 years -0.920 years § conditional on height and cognition
22

Panel C: cognition Effect of stunting on cognition (in SD) 𝜕𝜕𝑪𝑪𝑾𝑾𝜕𝜕𝑆𝑆𝑊𝑊
Effect of cognition on earnings 𝛿𝛿
Study Country Adult age M/F Unconditional conditional Unconditional Conditional Giles, Witoelar51 Indonesia 21-26 M/F -0.037 -0.008 0.038 M
0.066 0.08 0.06
F -0.133 -0.123 0.021
LaFave and Thomas34 Indonesia 25-65 M — 0.077
Vogl33 Mexico (MFLS) 25-65 M —
0.011
Bossavie et al52 Pakistan 15-64 M —
0.024 Glewwe, Jacoby and King16 Philippines 11 M/F -0.870 — —
Walker et al56 Jamaica 17-18 M/F -0.930 -0.710 ˣ —
Berkman14 Peru 9 M/F -0.670 -0.367 ˣ
—
—
Grantham McGregor et al8 COHORTS study (India, Guatemala, Philippines, South Africa)
21-23, 26-41, 26-32, 21, 15
M/F -0.675 — —
Mean across all studies (weighting COHORTS x 5) -0.625 SD 0.043 (men)
Median across all studies (weighting COHORTS x 5) -0.685 SD 0.042 (men) Notes: ˣ conditional on SES, § conditional on schooling, and height
23

We set ∆𝑆𝑆𝑊𝑊 equal to the average rate of childhood stunting among today’s workers, i.e. those working in 2014. Thus ∆𝑙𝑙𝑙𝑙𝑙𝑙 is the percentage difference between actual per capita income today and what it would have been if none of today’s workers had been stunted in childhood. We compute the average rate of childhood stunting among today’s workers as the (estimated) under-five stunting rate in the year when the median aged worker was aged 2. We estimate the median age of today’s workers using the distribution of the population across five-year age bands from 15 through 55 using the WDI population age structure data. Childhood stunting rates are available only for relatively recent years in the JME-World Development Indicators dataset, so we used the modelled estimates in the dataset of Paciorek et al.57 Their data go back to 1985, so when the median age worker was 2 in an earlier year, we use the 1985 childhood stunting rate.
As an example, take a country like Bangladesh. The median age worker for Bangladesh as from the WDI age structure in 2014 was 30. Even though the stunting prevalence in Bangladesh has almost halved in the past three decades, the relevant stunting prevalence for this exercise is the year when the median age worker was 2, that is the year 1986 (2014-30+2). The childhood stunting in 1986 (∆𝑆𝑆𝑊𝑊~over 70%) among today’s workers is used to compute the country-specific income penalty from equation (4) using the estimated effects on stunting education height and cognition as summarized below:
Table 2: Assumptions in estimating the cost of childhood stunting
Parameters Effects of stunting on:
Education (𝜕𝜕𝐸𝐸𝑤𝑤/𝜕𝜕𝑆𝑆𝑤𝑤) -1.594 fewer years of education See Table 1 Height (𝜕𝜕𝐻𝐻𝑤𝑤/𝜕𝜕𝑆𝑆𝑤𝑤) -5.981 cm shorter See Table 1
Cognition (𝜕𝜕𝐶𝐶𝑤𝑤/𝜕𝜕𝑆𝑆𝑤𝑤) -0.625 SD lower cognition See Table 1 Returns to:
Education (r) Region-specific percentage extra income per extra year of education
Montenegro and Patrinos49
Height (γ) 1.7% extra income per extra cm See Table 1 Cognition (δ) 4.3% extra income per extra SD See Table 1
Elasticity of income with respect to human capital, i.e. labor share (α)
0.67 Hanushek and Woessmann43
C. Results The results are shown in
Table 3 and Figure 7. The rates of childhood stunting among today’s workforce varies considerably across countries depending on the historical stunting rate and the age distribution of the population. Only 6% of Hong Kong’s workforce was stunted in childhood. In Chile, the figure was 8%. By contrast, two thirds of India’s current workforce was stunted in childhood. Over 70% of Bangladesh’s workforce was stunted in childhood.
In part, because of these differences, the cost of stunting – in terms of the reduction in per capita income from some of today’s workforce being stunted in childhood – varies considerably across countries, from 1% to 13%. The average is 7%. Africa and South Asia are the regions with the largest average penalties – around 9-10% of GDP per capita. Countries with stunting-induced per capita income reductions less than 2% include Bermuda, Chile, Fiji, Hong Kong (China), Samoa, Seychelles, Tonga, and Trinidad and Tobago. At the other extreme, Ethiopia’s per capita income is 13% less than it would have been if none of its workforce had been stunted in childhood. Other
24

countries with large ‘stunting penalties’ include Burundi, Guatemala, Malawi, Mozambique, Rwanda, and Vietnam.
Table 3: Costs of childhood stunting among today’s workforce
Region No. countries Mean East Asia & Pacific 23 -7% Europe & Central Asia 9 -5% Latin America & Caribbean 33 -5% Middle East & North Africa 19 -4% North America 1 -2% South Asia 8 -10% Sub-Saharan Africa 47 -9%
Total 140 -7%
25
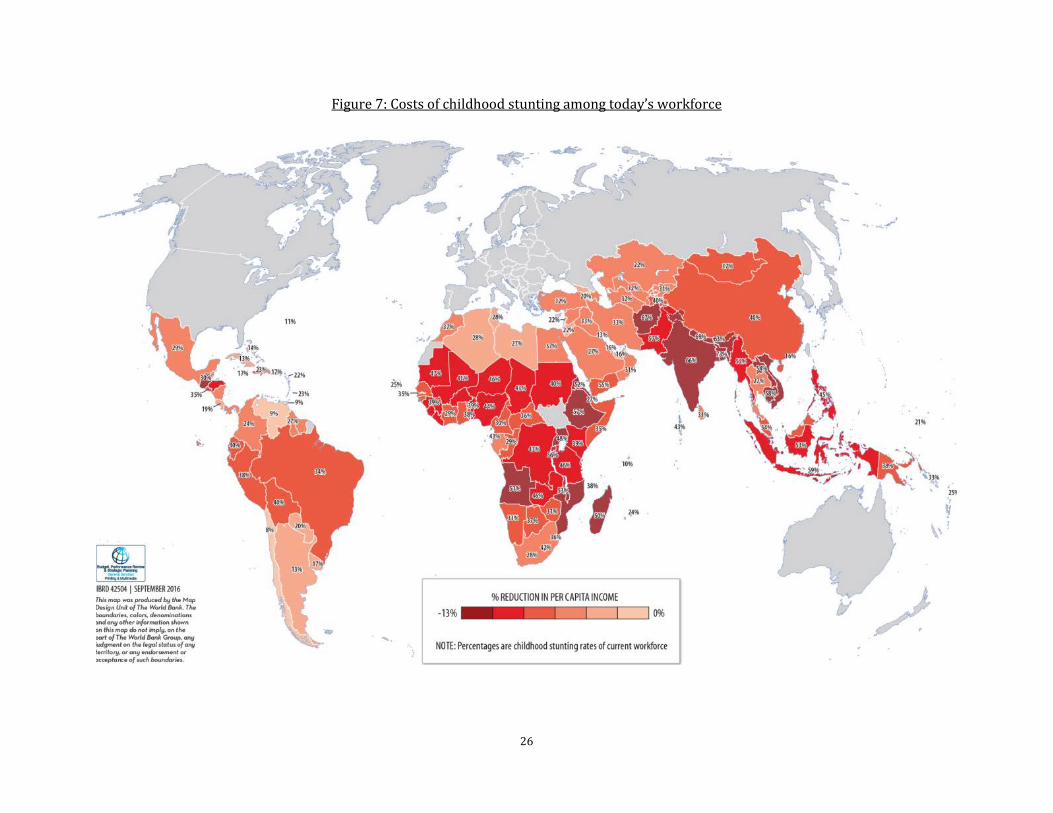
Figure 7: Costs of childhood stunting among today’s workforce
26

V. NUTRITION-SPECIFIC PROGRAMS AND THEIR EFFECTS – A REVIEW
Stunting may reflect inadequate food and nutrient intake, disease39,58, maternal health, and maternal stature36 (the stature of women of child-bearing age affects the scope for a country to reduce stunting). Lack of access to adequate food at the household level, inadequate access to health services and a healthy environment, and poor parental ‘caring’ practices (including gender bias) all play a role in determining the likelihood of a child being stunted. Governments cannot of course directly determine these factors, but they can influence them: by subsidizing the price of food; by promoting dietary diversity in agriculture; by increasing the incomes of the poor through a cash transfer program; by expanding access to and increasing the affordability of health care; by integrating nutrition into health services; by improving the environment, including water and sanitation infrastructure; and by educating women about caring for young children.
These initiatives are often grouped into two types: nutrition-specific and nutrition-sensitive interventions. In recent years, the effects of both sets of interventions have been studied, often through randomized trials and experiments. The findings of these studies have also been assessed through systematic reviews and their impacts summarized through meta-analyses.
In this section we review the evidence on nutrition-specific interventions. In section VII we review the evidence on nutrition-sensitive interventions.
A. Nutrition-specific interventions – evidence on impacts on stunting A variety of ‘nutrition-specific’ initiatives have been adopted, all of which have been the subject of systematic reviews and meta-analyses.59-63 The major ones include:
a) Breastfeeding promotion delivered by community health workers or peer counsellors visiting the mother’s home;
b) Vitamin and micronutrient supplementation, including vitamin A, iron, zinc, and folic acid, sometimes in combination;
c) Education of mothers and caregivers in their homes or at a facility about complementary feeding by community health workers or facility-based staff;
d) Provision of complementary foods, either given to children at a central location, or to mothers and caregivers for use at home;
e) Provision of complementary foods with micronutrient fortification, where the fortification is usually done through central processing of the complementary food but sometimes through the addition of micronutrient supplements to the home-prepared food; and
f) Increasing the energy density of complementary foods (especially cereal gruels) through the use of simple technologies such as adding amylase to cereal gruels, and soaking, germination and roasting.
The evidence on these initiatives (effectiveness and efficacy studies) emerging from the systematic reviews and meta-analyses is summarized in Table 4. Note that the focus of this review is on impacts on stunting. Many of these interventions have been shown to have impacts on child survival, anemia, and/or severe or moderate acute malnutrition. Meta-analysis have shown that the supplementation of vitamin A and the provision of multiple micronutrients to pregnant women64 have significant impacts on infant and childhood mortality from all causes, and in particular on
27

diarrhea-specific mortality. Meta-analyses have also shown impacts of preventive zinc-supplementation on morbidity, and on diarrhea- and pneumonia-related mortality65, and exclusive breastfeeding has been shown to have an impact on pneumonia-mortality66.
As far as impacts on stunting are concerned, there have been more studies of breastfeeding promotion and vitamin- and micronutrient-supplementation than of education and complementary food provision. The majority of initiatives evaluated to date are ‘efficacy’ trials, i.e. in the intervention studied there was “a high degree of assurance of delivery of the ‘treatment’, generally under carefully controlled research conditions (e.g. provision of a fortified complementary food with frequent follow-up to assess adherence).”63 Only a few of the evaluations conducted to date have been ‘effectiveness’ studies, i.e. in a program setting, “generally with less ability to control delivery of and adherence to ‘treatment’”.63 The latter studies are, of course, more informative for policymakers because they give a better guide as to what would happen in a real program; unsurprisingly, the impacts tend to be smaller in these effectiveness studies than in the efficacy trials.
In terms of impacts, typically only a small fraction of studies in each intervention type have found statistically significant impacts on height or stunting. In fact, with the exception of one recent meta-analysis covering education and complementary food provision, all meta-analysis have reported an overall effect for the studies combined that was not significantly different from zero. And this result was driven by two studies conducted in just one country—China; this raises serious questions about the generalizability of the results from this meta-analysis.
The authors and experts in the field summarized the evidence on impacts on stunting thus:
a) Breastfeeding promotion: “Breastfeeding promotion interventions were not associated with significant changes in weight or length.”60
b) Vitamin and micronutrient supplementation: “Strategies to increase bioavailability of key nutrients such as iron and zinc have generally failed to reduce stunting.” 4 “Our findings confirm earlier results of no benefits for interventions including iron and vitamin A only but differ from the earlier meta-analysis that found improvements in linear growth for zinc only interventions. This may be due to the improved nutritional status of children in the more recent studies. Multiple micronutrient interventions improve linear growth, but the benefits are small. Other strategies are needed to prevent stunting.”59
c) Education of mothers and caregivers. “Educational interventions to improve complementary feeding practices are often effective at changing behaviors, but their impact on stunting has been less impressive. Most of the educational interventions included in the systematic review conducted in 2008 showed either no impact or a modest effect on linear growth.”4
d) Provision of complementary foods. “Provision of complementary food has had a positive impact on linear growth in some … studies. The average effect size has been modest (∼0.2–0.3), but there has been a wide range of impact, perhaps reflecting variations in the target populations’ food security and the nutrient quality of the food provided.”4 “The … provision of complementary foods (±nutritional counseling) and … nutritional counseling alone … were found to result in a significant increase in … linear growth.”61
e) Provision of complementary foods with micronutrient fortification. “Fortification of complementary foods with micronutrients via central processing or home fortification strategies (such as micronutrient powders), without any additional macronutrients (energy, protein or fat), has generally not affected linear growth.”4
28
f) Increasing the energy density of complementary foods. “Interventions to increase the energy density of complementary foods have yielded mixed results. Of the five studies included in the systematic review, two had a positive impact on linear growth but three had no impact on energy intake or growth.”4
29

Table 4: Summary of meta-analyses of effects of nutrition-specific interventions on stunting and height
Intervention Delivery mechanism Year
of study
Study # studies
% of studies about a
program (rather than efficacy trial)
% high or v. high
quality
% significant effect with 'right' sign
Mean effect across studies
significant? Effect size
Vitamin A supplementation
2009 Ramakrishnan et al.59
15 100% 13% No (0.08 SD)
Iron supplementation 34 100% 9% No (0.01 SD) Zinc supplementation 53 100% 17% No (0.07 SD) Iron & zinc 7 100% 14% No (0.0 SD) Multiple micronutrients 2 100% 50% Yes (0.09 SD) Breastfeeding promotion 2015 Giugliani et al60 17 60% 12% No (0.03 SD) Education about complementary feeding
Education of mothers and caregivers in their homes or at a facility about complementary feeding by community health workers or facility-based staff
2008 Dewey et al.63 8 50% 13% 38% n/a
Education about complementary feeding
Education of mothers and caregivers in their homes or at a facility about complementary feeding by community health workers or facility-based staff
2011 Imdad et al.61 7 29% Yes (0.19 SD)
Provision of complementary foods - only
Provision of complementary foods, either given to children at a central location, or to mothers and caregivers for use at home;
2008 Dewey et al.63 8 20% 0% 63% n/a
Complementary food & education
Provision of complementary foods, either given to children at a central location, or to mothers and caregivers for use at home;
2008 Dewey et al.63 8 75% 13% 0% n/a
Complementary food & education
Provision of complementary foods, either given to children at a central location, or to mothers and caregivers for use at home;
2011 Imdad et al.61 11 27% Yes (0.21 SD)
Provision of complementary foods with micronutrient fortification
Provision of complementary foods with micronutrient fortification, where the fortification is usually done through central processing of the complementary food but sometimes through the addition of micronutrient supplements to the home-prepared food
2008 Dewey et al.63 6 22% 56% 17% n/a
Increasing the energy density of complementary foods
Increasing the energy density of complementary foods
2008 Dewey et al.63 5 0% 0% 20% n/a
30

B. Positive experiences with nutrition-specific programs Despite the limited (and often statistically insignificant) effects of nutrition-specific interventions seen in the meta-analyses reviewed above, several countries have brought stunting rates down using nutrition-specific interventions, albeit sometimes combined with nutrition-sensitive interventions.
In Peru, stunting was stuck at around 30% through most of the 2000s. Then in the period 2007-14, stunting fell by half to just 14%. The reduction is thought to be attributable to a series of concerted policy efforts and policies, beginning around 2006, driven by strong political commitment up to the level of the President, with measurable time-bound goals (the president announced a 5x5 target – reducing child malnutrition by 5 percentage points in 5 years). An inter-ministerial coordination platform within the cabinet was set up, aiming to integrate multi-sectoral nutrition initiatives to benefit 5 million under-fives. Information videos were produced and disseminated, and nutrition was integrated into the country’s conditional cash transfer program (Juntos). Substantial investments were made in the supply side of the health system, with performance-based budgeting introduced. An evidence-based and highly targeted nutrition program was introduced and included in the performance-based budgeting initiative.
In Senegal, the government made a policy shift in 2000 from humanitarian assistance in the wake of a crisis to a focus on the more common problem of stunting. The initiative, as in Peru, was driven by political leadership at the highest level. Key elements included: evidence-based programming focusing on high-impact, low-cost interventions; innovative community mobilization approaches including a network of around 10,000 community volunteers grandmother clubs, and pregnant women solidarity circles; inclusive, decentralized management with high levels of community participation supported by a tripartite arrangement between public service providers, NGOs and local government; and integrated service delivery by which the community-based service delivery platform has successfully been used for insecticide-treated bed net distribution, therapeutic care of acute malnutrition; production of iodized salt; home fortification of infant food with micronutrient powders; and targeted food security support. Stunting has come down from more than 30% before 2000 to approximately 19% now.
Madagascar has a prevalence of stunting over 50%, among the highest in the world. The government has a flagship National Community Nutrition Program, now reaching 2.1 million mothers and children under five years of age, delivering growth-monitoring activities, culinary demonstrations, and nutrition education of primary caregivers through a network of over rural 7,000 sites. The results of a long-term impact evaluation of the community-based nutrition program spanning 1998-2011 showed that while the program had a significant impact on weight-for-age (underweight), the short-term small effects on stunting were not sustained in the long run. In 2012, the long term-evaluation results and the emerging global evidence on stunting, spurred the Government to drastically rethink its strategy and scope on multiple fronts. The government is using design tools to better understand maternal behavioral change and rethinking how frontline workers are trained, monitored and motivated. An ongoing trial is testing the cost-effectiveness of lipid-based nutrient supplements (LNS) for pregnant women and children as a preventative tool, as well as the integration of nutrition and early stimulation activities. In addition to strengthening delivery and uptake of nutrition specific interventions, a potential future IDA operation will focus on broadening the scope for nutrition-sensitive interventions through a multi-sectoral approach.
31

Common elements in these three experiences include: political commitment at the highest level; evidence-based planning; integration of community delivery mechanisms and the health system; and an approach that involves leveraging additional impact from nutrition-sensitive approaches.
C. Nutrition-specific interventions – evidence on impacts on cognition So far we have focused on the effects of nutrition-specific interventions on stunting. Many, however, also have effects on adult outcomes in terms cognition, or, depending on the study, completed years of schooling, without necessarily affecting stunting directly (Figure 5 makes this clear).
Table 5 summarizes the evidence on these effects, focusing on the subset of interventions included in the Bhutta et al.1 2013 Lancet nutrition series package to address maternal and child malnutrition during the first 1,000 days of life. (We focus on this list because we estimate the rate of return to this package of interventions in section VI.) The package excludes some health and nutrition interventions that have been shown to have an association with cognition (and long-term human capital outcomes) but not stunting. Deworming during pregnancy and early childhood is one of the excluded interventions. The previous (2008) Lancet nutrition series67 did, in fact, include deworming as an optional intervention to be implemented in areas with high rates of soil helminths. Deworming has a low unit cost per child, and sizable impacts on cognition68,69 (0.15-0.3 SD) and on adult schooling attainment70 (0.3 years of schooling). Another excluded intervention is immunization: the one study to date71 found an impact of about 0.5 SD on cognition. Also excluded is malaria prevention: we found no studies of the cognition effects. We should also emphasize that we are focusing on effects on cognition and years of schooling. Some of the interventions in the Bhutta et al. package may affect incomes through other channels: vitamin A supplementation, for example, has been proven to prevent blindness, with clear implications for productivity.
A new set of meta-analyses and long term longitudinal studies have shown the sizable association between breastfeeding and cognition and schooling in adulthood, with an average effect size of 0.27 SD on cognition.72 The literature has highlighted two mechanisms that explain these effects: a biological one, associated with the presence of fatty acids in breast milk but not in formula milk, and a behavioral one, that relates to an improved mother and child interaction. Two interventions of breastfeeding promotion73 that have been evaluated in developed countries seem to support the importance of the biological link from early brain development to cognition, as neither study found evidence of changes in the quality of mother and child interaction, or of effects on child behavior and noncognitive skills.
Although iodine is a necessary nutrient throughout the life cycle, iodine deficiency during pregnancy has long been recognized to be associated to irreversible effects on brain development.74 The most recent meta-analysis75 summarizes the cognitive deficit of iodine deficiency to be of 7.4 IQ or 0.49 SD in cognitive scores. An important study in Tanzania76 has documented the persistent impact of exposure to a large scale iodine supplementation in utero to grade attainment and progression 10 to 14 years, with an “estimated 0.35–0.56 years of additional schooling relative to siblings and older and younger peers”. Meta-analyses of multiple micronutrient supplementation rely on a limited number of studies that collect information about child development outcomes. 77 Evidence from four efficacy trials documented an average impact on fluid intelligence and academic performance of 0.30 SD. A more recent longitudinal study in Indonesia78 found a sustained effect on child cognition, with the largest effects on women who were malnourished and women who were anemic at the time of enrolment.
32

Table 5: Evidence on the effects of selected nutrition interventions on cognition
Intervention Year
of study
Study # studies
% of studies about a
program (rather
than efficacy
trial)
% high or v. high
quality
% significant effect with 'right' sign
Mean effect across studies significant?
Effect size on cognition/academic
performance
Breastfeeding 2015 Horta et al.79 16 - 100% Yes (0.27 SD) Iodine 2013 Bougma et al.75 24 40% 95% Yes (0.49 SD ,
7.4 IQ) Multiple micronutrients
2010 Eilander et al.77 4 - 100% - Yes (0.30 SD)
VI. THE ECONOMIC RETURNS TO A NUTRITION PROGRAM The systematic reviews and meta-analyses reviewed in section IV suggested that nutrition-specific interventions do not have very large effects on stunting, and often the effects fail to attain statistical significance. This does not mean, however, that the economic returns to such programs are so small as to mean that investing in them is not worthwhile. As has just been seen, nutrition interventions affect cognition as well as (and sometimes instead of) stunting, and cognition affects income. Moreover, to decide whether nutrition-specific programs are a worthwhile investment, we need to know their costs, not just the benefits that they bring through more education, stronger cognitive skills, and increased stature.
In this section we present estimates of the economic returns to implementing a package of nutrition-specific interventions whose costs and stunting impacts have been estimated and reported in a peer-reviewed journal, namely the package devised by Bhutta et al.1 ††† We assume a gradual scale-up of intervention coverage from current rates to 90% (the coverage rate assumed by Bhutta et al.). This package is then implemented each year thereafter at 90% coverage. We estimate the benefits on the assumption that in the absence of the program stunting would have fallen at an annual rate of -1.5% p.a.
A. The Bhutta et al. nutrition package The Bhutta et al. package includes 10 interventions, each of which is assumed to be taken to 90% coverage. The effects on stunting and costs are estimated for 34 countries‡‡‡ that together account for 90% of the world’s stunted children. The interventions (with, in parentheses, annual aggregate costs across the 34 countries in 2010 international dollars) are: (i) salt iodization ($68m), (ii) multiple micronutrient supplementation in pregnancy including iron-folate ($472m), (iii) calcium supplementation in pregnancy ($1,914m), (iv) energy-protein supplementation in pregnancy
††† At the time of writing, this is, in fact, the only package for which both region-specific costs and stunting impacts have been reported in a public-domain document. ‡‡‡ The countries are: Afghanistan, Angola, Bangladesh, Burkina Faso, Cameroon, Chad, Congo, Dem. Rep., Cote d'Ivoire, Egypt, Arab Rep., Ethiopia, Ghana, Guatemala, India, Indonesia, Iraq, Kenya, Madagascar, Malawi, Mali, Mozambique, Myanmar, Nepal, Niger, Nigeria, Pakistan, Philippines, Rwanda, South Africa, Sudan, Tanzania, Uganda, Vietnam, Yemen, Rep., and Zambia.
33

($972m), (v) vitamin A supplementation in childhood ($106m), (vi) zinc supplementation in childhood ($1,182), (vii) breastfeeding promotion ($653m), (viii) complementary feeding education ($269m), (ix) complementary food supplementation ($1,359m), and (x) severe acute malnutrition management ($2,563m). It is important to note that the latter - management of severe acute malnutrition – represents the largest component of the cost, affecting child mortality but not stunting or cognition. Scaling these 10 interventions up to 90% coverage is estimated to reduce stunting across these 34 countries by 20% at an aggregate cost of $9,559m.
B. Methods Suppose we have a nutrition program, like that proposed by Bhutta et al., and we know its costs and its effects on stunting rates and on cognition. We can compute the internal rate of return, i, of the program:
(5) ∑ ∆𝑦𝑦(𝑡𝑡)(1+𝑖𝑖)𝑡𝑡
∞𝑡𝑡=1 = ∑ 𝐶𝐶(𝑡𝑡)
(1+𝑖𝑖)𝑡𝑡∞𝑡𝑡=1
where ∆𝑙𝑙(𝑡𝑡) is the income change due to the program and 𝐶𝐶(𝑡𝑡) is the cost of the program. The internal rate of return is the value of i that equalizes the net present value (NPV) of the benefit stream (the left-hand side) and the NPV of the cost stream (the right-hand side). We can also impose a specific discount rate and compute the NPVs of the benefit and cost streams, and compute the (discounted) benefit-cost ratio.
To get the benefit stream, we can totally differentiate eqn (3) with respect to a nutrition program to get:
(6) d𝑙𝑙𝑙𝑙𝑦𝑦(𝑡𝑡+𝜏𝜏)d𝐷𝐷𝑁𝑁(𝑡𝑡)
= 𝛼𝛼 ��𝑟𝑟 𝜕𝜕𝐸𝐸𝑊𝑊(𝑡𝑡+𝜏𝜏)𝜕𝜕𝑆𝑆𝑊𝑊(𝑡𝑡+𝜏𝜏) + 𝛾𝛾 𝜕𝜕𝐻𝐻𝑊𝑊(𝑡𝑡+𝜏𝜏)
𝜕𝜕𝑆𝑆𝑊𝑊(𝑡𝑡+𝜏𝜏)�𝜕𝜕𝑆𝑆𝑊𝑊(𝑡𝑡+𝜏𝜏)𝜕𝜕𝑆𝑆𝐶𝐶(𝑡𝑡)
d𝑆𝑆𝐶𝐶(𝑡𝑡)d𝐷𝐷𝑁𝑁(𝑡𝑡)
+ 𝛿𝛿 𝜕𝜕𝐶𝐶𝑊𝑊(𝑡𝑡+𝜏𝜏)𝜕𝜕𝐶𝐶𝐶𝐶(𝑡𝑡)
d𝐶𝐶𝐶𝐶(𝑡𝑡)d𝐷𝐷𝑁𝑁(𝑡𝑡)
�
The nutrition program affects income through three channels. The first two are an education effect and a height effect: the program lowers stunting among children today (d𝑆𝑆𝐶𝐶(𝑡𝑡) d𝐷𝐷𝑁𝑁(𝑡𝑡)⁄ ) which leads to a lower childhood stunting rate among workers in years to come (𝜕𝜕𝑆𝑆𝑊𝑊(𝑡𝑡 + 𝜏𝜏) 𝜕𝜕𝑆𝑆𝐶𝐶(𝑡𝑡))⁄ which is associated with a higher level of educational attainment (𝜕𝜕𝐸𝐸𝑊𝑊(𝑡𝑡 + 𝜏𝜏) 𝜕𝜕𝑆𝑆𝑊𝑊(𝑡𝑡))⁄ and increased stature (𝜕𝜕𝐻𝐻𝑊𝑊(𝑡𝑡 + 𝜏𝜏) 𝜕𝜕𝑆𝑆𝑊𝑊(𝑡𝑡))⁄ among future workers, and this translates into higher future incomes (r and γ). The third channel is a cognitive effect: some nutrition interventions increase cognition among children today (d𝐶𝐶𝐶𝐶(𝑡𝑡) d𝐷𝐷𝑁𝑁(𝑡𝑡)⁄ ) without necessarily affecting stunting, and this translates into a higher level of cognition among workers in years to come (𝜕𝜕𝐶𝐶𝑊𝑊(𝑡𝑡 + 𝜏𝜏) 𝜕𝜕𝐶𝐶𝐶𝐶(𝑡𝑡))⁄ , which translates into higher incomes (δ).
Both 𝜕𝜕𝑆𝑆𝑊𝑊(𝑡𝑡 + 𝜏𝜏) 𝜕𝜕𝑆𝑆𝐶𝐶(𝑡𝑡)⁄ , which captures the transmission of changes in stunting among today’s children to the childhood stunting rate among workers 𝜏𝜏 years in the future, and 𝜕𝜕𝐶𝐶𝑊𝑊(𝑡𝑡 + 𝜏𝜏) 𝜕𝜕𝐶𝐶𝐶𝐶(𝑡𝑡)⁄ , which captures the transmission of changes in cognition among today’s children to the cognition among workers 𝜏𝜏 years in the future, depend on 𝜏𝜏. For 𝜏𝜏 < 15, both will be zero, since the beneficiaries of the nutrition interventions have yet to join the labor force. As 𝜏𝜏 increases beyond 15, 𝜕𝜕𝑆𝑆𝑊𝑊(𝑡𝑡 + 𝜏𝜏) 𝜕𝜕𝑆𝑆𝐶𝐶(𝑡𝑡)⁄ and 𝜕𝜕𝐶𝐶𝑊𝑊(𝑡𝑡 + 𝜏𝜏) 𝜕𝜕𝐶𝐶𝐶𝐶(𝑡𝑡)⁄ become positive. If, for example, the rate of childhood stunting were constant in the absence of the program, 𝜕𝜕𝑆𝑆𝑊𝑊(𝑡𝑡 + 𝜏𝜏) 𝜕𝜕𝑆𝑆𝐶𝐶(𝑡𝑡)⁄ would eventually reach 1 and stay at 1. In other words, if 𝜏𝜏 is sufficiently large, a given change in stunting among children at time t will translate into an equal change in the average rate of childhood stunting among workers at time 𝑡𝑡 + 𝜏𝜏. The same logic applies to 𝜕𝜕𝐶𝐶𝑊𝑊(𝑡𝑡 + 𝜏𝜏) 𝜕𝜕𝐶𝐶𝐶𝐶(𝑡𝑡)⁄ .
34

C. Parameters We summarize our assumptions in Table 6.
Table 6: Assumptions in estimating returns to nutrition program
Parameter Assumption Source Counterfactual trends:
Stunting (S) 2016 rate from WDI, closest year. Trend before and after follows -1.5% p.a. growth, based on analysis in section II
Authors’ assumption
Cognition (C) 2016 z-score assumed to be 0.0 SD. No trend assumed
Authors’ assumption
Per capita income (y) 2016 per capita income from WDI, closest year. Country-specific trend thereafter given by country-specific growth rate from IMF WEO forecast, with growth rate being reduced over time according to reciprocal function with 2125 growth rate equal to 50% of 2016 growth rate
Authors’ assumption
Program effects on: Stunting (d𝑆𝑆𝐶𝐶(𝑡𝑡) d𝐷𝐷𝑁𝑁(𝑡𝑡)⁄ ) 20% reduction (assumed relative to
counterfactual). Program assumed to be scaled up over 10-year period, 20% reduction below trend being reached in 2025. Program remains in place thereafter so stunting remains 20% below trend thereafter
Bhutta et al.1
Cognition (d𝐶𝐶𝐶𝐶(𝑡𝑡) d𝐷𝐷𝑁𝑁(𝑡𝑡)⁄ ) 0.487 extra SDs of cognition relative to counterfactual. Program assumed to be scaled up over 10-year period, 0.487 increase above trend being reached in 2025. Program remains in place thereafter so cognition remains 0.487 SDs above trend thereafter
See table 1. For each intervention in Table 5 we multiply the estimated cognition effect by 0.9 minus the fraction of children currently covered by the intervention. Current intervention coverage rates from various sources.§§§
Transmission of effects from childhood to adulthood
Stunting (𝜕𝜕𝑆𝑆𝑊𝑊(𝑡𝑡 + 𝜏𝜏) 𝜕𝜕𝑆𝑆𝐶𝐶(𝑡𝑡))⁄ Assume 15 years before joining labor force, and adult working life of 40 years
Authors’ assumption Cognition (𝜕𝜕𝐶𝐶𝑊𝑊(𝑡𝑡 + 𝜏𝜏) 𝜕𝜕𝐶𝐶𝐶𝐶(𝑡𝑡))⁄
Effects of stunting on: Education (𝜕𝜕𝐸𝐸𝑤𝑤/𝜕𝜕𝐸𝐸𝑆𝑆𝑤𝑤) -1.594 fewer years of education See Table 1 Height (𝜕𝜕𝐻𝐻𝑤𝑤/𝜕𝜕𝐸𝐸𝑆𝑆𝑤𝑤) -5.981 cm shorter See Table 1
Returns to: Education (r) Region-specific percentage extra income per
extra year of education Montenegro and Patrinos49
Height (γ) 1.7% extra income per extra cm See Table 1 Cognition (δ) 4.3% extra income per extra SD See Table 1
Elasticity of income with respect to human capital, i.e. labor share (α)
0.67 Hanushek and Woessmann43
Program costs Aggregate costs from for WHO groups of countries divided by aggregate population to get per capita costs for each WHO group. Given program assumed to be scaled up over 10-year period, per capita costs also rise accordingly, reaching full per capita cost only in 2025. Cost stays constant thereafter
Bhutta et al.1
Discount rate 5% Authors’ assumption Time horizon 2125 Authors’ assumption
§§§ The coverage rates for breastfeeding and maternal multiple micronutrient supplementation are the same as those used by Bhutta et al in the LiST model. The iodine supplementation coverage indicator is salt iodization; the data are from UNICEF.
35

We compute, for each country, time paths of childhood stunting and cognition without the nutrition program, to which we apply the program effects 𝑑𝑑𝑆𝑆𝐶𝐶(𝑡𝑡) 𝜕𝜕𝐷𝐷𝑁𝑁(𝑡𝑡)⁄ and 𝑑𝑑𝐶𝐶𝐶𝐶(𝑡𝑡) 𝜕𝜕𝐷𝐷𝑁𝑁(𝑡𝑡)⁄ .
We get the counterfactual childhood stunting time path by setting the 2015 childhood stunting rate equal to the latest JME-WDI childhood stunting rate for the country in question, and then assuming that before and after 2015 stunting falls at an annual rate of 1.5% (the rate we computed in section II above). For the counterfactual cognition time path, we assume zero change in the absence of the nutrition program, and assume the z-score is initially zero.
As in a recent World Bank report80, we assume the program goes to scale gradually over a 10-year period between 2016 and 2025, achieving Bhutta et al.’s estimated 20% reduction (compared to the counterfactual) in 2025. This gives us, after 10 years, a value of 𝑑𝑑𝑆𝑆𝐶𝐶(𝑡𝑡) 𝜕𝜕𝐷𝐷𝑁𝑁(𝑡𝑡)⁄ (in terms of year-to-year changes) equal to -3.7%. We assume the program is maintained at the same scale thereafter so the stunting rate remains at 20% below the counterfactual rate for all periods after 2025.
We estimate the change in the cognition z-score attributable to the nutrition program, 𝑑𝑑𝐶𝐶𝐶𝐶(𝑡𝑡) 𝑑𝑑𝐷𝐷𝑁𝑁(𝑡𝑡)⁄ , by multiplying, for each intervention in the Bhutta et al. package, the estimated cognition effect of the intervention (obtained from Table 5) by 0.9 minus the fraction of children currently covered by the intervention. (The effect size is relevant for going from 0% to 100%, whereas the program takes intervention coverage from its current rate to 90%.) We use the estimated mean cognition effects from the meta-analyses summarized in Table 5. The current intervention coverage rates are from various sources.**** We assume the effects are achieved over a 10-year period, in line with the assumption that the program is scaled up gradually over a 10-year period.
To get 𝜕𝜕𝑆𝑆𝑊𝑊(𝑡𝑡 + 𝜏𝜏) 𝜕𝜕𝑆𝑆𝐶𝐶(𝑡𝑡)⁄ and 𝜕𝜕𝐶𝐶𝑊𝑊(𝑡𝑡 + 𝜏𝜏) 𝜕𝜕𝐶𝐶𝐶𝐶(𝑡𝑡)⁄ we need to make assumptions about the number of years before a child starts working (we assume 15 given that stunting rates apply to under-fives) and about the number of years an adult will spend at work (we assume 40). In addition, we need to know the distribution of the population across age groups – not all under-fives will survive through to age 55, some may survive but may migrate elsewhere, etc. We take the age distribution of the population across five-year age bands from 15 through 55 using the WDI population age structure data. These assumptions allow us to quantify how reductions in stunting and increases in cognition among today’s children translate into reductions in childhood stunting rates and increases in cognition among the working-age population in years to come.
We use the same values of α, r, γ, δ, 𝜕𝜕𝐸𝐸𝑊𝑊 𝜕𝜕𝑆𝑆𝑊𝑊⁄ , and 𝜕𝜕𝐻𝐻𝑊𝑊 𝜕𝜕𝑆𝑆𝑊𝑊⁄ as in the previous exercise. Applying these assumptions, and the others listed above, we get a time path for ∆𝑙𝑙𝑙𝑙𝑙𝑙(𝑡𝑡), the percentage change in y(t). To compute the time path for ∆𝑙𝑙(𝑡𝑡), and hence the NPV of the benefit stream, we need to estimate the counterfactual time path for per capita income to which we can apply the estimated percentage change due to the program, ∆𝑙𝑙𝑙𝑙𝑙𝑙(𝑡𝑡). For the counterfactual time path of y(t), we take GNI per capita (converted using PPP) for the latest year from the WDI, and project it forwards, initially using the annual average IMF April 2016 World Economic Outlook (WEO) estimated growth rate over the period 2014-2021, then reducing the growth rate over time asymptotically (via a reciprocal function) until it reaches 50% of the IMF growth rate in 2125.
**** The coverage rates for breastfeeding and maternal multiple micronutrient supplementation are the same as those used by Bhutta et al. in the LiST model. The iodine supplementation coverage indicator is salt iodization; the data are from UNICEF.
36

For costs, we use the program costs computed by Bhutta et al.1 To get the program cost per capita (i.e. per person living in the country, not per under-five child), we take the aggregate program costs for each group of countries in Bhutta et al.’s Web Appendix Panel 15 (the groups are WHO regions), and divide the aggregate cost of each group by the aggregate population of that country group (we take the population data from WDI). As already mentioned, we assume that the scaling-up process takes 10 years, so we assume the full cost per capita is reached only in year 10; in year 9, the cost is 9/10th of the full cost, etc.
D. Results Figure 8 shows the results of our assumptions in terms of trends in stunting. The counterfactual rate of stunting among children falls at 1.5% per year. The nutrition program kicks in in 2016 reducing the rate of stunting among children below the counterfactual; the program reaches its full scale in 2025, at which point the reduction in the rate of stunting below the counterfactual reaches 20%. By 2025, stunting has fallen by 36% compared to its 2010 value – 4 percentage points below the 40% target reduction adopted by the sixty-fifth World Health Assembly. We assume the nutrition program is sustained at scale and thereafter stunting stays at 20% below the counterfactual.
It takes much longer than 10 years for the childhood stunting rate among workers to fall by 20%. The childhood stunting rate among workers in any year is a weighted average of the childhood stunting rates that were prevalent when today’s workers were children. Given the lag between childhood and joining the labor force, and the assumed 40-year working life, the childhood stunting rate among workers today thus exceeds the rate of stunting among today’s children by a large margin. For the same reasons, it is 15 years before the effect of the nutrition program is felt on childhood stunting rates among workers. And even then the decline is slower than the decline 15 years previously in the stunting rate among under-fives: the rate of stunting among children falls to 20% below its counterfactual value within 10 years of the start of the program; by contrast, it takes 55 years for the childhood stunting rate among workers to fall to 20% below its counterfactual rate.
Figure 8: Reductions in stunting among today’s children and their effects on childhood stunting rates among the workforce in later years
0%
5%
10%
15%
20%
25%
30%
35%
40%
45%
50%
2000 2010 2020 2030 2040 2050 2060 2070 2080 2090 2100 2110 2120
Stunting among today's under-5s (counterfactual)Stunting among today's under-5s (after program)Childhood stunting among today's workforce (counterfactual)Childhood stunting among today's workforce (after program)
37

Figure 9 shows the time path of per capita costs and benefits (in terms of income) for the 34 countries on average. Per capita costs rise from zero in 2015 to $3.85 in 2025 and stay there thereafter. Per capita benefits – in terms of higher incomes – are zero until 2033 when the first cohort benefitting from the scaling-up of the 10 nutrition interventions joins the labor force. Initially the change in per capita income in the country is small, because only the youngest of 40 cohorts in the labor force has benefitted from the scale-up. As time passes, an ever larger fraction of the labor force has benefitted from the scale-up, and the effect on per capita income grows. In addition, as time passes, the counterfactual per capita income that the percentage effect of the program gets applied to increases (on our assumption that economic growth remains positive), so that the benefit in dollar terms of being well nourished in childhood increases.
Figure 9: Time path of per capita costs and benefits of the nutrition program
The internal rate of return results are shown in Table 7 and Figure 10. The rate of return varies from 8.5% to 24%. The average is 16%. The East Asia & Pacific region has the highest rate of return (24%) reflecting the low per capita program cost, the high rate of return to education, the high initial GDP per capita, and the high GDP growth rate. Africa is the region with the lowest rate of return (15%) reflecting the high per capita program cost, the relatively low initial GDP per capita, and the relatively low GDP growth rate; these numbers are offset only partly by the relatively high rate of return to education in Africa. There are variations within regions, of course: India, for example, has a rate of return of 23% reflecting in part India’s low program cost and its high GDP growth rate.
$0
$20
$40
$60
$80
$100
$120
2010 2015 2020 2025 2030 2035 2040 2045 2050
Costs per capita Benefits per capita
38

Table 7: Rates of return to nutrition project, by region
Region No.
countries Stunting
rate
Program cost per capita
Per capita
income
Growth of per capita
income p.a.
Education rate of return
Benefit-cost ratio
Rate of
return
East Asia & Pacific 3 31% $2.63 $8,423 5% 10% 76:1 23.6%
Latin America & Caribbean 1 48% $2.72 $7,510 1% 10% 25:1 20.7%
Middle East & North Africa 2 31% $2.61 $9,733 0% 6% 19:1 19.1%
South Asia 5 46% $2.73 $3,882 4% 7% 23:1 18.7%
Sub-Saharan Africa 21 36% $4.59 $3,119 3% 13% 9:1 14.7%
Total 32 37% $3.85 $4,451 3% 11% 15:1 17.2%
39

Figure 10: Rates of return to nutrition project, by country
Note: number shown on country is benefit-cost ratio.
40

These returns are somewhat lower than the rates of return to World Bank projects where a cost-benefit analysis was undertaken. The World Bank’s Independent Evaluation Group81 reported a median rate of return for World Bank projects over the period 2000-2008 of around 22%. It is true that only half of World Bank projects report an estimate rate of return, and that some sectors (including the Health, Nutrition and Population sector) are consistently less likely to undertake a CBA than others. However, the IEG found similar returns in the sectors that traditionally make less use of CBA.
It should also be kept in mind that our results do not capture the effects of the program on mortality, which are estimated1 to be appreciable. Insofar as the program reduces child mortality, the initial effect will be to reduce the fraction of the population working, i.e. 𝑁𝑁𝑊𝑊 𝑁𝑁⁄ in eqn (1) will fall. This will cause per capita income to fall until the children grow up and join the labor force. Reductions in child mortality are also likely, however, to lead to subsequent changes in fertility behavior, with families reducing their family size as children are more likely to survive childhood. This will push 𝑁𝑁𝑊𝑊 𝑁𝑁⁄ back up and hence dampen the downward pressure on per capita income.
Finally, we should keep in mind that childhood survival is valued in its own right – a more complete cost-benefit analysis would capture the intrinsic value associated with fewer children dying in childhood as a result of the nutrition program. All told, our estimates are probably underestimates of the rate-of-return.
E. Sensitivity analysis Table 8 shows how sensitive the estimated rates of return for the 34 countries overall are to the assumptions used. It is possible that the costs of the program are underestimated if only because the cost estimates do not take into account that unit costs will likely rise as harder-to-reach groups are covered. Doubling the total cost of the program would cut the benefit-cost ratio by almost half, and would cut the rate of return by 20% or 3.4 percentage points. It is also possible that the program’s impacts on stunting are overestimated, in part because many of the effect sizes from the meta-analyses are not statistically significant, and in part because most estimates come from efficacy trials, not at-scale programs. Halving the assumed program effect on stunting from 20% to 10% reduces the benefit-cost ratio by 20% and the rate-of-return by 8% or 1.3 percentage points; it also cuts the estimated reduction in stunting from 36% to 28%. The cognition impacts of the program may also be overestimated for the same reasons. Halving the assumed cognition effects of the program reduces the rate-of-return by 9% or 1.6 percentage points. We also explore the effects of changes in the assumed effects of stunting on years of education and adult height. Halving the assumed effects of stunting on years of education and adult height reduces the overall effect on adult income of being stunted as a child from 28% to 14%, and cuts the benefit-cost ratio by 20% and the rate-of-return by 8% or 1.3 percentage points. If we make all of these changes simultaneously, we end up with an almost 50% reduction in the rate-of-return, equivalent to a reduction of almost 8 percentage points. Finally, reducing the scale-up period from 10 years to one reduces the rate-of-return by 20% or 3.5 percentage points; a 10-year scale-up is considerably more realistic.
41
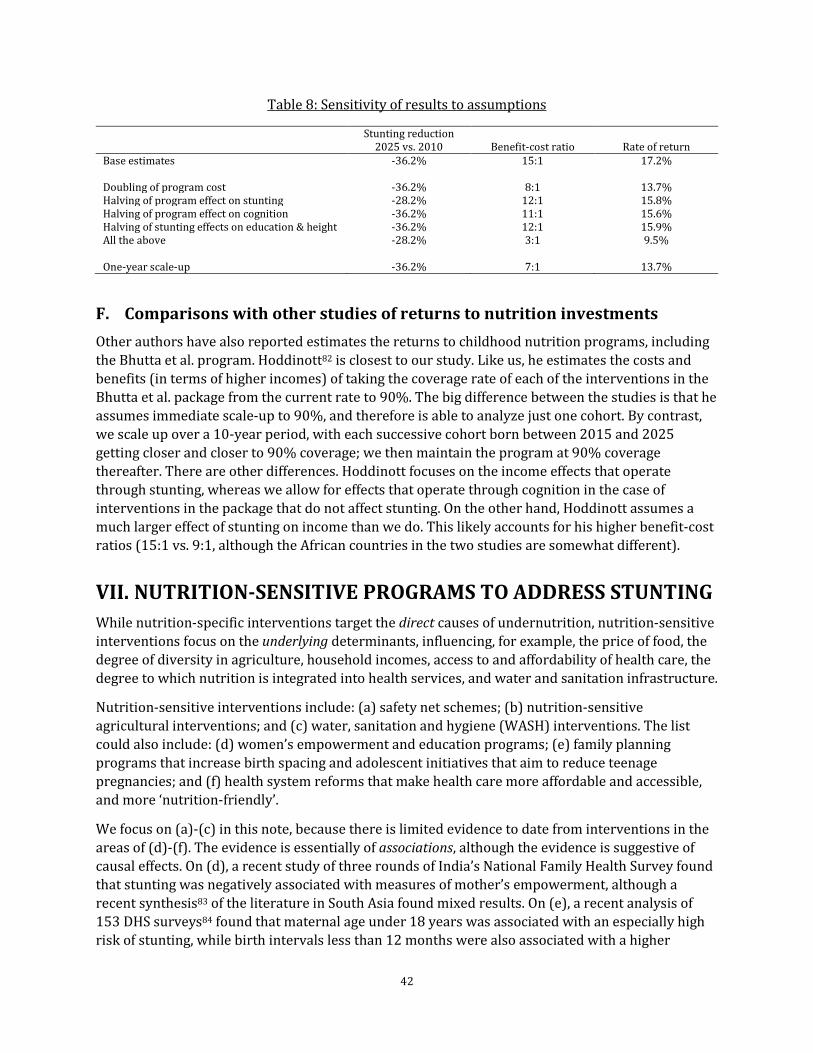
Table 8: Sensitivity of results to assumptions
Stunting reduction 2025 vs. 2010 Benefit-cost ratio Rate of return
Base estimates -36.2% 15:1 17.2% Doubling of program cost -36.2% 8:1 13.7% Halving of program effect on stunting -28.2% 12:1 15.8% Halving of program effect on cognition -36.2% 11:1 15.6% Halving of stunting effects on education & height -36.2% 12:1 15.9% All the above -28.2% 3:1 9.5% One-year scale-up -36.2% 7:1 13.7%
F. Comparisons with other studies of returns to nutrition investments Other authors have also reported estimates the returns to childhood nutrition programs, including the Bhutta et al. program. Hoddinott82 is closest to our study. Like us, he estimates the costs and benefits (in terms of higher incomes) of taking the coverage rate of each of the interventions in the Bhutta et al. package from the current rate to 90%. The big difference between the studies is that he assumes immediate scale-up to 90%, and therefore is able to analyze just one cohort. By contrast, we scale up over a 10-year period, with each successive cohort born between 2015 and 2025 getting closer and closer to 90% coverage; we then maintain the program at 90% coverage thereafter. There are other differences. Hoddinott focuses on the income effects that operate through stunting, whereas we allow for effects that operate through cognition in the case of interventions in the package that do not affect stunting. On the other hand, Hoddinott assumes a much larger effect of stunting on income than we do. This likely accounts for his higher benefit-cost ratios (15:1 vs. 9:1, although the African countries in the two studies are somewhat different).
VII. NUTRITION-SENSITIVE PROGRAMS TO ADDRESS STUNTING While nutrition-specific interventions target the direct causes of undernutrition, nutrition-sensitive interventions focus on the underlying determinants, influencing, for example, the price of food, the degree of diversity in agriculture, household incomes, access to and affordability of health care, the degree to which nutrition is integrated into health services, and water and sanitation infrastructure.
Nutrition-sensitive interventions include: (a) safety net schemes; (b) nutrition-sensitive agricultural interventions; and (c) water, sanitation and hygiene (WASH) interventions. The list could also include: (d) women’s empowerment and education programs; (e) family planning programs that increase birth spacing and adolescent initiatives that aim to reduce teenage pregnancies; and (f) health system reforms that make health care more affordable and accessible, and more ‘nutrition-friendly’.
We focus on (a)-(c) in this note, because there is limited evidence to date from interventions in the areas of (d)-(f). The evidence is essentially of associations, although the evidence is suggestive of causal effects. On (d), a recent study of three rounds of India’s National Family Health Survey found that stunting was negatively associated with measures of mother’s empowerment, although a recent synthesis83 of the literature in South Asia found mixed results. On (e), a recent analysis of 153 DHS surveys84 found that maternal age under 18 years was associated with an especially high risk of stunting, while birth intervals less than 12 months were also associated with a higher
42

stunting risk. And on (f), a recent study85 found that membership of a mutuelle was associated with lower stunting rates among children in Rwanda, a country that has included nutrition services in the insurance benefit package and in most health facilities, while another study86 found that the rollout of Argentina’s universal health coverage programs Plan Nacer and Programa Sumar was associated with reductions in stunting.
The evidence from meta-analyses of safety net schemes, nutrition-sensitive agricultural interventions, and water, sanitation and hygiene (WASH) interventions is summarized in Table 9.††††
†††† Extending cost-benefit analysis to programs that have multiple objectives and goals may be challenging, as it requires to explicit about the relative value of multiple outcomes. This has been a recurrent theme for safety nets schemes, for instance, conditional cash transfers have a joint human capital objective, with benefits is assessed on productivity arguments (from labor market earnings) and equity and redistribution objectives, which are usually not accounted for in the benefit/cost ratios.
43

Table 9: Summary of meta-analyses of effects of nutrition-sensitive interventions on stunting and height
Intervention Delivery mechanism Year of study
Study # studies % of studies about a program (rather than efficacy trial)
% high or v. high quality
% significant effect with 'right' sign
Mean effect across studies significant?
CCT programs Various 2013 Manley, et al.87
15 100% 7% No (0.04 SD)
Water, sanitation and hygiene Various 2013 Dangour, et al.88
7 0% No (0.08 SD)
Home gardens, small livestock production, dairy production, biofortification
Promotion adoption of agriculture or livestock strategies to increase the production of nutrient-rich food
2012 Webb Girard, et al. 89
4 25% No
Home gardens, small livestock, fisheries, aquaculture, dairy development, animal husbandry and poultry development, bio-fortification
Promotion adoption of agriculture or livestock strategies to increase the production of nutrient-rich food
2012 Masset, et al.90
8 12% No
Aquaculture, dairy production, poultry, interventions combined with nutrition education
Promotion of animal production to increase animal source food consumption
2008 Leroy, et al. 91
4
25% No
Home gardens, small livestock production, cash cropping, irrigation
Promotion adoption of agriculture or livestock strategies to increase the production of nutrient-rich food
2004 Berti, et al. 92
13 7% 15% n/a
44

A. Safety net schemes By providing income or in-kind benefits to poor and vulnerable households, safety net schemes can play a dual role of reducing the incidence of stunting, as well as protecting children from the long term human capital cost of shocks. Their attractiveness to accelerate progress, relies on the fact that they are often implemented at scale, and often explicitly target and reach poor and vulnerable populations.93,94 A recent meta-analysis87 of 17 conditional- and unconditional cash transfer schemes in 12 countries found that the 17 programs, on average, increased HAZ by 0.025, but the effect was not significant; the six studies that analyzed linear height effects found, on average, a significant but small effect of just 0.6 cm. This is in line with the conclusions of other reviews.5,95,96
A number of key factors are likely to make it more likely that a cash transfer program produces changes in food consumption and diet diversity and hence more likely to reduce stunting. One is whether the target population includes children in the first 1,000 days and for a sufficient duration of exposure. A recent study found that being covered by the US food stamp program mattered only if the coverage was in early childhood.97 By contrast, insofar as school-feeding programs (which target an older age group) have any effect on height, it is mostly on that of younger siblings, and typically not the height of the school-age children (though there are exceptions).98
A second factor affecting the effectiveness of CCT programs on stunting is whether they are geared to cushioning children from the effects of economic and other ‘shocks’. The negative effects of shocks on young children are well known: a study of drought in Zimbabwe, for example, found that children aged 12 to 24 months lost 1.5-2 cm of growth as a result of the drought, while older children did not experience any slowdown in growth.99 That safety nets can help cushion against such shocks is illustrated by two recent studies. One100 examines Indonesia’s supplementary feeding program rolled out as a response to the 1998 crises. The program provided energy and proteins, and was targeted to children aged 6-60 months. The study found that toddlers aged 12-24 months and young children aged 24-60 months with 1 year of exposure to the program experienced increases of 0.11 and 0.13 SD deviations in HAZ respectively, and 15% and 27% reductions in the probability of severe stunting. The second study101 examines the introduction of a national midday meal program in India on height among primary school students: the study found that the program had large and significant height effects but only for children whose families suffered from drought.
B. Nutrition-sensitive agricultural interventions Agriculture is the main occupation of a large fraction of people living under $1.90 a day and investments that increase agricultural productivity and food supply are potentially an important way to address undernutrition. While many agricultural interventions such as irrigation, watershed management, and agriculture extension might have an indirect effect on nutrition, the meta-analyses to date include only agriculture interventions that have a specific nutrition objective, or are considered ‘nutrition-sensitive’. More generally, policies that impact food systems (such as agricultural research, taxes or regulations) rather than specific interventions might have a larger impact on stunting102, though evidence of the effectiveness of such general equilibrium policies is lacking,
45

Specific agricultural or livestock interventions that promote access to more nutritious and diversified diets could translate into improved nutrition directly by improving incomes and indirectly by dietary diversity in home consumption. Major nutrition-sensitive approaches include home gardens, and home gardens enhanced with micro-nutrient rich fruits and vegetables. Given the critical importance of animal-source food for linear growth103, there is also interest in targeting livestock and livelihood programs to be more nutrition-sensitive, with poultry rearing and dairy production promoting egg and milk consumption among children and egg consumption among women.
The four meta-analyses available to date5,90,104,105 found a few small-scale studies (many have limited information on nutritional outcomes). The studies are often underpowered to detect nutritional effects, and to identify pathways of impact. There is no evidence so far that homestead production or small livestock interventions have a significant impact on child nutrition outcomes and stunting.5,89 Most interventions at best promote intake of vitamin A or diet diversity, with some interventions improving short-term wasting or morbidity. Integration with nutrition education or specific nutrition goals might be needed to realize the potential for these targeted agricultural interventions. All nutrition-sensitive agricultural programs also point to targeting women, or including women’s empowerment activities such as improvements on their control over income and assets, or through improvements in their knowledge and practices through behavioral change as a key pathway through which these targeted agricultural interventions are likely to translate into improved nutrition.
The verdict is still open on bio-fortification, which involves breeding staple crops that are rich in key micronutrients. The only effectiveness studies available refer to vitamin A in orange-flesh sweet potatoes, with agriculture interventions (distribution of vines and agriculture extension) targeted to female farmers, combined with nutrition education about its value of home consumption: evaluations of small scale pilots in Mozambique106 show improved knowledge, as well as increased linear growth.
C. Water, sanitation and hygiene (WASH) interventions Poor sanitation (and associated open defecation) can lead to stunting through three channels: diarrheal diseases, environmental enteropathy‡‡‡‡ and nematode infections§§§§. A recent study pooling Demographic and Health Surveys from a large number of countries38 found that access to improved water and especially sanitation was associated with significantly lower risks of child diarrhea, child mortality and stunting. However, interventions aimed at improving infrastructure (access and quality of water or sanitation facilities) and/or behavior (e.g. open defecation, hand-washing) have had limited impacts on stunting, per se, although they have shown to be effective at reducing child mortality or diarrhea incidence, a risk factor for both child mortality and stunting. A recent meta-analysis88 examined the effects on height of WASH interventions designed to: (i) improve the microbiological quality of drinking water or protect the microbiological quality of water prior to consumption; (ii) introduce new or improved water supply or improve distribution;
‡‡‡‡ Also called tropical enteropathy – a subclinical condition caused by constant fecal-oral contamination and resulting in blunting of intestinal villi and intestinal. §§§§ In humans, these include ascariasis, trichuriasis, hookworm, enterobiasis, strongyloidiasis, filariasis and trichinosis.
46

(iii) introduce or expand the coverage and use of facilities designed to improve sanitation; or (iv) promote handwashing with soap after defecation and disposal of child feces, and prior to preparing and handling food. The meta-analysis, covering 4,627 children, identified a borderline statistically significant effect of WASH interventions on HAZ. Those that appeared to have a (small) benefit were solar disinfection of water, provision of soap, and improvement of water quality.
Existing systematic reviews and meta analyses of the impact of WASH interventions on diarrhea incidence107,108 have been limited by a small number of high-quality studies or by the failure to achieve coverage and near universal use (in order to account for externalities of recontamination in the transmission of pathogens).109,110 A recent study that provided an integrated water and sanitation improvement in India, and ensured universal coverage of all households in the participating villages, showed short-term and long-term reductions in diarrhea episodes (by 30-50%), with important complementarities between water and sanitation improvements.111
A recent multi-country study on health promotion in campaigns designed to eliminate open defecation in four countries, showed that full eradication of open defecation at the village level is a necessary to increase child height, with an average effect size of 0.44 standard deviations in child height-for-age. The biggest potential gains were also shown to materialize in areas where the prevalence of open defecation is the highest.112 In addition, the multi-country study suggested that combining the expansion of sanitation facilities with individual subsidies, and an intensive behavioral change intervention strategy in sanitation (such as in the case of community-led total sanitation campaign in Mali) might be necessary to obtain meaningful improvements in height. Large infrastructure investments in access to water and sanitation, however, might be costly in low-income and sparsely populated environments. Recent studies on the effectiveness of child and environmental interventions in addressing diarrhea in low-income countries highlight handwashing and point-of-use water treatment as effective strategies in reducing diarrhea, though there is still limited knowledge about ways to promote household take-up and participation.113
VIII. LOWERING THE COSTS OF STUNTING AND RAISING THE RETURNS TO NUTRITION INTERVENTIONS
As was seen in section IV, the total costs of stunting to a country – in terms of the income lost – depends on the rate of childhood stunting among workers. The obvious way to reduce these costs (tomorrow) is to reduce the rate of childhood stunting (today). The other way to reduce the costs of stunting is to make childhood stunting matter less, by cutting the education and cognition deficits associated with being stunted. Early child development (ECD) programs, including those that focus on promoting better parenting and increased early stimulation and learning, have in general proved an effective way of promoting cognitive and socio-emotional development among young children, prompting the question of whether enrolling stunted children – and children at risk of being stunted – and their families in such programs might limit the damaging effects of stunting on cognition, educational attainment and success later in life. In terms of eqn (4), the question is whether ECD programs could reduce the (absolute) size of 𝜕𝜕𝐸𝐸𝑊𝑊 𝜕𝜕𝑆𝑆𝑊𝑊⁄ and 𝜕𝜕𝐶𝐶𝑊𝑊 𝜕𝜕𝑆𝑆𝑊𝑊⁄ .
ECD programs are also relevant to the question of the size of the rate-of-return to nutrition interventions. This depends, as was seen in section V, on the effect of the nutrition program on cognitive development, i.e. (d𝐶𝐶𝐶𝐶(𝑡𝑡) d𝐷𝐷𝑁𝑁(𝑡𝑡)⁄ in eqn (6). It is possible that this effect might be increased if there are ECD interventions delivered in tandem with the nutrition intervention. Even
47
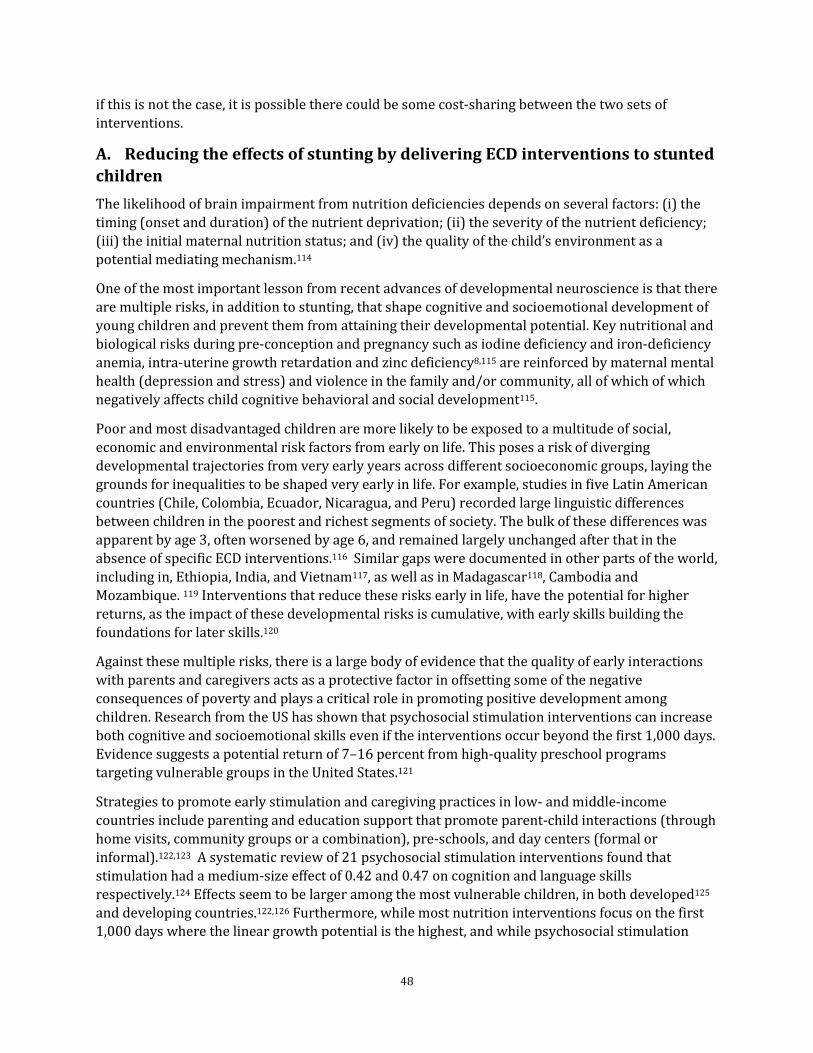
if this is not the case, it is possible there could be some cost-sharing between the two sets of interventions.
A. Reducing the effects of stunting by delivering ECD interventions to stunted children The likelihood of brain impairment from nutrition deficiencies depends on several factors: (i) the timing (onset and duration) of the nutrient deprivation; (ii) the severity of the nutrient deficiency; (iii) the initial maternal nutrition status; and (iv) the quality of the child’s environment as a potential mediating mechanism.114
One of the most important lesson from recent advances of developmental neuroscience is that there are multiple risks, in addition to stunting, that shape cognitive and socioemotional development of young children and prevent them from attaining their developmental potential. Key nutritional and biological risks during pre-conception and pregnancy such as iodine deficiency and iron-deficiency anemia, intra-uterine growth retardation and zinc deficiency8,115 are reinforced by maternal mental health (depression and stress) and violence in the family and/or community, all of which of which negatively affects child cognitive behavioral and social development115.
Poor and most disadvantaged children are more likely to be exposed to a multitude of social, economic and environmental risk factors from early on life. This poses a risk of diverging developmental trajectories from very early years across different socioeconomic groups, laying the grounds for inequalities to be shaped very early in life. For example, studies in five Latin American countries (Chile, Colombia, Ecuador, Nicaragua, and Peru) recorded large linguistic differences between children in the poorest and richest segments of society. The bulk of these differences was apparent by age 3, often worsened by age 6, and remained largely unchanged after that in the absence of specific ECD interventions.116 Similar gaps were documented in other parts of the world, including in, Ethiopia, India, and Vietnam117, as well as in Madagascar118, Cambodia and Mozambique. 119 Interventions that reduce these risks early in life, have the potential for higher returns, as the impact of these developmental risks is cumulative, with early skills building the foundations for later skills.120
Against these multiple risks, there is a large body of evidence that the quality of early interactions with parents and caregivers acts as a protective factor in offsetting some of the negative consequences of poverty and plays a critical role in promoting positive development among children. Research from the US has shown that psychosocial stimulation interventions can increase both cognitive and socioemotional skills even if the interventions occur beyond the first 1,000 days. Evidence suggests a potential return of 7–16 percent from high-quality preschool programs targeting vulnerable groups in the United States.121
Strategies to promote early stimulation and caregiving practices in low- and middle-income countries include parenting and education support that promote parent-child interactions (through home visits, community groups or a combination), pre-schools, and day centers (formal or informal).122,123 A systematic review of 21 psychosocial stimulation interventions found that stimulation had a medium-size effect of 0.42 and 0.47 on cognition and language skills respectively.124 Effects seem to be larger among the most vulnerable children, in both developed125 and developing countries.122,126 Furthermore, while most nutrition interventions focus on the first 1,000 days where the linear growth potential is the highest, and while psychosocial stimulation
48

interventions may have the largest impact in this window too, the window for the highest sensitivity to investments in child development extends right up to before school age.127
Key in the present context is the emerging evidence that effects of ECD interventions on cognitive development seem to be just as large – if not larger – among stunted children. Ongoing work in Malawi128 finds larger impacts on cognitive development of an ECD program among children with lower HAZ scores, although the program’s impacts were not sustained. Similarly, ongoing work in Mozambique129 finds larger impacts of cognitive development of an ECD program among stunted children.
The most striking evidence, however, comes from a randomized psychosocial stimulation intervention conducted in 1986-1987 in Jamaica which found lasting impacts that were especially pronounced among children who were stunted when they were in the program.130 The intervention involved weekly visits from community health workers over a 2-year period that taught parenting skills and encouraged mothers and children to interact in ways that would develop cognitive and socioemotional skills. Follow-up studies found that the intervention increased cognitive capacity compared to the control group of stunted children, so much so that it eliminated the gap on most tests between the stunted intervention group and a non-stunted comparison group.56 Authors of a later study re-interviewed study participants 20 years later found that the intervention increased earnings by 25%.130 Moreover, the effect was large enough for the intervention group to catch up with the earnings of a non-stunted comparison group that was identified at baseline.
B. Synergies and scope economies between nutrition and ECD interventions
There are two reasons why the returns to nutrition interventions might be increased by having ECD interventions alongside them: the benefits may be greater (having both interventions at the same time increases the effects of each intervention); and the costs may be reduced through economies of scope (e.g. both sets of interventions are delivered using the same staff or same offices).
The very limited evidence to-date does not, in fact, support the hypothesis that the effects of a nutrition intervention can be increased by delivering ECD interventions in tandem. Rather, programs that combine nutrition and psychosocial stimulation interventions to jointly promote the optimal development across domains show additive but mostly non-synergistic effects; however, these programs have still to be tested at scale.5,131 Even in the absence of complementarities on the benefit side (e.g. the benefits are additive), there might be economies of scale or scope to integration or sequencing interventions – if the economies of scope are sufficiently large, the returns might be larger despite the absence of synergies in benefits. The integrated nutrition and stimulation program implemented by Lady Health Workers in Pakistan provides a possible example.132 The evidence suggests that combining the two sets of interventions did not enhance the effects of either, and may have even reduced the effect size. However, since the interventions were delivered by the same health worker, there were presumably substantial cost savings to having the two sets of interventions delivered separately, so that the return could still have been increased through joint delivery.
IX. Conclusions Despite a downward trend, 163 million children worldwide were stunted in 2015. On current trends, stunting will fall by only 20% between 2010 and 2025 – just half of the SDG target
49

reduction. The high rate of stunting and the slow reduction matter in their own right. But they matter from an economic point of view too: because of impaired cognitive development, less schooling, and reduced stature, stunting represents a loss of potential output for an economy. Our calculations suggest that per capita income today is probably 7% lower than it would have been if none of today’s workers had been stunted in childhood. In Africa and S Asia this ‘stunting penalty’ is likely to be even higher – around 9-10% of GDP per capita.
What can be done? Reducing stunting through nutrition-specific interventions, such as breastfeeding counselling and micronutrient supplementation, is one option. The impacts of such interventions on stunting are not especially large, but neither – for the most part – are their costs. And because the economic consequences of stunting are large, even small changes in stunting can have large economic effects. We estimate that scaling up to 90% coverage a package of 10 nutrition-specific interventions in 34 countries over a period of 10 years would take the stunting rate in 2025 down to 36% below to its 2010 value – 4 percentage points shy of the 40% SDG target reduction. We estimate a rate-of-return for the 34 countries as a whole of 17%, with a benefit-cost ratio of 15:1. If we allow for the possibility that the assumed program effect on stunting might be overestimated, and halve the assumed effect, the rate-of-return falls to 14%, which is still respectable; however, the percentage reduction in stunting falls to 28%, which is some way off the SDG target.
More therefore likely needs to be done. Two strategies suggest themselves, one directed at reducing stunting, the other at reducing the negative consequences of stunting. The first is to broaden out beyond nutrition-specific interventions to include nutrition-sensitive interventions, such as water and sanitation (and complementary behavior change interventions), agriculture interventions, and safety net schemes. Our review of the available systematic reviews and meta-analyses suggest that these interventions may have modest effects on stunting, but they are likely worth trying. A key part of the knowledge agenda here is to test the effects on stunting of interventions aimed at promoting female empowerment, improving family planning, and increasing the access to and affordability of health services – the effects of these are not well established. The second strategy is to ensure that efforts are made to limit the cognitive effects of early malnutrition by exposing stunted children to ECD interventions including beyond the first 1,000 days – the evidence suggests that stunted children may benefit as much, if not more, than their non-stunted peers. This will not help reduce stunting, but it will help limit the economic costs of stunting. And that is a prize worth having.
50

References
1. Bhutta ZA, Das JK, Rizvi A, et al. Evidence-based interventions for improvement of maternal and child nutrition: what can be done and at what cost? Lancet 2013; 382(9890): 452-77. 2. UNICEF, WHO, World Bank Group. UNICEF, WHO, World Bank Group joint child malnutrition estimates - Levels and trends in child malnutrition: Key findings of the 2015 edition. New York, Geneva, Washington DC: UNICEF, WHO, World Bank Group, 2015. 3. Lewit EM, Kerrebrock N. Population-based growth stunting. The Future of Children 1997; 7(2): 149-56. 4. de Onis M, Dewey KG, Borghi E, et al. The World Health Organization's global target for reducing childhood stunting by 2025: rationale and proposed actions. Matern Child Nutr 2013; 9 Suppl 2: 6-26. 5. Ruel MT, Alderman H, Maternal, Child Nutrition Study G. Nutrition-sensitive interventions and programmes: how can they help to accelerate progress in improving maternal and child nutrition? Lancet 2013; 382(9891): 536-51. 6. Bredenkamp C, Buisman LR, Van de Poel E. Persistent inequalities in child undernutrition: evidence from 80 countries, from 1990 to today. International Journal of Epidemiology 2014. 7. Wagstaff A, Bredenkamp C, Buisman LR. Progress on Global Health Goals: Are the Poor Being Left Behind? World Bank Research Observer 2014; 29 2: 137-62. 8. Grantham-McGregor S, Cheung YB, Cueto S, et al. Developmental potential in the first 5 years for children in developing countries. Lancet 2007; 369(9555): 60-70. 9. Fernald LC, Grantham-McGregor SM. Growth Retardation Is Associated with Changes in the Stress Response System and Behavior in School-Aged Jamaican Children. The Journal of Nutrition 2002; 132(12): 3674-9. 10. Blair C, Razza RP. Relating Effortful Control, Executive Function, and False Belief Understanding to Emerging Math and Literacy Ability in Kindergarten. Child Development 2007; 78(2): 647-63. 11. Victora CG, Adair L, Fall C, et al. Maternal and child undernutrition: consequences for adult health and human capital. Lancet 2008; 371(9609): 340-57. 12. Mendez MA, Adair LS. Severity and timing of stunting in the first two years of life affect performance on cognitive tests in late childhood. J Nutr 1999; 129(8): 1555-62. 13. Grantham-McGregor S. Linear growth retardation and cognition. Lancet 2002; 359(9306): 542. 14. Berkman DS, Lescano AG, Gilman RH, Lopez SL, Black MM. Effects of stunting, diarrhoeal disease, and parasitic infection during infancy on cognition in late childhood: a follow-up study. Lancet 2002; 359(9306): 564-71. 15. Glewwe P, Jacoby HG. An Economic Analysis of Delayed Primary School Enrollment in a Low Income Country: The Role of Early Childhood Nutrition. Review of Economics and Statistics 1995; 77 1: 156-69. 16. Glewwe P, Jacoby HG, King EM. Early Childhood Nutrition and Academic Achievement: A Longitudinal Analysis. Journal of Public Economics 2001; 81 3: 345-68. 17. Hoddinott J, Alderman H, Behrman JR, Haddad L, Horton S. The economic rationale for investing in stunting reduction. Matern Child Nutr 2013; 9 Suppl 2: 69-82. 18. Behrman JR. Chapter 73 - Investment in Education—Inputs and Incentives*. In: Dani R, Mark R, eds. Handbook of Development Economics: Elsevier; 2010: 4883-975. 19. Hanushek EA, Woessmann L. The role of cognitive skills in economic development. Journal of economic literature 2008; 46(3): 607-68. 20. Lochner L. Non-Production Benefits of Education: Crime, Health, and Good Citizenship. In: E. Hanushek SM, and L. Woessmann (eds.), ed. Handbook of the Economics of Education. Amsterdam: : Elsevier Science.; 2011. 21. Coly AN, Milet J, Diallo A, et al. Preschool stunting, adolescent migration, catch-up growth, and adult height in young senegalese men and women of rural origin. J Nutr 2006; 136(9): 2412-20.
51

22. Alderman H, Hoddinott J, Kinsey B. Long Term Consequences of Early Childhood Malnutrition. Oxford Economic Papers 2006; 58 (3): 450-74. 23. Stein AD, Wang M, Martorell R, et al. Growth patterns in early childhood and final attained stature: data from five birth cohorts from low- and middle-income countries. Am J Hum Biol 2010; 22(3): 353-9. 24. Attanasio O, Meghir C, Nix E. Human Capital Development and Parental Investment in India. National Bureau of Economic Research, Inc, NBER Working Papers: 21740; 2015. 25. Adair LS. Filipino Children Exhibit Catch-Up Growth from Age 2 to 12 Years. The Journal of Nutrition 1999; 129(6): 1140-8. 26. Mani S. Is there Complete, Partial, or No Recovery from Childhood Malnutrition? – Empirical Evidence from Indonesia*. Oxford Bulletin of Economics and Statistics 2012; 74(5): 691-715. 27. Crookston BT, Schott W, Cueto S, et al. Postinfancy growth, schooling, and cognitive achievement: Young Lives. The American Journal of Clinical Nutrition 2013; 98(6): 1555-63. 28. Lundeen EA, Behrman JR, Crookston BT, et al. Growth faltering and recovery in children aged 1–8 years in four low- and middle-income countries: Young Lives. Public health nutrition 2014; 17(9): 2131-7. 29. Crookston BT, Penny ME, Alder SC, et al. Children who recover from early stunting and children who are not stunted demonstrate similar levels of cognition. J Nutr 2010; 140(11): 1996-2001. 30. Horta BL, Sibbritt DW, Lima RC, Victora CG. Weight catch-up and achieved schooling at 18 years of age in Brazilian males. Eur J Clin Nutr 2009; 63(3): 369-74. 31. Horta BL, Victora CG, Lima RC, Post P. Weight gain in childhood and blood lipids in adolescence. Acta Paediatr 2009; 98(6): 1024-8. 32. Monteiro POA, Victora CG. Rapid growth in infancy and childhood and obesity in later life – a systematic review. Obesity Reviews 2005; 6(2): 143-54. 33. Vogl TS. Height, Skills, and Labor Market Outcomes in Mexico. Journal of Development Economics 2014; 107: 84-96. 34. LaFave D, Thomas D. Height and Cognition at Work: Labor market performance in a low income setting. 2013. 35. Ramakrishnan U, Martorell R, Schroeder DG, Flores R. Role of Intergenerational Effects on Linear Growth. The Journal of Nutrition 1999; 129(2): 544. 36. Özaltin E, Hill K, Subramanian SV. Association of maternal stature with offspring mortality, underweight, and stunting in low- to middle-income countries. JAMA 2010; 303(15): 1507-16. 37. Black RE, Allen LH, Bhutta ZA, et al. Maternal and child undernutrition: global and regional exposures and health consequences. The lancet 2008; 371(9608): 243-60. 38. Fink G, Günther I, Hill K. The effect of water and sanitation on child health: evidence from the demographic and health surveys 1986–2007. International Journal of Epidemiology 2011; 40(5): 1196-204. 39. Checkley W, Buckley G, Gilman RH, et al. Multi-country analysis of the effects of diarrhoea on childhood stunting. International Journal of Epidemiology 2008; 37(4): 816-30. 40. Hoddinott J, Maluccio J, Behrman JR, et al. The consequences of early childhood growth failure over the life course. International food policy research institute paper. Washington, DC: IFPRI; 2011. 41. Richter LM, Victora CG, Hallal PC, et al. Cohort Profile: The Consortium of Health-Orientated Research in Transitioning Societies. International Journal of Epidemiology 2012; 41(3): 621-6. 42. Alderman HB, J; Puett, C. Big Numbers about Small Children: Estimating the Economic Benefits of Addressing Undernutrition. World Bank Research Observer Forthcoming; 31(2). 43. Hanushek EA, Woessmann L. Schooling, Educational Achievement, and the Latin American Growth Puzzle. Journal of Development Economics 2012; 99 2: 497-512. 44. Weil DN. Accounting for the Effect of Health on Economic Growth. Quarterly Journal of Economics 2007; 122 3: 1265-306.
52

45. Caselli F. Accounting for Cross-Country Income Differences. In: Durlauf PAaSN, ed. Handbook of Economic Growth. New York: North-Holland; 2005: 679–741. 46. Hsieh C-TK, Peter J. Development Accounting. American Economic Journal: Macroeconomics 2010; 2(1): 207-23. 47. Foster AaMR. Microeconomics of technology adoption. Annual Review of Economics 2010; 2: 395-424. 48. Caselli F, Ciccone A. The contribution of schooling in development accounting: Results from a nonparametric upper bound. Journal of Development Economics 2013; 104: 199-211. 49. Montenegro CE, Patrinos HA. Comparable estimates of returns to schooling around the world. The World Bank, Policy Research Working Paper Series: 7020; 2014. 50. Thomas D, Strauss J. Health and Wages: Evidence on Men and Women in Urban Brazil. Journal of Econometrics 1997; 77(1): 159-85. 51. Giles J, Witoelar F. Personal communication. 2016. 52. Bossavie I, Alderman H, Giles J, Mete M. The Effect of Height on Earnings: Is Stature Just a Proxy for Cognitive and Non-Cognitive Skills? Paper presented at the Population Association of America 2015 Annual Meeting, San Diego, CA, April 30–May 2; 2015. 53. Fernald LC, Galasso E, Weber A. Personal communication. 2016. 54. Pitt MM, Rosenzweig MR, Hassan MN. Human Capital Investment and the Gender Division of Labor in a Brawn-Based Economy. American Economic Review 2012; 102 (7): 3531-60. 55. Martorell R, Horta BL, Adair LS, et al. Weight Gain in the First Two Years of Life Is an Important Predictor of Schooling Outcomes in Pooled Analyses from Five Birth Cohorts from Low- and Middle-Income Countries. The Journal of Nutrition 2010; 140(2): 348-54. 56. Walker SP, Chang SM, Powell CA, Grantham-McGregor SM. Effects of early childhood psychosocial stimulation and nutritional supplementation on cognition and education in growth-stunted Jamaican children: prospective cohort study. Lancet 2005; 366(9499): 1804-7. 57. Paciorek CJ, Stevens GA, Finucane MM, Ezzati M, Nutrition Impact Model Study G. Children's height and weight in rural and urban populations in low-income and middle-income countries: a systematic analysis of population-representative data. Lancet Glob Health 2013; 1(5): e300-9. 58. Kang H, Kreuels B, Adjei O, Krumkamp R, May J, Small DS. The causal effect of malaria on stunting: a Mendelian randomization and matching approach. International Journal of Epidemiology 2013; 42(5): 1390-8. 59. Ramakrishnan U, Nguyen P, Martorell R. Effects of micronutrients on growth of children under 5 y of age: meta-analyses of single and multiple nutrient interventions. The American Journal of Clinical Nutrition 2009; 89(1): 191-203. 60. Giugliani ERJ, Horta BL, Loret de Mola C, Lisboa BO, Victora CG. Effect of breastfeeding promotion interventions on child growth: a systematic review and meta-analysis. Acta Paediatrica 2015; 104: 20-9. 61. Imdad A, Yakoob MY, Bhutta ZA. Impact of maternal education about complementary feeding and provision of complementary foods on child growth in developing countries. BMC Public Health 2011; 11(3): 1-14. 62. Yousafzai AK, Rasheed MA, Rizvi A, Armstrong R, Bhutta ZA. Supplementary appendix - Effect of integrated responsive stimulation and nutrition interventions in the Lady Health Worker programme in Pakistan on child development, growth, and health outcomes: a cluster-randomised factorial effectiveness trial. The lancet 2014; 384(9950): 1-4. 63. Dewey KG, Adu-Afarwuah S. Systematic review of the efficacy and effectiveness of complementary feeding interventions in developing countries (Web Appendix 3). Matern Child Nutr 2008; 4 Suppl 1: 24-85 (1-134). 64. Haider BA, Bhutta ZA. Multiple-micronutrient supplementation for women during pregnancy. Cochrane Database of Systematic Reviews 2015; (11).
53

65. Yakoob MY, Theodoratou E, Jabeen A, et al. Preventive zinc supplementation in developing countries: impact on mortality and morbidity due to diarrhea, pneumonia and malaria. BMC Public Health 2011; 11(3): 1-10. 66. Lamberti LM, Zakarija-Grković I, Fischer Walker CL, et al. Breastfeeding for reducing the risk of pneumonia morbidity and mortality in children under two: a systematic literature review and meta-analysis. BMC Public Health 2013; 13(3): 1-8. 67. Bhutta ZA, Ahmed T, Black RE, et al. What works? Interventions for maternal and child undernutrition and survival. The lancet 2008; 371(9610): 417-40. 68. Ozier O. Exploiting externalities to estimate the long-term effects of early childhood deworming. Washington, DC, 2015. 69. Croke K. The long run effects of early childhood deworming on literacy and numeracy: Evidence from Uganda. In: Health HSoP, editor.; 2014. 70. Baird S, Hicks JH, Kremer M, Miguel E. Worms at Work: Long-run Impacts of a Child Health Investment. Quarterly Journal of Economics. 71. Bloom DE, Canning D, Shenoy ES. The Effect of Vaccination on Children's Physical and Cognitive Development in the Philippines. Applied Economics 2012; 44 19-21: 2777-83. 72. Victora CG, Bahl R, Barros AJD, et al. Breastfeeding in the 21st century: epidemiology, mechanisms, and lifelong effect. The Lancet; 387(10017): 475-90. 73. Kramer MS, Chalmers B, Hodnett ED, et al. Promotion of breastfeeding intervention trial (probit): A randomized trial in the republic of belarus. JAMA 2001; 285(4): 413-20. 74. Dunn JT. Iodine Should Be Routinely Added to Complementary Foods. The Journal of Nutrition 2003; 133(9): 3008S-10S. 75. Bougma K, Aboud F, Harding K, Marquis G. Iodine and Mental Development of Children 5 Years Old and Under: A Systematic Review and Meta-Analysis. Nutrients 2013; 5(4): 1384. 76. Field E, Robles O, Torero M. Iodine Deficiency and Schooling Attainment in Tanzania. American Economic Journal: Applied Economics 2009; 1(4): 140-69. 77. Eilander A, Gera T, Sachdev HS, et al. Multiple micronutrient supplementation for improving cognitive performance in children: systematic review of randomized controlled trials. The American Journal of Clinical Nutrition 2010; 91(1): 115-30. 78. Prado E, Sebayang S, Apriatni M, et al. Maternal Multiple Micronutrient Supplementation and Children's Cognition at Age 9-12 Years in Indonesia. The FASEB Journal 2015; 29(1 Supplement). 79. Horta BL, Loret de Mola C, Victora CG. Breastfeeding and intelligence: a systematic review and meta-analysis. Acta Paediatrica 2015; 104: 14-9. 80. World Bank. Investing in nutrition : the foundation for development – an investment framework to reach the global nutrition targets. Report # 104865. Washington, D.C.: World Bank, 2016. 81. World Bank Independent Evaluation Group. Cost-Benefit Analysis in World Bank Projects. Washington, DC: World Bank, 2010. 82. Hoddinott J. The economics of reducing malnutrition in Sub-Saharan Africa, 2016. 83. Cunningham K, Ruel M, Ferguson E, Uauy R. Women's empowerment and child nutritional status in South Asia: a synthesis of the literature. Maternal & Child Nutrition 2015; 11(1): 1-19. 84. Fink G, Sudfeld CR, Danaei G, Ezzati M, Fawzi WW. Scaling-Up Access to Family Planning May Improve Linear Growth and Child Development in Low and Middle Income Countries. PLoS ONE 2014; 9(7): e102391. 85. Lu C, Mejía-Guevara I, Hill K, Farmer P, Subramanian SV, Binagwaho A. Community-Based Health Financing and Child Stunting in Rural Rwanda. American Journal of Public Health 2015; 106(1): 49-55. 86. Nuñez PA, Fernández-Slezak D, Farall A, Szretter ME, Salomón OD, Valeggia CR. Impact of Universal Health Coverage on Child Growth and Nutrition in Argentina. American Journal of Public Health 2016; 106(4): 720-6.
54

87. Manley J, Gitter S, Slavchevska V. How effective are cash transfers at improving nutritional status? World development 2013; 48: 133-55. 88. Dangour AD, Watson L, Cumming O, et al. Interventions to improve water quality and supply, sanitation and hygiene practices, and their effects on the nutritional status of children. Cochrane Database Syst Rev 2013; 8: 1-99. 89. Webb Girard A, Self JL, McAuliffe C, Olude O. The Effects of Household Food Production Strategies on the Health and Nutrition Outcomes of Women and Young Children: A Systematic Review. Paediatric and Perinatal Epidemiology 2012; 26: 205-22. 90. Masset E, Haddad L, Cornelius A, Isaza-Castro J. Effectiveness of agricultural interventions that aim to improve nutritional status of children: systematic review. BMJ 2012; 344. 91. Leroy JL, Gadsden P, Guijarro M. The impact of daycare programmes on child health, nutrition and development in developing countries: a systematic review. Journal of Development Effectiveness 2012; 4(3): 472-96. 92. Berti PR, Krasevec J, FitzGerald S. A review of the effectiveness of agriculture interventions in improving nutrition outcomes. Public Health Nutr 2004; 7(5): 599-609. 93. Alderman H. Can Transfer Programs Be Made More Nutrition Sensitive? Washington, DC: IFPRI Discussion Paper 01342; 2014. 94. Alderman H. Leveraging Social Protection Programs for Improved Nutrition: Summary of Evidence. Gloabl Forum on Nutrition-Sensitive Social Protection Programs; 2015. 95. Fiszbein A, Schady NR, Ferreira FH. Conditional cash transfers: reducing present and future poverty: World Bank Publications; 2009. 96. de Groot R, Palermo T, Handa S, Ragno LP, Peterman A. Cash Transfers and Child Nutrition: What We Know and What We Need to Know. 2015. 97. Hoynes HW, Schanzenbach DW, Almond D. Long run impacts of childhood access to the safety net: National Bureau of Economic Research, 2012. 98. Alderman H, Bundy D. School Feeding Programs and Development: Are We Framing the Question Correctly? The World Bank Research Observer 2011. 99. Hoddinott J, Kinsey B. Child growth in the time of drought. Oxford Bulletin of Economics and statistics 2001; 63(4): 409-36. 100. Giles J, Satriawan E. Protecting Child Nutritional Status in the Aftermath of a Financial Crisis: Evidence from Indonesia. Journal of Development Economics 2015; 114: 97-106. 101. Singh A, Park A, Dercon S. School Meals as a Safety Net: An Evaluation of the Midday Meal Scheme in India. Economic Development and Cultural Change 2014; 62(2): 275-306. 102. Pinstrup-Andersen P. Nutrition-sensitive food systems: from rhetoric to action. The Lancet; 382(9890): 375-6. 103. Puentes E, Wang F, Behrman JR, et al. Early Life Height and Weight Production Functions with Endogenous Energy and Protein Inputs. Economics & Human Biology 2016. 104. Berti PR, Krasevec, J. and FitzGerald, S. . A review of the effectiveness of agriculture interventions in improving nutrition outcomes. Public Health Nutrition 2004; 7(5): 599. 105. Girard AW, Self JL, McAuliffe C, Olude O. The Effects of Household Food Production Strategies on the Health and Nutrition Outcomes of Women and Young Children: A Systematic Review. Paediatric and Perinatal Epidemiology 2012; 26: 205-22. 106. De Brauw A, Eozenou P, Moursi M. Programme Participation Intensity and Children’s Nutritional Status: Evidence from a Randomised Control Trial in Mozambique. The Journal of Development Studies 2015; 51(8): 996-1015. 107. Fewtrell L, Kaufmann RB, Kay D, Enanoria W, Haller L, Colford JM, Jr. Water, sanitation, and hygiene interventions to reduce diarrhoea in less developed countries: a systematic review and meta-analysis. The Lancet Infectious Diseases; 5(1): 42-52.
55

108. Clasen T, Schmidt W-P, Rabie T, Roberts I, Cairncross S. Interventions to improve water quality for preventing diarrhoea: systematic review and meta-analysis. BMJ 2007; 334(7597): 782. 109. Kremer M, Leino J, Miguel E, Zwane AP. Spring Cleaning: Rural Water Impacts, Valuation, and Property Rights Institutions. Quarterly Journal of Economics 2011; 126(1): 145-205. 110. Guiteras RL, James; Mobarak, Ahmed Mushfiq. Encouraging sanitation investment in the developing world: A cluster-randomized trial. Science 2015; 348(6237): 903-6. 111. Duflo EG, Michael; Guiteras, Raymond; Clasen, Thomas. Toilets Can Work: Short and Medium Run Health Impacts of Addressing Complementarities and Externalities in Water and Sanitation: National Bureau of Economic Research, 2015. 112. Gertler PS, Manisha; Alzua, Maria Laura; Cameron, Lisa; Martinez, Sebastian; and Patil, Sumee. How Does Health Promotion Work? Evidence From The Dirty Business of Eliminating Open Defecation, 2015. 113. Zwane AP, Kremer M. What Works in Fighting Diarrheal Diseases in Developing Countries? A Critical Review. The World Bank Research Observer 2007; 22(1): 1-24. 114. Prado EL, Dewey KG. Nutrition and brain development in early life. Nutr Rev 2014; 72(4): 267-84. 115. Walker SP, Wachs TD, Grantham-McGregor S, et al. Inequality in early childhood: risk and protective factors for early child development. Lancet 2011; 378(9799): 1325-38. 116. Schady N, Behrman J, Araujo MC, et al. Wealth Gradients in Early Childhood Cognitive Development in Five Latin American Countries. Penn Institute for Economic Research, Department of Economics, University of Pennsylvania, PIER Working Paper Archive; 2014. p. 21 pages. 117. Fernald LCH, Kariger P, Hidrobo M, Gertler PJ. Socioeconomic gradients in child development in very young children: Evidence from India, Indonesia, Peru, and Senegal. Proceedings of the National Academy of Sciences 2012; 109(Supplement 2): 17273-80. 118. Fernald LCH, Weber A, Galasso E, Ratsifandrihamanana L. Socioeconomic gradients and child development in a very low income population: evidence from Madagascar. Developmental Science 2011; 14(4). 119. Naudeau SM, Sebastian; Premand, Patrick; and Filmer, Deon. Cognitive Development among Young Children in Low-Income Countries. In: Alderman H, ed. No Small Matter: The Impact of Poverty, Shocks, and Human Capital Investments in Early Childhood Development. Washington, D.C.: The World Bank; 2011. 120. Heckman JJ. Skill formation and the economics of investing in disadvantaged children. Science 2006; 312(5782): 1900-2. 121. Heckman JJ, Moon SH, Pinto R, Savelyev PA, Yavitz A. The Rate of Return to the High/Scope Perry Preschool Program. Geary Institute, University College Dublin, Working Papers: 200936; 2009. p. 61 pages. 122. Engle PL, Black MM, Behrman JR, et al. Strategies to avoid the loss of developmental potential in more than 200 million children in the developing world. Lancet 2007; 369(9557): 229-42. 123. Engle PL, Fernald LC, Alderman H, et al. Strategies for reducing inequalities and improving developmental outcomes for young children in low-income and middle-income countries. Lancet 2011; 378(9799): 1339-53. 124. Aboud FE, Yousafzai AK. Global health and development in early childhood. Annu Rev Psychol 2015; 66: 433-57. 125. Heckman JJ, Masterov DV. The productivity argument for investing in young children. Applied Economic Perspectives and Policy 2007; 29(3): 446-93. 126. Engle PL, Fernald LC, Alderman H, et al. Strategies for reducing inequalities and improving developmental outcomes for young children in low-income and middle-income countries. The lancet 2011; 378(9799): 1339-53.
56

127. Shonkoff JP, Garner AS, Committee on Psychosocial Aspects of C, et al. The lifelong effects of early childhood adversity and toxic stress. Pediatrics 2012; 129(1): e232-46. 128. Ozler B, Fernald LC, Kariger P, McConnell C, Neuman MJ. Personal communication. 2016. 129. Besbas B. Personal communication, 2016. 130. Gertler P, Heckman J, Pinto R, et al. Labor market returns to an early childhood stimulation intervention in Jamaica. Science 2014; 344(6187): 998-1001. 131. Grantham-McGregor SM, Fernald LC, Kagawa RM, Walker S. Effects of integrated child development and nutrition interventions on child development and nutritional status. Ann N Y Acad Sci 2014; 1308: 11-32. 132. Yousafzai AK, Rasheed MA, Rizvi A, Armstrong R, Bhutta ZA. Effect of integrated responsive stimulation and nutrition interventions in the Lady Health Worker programme in Pakistan on child development, growth, and health outcomes: a cluster-randomised factorial effectiveness trial. Lancet 2014; 384(9950): 1282-93.
57