the economic effects of significant u.s. import restraints · effects of significant import...
TRANSCRIPT
U.S. INTERNATIONAL TRADE COMMISSION
COMMISSIONERSShara L. Aranoff, Chairman
Daniel R. Pearson, Vice ChairmanDeanna Tanner Okun
Charlotte R. LaneIrving A. Williamson
Dean A. Pinkert
Robert A. RogowskyDirector of Operations
Robert B. KoopmanDirector of Economics
Address all communications toSecretary to the Commission
United States International Trade CommissionWashington, DC 20436
THE ECONOMIC EFFECTS
OF SIGNIFICANT U.S.IMPORT RESTRAINTS
Sixth Update 2009
Investigation No. 332-325
August 2009
Publication 4094
United States International Trade Commission
This report was prepared principally by
Office of EconomicsWilliam Deese, Project Leader
Alan K. Fox and Kyle Johnson,Deputy Project Leaders
Robert Feinberg, Tani Fukui,Jesse Mora, Chuma Onwuka, William M. Powers,
Alison Weingarden, and Edward Wilson
Office of IndustriesJoanna Bonarriva, Andrea Boron, Jeffrey Clark,
John Fry, Erland Herfindahl,Douglas Newman, and George Serletis
General CounselWilliam Gearhart
Primary ReviewersMarinos Tsigas and Heidi Colby-Oizumi
Office of Publishing
With Special Assistance fromAshley Winston
Monash University
Under the direction ofHugh M. Arce
Chief, Research Division, Office of Economics
Contents
Executive Summary . . . . . . . . . . . . . . . . . . . . . . . . ixEffects of Significant Import Restraints . . . . . . . . . . . . . x
Removal of All Significant Restraints . . . . . . . . . . . . xEffects of Sector-by-Sector Liberalization . . . . . . . . . . xii
History of U.S. Trade Policy since 1934 . . . . . . . . . . . . xvHistory of Trade Policy . . . . . . . . . . . . . . . . . . . . xvEconomic Effects of Trade Liberalization . . . . . . . . . . xvii
1 Introduction . . . . . . . . . . . . . . . . . . . . . . . . . . 1Scope and Organization of the Report . . . . . . . . . . . . . 2Approach . . . . . . . . . . . . . . . . . . . . . . . . . . . . 5
Significant Import Restraints . . . . . . . . . . . . . . . . . 5History of U.S. Trade Policy since 1934 . . . . . . . . . . . 6Bibliography . . . . . . . . . . . . . . . . . . . . . . . . . 7
2 Significant Import Restraints . . . . . . . . . . . . . . . . 9Removal of All Significant Restraints . . . . . . . . . . . . . 11
Recent Performance of the U.S. Economy . . . . . . . . . . 11Effects of Liberalization of All Significant Import Restraints 12
Sugar and Sugar-Containing Products . . . . . . . . . . . . . 16Nature of Trade Restraints . . . . . . . . . . . . . . . . . . 18
WTO Agreement on Agriculture TRQs . . . . . . . . . . 19FTA TRQs . . . . . . . . . . . . . . . . . . . . . . . . . 20
Restrictiveness of Trade Restraints . . . . . . . . . . . . . . 20Effects of Liberalization . . . . . . . . . . . . . . . . . . . 21
Ethyl Alcohol . . . . . . . . . . . . . . . . . . . . . . . . . . 24Nature of Trade Restraints . . . . . . . . . . . . . . . . . . 24Restrictiveness of Trade Restraints . . . . . . . . . . . . . . 27Effects of Liberalization . . . . . . . . . . . . . . . . . . . 28
Dairy Products . . . . . . . . . . . . . . . . . . . . . . . . . 28Nature and Restrictiveness of Trade Restraints . . . . . . . 30
i
ii CONTENTS
Effects of Liberalization . . . . . . . . . . . . . . . . . . . 32Tobacco and Tobacco Products . . . . . . . . . . . . . . . . . 33
Nature and Restrictiveness of Trade Restraints . . . . . . . 34Effects of Liberalization . . . . . . . . . . . . . . . . . . . 37
Canned Tuna . . . . . . . . . . . . . . . . . . . . . . . . . . 39Nature and Restrictiveness of Trade Restraints . . . . . . . 40Effects of Liberalization . . . . . . . . . . . . . . . . . . . 40
Textiles and Apparel . . . . . . . . . . . . . . . . . . . . . . 41Nature of Trade Restraints . . . . . . . . . . . . . . . . . . 44
Tariffs . . . . . . . . . . . . . . . . . . . . . . . . . . . 45Preference Programs and Rules of Origin . . . . . . . . . 45
Effects of Liberalization . . . . . . . . . . . . . . . . . . . 47Projected Industry Trends . . . . . . . . . . . . . . . . . 47Deviations from Projected Trends . . . . . . . . . . . . . 47
Other Sectors with Significant Import Restraints . . . . . . . . 50Bibliography . . . . . . . . . . . . . . . . . . . . . . . . . . 55
3 U.S. Trade Policy since 1934 . . . . . . . . . . . . . . . . . 59Introduction . . . . . . . . . . . . . . . . . . . . . . . . . . . 59History of U.S. Trade Policy since 1934 . . . . . . . . . . . . 62
The Reopening of Trade (1934–1941) . . . . . . . . . . . . 63World War II and Postwar Liberalization (1941–1967) . . . 67Restructuring U.S. Trade Policy (1967–1989) . . . . . . . . 70
Voluntary Export Restraints . . . . . . . . . . . . . . . . 71Trade Act of 1974 . . . . . . . . . . . . . . . . . . . . . 73Generalized System of Preferences . . . . . . . . . . . . 75Addressing Nontariff Measures . . . . . . . . . . . . . . 78
The WTO and the Proliferation of FTAs (since 1989) . . . . 80Trade Agreements in North America . . . . . . . . . . . 82The Uruguay Round . . . . . . . . . . . . . . . . . . . . 83The Doha Development Agenda . . . . . . . . . . . . . . 87
The Economic Effects of Trade Liberalization . . . . . . . . . 89Approaches in the Literature . . . . . . . . . . . . . . . . . 91Survey of Economic Literature . . . . . . . . . . . . . . . . 93
Early Literature . . . . . . . . . . . . . . . . . . . . . . 93Tokyo Round and Computational Models . . . . . . . . . 97Recent Literature . . . . . . . . . . . . . . . . . . . . . . 102
Conclusion and Timeline . . . . . . . . . . . . . . . . . . . . 108Timeline of Important U.S. Legislation and Related Events . 109
Bibliography . . . . . . . . . . . . . . . . . . . . . . . . . . 115
CONTENTS iii
A Request Letters . . . . . . . . . . . . . . . . . . . . . . . . 125
B Federal Register Notice . . . . . . . . . . . . . . . . . . . . 131
C Positions of Interested Parties . . . . . . . . . . . . . . . . 137Introduction . . . . . . . . . . . . . . . . . . . . . . . . . . . 139American Sugar Alliance . . . . . . . . . . . . . . . . . . . . 139Meat Importers Council of America . . . . . . . . . . . . . . 140National Milk Producers Federation . . . . . . . . . . . . . . 141Sweetener Users Association . . . . . . . . . . . . . . . . . . 142U.S. Industrial Users Coalition . . . . . . . . . . . . . . . . . 143U.S. Association of Importers of Textiles and Apparel . . . . . 144Bibliography . . . . . . . . . . . . . . . . . . . . . . . . . . 146
D Calendar of Public Hearing . . . . . . . . . . . . . . . . . 149
E The USITC Modeling Framework . . . . . . . . . . . . . . 153Introduction . . . . . . . . . . . . . . . . . . . . . . . . . . . 155Overview of the USAGE-ITC Framework . . . . . . . . . . . 155
Dynamic Mechanisms in the USAGE-ITC Model . . . . . . 157Specification of the USAGE-ITC Model . . . . . . . . . . . 158
Final Demand Behavior . . . . . . . . . . . . . . . . . . 158Production Technology . . . . . . . . . . . . . . . . . . 159Factor Supplies . . . . . . . . . . . . . . . . . . . . . . . 160Trade Equilibrium . . . . . . . . . . . . . . . . . . . . . 160Capital . . . . . . . . . . . . . . . . . . . . . . . . . . . 162Net Foreign Liabilities . . . . . . . . . . . . . . . . . . . 163Public Sector Debt . . . . . . . . . . . . . . . . . . . . . 163Wage Determination in Policy Runs . . . . . . . . . . . . 163
Significant Import Restraint Analysis with USAGE-ITC . . 164USAGE-ITC Data and Parameters . . . . . . . . . . . . . . 165
Setting the Exogenous Variables in the Forecast Simulation 166Macro Variables . . . . . . . . . . . . . . . . . . . . . . 167Technology and Consumer Preferences, Exports and Imports 167Import Prices . . . . . . . . . . . . . . . . . . . . . . . . 168The Balance of Payments, and Foreign Assets and Liabilities 168
Detailed Baseline Projections and Simulation Results . . . . . 170Bibliography . . . . . . . . . . . . . . . . . . . . . . . . . . 191
F Trade Negotiation Tables . . . . . . . . . . . . . . . . . . . 195
Tables
ES.1 Quantifiable significant U.S. import restraints, by sector,2013 . . . . . . . . . . . . . . . . . . . . . . . . . . . . xi
ES.2 Projected welfare from liberalizing significant import re-straints . . . . . . . . . . . . . . . . . . . . . . . . . . . xii
ES.3 All significant import restraints: simulation results, 2013 xiii
1.1 Quantifiable significant U.S. import restraints by sector,2013 . . . . . . . . . . . . . . . . . . . . . . . . . . . . 4
2.1 U.S. national economy, summary data, 2005–07 . . . . 122.2 All significant import restraints: simulation results, 2013 152.3 Sugar: summary data and simulation results . . . . . . . 222.4 Ethyl alcohol: summary data and simulation results . . . 252.5 Dairy products: summary data and simulation results . . 292.6 Tobacco: summary data and simulation results . . . . . . 352.7 Tobacco: TRQ fill rates, allocation and imports . . . . . 362.8 Canned tuna: summary data and simulation results . . . 392.9 Textiles and apparel: summary data and simulation results 432.10 U.S. textiles and apparel imports by source, by value,
percentage change, and share, 2005–07 . . . . . . . . . 442.11 Sectors with significant tariffs: summary data and simula-
tion results . . . . . . . . . . . . . . . . . . . . . . . . . 51
3.1 Trade-weighted average tariffs by selected regions andnegotiating round . . . . . . . . . . . . . . . . . . . . . 79
3.2 Free trade agreements, proposed and implemented . . . . 883.3 A sample of modeling assumptions and approaches . . . 923.4 Pre-Tokyo Round studies . . . . . . . . . . . . . . . . . 973.5 Tokyo Round studies . . . . . . . . . . . . . . . . . . . 983.6 Imports affected by NTMs, 1966 and 1986 . . . . . . . . 1013.7 Uruguay Round studies . . . . . . . . . . . . . . . . . . 1033.8 Doha Round studies . . . . . . . . . . . . . . . . . . . . 107
iv
TABLES v
E.1 Shocked technology and preference variables in the 2005–13 forecast simulation . . . . . . . . . . . . . . . . . . . 168
E.2 Employment in sugar: baseline and liberalization . . . . 171E.3 Output of sugar: baseline and liberalization . . . . . . . 171E.4 Imports of sugar: baseline and liberalization . . . . . . . 172E.5 Exports of sugar: baseline and liberalization . . . . . . . 172E.6 Employment in ethyl alcohol: baseline and liberalization 173E.7 Output of ethyl alcohol: baseline and liberalization . . . 173E.8 Imports of ethyl alcohol: baseline and liberalization . . . 174E.9 Exports of ethyl alcohol: baseline and liberalization . . . 174E.10 Employment in tuna: baseline and liberalization . . . . . 175E.11 Output of tuna: projected baseline and liberalization . . . 175E.12 Imports of tuna: baseline and liberalization . . . . . . . 176E.13 Exports of tuna: baseline and liberalization . . . . . . . 176E.14 Employment in dairy: baseline and liberalization . . . . 177E.15 Output of dairy: baseline and liberalization . . . . . . . 177E.16 Imports of dairy: baseline and liberalization . . . . . . . 178E.17 Exports of dairy: baseline and liberalization . . . . . . . 178E.18 Employment in tobacco: baseline and liberalization . . . 179E.19 Output of tobacco: baseline and liberalization . . . . . . 179E.20 Imports of tobacco: baseline and liberalization . . . . . . 180E.21 Exports of tobacco: baseline and liberalization . . . . . . 180E.22 Employment in textiles and apparel: baseline and liberal-
ization . . . . . . . . . . . . . . . . . . . . . . . . . . . 181E.23 Output of textiles and apparel: baseline and liberalization 182E.24 Imports of textiles and apparel: baseline and liberalization 183E.25 Exports of textiles and apparel: baseline and liberalization 184E.26 Employment in high tariff sectors: baseline and liberaliza-
tion . . . . . . . . . . . . . . . . . . . . . . . . . . . . 185E.27 Output of high tariff sectors: baseline and liberalization . 186E.28 Imports of high tariff sectors: baseline and liberalization 187E.29 Exports of high tariff sectors: baseline and liberalization 188E.30 Projected effect of liberalization of all significant import
restraints . . . . . . . . . . . . . . . . . . . . . . . . . . 189
F.1 Selected U.S. free trade agreements . . . . . . . . . . . 197F.2 Summary of GATT rounds . . . . . . . . . . . . . . . . 198
Figures
2.1 Imports of sugar and ethyl alcohol, baseline and liberaliza-tion . . . . . . . . . . . . . . . . . . . . . . . . . . . . 23
2.2 Output of sugar and ethyl alcohol, baseline and liberaliza-tion . . . . . . . . . . . . . . . . . . . . . . . . . . . . 23
2.3 Renewable fuel standard, 2006–22 . . . . . . . . . . . . 262.4 Imports of dairy, baseline and liberalization . . . . . . . 322.5 Output of dairy, baseline and liberalization . . . . . . . . 332.6 Imports of tobacco and canned tuna, baseline and liberal-
ization . . . . . . . . . . . . . . . . . . . . . . . . . . . 382.7 Output of tobacco and canned tuna, baseline and liberal-
ization . . . . . . . . . . . . . . . . . . . . . . . . . . . 382.8 Output of textiles and apparel, baseline and liberalization 492.9 Imports of textiles and apparel, baseline and liberalization 502.10 Output of sectors with significant tariff restraints, baseline
and liberalization . . . . . . . . . . . . . . . . . . . . . 522.11 Imports of sectors with significant tariff restraints, baseline
and liberalization . . . . . . . . . . . . . . . . . . . . . 522.12 Output of footwear and leather products, baseline and
liberalization . . . . . . . . . . . . . . . . . . . . . . . 532.13 Imports of footwear and leather products, baseline and
liberalization . . . . . . . . . . . . . . . . . . . . . . . 53
3.1 U.S. real GDP and U.S. exports and imports as a share ofGDP, 1930–2008 . . . . . . . . . . . . . . . . . . . . . 60
3.2 U.S. trade-weighted tariffs on dutiable imports and histori-cal periods, 1930–2008 . . . . . . . . . . . . . . . . . . 64
3.3 GATT round summary: number of signatories and weightedaverage tariff reductions . . . . . . . . . . . . . . . . . 69
E.1 Production in the USAGE-ITC Model . . . . . . . . . . 161E.2 Commodity differentiation and sourcing of imports . . . 162
vi
Boxes
2.1 Estimated welfare gains in the Import Restraints series . 102.2 U.S. services trade and import restrictions . . . . . . . . 133.1 Trade remedies . . . . . . . . . . . . . . . . . . . . . . 763.2 Channels of the effects of trade liberalization . . . . . . 943.3 Summary statistics for tariffs . . . . . . . . . . . . . . . 963.4 Computable general equilibrium models . . . . . . . . . 99
vii

Executive Summary
This is the sixth update of The Economic Effects of Significant U.S.Import Restraints. During the almost 20 years since these studies began,tariffs and nontariff measures on imports have fallen, and trade hasexpanded markedly. Through the efforts of policymakers and tradenegotiators that have pursued principles of openness over a number ofyears, the United States has become one of the world’s most openeconomies. Most of the United States’ top trading partners have alsoreduced tariffs. In addition to the analysis of significant import restraints,this report contains a concise summary of the history of U.S. trade policysince 1934.
The Commission estimates that U.S. economic welfare, as defined bytotal public and private consumption, would increase by about $4.6 billionannually by 2013 if all significant restraints quantified in this report wereunilaterally removed. Exports would expand by $5.5 billion and imports by$13.1 billion. These changes would result from removing tariffs and tariff-rate quotas (TRQs) in the following sectors: sugar, ethyl alcohol, cannedtuna, dairy products, tobacco, textiles and apparel, and other manufacturingsectors.1
A common although not universal aspect of liberalization is thatspecific groups, such as workers losing their jobs or communities whereplants close, are more likely to bear the costs of adjustment, whereasthe benefits of liberalization, such as lower prices and greater varietiesof goods, accrue to the public at large. This report does not analyze theextent to which policy measures could facilitate the adjustment process or,
1These include footwear and leather products; glass and glass products; watches,clocks, watch cases, and parts; ball and roller bearings; ceramic and floor tile; table andkitchenware; costume jewelry; pens, mechanical pencils, and parts; dehydrated fruits andvegetables; and cutlery and hand tools.
ix
x EXECUTIVE SUMMARY
more generally, assist the economy to become more broadly competitivein a liberalization context. This report also does not address the effects,especially the employment effects, that would occur if other countriesliberalized trade at the same time.
Effects of Significant Import Restraints
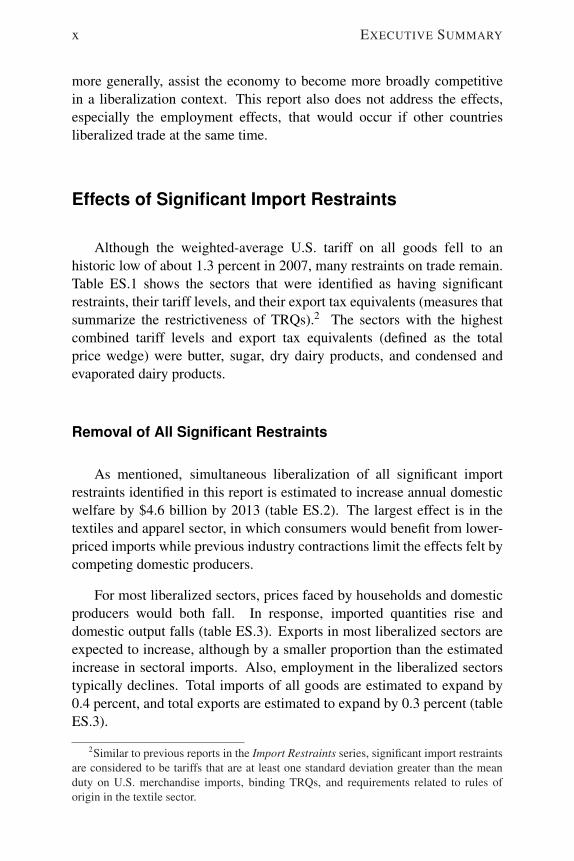
Although the weighted-average U.S. tariff on all goods fell to anhistoric low of about 1.3 percent in 2007, many restraints on trade remain.Table ES.1 shows the sectors that were identified as having significantrestraints, their tariff levels, and their export tax equivalents (measures thatsummarize the restrictiveness of TRQs).2 The sectors with the highestcombined tariff levels and export tax equivalents (defined as the totalprice wedge) were butter, sugar, dry dairy products, and condensed andevaporated dairy products.
Removal of All Significant Restraints
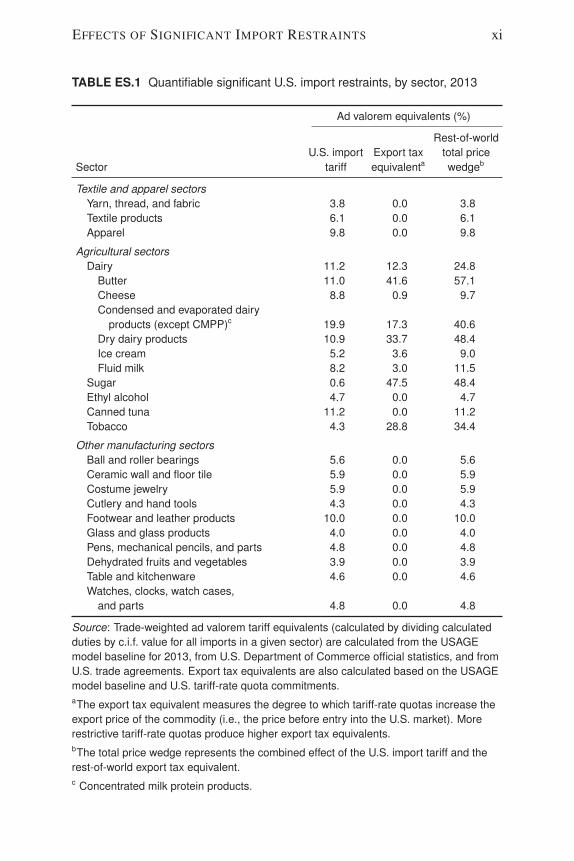
As mentioned, simultaneous liberalization of all significant importrestraints identified in this report is estimated to increase annual domesticwelfare by $4.6 billion by 2013 (table ES.2). The largest effect is in thetextiles and apparel sector, in which consumers would benefit from lower-priced imports while previous industry contractions limit the effects felt bycompeting domestic producers.
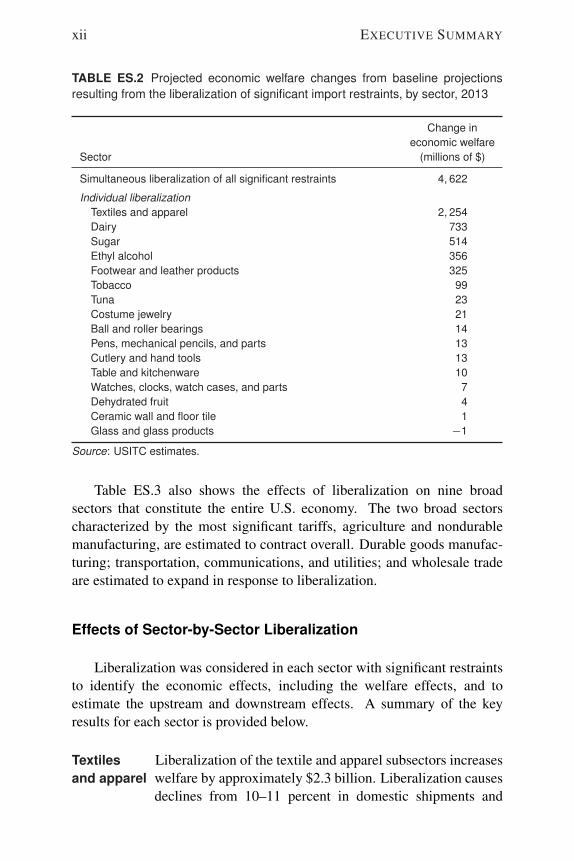
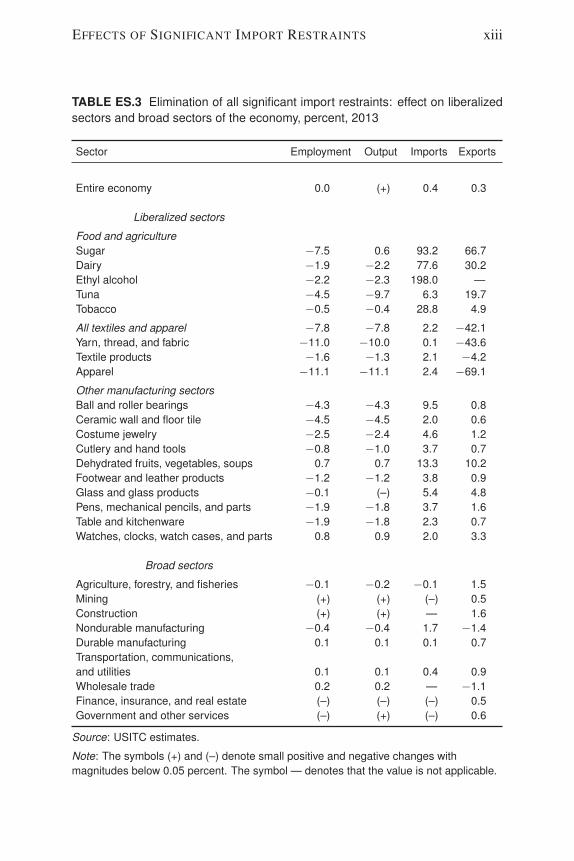
For most liberalized sectors, prices faced by households and domesticproducers would both fall. In response, imported quantities rise anddomestic output falls (table ES.3). Exports in most liberalized sectors areexpected to increase, although by a smaller proportion than the estimatedincrease in sectoral imports. Also, employment in the liberalized sectorstypically declines. Total imports of all goods are estimated to expand by0.4 percent, and total exports are estimated to expand by 0.3 percent (tableES.3).
2Similar to previous reports in the Import Restraints series, significant import restraintsare considered to be tariffs that are at least one standard deviation greater than the meanduty on U.S. merchandise imports, binding TRQs, and requirements related to rules oforigin in the textile sector.
EFFECTS OF SIGNIFICANT IMPORT RESTRAINTS xi
TABLE ES.1 Quantifiable significant U.S. import restraints, by sector, 2013
Ad valorem equivalents (%)
Rest-of-worldU.S. import Export tax total price
Sector tariff equivalenta wedgeb
Textile and apparel sectorsYarn, thread, and fabric 3.8 0.0 3.8Textile products 6.1 0.0 6.1Apparel 9.8 0.0 9.8
Agricultural sectorsDairy 11.2 12.3 24.8
Butter 11.0 41.6 57.1Cheese 8.8 0.9 9.7Condensed and evaporated dairy
products (except CMPP)c 19.9 17.3 40.6Dry dairy products 10.9 33.7 48.4Ice cream 5.2 3.6 9.0Fluid milk 8.2 3.0 11.5
Sugar 0.6 47.5 48.4Ethyl alcohol 4.7 0.0 4.7Canned tuna 11.2 0.0 11.2Tobacco 4.3 28.8 34.4
Other manufacturing sectorsBall and roller bearings 5.6 0.0 5.6Ceramic wall and floor tile 5.9 0.0 5.9Costume jewelry 5.9 0.0 5.9Cutlery and hand tools 4.3 0.0 4.3Footwear and leather products 10.0 0.0 10.0Glass and glass products 4.0 0.0 4.0Pens, mechanical pencils, and parts 4.8 0.0 4.8Dehydrated fruits and vegetables 3.9 0.0 3.9Table and kitchenware 4.6 0.0 4.6Watches, clocks, watch cases,
and parts 4.8 0.0 4.8
Source: Trade-weighted ad valorem tariff equivalents (calculated by dividing calculatedduties by c.i.f. value for all imports in a given sector) are calculated from the USAGEmodel baseline for 2013, from U.S. Department of Commerce official statistics, and fromU.S. trade agreements. Export tax equivalents are also calculated based on the USAGEmodel baseline and U.S. tariff-rate quota commitments.aThe export tax equivalent measures the degree to which tariff-rate quotas increase theexport price of the commodity (i.e., the price before entry into the U.S. market). Morerestrictive tariff-rate quotas produce higher export tax equivalents.bThe total price wedge represents the combined effect of the U.S. import tariff and therest-of-world export tax equivalent.c Concentrated milk protein products.
xii EXECUTIVE SUMMARY
TABLE ES.2 Projected economic welfare changes from baseline projectionsresulting from the liberalization of significant import restraints, by sector, 2013
Change ineconomic welfare
Sector (millions of $)
Simultaneous liberalization of all significant restraints 4, 622
Individual liberalizationTextiles and apparel 2, 254Dairy 733Sugar 514Ethyl alcohol 356Footwear and leather products 325Tobacco 99Tuna 23Costume jewelry 21Ball and roller bearings 14Pens, mechanical pencils, and parts 13Cutlery and hand tools 13Table and kitchenware 10Watches, clocks, watch cases, and parts 7Dehydrated fruit 4Ceramic wall and floor tile 1Glass and glass products −1
Source: USITC estimates.
Table ES.3 also shows the effects of liberalization on nine broadsectors that constitute the entire U.S. economy. The two broad sectorscharacterized by the most significant tariffs, agriculture and nondurablemanufacturing, are estimated to contract overall. Durable goods manufac-turing; transportation, communications, and utilities; and wholesale tradeare estimated to expand in response to liberalization.
Effects of Sector-by-Sector Liberalization
Liberalization was considered in each sector with significant restraintsto identify the economic effects, including the welfare effects, and toestimate the upstream and downstream effects. A summary of the keyresults for each sector is provided below.
Textilesand apparel
Liberalization of the textile and apparel subsectors increaseswelfare by approximately $2.3 billion. Liberalization causesdeclines from 10–11 percent in domestic shipments and
EFFECTS OF SIGNIFICANT IMPORT RESTRAINTS xiii
TABLE ES.3 Elimination of all significant import restraints: effect on liberalizedsectors and broad sectors of the economy, percent, 2013
Sector Employment Output Imports Exports
Entire economy 0.0 (+) 0.4 0.3
Liberalized sectors
Food and agricultureSugar −7.5 0.6 93.2 66.7Dairy −1.9 −2.2 77.6 30.2Ethyl alcohol −2.2 −2.3 198.0 —Tuna −4.5 −9.7 6.3 19.7Tobacco −0.5 −0.4 28.8 4.9
All textiles and apparel −7.8 −7.8 2.2 −42.1Yarn, thread, and fabric −11.0 −10.0 0.1 −43.6Textile products −1.6 −1.3 2.1 −4.2Apparel −11.1 −11.1 2.4 −69.1
Other manufacturing sectorsBall and roller bearings −4.3 −4.3 9.5 0.8Ceramic wall and floor tile −4.5 −4.5 2.0 0.6Costume jewelry −2.5 −2.4 4.6 1.2Cutlery and hand tools −0.8 −1.0 3.7 0.7Dehydrated fruits, vegetables, soups 0.7 0.7 13.3 10.2Footwear and leather products −1.2 −1.2 3.8 0.9Glass and glass products −0.1 (–) 5.4 4.8Pens, mechanical pencils, and parts −1.9 −1.8 3.7 1.6Table and kitchenware −1.9 −1.8 2.3 0.7Watches, clocks, watch cases, and parts 0.8 0.9 2.0 3.3
Broad sectors
Agriculture, forestry, and fisheries −0.1 −0.2 −0.1 1.5Mining (+) (+) (–) 0.5Construction (+) (+) — 1.6Nondurable manufacturing −0.4 −0.4 1.7 −1.4Durable manufacturing 0.1 0.1 0.1 0.7Transportation, communications,and utilities 0.1 0.1 0.4 0.9Wholesale trade 0.2 0.2 — −1.1Finance, insurance, and real estate (–) (–) (–) 0.5Government and other services (–) (+) (–) 0.6
Source: USITC estimates.
Note: The symbols (+) and (–) denote small positive and negative changes withmagnitudes below 0.05 percent. The symbol — denotes that the value is not applicable.
xiv EXECUTIVE SUMMARY
employment in yarn, thread, and fabric and apparel. Exports,production, and employment in apparel (cut pieces), yarn,thread, knit fabric, and broadwoven fabric decline consid-erably as a result of liberalization, which includes elimi-nation of rule-of-origin-based requirements for U.S. inputs.Domestic prices of these goods also decrease, leading toincreased U.S. competitiveness in the global economy anda slight mitigation of the decline in U.S. exports caused bythe elimination of rule-of-origin requirements. Effects onthe textile products category are smaller.
Dairy Removing tariffs and TRQs on imports of dairy products isestimated to increase U.S. welfare by approximately $733million. Shipments of butter and dry and condensed dairyproducts are estimated to decline by 10–11 percent. Ship-ments of cheese, fluid milk and cream, and ice cream declineby less than 1 percent. The value of imports of butter anddry and condensed dairy products more than doubles, withthe other dairy subsectors experiencing smaller increases inimports.
Sugar Removing tariffs and TRQs on imports of raw and refinedsugar is estimated to increase welfare by about $514 million.Employment and production changes in the liberalized sugarsubsectors are mixed. The removal of U.S. TRQs on rawand refined sugar results in price declines throughout theindustry. Shipments of raw cane sugar and refined beetsugar decline 32 and 10 percent, respectively. Cane refinersbenefit from the drop in raw cane sugar prices and increaseshipments by 14 percent. Confectioners benefit from thedecline in refined sugar prices and increase production andexports.
Ethylalcohol
Liberalization of ethyl alcohol would increase welfare by$356 million. The effects on industry output and employ-ment are minimal, with each declining by 2 percent. Thevalue of imports increases by 183 percent.
Tobacco Elimination of tariffs and TRQs on cigarettes and tobaccois estimated to increase welfare by about $99 million. Ship-ments and employment in tobacco are estimated to declineby 4–5 percent. Because tobacco is a major input into the
HISTORY OF U.S. TRADE POLICY SINCE 1934 xv
production of cigarettes, shipments and employment in thecigarette industry increase, but by less than 1 percent.
Cannedtuna
Tuna liberalization would increase welfare in the UnitedStates by about $23 million. Shipments of canned tunaoutput are expected to decline by about 10 percent as a resultof liberalization. Employment in the broader canned fishindustry falls by 5 percent.
Otherhigh-tariffsectors
Ten other sector groupings are identified as subject torelatively high tariffs. The welfare effects of liberalizationare estimated to range from a potential gain of about $325million for footwear and leather products to a potential lossof approximately $1 million for glass. Most sectors areexpected to experience increased imports, increased exports,and lower consumer prices.
History of U.S. Trade Policy since 1934
In the early 1930s, the United States was a relatively closed economy,with exports and imports each accounting for less than 5 percent of grossdomestic product. Chapter 3 describes how the United States transformeditself into one of the most open economies in the world. It then concludeswith an overview of the quantitative and related literature on the economiceffects of trade liberalization. Virtually all quantitative assessments suggestthat the United States has benefited from trade liberalization, but estimatesvary in magnitude.
History of Trade Policy
U.S. trade policy has evolved significantly during the 75 years coveredin this chapter. The weighted average tariff on all imports fell fromabout 18.4 percent in 1934 to approximately 1.3 percent in 2007, andmany nontariff measures, particularly in textiles and apparel, have beeneliminated. As GDP steadily increased over these years, exports andimports as a share of GDP also grew. The General Agreement on Tariffsand Trade (GATT), an international framework for mutually agreed traderules and multilateral trade negotiation, was established and maintained for
xvi EXECUTIVE SUMMARY
many years. Through this process, the World Trade Organization (WTO)was formed, and several landmark agreements were reached.
The discussion of the 75-year history of U.S. trade policy is organizedinto four distinct periods based on the types of policy actions that weredominant during each timeframe. The first period, characterized byreopening trade (1934–41), begins with the passage of the ReciprocalTrade Agreements Act of 1934. This act is noteworthy because itoverturned many highly restrictive policies of the Tariff Act of 1930 (oftencalled the Smoot-Hawley Act) and laid the groundwork for a number ofbilateral agreements.
The second period is World War II and post-war liberalization (1941–67). As the limits of the bilateral approach became apparent, a series ofmultilateral negotiations, or “rounds,” began under the GATT. The GATTnegotiations, the first of which was held in Geneva (April–October 1947),set the stage for multilateral trade negotiations for the next 50 years. TheTrade Expansion Act of 1962 authorized the President to negotiate across-the-board tariff cuts and established the Trade Adjustment AssistanceProgram, although this program was ineffective in its initial form.
During the third period of restructuring trade policy (1967–89), coun-tries continued to recover from World War II, and European and Japanesefirms became better able to compete with U.S. firms. As a result, domesticopposition to opening trade grew, although some continued to supportliberalization. Out of the mix of views, several agreements involvingvoluntary export restraints emerged. The Long-Term Arrangement onCotton Textiles was established in 1962 and was succeeded by the Mul-tifiber Arrangement in 1974; both agreements restricted trade in textilesand apparel. The Trade Act of 1974 was in a similar spirit; it addressedthe need to negotiate nontariff restraints on trade and also made the traderemedy laws more effective.
The fourth period (since 1989) was characterized by the U.S. rolein the establishment of the WTO and by the proliferation of free tradeagreements. The scope of trade negotiations expanded to include sensitiveand technically difficult areas, including trade in services and nontariffmeasures. The United States signed the North American Free TradeAgreement (NAFTA) with Canada and Mexico. The Uruguay Roundnegotiations under the GATT concluded with the establishment of theWTO. An outcome of these negotiations was the Agreement on Textilesand Clothing (ATC), which phased out quotas on textiles and clothing
HISTORY OF U.S. TRADE POLICY SINCE 1934 xvii
by 2005. Other landmark agreements included the General Agreementon Trade in Services (GATS), the Agreement on Trade-Related Aspectsof Intellectual Property Rights (TRIPS), and the Agreement on Trade-Related Investment Measures (TRIMs). The United States also signed anumber of bilateral free trade agreements during this time. Multilateralnegotiations under the current Doha Round of negotiations are presently ata standstill. Developing countries are playing a more prominent role, anddisagreements remain over various issues, including agricultural tariffs anddomestic support programs, nonagricultural market access, and barriers totrade in services.
Economic Effects of Trade Liberalization
Estimates of the welfare effects of liberalization vary greatly, from afraction of a percent of GDP to as much as 13 percent. The broad rangereflects the variety of modeling assumptions and approaches, and mostestimates have been at the low end of this range. Approaches also varyby time period. Large computer models were first used in the 1970s, forexample, and the welfare gains estimated by these models were relativelysmall—typically less than 1 percent of GDP. Recent modeling efforts haveexpanded into new areas, such as trade in services and nontariff measures,and some show larger effects from trade liberalization. However, theremoval of nontariff measures in a model is not as straightforward as theremoval of tariffs, and concerns exist over availability of reliable data andmodeling approaches. Different types of models have been developed;some assume that firms have increasing returns to scale or that consumersare motivated to purchase an increasing variety of similar goods. Someof these studies show larger gains to trade liberalization than the earliermodels, but most projected gains remain below 1 percent of GDP.

Chapter 1
Introduction
This is the sixth update in the series of reports entitled The EconomicEffects of Significant U.S. Import Restraints.1 During the nearly 20 yearssince the USITC began these studies, the weighted-average tariff on totalU.S. imports fell from 3.4 percent in 1989 to approximately 1.3 percentin 2007; many nontariff measures have been eliminated, particularly intextiles and apparel; and trade (imports plus exports) as a share of GDPincreased from 15 percent to 23 percent. These changes largely resultedfrom trade liberalization over this period and over the past 75 years. Inaddition to updating the analysis of significant import restraints, this reportincludes a review of this recent history of U.S. trade policy and its effectson the U.S. economy. The principal conclusion of this update is thatannual welfare in the United States, defined as total private and publicconsumption, would increase by $4.6 billion in 2013 if the significantrestraints on U.S. imports were removed, according to estimates in thisreport.
1The United States Trade Representative (USTR) originally requested this series ofreports in May 1992. In August 2008, the USTR, in addition to requesting a sixth updateof this report, requested a review of U.S. trade policy since 1934. See app. A for facsimilesof both the 1992 and 2008 request letters. Prior to this series of investigations, the USITCconducted a similar study in three phases for the U.S. Senate Committee on Finance during1989–91.
1
2 CHAPTER 1 INTRODUCTION
Scope and Organization of the Report
Chapter 2 provides an updated quantitative assessment of the economiceffects of significant U.S. import restraints on U.S. consumption, produc-tion, income, employment, trade, and welfare using the Commission’scomputable general equilibrium model USAGE.2 An initial step in thequantitative analysis is defining which import restraints are significant.As requested in the original letter, all import restraints are initiallyconsidered except those originating from antidumping or countervailingduty investigations, section 337 or 406 investigations, or section 301actions. The focus in this report is on measures that are applied at theborder, such as tariffs and tariff-rate quotas. Liberalization of the servicesectors is not addressed.3 Although the trade-weighted average tariff ontotal U.S. imports was just under 1.35 percent in 2007 (down from 1.40percent in 2005), some products still have significant tariffs. Similarto prior reports in the import restraints series, tariffs are considered tobe a significant import restraint if they exceed the mean duty on U.S.imports by at least one standard deviation.4 Additionally, the followingsectors were considered to have significant restraints because of tariff-ratequotas (TRQs): dairy, ethyl alcohol (ethanol), sugar, tobacco, and cannedtuna.5 Some commodities with TRQs have associated domestic-support
2The U.S. applied general equilibrium (USAGE) model is discussed in more detail inthe next section.
3Some previous studies in the Import Restraints series have qualitatively addressedlimitations to trade in services (e.g., restrictions on transport services) but have notquantitatively analyzed these limitations in a computable general equilibrium (CGE)model. Restrictions to trade in services tend to be nontariff measures, which areconceptually more difficult to quantify. Researchers have begun to model trade in servicesand broader “behind-the-border” issues in CGE models, as reported in chapter 3 of thisreport. As discussed there, some studies show large gains from liberalization of servicesand nontariff measures, but the results are highly variable, as these measures are inherentlymore difficult to specify. Many researchers have the view that addressing services and thebroader effects of trade in CGE models remains problematical or speculative. See, e.g.,Ackerman, “The Shrinking Gains from Trade,” October 2005, 1. Box 2.1 provides anoverview of issues involving trade in services.
4The standard deviation is 2.79 percent; therefore sectors with tariffs over 4.14 percentwere considered significant, except that lubricating oils and grease and nonferrous forgings,which qualified on the basis of their tariffs, were eliminated because of very low trade flowsand the absence of any other measures that would have restricted their trade. The USAGEmodel divides the U.S. economy into 535 industries that produce 539 goods and services.
5Although the TRQ for beef has been binding at times for a couple of countries, it hasnot generally been binding on most countries in recent years and is not considered in thisreport. Fill rates for the cotton and peanut TRQs are low and are not binding. As in the
SCOPE AND ORGANIZATION OF THE REPORT 3
programs, and the liberalization scenario assumes that these programs areeliminated and that domestic prices for these commodities become equalto world prices.6 Requirements related to rules of origin for the textiles andapparel sector also were considered to be a significant constraint.
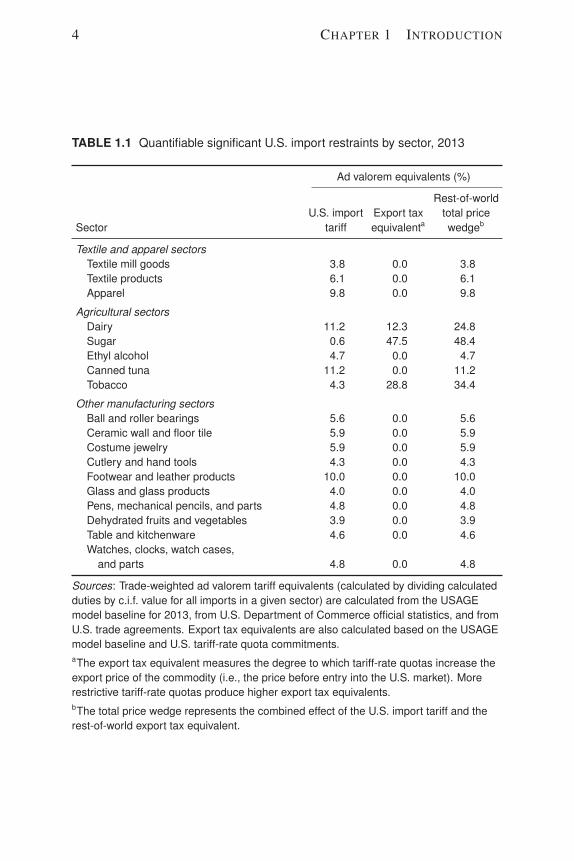
Table 1.1 presents the commodities that were identified as havingsignificant restraints and summarizes the restrictiveness of the restraints.Apparel, dairy, canned tuna, and footwear have the highest tariffs. Thetextile products and apparel sectors and most sectors with TRQs also havesignificantly high tariffs. A TRQ imposes a cost on exporters to the UnitedStates that is analogous to an export tax, and a common way to measurethe restrictiveness of a TRQ is to compute its export tax equivalent (ETE),which measures the degree to which the TRQ raises the export price of thecommodity to the U.S. market.7 TRQs in the sugar and tobacco sectors areparticularly restrictive as shown in table 1.1.
Chapter 3 provides a concise summary of the history of U.S. tradepolicy since 1934 and a review of the literature on the economic effectsof these policies. The year 1934 was chosen as a starting point becauseCongress passed the original Reciprocal Trade Agreements Act (RTAA)that year. This act marked a turning point in trade, following a seriesof highly restrictive measures such as the Tariff Act of 1930 (so-calledSmoot-Hawley Tariff Act). The literature review begins by laying out thetrade landscape as formed by events prior to 1934 and follows the ups anddowns in the evolution of trade policy to the present day. In a separatesection, the report provides a summary of economic theory that exploresthe links between trade and its effects on economic well-being; a summaryof the quantitative literature on U.S. trade policies is also presented.
fifth update, these restraints were not considered to be significant. USITC, The EconomicEffects of Significant U.S. Import Restraints: Fifth Update, 2007.
6Otherwise, domestic price supports would become very expensive for the government.7Before the USAGE model was able to handle TRQs explicitly, ETEs were computed
and added to the tariff to create the total price wedge (last column of table 1.1) that wasremoved in the policy simulation. TRQs are now modeled based on their within-quota andover-quota tariffs and fill rates, and the ETEs are not used. They are shown here, however,because they are a convenient summary indicator of the restrictiveness of a sector.
4 CHAPTER 1 INTRODUCTION
TABLE 1.1 Quantifiable significant U.S. import restraints by sector, 2013
Ad valorem equivalents (%)
Rest-of-worldU.S. import Export tax total price
Sector tariff equivalenta wedgeb
Textile and apparel sectorsTextile mill goods 3.8 0.0 3.8Textile products 6.1 0.0 6.1Apparel 9.8 0.0 9.8
Agricultural sectorsDairy 11.2 12.3 24.8Sugar 0.6 47.5 48.4Ethyl alcohol 4.7 0.0 4.7Canned tuna 11.2 0.0 11.2Tobacco 4.3 28.8 34.4
Other manufacturing sectorsBall and roller bearings 5.6 0.0 5.6Ceramic wall and floor tile 5.9 0.0 5.9Costume jewelry 5.9 0.0 5.9Cutlery and hand tools 4.3 0.0 4.3Footwear and leather products 10.0 0.0 10.0Glass and glass products 4.0 0.0 4.0Pens, mechanical pencils, and parts 4.8 0.0 4.8Dehydrated fruits and vegetables 3.9 0.0 3.9Table and kitchenware 4.6 0.0 4.6Watches, clocks, watch cases,
and parts 4.8 0.0 4.8
Sources: Trade-weighted ad valorem tariff equivalents (calculated by dividing calculatedduties by c.i.f. value for all imports in a given sector) are calculated from the USAGEmodel baseline for 2013, from U.S. Department of Commerce official statistics, and fromU.S. trade agreements. Export tax equivalents are also calculated based on the USAGEmodel baseline and U.S. tariff-rate quota commitments.aThe export tax equivalent measures the degree to which tariff-rate quotas increase theexport price of the commodity (i.e., the price before entry into the U.S. market). Morerestrictive tariff-rate quotas produce higher export tax equivalents.bThe total price wedge represents the combined effect of the U.S. import tariff and therest-of-world export tax equivalent.
APPROACH 5
Approach
Significant Import Restraints
Chapter 2 provides background on the sectors identified as havingsignificant limits on trade and discusses the nature and restrictiveness ofthe restraints. The information includes data on production, employment,and trade and identifies any important policy changes. These data originateprimarily from other government agencies such as the U.S. Departmentof Agriculture and the U.S. Department of Commerce. Additional in-formation was obtained at a Commission hearing and through writtensubmissions of interested parties.8
The USAGE model provides a depiction of the U.S. economy projectedto 2013. This is based on the assumption that current U.S. trade policiescontinue in place (including any phase-outs of import restrictions previ-ously agreed to); this projection is called the baseline. Known factorsthat affect the U.S. economy, such as the current financial downturn, areincorporated into the baseline. Then the economy depicted by the baselineis modified to remove only the significant U.S. import restraints. Bothan economy-wide simulation that simultaneously removes all significantimport restraints and simulations that remove the restraints sector by sectorare run. The results of this study are then presented in the form ofcomparisons between the baseline and the policy simulations.
The USAGE model is a dynamic computable general equilibriummodel of the U.S. economy.9 Production is divided into 535 industriesthat produce goods and services. The model shows the linkages amongthese producing sectors, consumers, the government, and foreign sectors.The detailed linkages among different sectors of the economy enable theUSITC to analyze how changes in trade policy have different interrelatedeffects on various parts of the economy. Policy measures, such as the tariffsto be removed, are based on 2007 data. The USAGE model is dynamic, andcapital stocks are allowed to adjust in response to changes in trade policy.
8A Federal Register notice (app. B) announced that the Commission was beginning toupdate the report and that a public hearing was scheduled for January 8, 2009. Positions ofthe parties that provided testimony or written submissions are summarized in app. C. Thecalendar of the public hearing is shown in app. D.
9Box 3.4 provides a brief explanation of computable general equilibrium models whileapp. E contains a full account of the model. Data are from 2005 national income andproduct accounts and 1992 and 1997 input-output tables, all published by the Bureau ofEconomic Analysis (BEA) of the U.S. Department of Commerce.
6 CHAPTER 1 INTRODUCTION
The 2013 projection is based on forecasts of GDP and other macro-economic and sector-specific variables from other government agencies,including the Congressional Budget Office, Department of Agriculture,Department of Energy, and Department of Commerce. The USAGEmodel enforces microeconomic principles in a consistent way across allsectors, so that final projections produced by the model may not matchthose that were input from other agencies. The foreign sector, whichbuys exports and sells imports, is divided into 27 distinct regions orcountries.10 This grouping, which is based on countries or regions with freetrade agreements, preferential trade arrangements, or some special tradecharacteristic, facilitates the analysis of trade policies. TRQs in a numberof sectors, including dairy products, ethyl alcohol, sugar, and tobacco, arefully modeled with over-quota and within-quota tariff rates and quota fillrates.
History of U.S. Trade Policy since 1934
Chapter 3 presents a review of the professional economic literature. Itdescribes how the United States transformed itself from a country with veryhigh tariffs and little trade into one of the most open countries in the worldwith respect to trade. This story, which is known to few outside of the tradecommunity, took place over nearly three-quarters of a century and involvedthe work of both Democratic and Republican administrations. First, thehistory of U.S. trade policy since 1934, including key changes in theinternational arena that affected the United States, is summarized. Next, anoverview of the quantitative and related literature on the economic effectsof trade liberalization is presented. Chapter 3 also includes a timeline thatshows important legislation, policy changes, and related events.
10These include the ATPA countries, Australia, Bahrain, Brazil, CAFTA-DR, CBERA,CBERA plus CBTPA, Canada, Chile, China, Colombia, the EU, GSP countries, GSPcountries in AGOA, least developed GSP countries, least developed GSP countries inAGOA, Israel, Japan, Jordan, Korea, Mexico, Morocco, Oman, Panama, Peru, Singapore,and the rest of the world.

APPROACH 7
Bibliography
Ackerman, Frank. “The Shrinking Gains from Trade: A CriticalAssessment of Doha Round Projections.” Global Development andEnvironment Institute Working Paper 05-01, October 2005.
U.S. International Trade Commission (USITC). The Economic Effects ofSignificant U.S. Import Restraints: Fifth Update 2007, USITCPublication 3906. Washington, D.C.: USITC, 2007.

Chapter 2
Significant Import Restraints
Removing the barriers to trade identified in this report is expected toincrease domestic welfare, exports, and imports. This chapter providesdetails on the effects of removing significant U.S. import restraints. It isorganized by industrial sectors with significant restraints and includes asection on the simultaneous removal of all significant import restraints.1
Each section describes a sector, analyzes the restrictions, and assessesthe economic impact of removing only its restrictions. As mentioned inchapter 1, the USITC has been preparing these reports for almost 20 years,and box 2.1 recalls the main results from these studies.
To understand the effects of trade liberalization on individual sectors,it is helpful to understand the typical adjustment process that results fromremoving an import restraint. When a measure such as a tariff or a TRQ isremoved, the landed duty-paid price of the affected U.S. import declines.The decline in the import price is related to the restrictiveness of the trademeasure, with the removal of more restrictive measures inducing largerdeclines. To compete with lower-priced imports, U.S. producers of similarcommodities reduce their prices. Therefore, these U.S. producers supplyless to the domestic market, and output and employment decline in theseindustries. U.S. consumption of the liberalized good increases becauseprices of both the imported and domestic goods have fallen. Consumersbenefit because they can continue to purchase the same quantity of the
1Simultaneous removal of all significant restraints, which is not synonymous withcomplete liberalization, refers to the removal of ROOs related to textiles and apparel,binding TRQs, and tariffs greater than 4.14 percent (or one standard deviation above themean tariff) on U.S. merchandise imports as explained in chapter 1.
9
10 CHAPTER 2 SIGNIFICANT IMPORT RESTRAINTS
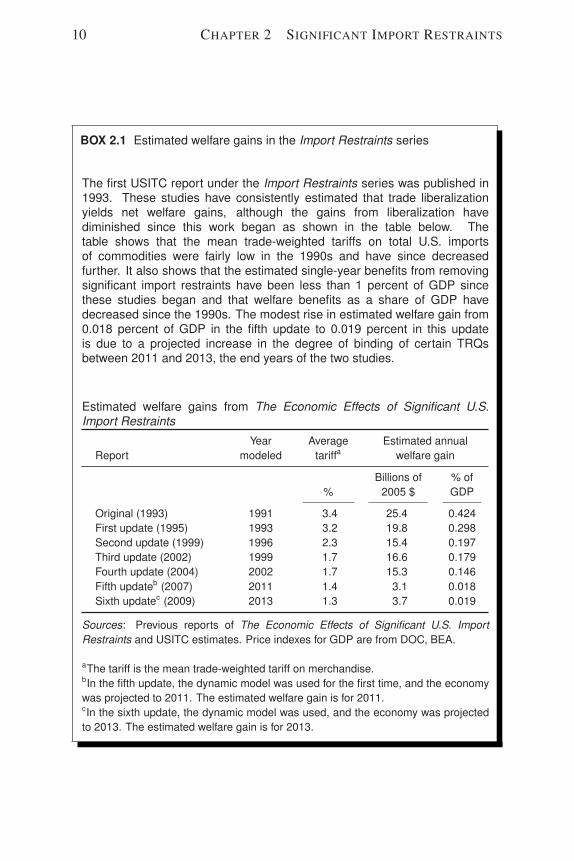
BOX 2.1 Estimated welfare gains in the Import Restraints series
The first USITC report under the Import Restraints series was published in1993. These studies have consistently estimated that trade liberalizationyields net welfare gains, although the gains from liberalization havediminished since this work began as shown in the table below. Thetable shows that the mean trade-weighted tariffs on total U.S. importsof commodities were fairly low in the 1990s and have since decreasedfurther. It also shows that the estimated single-year benefits from removingsignificant import restraints have been less than 1 percent of GDP sincethese studies began and that welfare benefits as a share of GDP havedecreased since the 1990s. The modest rise in estimated welfare gain from0.018 percent of GDP in the fifth update to 0.019 percent in this updateis due to a projected increase in the degree of binding of certain TRQsbetween 2011 and 2013, the end years of the two studies.
Estimated welfare gains from The Economic Effects of Significant U.S.Import Restraints
Year Average Estimated annualReport modeled tariffa welfare gain
Billions of % of% 2005 $ GDP
Original (1993) 1991 3.4 25.4 0.424First update (1995) 1993 3.2 19.8 0.298Second update (1999) 1996 2.3 15.4 0.197Third update (2002) 1999 1.7 16.6 0.179Fourth update (2004) 2002 1.7 15.3 0.146Fifth updateb (2007) 2011 1.4 3.1 0.018Sixth updatec (2009) 2013 1.3 3.7 0.019
Sources: Previous reports of The Economic Effects of Significant U.S. ImportRestraints and USITC estimates. Price indexes for GDP are from DOC, BEA.
aThe tariff is the mean trade-weighted tariff on merchandise.bIn the fifth update, the dynamic model was used for the first time, and the economywas projected to 2011. The estimated welfare gain is for 2011.cIn the sixth update, the dynamic model was used, and the economy was projectedto 2013. The estimated welfare gain is for 2013.
REMOVAL OF ALL SIGNIFICANT RESTRAINTS 11
good under consideration at a lower price and have funds remaining foradditional uses. Producers who use the product as an input becomemore competitive in both domestic and foreign markets. Remaining U.S.producers of the liberalized good become more competitive in the worldeconomy and increase sales of exports. In this adjustment process, thegains typically outweigh the costs, although there are distributional effects.For example, workers employed in import-competing industries face theprospect of job loss and depressed wages. Households broadly benefitfrom lower-cost consumption, but not every household gains. Those facingdislocation bear greater costs, barring any special assistance that they mayreceive. The same holds for capital owners in different sectors of theeconomy.
As previously mentioned, the dynamic USAGE model is first used tosimulate a baseline that shows the likely changes to each sector in 2013if current policies and known trends continue. Another simulation is thenperformed in which the restraints on imports are removed. The resultsof the liberalization are then presented as deviations from the baseline in2013. Generally by 2013, the adjustment process described in the previousparagraph will have run its course, with some businesses having expandedand others having contracted.
Removal of All Significant Restraints
Recent Performance of the U.S. Economy
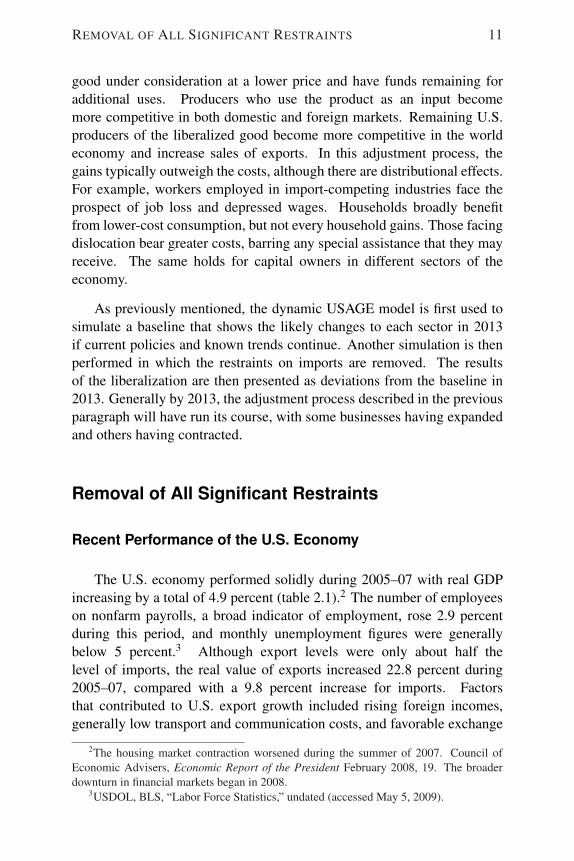
The U.S. economy performed solidly during 2005–07 with real GDPincreasing by a total of 4.9 percent (table 2.1).2 The number of employeeson nonfarm payrolls, a broad indicator of employment, rose 2.9 percentduring this period, and monthly unemployment figures were generallybelow 5 percent.3 Although export levels were only about half thelevel of imports, the real value of exports increased 22.8 percent during2005–07, compared with a 9.8 percent increase for imports. Factorsthat contributed to U.S. export growth included rising foreign incomes,generally low transport and communication costs, and favorable exchange
2The housing market contraction worsened during the summer of 2007. Council ofEconomic Advisers, Economic Report of the President February 2008, 19. The broaderdownturn in financial markets began in 2008.
3USDOL, BLS, “Labor Force Statistics,” undated (accessed May 5, 2009).
12 CHAPTER 2 SIGNIFICANT IMPORT RESTRAINTS
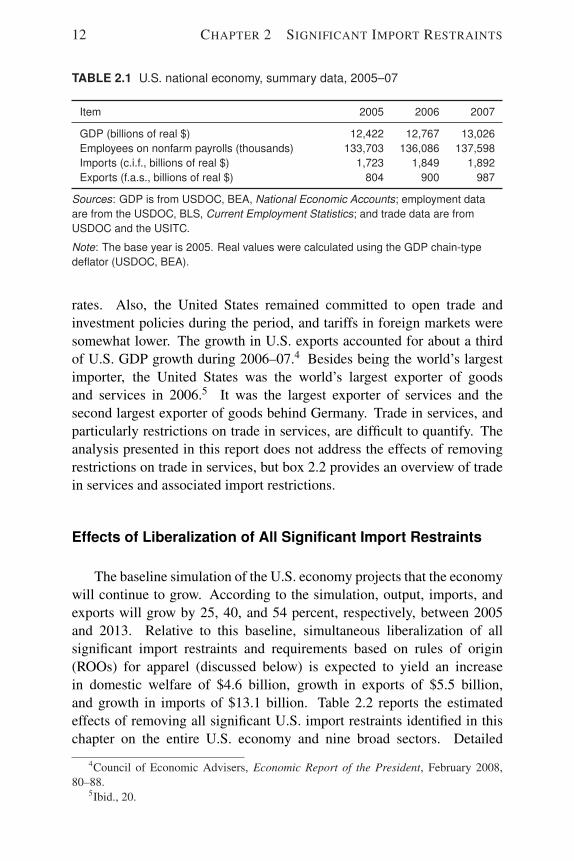
TABLE 2.1 U.S. national economy, summary data, 2005–07
Item 2005 2006 2007
GDP (billions of real $) 12,422 12,767 13,026Employees on nonfarm payrolls (thousands) 133,703 136,086 137,598Imports (c.i.f., billions of real $) 1,723 1,849 1,892Exports (f.a.s., billions of real $) 804 900 987
Sources: GDP is from USDOC, BEA, National Economic Accounts; employment dataare from the USDOC, BLS, Current Employment Statistics; and trade data are fromUSDOC and the USITC.
Note: The base year is 2005. Real values were calculated using the GDP chain-typedeflator (USDOC, BEA).
rates. Also, the United States remained committed to open trade andinvestment policies during the period, and tariffs in foreign markets weresomewhat lower. The growth in U.S. exports accounted for about a thirdof U.S. GDP growth during 2006–07.4 Besides being the world’s largestimporter, the United States was the world’s largest exporter of goodsand services in 2006.5 It was the largest exporter of services and thesecond largest exporter of goods behind Germany. Trade in services, andparticularly restrictions on trade in services, are difficult to quantify. Theanalysis presented in this report does not address the effects of removingrestrictions on trade in services, but box 2.2 provides an overview of tradein services and associated import restrictions.
Effects of Liberalization of All Significant Import Restraints
The baseline simulation of the U.S. economy projects that the economywill continue to grow. According to the simulation, output, imports, andexports will grow by 25, 40, and 54 percent, respectively, between 2005and 2013. Relative to this baseline, simultaneous liberalization of allsignificant import restraints and requirements based on rules of origin(ROOs) for apparel (discussed below) is expected to yield an increasein domestic welfare of $4.6 billion, growth in exports of $5.5 billion,and growth in imports of $13.1 billion. Table 2.2 reports the estimatedeffects of removing all significant U.S. import restraints identified in thischapter on the entire U.S. economy and nine broad sectors. Detailed
4Council of Economic Advisers, Economic Report of the President, February 2008,80–88.
5Ibid., 20.

REMOVAL OF ALL SIGNIFICANT RESTRAINTS 13
BOX 2.2 U.S. services trade and import restrictions
The United States is the world’s largest services market, the biggest importer andexporter of services, and maintains the greatest services trade surplus.a In 2007,services accounted for 79 percent of both U.S. gross domestic product (GDP)and employment.b Additionally, the United States has one of the most liberalizedservices trade regimes, ranking sixth out of 148 countries in the World Bank’s GATScommitment index.c Nevertheless, the United States does maintain some significantservices import restraints, particularly in transportation services.
The Merchant Marine Act of 1920, also known as the Jones Act, stipulates that onlyships that are built in the United States and that are owned and staffed by U.S.citizens, may engage in domestic maritime shipping, also known as cabotage.d Whileit is common practice for countries to restrict foreign participation in cabotage, fewcountries require domestically built vessels to be used.e The United States reservesdomestic air travel for U.S. majority-owned airlines. Additionally, the United Statesprohibits domestic airlines from leasing foreign aircraft and crew.f Similarly, foreigntrucking fleets are prohibited from cabotage, but Canadian trucks are allowed toprovide cross-border trucking services. Mexican trucks, however, are prohibited fromoperating in the United States, outside of a narrow border zone. A pilot program thatallowed a fixed number of Mexican trucks to provide cross-border trucking servicesthroughout the United States was suspended in March 2009.g
Exports, imports, and trade balances in U.S. private services, 2005–07
Item 2005 2006 2007
Millions of $
Exports 368,496 415,321 479,980Travel 81,799 85,720 96,712Passenger fares 20,970 22,036 25,586
Imports 279,486 313,865 341,126Travel 68,970 72,104 76,167Passenger fares 26,149 27,501 28,486
Trade balance 89,010 101,456 138,854
Source: USDOC, BEA, “U.S. International Services: Cross-Border Trade 1986–2007,and Services Supplied Through Affiliates, 1986–2006,” Table 1 (accessed March 17, 2009).
aWTO, International Trade Statistics 2008 (accessed March 17, 2009).bUSDOC, BEA, Industry Economic Accounts, interactive tables.cWorld Bank, World Trade Indicators 2008 (accessed March 12, 2009). This index reflects theextent to which countries have undertaken market access and national treatment commitmentsin the 155 services subsectors included in the WTO’s General Agreement on Trade in Services.dUSDOT, MARAD, “Domestic Shipping” (accessed March 12, 2009).eUSITC, Import Restraints, 2004, 92,102.fIbid., 101–02.gGamboa, “Cross-border Trucking Program May Be Revived,” March 11, 2009.
14 CHAPTER 2 SIGNIFICANT IMPORT RESTRAINTS
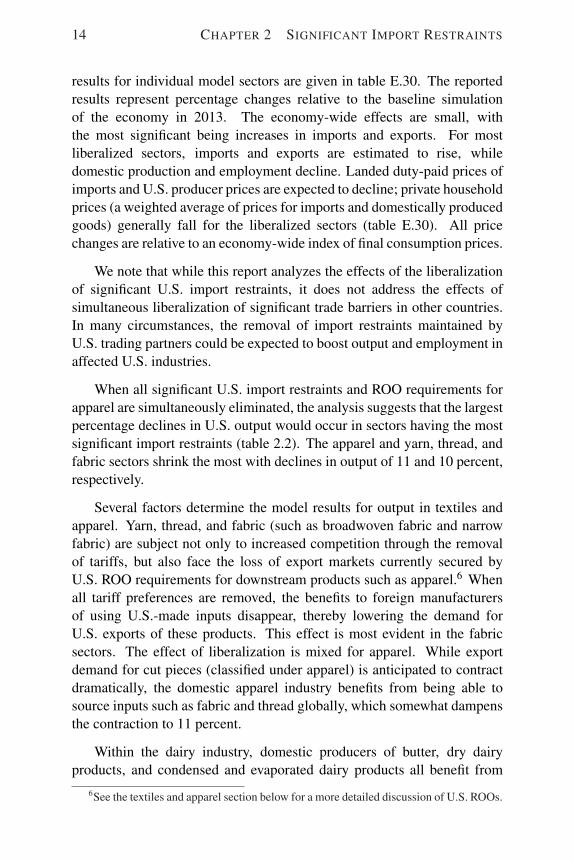
results for individual model sectors are given in table E.30. The reportedresults represent percentage changes relative to the baseline simulationof the economy in 2013. The economy-wide effects are small, withthe most significant being increases in imports and exports. For mostliberalized sectors, imports and exports are estimated to rise, whiledomestic production and employment decline. Landed duty-paid prices ofimports and U.S. producer prices are expected to decline; private householdprices (a weighted average of prices for imports and domestically producedgoods) generally fall for the liberalized sectors (table E.30). All pricechanges are relative to an economy-wide index of final consumption prices.
We note that while this report analyzes the effects of the liberalizationof significant U.S. import restraints, it does not address the effects ofsimultaneous liberalization of significant trade barriers in other countries.In many circumstances, the removal of import restraints maintained byU.S. trading partners could be expected to boost output and employment inaffected U.S. industries.
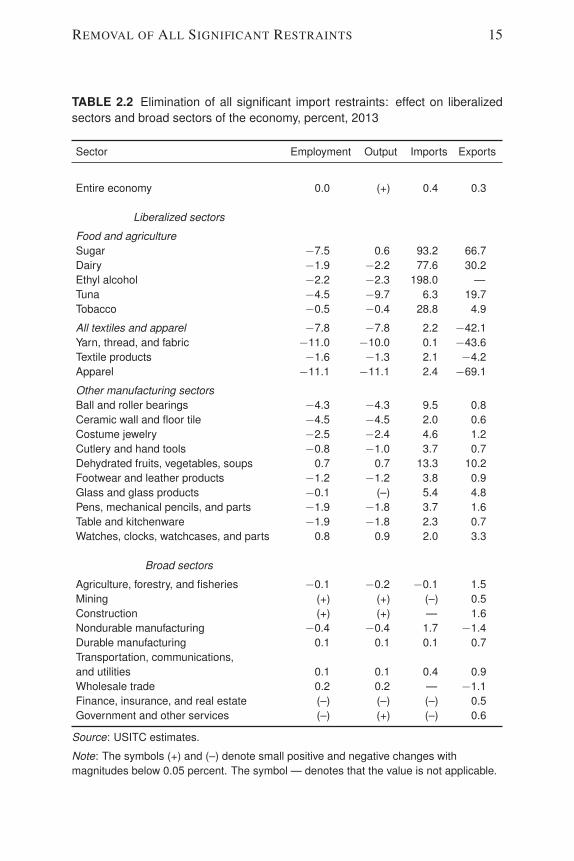
When all significant U.S. import restraints and ROO requirements forapparel are simultaneously eliminated, the analysis suggests that the largestpercentage declines in U.S. output would occur in sectors having the mostsignificant import restraints (table 2.2). The apparel and yarn, thread, andfabric sectors shrink the most with declines in output of 11 and 10 percent,respectively.
Several factors determine the model results for output in textiles andapparel. Yarn, thread, and fabric (such as broadwoven fabric and narrowfabric) are subject not only to increased competition through the removalof tariffs, but also face the loss of export markets currently secured byU.S. ROO requirements for downstream products such as apparel.6 Whenall tariff preferences are removed, the benefits to foreign manufacturersof using U.S.-made inputs disappear, thereby lowering the demand forU.S. exports of these products. This effect is most evident in the fabricsectors. The effect of liberalization is mixed for apparel. While exportdemand for cut pieces (classified under apparel) is anticipated to contractdramatically, the domestic apparel industry benefits from being able tosource inputs such as fabric and thread globally, which somewhat dampensthe contraction to 11 percent.
Within the dairy industry, domestic producers of butter, dry dairyproducts, and condensed and evaporated dairy products all benefit from
6See the textiles and apparel section below for a more detailed discussion of U.S. ROOs.
REMOVAL OF ALL SIGNIFICANT RESTRAINTS 15
TABLE 2.2 Elimination of all significant import restraints: effect on liberalizedsectors and broad sectors of the economy, percent, 2013
Sector Employment Output Imports Exports
Entire economy 0.0 (+) 0.4 0.3
Liberalized sectors
Food and agricultureSugar −7.5 0.6 93.2 66.7Dairy −1.9 −2.2 77.6 30.2Ethyl alcohol −2.2 −2.3 198.0 —Tuna −4.5 −9.7 6.3 19.7Tobacco −0.5 −0.4 28.8 4.9
All textiles and apparel −7.8 −7.8 2.2 −42.1Yarn, thread, and fabric −11.0 −10.0 0.1 −43.6Textile products −1.6 −1.3 2.1 −4.2Apparel −11.1 −11.1 2.4 −69.1
Other manufacturing sectorsBall and roller bearings −4.3 −4.3 9.5 0.8Ceramic wall and floor tile −4.5 −4.5 2.0 0.6Costume jewelry −2.5 −2.4 4.6 1.2Cutlery and hand tools −0.8 −1.0 3.7 0.7Dehydrated fruits, vegetables, soups 0.7 0.7 13.3 10.2Footwear and leather products −1.2 −1.2 3.8 0.9Glass and glass products −0.1 (–) 5.4 4.8Pens, mechanical pencils, and parts −1.9 −1.8 3.7 1.6Table and kitchenware −1.9 −1.8 2.3 0.7Watches, clocks, watchcases, and parts 0.8 0.9 2.0 3.3
Broad sectors
Agriculture, forestry, and fisheries −0.1 −0.2 −0.1 1.5Mining (+) (+) (–) 0.5Construction (+) (+) — 1.6Nondurable manufacturing −0.4 −0.4 1.7 −1.4Durable manufacturing 0.1 0.1 0.1 0.7Transportation, communications,and utilities 0.1 0.1 0.4 0.9Wholesale trade 0.2 0.2 — −1.1Finance, insurance, and real estate (–) (–) (–) 0.5Government and other services (–) (+) (–) 0.6
Source: USITC estimates.
Note: The symbols (+) and (–) denote small positive and negative changes withmagnitudes below 0.05 percent. The symbol — denotes that the value is not applicable.
16 CHAPTER 2 SIGNIFICANT IMPORT RESTRAINTS
substantial total protection. As a result, all three sectors see substantialdeclines in output following liberalization (table E.30). Butter output isestimated to decline by 10 percent, dry dairy products by 11 percent, andcondensed and evaporated products by 8 percent.
Almost all sectors with high tariffs or TRQs show the expected patternsof declining domestic production, employment, and prices, along withincreases in imports and exports, when these measures are eliminated. Theonly sector that has a sizable increase in output is refined cane sugar (tableE.30). Cane refiners can choose to refine either domestically milled orforeign-milled raw sugar. Because sugar beets are essentially untraded,beet refiners mainly process domestic sugar beets and lack access to less-expensive imported inputs. However, cane sugar refiners benefit by gainingaccess to cheaper foreign raw cane sugar. Cane refiners are expected torespond by expanding production by 14 percent, and exports of refinedsugar more than triple. In contrast, both cane millers and growers wouldbe hurt by import competition; sugarcane production and raw sugar millingare expected to drop by 30 and 32 percent, respectively. Growers of sugarbeets and refiners of beet sugar would be hurt to a lesser extent, with outputof beets and refined beet sugar declining by 9 and 10 percent, respectively.
In other sectors with significant import restraints, estimates are thatemployment and output generally fall in response to liberalization, whileimports and exports are expected to rise. Some high-tariff sectors that facesmall output declines under sector-by-sector liberalization are estimatedto expand under simultaneous liberalization, owing to more favorableexport demand conditions (because there is a larger depreciation of thedollar in the simultaneous liberalization). Leather goods not elsewhereclassified (n.e.c.) is one such example. Output and exports of thisproduct are estimated to decline 0.4 percent (table E.27) and 0.6 percent(table E.29), respectively, under sector-by-sector liberalization, but outputexpands marginally and exports increase 0.1 percent under simultaneousliberalization (table E.30).
Sugar and Sugar-Containing Products
Total U.S. sugar use was 10.9 million short tons, raw value (strv), inmarketing year (MY) 2008.7 U.S. per capita sugar consumption has been
7USDA, FAS, Production Supply and Distribution Online. Data are on a marketing yearbasis, generally October of the previous year through September of the stated year.
SUGAR AND SUGAR-CONTAINING PRODUCTS 17
in a long-term decline, having peaked at 102.3 pounds, refined basis, in1972. Per capita consumption was 66.3 pounds in 2008. The declinemainly reflects a shift to lower-cost alternatives, principally high-fructosecorn syrup (HFCS), by primary users, mainly soft-drink manufacturers. Incalendar year (CY) 2007, refined sugar accounted for approximately 45percent of the total U.S. consumption of caloric sweeteners, down from 86percent in 1967, the year before consumption of HFCS was first recorded.8
For the purposes of this report, the sugar sector consists of threesix-digit categories in the North American Industry Classification System(NAICS): sugarcane mills (311311), cane sugar refining (311312), and beetsugar manufacturing (311313).9 Sugar is used as a primary product and asan input in the manufacture of a multitude of food items. These food items,which compose the sugar-containing-products (SCP) sector, span severalNAICS categories.10 The primary focus of this section is the sugar sector;SCPs affected by import restraints are discussed to a lesser extent.
U.S. producers supplied approximately 77 percent of U.S. sugarconsumption in MY 2008.11 U.S. raw cane sugar production totaled $1.4billion in MY 2007. U.S. refined sugar production totaled $4.1 billion, withrefined beet sugar accounting for 59 percent of the total (table 2.3).12 Thesugar processing sector employed about 13,000 workers in CY 2006. Thenumber of jobs in this sector has been in decline due to long-term industryconsolidation. Employment in the upstream sectors of sugarcane and sugarbeets totaled 7,337 workers in CY 2006.
The United States is a net importer of sugar, most of which is raw sugarproduced from sugarcane. The United States typically exports a smallamount of sugar.13 The total value of sugar imports declined from MY
8USDA, ERS, Sugar and Sweetener Yearbook Tables, undated (accessed March 26,2009).
9Sugarcane and sugar beet production (NAICS categories 111930 and 111991,respectively) are not formally included in the sugar sector, as the import restraint is appliedto the manufactured product.
10NAICS categories for SCPs include chocolate and confectionery manufacturingfrom cacao beans (31132); confectionery manufacturing from purchased chocolate(31133); nonchocolate confectionery manufacturing (31134); bread and bakery productmanufacturing (31181); cookie, cracker, and pasta manufacturing (31182); and flavoringsyrup and concentrate manufacturing (31193).
11USDA, ERS, Sugar and Sweetener Yearbook Tables, undated (accessed March 26,2009).
12Ibid.13Almost all exports of U.S. sugar fall under the refined sugar reexport program that
allows cane sugar refiners and manufacturers using refined sugar as an input to import
18 CHAPTER 2 SIGNIFICANT IMPORT RESTRAINTS
2006 to MY 2007 as the market recovered from adverse weather that led toa decrease in the domestic supply of sugar. Imports rose in 2008, largelyas the result of a decline in refinery capacity caused by a factory explosion.The share of the U.S. sugar market supplied by imports declined in termsof quantity (raw basis), from about 33 percent in MY 2006 to 20 percent inMY 2007, before rising to 24 percent in MY 2008.14
Nature of Trade Restraints
Trade restraints in the U.S. sugar sector are related to domestic policiesthat manage supplies in order to maintain market prices for raw cane andrefined sugar.15 If domestic prices fall below legislatively determinedprices (loan rates), producers may forfeit their supplies to the CommodityCredit Corporation of the U.S. Department of Agriculture at the loan rates.To maintain U.S. domestic prices sufficiently above the loan rates, theUnited States administers a system of TRQs for imports of raw cane andrefined sugar, blended sugar syrups, and SCPs for WTO member countriesin accordance with the WTO Agreement on Agriculture, and for othercountries under various bilateral and regional free trade agreements (FTAs)and preferential trade arrangements (PTAs).16
raw cane sugar at or slightly above world prices. However, the equivalent quantity ofimported sugar must be reexported within a given time period. The refined sugar reexportprogram is designed to ensure the competitiveness of U.S. sugarcane product exports on theworld market while offering U.S. cane sugar refiners access to the raw material to maintainutilization of their refineries’ capacity.
14USDA, ERS, Sugar and Sweetener Yearbook Tables, undated (accessed March 26,2009).
15The principal domestic policy elements include minimum prices (loan rates), aguaranteed 85 percent market share for U.S. producers, and a feedstock flexibility programto divert surplus sugar to ethanol production. A summary of major changes in the U.S.sugar program resulting from the 2008 farm bill is available at http://www.ers.usda.gov/FarmBill/2008/Titles/TitleIcommodities.htm#sugar.
16Currently the United States has FTAs with Jordan, Singapore, Chile, Australia,Morocco, Costa Rica, the Dominican Republic, El Salvador, Honduras, Nicaragua,Guatemala, Peru, Oman, and Bahrain. Preferential treatment under the raw cane sugar andrefined sugar TRQs was not provided in the FTA with Australia. PTAs include programssuch as GSP, CBERA, and AGOA. GSP, ATPA, and CBERA provide some benefits withrespect to sugar, while AGOA does not.
SUGAR AND SUGAR-CONTAINING PRODUCTS 19
WTO Agreement on Agriculture TRQs
The United States maintains separate TRQs for raw cane sugar, refinedsugar, certain SCPs, and blended sugar syrups, as well as an absolutequota for cocoa powder containing sugar under the WTO Agreement onAgriculture.17 Imports within the quota are dutiable at a low in-quotatariff rate, while imports beyond the quota are dutiable at a higher over-quota tariff rate. The majority of in-quota imports benefit from duty-freetreatment under various FTAs or PTAs.18 Imports of all sugar from Mexicohave been free of duty under NAFTA since January 1, 2008. Over-quotaimports are subject to automatic price-based safeguards, which effectivelyraise the over-quota tariff by the level of the safeguard.19
The raw cane sugar TRQ is allocated on a country-specific basis amongdesignated sugar-exporting nations in proportion to their average marketshare of U.S. imports during a base period of 1975–81. Under UruguayRound commitments, the United States is required to allocate at least1,117,195 mt annually. During MY 2006–08, the TRQ allocations for rawcane sugar were 1,717,750 mt for MY 2006, 1,336,736 mt for MY 2007,and 1,117,195 mt for MY 2008.20 The current farm bill requires that theminimum level be set at the beginning of each marketing year for sugar(October 1) and not be increased except in cases of emergency.21
The minimum level of the global refined sugar TRQ is 22,000 mtannually. However, annual allocations totaled 493,602 mt in MY 2006,largely the result of domestic supply interruptions owing to weatherconditions. The refined sugar TRQ totaled 75,144 mt in MY 2007 andinitially 85,503 mt in MY 2008. The MY 2008 TRQ was increased to357,658 mt, largely the result of the domestic refinery explosion mentioned
17The WTO TRQs for raw cane sugar, refined sugar, certain SCPs, and blended sugarsyrups are all provided for in the additional U.S. notes 5, 7, 8, and 9 to chap. 17 of the HTSand pertinent subheadings. The WTO TRQ for cocoa powder containing sugar is providedfor in additional U.S. note 1 of chap. 18 of the HTS. 15 C.F.R. 2011 (2009).
18In-quota imports from Argentina, Australia, Brazil, and Malawi were dutiable duringCY 2005–CY 2008.
19See U.S. note 1 to chap. 99, subchap. IV, of the U.S. HTS. Canada, Mexico, Jordan,Singapore, Chile, Australia, Morocco, El Salvador, Honduras, Nicaragua, Guatemala,Bahrain, the Dominican Republic, Costa Rica, Peru, and Oman are exempt from thesespecial safeguard duties because of FTAs between these countries and the United States.
20USDA, FAS, “Sugar under Tariff Rate Quotas,” undated (accessed April 2, 2009).21Emergencies include war, flood, hurricane, or other natural disaster, or other similar
event as determined by the Secretary of Agriculture. Food Conservation and Energy Act of2008, Pub. L. No. 110-234. This new farm bill became effective at the start of MY 2009.
20 CHAPTER 2 SIGNIFICANT IMPORT RESTRAINTS
above. A certain amount of the refined sugar TRQ—65,159 mt in 2008—isreserved for specialty sugars.22
FTA TRQs
TRQs for sugar and SCPs that are in addition to the WTO TRQsare provided for under various FTAs. The partner countries must be netexporters of sugar in order to receive the additional TRQs. Currently onlythe CAFTA-DR beneficiaries are net exporters. Under the CAFTA-DR, theadditional access covers raw cane sugar, refined sugar, and SCPs. The TRQfor these products has increased under the CAFTA-DR agreement for eachFTA member, with the initial additional regional access totaling 109,000mt. After a 15-year staging period, the additional regional access will total153,140 mt. After the 15-year phase-in period, the TRQ will rise by 2,640mt annually, in perpetuity. In CY 2008, sugar TRQs under FTAs totaled89,481 mt, virtually all of which were supplied by CAFTA-DR countries.
Restrictiveness of Trade Restraints
The TRQs in this sector limit U.S. imports (to about 14 percent of thequantity of U.S. sugar consumption on a raw-value basis in MY 2008) andassist in maintaining domestic sugar prices above USDA loan rates for rawcane and refined sugar. The TRQs contribute to a significant gap betweenU.S. prices and the so-called world price for raw cane and refined sugar.In 2008 the difference between the U.S. price (21.27 cents per pound) andthe world price (13.67 cents per pound) for raw cane sugar was 56 percent,while the difference between the U.S. price (29.86 cents per pound) andthe world price (15.55 cents per pound) for refined sugar was 92 percent.23
22Specialty sugars are defined in 15 C.F.R. 2011.202(i) (2009).23The world raw cane sugar price is represented by Contract No. 11 f.o.b. stowed
Caribbean port, including Brazil, bulk spot price; the U.S. raw cane sugar price isrepresented by Contract No. 14, duty fee paid New York, reported by the New YorkBoard of Trade. Prices were obtained from USDA, ERS, Sugar and Sweetener YearbookTables, undated (accessed March 26, 2009). The world refined sugar price is representedby Contract No. 5, London Daily Price, for refined sugar, f.o.b. Europe, spot price; the U.S.refined sugar price is represented by U.S. wholesale refined beet sugar price, reported bythe Milling & Baking News. Prices were obtained from USDA, ERS, Sugar and SweetenerYearbook Tables, undated (accessed March 26, 2009). In his testimony on behalf of theSweetener Users Association, Thomas Earley stated that the gap between U.S. raw sugarprice and the adjusted world price averaged about 6 cents per pound in the last three years,
SUGAR AND SUGAR-CONTAINING PRODUCTS 21
Another measure of the restrictiveness of the TRQs is the quota fillrate—U.S. sugar TRQs are essentially filled each year.24 TRQs restrictand distort the flow of trade to the United States because foreign supplierscannot compete in the U.S. market at the generally prohibitive over-quotaduty rates. Also, the TRQs provide market share to relatively high-costproducers, such as the Dominican Republic, at the expense of lower-costproducers, such as Brazil and Thailand. Despite the restrictions imposedby the TRQs, U.S. policy provides flexibility to allow a greater quantity ofimports in cases of emergency.25
Effects of Liberalization
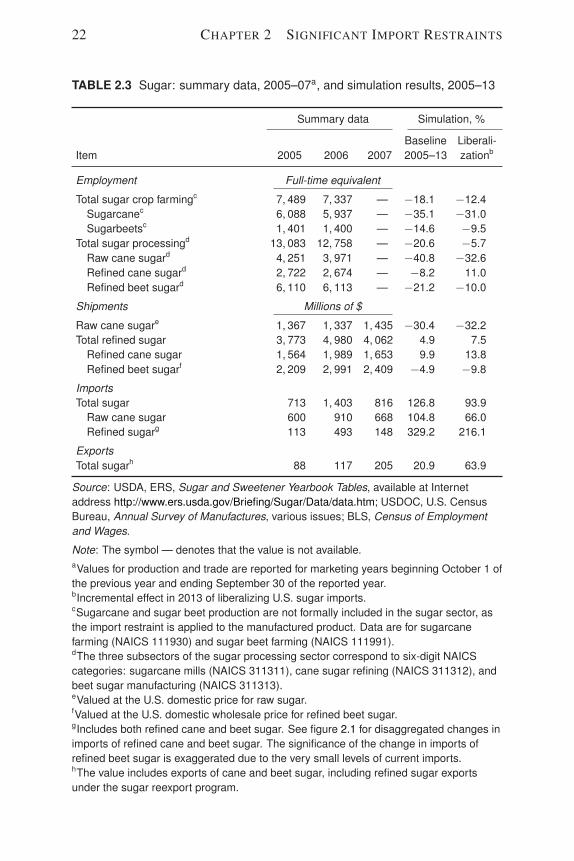
Removal of the restrictions on imports of sugar is expected to result inan increase in U.S. welfare of $514 million. Table 2.3, figures 2.1 and 2.2(green lines in the figures show the response of the entire U.S. economy),and tables E.2–E.5 in appendix E show the effects of liberalizing U.S.sugar import restrictions. Liberalizing consists of removing TRQs andeliminating the remaining within-quota tariffs. As a result, the importprice of raw cane sugar (landed, duty-paid) would decline by 35 percent,compared with the 2013 baseline projection (table E.4). As prices decline,demand for imported sugar is expected to increase by 66 percent for rawcane sugar and more than 200 percent for refined sugar. The increasedcompetition from imports would push down domestic production of rawcane sugar (by 32 percent) and of refined beet sugar (by 10 percent), aswell as production of the sugarcane and beets from which the sugar isproduced (table E.3). Employment would decline by similar percentages.However, domestic production of refined cane sugar actually rises by 14percent because the imported raw cane sugar is an input into domesticsugar refineries. Household prices of refined sugar would decline by 5.2percent. Because of the reduced cost of sugar, production of SCPs wouldincrease slightly, while household prices of these products would declineby a fraction of a percent.
compared to about 10 cents per pound during 1990–2005, but that the price gap for refinedsugar averaged 12 cents per pound over the last three years. USITC, Hearing transcript,January 8, 2009, 16–17 (testimony of Thomas Earley, Sweetener Users Association).
24Minor shortfalls may occur. For more information about the nature of the TRQs, seeUSITC, The Economic Effects of Significant U.S. Import Restraints: Fourth Update, 2004.
25Food, Conservation, and Energy Act of 2008, Pub. L. No. 110-234.
22 CHAPTER 2 SIGNIFICANT IMPORT RESTRAINTS
TABLE 2.3 Sugar: summary data, 2005–07a, and simulation results, 2005–13
Summary data Simulation, %
Baseline Liberali-Item 2005 2006 2007 2005–13 zationb
Employment Full-time equivalent
Total sugar crop farmingc 7, 489 7, 337 — −18.1 −12.4Sugarcanec 6, 088 5, 937 — −35.1 −31.0Sugarbeetsc 1, 401 1, 400 — −14.6 −9.5
Total sugar processingd 13, 083 12, 758 — −20.6 −5.7Raw cane sugard 4, 251 3, 971 — −40.8 −32.6Refined cane sugard 2, 722 2, 674 — −8.2 11.0Refined beet sugard 6, 110 6, 113 — −21.2 −10.0
Shipments Millions of $
Raw cane sugare 1, 367 1, 337 1, 435 −30.4 −32.2Total refined sugar 3, 773 4, 980 4, 062 4.9 7.5
Refined cane sugar 1, 564 1, 989 1, 653 9.9 13.8Refined beet sugarf 2, 209 2, 991 2, 409 −4.9 −9.8
ImportsTotal sugar 713 1, 403 816 126.8 93.9
Raw cane sugar 600 910 668 104.8 66.0Refined sugarg 113 493 148 329.2 216.1
ExportsTotal sugarh 88 117 205 20.9 63.9
Source: USDA, ERS, Sugar and Sweetener Yearbook Tables, available at Internetaddress http://www.ers.usda.gov/Briefing/Sugar/Data/data.htm; USDOC, U.S. CensusBureau, Annual Survey of Manufactures, various issues; BLS, Census of Employmentand Wages.
Note: The symbol — denotes that the value is not available.aValues for production and trade are reported for marketing years beginning October 1 ofthe previous year and ending September 30 of the reported year.bIncremental effect in 2013 of liberalizing U.S. sugar imports.cSugarcane and sugar beet production are not formally included in the sugar sector, asthe import restraint is applied to the manufactured product. Data are for sugarcanefarming (NAICS 111930) and sugar beet farming (NAICS 111991).dThe three subsectors of the sugar processing sector correspond to six-digit NAICScategories: sugarcane mills (NAICS 311311), cane sugar refining (NAICS 311312), andbeet sugar manufacturing (NAICS 311313).eValued at the U.S. domestic price for raw sugar.fValued at the U.S. domestic wholesale price for refined beet sugar.gIncludes both refined cane and beet sugar. See figure 2.1 for disaggregated changes inimports of refined cane and beet sugar. The significance of the change in imports ofrefined beet sugar is exaggerated due to the very small levels of current imports.hThe value includes exports of cane and beet sugar, including refined sugar exportsunder the sugar reexport program.
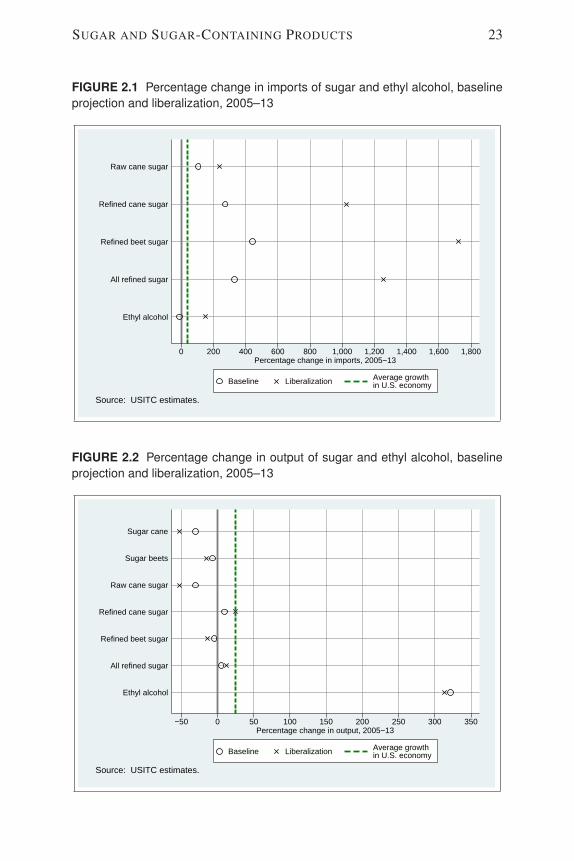
SUGAR AND SUGAR-CONTAINING PRODUCTS 23
FIGURE 2.1 Percentage change in imports of sugar and ethyl alcohol, baselineprojection and liberalization, 2005–13
0 200 400 600 800 1,000 1,200 1,400 1,600 1,800Percentage change in imports, 2005−13
Ethyl alcohol
All refined sugar
Refined beet sugar
Refined cane sugar
Raw cane sugar
Source: USITC estimates.
Baseline Liberalization Average growthin U.S. economy
FIGURE 2.2 Percentage change in output of sugar and ethyl alcohol, baselineprojection and liberalization, 2005–13
−50 0 50 100 150 200 250 300 350Percentage change in output, 2005−13
Ethyl alcohol
All refined sugar
Refined beet sugar
Refined cane sugar
Raw cane sugar
Sugar beets
Sugar cane
Source: USITC estimates.
Baseline Liberalization Average growthin U.S. economy
24 CHAPTER 2 SIGNIFICANT IMPORT RESTRAINTS
Ethyl Alcohol
Ethyl alcohol for fuel use (ethanol)26 is a clear, colorless liquidproduced from corn, sugarcane, or other feedstocks. The bulk of ethanolproduction in the United States is derived from corn.27 U.S. productionof ethanol in 2007 was valued at $14.3 billion (table 2.4). Productioncapacity in the United States, as of January 2009, totaled approximately12.5 billion gallons.28 The U.S. ethanol industry employed 4,262 workersin 2006 (table 2.4). The United States is the leading global producer ofethanol, accounting for 52 percent of world production in 2008.29
The Energy Policy Act of 2005 (EPA) established a renewable fuelprogram, which mandated that renewable fuels, including ethanol, beblended with gasoline.30 The Energy Independence and Security Act of2007 made several changes to the EPA and established the Renewable FuelStandard (RFS).31
The RFS requires that 36 billion gallons of renewable fuel be mixedinto domestic gasoline supplies by 2022 (figure 2.3). Of this amount, 21billion gallons must be advanced biofuel, consisting of at least 16 billiongallons of cellulosic biofuel and at least 1 billion gallons of biodiesel.The remaining 4 billion gallons of unspecified advanced biofuel can beprovided by noncorn-based feedstocks, such as sugarcane. The remaining15 billion gallons of unspecified renewable fuel can be provided by cornethanol. The RFS can be filled by ethanol from domestic production as wellas from imports. Depending on feedstock requirements, biofuel in more re-strictive categories may fill the requirement in less restrictive categories.32
These amounts are not binding—they are minimums; additional amountscan be blended and receive tax credits. In 2009, the RFS is equivalentto 10.21 percent of projected U.S. gasoline consumption. The RFS isincorporated into the baseline projection.
Nature of Trade Restraints
Imports of ethyl alcohol for fuel use are restricted by duties and anorigin quota. Two duties are applied to imports of fuel ethanol. The general
26For the purposes of this study, ethyl alcohol and ethanol are used interchangeably.27There are two different processes used in the United States to produce ethanol from
corn: dry corn milling and wet corn milling. Corresponding North American IndustryClassification System codes for the dry and wet milling production of fuel-grade ethanol are32519303 and 32519301, respectively. The production of ethanol from cellulosic biomass
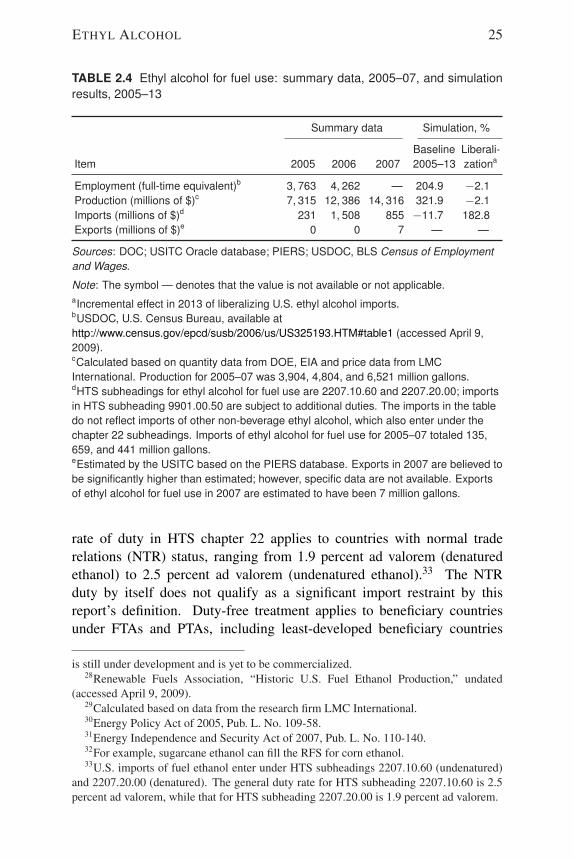
ETHYL ALCOHOL 25
TABLE 2.4 Ethyl alcohol for fuel use: summary data, 2005–07, and simulationresults, 2005–13
Summary data Simulation, %
Baseline Liberali-Item 2005 2006 2007 2005–13 zationa
Employment (full-time equivalent)b 3, 763 4, 262 — 204.9 −2.1Production (millions of $)c 7, 315 12, 386 14, 316 321.9 −2.1Imports (millions of $)d 231 1, 508 855 −11.7 182.8Exports (millions of $)e 0 0 7 — —
Sources: DOC; USITC Oracle database; PIERS; USDOC, BLS Census of Employmentand Wages.
Note: The symbol — denotes that the value is not available or not applicable.aIncremental effect in 2013 of liberalizing U.S. ethyl alcohol imports.bUSDOC, U.S. Census Bureau, available athttp://www.census.gov/epcd/susb/2006/us/US325193.HTM#table1 (accessed April 9,2009).cCalculated based on quantity data from DOE, EIA and price data from LMCInternational. Production for 2005–07 was 3,904, 4,804, and 6,521 million gallons.dHTS subheadings for ethyl alcohol for fuel use are 2207.10.60 and 2207.20.00; importsin HTS subheading 9901.00.50 are subject to additional duties. The imports in the tabledo not reflect imports of other non-beverage ethyl alcohol, which also enter under thechapter 22 subheadings. Imports of ethyl alcohol for fuel use for 2005–07 totaled 135,659, and 441 million gallons.eEstimated by the USITC based on the PIERS database. Exports in 2007 are believed tobe significantly higher than estimated; however, specific data are not available. Exportsof ethyl alcohol for fuel use in 2007 are estimated to have been 7 million gallons.
rate of duty in HTS chapter 22 applies to countries with normal traderelations (NTR) status, ranging from 1.9 percent ad valorem (denaturedethanol) to 2.5 percent ad valorem (undenatured ethanol).33 The NTRduty by itself does not qualify as a significant import restraint by thisreport’s definition. Duty-free treatment applies to beneficiary countriesunder FTAs and PTAs, including least-developed beneficiary countries
is still under development and is yet to be commercialized.28Renewable Fuels Association, “Historic U.S. Fuel Ethanol Production,” undated
(accessed April 9, 2009).29Calculated based on data from the research firm LMC International.30Energy Policy Act of 2005, Pub. L. No. 109-58.31Energy Independence and Security Act of 2007, Pub. L. No. 110-140.32For example, sugarcane ethanol can fill the RFS for corn ethanol.33U.S. imports of fuel ethanol enter under HTS subheadings 2207.10.60 (undenatured)
and 2207.20.00 (denatured). The general duty rate for HTS subheading 2207.10.60 is 2.5percent ad valorem, while that for HTS subheading 2207.20.00 is 1.9 percent ad valorem.
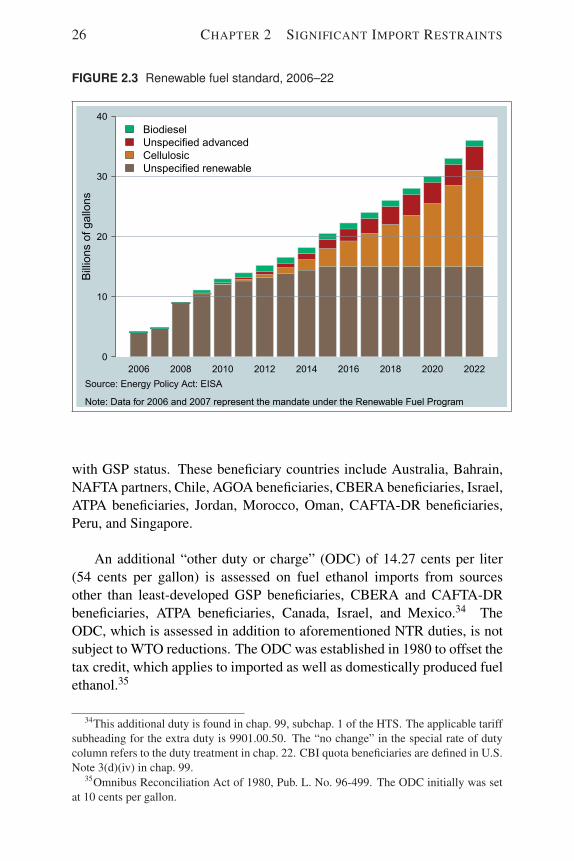
26 CHAPTER 2 SIGNIFICANT IMPORT RESTRAINTS
FIGURE 2.3 Renewable fuel standard, 2006–22
2006 2008 2010 2012 2014 2016 2018 2020 2022
0
10
20
30
40
Biodiesel
Unspecified advanced
Cellulosic
Unspecified renewable
Bill
ions o
f gallo
ns
Source: Energy Policy Act: EISA
Note: Data for 2006 and 2007 represent the mandate under the Renewable Fuel Program
with GSP status. These beneficiary countries include Australia, Bahrain,NAFTA partners, Chile, AGOA beneficiaries, CBERA beneficiaries, Israel,ATPA beneficiaries, Jordan, Morocco, Oman, CAFTA-DR beneficiaries,Peru, and Singapore.
An additional “other duty or charge” (ODC) of 14.27 cents per liter(54 cents per gallon) is assessed on fuel ethanol imports from sourcesother than least-developed GSP beneficiaries, CBERA and CAFTA-DRbeneficiaries, ATPA beneficiaries, Canada, Israel, and Mexico.34 TheODC, which is assessed in addition to aforementioned NTR duties, is notsubject to WTO reductions. The ODC was established in 1980 to offset thetax credit, which applies to imported as well as domestically produced fuelethanol.35
34This additional duty is found in chap. 99, subchap. 1 of the HTS. The applicable tariffsubheading for the extra duty is 9901.00.50. The “no change” in the special rate of dutycolumn refers to the duty treatment in chap. 22. CBI quota beneficiaries are defined in U.S.Note 3(d)(iv) in chap. 99.
35Omnibus Reconciliation Act of 1980, Pub. L. No. 96-499. The ODC initially was setat 10 cents per gallon.
ETHYL ALCOHOL 27
In addition to duty-free access for ethanol produced from local feed-stock under the FTAs and PTAs, certain countries receive duty-free accessto the U.S. fuel ethanol market for a specified amount of ethanol producedfrom imported feedstocks under an origin quota.36 In-quota imports fromCBERA and CAFTA-DR beneficiaries, as well as U.S. insular possessions,enter free of duty. Over-quota imports are not considered to be a productof those countries and are assessed the rate applicable to the origin of thefeedstocks. The quota has never been filled; the fill rate was 75 percentin 2008.37 The USITC estimated total U.S. domestic consumption ofethanol for the 12-month period ending September 30, 2008, to be 8.88billion gallons; therefore the quota is 621.5 million gallons for calendaryear 2009.38
Restrictiveness of Trade Restraints
The general rates of duty on ethanol are relatively low and are notsignificantly restrictive. The additional 14.27 cents-per-liter ODC onimports of fuel ethanol was not considered restrictive during most of 2006–08 because most dutiable imports received duty drawbacks.39 However,as of October 1, 2008, the drawback provisions were amended to requirethat ethanol be contained in any product that is being used to claim dutydrawbacks on imports of fuel ethanol.40 This policy change essentiallyreestablished the ODC, which is now applicable to imports from Brazil, the
36Steel Trade Liberalization Program Implementation Act of 1989, Pub. L. No. 101-221, §7. Under the quota, CBERA beneficiaries as of the date of the implementation ofthe quota (1989) may import and dehydrate hydrous ethanol, mainly from Brazil, andexport the finished product free of duty to the United States. The quota confers originto the finished product; the duty-free treatment then follows. Beneficiaries include thosecountries currently under the CBERA and CAFTA-DR. The quota also applies to U.S.insular possessions, which receive no less favorable treatment. The quota applies to dutiesunder HTS chaps. 22 and 99.
37Data provided by the U.S. Department of Homeland Security, Customs and BorderProtection Agency. For more information on the TRQs, see USITC, The Economic Effectsof Significant U.S. Import Restraints: Fourth Update, 2004.
3873 Fed. Reg. 75770 (December 12, 2008). The TRQ was 268.1 million gallons in2006, 343.9 million gallons in 2007, and 452.5 million gallons in 2008.
39U.S. imports of fuel ethanol from dutiable sources, particularly Brazil, benefited fromduty drawbacks during 2004–08. For more information on fuel ethanol duty drawbacks,see USITC, The Economic Effects of Significant Import Restraints: Fifth Update, 2007.
40Food, Conservation, and Energy Act of 2008, Pub. L. No. 110-234, §15334 (2008).Previously, the drawback was eligible for sales of jet fuel that was used for overseas flights.Jet fuel contains no ethanol.
28 CHAPTER 2 SIGNIFICANT IMPORT RESTRAINTS
only major dutiable supplier. The ODC likely will be restrictive, dependingon market conditions. There were no direct imports of fuel ethanol fromBrazil in 2008 following the drawback change. However, unfavorable U.S.market conditions, caused largely by oversupply and the financial crisis,likely were contributing factors as well.
Effects of Liberalization
Liberalization is expected to result in an increase in U.S. welfare of$356 million. The effects of liberalizing U.S. imports of ethyl alcoholare modeled by removing the quota and all tariffs on imports of ethylalcohol. Summary results from liberalization are shown in table 2.4;sectoral impacts of the liberalization are shown in figures 2.1 and 2.2 andin tables E.6–E.9.
The only significant impact is felt in the ethanol sector itself; effectson upstream industries are minimal. Elimination of the origin quotawould lower the landed, duty-paid price of ethanol by 25 percent fromthe projected 2013 baseline value, increasing the value of imports by205 percent (table E.8). Because imports are small relative to domesticproduction, the effect on domestic output is small, a decrease of about 3percent.
Dairy Products
In response to increased domestic and foreign demand, U.S. shipmentsof dairy products rose considerably during 2005–07 and reached $106.2billion in 2007 (table 2.5). U.S. trade in dairy products is small comparedwith total domestic production. In 2007, dairy imports amounted to $2.1billion, or about 2 percent of the total value of U.S. dairy shipments,while dairy exports amounted to $3.1 billion, or just under 3 percentof such shipments. More than 80 percent of dairy imports consisted ofcheese, casein/caseinates, and milk protein concentrates (MPC) in 2007.Other imported products include butter and ice cream (nearly 5 percent,combined, of dairy imports). Major dairy exports in 2007 were nonfat drymilk (NDM), whey products (which falls under the dry/condensed milkproducts category), cheese, and lactose.41
41Casein, caseinates, and MPC have not been produced in the United States in largequantities since the early 1950s. After USDA established a price support program for
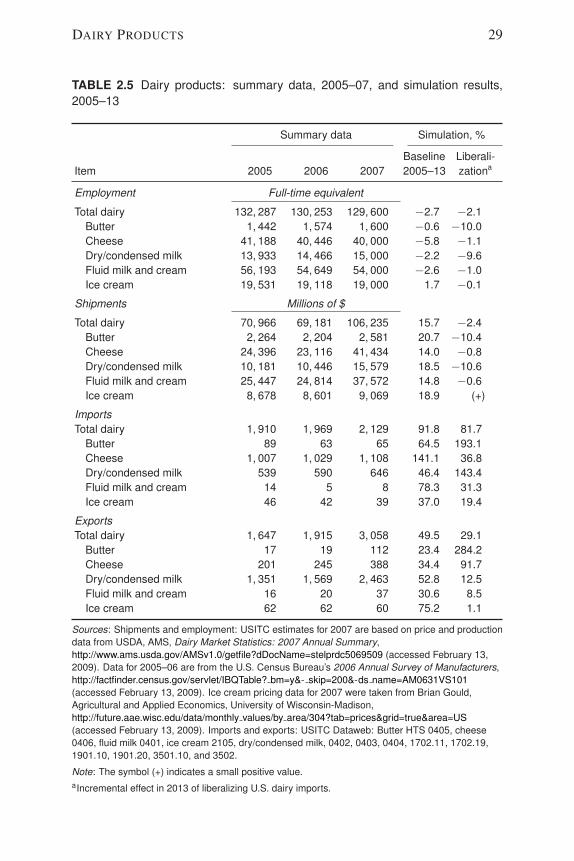
DAIRY PRODUCTS 29
TABLE 2.5 Dairy products: summary data, 2005–07, and simulation results,2005–13
Summary data Simulation, %
Baseline Liberali-Item 2005 2006 2007 2005–13 zationa
Employment Full-time equivalent
Total dairy 132, 287 130, 253 129, 600 −2.7 −2.1Butter 1, 442 1, 574 1, 600 −0.6 −10.0Cheese 41, 188 40, 446 40, 000 −5.8 −1.1Dry/condensed milk 13, 933 14, 466 15, 000 −2.2 −9.6Fluid milk and cream 56, 193 54, 649 54, 000 −2.6 −1.0Ice cream 19, 531 19, 118 19, 000 1.7 −0.1
Shipments Millions of $
Total dairy 70, 966 69, 181 106, 235 15.7 −2.4Butter 2, 264 2, 204 2, 581 20.7 −10.4Cheese 24, 396 23, 116 41, 434 14.0 −0.8Dry/condensed milk 10, 181 10, 446 15, 579 18.5 −10.6Fluid milk and cream 25, 447 24, 814 37, 572 14.8 −0.6Ice cream 8, 678 8, 601 9, 069 18.9 (+)
ImportsTotal dairy 1, 910 1, 969 2, 129 91.8 81.7
Butter 89 63 65 64.5 193.1Cheese 1, 007 1, 029 1, 108 141.1 36.8Dry/condensed milk 539 590 646 46.4 143.4Fluid milk and cream 14 5 8 78.3 31.3Ice cream 46 42 39 37.0 19.4
ExportsTotal dairy 1, 647 1, 915 3, 058 49.5 29.1
Butter 17 19 112 23.4 284.2Cheese 201 245 388 34.4 91.7Dry/condensed milk 1, 351 1, 569 2, 463 52.8 12.5Fluid milk and cream 16 20 37 30.6 8.5Ice cream 62 62 60 75.2 1.1
Sources: Shipments and employment: USITC estimates for 2007 are based on price and productiondata from USDA, AMS, Dairy Market Statistics: 2007 Annual Summary,http://www.ams.usda.gov/AMSv1.0/getfile?dDocName=stelprdc5069509 (accessed February 13,2009). Data for 2005–06 are from the U.S. Census Bureau’s 2006 Annual Survey of Manufacturers,http://factfinder.census.gov/servlet/IBQTable? bm=y&- skip=200&-ds name=AM0631VS101(accessed February 13, 2009). Ice cream pricing data for 2007 were taken from Brian Gould,Agricultural and Applied Economics, University of Wisconsin-Madison,http://future.aae.wisc.edu/data/monthly values/by area/304?tab=prices&grid=true&area=US(accessed February 13, 2009). Imports and exports: USITC Dataweb: Butter HTS 0405, cheese0406, fluid milk 0401, ice cream 2105, dry/condensed milk, 0402, 0403, 0404, 1702.11, 1702.19,1901.10, 1901.20, 3501.10, and 3502.
Note: The symbol (+) indicates a small positive value.aIncremental effect in 2013 of liberalizing U.S. dairy imports.
30 CHAPTER 2 SIGNIFICANT IMPORT RESTRAINTS
Nature and Restrictiveness of Trade Restraints
Several dairy products, including fluid milk and cream, butter, cheese,powdered milk products, ice cream, infant formula, and animal feedscontaining milk, have significant import restraints.42 Import restraintsoperate in conjunction with a complex system of federal, state, andlocal laws to maintain price and production supports for the domesticdairy industry. Federal programs include domestic price supports, milkmarketing orders, export supports such as the Dairy Export IncentiveProgram (DEIP), and domestic and international food aid programs.43 TheUSDA has not funded the DEIP since the beginning of FY 2005 becauseU.S. prices for NDM, butter, and several varieties of cheese have beenglobally competitive, at least through 2007.
Of the approximately 392 U.S. 10-digit HTS numbers considered tobe dairy products, 135 are not subject to any TRQs. The other 257 HTSnumbers are subject to 27 separate TRQs, most of which have country-specific in-quota volume allocations.44 U.S. imports of dairy productssubject to these TRQs are primarily cheese, ice cream, butter, and yogurt.
Slightly more than one half (51 percent) of the value of dairy productsimported into the United States during 2007 was not subject to TRQs,including MPC, whey protein concentrates, and certain varieties of cheese(mainly cheese made of sheep and goat milk). These imports face lowtariffs and account for over 95 percent of domestic consumption of theseproducts, and U.S. production of these products is negligible. For example,the average ad valorem equivalent (AVE) across all nonquota imports was0.4 percent during 2005–07, with cheese not subject to TRQs averaging 1.4
milk, U.S. butter and milk powder producers realized greater returns from drying theirskim milk into nonfat dry milk and selling it to the government intervention agency, theCommodity Credit Corporation (CCC), than from processing it into casein and MPC.Therefore, domestic supplies of casein are furnished by imports.
42Some food preparations and chocolate products covered in chaps. 18, 19, and 21 ofthe HTS contain both dairy and sugar products.
43DEIP covers NDM, butterfat, and various cheeses. It helps U.S. dairy exportersmatch prevailing prices in certain export markets by paying cash bonuses, thereby allowingexporters to sell certain U.S. dairy products at prices lower than the exporter’s costsof acquiring them. DEIP is designed to develop export markets where U.S. productsare not competitive because of subsidized dairy products from other countries. Formore information on DEIP, see USDA, FAS, “Dairy Export Incentive Program,” undated(accessed February 10, 2009).
44Submission by the National Milk Producers Federation, February 6, 2009, 3.
DAIRY PRODUCTS 31
percent. Casein and milk albumin, accounting for 17 percent of all dairyimports, were imported duty-free. By comparison, the average ad valoremequivalent for imports subject to TRQs was 8.4 percent.
Overall, the TRQ system has made over-quota imports uncompetitivein the U.S. market. For example, in 2007, the U.S. price of butter ($1.35per pound) was significantly higher than the price of imports subject tothe in-quota tariff ($1.26 per pound), but lower than the price of importssubject to the over-quota tariff ($1.46 per pound). Similarly, for cheese, theover-quota tariff for the most part was sufficient to deter imports above theTRQ level during 2005–07.45
TRQ fill rates, the ratio between imports and the quota level, providean indication of the restrictiveness of restraints. In 2007 fill rates forbutter and cheese exceeded 90 percent, which indicates restrictiveness. Insome product categories, however, fill rates show that the TRQs were notconstraining in 2007. For instance, the quotas do not appear to be bindingfor whole milk powder (58 percent fill), NDM (6 percent fill), fluid milkand cream (44 percent fill), and ice cream (69 percent fill). However, it isdifficult to gauge whether these TRQs may still have had some small effectbecause the U.S. licensing system allocates country-specific quantitativelimits and thus the quota fill rate may have been higher for particularcountries.
In some instances there is clearly no effect from TRQs. For example,since 2005, U.S. imports of milk powders declined, and the United Statesbecame a significant exporter of NDM. During 2005–07, the price ofNDM in the United States was 2 to 30 percent lower (but typically morethan 10 percent lower) than European and Oceania prices for skim milkpowder.46 Part of the explanation for this price discrepancy is that NDMand skim milk powder are not completely substitutable on world markets.Another explanation is that federal milk programs at times encourageoverproduction of NDM at the expense of other dairy products.
45Over-quota imports can occur when the U.S. domestic price exceeds the world price bymore than the tariff. For example, high U.S. prices of cheese in the second quarter of 2005led to limited over-quota imports. During this period, the gap between the U.S. price andthe world price was as much as $850 per metric ton. But most of the over-quota importsfor any year occur in the fourth quarter, as annual quota volumes fill. For 2006 and 2007,U.S. and international prices for most cheeses tracked closely.
46Alan Levitt Corporate Communications, “SMP: World Prices vs. U.S. Prices,” undated(accessed February 17, 2009).
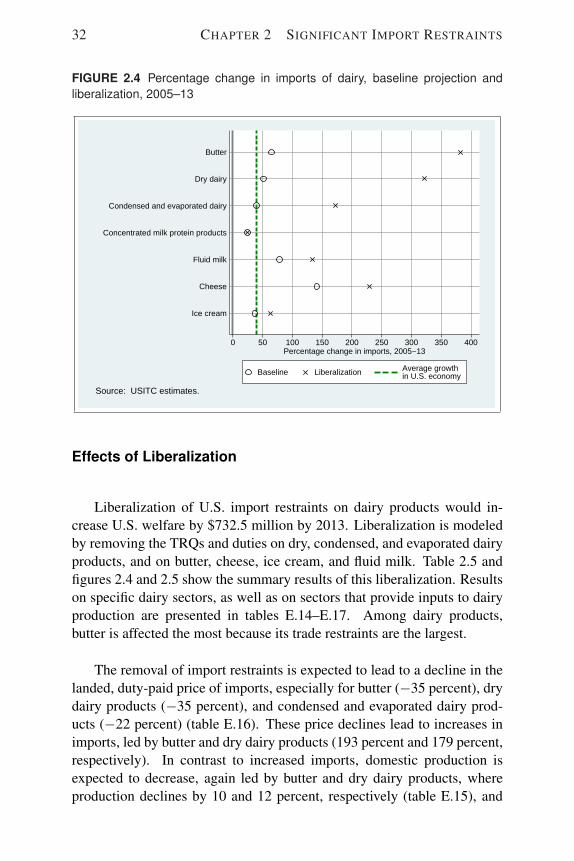
32 CHAPTER 2 SIGNIFICANT IMPORT RESTRAINTS
FIGURE 2.4 Percentage change in imports of dairy, baseline projection andliberalization, 2005–13
0 50 100 150 200 250 300 350 400Percentage change in imports, 2005−13
Ice cream
Cheese
Fluid milk
Concentrated milk protein products
Condensed and evaporated dairy
Dry dairy
Butter
Source: USITC estimates.
Baseline Liberalization Average growthin U.S. economy
Effects of Liberalization
Liberalization of U.S. import restraints on dairy products would in-crease U.S. welfare by $732.5 million by 2013. Liberalization is modeledby removing the TRQs and duties on dry, condensed, and evaporated dairyproducts, and on butter, cheese, ice cream, and fluid milk. Table 2.5 andfigures 2.4 and 2.5 show the summary results of this liberalization. Resultson specific dairy sectors, as well as on sectors that provide inputs to dairyproduction are presented in tables E.14–E.17. Among dairy products,butter is affected the most because its trade restraints are the largest.
The removal of import restraints is expected to lead to a decline in thelanded, duty-paid price of imports, especially for butter (−35 percent), drydairy products (−35 percent), and condensed and evaporated dairy prod-ucts (−22 percent) (table E.16). These price declines lead to increases inimports, led by butter and dry dairy products (193 percent and 179 percent,respectively). In contrast to increased imports, domestic production isexpected to decrease, again led by butter and dry dairy products, whereproduction declines by 10 and 12 percent, respectively (table E.15), and
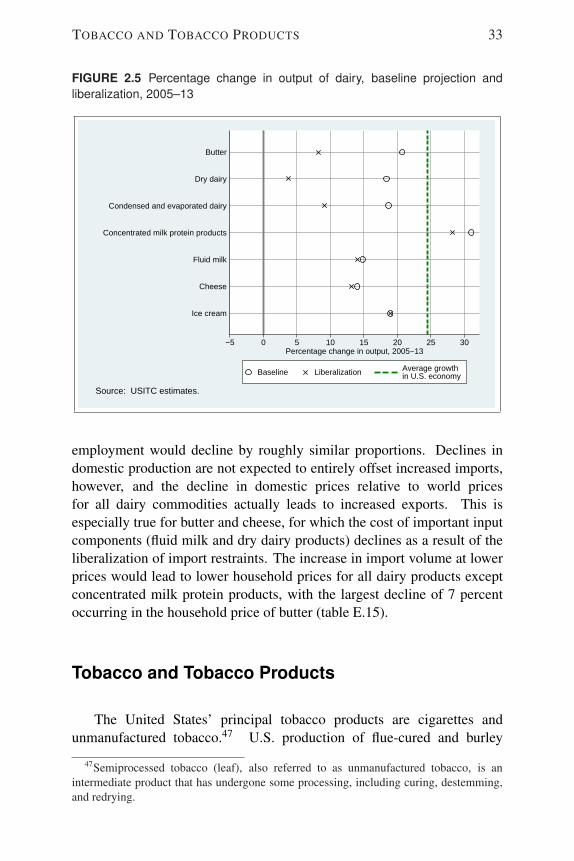
TOBACCO AND TOBACCO PRODUCTS 33
FIGURE 2.5 Percentage change in output of dairy, baseline projection andliberalization, 2005–13
−5 0 5 10 15 20 25 30Percentage change in output, 2005−13
Ice cream
Cheese
Fluid milk
Concentrated milk protein products
Condensed and evaporated dairy
Dry dairy
Butter
Source: USITC estimates.
Baseline Liberalization Average growthin U.S. economy
employment would decline by roughly similar proportions. Declines indomestic production are not expected to entirely offset increased imports,however, and the decline in domestic prices relative to world pricesfor all dairy commodities actually leads to increased exports. This isespecially true for butter and cheese, for which the cost of important inputcomponents (fluid milk and dry dairy products) declines as a result of theliberalization of import restraints. The increase in import volume at lowerprices would lead to lower household prices for all dairy products exceptconcentrated milk protein products, with the largest decline of 7 percentoccurring in the household price of butter (table E.15).
Tobacco and Tobacco Products
The United States’ principal tobacco products are cigarettes andunmanufactured tobacco.47 U.S. production of flue-cured and burley
47Semiprocessed tobacco (leaf), also referred to as unmanufactured tobacco, is anintermediate product that has undergone some processing, including curing, destemming,and redrying.
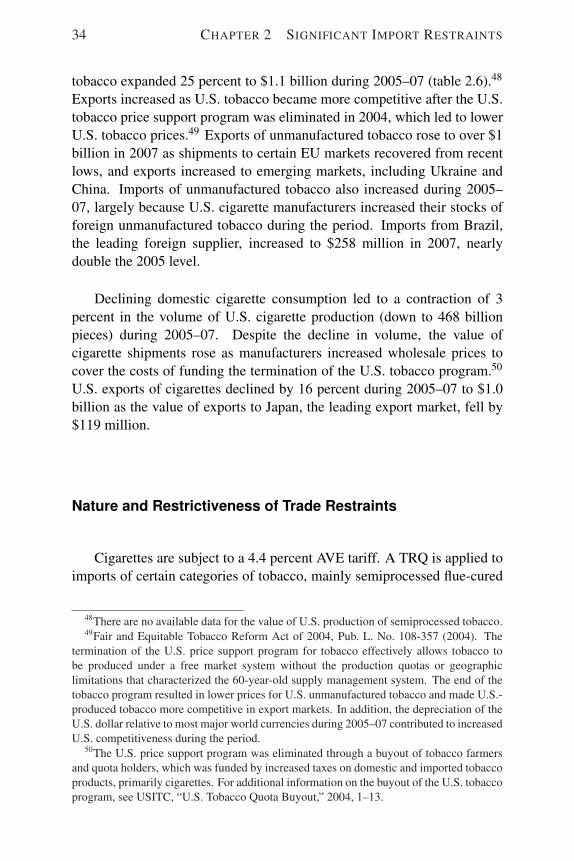
34 CHAPTER 2 SIGNIFICANT IMPORT RESTRAINTS
tobacco expanded 25 percent to $1.1 billion during 2005–07 (table 2.6).48
Exports increased as U.S. tobacco became more competitive after the U.S.tobacco price support program was eliminated in 2004, which led to lowerU.S. tobacco prices.49 Exports of unmanufactured tobacco rose to over $1billion in 2007 as shipments to certain EU markets recovered from recentlows, and exports increased to emerging markets, including Ukraine andChina. Imports of unmanufactured tobacco also increased during 2005–07, largely because U.S. cigarette manufacturers increased their stocks offoreign unmanufactured tobacco during the period. Imports from Brazil,the leading foreign supplier, increased to $258 million in 2007, nearlydouble the 2005 level.
Declining domestic cigarette consumption led to a contraction of 3percent in the volume of U.S. cigarette production (down to 468 billionpieces) during 2005–07. Despite the decline in volume, the value ofcigarette shipments rose as manufacturers increased wholesale prices tocover the costs of funding the termination of the U.S. tobacco program.50
U.S. exports of cigarettes declined by 16 percent during 2005–07 to $1.0billion as the value of exports to Japan, the leading export market, fell by$119 million.
Nature and Restrictiveness of Trade Restraints
Cigarettes are subject to a 4.4 percent AVE tariff. A TRQ is applied toimports of certain categories of tobacco, mainly semiprocessed flue-cured
48There are no available data for the value of U.S. production of semiprocessed tobacco.49Fair and Equitable Tobacco Reform Act of 2004, Pub. L. No. 108-357 (2004). The
termination of the U.S. price support program for tobacco effectively allows tobacco tobe produced under a free market system without the production quotas or geographiclimitations that characterized the 60-year-old supply management system. The end of thetobacco program resulted in lower prices for U.S. unmanufactured tobacco and made U.S.-produced tobacco more competitive in export markets. In addition, the depreciation of theU.S. dollar relative to most major world currencies during 2005–07 contributed to increasedU.S. competitiveness during the period.
50The U.S. price support program was eliminated through a buyout of tobacco farmersand quota holders, which was funded by increased taxes on domestic and imported tobaccoproducts, primarily cigarettes. For additional information on the buyout of the U.S. tobaccoprogram, see USITC, “U.S. Tobacco Quota Buyout,” 2004, 1–13.
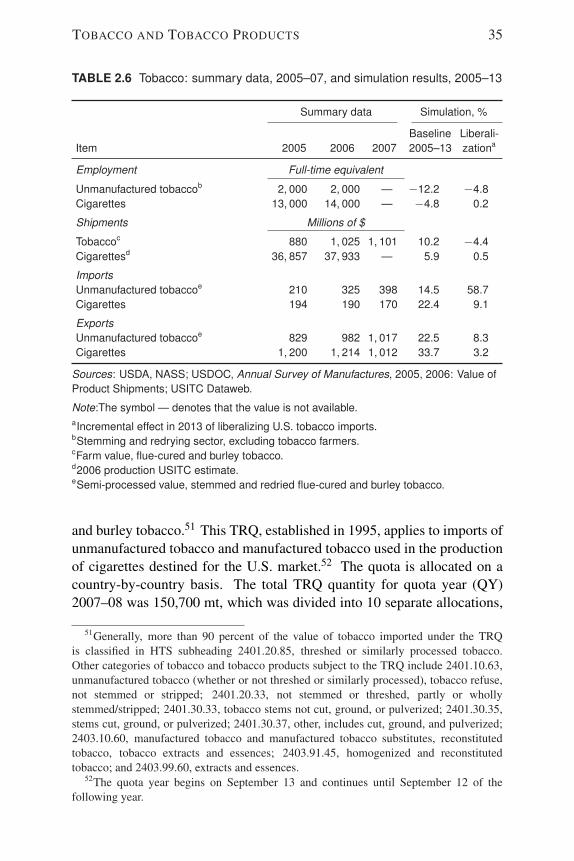
TOBACCO AND TOBACCO PRODUCTS 35
TABLE 2.6 Tobacco: summary data, 2005–07, and simulation results, 2005–13
Summary data Simulation, %
Baseline Liberali-Item 2005 2006 2007 2005–13 zationa
Employment Full-time equivalent
Unmanufactured tobaccob 2, 000 2, 000 — −12.2 −4.8Cigarettes 13, 000 14, 000 — −4.8 0.2
Shipments Millions of $
Tobaccoc 880 1, 025 1, 101 10.2 −4.4Cigarettesd 36, 857 37, 933 — 5.9 0.5
ImportsUnmanufactured tobaccoe 210 325 398 14.5 58.7Cigarettes 194 190 170 22.4 9.1
ExportsUnmanufactured tobaccoe 829 982 1, 017 22.5 8.3Cigarettes 1, 200 1, 214 1, 012 33.7 3.2
Sources: USDA, NASS; USDOC, Annual Survey of Manufactures, 2005, 2006: Value ofProduct Shipments; USITC Dataweb.
Note:The symbol — denotes that the value is not available.aIncremental effect in 2013 of liberalizing U.S. tobacco imports.bStemming and redrying sector, excluding tobacco farmers.cFarm value, flue-cured and burley tobacco.d2006 production USITC estimate.eSemi-processed value, stemmed and redried flue-cured and burley tobacco.
and burley tobacco.51 This TRQ, established in 1995, applies to imports ofunmanufactured tobacco and manufactured tobacco used in the productionof cigarettes destined for the U.S. market.52 The quota is allocated on acountry-by-country basis. The total TRQ quantity for quota year (QY)2007–08 was 150,700 mt, which was divided into 10 separate allocations,
51Generally, more than 90 percent of the value of tobacco imported under the TRQis classified in HTS subheading 2401.20.85, threshed or similarly processed tobacco.Other categories of tobacco and tobacco products subject to the TRQ include 2401.10.63,unmanufactured tobacco (whether or not threshed or similarly processed), tobacco refuse,not stemmed or stripped; 2401.20.33, not stemmed or threshed, partly or whollystemmed/stripped; 2401.30.33, tobacco stems not cut, ground, or pulverized; 2401.30.35,stems cut, ground, or pulverized; 2401.30.37, other, includes cut, ground, and pulverized;2403.10.60, manufactured tobacco and manufactured tobacco substitutes, reconstitutedtobacco, tobacco extracts and essences; 2403.91.45, homogenized and reconstitutedtobacco; and 2403.99.60, extracts and essences.
52The quota year begins on September 13 and continues until September 12 of thefollowing year.
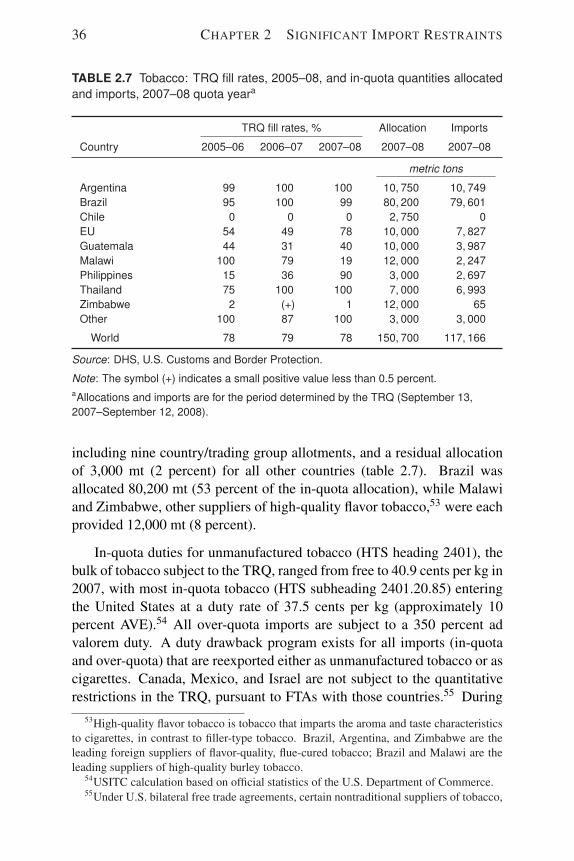
36 CHAPTER 2 SIGNIFICANT IMPORT RESTRAINTS
TABLE 2.7 Tobacco: TRQ fill rates, 2005–08, and in-quota quantities allocatedand imports, 2007–08 quota yeara
TRQ fill rates, % Allocation Imports
Country 2005–06 2006–07 2007–08 2007–08 2007–08
metric tons
Argentina 99 100 100 10, 750 10, 749Brazil 95 100 99 80, 200 79, 601Chile 0 0 0 2, 750 0EU 54 49 78 10, 000 7, 827Guatemala 44 31 40 10, 000 3, 987Malawi 100 79 19 12, 000 2, 247Philippines 15 36 90 3, 000 2, 697Thailand 75 100 100 7, 000 6, 993Zimbabwe 2 (+) 1 12, 000 65Other 100 87 100 3, 000 3, 000
World 78 79 78 150, 700 117, 166
Source: DHS, U.S. Customs and Border Protection.
Note: The symbol (+) indicates a small positive value less than 0.5 percent.aAllocations and imports are for the period determined by the TRQ (September 13,2007–September 12, 2008).
including nine country/trading group allotments, and a residual allocationof 3,000 mt (2 percent) for all other countries (table 2.7). Brazil wasallocated 80,200 mt (53 percent of the in-quota allocation), while Malawiand Zimbabwe, other suppliers of high-quality flavor tobacco,53 were eachprovided 12,000 mt (8 percent).
In-quota duties for unmanufactured tobacco (HTS heading 2401), thebulk of tobacco subject to the TRQ, ranged from free to 40.9 cents per kg in2007, with most in-quota tobacco (HTS subheading 2401.20.85) enteringthe United States at a duty rate of 37.5 cents per kg (approximately 10percent AVE).54 All over-quota imports are subject to a 350 percent advalorem duty. A duty drawback program exists for all imports (in-quotaand over-quota) that are reexported either as unmanufactured tobacco or ascigarettes. Canada, Mexico, and Israel are not subject to the quantitativerestrictions in the TRQ, pursuant to FTAs with those countries.55 During
53High-quality flavor tobacco is tobacco that imparts the aroma and taste characteristicsto cigarettes, in contrast to filler-type tobacco. Brazil, Argentina, and Zimbabwe are theleading foreign suppliers of flavor-quality, flue-cured tobacco; Brazil and Malawi are theleading suppliers of high-quality burley tobacco.
54USITC calculation based on official statistics of the U.S. Department of Commerce.55Under U.S. bilateral free trade agreements, certain nontraditional suppliers of tobacco,
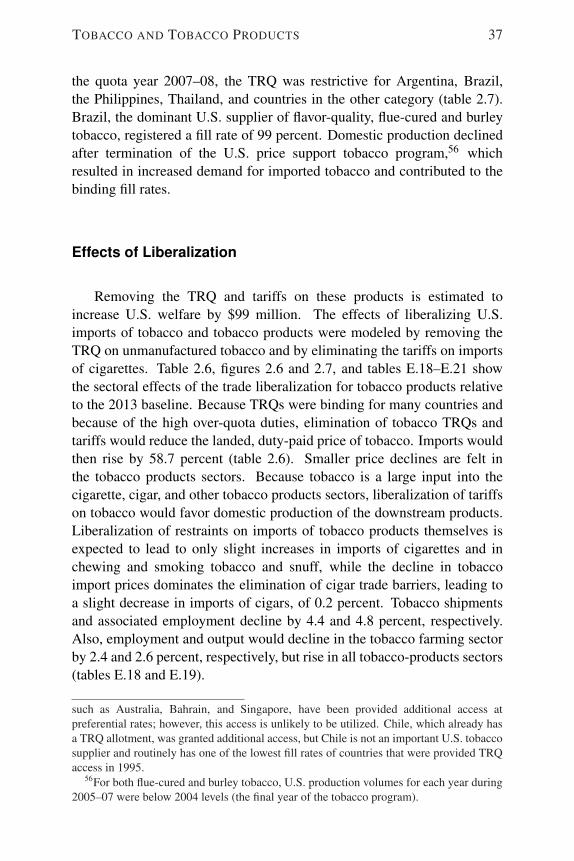
TOBACCO AND TOBACCO PRODUCTS 37
the quota year 2007–08, the TRQ was restrictive for Argentina, Brazil,the Philippines, Thailand, and countries in the other category (table 2.7).Brazil, the dominant U.S. supplier of flavor-quality, flue-cured and burleytobacco, registered a fill rate of 99 percent. Domestic production declinedafter termination of the U.S. price support tobacco program,56 whichresulted in increased demand for imported tobacco and contributed to thebinding fill rates.
Effects of Liberalization
Removing the TRQ and tariffs on these products is estimated toincrease U.S. welfare by $99 million. The effects of liberalizing U.S.imports of tobacco and tobacco products were modeled by removing theTRQ on unmanufactured tobacco and by eliminating the tariffs on importsof cigarettes. Table 2.6, figures 2.6 and 2.7, and tables E.18–E.21 showthe sectoral effects of the trade liberalization for tobacco products relativeto the 2013 baseline. Because TRQs were binding for many countries andbecause of the high over-quota duties, elimination of tobacco TRQs andtariffs would reduce the landed, duty-paid price of tobacco. Imports wouldthen rise by 58.7 percent (table 2.6). Smaller price declines are felt inthe tobacco products sectors. Because tobacco is a large input into thecigarette, cigar, and other tobacco products sectors, liberalization of tariffson tobacco would favor domestic production of the downstream products.Liberalization of restraints on imports of tobacco products themselves isexpected to lead to only slight increases in imports of cigarettes and inchewing and smoking tobacco and snuff, while the decline in tobaccoimport prices dominates the elimination of cigar trade barriers, leading toa slight decrease in imports of cigars, of 0.2 percent. Tobacco shipmentsand associated employment decline by 4.4 and 4.8 percent, respectively.Also, employment and output would decline in the tobacco farming sectorby 2.4 and 2.6 percent, respectively, but rise in all tobacco-products sectors(tables E.18 and E.19).
such as Australia, Bahrain, and Singapore, have been provided additional access atpreferential rates; however, this access is unlikely to be utilized. Chile, which already hasa TRQ allotment, was granted additional access, but Chile is not an important U.S. tobaccosupplier and routinely has one of the lowest fill rates of countries that were provided TRQaccess in 1995.
56For both flue-cured and burley tobacco, U.S. production volumes for each year during2005–07 were below 2004 levels (the final year of the tobacco program).
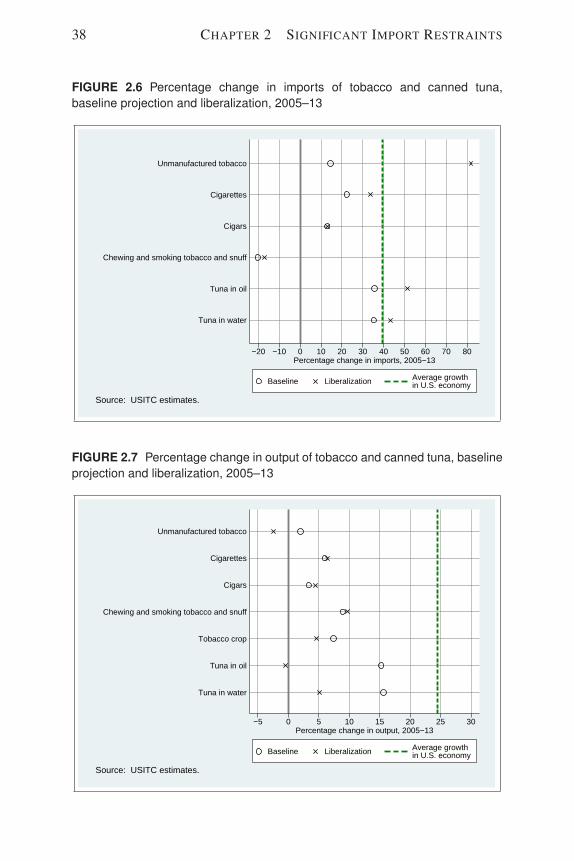
38 CHAPTER 2 SIGNIFICANT IMPORT RESTRAINTS
FIGURE 2.6 Percentage change in imports of tobacco and canned tuna,baseline projection and liberalization, 2005–13
−20 −10 0 10 20 30 40 50 60 70 80Percentage change in imports, 2005−13
Tuna in water
Tuna in oil
Chewing and smoking tobacco and snuff
Cigars
Cigarettes
Unmanufactured tobacco
Source: USITC estimates.
Baseline Liberalization Average growthin U.S. economy
FIGURE 2.7 Percentage change in output of tobacco and canned tuna, baselineprojection and liberalization, 2005–13
−5 0 5 10 15 20 25 30Percentage change in output, 2005−13
Tuna in water
Tuna in oil
Tobacco crop
Chewing and smoking tobacco and snuff
Cigars
Cigarettes
Unmanufactured tobacco
Source: USITC estimates.
Baseline Liberalization Average growthin U.S. economy
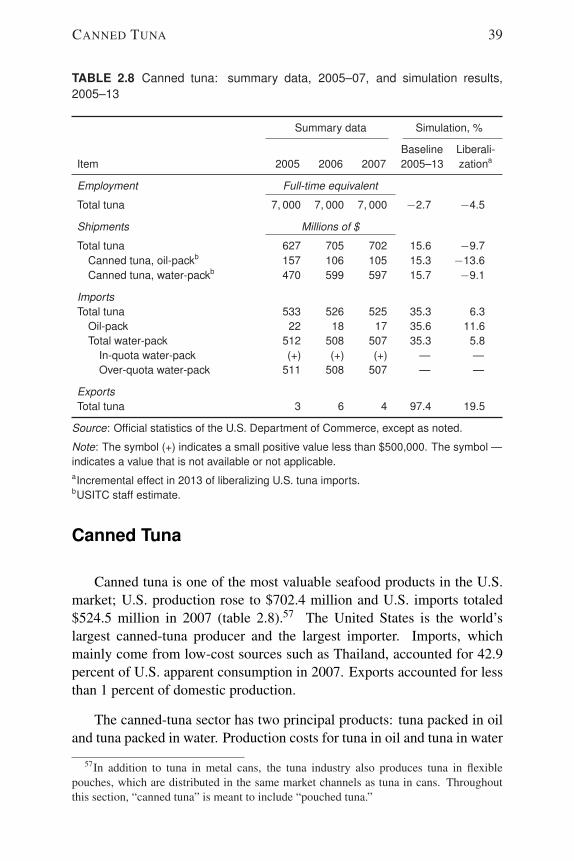
CANNED TUNA 39
TABLE 2.8 Canned tuna: summary data, 2005–07, and simulation results,2005–13
Summary data Simulation, %
Baseline Liberali-Item 2005 2006 2007 2005–13 zationa
Employment Full-time equivalent
Total tuna 7, 000 7, 000 7, 000 −2.7 −4.5
Shipments Millions of $
Total tuna 627 705 702 15.6 −9.7Canned tuna, oil-packb 157 106 105 15.3 −13.6Canned tuna, water-packb 470 599 597 15.7 −9.1
ImportsTotal tuna 533 526 525 35.3 6.3
Oil-pack 22 18 17 35.6 11.6Total water-pack 512 508 507 35.3 5.8
In-quota water-pack (+) (+) (+) — —Over-quota water-pack 511 508 507 — —
ExportsTotal tuna 3 6 4 97.4 19.5
Source: Official statistics of the U.S. Department of Commerce, except as noted.
Note: The symbol (+) indicates a small positive value less than $500,000. The symbol —indicates a value that is not available or not applicable.aIncremental effect in 2013 of liberalizing U.S. tuna imports.bUSITC staff estimate.
Canned Tuna
Canned tuna is one of the most valuable seafood products in the U.S.market; U.S. production rose to $702.4 million and U.S. imports totaled$524.5 million in 2007 (table 2.8).57 The United States is the world’slargest canned-tuna producer and the largest importer. Imports, whichmainly come from low-cost sources such as Thailand, accounted for 42.9percent of U.S. apparent consumption in 2007. Exports accounted for lessthan 1 percent of domestic production.
The canned-tuna sector has two principal products: tuna packed in oiland tuna packed in water. Production costs for tuna in oil and tuna in water
57In addition to tuna in metal cans, the tuna industry also produces tuna in flexiblepouches, which are distributed in the same market channels as tuna in cans. Throughoutthis section, “canned tuna” is meant to include “pouched tuna.”
40 CHAPTER 2 SIGNIFICANT IMPORT RESTRAINTS
are nearly identical; canneries can switch production from one product tothe other at little cost. The two products generally have identical wholesaleand retail prices (for any given brand and size of can or pouch). Just over 15percent of U.S. tuna production is packed in oil, and 85 percent is packed inwater. Approximately 97 percent of U.S. imports of canned tuna is packedin water.
Nature and Restrictiveness of Trade Restraints
The U.S. rate of duty on canned tuna packed in oil is 35 percent.58
A TRQ exists for U.S. imports of canned tuna packed “not in oil” (i.e.,in water). Imports within the quota are dutiable at 6 percent, whileimports in excess of the quota are dutiable at 12.5 percent.59 The in-quota quantity entered in any calendar year cannot exceed 4.8 percent ofapparent U.S. consumption (as reported annually by the U.S. Departmentof Commerce) of tuna in airtight containers during the immediatelypreceding year. The quota of 4.8 percent of the preceding year’s domesticapparent consumption is allocated on a global first-come, first-served basis.
The TRQ reportedly imposes significant costs on importers in the formof increased warehousing needs and uncertainty regarding the extent andtiming of reduced tariff-rate benefits. Because the TRQ is usually filledquickly and the tariff gap is 6.5 percent, importers attempt to qualify forthe largest share of the TRQ as possible by stockpiling large quantities ofcanned tuna in customs-bonded warehouses in late December and releasingthe warehoused product as soon as the calendar year begins.60
Effects of Liberalization
The tuna TRQs were not explicitly modeled because quota levels aresmall compared to the total volume of U.S. imports and consumption,implying that the over-quota tariff rate is not prohibitively high. Instead,liberalization of U.S. tuna imports was modeled by removing the advalorem tariff equivalents for both tuna packed in oil and tuna packed inwater. The average U.S. ad valorem tariff equivalents for tuna packed
58HTS subheading 1604.14.1059HTS subheading 1604.14.2260USITC, Tuna: Competitive Conditions Affecting the U.S. and European Industries in
Domestic and Foreign Markets, 1990.
TEXTILES AND APPAREL 41
in oil and tuna packed in water were 17.2 percent and 10.5 percent,respectively.61 Removing these tariff equivalents is estimated to increaseU.S. welfare by $23 million. The removal of border measures on tunapacked in oil and in water causes import prices to decline by 17 and 10percent, respectively, from the 2013 baseline (table E.12). As a result,import levels of tuna packed in oil and in water are estimated to increaseby 12 and 6 percent, respectively (table 2.8 and figures 2.6 and 2.7). Theestimated effects on related sectors are small, mostly in the canned fishsector (tables E.10–E.13).
Textiles and Apparel
The United States, the world’s largest importer of textiles and apparel,accounted for roughly 28.8 percent of global imports by value in 2007.62
U.S. imports of textiles and apparel remain subject to tariffs that areamong the highest of any sector, entering at rates that range from free ofduty to as high as 32 percent. Currently, however, there are no quotason U.S. imports of textiles and apparel after the quantitative restrictionsestablished under a Memorandum of Understanding (MOU) with Chinaexpired on December 31, 2008.63 Expiration of the U.S.-China MOU waspreceded by the final phase-out of developed-country quotas on January 1,2005, on which date the United States, the EU, and Canada eliminatedtheir remaining quotas on imports from WTO countries as required bythe Uruguay Round Agreement on Textiles and Clothing (ATC)64 and
61The USAGE-ITC model tracks U.S. imports of oil- and water-packed tuna from 27groups of countries, some of which are U.S. FTA partners or are given preferential tarifftreatment; thus, the tariffs removed in this simulation vary widely by region.
62GTIS, World Trade Atlas Database (accessed January 9, 2009).63The disruption and uncertainties associated with the U.S. safeguards (discussed below)
on certain textile and apparel products from China led to the negotiation of a three-yearagreement to limit U.S. imports of such items from China. The MOU established 21quotas covering 34 categories of textile and apparel products. It went into effect on January1, 2006 and was extended through December 31, 2008, at which time the right of theUnited States to invoke safeguards under the textile provision of China’s WTO MembershipAccession Agreement expired. Office of the USTR, “Memorandum of Understandingbetween the Governments of the United States of America and the People’s Republic ofChina,” November 8, 2005.
64The ATC entered into force with the WTO agreements in 1995. It called for the gradualelimination of quotas established under the Multifiber Arrangement, an arrangementnegotiated under the General Agreement on Tariffs and Trade (GATT) that had governedworld textile and apparel trade since 1974. The ATC required countries to increase the
42 CHAPTER 2 SIGNIFICANT IMPORT RESTRAINTS
subsequent U.S. safeguard measures on certain import categories fromChina.65
Following the liberalization of trade in textiles and apparel, U.S.imports of such goods rose 6.4 percent to $106.8 billion from 2005 to2007, while U.S. producers’ shipments declined 3.1 percent to $101.0billion during the same period (table 2.9). Apparel accounted for 77.2percent of the total value of U.S. imports of textiles and apparel in2007. As apparel imports increased, the U.S. import penetration ratio inapparel rose from 50 to 73 percent from 1999 to 2007.66 Retailers areincreasingly sourcing apparel and home furnishings directly from low-costforeign producers and are focusing their efforts on product design andmarketing. As a result, domestic sales of U.S.-produced yarn and fabrichave shrunk. With increasing import competition, the U.S. textile industryhas undergone extensive restructuring and consolidation. From 2005 to2007, employment in the U.S. textile and apparel industries declinedby 16.0 percent to 541,300 workers, a loss of 103,200 jobs.67 Currentdomestic production of textile and apparel articles is largely for U.S.government defense contracts under the Berry Amendment68 and nichefashion production concentrated in New York and Los Angeles.69
In the absence of quotas, global textile and apparel production hasbecome concentrated among a handful of lower-cost Asian suppliers.China, whose exports of textiles and apparel to the United States increased
rate at which all quotas grew and to integrate textile and apparel articles into the GATTregime over a 10-year transition period, which ended on January 1, 2005. At that juncture,the articles were brought under GATT discipline and became subject to the same rules asproducts of other sectors. See also the discussion of textiles and apparel in chap. 3.
65The rapid increase in U.S. imports of textiles and apparel from China after the ATCexpired led to the establishment of 10 safeguards (quotas) on selected imports of Chinesetextile and apparel articles. For a more detailed discussion of the U.S.-China MOU, seeUSITC, The Economic Effects of Significant U.S. Import Restraints: Fifth Update, 2007.
66CBO, “Factors Underlying the Decline in Manufacturing Employment since 2000,”December 28, 2008, 4.
67USDOL, BLS, CES Survey Database, undated (accessed various dates).68The Berry Amendment requires that the U.S. Department of Defense’s procurements
of clothing or textile articles, including the fibers, yarn, and fabric used to constructsuch articles, be produced in the United States (10 U.S.C. 2533a). The BerryAmendment applies to clothing and textile articles including outerwear, headwear,underwear, nightwear, footwear, hosiery, handwear, belts, badges, and insignia. For furtherinformation on the Berry Amendment, see U.S. Department of Defense, Office of the UnderSecretary of Defense for Acquisition Technology and Logistics, Defense Procurement andAcquisition Policy, at http://www.acq.osd.mil/dpap/cpic/ic/berry amendment faq.html
69USITC, Hearing transcript, January 8, 2009 (testimony of Brenda Jacobs, USA-ITA), 45.
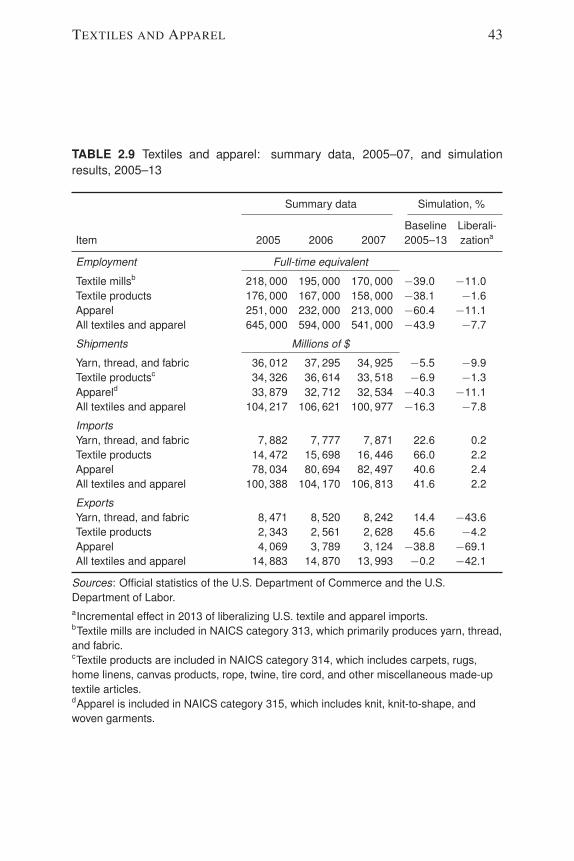
TEXTILES AND APPAREL 43
TABLE 2.9 Textiles and apparel: summary data, 2005–07, and simulationresults, 2005–13
Summary data Simulation, %
Baseline Liberali-Item 2005 2006 2007 2005–13 zationa
Employment Full-time equivalent
Textile millsb 218, 000 195, 000 170, 000 −39.0 −11.0Textile products 176, 000 167, 000 158, 000 −38.1 −1.6Apparel 251, 000 232, 000 213, 000 −60.4 −11.1All textiles and apparel 645, 000 594, 000 541, 000 −43.9 −7.7
Shipments Millions of $
Yarn, thread, and fabric 36, 012 37, 295 34, 925 −5.5 −9.9Textile productsc 34, 326 36, 614 33, 518 −6.9 −1.3Appareld 33, 879 32, 712 32, 534 −40.3 −11.1All textiles and apparel 104, 217 106, 621 100, 977 −16.3 −7.8
ImportsYarn, thread, and fabric 7, 882 7, 777 7, 871 22.6 0.2Textile products 14, 472 15, 698 16, 446 66.0 2.2Apparel 78, 034 80, 694 82, 497 40.6 2.4All textiles and apparel 100, 388 104, 170 106, 813 41.6 2.2
ExportsYarn, thread, and fabric 8, 471 8, 520 8, 242 14.4 −43.6Textile products 2, 343 2, 561 2, 628 45.6 −4.2Apparel 4, 069 3, 789 3, 124 −38.8 −69.1All textiles and apparel 14, 883 14, 870 13, 993 −0.2 −42.1
Sources: Official statistics of the U.S. Department of Commerce and the U.S.Department of Labor.aIncremental effect in 2013 of liberalizing U.S. textile and apparel imports.bTextile mills are included in NAICS category 313, which primarily produces yarn, thread,and fabric.cTextile products are included in NAICS category 314, which includes carpets, rugs,home linens, canvas products, rope, twine, tire cord, and other miscellaneous made-uptextile articles.dApparel is included in NAICS category 315, which includes knit, knit-to-shape, andwoven garments.
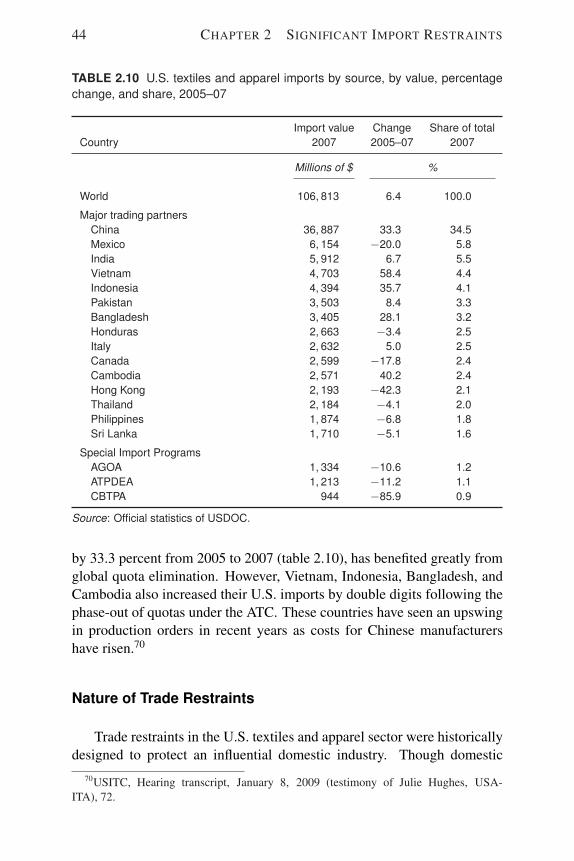
44 CHAPTER 2 SIGNIFICANT IMPORT RESTRAINTS
TABLE 2.10 U.S. textiles and apparel imports by source, by value, percentagechange, and share, 2005–07
Import value Change Share of totalCountry 2007 2005–07 2007
Millions of $ %
World 106, 813 6.4 100.0
Major trading partnersChina 36, 887 33.3 34.5Mexico 6, 154 −20.0 5.8India 5, 912 6.7 5.5Vietnam 4, 703 58.4 4.4Indonesia 4, 394 35.7 4.1Pakistan 3, 503 8.4 3.3Bangladesh 3, 405 28.1 3.2Honduras 2, 663 −3.4 2.5Italy 2, 632 5.0 2.5Canada 2, 599 −17.8 2.4Cambodia 2, 571 40.2 2.4Hong Kong 2, 193 −42.3 2.1Thailand 2, 184 −4.1 2.0Philippines 1, 874 −6.8 1.8Sri Lanka 1, 710 −5.1 1.6
Special Import ProgramsAGOA 1, 334 −10.6 1.2ATPDEA 1, 213 −11.2 1.1CBTPA 944 −85.9 0.9
Source: Official statistics of USDOC.
by 33.3 percent from 2005 to 2007 (table 2.10), has benefited greatly fromglobal quota elimination. However, Vietnam, Indonesia, Bangladesh, andCambodia also increased their U.S. imports by double digits following thephase-out of quotas under the ATC. These countries have seen an upswingin production orders in recent years as costs for Chinese manufacturershave risen.70
Nature of Trade Restraints
Trade restraints in the U.S. textiles and apparel sector were historicallydesigned to protect an influential domestic industry. Though domestic
70USITC, Hearing transcript, January 8, 2009 (testimony of Julie Hughes, USA-ITA), 72.
TEXTILES AND APPAREL 45
production has declined markedly over the past decade, tariffs remain high,especially for man-made fiber garments. With the final phase-out of quotasunder the ATC at the end of 2004, global trade in textiles and apparel isbeing integrated into the broader WTO framework for manufactured goods.
Tariffs
The trade-weighted average ad valorem tariff on all U.S. imports oftextiles and apparel in 2007 was 10.5 percent. In general, tariffs on textilesand apparel increase with each stage of manufacturing; that is, the dutyrates are usually higher on apparel than on yarn or fabric.71 The trade-weighted average tariff on apparel was 11.4 percent, compared with 6.7percent for textile mill articles (mainly yarns and fabrics) and 6.3 percentfor textile products.72 Tariffs for many heavily traded apparel articles weremuch higher than the overall averages cited above. For example, the 2007NTR duty rates on certain women’s and girls’ woven man-made fiber pantsand blouses were 28.6 percent and 26.9 percent, respectively.73 Tariffsare generally higher on man-made fiber apparel than on similar cotton orwool garments (e.g., the 2007 duty rate on man-made fiber sweaters was32 percent, compared with 16 percent for wool sweaters and 16.5 percentfor cotton sweaters). Further, some apparel is subject to compound tariffsat a specific rate per kilogram (kg) plus an ad valorem duty as high as 25.9percent (e.g., the 2007 duty on men’s and boys’ wool suits was 52.9 centsper kg plus a 21 percent ad valorem tariff).
Preference Programs and Rules of Origin
Certain U.S. imports of textiles and apparel are eligible for duty-freetreatment under FTAs and trade preference programs. The value of U.S.textile and apparel imports that entered duty-free in 2007 was $24.3 billion,or 22.8 percent of total imports of such goods. More than half of the value
71This is often referred to as tariff escalation.72These average tariffs were calculated using NAICS nomenclature. Under NAICS,
textile mill articles include intermediate inputs (e.g., yarn and fabric), and textile productsconsist of made-up textile articles, including towels, bedding, and other house furnishings.See table 2.9 for additional information on the NAICS categories related to textiles andapparel.
73Nearly all U.S. trading partners have permanent normal-trade-relations (NTR) status,formerly known as most-favored- nation status.
46 CHAPTER 2 SIGNIFICANT IMPORT RESTRAINTS
of duty-free imports was accounted for by goods originating from CAFTA-DR countries (22.0 percent of the total) and NAFTA partners (30.1 percentof the total).74 Remaining duty-free imports consisted mainly of goodsthat entered under the Andean Trade Promotion and Drug Eradication Act(ATPDEA) (5.0 percent) and the African Growth and Opportunity Act(AGOA) (5.5 percent).75
In general, for apparel to qualify for duty-free entry under ROOrequirements in U.S. FTAs or preference programs, it must be madefrom U.S. or regional fabric, with the specific percentages and otherrequirements varying by program. ROOs redirect trade flows by creatingdemand for U.S. exports of textile articles for use in the production ofapparel, which is then re-exported to the United States free of duty.According to the USA-ITA, duty cost savings associated with sourcingfrom FTA or preference partner countries are often offset by highercompliance costs for importers. Reportedly, ROOs for apparel are morecomplicated than for other industries, and firms incur additional costs forhiring staff to ensure compliance and to complete the necessary paperworkto demonstrate compliance.76
74CAFTA-DR was implemented on a country-by-country basis. It went into force for ElSalvador on March 1, 2006, for Honduras and Nicaragua on April 1, 2006, for Guatemalaon July 1, 2006, for the Dominican Republic on March 1, 2007, and for Costa Ricaon January 1, 2009. On August 15, 2008, the United States implemented two textileprovisions designed to promote regional production: (1) the textile cumulation provision,which allows a limited quantity of woven apparel containing Mexican or Canadian inputsto enter the United States duty-free; and (2) the pocketing amendment, which requires thatfor apparel items containing at least one pocket, the pocket bag fabric must be formed andfinished in the territory of one or more CAFTA-DR parties before the apparel can qualifyas an originating good and receive duty-free treatment under CAFTA-DR.
75The Africa Investment Incentive Act of 2006 (AGOA IV) extended preferentialtreatment for qualifying textiles and apparel from eligible sub-Saharan African (SSA)countries through September 30, 2015. It provides for duty-free and quota-free treatmentfor apparel assembled in SSA countries from U.S. fabrics, as well as duty-free and quota-free treatment for specified quantities of apparel made from “regional fabrics” that areproduced in SSA countries from U.S. or SSA yarns. A special rule also allows for certainquantities of apparel made in “lesser developed” SSA countries from third-country fabricsto receive duty-free treatment through September 30, 2012.
76USITC, Hearing transcript, January 8, 2009 (testimony of Brenda Jacobs, USA-ITA),56.
TEXTILES AND APPAREL 47
Effects of Liberalization
Projected Industry Trends
The baseline simulation estimates an increase of 23.2 percent in thehousehold demand for textiles and apparel between 2005 and 2013. Thisprojection, which incorporates all negotiated trade policy changes, is lowerthan the estimated 25 percent increase in household consumption of allgoods. Despite the demand increase, domestic production of textiles andapparel output is expected to decline sharply (table 2.9 and table E.23).Many sectors would shrink outright, and no sector would increase outputby more than the projected GDP increase of 25 percent. The projectedemployment decline of 43.9 percent is greater than the output declinebecause the trend toward more capital-intensive production is expectedto continue. Exports in the baseline simulation are projected to increasein most sectors owing to the anticipated 9.5 percent depreciation of thedollar. U.S. exports of nonwoven fabrics, curtains and draperies, canvasand related products, and pleating and stitching have the largest increasesin the baseline simulation to 2013 (table E.25). Imports in the textile andapparel sectors are generally projected to increase.
Deviations from Projected Trends
Compared to projected trends in the overall economy, liberalizationof textiles and apparel is estimated to have a relatively minor effect onproduction, imports, and exports, although the effect is the largest of anysector in this report. The removal of restraints would increase overall U.S.welfare in 2013 by 0.01 percent, or $2.2 billion, relative to the baselinevalue. In detail, efficiency gains from removing tariffs improve welfare by$2,627 million, but the contraction in demand for U.S. exports by countrieswith trade preference programs reduces this by $373 million. The overallincrease in welfare is modestly higher than estimated in the last update ofthis report.77 About $100 million of this increase is attributed to the smallereffects of liberalization due to continued preference erosion in the current
77In the previous update, the estimated increase in welfare from tariff liberalization,removal of quotas on Vietnam, and the erosion of ROO-driven demand was $1.9 billion.USITC, The Economic Effects of Significant U.S. Import Restraints: Fifth Update, 2007,78.
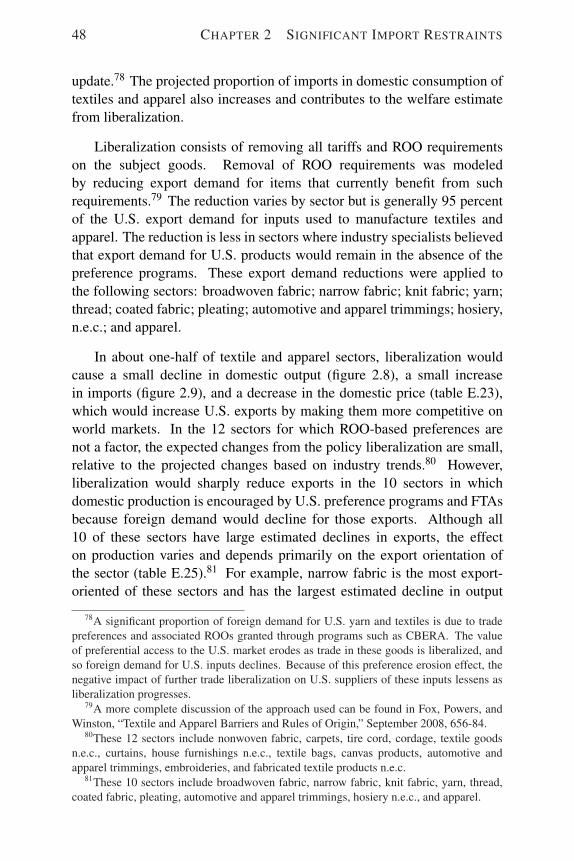
48 CHAPTER 2 SIGNIFICANT IMPORT RESTRAINTS
update.78 The projected proportion of imports in domestic consumption oftextiles and apparel also increases and contributes to the welfare estimatefrom liberalization.
Liberalization consists of removing all tariffs and ROO requirementson the subject goods. Removal of ROO requirements was modeledby reducing export demand for items that currently benefit from suchrequirements.79 The reduction varies by sector but is generally 95 percentof the U.S. export demand for inputs used to manufacture textiles andapparel. The reduction is less in sectors where industry specialists believedthat export demand for U.S. products would remain in the absence of thepreference programs. These export demand reductions were applied tothe following sectors: broadwoven fabric; narrow fabric; knit fabric; yarn;thread; coated fabric; pleating; automotive and apparel trimmings; hosiery,n.e.c.; and apparel.
In about one-half of textile and apparel sectors, liberalization wouldcause a small decline in domestic output (figure 2.8), a small increasein imports (figure 2.9), and a decrease in the domestic price (table E.23),which would increase U.S. exports by making them more competitive onworld markets. In the 12 sectors for which ROO-based preferences arenot a factor, the expected changes from the policy liberalization are small,relative to the projected changes based on industry trends.80 However,liberalization would sharply reduce exports in the 10 sectors in whichdomestic production is encouraged by U.S. preference programs and FTAsbecause foreign demand would decline for those exports. Although all10 of these sectors have large estimated declines in exports, the effecton production varies and depends primarily on the export orientation ofthe sector (table E.25).81 For example, narrow fabric is the most export-oriented of these sectors and has the largest estimated decline in output
78A significant proportion of foreign demand for U.S. yarn and textiles is due to tradepreferences and associated ROOs granted through programs such as CBERA. The valueof preferential access to the U.S. market erodes as trade in these goods is liberalized, andso foreign demand for U.S. inputs declines. Because of this preference erosion effect, thenegative impact of further trade liberalization on U.S. suppliers of these inputs lessens asliberalization progresses.
79A more complete discussion of the approach used can be found in Fox, Powers, andWinston, “Textile and Apparel Barriers and Rules of Origin,” September 2008, 656-84.
80These 12 sectors include nonwoven fabric, carpets, tire cord, cordage, textile goodsn.e.c., curtains, house furnishings n.e.c., textile bags, canvas products, automotive andapparel trimmings, embroideries, and fabricated textile products n.e.c.
81These 10 sectors include broadwoven fabric, narrow fabric, knit fabric, yarn, thread,coated fabric, pleating, automotive and apparel trimmings, hosiery n.e.c., and apparel.
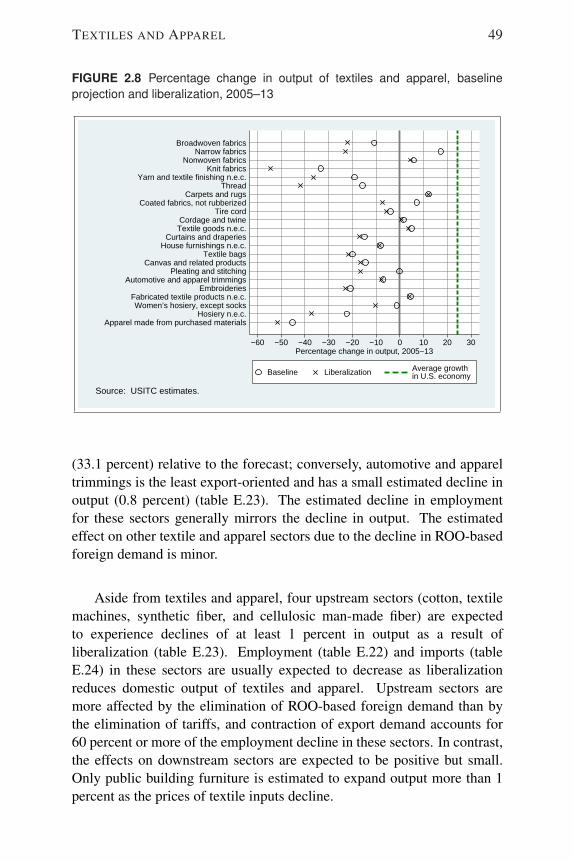
TEXTILES AND APPAREL 49
FIGURE 2.8 Percentage change in output of textiles and apparel, baselineprojection and liberalization, 2005–13
−60 −50 −40 −30 −20 −10 0 10 20 30Percentage change in output, 2005−13
Apparel made from purchased materialsHosiery n.e.c.
Women’s hosiery, except socksFabricated textile products n.e.c.
EmbroideriesAutomotive and apparel trimmings
Pleating and stitchingCanvas and related products
Textile bagsHouse furnishings n.e.c.
Curtains and draperiesTextile goods n.e.c.Cordage and twine
Tire cordCoated fabrics, not rubberized
Carpets and rugsThread
Yarn and textile finishing n.e.c.Knit fabrics
Nonwoven fabricsNarrow fabrics
Broadwoven fabrics
Source: USITC estimates.
Baseline Liberalization Average growthin U.S. economy
(33.1 percent) relative to the forecast; conversely, automotive and appareltrimmings is the least export-oriented and has a small estimated decline inoutput (0.8 percent) (table E.23). The estimated decline in employmentfor these sectors generally mirrors the decline in output. The estimatedeffect on other textile and apparel sectors due to the decline in ROO-basedforeign demand is minor.
Aside from textiles and apparel, four upstream sectors (cotton, textilemachines, synthetic fiber, and cellulosic man-made fiber) are expectedto experience declines of at least 1 percent in output as a result ofliberalization (table E.23). Employment (table E.22) and imports (tableE.24) in these sectors are usually expected to decrease as liberalizationreduces domestic output of textiles and apparel. Upstream sectors aremore affected by the elimination of ROO-based foreign demand than bythe elimination of tariffs, and contraction of export demand accounts for60 percent or more of the employment decline in these sectors. In contrast,the effects on downstream sectors are expected to be positive but small.Only public building furniture is estimated to expand output more than 1percent as the prices of textile inputs decline.
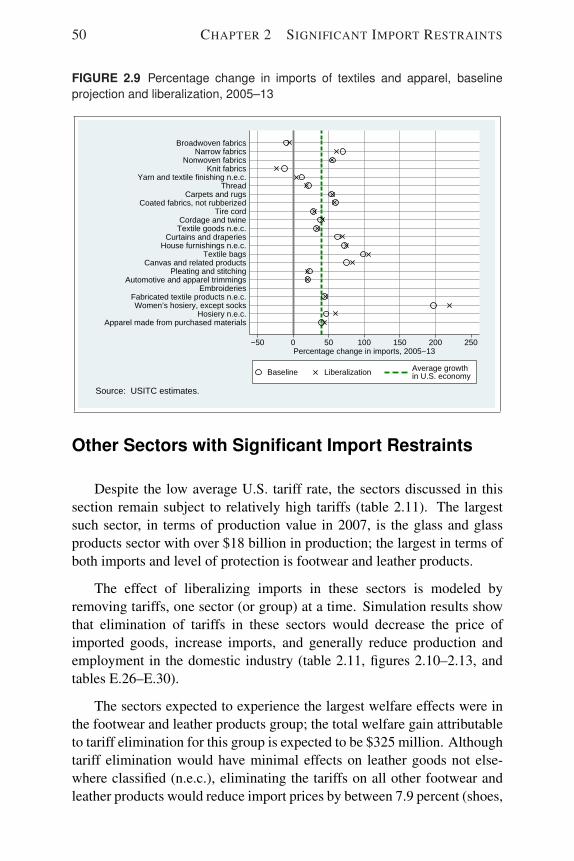
50 CHAPTER 2 SIGNIFICANT IMPORT RESTRAINTS
FIGURE 2.9 Percentage change in imports of textiles and apparel, baselineprojection and liberalization, 2005–13
−50 0 50 100 150 200 250Percentage change in imports, 2005−13
Apparel made from purchased materialsHosiery n.e.c.
Women’s hosiery, except socksFabricated textile products n.e.c.
EmbroideriesAutomotive and apparel trimmings
Pleating and stitchingCanvas and related products
Textile bagsHouse furnishings n.e.c.
Curtains and draperiesTextile goods n.e.c.Cordage and twine
Tire cordCoated fabrics, not rubberized
Carpets and rugsThread
Yarn and textile finishing n.e.c.Knit fabrics
Nonwoven fabricsNarrow fabrics
Broadwoven fabrics
Source: USITC estimates.
Baseline Liberalization Average growthin U.S. economy
Other Sectors with Significant Import Restraints
Despite the low average U.S. tariff rate, the sectors discussed in thissection remain subject to relatively high tariffs (table 2.11). The largestsuch sector, in terms of production value in 2007, is the glass and glassproducts sector with over $18 billion in production; the largest in terms ofboth imports and level of protection is footwear and leather products.
The effect of liberalizing imports in these sectors is modeled byremoving tariffs, one sector (or group) at a time. Simulation results showthat elimination of tariffs in these sectors would decrease the price ofimported goods, increase imports, and generally reduce production andemployment in the domestic industry (table 2.11, figures 2.10–2.13, andtables E.26–E.30).
The sectors expected to experience the largest welfare effects were inthe footwear and leather products group; the total welfare gain attributableto tariff elimination for this group is expected to be $325 million. Althoughtariff elimination would have minimal effects on leather goods not else-where classified (n.e.c.), eliminating the tariffs on all other footwear andleather products would reduce import prices by between 7.9 percent (shoes,
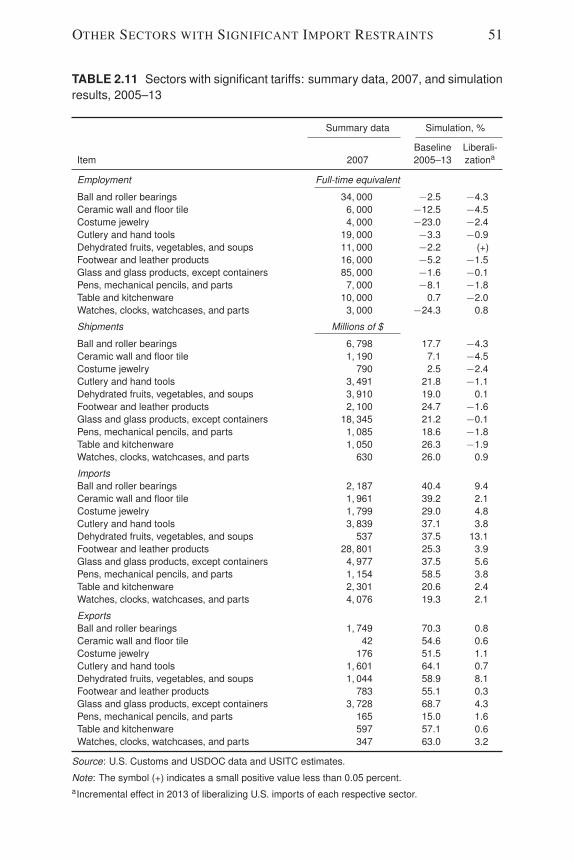
OTHER SECTORS WITH SIGNIFICANT IMPORT RESTRAINTS 51
TABLE 2.11 Sectors with significant tariffs: summary data, 2007, and simulationresults, 2005–13
Summary data Simulation, %
Baseline Liberali-Item 2007 2005–13 zationa
Employment Full-time equivalent
Ball and roller bearings 34, 000 −2.5 −4.3Ceramic wall and floor tile 6, 000 −12.5 −4.5Costume jewelry 4, 000 −23.0 −2.4Cutlery and hand tools 19, 000 −3.3 −0.9Dehydrated fruits, vegetables, and soups 11, 000 −2.2 (+)Footwear and leather products 16, 000 −5.2 −1.5Glass and glass products, except containers 85, 000 −1.6 −0.1Pens, mechanical pencils, and parts 7, 000 −8.1 −1.8Table and kitchenware 10, 000 0.7 −2.0Watches, clocks, watchcases, and parts 3, 000 −24.3 0.8
Shipments Millions of $
Ball and roller bearings 6, 798 17.7 −4.3Ceramic wall and floor tile 1, 190 7.1 −4.5Costume jewelry 790 2.5 −2.4Cutlery and hand tools 3, 491 21.8 −1.1Dehydrated fruits, vegetables, and soups 3, 910 19.0 0.1Footwear and leather products 2, 100 24.7 −1.6Glass and glass products, except containers 18, 345 21.2 −0.1Pens, mechanical pencils, and parts 1, 085 18.6 −1.8Table and kitchenware 1, 050 26.3 −1.9Watches, clocks, watchcases, and parts 630 26.0 0.9
ImportsBall and roller bearings 2, 187 40.4 9.4Ceramic wall and floor tile 1, 961 39.2 2.1Costume jewelry 1, 799 29.0 4.8Cutlery and hand tools 3, 839 37.1 3.8Dehydrated fruits, vegetables, and soups 537 37.5 13.1Footwear and leather products 28, 801 25.3 3.9Glass and glass products, except containers 4, 977 37.5 5.6Pens, mechanical pencils, and parts 1, 154 58.5 3.8Table and kitchenware 2, 301 20.6 2.4Watches, clocks, watchcases, and parts 4, 076 19.3 2.1
ExportsBall and roller bearings 1, 749 70.3 0.8Ceramic wall and floor tile 42 54.6 0.6Costume jewelry 176 51.5 1.1Cutlery and hand tools 1, 601 64.1 0.7Dehydrated fruits, vegetables, and soups 1, 044 58.9 8.1Footwear and leather products 783 55.1 0.3Glass and glass products, except containers 3, 728 68.7 4.3Pens, mechanical pencils, and parts 165 15.0 1.6Table and kitchenware 597 57.1 0.6Watches, clocks, watchcases, and parts 347 63.0 3.2
Source: U.S. Customs and USDOC data and USITC estimates.
Note: The symbol (+) indicates a small positive value less than 0.05 percent.aIncremental effect in 2013 of liberalizing U.S. imports of each respective sector.
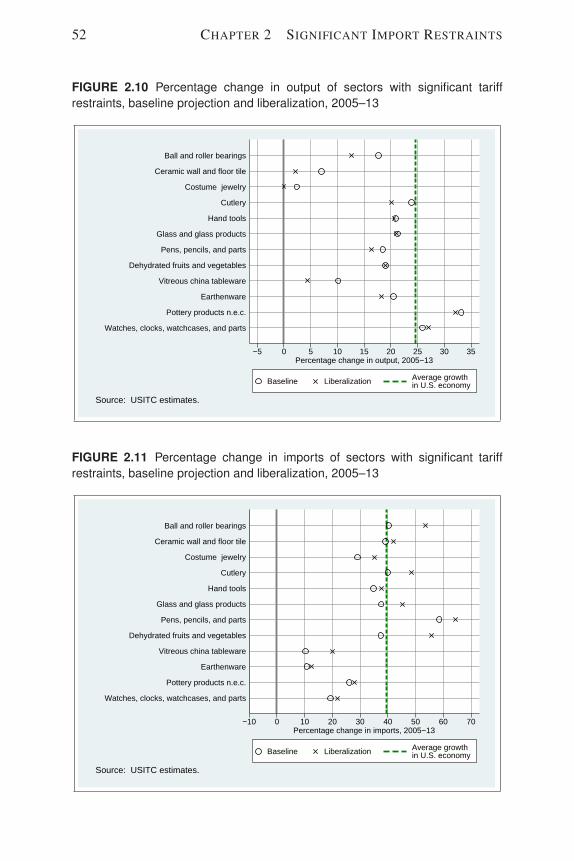
52 CHAPTER 2 SIGNIFICANT IMPORT RESTRAINTS
FIGURE 2.10 Percentage change in output of sectors with significant tariffrestraints, baseline projection and liberalization, 2005–13
−5 0 5 10 15 20 25 30 35Percentage change in output, 2005−13
Watches, clocks, watchcases, and parts
Pottery products n.e.c.
Earthenware
Vitreous china tableware
Dehydrated fruits and vegetables
Pens, pencils, and parts
Glass and glass products
Hand tools
Cutlery
Costume jewelry
Ceramic wall and floor tile
Ball and roller bearings
Source: USITC estimates.
Baseline Liberalization Average growthin U.S. economy
FIGURE 2.11 Percentage change in imports of sectors with significant tariffrestraints, baseline projection and liberalization, 2005–13
−10 0 10 20 30 40 50 60 70Percentage change in imports, 2005−13
Watches, clocks, watchcases, and parts
Pottery products n.e.c.
Earthenware
Vitreous china tableware
Dehydrated fruits and vegetables
Pens, pencils, and parts
Glass and glass products
Hand tools
Cutlery
Costume jewelry
Ceramic wall and floor tile
Ball and roller bearings
Source: USITC estimates.
Baseline Liberalization Average growthin U.S. economy
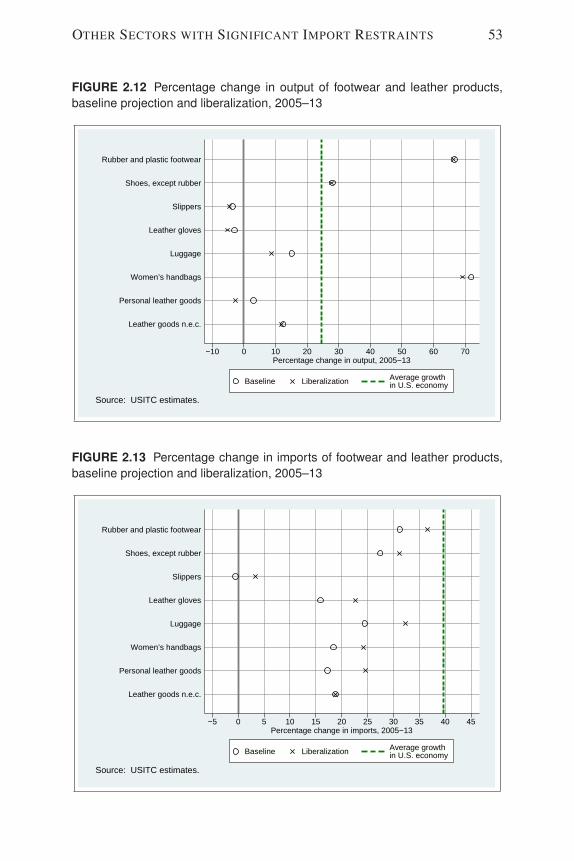
OTHER SECTORS WITH SIGNIFICANT IMPORT RESTRAINTS 53
FIGURE 2.12 Percentage change in output of footwear and leather products,baseline projection and liberalization, 2005–13
−10 0 10 20 30 40 50 60 70Percentage change in output, 2005−13
Leather goods n.e.c.
Personal leather goods
Women’s handbags
Luggage
Leather gloves
Slippers
Shoes, except rubber
Rubber and plastic footwear
Source: USITC estimates.
Baseline Liberalization Average growthin U.S. economy
FIGURE 2.13 Percentage change in imports of footwear and leather products,baseline projection and liberalization, 2005–13
−5 0 5 10 15 20 25 30 35 40 45Percentage change in imports, 2005−13
Leather goods n.e.c.
Personal leather goods
Women’s handbags
Luggage
Leather gloves
Slippers
Shoes, except rubber
Rubber and plastic footwear
Source: USITC estimates.
Baseline Liberalization Average growthin U.S. economy
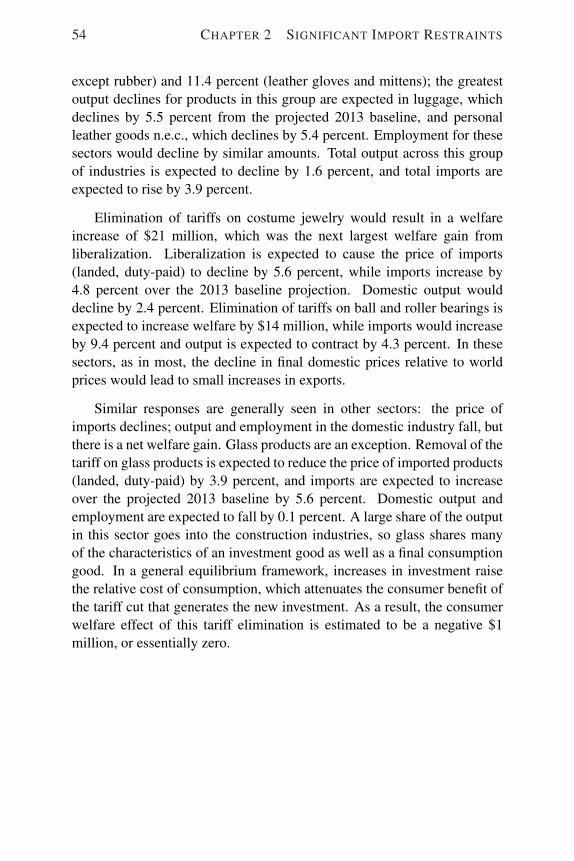
54 CHAPTER 2 SIGNIFICANT IMPORT RESTRAINTS
except rubber) and 11.4 percent (leather gloves and mittens); the greatestoutput declines for products in this group are expected in luggage, whichdeclines by 5.5 percent from the projected 2013 baseline, and personalleather goods n.e.c., which declines by 5.4 percent. Employment for thesesectors would decline by similar amounts. Total output across this groupof industries is expected to decline by 1.6 percent, and total imports areexpected to rise by 3.9 percent.
Elimination of tariffs on costume jewelry would result in a welfareincrease of $21 million, which was the next largest welfare gain fromliberalization. Liberalization is expected to cause the price of imports(landed, duty-paid) to decline by 5.6 percent, while imports increase by4.8 percent over the 2013 baseline projection. Domestic output woulddecline by 2.4 percent. Elimination of tariffs on ball and roller bearings isexpected to increase welfare by $14 million, while imports would increaseby 9.4 percent and output is expected to contract by 4.3 percent. In thesesectors, as in most, the decline in final domestic prices relative to worldprices would lead to small increases in exports.
Similar responses are generally seen in other sectors: the price ofimports declines; output and employment in the domestic industry fall, butthere is a net welfare gain. Glass products are an exception. Removal of thetariff on glass products is expected to reduce the price of imported products(landed, duty-paid) by 3.9 percent, and imports are expected to increaseover the projected 2013 baseline by 5.6 percent. Domestic output andemployment are expected to fall by 0.1 percent. A large share of the outputin this sector goes into the construction industries, so glass shares manyof the characteristics of an investment good as well as a final consumptiongood. In a general equilibrium framework, increases in investment raisethe relative cost of consumption, which attenuates the consumer benefit ofthe tariff cut that generates the new investment. As a result, the consumerwelfare effect of this tariff elimination is estimated to be a negative $1million, or essentially zero.
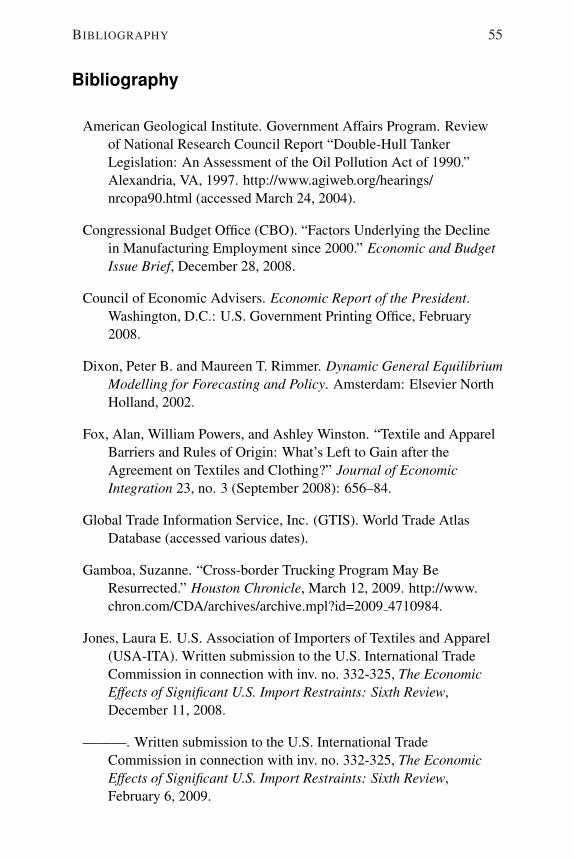
BIBLIOGRAPHY 55
Bibliography
American Geological Institute. Government Affairs Program. Reviewof National Research Council Report “Double-Hull TankerLegislation: An Assessment of the Oil Pollution Act of 1990.”Alexandria, VA, 1997. http://www.agiweb.org/hearings/nrcopa90.html (accessed March 24, 2004).
Congressional Budget Office (CBO). “Factors Underlying the Declinein Manufacturing Employment since 2000.” Economic and BudgetIssue Brief, December 28, 2008.
Council of Economic Advisers. Economic Report of the President.Washington, D.C.: U.S. Government Printing Office, February2008.
Dixon, Peter B. and Maureen T. Rimmer. Dynamic General EquilibriumModelling for Forecasting and Policy. Amsterdam: Elsevier NorthHolland, 2002.
Fox, Alan, William Powers, and Ashley Winston. “Textile and ApparelBarriers and Rules of Origin: What’s Left to Gain after theAgreement on Textiles and Clothing?” Journal of EconomicIntegration 23, no. 3 (September 2008): 656–84.
Global Trade Information Service, Inc. (GTIS). World Trade AtlasDatabase (accessed various dates).
Gamboa, Suzanne. “Cross-border Trucking Program May BeResurrected.” Houston Chronicle, March 12, 2009. http://www.chron.com/CDA/archives/archive.mpl?id=2009 4710984.
Jones, Laura E. U.S. Association of Importers of Textiles and Apparel(USA-ITA). Written submission to the U.S. International TradeCommission in connection with inv. no. 332-325, The EconomicEffects of Significant U.S. Import Restraints: Sixth Review,December 11, 2008.
———. Written submission to the U.S. International TradeCommission in connection with inv. no. 332-325, The EconomicEffects of Significant U.S. Import Restraints: Sixth Review,February 6, 2009.
56 CHAPTER 2 SIGNIFICANT IMPORT RESTRAINTS
Alan Levitt Corporate Communications. “SMP: World Prices vs. U.S.Prices,” undated. http://www.levcom.com/LinkClick.aspx?fileticket=3OGPnGLApDU%3D&tabid=56&mid=396 (accessedFebruary 17, 2009).
Office of the United States Trade Representative (USTR).“Memorandum of Understanding between the Governments of theUnited States of America and the People’s Republic of ChinaConcerning Trade in Textile and Apparel Products,” November 8,2005. http://www.state.gov/documents/organization/94919.pdf(accessed August 11, 2009).
Renewable Fuels Association. “Historic U.S. Fuel Ethanol Production,”undated. http://www.ethanolrfa.org/industry/statistics/#A (accessedApril 9, 2009).
U.S. Department of Agriculture (USDA). Economic Research Service(ERS). Sugar and Sweetener Yearbook Tables, undated.http://www.ers.usda.gov/Briefing/Sugar/data.htm (accessed March26, 2009).
———. Foreign Agricultural Service (FAS). “Dairy Export IncentiveProgram,” undated.http://www.fas.usda.gov/excredits/deip/deip-new.asp (accessedFebruary 10, 2009).
———. FAS. Production Supply and Distribution Online.http://www.fas.usda.gov/psdonline/psdQuery.aspx, accessed March26, 2009.
———. FAS. “Sugar under Tariff Rate Quotas,” undated.http://www.fas.usda.gov/itp/imports/Sugar/sugartrq.asp (accessedApril 2, 2009).
U.S. Department of Commerce (USDOC). Bureau of EconomicAnalysis (BEA). Industry Economic Accounts. Interactive tables.http://www.bea.gov/industry/index.htm (accessed various dates).
———. BEA. U.S. International Services: Cross-Border Trade1986–2007, and Services Supplied Through Affiliates, 1986–2006.“Table 1: Summary Data for Trade in Private Services by Type,”October 2008.

BIBLIOGRAPHY 57
———. U.S. Census Bureau. Official U.S. Trade Statistics. http://www.census.gov/foreign-trade/download/dvd/index.html#merch(accessed monthly).
U.S. Department of Labor (USDOL). Bureau of Labor Statistics (BLS).“Labor Force Statistics from the Current Population Survey,”undated. http://data.bls.gov/PDQ/servlet/SurveyOutputServlet?data tool=latest numbers&series id=LNS14000000 (accessed May5, 2009).
———. Current Employment Statistics (CES) Survey (National)Database. http://data.bls.gov/PDQ/outside.jsp?survey=ce (accessedvarious dates).
U.S. Department of Transportation (USDOT). Maritime Administration(MARAD). “Domestic Shipping,” undated.http://www.marad.dot.gov/ships shipping landing page/domestic shipping/Domestic Shipping.htm (accessed January 13,2009).
U.S. International Trade Commission (USITC). “U.S. Tobacco QuotaBuyout: Issues and Analysis.” Industry Trade and TechnologyReview, USITC Publication 3747. Washington, D.C.: USITC, 2004.
———. The Economic Effects of Significant U.S. Import Restraints:Fifth Update 2007, USITC Publication 3906. Washington DC:USITC, 2007.
———. The Economic Effects of Significant U.S. Import Restraints:Fourth Update 2004, USITC Publication 3701. Washington DC:USITC, 2004.
———. The Economic Effects of Significant U.S. Import Restraints:Third Update 2002, USITC Publication 3519. Washington DC:USITC, 2002.
———. The Economic Effects of Significant U.S. Import Restraints:Second Update 1999, USITC Publication 3201. Washington DC:USITC, 1999.
———. Tuna: Competitive Conditions Affecting the U.S. and EuropeanIndustries in Domestic and Foreign Markets. USITC Publication2339. Washington DC: USITC, 1990.
58 CHAPTER 2 SIGNIFICANT IMPORT RESTRAINTS
———. Hearing transcript in connection with inv. no. 332-325, TheEconomic Effects of Significant U.S. Import Restraints: SixthReview, January 8, 2009.
World Bank. World Trade Indicators 2008.http://web.worldbank.org/WBSITE/EXTERNAL/TOPICS/TRADE/0,,contentMDK:21393040∼pagePK:210058∼piPK:210062∼theSitePK:239071,00.html (accessed January 5, 2009).
World Trade Organization (WTO). International Trade Statistics 2008.“Table 1.10: Leading Exporters and Importers in World Trade inCommercial Services, 2007.” http://www.wto.org/english/res e/statis e/its2008 e/section1 e/i10.xls.
Chapter 3
U.S. Trade Policysince 1934
Introduction
U.S. trade policy has evolved greatly in the 75 years since the passageof the landmark 1934 Reciprocal Trade Agreements Act (RTAA). At thebeginning of this era, the United States and its trading partners had in placehigh import tariffs. There was no multinational international agreementthat set out rules of trade between nations, and the few trade agreementsthat existed had generally been negotiated on a bilateral basis. Tradenegotiations, when they occurred, were focused on manufactured goodsand the elimination of tariffs.
Since that time, the United States and its trading partners have reducedor removed many barriers to trade. Tariffs have been lowered or eliminatedon nearly all products, and average tariff rates for the United Statesdeclined from 18.4 percent in 1934 to 1.3 percent in 2007.1 Otherindustrialized countries have similarly lowered their tariffs. Trade hasbecome a larger component of U.S. GDP during this time (figure 3.1).
Significant strides have been made in international cooperation. Tradenegotiations now take place in an established multilateral framework thatprovides stability and continuity to the negotiations. An initial set of
1Data are weighted-average tariff rates as a percent of all imports. Compiled fromofficial statistics of the U.S. Department of Commerce.
59
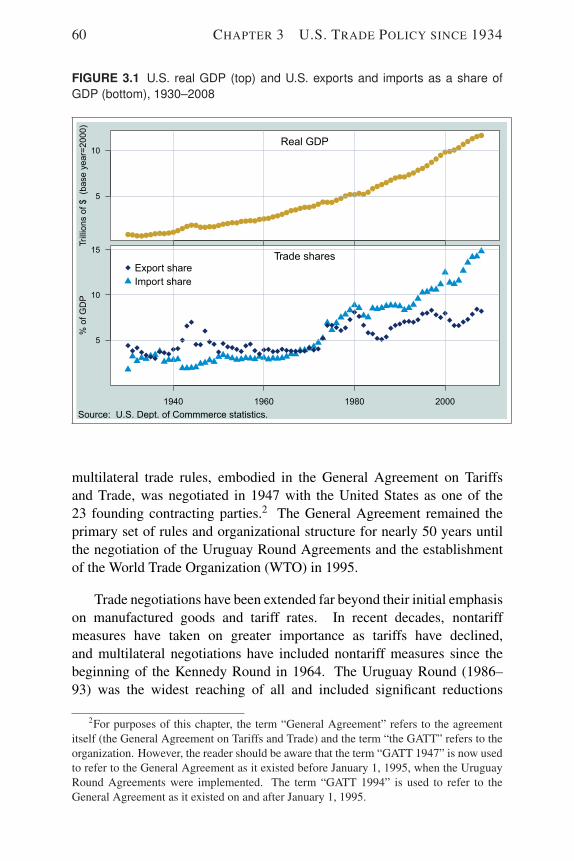
60 CHAPTER 3 U.S. TRADE POLICY SINCE 1934
FIGURE 3.1 U.S. real GDP (top) and U.S. exports and imports as a share ofGDP (bottom), 1930–2008
Source: U.S. Dept. of Commmerce statistics.
1940 1960 1980 2000
5
10
15
% o
f G
DP
Export share
Import share
Trade shares
●●●●●●●●●●●●
●●●●●●●●●
●●●●●●●●●●
●●●●●
●●●●●●
●●●●●●
●●●●●●●●
●●●●
●●●●●●
●●●●●●●
●●●●●
●
5
10
Trill
ions o
f $
(base y
ear=
2000)
Real GDP
multilateral trade rules, embodied in the General Agreement on Tariffsand Trade, was negotiated in 1947 with the United States as one of the23 founding contracting parties.2 The General Agreement remained theprimary set of rules and organizational structure for nearly 50 years untilthe negotiation of the Uruguay Round Agreements and the establishmentof the World Trade Organization (WTO) in 1995.
Trade negotiations have been extended far beyond their initial emphasison manufactured goods and tariff rates. In recent decades, nontariffmeasures have taken on greater importance as tariffs have declined,and multilateral negotiations have included nontariff measures since thebeginning of the Kennedy Round in 1964. The Uruguay Round (1986–93) was the widest reaching of all and included significant reductions
2For purposes of this chapter, the term “General Agreement” refers to the agreementitself (the General Agreement on Tariffs and Trade) and the term “the GATT” refers to theorganization. However, the reader should be aware that the term “GATT 1947” is now usedto refer to the General Agreement as it existed before January 1, 1995, when the UruguayRound Agreements were implemented. The term “GATT 1994” is used to refer to theGeneral Agreement as it existed on and after January 1, 1995.
INTRODUCTION 61
in tariffs; the tariffication of quotas on agricultural goods; the phase-outof quotas on textiles and apparel; the expansion of the rules relating totrade in goods; the establishment of new rules relating to investment,intellectual property, and trade in services; a binding dispute settlementprocess; and the establishment of a permanent organization to administerthe agreements, the World Trade Organization.
A survey of the economic literature on trade provides a clear picture ofthe effects of trade policy on the United States. There is near unanimityin the literature that trade liberalization has broadly benefited the UnitedStates, although assessments differ considerably about its precise effects. Itis well recognized that the gains from trade liberalization are more widelydispersed than the losses, which may make the losses more apparent.However, the economy-wide benefits of trade liberalization are estimatedto be positive even after taking into account the costs of adjusting aneconomy to trade openness. Another observation made in the literatureis that further tariff reductions provide fewer gains to economic welfarewhen tariff barriers are already at very low levels.3 This is particularly truefor the United States and other developed countries as their average tariffrates edge toward zero. Finally, recent economic literature has begun toinclude analysis of services barriers and nontariff barriers; reductions inthese types of barriers are estimated to have a greater potential effect onwelfare than can be currently derived from additional reductions in tariffs.
This chapter provides an overview of U.S. trade policy since 1934and summarizes the literature on the economic effects of these policychanges on the United States. The first part, organized into four timeperiods, examines the key steps and results of U.S. trade policy since1934. The second part summarizes the economic literature on the effects oftrade liberalization, with brief discussions of economic theories and theirquantitative implications. For the purposes of this study, the referencedliterature was selected from peer-reviewed literature. For the section onthe history of U.S. trade, the literature review drew heavily on experts inthe fields of economic history, political economy and U.S. trade law. Thesection on economic effects focuses on analytical and rigorous studies,both theoretical and quantitative.4 Context and summary points have beenadded where necessary to provide the reader with a narrative structure.
3Welfare is used throughout this chapter in its economic sense; it correspondsapproximately to household income, taking into consideration the prices of goodspurchased by the household and the variety of goods available.
4The chapter will not, as a rule, explore the interplay of exchange rate policy and tradepolicy. For details on the exchange rate regime that prevailed until the mid 1970s when the
62 CHAPTER 3 U.S. TRADE POLICY SINCE 1934
A timeline of important legislation, policy changes, and related events isavailable at the end of this chapter.
History of U.S. Trade Policy since 1934
This section of the chapter provides a chronology of events sincepassage of the 1934 Reciprocal Trade Agreements Act (RTAA). Thischronology of the last 75 years documents the course of U.S. efforts toincrease trade openness. The period can be divided into four major eras.During the first era, from 1934 until the beginning of World War II, theUnited States began to reduce barriers and expand trade via a series ofbilateral agreements with its main trading partners to mutually reducetariffs. After World War II, trade policy shifted toward a multilateralapproach under the auspices of the GATT. Following the post-war periodof trade opening came a third era during which progress in multilateralnegotiations continued, with successive rounds of negotiations resultingin further tariff reductions and increasingly in rules regulating nontariffissues. As multilateral trade liberalization contributed to the growth of newexport-oriented industries in developing countries, the resulting disruptionsto importing countries gave rise to a series of measures in the formof voluntary export restraints and marketing arrangements, such as theMultifiber Arrangement for textiles and apparel.
Finally, the most recent period in U.S. trade policy has been markedby a renewed effort toward liberalization on multilateral, regional, andbilateral fronts after the United States completed a free trade agreementwith Israel in 1985. In 1989, the United States entered into a free tradeagreement with Canada and then in 1994 began implementing an expandedfree trade agreement that included Mexico (NAFTA). The Uruguay Roundnegotiations, concluded in 1994, further reduced tariffs on a global basisand included new agreements on issues of critical importance to manyU.S. industries, such as intellectual property, investments, and trade inservices. In the post-1995 period, the United States continued to negotiateand implement free trade agreements; chronologically, these agreementswere with Singapore, Chile, Australia, a group of Central American andCaribbean countries (CAFTA), Morocco, Bahrain, Oman, and Peru. Three
United States left the gold standard see Krugman and Obstfeld, International Economics,2000, chap. 18, and in particular, 557–61.
HISTORY OF U.S. TRADE POLICY SINCE 1934 63
additional agreements are awaiting approval at the time of this writing:Colombia, South Korea and Panama.
The Reopening of Trade (1934–1941)
After more than a decade of increasingly high barriers to U.S. imports,the 1934 RTAA signaled what was to be the beginning of a long push toliberalize trade. Before tracing that path, however, it is useful to step backa few years and look at the Tariff Act of 1930, commonly known as theSmoot-Hawley Act.
While economists have debated the precise impact of the Smoot-Hawley Tariff Act of 1930, it has come to epitomize the trade restrictingsentiment in the United States at the outset of the Great Depression.5
This legislation was originally intended to protect domestic agriculturalinterests from low-priced imports that arose from global surges in farmproduction in the aftermath of World War I.6 The stock market crashof 1929, however, prompted demands for increased protection from allsectors of the economy. What were initially seen as a series of limitedadjustments in duties affecting selected agricultural and manufacturingproducts escalated through “log rolling” into the more substantial tariffincreases incorporated into the Tariff Act of 1930.7 International retaliatorymoves led to a dramatic decline in the volume of world trade. Such actionsincluded an increase in tariffs by the United Kingdom, prohibitive Italiantariffs on automobiles, significantly increased Spanish duties on productslargely imported from the United States (e.g., automobiles, tires, tubes, andmotion pictures), and similar Canadian actions against U.S. imports.8
5Irwin notes, however, that the increase in average tariffs due to Smoot-Hawley wassomewhat more modest than often thought, at about a 23 percent increase (as applied toactual 1928 imports). For purposes of comparison, the Fordney-McCumber tariff increaseof just eight years earlier pushed the average tariff rate up by 64 percent. Nevertheless, thecumulative effect was to push tariff rates to historic levels. Irwin, “From Smoot-Hawley toReciprocal Trade Agreements,” 1998, 334.
6Chorev, Remaking U.S. Trade Policy, 2007, 44.7Taussig, The Tariff History of the United States, 1931, 498.8Eichengreen notes that the extent to which increased foreign trade restrictions were a
reaction to Smoot-Hawley versus a reflection of protectionist sentiments in those countriesis not completely clear. Eichengreen, “The Political Economy of the Smoot-Hawley Tariff,”August 1986, 47. Retaliatory moves are also discussed in great detail in Jones, TariffRetaliation, 1934.
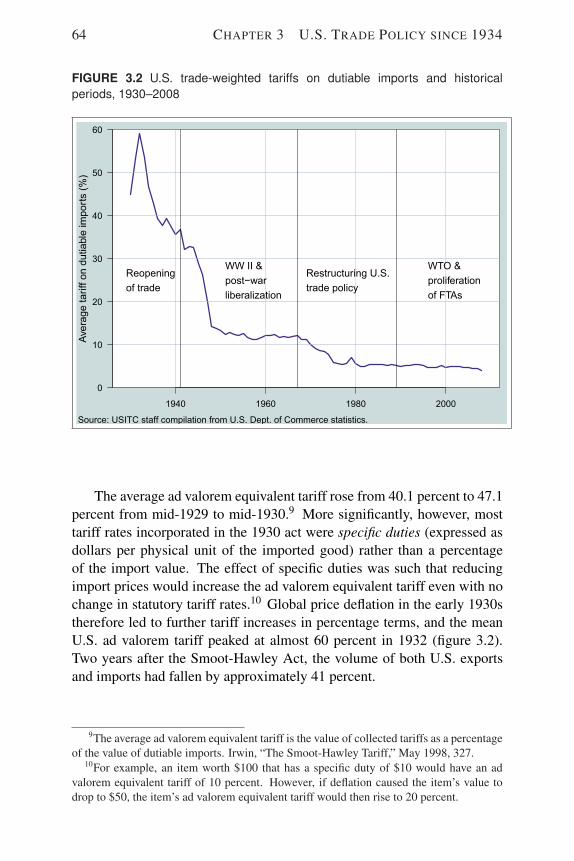
64 CHAPTER 3 U.S. TRADE POLICY SINCE 1934
FIGURE 3.2 U.S. trade-weighted tariffs on dutiable imports and historicalperiods, 1930–2008
Source: USITC staff compilation from U.S. Dept. of Commerce statistics.
1940 1960 1980 2000
0
10
20
30
40
50
60
Avera
ge t
ari
ff o
n d
utiable
im
port
s (
%)
Reopening
of trade
WW II &
post−war
liberalization
Restructuring U.S.
trade policy
WTO &
proliferation
of FTAs
The average ad valorem equivalent tariff rose from 40.1 percent to 47.1percent from mid-1929 to mid-1930.9 More significantly, however, mosttariff rates incorporated in the 1930 act were specific duties (expressed asdollars per physical unit of the imported good) rather than a percentageof the import value. The effect of specific duties was such that reducingimport prices would increase the ad valorem equivalent tariff even with nochange in statutory tariff rates.10 Global price deflation in the early 1930stherefore led to further tariff increases in percentage terms, and the meanU.S. ad valorem tariff peaked at almost 60 percent in 1932 (figure 3.2).Two years after the Smoot-Hawley Act, the volume of both U.S. exportsand imports had fallen by approximately 41 percent.
9The average ad valorem equivalent tariff is the value of collected tariffs as a percentageof the value of dutiable imports. Irwin, “The Smoot-Hawley Tariff,” May 1998, 327.
10For example, an item worth $100 that has a specific duty of $10 would have an advalorem equivalent tariff of 10 percent. However, if deflation caused the item’s value todrop to $50, the item’s ad valorem equivalent tariff would then rise to 20 percent.
HISTORY OF U.S. TRADE POLICY SINCE 1934 65
Prior to the 1930 act, tariff changes were viewed as entirely thedomain of Congress.11 The depth of the global depression and the risein barriers imposed by foreign trading partners, however, made it clearthat international negotiations would be required to reverse these effects,as trading partners were unlikely to lower barriers to U.S. exports unlessthe United States acted in a similar manner. Although the President couldengage in multilateral negotiations, the need for a two-thirds majority inthe Senate to approve a resulting treaty made other countries less likely toengage in such negotiations.
The Roosevelt administration, which took office in 1933, was sym-pathetic to reducing tariffs, but in the midst of the depression, politicalsupport for unilateral reductions was lacking.12 The President thereforerequested, though not until March of 1934, that Congress authorize him tonegotiate bilateral or multilateral tariff-reduction agreements. The RTAAwas signed into law in June 1934.
The goal of the RTAA was export promotion, as its opening linestated it was “[f]or the purpose of expanding foreign markets for theproducers of the United States.”13 The RTAA permitted the Presidentto conclude bilateral, reciprocal trade agreements with a view towardreducing the tariffs of mutual interest to the United States and specific tradepartners.14 This allowed the President to engage in a more streamlinednegotiating process.15 The RTAA led to a series of bilateral tariff-reduction agreements, although these were not across-the-board cuts butrather selective reductions taking into account the possibility of injury toparticular industries. The U.S. reductions were generally applied accordingto the “most-favored-nation” (MFN) principle that had been in effect underU.S. trade law since 1923, in that tariff preferences granted to one countrywere automatically granted to imports into the United States from all
11Irwin, “From Smoot-Hawley to Reciprocal Trade Agreements,” 1998, 331.12Dam notes that Secretary of State Cordell Hull, a long-time proponent of low tariffs,
called for an “immediate unilateral reduction in U.S. tariffs” via a 1925 draft resolution inthe U.S. House of Representatives. Dam, “Cordell Hull,” October 2004, 2.
13Reciprocal Trade Agreements Act of 1934, Pub. L. No. 73-316 (1934).14These bilateral agreements did not need to be submitted for congressional approval.
Irwin, “From Smoot-Hawley to Reciprocal Trade Agreements,” 1998, 341.15The initial law was valid for a three-year period. It was renewed repeatedly and has
existed in some form since 1934 with a few major lapses: 1967–74, 1994–2002, andsince 2007. Currently, the President does not have this power, now called trade promotionauthority.
66 CHAPTER 3 U.S. TRADE POLICY SINCE 1934
other countries.16 “Free-riding”17 by other countries was minimized bystriking deals “only on commodities in which the negotiating country wasa ‘principal supplier’.”18
Tariff reduction necessitated finding alternate sources of governmentrevenues.19 While the share of federal revenues derived from customsduties had been steadily falling since the turn of the century (it was 40percent in 1910 before the 1913 ratification of the Sixteenth Amendmentestablished the modern system of income taxes), the percentage of federalrevenues coming from tariffs was still 14.5 percent in 1930.20 By 1940 thisshare fell to 4.8 percent and by 1950 to 1 percent (where it has remained todate).
Agreements had been signed under the RTAA with 21 countriesrepresenting approximately 60 percent of U.S. trade by June 1940.21 The
16Trebilcock and Howse present an extensive discussion of the rationale for and historyof MFN principles. There are both political and economic rationales for the principle,such as avoiding tensions among countries due to perceived discrimination in economicpolicy and inefficient distortions of trade flows that would result in its absence. Trebilcockand Howse, The Regulation of International Trade, 2005. The United States had longadhered to a “conditional” MFN policy in which tariff concessions negotiated with onecountry would be extended to others but only if those others made reciprocal concessions.Irwin, “From Smoot-Hawley to Reciprocal Trade Agreements,” 1998, 333. However, in1923, President Harding approved adoption of unconditional MFN in future commercialtreaties. The United States subsequently announced it would in the future adhere to an“unconditional” MFN policy–in which “any negotiated U.S. tariff reduction would beautomatically applied to all countries that had an MFN treaty with the United States.” Irwin,“The Smoot-Hawley Tariff,” 1998, 333; U.S. Tariff Commission, Operation of the TradeAgreements Program, Report No. 160, 1949.
17In other words, a country with MFN status could benefit without liberalizing any of itsown import tariffs.
18Irwin, “From Smoot-Hawley to Reciprocal Trade Agreements,” 1998, 27–28.19Taussig, in describing a phase-in period for a reduction in the sugar duty incorporated
in the Tariff Act of 1913 notes “the sugar duty contributed heavily to the customs revenue.The income tax, which was expected to make up for the loss in the customs revenue, wouldalmost certainly require time for working out its full yield.” Taussig, The Tariff History ofthe United States, 1914, 426.
20Personal and corporate income taxation provided a rapidly increasing share of federalrevenues, rising to 30 percent in 1935, to 77 percent in 1950, and to 93 percent today(including payroll taxes).
21Irwin, “From Smoot-Hawley to Reciprocal Trade Agreements,” 1998, 343; Beckett,The Reciprocal Trade Agreements Program, 1941, 32, 124. These countries (inchronological order of their effective dates) were: Cuba, Belgium, Haiti, Sweden,Brazil, Canada, the Netherlands, Switzerland, Honduras, Colombia, France, Guatemala,Nicaragua, Finland, El Salvador, Costa Rica, Czechoslovakia, Ecuador, the UnitedKingdom, Turkey, and Venezuela. Through 1945, 32 agreements were negotiated. Jackson,World Trade and the Law of GATT, 1969, 37.
HISTORY OF U.S. TRADE POLICY SINCE 1934 67
average U.S. ad valorem tariff on dutiable imports had fallen to 25.3percent by 1946 (figure 3.2).22 Despite these bilateral trade agreementsand similar arrangements undertaken by other developed economies, andperhaps due in part to the shift toward war-related production in somecountries, growth in global trade lagged behind growth in overall economicactivity during the slow recovery from the depression.23
World War II and Postwar Liberalization (1941–1967)
World War II brought bilateral trade negotiations largely to an end.Bilateral negotiations were not resumed even after the war ended, as therewere limitations to the approach. The primary limitation was the obligationunder the principle of MFN to provide all trade partners with the samenondiscriminatory treatment as given to a specific partner under a bilateraltrade agreement.24 But perhaps more importantly, the 1941 AtlanticCharter between the United States and the United Kingdom promotedthe view that broad international economic collaboration was necessaryto avoid the “beggar-thy-neighbor” policies that followed World War I,which were thought to have led to the economic inequities and resultingresentments that contributed to the start of World War II.25 In calling forrenewal of the Trade Agreements Act in 1945, the President—referring topost-war economic policy underway—said:
The purpose of the whole effort is to eliminate economicwarfare, to make practical international co-operation effectiveon as many fronts as possible, and so to lay the economic basisfor the secure and peaceful world we all desire.26
After the war, the United Nations (with the United States as one of the51 charter member countries) was established to provide a forum for bothpolitical and economic issues. One of the first goals of the United Nations,through its Economic and Social Council, was to establish the InternationalTrade Organization (ITO). The 1947–48 Havana Conference on Trade and
22Irwin, “Trade Restrictiveness,” 2007, 33.23Eichengreen and Irwin state that “[f]rom 1932 to 1938, GNP rose 29 percent in the
industrialized countries, while export volume increased 24 percent and import volume rosea mere 14 percent.” Eichengreen and Irwin, “Trade Blocs,” 1995, 4.
24Dam, “Cordell Hull,” October 2004, 6.25Jackson, World Trade and the Law of GATT, 1969, 37–38.26As quoted in Jackson, World Trade and the Law of GATT, 1969, 39.
68 CHAPTER 3 U.S. TRADE POLICY SINCE 1934
Employment concluded with the Havana Charter, an agreement by 52countries, which was to prepare the way for the ITO.27 However, the ITOconcept of a multilateral institution was abandoned when it became clearthat the United States would not accept the Havana Charter.28
Preparatory work on the ITO, however, did result in the set of traderules and disciplines embodied in the General Agreement on Tariffs andTrade, which was signed by 23 countries including the United States inOctober 1947.29 The General Agreement, and the informal organization(the GATT) created to oversee its implementation, became the vehiclefor multilateral trade negotiations for the next 50 years. The first GATTnegotiations, held in Geneva, led to U.S. tariff reductions, effective January1948, which brought the average U.S. ad valorem rate on dutiable importsdown to 13.9 percent from 19.4 percent in 1947, though a considerable partof that reduction was due to increased import prices rather than negotiatedreductions in specific duties.30
At the time the General Agreement was drafted, the United Stateswas a major exporter of agricultural goods. Moreover, it had in placea substantial set of price and quantity controls on agriculture establishedunder the 1933 Agricultural Adjustment Act. The General Agreement wasdrafted to exempt existing agricultural programs maintained by the UnitedStates and other parties. The United States played a significant role in thisexemption.31 After a 1951 amendment to the 1933 act that required certainimport quotas, the United States requested and received a waiver in 1955that permitted the new U.S. agricultural quotas.32
The Annecy (1949), Torquay (1950–51), Geneva (1955–56) and Dillon(1961–62) Rounds produced only small tariff reductions.33 However,these rounds slightly increased the number of signatories to the GATT andconsolidated the initial gains of the GATT by signaling the commitment ofthe members to the new structure of trade negotiations (see figure 3.3).34
27McGovern, International Trade Regulation, 1995, 1.11-1.28Diebold suggests that a variety of domestic groups, as well as the lack of political will
or power by the Truman administration, contributed to the charter’s failure to pass the U.S.Congress. Diebold, “The End of the ITO,” 1952, 3.
29The GATT was originally conceived as an agreement within the context of the ITO.Jackson, World Trade and the Law of the GATT,1969, 43.
30Irwin, “From Smoot-Hawley to Reciprocal Trade Agreements,” 1998, 346.31Jackson, World Trade and the Law of GATT, 1969, 733.32Jackson, World Trade and the Law of GATT, 1969, 734-735.33Irwin, “From Smoot-Hawley to Reciprocal Trade Agreements,” 1998, 346.34Table F.2, provides a detailed summary of all negotiating rounds under the GATT.
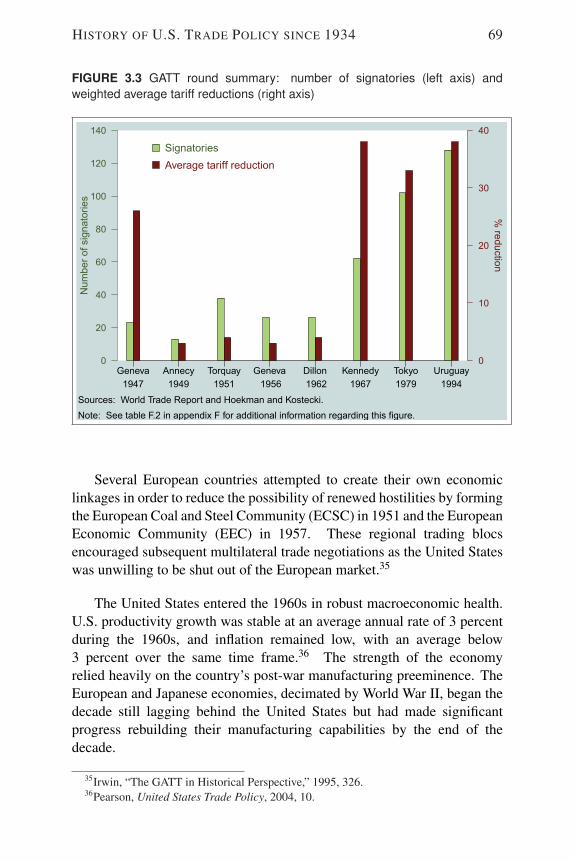
HISTORY OF U.S. TRADE POLICY SINCE 1934 69
FIGURE 3.3 GATT round summary: number of signatories (left axis) andweighted average tariff reductions (right axis)
Sources: World Trade Report and Hoekman and Kostecki.
Note: See table F.2 in appendix F for additional information regarding this figure.
Geneva
1947
Annecy
1949
Torquay
1951
Geneva
1956
Dillon
1962
Kennedy
1967
Tokyo
1979
Uruguay
1994
0
20
40
60
80
100
120
140
Num
ber
of
sig
nato
ries
0
10
20
30
40
% re
ductio
n
Signatories
Average tariff reduction
Several European countries attempted to create their own economiclinkages in order to reduce the possibility of renewed hostilities by formingthe European Coal and Steel Community (ECSC) in 1951 and the EuropeanEconomic Community (EEC) in 1957. These regional trading blocsencouraged subsequent multilateral trade negotiations as the United Stateswas unwilling to be shut out of the European market.35
The United States entered the 1960s in robust macroeconomic health.U.S. productivity growth was stable at an average annual rate of 3 percentduring the 1960s, and inflation remained low, with an average below3 percent over the same time frame.36 The strength of the economyrelied heavily on the country’s post-war manufacturing preeminence. TheEuropean and Japanese economies, decimated by World War II, began thedecade still lagging behind the United States but had made significantprogress rebuilding their manufacturing capabilities by the end of thedecade.
35Irwin, “The GATT in Historical Perspective,” 1995, 326.36Pearson, United States Trade Policy, 2004, 10.
70 CHAPTER 3 U.S. TRADE POLICY SINCE 1934
In the context of continued growth, the Trade Expansion Act of 1962was passed. The primary aim of the act was to authorize the President tonegotiate further reductions in duties. The act authorized the President tonegotiate across-the-board tariff-rate cuts37 as well as tariff reductions ofup to 50 percent, an increase from the 1958 extension of the RTAA thatonly allowed reductions of up to 20 percent. The Trade Expansion Actalso moved the locus of trade negotiations to the separate U.S. governmentoffice of the newly created Special Trade Representative.38 The 1962 TradeExpansion Act passed Congress with the support of the labor unions, whowere reassured by the inclusion of the new Trade Adjustment Assistance(TAA) program designed to help workers in industries adversely affectedby trade.39 However, the TAA program was subject to strict criteria, and nofavorable action was granted to workers seeking relief until 1969;40 eventhrough 1974 relatively few workers had obtained compensation under theTAA.41
Restructuring U.S. Trade Policy (1967–1989)
The 1967–89 period was marked by a struggle among domesticinterests over the trade liberalization framework. This domestic strugglearose out of the considerable pressures placed on U.S. manufacturers inimport-competing industries during the 1960s and 1970s when Europeanand Japanese firms emerged from their post-World War II rebuilding effortswith a greater level of competitiveness. Additionally, the late 1960sand 1970s presented a series of macroeconomic challenges, including theoil shocks, the end of fixed exchange rate regimes, and high inflation,which further disrupted U.S. industries. Domestic producers in certainvulnerable industries, particularly labor-intensive manufacturers, pushedfor legislation against imports, while export-oriented producers, includingcertain agricultural exporters, opposed new U.S. barriers that might leadto reciprocal barriers against U.S. exports. Those domestic producers infavor of restricting trade were initially successful in reducing imports from
37As noted by Chorev, this was a change from prior extensions of the RTAA thatpermitted only line-by-line negotiations. Chorev, Remaking U.S. Trade Policy, 2007, 61.
38Office of the USTR, “History of the U.S. Trade Representative,” undated (accessedFebruary 2, 2009).
39Destler, American Trade Politics, 1995, 23.40Baldwin, “The Changing Nature of U.S. Trade Policy,” 1984a, 13.41Fewer than 54,000 workers received compensation under the program through 1974.
Kenan, The International Economy, 2000, 228.
HISTORY OF U.S. TRADE POLICY SINCE 1934 71
a limited number of countries via quota-based agreements or voluntaryexport restraints (VERs).42 As will be explained in detail in this section,these practices were gradually applied to other vulnerable industries, aswell as to a broader set of countries. The effect was a significant lossof momentum in the reduction of trade barriers and an increase in tradebarriers in certain areas. However, this trend began to reverse itself towardthe end of the era, when a set of trade remedy laws was established toaddress the concerns of those in the import-competing industries, while atthe same time a broader liberalization agenda was revived.
Voluntary Export Restraints (VERs)
As early as the mid-1950s, certain import-competing industries beganlobbying for government action against imported goods. The mostvulnerable industries—those that employed domestic labor intensively,those that competed with foreign labor-intensive manufacturing processes,or those with easily adoptable technologies—were among the most ferventin their lobbying efforts. Much of this effort was initially directed againstJapan’s cotton textile manufacturers.43 In order to deflect charges of unfairtrade practices and to avoid punitive tariffs, Japan voluntarily agreed torestrict its exports to many of its trade partners. These VERs were initiallyapplied to certain cotton products in 1955 at the time of Japan’s accessionto the GATT. Even with the agreement in place, many GATT membersdeclined to grant MFN status to Japan.44 This was done via the “opt-out”clause of the GATT, which allowed any member to refuse to grant MFNstatus to any country at the time of that country’s accession.45 With thetrade restraints in place, Japan eventually achieved MFN status from GATTmembers. The VER agreements with the United States called for Japan torestrain its textiles exports to approximately 1.5 percent of U.S. domesticproduction of textiles, with a one-time 5.2 percent increase in exports
42Voluntary export restraints are restraints placed by exporting countries (usuallyexporters of low-priced goods) on their own goods, generally after considerable pressureby the importing country.
43Japan’s exports of cotton textiles increased sixfold from 1945 to 1955, providingsudden competition for U.S. manufacturers. Hunter and Macnaughtan, “Textile Workers inJapan,” 2008, 39. It should be noted, however, that by 1959 Japan had merely regained itsprewar share of textile world trade. Keesing and Wolf, Textile Quotas Against DevelopingCountries, 1980, 12.
44The United States did extend MFN status to Japan.45Jackson, The World Trading System, 1997, 60.
72 CHAPTER 3 U.S. TRADE POLICY SINCE 1934
permitted in 1959.46 Over time, U.S.-Japanese VER agreements expandedfrom narrowly defined product categories to agreements covering a diverseset of goods from tuna to kitchen utensils.47 Several other countries,including Australia, France and the United Kingdom also concluded VERswith Japan.48
The GATT Long-Term Arrangement Regarding International Trade inCotton Textiles (LTA) was established in 1962. This agreement included29 exporting and importing nations and imposed VERs on cotton textilesto the United States and several other developed countries.49 By 1972, newVER agreements had been made that included increasingly popular man-made fibers, as well as wool, and were applied to South Korea, Taiwan,Hong Kong, and Malaysia. The GATT Multifiber Arrangement (MFA)was implemented in 1974. The MFA initially comprised approximately40 countries, including nine developed country importers (including theUnited States).50 It restricted exporters to “orderly marketing agreements,”effectively VERs, on certain textile and apparel products including cotton,certain man-made fibers, and wool. The MFA, as with VERs, providedU.S. firms with an adjustment period, enabling them to revise theirproduction process to become more internationally competitive or to shiftproduction to a product more in line with their comparative advantage.The MFA was renewed multiple times until it was replaced by the WTOAgreement on Textiles and Clothing (ATC), to which the United States wasa party, under which textile quotas were phased out from 1995 to 2005.
Textile quotas and restraints were applied largely to benefit domesticinterests in the United States and other industrialized nations althoughbenefits also accrued to certain developing countries. For example,countries that were allocated quotas received guaranteed market accesseven for marginally efficient products. Quotas also provided incentivesfor developing countries to increase value added per unit as a way ofmaximizing the revenue from abroad.51
46McClenahan, “The Growth of Voluntary Export Restraints,” 1991, 183.47Ibid., 184.48Farrell, Japanese Investment in the World Economy, 179.49The LTA was preceded by an interim measure, the GATT Short-Term Arrangement
(STA), which provided terms on imports and exports of cotton textiles similar to those ofthe eventual LTA. The STA was drafted by representatives of 16 countries including theUnited States and was in effect from 1961 to 1962. USITC, The History and Current Statusof the Multifiber Arrangement, 1978, 8-9.
50Jackson, The World Trading System, 1997, 208.51For a lengthier treatment of the effects of textiles quotas on developing countries see
Keesing and Wolf, Textile Quotas Against Developing Countries, 1980, 122-128.
HISTORY OF U.S. TRADE POLICY SINCE 1934 73
The steel industry also experienced increased competition from im-ports, which increased dramatically in the mid-1950s. From 1955, whenimports made up 1.2 percent of the U.S. steel market, imports increasednearly fivefold to a 5.6 percent market share in 1962.52 The steel industrysought relief, and in 1969 a major arrangement was reached between theU.S. government and representatives of the steel industries in Japan and theEEC, wherein these industries voluntarily agreed to restrict their exportsto the United States. This arrangement was expanded in 1972 to includethe British steel industry,53 but was eliminated a few years later wheneconomic pressures on the steel industry eased.54 Renewed efforts by theU.S. steel industry led to the implementation of the steel Trigger PriceMechanism (TPM) in 1977. The TPM established a minimum price forsteel and treated any price below the minimum as dumping.55 AdditionalVERs on steel were implemented in 1982 and 1984 and phased out in 1992.
Another set of significant export restrictions was the system of VERsfor passenger vehicles exported to the United States from Japan, in placeduring 1981–84.56 These VERs added significantly to the restraintsalready in place. Imports subject to restrictions under VERs amounted toapproximately 6 percent of annual U.S. manufactured imports in 1980, afigure that, by one estimate, doubled with the implementation of passengervehicle VERs.57
Trade Act of 1974
By 1974, reduction of nontariff barriers had come to be seen as criticalto progress in multilateral trade liberalization.58 Two forces highlightedtheir importance. The first was the substantial progress that had beenmade in the reduction of tariffs, which in turn tended to reveal the highlyrestrictive nature of nontariff measures. The second was the increased useof nontariff measures, such as VERs, that were outside of the negotiatingframework. The Trade Act of 1974 addressed the matter from the United
52Adams and Dirlam, “Steel Imports,” 1964, 629.53McClenahan, “The Growth of Voluntary Export Restraints,” 1991, 188.54Destler notes that this was a result of both domestic economic growth and the
devaluation of the dollar during this time. Destler, American Trade Politics, 1995, 188.55Chorev, Remaking U.S. Trade Policy, 2007, 121.56Feenstra, “Voluntary Export Restraints in U.S. Autos,” 1984, 37.57Destler, American Trade Politics, 1995, 210.5893rd Congress, Trade Act of 1974, Pub. L. No. 93-618, January 3, 1975 (19 U.S.C.
2101)
74 CHAPTER 3 U.S. TRADE POLICY SINCE 1934
States’ perspective. It provided relief from injury caused by importcompetition and provided other adjustment assistance for workers andfirms.59 At the same time, the 1974 act reduced the overall level of tradebarriers, reinstated the President’s authority to negotiate tariff reductionsin the Tokyo Round (1973–79), and extended trade negotiation authorityto the reduction of nontariff measures, which previous trade authorizationbills had not explicitly included.60 This renewal of trade negotiatingauthority was similar to the 1934 RTAA (which had finally lapsed in1962), although the 1974 act required greater consultation with Congressduring the negotiating process. The 1974 act provided so-called fast trackauthority under which Congress agreed that if the President submittedlegislation to implement a trade agreement and followed certain proceduralrequirements, Congress would veto or approve, but not amend, thelegislation. This authority signaled the seriousness of the administration’sintent when negotiating with trade partners and helped to speed upnegotiations by limiting Congress’s role to setting negotiating objectivesand active consultation.61
To address concerns from industries about increased competition fromabroad, the 1974 act relaxed the requirements for obtaining relief viavarious measures collectively called trade remedies. These trade remedies,as discussed below, had in some cases been available to firms since 1921.62
The intent of the legislation was to provide a rational framework forrelief from import competition to replace what some observers claimedhad become a series of exemptions for powerful industries.63 Althoughthe relaxed trade-remedy requirements enabled less-powerful industries tosuccessfully obtain relief, industries previously receiving favored treatmentcontinued to do so under the new legislation, and the 1974 act easedthe requirements somewhat for obtaining assistance under the TradeAdjustment Assistance program.64 The 1974 Trade Act changed the nameof the U.S. Tariff Commission—initially established in 1916—to the U.S.International Trade Commission to reflect the expansion of trade issuesbeyond tariffs. More substantively, the legislation authorized the President
5993rd Congress, Trade Act of 1974, Pub. L. No. 93-618, January 3, 1975 (19 U.S.C.2101).
60Destler, American Trade Politics, 1995, 312.61Ibid., 71.62The first, though rarely used, antidumping provision was in the Antidumping Law
of 1916, 15 U.S.C. §71 et seq. The law generally thought of as the basis for currentantidumping concepts is the Antidumping Act of 1921.
63Destler, American Trade Politics, 1995, 142.64Ibid., 140.
HISTORY OF U.S. TRADE POLICY SINCE 1934 75
to retaliate against foreign import restraints via Section 301. Continuedtrade liberalization required a set of measures aimed at providing relief toindustries that faced unfair competition from imports, and the 1974 TradeAct sought to broaden the trade remedies available to the President andU.S. industries. The remedies fall into five categories: antidumping duties,countervailing duties, section 337 of the 1930 Tariff Act (certain unfairimport practices), safeguard actions (reenacted as section 201 of the 1974Trade Act), and section 301 of the 1974 Trade Act (box 3.1).
There is debate as to the role of trade remedies in the broader tradeliberalization agenda. Some scholars view trade remedy laws as a way tomanage the requests for protection from vulnerable domestic industries.65
That is, these laws enable firms to target specific goods from specificcountries, reducing firms’ incentives to band together to push Congress forbroad-based increases in tariffs or quotas. A different perspective is thattrade remedies are an alternate means of restricting trade. An examinationof trade remedies broadly defined to include VERs estimates that theseremedies were equivalent to a nearly 20 percent tariff on the goods inthe affected industries.66 Antidumping proceedings may also encourageforeign firms to raise their prices in U.S. markets to avoid antidumpingduties, which can lead to quota rents67 being transferred abroad at theexpense of U.S. consumers.68
Generalized System of Preferences
Another major change resulting from the 1974 act was the authoriza-tion of the U.S. Generalized System of Preferences (GSP) that permitteddesignated developing countries to export certain goods duty-free to the
65See, for example, the discussions in Pearson 33, and Chorev 144.66De Melo and Tarr, “Welfare Costs of U.S. Quotas,” 1990, 492-96. The effects
estimated were derived from two sources: somewhat less than 13 percent is obtained strictlyfrom tariff equivalents, while the extra 7 percent results from the transfer of quota rentsgoing to other countries under VERs.
67“Quota rents” is an economic term with the following meaning. Any quantityrestriction on imports will imply that those few imports permitted into the country canbe sold at a premium; this premium is known as a “quota rent.” Conventional quotas onimports will see the quota rents accrue domestically, frequently to the importers; exportrestraints will see the quota rents accrue to foreign exporters.
68Gallaway, Blonigen, and Flynn, “Welfare Costs of the U.S. Antidumping andCountervailing Duty Laws,” 1999, 211-44. In this case, quota rents allow foreign producersto benefit from the higher prices paid by U.S. consumers. An extensive survey of theliterature can be found in Blonigen and Prusa, “Antidumping,” 2001.
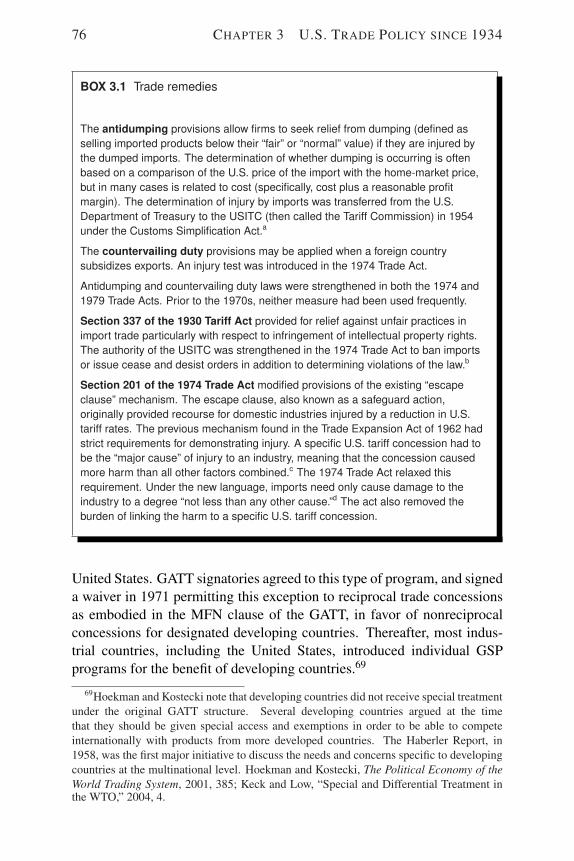
76 CHAPTER 3 U.S. TRADE POLICY SINCE 1934
BOX 3.1 Trade remedies
The antidumping provisions allow firms to seek relief from dumping (defined asselling imported products below their “fair” or “normal” value) if they are injured bythe dumped imports. The determination of whether dumping is occurring is oftenbased on a comparison of the U.S. price of the import with the home-market price,but in many cases is related to cost (specifically, cost plus a reasonable profitmargin). The determination of injury by imports was transferred from the U.S.Department of Treasury to the USITC (then called the Tariff Commission) in 1954under the Customs Simplification Act.a
The countervailing duty provisions may be applied when a foreign countrysubsidizes exports. An injury test was introduced in the 1974 Trade Act.
Antidumping and countervailing duty laws were strengthened in both the 1974 and1979 Trade Acts. Prior to the 1970s, neither measure had been used frequently.
Section 337 of the 1930 Tariff Act provided for relief against unfair practices inimport trade particularly with respect to infringement of intellectual property rights.The authority of the USITC was strengthened in the 1974 Trade Act to ban importsor issue cease and desist orders in addition to determining violations of the law.b
Section 201 of the 1974 Trade Act modified provisions of the existing “escapeclause” mechanism. The escape clause, also known as a safeguard action,originally provided recourse for domestic industries injured by a reduction in U.S.tariff rates. The previous mechanism found in the Trade Expansion Act of 1962 hadstrict requirements for demonstrating injury. A specific U.S. tariff concession had tobe the “major cause” of injury to an industry, meaning that the concession causedmore harm than all other factors combined.c The 1974 Trade Act relaxed thisrequirement. Under the new language, imports need only cause damage to theindustry to a degree “not less than any other cause.”d The act also removed theburden of linking the harm to a specific U.S. tariff concession.
United States. GATT signatories agreed to this type of program, and signeda waiver in 1971 permitting this exception to reciprocal trade concessionsas embodied in the MFN clause of the GATT, in favor of nonreciprocalconcessions for designated developing countries. Thereafter, most indus-trial countries, including the United States, introduced individual GSPprograms for the benefit of developing countries.69
69Hoekman and Kostecki note that developing countries did not receive special treatmentunder the original GATT structure. Several developing countries argued at the timethat they should be given special access and exemptions in order to be able to competeinternationally with products from more developed countries. The Haberler Report, in1958, was the first major initiative to discuss the needs and concerns specific to developingcountries at the multinational level. Hoekman and Kostecki, The Political Economy of theWorld Trading System, 2001, 385; Keck and Low, “Special and Differential Treatment inthe WTO,” 2004, 4.
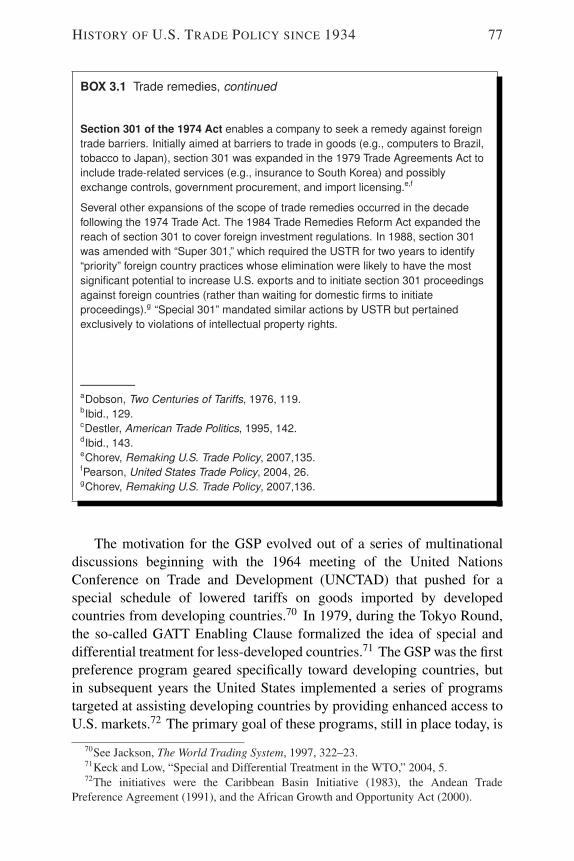
HISTORY OF U.S. TRADE POLICY SINCE 1934 77
BOX 3.1 Trade remedies, continued
Section 301 of the 1974 Act enables a company to seek a remedy against foreigntrade barriers. Initially aimed at barriers to trade in goods (e.g., computers to Brazil,tobacco to Japan), section 301 was expanded in the 1979 Trade Agreements Act toinclude trade-related services (e.g., insurance to South Korea) and possiblyexchange controls, government procurement, and import licensing.e,f
Several other expansions of the scope of trade remedies occurred in the decadefollowing the 1974 Trade Act. The 1984 Trade Remedies Reform Act expanded thereach of section 301 to cover foreign investment regulations. In 1988, section 301was amended with “Super 301,” which required the USTR for two years to identify“priority” foreign country practices whose elimination were likely to have the mostsignificant potential to increase U.S. exports and to initiate section 301 proceedingsagainst foreign countries (rather than waiting for domestic firms to initiateproceedings).g “Special 301” mandated similar actions by USTR but pertainedexclusively to violations of intellectual property rights.
—————aDobson, Two Centuries of Tariffs, 1976, 119.bIbid., 129.cDestler, American Trade Politics, 1995, 142.dIbid., 143.eChorev, Remaking U.S. Trade Policy, 2007,135.fPearson, United States Trade Policy, 2004, 26.gChorev, Remaking U.S. Trade Policy, 2007,136.
The motivation for the GSP evolved out of a series of multinationaldiscussions beginning with the 1964 meeting of the United NationsConference on Trade and Development (UNCTAD) that pushed for aspecial schedule of lowered tariffs on goods imported by developedcountries from developing countries.70 In 1979, during the Tokyo Round,the so-called GATT Enabling Clause formalized the idea of special anddifferential treatment for less-developed countries.71 The GSP was the firstpreference program geared specifically toward developing countries, butin subsequent years the United States implemented a series of programstargeted at assisting developing countries by providing enhanced access toU.S. markets.72 The primary goal of these programs, still in place today, is
70See Jackson, The World Trading System, 1997, 322–23.71Keck and Low, “Special and Differential Treatment in the WTO,” 2004, 5.72The initiatives were the Caribbean Basin Initiative (1983), the Andean Trade
Preference Agreement (1991), and the African Growth and Opportunity Act (2000).
78 CHAPTER 3 U.S. TRADE POLICY SINCE 1934
to assist the developing countries by encouraging their economic growth,although the United States benefits as well.73
Addressing Nontariff Measures
A series of multilateral initiatives began in the late 1960s to counterthe proliferation of nontariff measures, in particular quotas and VERs. TheKennedy Round (1964–67) was the first multilateral round to deal withnontariff measures, although its success was limited. Several agreementswere reached, notably on antidumping measures and a unified method forcustoms valuation. However, the U.S. Congress never passed the agree-ments, and the agreements became voluntary. The President, according toCongress, exceeded his authority by attempting to implement the nontariffmeasures as an executive agreement. Congress insisted that nontariffmeasures negotiated during the subsequent Tokyo Round be submitted toit for final approval.74 The main accomplishment of the Kennedy Roundwas a reduction in tariffs, which participating countries cut in 1967 to anaverage of 8.7 percent, a decrease of 35 percent.75
The Tokyo Round (1973–79) raised the subject of nontariff measuresagain, and this time an agreement was reached. The agreements resultingfrom the Tokyo Round were in the form of so-called codes, which wereagreements signed by only a subset of GATT countries—generally theOECD countries plus a few developing countries. The codes includedagreements on a number of subjects: customs valuation, governmentprocurement, import licensing procedures, subsidies and countervailingduties, antidumping duties, standards (technical barriers to trade), anda civil aircraft agreement. This time, the U.S. Congress approved theagreements without difficulty.
73A body of literature seeks to quantify these benefits. Hoekman, Martin, and Braga(2006) summarize some of this literature. Dean and Wainio, in estimating the value ofthe preference programs for the developing countries, point out that, as trade barriersare reduced, countries that are the beneficiaries of preference programs no longer havean advantage vis-a-vis the rest of the world. However, the key question as to whetherpreference programs aid in integrating developing countries into the world economy hasnot yet been conclusively answered. Hoekman, Martin, and Braga, “Preference Erosion”,2006, 19; Dean and Wainio, “Quantifying the Value of U.S. Tariff Preferences,” 2006.
74Baldwin, “The Changing Nature of U.S. Trade Policy Since World War II,” 1984, 19.Jackson attributes this failure to “procedural devices engineered by domestic interests” touphold protection for their products. Jackson, The World Trading System, 1997, 75.
75Ibid., 74.
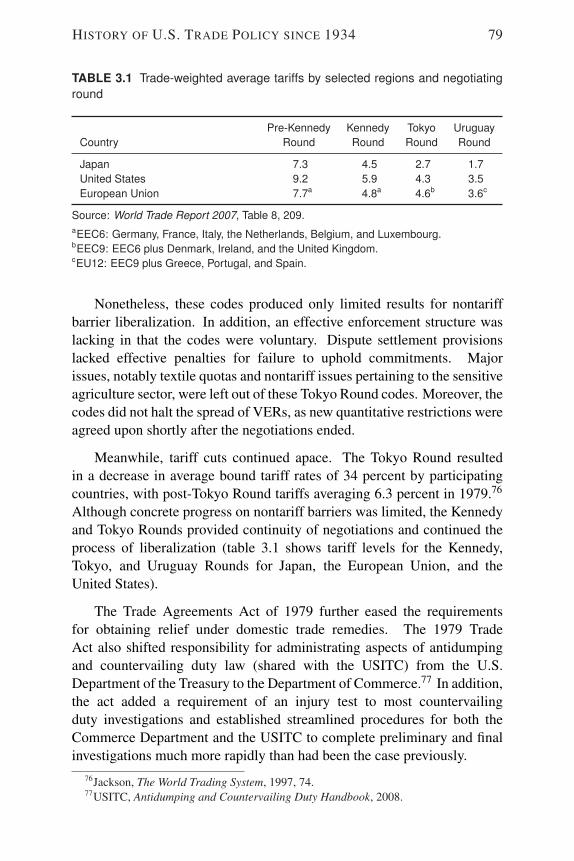
HISTORY OF U.S. TRADE POLICY SINCE 1934 79
TABLE 3.1 Trade-weighted average tariffs by selected regions and negotiatinground
Pre-Kennedy Kennedy Tokyo UruguayCountry Round Round Round Round
Japan 7.3 4.5 2.7 1.7United States 9.2 5.9 4.3 3.5European Union 7.7a 4.8a 4.6b 3.6c
Source: World Trade Report 2007, Table 8, 209.aEEC6: Germany, France, Italy, the Netherlands, Belgium, and Luxembourg.bEEC9: EEC6 plus Denmark, Ireland, and the United Kingdom.cEU12: EEC9 plus Greece, Portugal, and Spain.
Nonetheless, these codes produced only limited results for nontariffbarrier liberalization. In addition, an effective enforcement structure waslacking in that the codes were voluntary. Dispute settlement provisionslacked effective penalties for failure to uphold commitments. Majorissues, notably textile quotas and nontariff issues pertaining to the sensitiveagriculture sector, were left out of these Tokyo Round codes. Moreover, thecodes did not halt the spread of VERs, as new quantitative restrictions wereagreed upon shortly after the negotiations ended.
Meanwhile, tariff cuts continued apace. The Tokyo Round resultedin a decrease in average bound tariff rates of 34 percent by participatingcountries, with post-Tokyo Round tariffs averaging 6.3 percent in 1979.76
Although concrete progress on nontariff barriers was limited, the Kennedyand Tokyo Rounds provided continuity of negotiations and continued theprocess of liberalization (table 3.1 shows tariff levels for the Kennedy,Tokyo, and Uruguay Rounds for Japan, the European Union, and theUnited States).
The Trade Agreements Act of 1979 further eased the requirementsfor obtaining relief under domestic trade remedies. The 1979 TradeAct also shifted responsibility for administrating aspects of antidumpingand countervailing duty law (shared with the USITC) from the U.S.Department of the Treasury to the Department of Commerce.77 In addition,the act added a requirement of an injury test to most countervailingduty investigations and established streamlined procedures for both theCommerce Department and the USITC to complete preliminary and finalinvestigations much more rapidly than had been the case previously.
76Jackson, The World Trading System, 1997, 74.77USITC, Antidumping and Countervailing Duty Handbook, 2008.
80 CHAPTER 3 U.S. TRADE POLICY SINCE 1934
The 1988 Omnibus Trade and Competitiveness Act established theU.S. negotiating objectives for the Uruguay Round. Its overarchingobjectives were the reciprocal lowering of trade barriers and other tradedistortions and an improved system of dispute settlement. Specificobjectives were detailed in areas such as agriculture, services, intellectualproperty, and foreign direct investment.78 Another key component of the1988 act was an amendment to section 301 of the Trade Act of 1974 (seebox 3.1 for details). The 1988 act sought to increase exports via a setof domestic measures including promotion of technological competitive-ness. The act also promoted competitiveness in technology (e.g. federalresearch programs in semiconductor and other advanced manufacturingtechnologies) and expanded adjustment assistance for workers in industriesadversely affected by increased imports.
The World Trade Organization and the Proliferation of FreeTrade Agreements (since 1989)
The era since 1989 has been marked by several initiatives to revitalizetrade negotiations. During this period, the United States committedto multiple agreements and focused on expanding the reach of tradenegotiations into sensitive and technically difficult areas. The agreementsimplementing the results of the Uruguay Round of multilateral tradenegotiations and establishing the World Trade Organization were signedin 1993. The United States also signed a string of bilateral and regionalagreements, including the politically and economically significant NorthAmerican Free Trade Agreement.
The economic backdrop of these agreements was the increasinglyglobalized nature of trade. During the 1980s, worldwide exports grewon average 68 percent faster than global GDP, and in the 1990s, exportsgrew nearly 140 percent faster than global GDP.79 Improvements intransportation and communications, in addition to lower policy barriers,have expanded trade in goods (and increasingly in services) and facilitatedthe creation of widely dispersed production networks.80 Partly as a result ofthese lower trade costs and improved communication, firms began to break
78Omnibus Trade and Competitiveness Act of 1988, Pub. L. No. 100-418.79World Bank, World Development Indicators Online.80Feenstra provides a summary of the recent growth in international trade as well as a
detailed analysis of changes in international production methods. Feenstra, “Integration ofTrade,” 1998.
HISTORY OF U.S. TRADE POLICY SINCE 1934 81
apart their production processes and distribute them around the world.Companies sourced and produced parts internationally according to wherethe item could be made at a better quality or at a lower cost. This growingtrade in intermediate goods contributed to trade expanding more rapidlythan GDP and increased the number of players having a vested interestin lower trade barriers.81 Additionally, technical improvements permittedpreviously nontradable services to become increasingly traded.82 Tradeliberalization in this era saw a resurgence in the use of bilateral and regionalagreements, which contrasted with the prior era’s emphasis on multilateral,GATT-based negotiations. The GATT (primarily via Article XXIV ofGATT 1994) permits regional agreements provided that the countriesadhere to certain conditions, such as a commitment not to increase dutiesbetween the regional trade area and other WTO members. An extensivebody of literature debates whether free trade agreements (either regionalor bilateral) have had a beneficial effect on global trade.83 One branchof this literature84 argues that regional trade works against the drive forglobal integration because it undermines the motivation to reduce barriersto all countries and increases trade diversion.85 Another branch of the tradeliterature argues that regional trade blocs are a way of moving forward intrade liberalization when multilateral negotiations are temporarily blocked.Regional or bilateral trade agreements could persuade recalcitrant WTOmembers to reengage and are a forum to test ideas on new areas of tradeliberalization.
81Barton et al., The Evolution of the Trade Regime, 2006, 124.82Prime examples are technical developments in information technology that allow for
the tradability of software development and call centers.83A detailed exposition of this literature is found in Feenstra, Advanced International
Trade, 2004, 175–208. A less formal discussion appears in Krugman and Obstfeld,International Economics, 2000, 241–45.
84Krueger, “Are Preferential Trade Arrangements Trade-Liberalizing or Protectionist?”1999, provides a synthesis of the two sides; see Bhagwati, Krishna, and Panagariya,Trading Blocs, 1999, for a discussion regarding the issues brought about by free tradeagreements; and Baldwin, “The Causes of Regionalism,” 1997, for a counterpoint.
85If the United States applies uniform tariffs to all countries, it will import an item fromthe most efficient producer. However if it lowers tariffs through a free trade agreement toa country that is not an efficient producer, imports from that country will increase at theexpense of those from the efficient producer. This is called trade diversion.
82 CHAPTER 3 U.S. TRADE POLICY SINCE 1934
Trade Agreements in North America
The U.S.-Canada Free Trade Agreement, which entered into force in1989, was an important milestone in U.S. trade policy.86 It signaled arenewed U.S. interest in bilateral or regional free trade agreements, onethat had been largely absent from the trade policy agenda since the pre-World War II accords.87 Moreover, it implemented certain innovations,such as liberalization of financial services and a dispute-settlement process,ahead of the Uruguay Round negotiations. The agreement emerged fromCanada’s interest in greater access to the U.S. market and both countries’frustration with the multilateral process. It was hoped that the agreementwould spur the international community to a resolution of the UruguayRound.88 The U.S.-Canada agreement was formalized between the twocountries while talks were still ongoing at the multilateral level.
Soon after the U.S.-Canada Free Trade Agreement was signed, andpartly as a consequence, Mexico approached the United States for asimilar accord.89 As a result, the North American Free Trade Agreement(NAFTA), comprising the United States, Canada, and Mexico, was signedand entered into force in 1994.90 In many cases, tariffs on goods tradebetween NAFTA countries were lifted immediately, and others weregradually phased out. For example, U.S. restrictions on imports ofsugar were phased out over 15 years; Mexico received a tariff-free quotaallocation, which increased incrementally, and all restrictions on sugarwere finally eliminated at the beginning of 2008.91
At the same time, Mexico lowered its barriers to U.S. agriculturalproducts, reduced its restrictions on imports of automobiles, and applied
86A prior agreement, the 1965 U.S.-Canadian Automobile Agreement, was significant.It provided reciprocal duty-free access for newly manufactured automobiles and relatedparts between the United States and Canada. To qualify for duty-free treatment, NorthAmerican content of the automobiles had to be at least 50 percent, and Canada imposedcertain additional restrictions on manufacturers to ensure a minimum level of domesticproduction. Helmers, The United States-Canadian Automobile Agreement, 1967.
87The United States did sign two free trade agreements, with Israel in 1985 and withJordan in 2000 in which political considerations predominated, according to Rosen, “FreeTrade Agreements as Foreign Policy,” 2004, 53–55.
88Pearson, United States Trade Policy, 2004, 108.89Destler, American Trade Politics, 1995, 135.90The NAFTA Implementation Act was submitted to Congress on November 4,
1993. U.S. House of Representatives, Committee on Ways and Means, Overview andCompilation of U.S. Trade Statutes, 1995 ed., 199.
91Hearing transcript, January 8, 2009, 13 (testimony of Thomas Earley, Sweetener UsersAssociation).
HISTORY OF U.S. TRADE POLICY SINCE 1934 83
national treatment rules to foreign direct investment from the UnitedStates and Canada in services such as telecommunications and finance.92
To prevent circumvention of existing tariffs by other countries, the U.S.automobile and textile industries secured rules of origin requirements93
for their products.94 The rules of origin requirements for automobiles, forexample, required that 62.5 percent of a car’s production cost (calculatedaccording to specific formulas set out in the agreement) be produced withinthe free trade area to qualify for tariff-free entry into the United States.95
Within the United States, environmental organizations and organizedlabor strongly opposed NAFTA.96 Provisions safeguarding the interests oflabor and the environment were not incorporated into the main agreement.To address the opposition, the Clinton administration negotiated sideagreements on the environment, workers’ rights, and safeguards againstimport surges that were ultimately approved by Congress.
The Uruguay Round
Simultaneous with negotiations of the U.S.-Canada FTA and NAFTA,the United States also participated in trade negotiations in the UruguayRound (1986-93).97 The Uruguay Round agreement was concluded in late1993 and entered into force in January 1995. It is generally considered tohave been a highly beneficial agreement for the United States. This wasparticularly true for the agreements on services and intellectual propertyrights protection. U.S. negotiators, as well as observers, felt that it was
92Barton et al., The Evolution of the Trade Regime, 2006, 165.93Rules of origin requirements pertain to where a product is made and are important for
trade statistics and trade agreements. Because raw materials and parts may originate frommany points, determination of origin is not straightforward. Rules of origin requirementsin a free trade agreement may grant preferential tariff treatment to goods made wholly orin part in the beneficiary country or group of countries.
94Destler, American Trade Politics, 1995, 219.95Ibid., 227.96In addition to these well defined groups, there was a more general trepidation about
NAFTA; large segments of the middle class were worried by NAFTA’s potential effect onjobs. Destler, American Trade Politics, 1995, 223. This was manifested most strongly byRoss Perot’s surprising third-party candidacy in the 1992 presidential elections.
97The Omnibus Trade and Competitiveness Act of 1988 provided the Presidentwith the authority to enter into trade agreements before June 1, 1993, subject toimplementation under special “fast track” Congressional approval procedures. U.S. Houseof Representatives, Committee on Ways and Means, Overview and Compilation of U.S.Trade Statutes, 1993 ed., 162.
84 CHAPTER 3 U.S. TRADE POLICY SINCE 1934
in the interest of the United States to open foreign markets for servicesas it had a comparative advantage in several services sectors98 and hadsignificant growth potential in the export of services trade, particularly inthe areas that employed highly skilled labor.99 The lack of intellectualproperty rights abroad prior to the Uruguay Round was estimated to bevery costly to the United States; by one estimate, U.S. firms lost revenuesof $23.8 billion due to inadequate intellectual property rights protection.100
In addition to another round of tariff cuts, which reduced industrializedcountry tariffs by 38 percent,101 the Uruguay Round extended prior gainsin certain nontariff measures and expanded the range of topics negotiatedin a multilateral setting, most significantly trade in services and certainpolitically sensitive domestic regulatory issues. The Uruguay Roundalso established more robust multilateral administrative structures fornegotiations and trade policy review, and its dispute resolution systemprovided a stronger enforcement mechanism.
The Uruguay Round’s most obvious structural achievement was theestablishment of the WTO (in the Marrakech Agreement of 1994), aformal international organization that took the place of the ad hoc GATTadministration that had been set up after it had become clear that the ITOagreement would not be implemented.102
The second accomplishment of the Uruguay Round was the consolida-tion of the gains from prior rounds of negotiation.103 New tariff bindingswere added. Most of the voluntary codes of the Tokyo Round (ruleson import licensing; antidumping duties, subsidies, and countervailingmeasures; customs valuation methods; and standards on health, safety, and
98Hoekman and Kostecki, The Political Economy of the World Trading System, 237.99Congressional Budget Office, The GATT Negotiations and U.S. Trade Policy, 1987,
17.100USITC, Foreign Protection of Intellectual Property Rights and the Effect on U.S.
Industry and Trade, 1988, 4-3.101Jackson, The World Trading System, 1997, 74.102Countries were no longer able to “opt out” of agreements with which they did not
agree, as was the case during the Tokyo Round negotiations for nontariff measures. Onthe other hand, the possibility that fewer agreements will be reached is greater because anagreement requires a commitment by each member. Hoekman and Kostecki, The PoliticalEconomy of the World Trading System, 2001, 1.
103A detailed explanation of the WTO and the GATT in the context of the WTO is foundin Hoekman and Kostecki, The Political Economy of the World Trading System, 2001, 9–73.The following discussion summarizes some of their main points.
HISTORY OF U.S. TRADE POLICY SINCE 1934 85
consumer protection, among others) were amended, incorporated into themain body of the agreement, and made mandatory.104
The Uruguay Round also provided for the phase out, over a 10-yearperiod, of quotas on textiles and apparel, nearly half a century after aframework for their imposition was first implemented. The ATC, whichreplaced the MFA, phased out the textile quota system in four stages: by16 percent (by volume of imports) upon entry into force of the agreement,by an additional 17 percent within the first three years, a further 18 percentwithin seven years, and the rest by 2005. The agreement did not, however,mandate lowering tariffs on textiles and apparel.105
Finally, the scope of negotiations was expanded. This included majorstrides forward on trade liberalization with the General Agreement onTrade in Services (GATS), the Agreement on Trade Related Aspects ofIntellectual Property Rights (TRIPS), Trade Related Investment Measures(TRIMs), and the Agreement on Agriculture. Each of these broke newtopical ground at the multilateral level and increased the reach of tradenegotiations beyond the borders of countries and into their domesticgovernance structure.
The GATS addressed, for the first time in a multilateral setting, theopening of trade in services. Services present a unique set of challengesto trade negotiators, as their nonphysical and highly heterogeneous naturemakes them more difficult than goods to count and assess for tariffs.106
The obligations, subscribed to by all members, extended MFN princi-ples to services, with temporary exceptions made for preexisting freetrade agreements. In addition, member countries subscribed to sector-specific commitments, separated into national treatment and market accesscommitments. National treatment requires countries to treat foreign anddomestic firms equally under the law. Market access requires countries topermit both domestic and foreign firms to compete in a market. Restricted
104A few of the Tokyo Round codes were appended as plurilateral agreements; that is,they remained binding only on those that had previously committed to them. These werein the areas of government procurement, civil aircraft, select bovine products, and milkproducts. The agreements on the latter two were terminated in 1997 and are now covered bythe Sanitary and Phytosanitary agreement. WTO, “Sanitary and Phytosanitary Measures,”undated (accessed December 9, 2008).
105The sector reportedly continues to face high U.S. import tariffs and complex rules oforigin requirements. USITC, Hearing transcript, January 8, 2009, 7 (testimony of BrendaJacobs, Esquire, Sidley Austin LLP on behalf of U.S. Association of Importers of Textilesand Apparel).
106Hoekman, “Liberalizing Trade in Services,” 2006, 10–12.
86 CHAPTER 3 U.S. TRADE POLICY SINCE 1934
market access tends to be a particular problem in services, as it includessectors such as telecommunications and transportation that are frequentlymonopolies or restricted to a few firms.
The TRIPS Agreement dealt with intellectual property rights, the firsttime the international community sought to require governments to enforceinternational laws regarding intellectual property.107 The agreement in-cluded protection of copyrights, trademarks, patents, geographic indicatorsand certain other trade secrets.
TRIMs extended to foreign direct investment the GATT principle ofnational treatment of goods and the GATT rules limiting the use of quanti-tative restrictions.108 Resistance to addressing investment measures meantthat the resulting agreement was limited to rules on foreign investment inthe manufacture of goods, rather than including broader commitments oninvestment in services.109
The Agreement on Agriculture addressed, among other issues, sub-sidies and quotas on agricultural goods. Developed countries committedto reduce export subsidies by 21 percent by volume and 36 percent byvalue by 2000, while developing countries committed to reductions of14 percent by volume and 24 percent by value by 2004. Developedcountries also agreed to expand market access by 36 percent by 2000,while developing countries committed to expand market access by 15percent by 2000. Nontariff measures, including quotas, were convertedinto equivalent tariffs, and the United States and other countries introducedtwo-tiered tariff rate quotas (TRQs) that allowed limited imports at lowtariff rates and unlimited imports at higher rates. The point where the hightariff is first applied is referred to as the quota point, and the TRQs areusually designed so that only minimal imports enter at the high rate.110
Domestically, the Uruguay Round agreement proved less controversialfor the United States than NAFTA for several reasons. First, although thestructure was different, the legal implications—in particular, sovereigntyover trade issues—were not materially more onerous than the prior GATTcommitments.111 Second, much of the new agreement, such as the
107Ibid., 126.108Hoekman and Kostecki, The Political Economy of the World Trading System, 2001,
202.109Ibid., 202–03; also found in the WTO TRIMs Agreement.110WTO, “Agriculture: Fairer Markets for Farmers,” undated (accessed January 2, 2009).111Hoekman and Kostecki, The Political Economy of the World Trading System, 2001,
49.
HISTORY OF U.S. TRADE POLICY SINCE 1934 87
intellectual property and services agreements, was perceived to benefit theUnited States. The arrangement on intellectual property in particular wasinstrumental in obtaining U.S. support for the Uruguay Round, and in-dustry groups reliant on intellectual property protection—pharmaceuticals,software, semiconductors, and entertainment, in particular—were verysupportive.112 Labor and environmental groups remained opposed, butthis time free-trade supporters were more numerous and vocal than withNAFTA. Third, the round created a binding dispute settlement system,which was especially important to the United States. The Uruguay RoundAgreements Act passed the U.S. Congress and entered into force one yearafter NAFTA, in January 1995.
Fast track authority lapsed in 1993; the ensuing decade saw only theU.S.-Jordan FTA signed into law in 2001. Fast track authority was renewedunder the name trade promotion authority in the Trade Act of 2002, whenlanguage about the importance of labor and environmental standards wasplaced in the act as a result of the debate over these issues that aroseduring the approval of NAFTA.113 Under trade promotion authority of theTrade Act of 2002, President Bush signed into law eight bilateral tradeagreements and a regional free trade agreement with Central Americancountries (table 3.2). Trade promotion authority expired in 2007 and hasnot been reauthorized at the time of this report.114
The Doha Development Agenda
The current round of multilateral negotiations, the Doha DevelopmentAgenda (DDA or “Doha Round”) remains unfinished. The DDA was initi-ated at the Fourth Ministerial Conference of the World Trade Organizationin 2001. The declared development objectives, as suggested by its title,and the prominent role taken by developing countries are the new featuresof this round of negotiations.115 Many developing countries believe thatthe Uruguay Round disproportionately benefited the developed world.116
Developing countries believed that the issue of subsidized agriculturalcommodities in developed countries, which compete with exports from
112Chorev, Remaking U.S. Trade Policy, 2007, 159.113Ibid., 185.114See table F.1 for details on the successfully concluded agreements and their economic
effects.115Hoekman, “Strengthening the Global Trade Architecture,” 2002, 13.116Mehta, “The Doha Development Agenda,” 2003, 11.
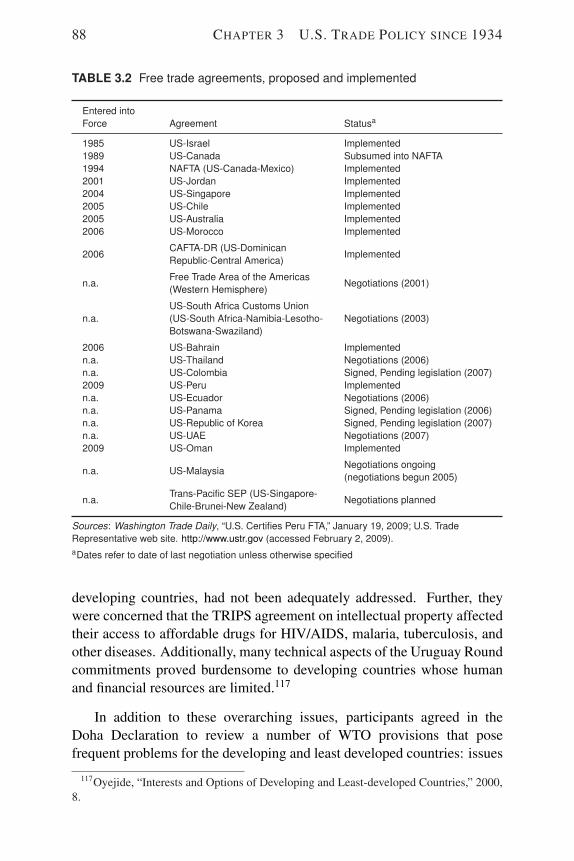
88 CHAPTER 3 U.S. TRADE POLICY SINCE 1934
TABLE 3.2 Free trade agreements, proposed and implemented
Entered intoForce Agreement Statusa
1985 US-Israel Implemented1989 US-Canada Subsumed into NAFTA1994 NAFTA (US-Canada-Mexico) Implemented2001 US-Jordan Implemented2004 US-Singapore Implemented2005 US-Chile Implemented2005 US-Australia Implemented2006 US-Morocco Implemented
2006CAFTA-DR (US-Dominican
ImplementedRepublic-Central America)
n.a.Free Trade Area of the Americas
Negotiations (2001)(Western Hemisphere)
n.a.US-South Africa Customs Union
Negotiations (2003)(US-South Africa-Namibia-Lesotho-Botswana-Swaziland)
2006 US-Bahrain Implementedn.a. US-Thailand Negotiations (2006)n.a. US-Colombia Signed, Pending legislation (2007)2009 US-Peru Implementedn.a. US-Ecuador Negotiations (2006)n.a. US-Panama Signed, Pending legislation (2006)n.a. US-Republic of Korea Signed, Pending legislation (2007)n.a. US-UAE Negotiations (2007)2009 US-Oman Implemented
n.a. US-MalaysiaNegotiations ongoing(negotiations begun 2005)
n.a.Trans-Pacific SEP (US-Singapore-
Negotiations plannedChile-Brunei-New Zealand)
Sources: Washington Trade Daily, “U.S. Certifies Peru FTA,” January 19, 2009; U.S. TradeRepresentative web site. http://www.ustr.gov (accessed February 2, 2009).aDates refer to date of last negotiation unless otherwise specified
developing countries, had not been adequately addressed. Further, theywere concerned that the TRIPS agreement on intellectual property affectedtheir access to affordable drugs for HIV/AIDS, malaria, tuberculosis, andother diseases. Additionally, many technical aspects of the Uruguay Roundcommitments proved burdensome to developing countries whose humanand financial resources are limited.117
In addition to these overarching issues, participants agreed in theDoha Declaration to review a number of WTO provisions that posefrequent problems for the developing and least developed countries: issues
117Oyejide, “Interests and Options of Developing and Least-developed Countries,” 2000,8.
THE ECONOMIC EFFECTS OF TRADE LIBERALIZATION 89
concerning trade, debt, and finance; trade and the transfer of technology;technical cooperation and capacity building; and WTO provisions concern-ing special and differential treatment.
Negotiations in the DDA reached an impasse in July 2008; theproximate cause was a stalemate over special safeguards on agriculturalimports between a group including India, China, and other developingcountries and another group composed primarily of developed countries.118
The proposal on offer included a provision for a tariff increase of up to 15percent for an import “surge” (defined as a 40 percent increase in importsover the average of the previous three years). The tariff was to be applicableto only 2.5 percent of tariff lines. Developing countries countered with anoffer of a 30 percent tariff increase on up to 7 percent of tariff lines.119 Theissue could not be resolved, and negotiations were eventually suspended.
The Economic Effects of Trade Liberalization
This section summarizes the existing economic literature on trade withan emphasis on the quantitative assessments of trade policy over time.This literature suggests that the benefits of trade liberalization have beensignificant, although the size of the gains and the methods of analysis havechanged over time.
In the early years, both trade negotiations and the economic analysisof trade policies focused heavily on tariffs, with minimal emphasis onnontariff barriers. There is general agreement in the economic literaturethat the United States benefited as tariff barriers were lowered. Gains fromtrade were greater than the costs even after taking into consideration thelosses experienced by import-competing segments of the economy. TheTokyo Round (1973–79) was the first round to produce agreements onnontariff measures. Economic analysis during this period took on the newtask of attempting to compute the effects of these less easily quantifiedreductions in nontariff measures. To the extent that researchers have beenable to quantify these effects, their results suggest a significant increase inwelfare, compared with tariff-only liberalization.
The economic literature on trade has evolved at least as much as thesubject it examines. At the beginning of the period under examination, the
118Baldwin, “Resolving the Conflict,” September 25, 2008.119The proposal details are cited in Baldwin, “Resolving the Conflict,” 2008.
90 CHAPTER 3 U.S. TRADE POLICY SINCE 1934
economic literature was confined to highly abstract representations of theeconomy and had put forth only a limited number of theories to explainpatterns of international trade. The lack of detail meant that quantitativeassessments of trade policy were at best suggestive; indeed there were fewattempts at quantitative analysis. In contrast, models in the current era canbe enormous, complex, and require more computational power than waspreviously available.
This evolution in the literature has been driven by a number oftrends. First, the economic literature pertaining to trade was relativelyunderdeveloped in 1934; formal mathematical analysis in the field wasnot the norm. Second, even if theories were articulated in a mathematicalframework, models remained simple and had to be solved analyticallyrather than computationally, which limited the number of details that couldbe addressed. Over time computing power grew, and economists tookadvantage by constructing more computationally intensive models withmany sectors and goods. The economic literature also responded to newobservations in the trade data. For example, early theory suggested thata country would export those goods that it produces most efficiently andimport those that it produces least efficiently. However, trade data showedthat countries import and export the same types of goods. For instance, theUnited States both imports and exports automobiles. New hypotheses wereposited to explain this behavior. Finally, the literature evolved to addressissues of trade policy. For example, the Tokyo Round (1973–79) was thefirst round to include nontariff measures, and contemporary economiststook on the task of estimating the effects of policy changes in nontariffbarriers.
International trade is a dynamic field of research, and recently therehas been a considerable increase in theoretical work. Theories are stillbeing tested and modified, and researchers are grappling with technicalissues that arise when applying theories to obtain quantitative results.For example, the theory of product variety proposes that individuals havepreferences for a large number of goods and that the improved access tovariety made possible by increased trade improves welfare. Applying theseideas requires determining (or assuming) a great deal about individuals’preferences for a large number of goods (i.e. elasticities of substitutionacross goods).120 Yet, controversy and uncertainty about the details ofthe approach remain. Another difficulty faced by researchers, one that is
120This has been the subject of some recent research. See, for example, Broda andWeinstein, “Globalization and the Gains from Variety,” 2006.
THE ECONOMIC EFFECTS OF TRADE LIBERALIZATION 91
particularly problematic for the analysis of services, is the lack of adequatedata.121 The following section is divided into two parts. The first brieflysummarizes the types of assumptions and explanations currently prevalentin economic analysis. The second part proceeds chronologically throughthe empirical literature and summarizes the findings.
Approaches in the Literature
Evaluating trade policies requires that assumptions be made regardingthe channels through which these policies affect the economy, as well asassumptions regarding the underlying economy itself. The assumptionsselected can have significant consequences on the quantitative assessmentof trade policy. For example, current estimates of the U.S. welfare effectsof trade liberalization vary widely, from a fraction of a percent of GDP toas much as 13 percent, depending on the treatment of services, nontariffmeasures and other modeling specifications.
Table 3.3 provides some examples of these assumptions and ap-proaches and their effects on welfare outcomes. A note of caution mustbe sounded regarding this table in that it should be seen as a rule of thumbonly. The effects of the assumptions and approaches on welfare gains doindeed reflect the results of the majority of empirical studies; however,not all studies fall in line with these generalizations. Until recently,applied trade policy analysis was concentrated on elements of the left-hand column of table 3.3, which led to relatively modest estimates of gainsfrom liberalization. As new models gain acceptance, assumptions fromthe right-hand column are increasingly being used. These tend to result inrelatively larger gains from trade liberalization although newer models andtechniques do not universally show greater effects from trade liberalization.More practically but equally important, estimates change as computingpower and data availability improve. As a result of these changing factors,comparing model results across time periods can be difficult unless thosefactors are controlled for.
Partial versus full liberalization. Full liberalization, the elimination ofall trade barriers, is rarely if ever achieved in practice, but it is sometimesused in quantitative analysis in order to compare policies or countries’
121See, for example, Francois, Hoekman, and Woerz, “Does Gravity Apply toIntangibles?” 2007.
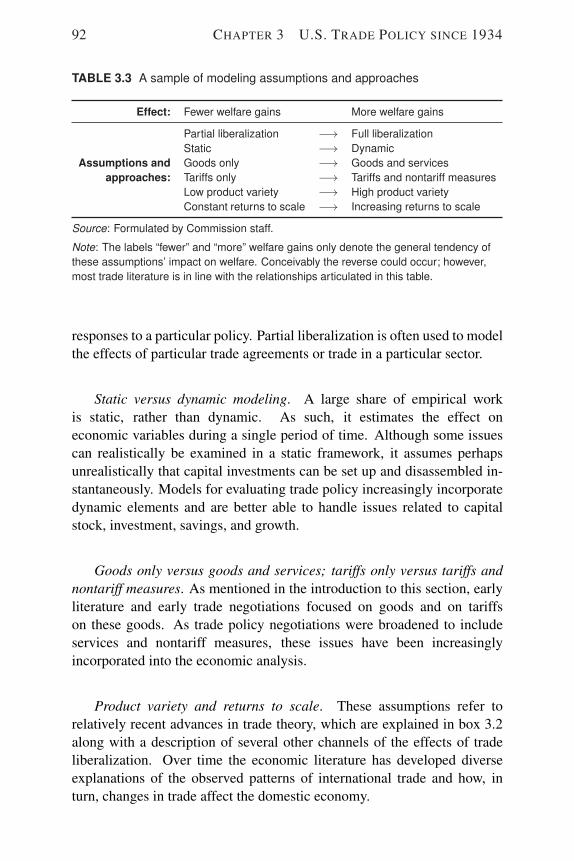
92 CHAPTER 3 U.S. TRADE POLICY SINCE 1934
TABLE 3.3 A sample of modeling assumptions and approaches
Effect: Fewer welfare gains More welfare gains
Partial liberalization −→ Full liberalizationStatic −→ Dynamic
Assumptions and Goods only −→ Goods and servicesapproaches: Tariffs only −→ Tariffs and nontariff measures
Low product variety −→ High product varietyConstant returns to scale −→ Increasing returns to scale
Source: Formulated by Commission staff.
Note: The labels “fewer” and “more” welfare gains only denote the general tendency ofthese assumptions’ impact on welfare. Conceivably the reverse could occur; however,most trade literature is in line with the relationships articulated in this table.
responses to a particular policy. Partial liberalization is often used to modelthe effects of particular trade agreements or trade in a particular sector.
Static versus dynamic modeling. A large share of empirical workis static, rather than dynamic. As such, it estimates the effect oneconomic variables during a single period of time. Although some issuescan realistically be examined in a static framework, it assumes perhapsunrealistically that capital investments can be set up and disassembled in-stantaneously. Models for evaluating trade policy increasingly incorporatedynamic elements and are better able to handle issues related to capitalstock, investment, savings, and growth.
Goods only versus goods and services; tariffs only versus tariffs andnontariff measures. As mentioned in the introduction to this section, earlyliterature and early trade negotiations focused on goods and on tariffson these goods. As trade policy negotiations were broadened to includeservices and nontariff measures, these issues have been increasinglyincorporated into the economic analysis.
Product variety and returns to scale. These assumptions refer torelatively recent advances in trade theory, which are explained in box 3.2along with a description of several other channels of the effects of tradeliberalization. Over time the economic literature has developed diverseexplanations of the observed patterns of international trade and how, inturn, changes in trade affect the domestic economy.
THE ECONOMIC EFFECTS OF TRADE LIBERALIZATION 93
Survey of Economic Literature
Examining the literature chronologically, three major periods emerge:the pre-Tokyo Round literature, the early computational literature, andthe recent complex and computationally intensive literature. The first isprimarily based on small models applying the classic gains from trade(or comparative advantage) literature to the liberalization questions of thetime. With some exceptions, the literature tends to apply theory to con-temporaneous problems rather than examining issues retrospectively.122
The second era saw the development of large-scale computer models withdetailed modeling of country- and sector-specific attributes. The thirdwave of literature combines the computational approaches with increasinginnovation in the economic literature of the channels through which tradeliberalization affects economies. Further, it increasingly incorporatesliberalization of the services sector. Box 3.3 explains some key issuesrelated to tariff data upon which many studies are based.
There are two general approaches to applied economic policy anal-ysis. The first is simulation of proposed changes in trade policy (oftenusing computable general equilibrium models), while the other involveseconometrically estimating a set of variables from historical or currentdata to explain changes in trade. The approaches are not exclusive, asthe parameters of a simulation model may be estimated econometrically,or work that is primarily econometric could be based on a model that isused for simulations.
Early Literature
There are only a few quantitative assessments of the effects of tradebarriers before World War II. Indeed, quantitative assessments remainscarce until the Kennedy Round (1964–67) for the reasons outlined in theintroduction to this section. The findings of these quantitative studies varysubstantially and are only suggestive of the effects of trade liberalization.
Irwin quantitatively examined tariff liberalization and its welfare ef-fects from the Civil War through 1961, just prior to the Kennedy Round.123
122Even with an ambitious researcher applying current methods to prior periods, newermethods are frequently more data-intensive and require data that were not collected in prioreras.
123Irwin, “Trade Restrictiveness,” 2007.
94 CHAPTER 3 U.S. TRADE POLICY SINCE 1934
BOX 3.2 Channels of the effects of trade liberalization
The theoretical literature forms the underpinnings of applied work. It also showsthe number of channels through which trade (and by extension trade barriers)affects an economy, including gains from trade, demand for variety, and productivityimprovements.
The classical benefits from trade liberalization result from comparative advantage,first articulated by David Ricardo in the early 19th century. In a two-good, two-countrymodel, the idea that a country that can produce a good with fewer resources or ata lower cost than another country will gain from specializing in the export of thatcommodity is fairly intuitive. However, two countries can still both gain from tradeeven when one of the countries can produce both goods more efficiently than theother country, if one of the countries produces one of the goods more efficientlythan the other good. Ricardo’s explanation was based on differences in technology,which allow one country to produce a certain good more efficiently than the othercountry. Similar results can be obtained when two countries have different factorendowments (i.e., land, labor, and capital).a
Recent work has built upon this foundation. The newer work takes the fundamentalprinciple of Ricardo, the differences in technology across countries, and generalizesit to a multicountry model with a more general structure encompassing differences intechnology across countries.b
Krugman introduced a different line of research, which analyzed the trade benefitsthat are achieved through greater variety. He noted that an individual obtainsgreater enjoyment from consuming a variety of, say, different automobiles thanbeing confined to domestically produced varieties, even when the total quantity ofautomobiles purchased remains the same.c In this model, countries are assumedto produce different varieties of goods; therefore, even two countries with the sameendowments and technology will want to trade with each other, unlike in the earlier,classical benefits literature. This provides an explanation for the prevalence ofintra-industry trade, for example why the United States both imports and exportsfruit. Individuals in both countries benefit both from lower prices and from anincrease in the available varieties of products.d
Trade liberalization can also improve a country’s welfare by increasing firmproductivity. This can occur in a variety of ways. One such way is via technologicaldiffusion, the movement of technological know-how across borders in a way thatbenefits the importing country. This may occur directly via a transfer of researchand development from one country to another, as in Grossman and Helpman.e
Alternatively, as in Eaton and Kortum,f the technological know-how may beembodied in intermediate and capital goods that are imported from abroad and thenused to produce another good domestically.
THE ECONOMIC EFFECTS OF TRADE LIBERALIZATION 95
BOX 3.2 Channels of the effects of trade liberalization, continued
Broader-based productivity gains may result from trade liberalization. A set ofpapers, originating with Melitz,g deals with productivity in the face of competition.When a country has many firms, each with its own level of productivity, the papershypothesize that the least-productive ones will go out of business when the countryopens itself up to foreign competition. Domestic productivity, as an average of theremaining firms, rises as a result, although there will be some negative distributionaleffects for the firms that go out of business.
Another productivity improvement can be seen through increasing-returns-to-scalefirms (or firms that require very large markets to operate efficiently). Certainindustries (for example, aircraft manufacturing) have enormous start-up costs, andsuch industries require large markets to recoup their investment. Reducing tradebarriers allows such firms to access international markets and sell more products,thereby increasing the firms’ per-unit productivity. Although unusual, potentialnegative effects could occur, for example if such a firm overtakes a foreign market,drives out local firms, and then uses its monopoly power to raise prices and lowerproduction.
Another potential benefit of trade liberalization is the procompetitive effect. Whena firm within a country has monopoly power, it will choose to sell fewer goods atpremium prices. The result is a loss in welfare to the country as a whole, althoughthe monopoly itself gains. Opening up to trade will allow competition into the industryand force the domestic firm to behave in a more competitive manner, improving thecountry’s overall welfare.
—————aMore detailed explanations of this literature can be found in textbooks oninternational economics; for example, Caves, Frankel, and Jones, World Trade andPayments, 2002; and Krugman, “Ricardo’s Difficult Idea,” 1996 (accessed April 20,2009).bEaton and Kortum “Technology, Geography, and Trade,” 2002.cKrugman, “Increasing Returns,” 1979; Krugman, “Scale Economies,” 1980.dThis is obtained from the assumptions in the paper regarding increasing returns toscale and monopolistic competition.eGrossman and Helpman, “Technology and Trade,” 1995.fEaton and Kortum, “Trade in Capital Goods,” 2001.gMelitz, “The Impact of Trade,” 2003.
96 CHAPTER 3 U.S. TRADE POLICY SINCE 1934
BOX 3.3 Summary statistics for tariffs
Assessing the size of tariff barriers can be done in a variety of ways. Many statisticshave been created to summarize the size of tariff barriers, each with its ownstrengths and weaknesses. A trade-weighted average takes the average of all tariffrates imposed on imports, weighted by the value of the goods imported in eachcategory. The advantage of this measure is that it gives the precise amount of tariffsactually collected and correctly accounts for high-value items. The disadvantageis that prohibitively high tariffs will not be recorded by the measure because nogoods subject to that tariff will be traded. Trade in goods with high tariffs will belimited and therefore result in an underrepresentation of the degree of restrictiveness.
Simple average tariffs take the unweighted average of all tariffs. The advantage isthat changes in policy will be reflected in changes in the index; the disadvantage isthat changes to a low-volume good with a small economic impact will have the sameeffect as changes to a high-volume good with significant effects on the economy.
Anderson and Neary propose an explicitly welfare-driven measure, the TradeRestrictiveness Index (TRI).a The TRI is a direct computation of the effect on welfareof import tariffs in a general equilibrium framework. They compute the loss of welfarefrom current tariff levels and then compute the uniform tariff equivalent—the tariffrate that would need to be applied uniformly to all goods in order to obtain the samewelfare loss. This has the advantage of being the correct theoretical measure toexamine, but it is computationally intensive to calculate and relies on various modelassumptions, including elasticities of substitution among goods.
Finally, there is a range of rates that may be used. GATT and WTO negotiationscenter on “bound rates” for tariff lines, which are the upper bounds for tariffs thathave been committed to by a country. A country may choose to levy a tariff ratebelow the bound rate—the “applied rate”—but not above it. A tariff average basedon bound rates is useful for measuring progress in negotiations, whereas the appliedrate is more useful for quantifying effects on an economy.
—————aAnderson and Neary, “A New Approach to Measuring Trade Policy,” 1996.
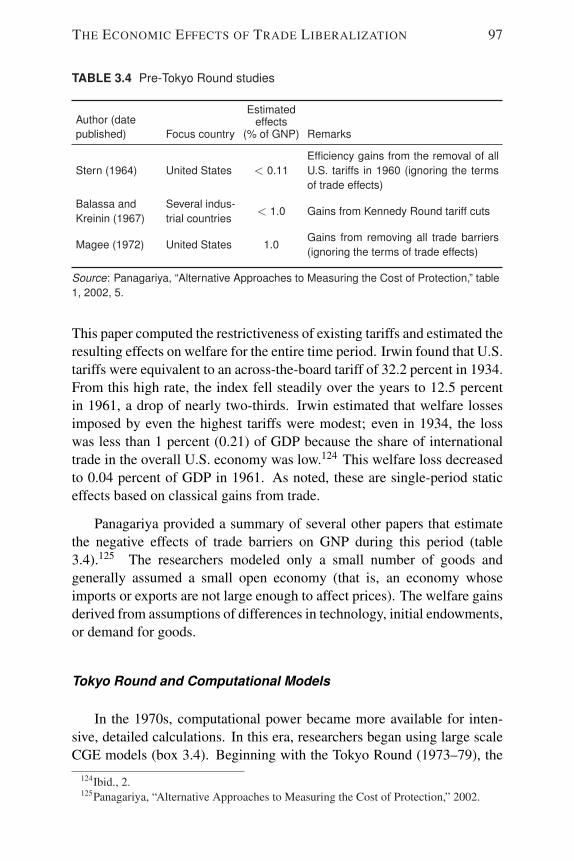
THE ECONOMIC EFFECTS OF TRADE LIBERALIZATION 97
TABLE 3.4 Pre-Tokyo Round studies
Author (datepublished) Focus country
Estimatedeffects
(% of GNP) Remarks
Stern (1964) United States < 0.11Efficiency gains from the removal of allU.S. tariffs in 1960 (ignoring the termsof trade effects)
Balassa and Several indus-< 1.0 Gains from Kennedy Round tariff cuts
Kreinin (1967) trial countries
Magee (1972) United States 1.0Gains from removing all trade barriers(ignoring the terms of trade effects)
Source: Panagariya, “Alternative Approaches to Measuring the Cost of Protection,” table1, 2002, 5.
This paper computed the restrictiveness of existing tariffs and estimated theresulting effects on welfare for the entire time period. Irwin found that U.S.tariffs were equivalent to an across-the-board tariff of 32.2 percent in 1934.From this high rate, the index fell steadily over the years to 12.5 percentin 1961, a drop of nearly two-thirds. Irwin estimated that welfare lossesimposed by even the highest tariffs were modest; even in 1934, the losswas less than 1 percent (0.21) of GDP because the share of internationaltrade in the overall U.S. economy was low.124 This welfare loss decreasedto 0.04 percent of GDP in 1961. As noted, these are single-period staticeffects based on classical gains from trade.
Panagariya provided a summary of several other papers that estimatethe negative effects of trade barriers on GNP during this period (table3.4).125 The researchers modeled only a small number of goods andgenerally assumed a small open economy (that is, an economy whoseimports or exports are not large enough to affect prices). The welfare gainsderived from assumptions of differences in technology, initial endowments,or demand for goods.
Tokyo Round and Computational Models
In the 1970s, computational power became more available for inten-sive, detailed calculations. In this era, researchers began using large scaleCGE models (box 3.4). Beginning with the Tokyo Round (1973–79), the
124Ibid., 2.125Panagariya, “Alternative Approaches to Measuring the Cost of Protection,” 2002.
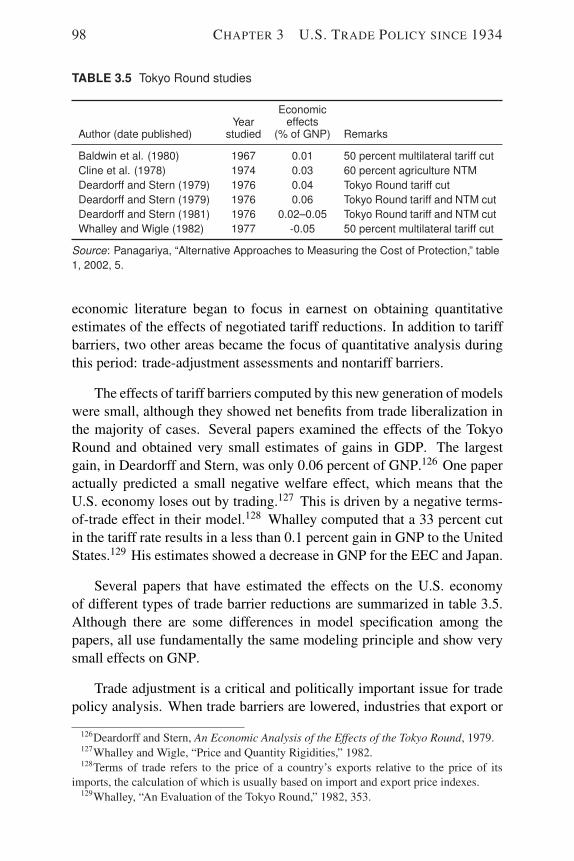
98 CHAPTER 3 U.S. TRADE POLICY SINCE 1934
TABLE 3.5 Tokyo Round studies
Author (date published)Year
studied
Economiceffects
(% of GNP) Remarks
Baldwin et al. (1980) 1967 0.01 50 percent multilateral tariff cutCline et al. (1978) 1974 0.03 60 percent agriculture NTMDeardorff and Stern (1979) 1976 0.04 Tokyo Round tariff cutDeardorff and Stern (1979) 1976 0.06 Tokyo Round tariff and NTM cutDeardorff and Stern (1981) 1976 0.02–0.05 Tokyo Round tariff and NTM cutWhalley and Wigle (1982) 1977 -0.05 50 percent multilateral tariff cut
Source: Panagariya, “Alternative Approaches to Measuring the Cost of Protection,” table1, 2002, 5.
economic literature began to focus in earnest on obtaining quantitativeestimates of the effects of negotiated tariff reductions. In addition to tariffbarriers, two other areas became the focus of quantitative analysis duringthis period: trade-adjustment assessments and nontariff barriers.
The effects of tariff barriers computed by this new generation of modelswere small, although they showed net benefits from trade liberalization inthe majority of cases. Several papers examined the effects of the TokyoRound and obtained very small estimates of gains in GDP. The largestgain, in Deardorff and Stern, was only 0.06 percent of GNP.126 One paperactually predicted a small negative welfare effect, which means that theU.S. economy loses out by trading.127 This is driven by a negative terms-of-trade effect in their model.128 Whalley computed that a 33 percent cutin the tariff rate results in a less than 0.1 percent gain in GNP to the UnitedStates.129 His estimates showed a decrease in GNP for the EEC and Japan.
Several papers that have estimated the effects on the U.S. economyof different types of trade barrier reductions are summarized in table 3.5.Although there are some differences in model specification among thepapers, all use fundamentally the same modeling principle and show verysmall effects on GNP.
Trade adjustment is a critical and politically important issue for tradepolicy analysis. When trade barriers are lowered, industries that export or
126Deardorff and Stern, An Economic Analysis of the Effects of the Tokyo Round, 1979.127Whalley and Wigle, “Price and Quantity Rigidities,” 1982.128Terms of trade refers to the price of a country’s exports relative to the price of its
imports, the calculation of which is usually based on import and export price indexes.129Whalley, “An Evaluation of the Tokyo Round,” 1982, 353.
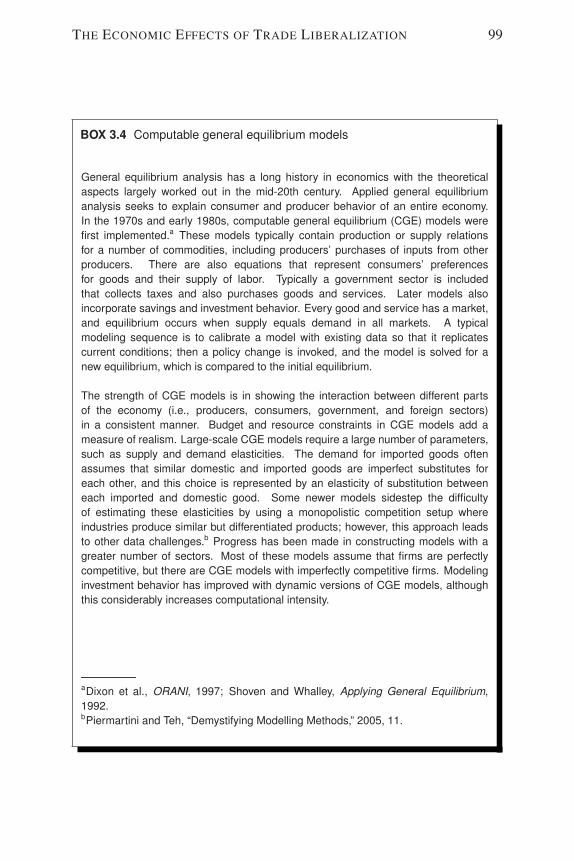
THE ECONOMIC EFFECTS OF TRADE LIBERALIZATION 99
BOX 3.4 Computable general equilibrium models
General equilibrium analysis has a long history in economics with the theoreticalaspects largely worked out in the mid-20th century. Applied general equilibriumanalysis seeks to explain consumer and producer behavior of an entire economy.In the 1970s and early 1980s, computable general equilibrium (CGE) models werefirst implemented.a These models typically contain production or supply relationsfor a number of commodities, including producers’ purchases of inputs from otherproducers. There are also equations that represent consumers’ preferencesfor goods and their supply of labor. Typically a government sector is includedthat collects taxes and also purchases goods and services. Later models alsoincorporate savings and investment behavior. Every good and service has a market,and equilibrium occurs when supply equals demand in all markets. A typicalmodeling sequence is to calibrate a model with existing data so that it replicatescurrent conditions; then a policy change is invoked, and the model is solved for anew equilibrium, which is compared to the initial equilibrium.
The strength of CGE models is in showing the interaction between different partsof the economy (i.e., producers, consumers, government, and foreign sectors)in a consistent manner. Budget and resource constraints in CGE models add ameasure of realism. Large-scale CGE models require a large number of parameters,such as supply and demand elasticities. The demand for imported goods oftenassumes that similar domestic and imported goods are imperfect substitutes foreach other, and this choice is represented by an elasticity of substitution betweeneach imported and domestic good. Some newer models sidestep the difficultyof estimating these elasticities by using a monopolistic competition setup whereindustries produce similar but differentiated products; however, this approach leadsto other data challenges.b Progress has been made in constructing models with agreater number of sectors. Most of these models assume that firms are perfectlycompetitive, but there are CGE models with imperfectly competitive firms. Modelinginvestment behavior has improved with dynamic versions of CGE models, althoughthis considerably increases computational intensity.
—————aDixon et al., ORANI, 1997; Shoven and Whalley, Applying General Equilibrium,1992.bPiermartini and Teh, “Demystifying Modelling Methods,” 2005, 11.
100 CHAPTER 3 U.S. TRADE POLICY SINCE 1934
that use imported inputs are likely to grow via increased export demand orreduced production costs. Industries that compete with imports will likelywitness a decline as foreign goods become relatively more competitive.The transition to this new equilibrium where some industries are largerand others smaller is not instantaneous, but the adjustment costs of movingto the new equilibrium are predicted to be smaller than the positive benefitsfrom freer trade to the country. There are effectively two types of negativeeffects. One is the immediate loss of jobs and wages; the second is the needto revamp factories, or make other changes to the capital structure, and toretrain workers. This is costly, as resources are required for retraining, andsome existing capital goods may be useless in a new industry. Becauseadjustment costs tend to be small relative to the benefits, income transfersare possible, so that everyone can be made better off through liberalization.
Several papers have computed these adjustment costs for the TokyoRound. Baldwin, Mutti, and Richardson calculated that 50 percentmultilateral cuts in tariffs would lead to labor adjustment costs of $3million (1967 dollars) and capital adjustment costs of $2.3 million versusan approximate consumer surplus gain of $610 million.130 Despitethe overall benefit, difficulties occur because these costs tend to beconcentrated either geographically or within an industry; five negativelyaffected industries were projected to lose more than 10 percent of theirworkforce.131 Baldwin reviewed several other contemporary studies ofadjustment costs.132 He cited Mutti’s 1977 estimate that there is roughly$1.30 in benefits for every $1 in adjustment costs. Other values are muchhigher: a 28-to-1 ratio from Baldwin and an 8-to-1 ratio from Cline.
Reforms of the Tokyo Round were also estimated to have a netpositive effect on employment. Deardorff and Stern calculated that theUnited States would gain approximately 15,000 jobs, or a 0.02 percent netincrease in the labor force as a result of Tokyo Round reforms.133 Thisfigure includes sectors with net job losses as well as sectors with net jobgains.134 Industrialized nations as a whole were projected to see a netgain of 134,000 jobs due to the Tokyo Round agreement. In making theseestimates, Deardorff and Stern included liberalization of a few nontariffbarriers, such as quotas and restrictions on government procurement.
130Baldwin, Mutti, and Richardson, “Welfare Effects on the United States,” 1980.131Ibid., 419.132Baldwin, “Trade Policies in Developed Countries,” 1984b, 593.133Deardorff and Stern, An Economic Analysis of the Effects of the Tokyo Round, 1979.134Ibid., V, table 1.
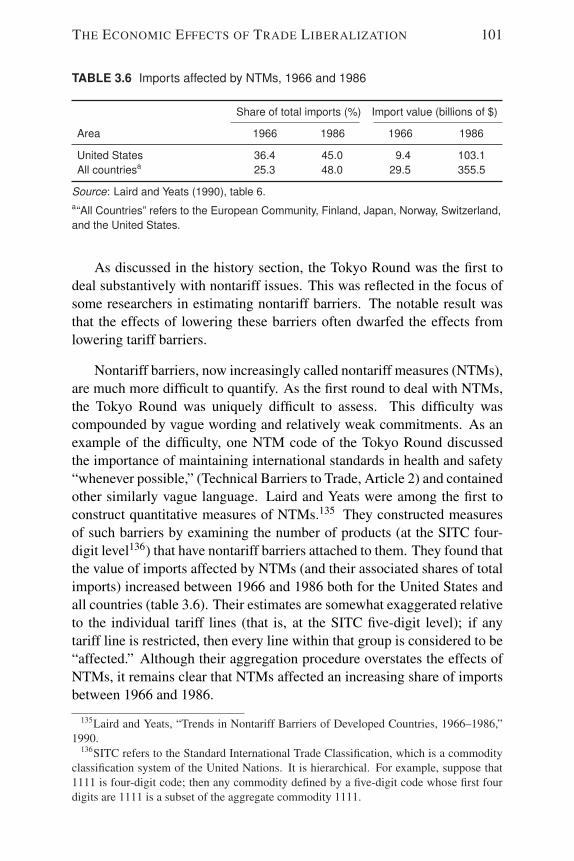
THE ECONOMIC EFFECTS OF TRADE LIBERALIZATION 101
TABLE 3.6 Imports affected by NTMs, 1966 and 1986
Share of total imports (%) Import value (billions of $)
Area 1966 1986 1966 1986
United States 36.4 45.0 9.4 103.1All countriesa 25.3 48.0 29.5 355.5
Source: Laird and Yeats (1990), table 6.a“All Countries” refers to the European Community, Finland, Japan, Norway, Switzerland,and the United States.
As discussed in the history section, the Tokyo Round was the first todeal substantively with nontariff issues. This was reflected in the focus ofsome researchers in estimating nontariff barriers. The notable result wasthat the effects of lowering these barriers often dwarfed the effects fromlowering tariff barriers.
Nontariff barriers, now increasingly called nontariff measures (NTMs),are much more difficult to quantify. As the first round to deal with NTMs,the Tokyo Round was uniquely difficult to assess. This difficulty wascompounded by vague wording and relatively weak commitments. As anexample of the difficulty, one NTM code of the Tokyo Round discussedthe importance of maintaining international standards in health and safety“whenever possible,” (Technical Barriers to Trade, Article 2) and containedother similarly vague language. Laird and Yeats were among the first toconstruct quantitative measures of NTMs.135 They constructed measuresof such barriers by examining the number of products (at the SITC four-digit level136) that have nontariff barriers attached to them. They found thatthe value of imports affected by NTMs (and their associated shares of totalimports) increased between 1966 and 1986 both for the United States andall countries (table 3.6). Their estimates are somewhat exaggerated relativeto the individual tariff lines (that is, at the SITC five-digit level); if anytariff line is restricted, then every line within that group is considered to be“affected.” Although their aggregation procedure overstates the effects ofNTMs, it remains clear that NTMs affected an increasing share of importsbetween 1966 and 1986.
135Laird and Yeats, “Trends in Nontariff Barriers of Developed Countries, 1966–1986,”1990.
136SITC refers to the Standard International Trade Classification, which is a commodityclassification system of the United Nations. It is hierarchical. For example, suppose that1111 is four-digit code; then any commodity defined by a five-digit code whose first fourdigits are 1111 is a subset of the aggregate commodity 1111.
102 CHAPTER 3 U.S. TRADE POLICY SINCE 1934
To compute the changes in welfare when evaluating the effects ofthe Tokyo Round, Whalley incorporated NTMs into a CGE model andcomputed the effects of their removal.137 He quantified a particular NTMby estimating a tariff equivalent of the distorting effect of the NTM, thatis, the tariff rate that would have a similar effect on the economy. Whalleyincorporated only those NTMs for which reasonably good estimates of thetariff equivalent could be made, although substantial subjectivity remained.For example, “buy domestic” restrictions on government procurement wereincorporated into the model as a 50 percent tariff on imports for the EECand Japan.138 Moreover, government procurement does not behave strictlylike a tariff; in certain circumstances—for example, if there is a suddenbout of inflation—the government may not be willing to pay as much forits supplies, which implies a smaller tariff equivalent.
Empirical studies of the Uruguay Round’s effects were largely focusedon the more readily quantifiable trade policies of tariff and quota reduction.Table 3.7, reproduced from Piermartini and Teh, summarizes several keystudies.
Recent Literature
There has been an explosion of research in recent years on the effectsof trade liberalization. Three areas of research have received increasinginterest. The first area is services, which are increasingly being traded. Thesecond area is NTMs, which have been given more attention as they havegrown in prominence during trade negotiations. In the current literature,the definition of NTMs is expanding, and more careful attention is paidto modeling the incidence and behavior of NTMs.139 The third areais the channels of trade benefits, where a number of theoretical papershave proposed new approaches to quantifying the benefits from trade.These papers tended to project larger benefits from trade liberalizationcompared with previous literature. According to many papers, the effectsof liberalizing NTMs eclipse those of liberalizing tariff measures. Similarlarge effects have been found from liberalization of the services industries,which were largely ignored in the foregoing literature. Empirical studies
137Whalley, “An Evaluation of the Tokyo Round Trade Agreement,” 1982.138Ibid., 350.139Nearly all services barriers fall into the category of nontariff barriers; however, as
services are a critical component of modern economies, it is frequently worth defining anddescribing them separately.
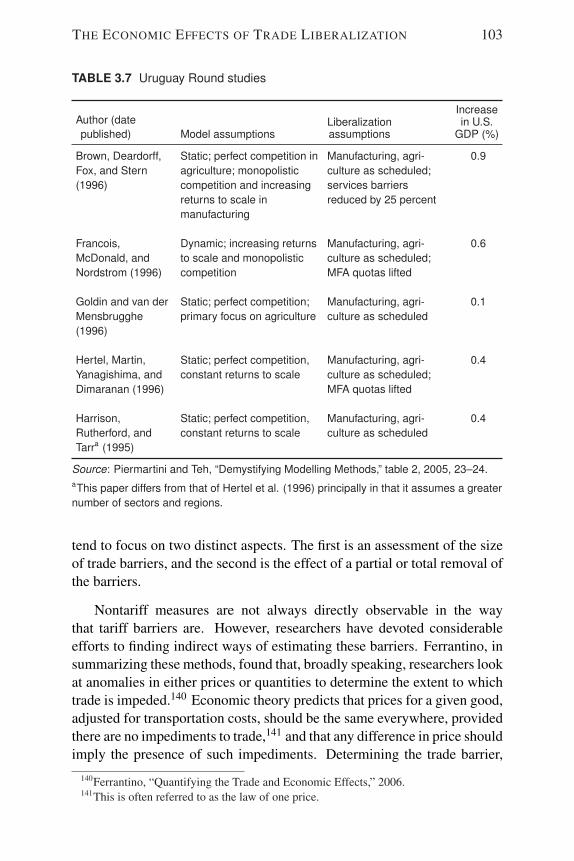
THE ECONOMIC EFFECTS OF TRADE LIBERALIZATION 103
TABLE 3.7 Uruguay Round studies
Author (datepublished) Model assumptions
Liberalizationassumptions
Increasein U.S.
GDP (%)
Brown, Deardorff,Fox, and Stern(1996)
Static; perfect competition inagriculture; monopolisticcompetition and increasingreturns to scale inmanufacturing
Manufacturing, agri-culture as scheduled;services barriersreduced by 25 percent
0.9
Francois,McDonald, andNordstrom (1996)
Dynamic; increasing returnsto scale and monopolisticcompetition
Manufacturing, agri-culture as scheduled;MFA quotas lifted
0.6
Goldin and van derMensbrugghe(1996)
Static; perfect competition;primary focus on agriculture
Manufacturing, agri-culture as scheduled
0.1
Hertel, Martin,Yanagishima, andDimaranan (1996)
Static; perfect competition,constant returns to scale
Manufacturing, agri-culture as scheduled;MFA quotas lifted
0.4
Harrison,Rutherford, andTarra (1995)
Static; perfect competition,constant returns to scale
Manufacturing, agri-culture as scheduled
0.4
Source: Piermartini and Teh, “Demystifying Modelling Methods,” table 2, 2005, 23–24.aThis paper differs from that of Hertel et al. (1996) principally in that it assumes a greaternumber of sectors and regions.
tend to focus on two distinct aspects. The first is an assessment of the sizeof trade barriers, and the second is the effect of a partial or total removal ofthe barriers.
Nontariff measures are not always directly observable in the waythat tariff barriers are. However, researchers have devoted considerableefforts to finding indirect ways of estimating these barriers. Ferrantino, insummarizing these methods, found that, broadly speaking, researchers lookat anomalies in either prices or quantities to determine the extent to whichtrade is impeded.140 Economic theory predicts that prices for a given good,adjusted for transportation costs, should be the same everywhere, providedthere are no impediments to trade,141 and that any difference in price shouldimply the presence of such impediments. Determining the trade barrier,
140Ferrantino, “Quantifying the Trade and Economic Effects,” 2006.141This is often referred to as the law of one price.
104 CHAPTER 3 U.S. TRADE POLICY SINCE 1934
however, is not as simple as looking at price differences across countriesbecause prices vary due to a number of nonpolicy reasons. Moreover, inthe case of a good that is produced in only a few countries, determiningthe world price (i.e., what the price of the good would be in an unfetteredmarket) is not a straightforward exercise.
More attention has been paid to modeling services since the UruguayRound, when it emerged as a dominant agenda item. Generally, servicesrequire special treatment and cannot be modeled simply as a different typeof good because of their complex interindustry linkages. Several papersattempt to quantify the effect of reducing barriers to trade in services.Robinson, Wang, and Martin attempted to quantify barriers in severalservices sectors while at the same time carefully laying out the difficultiesof the exercise.142 These authors found a 50 percent cut in services barriersleads to a slightly less than 1 percent increase in welfare.143 Brown,Deardorff, and Stern simulated a 33 percent reduction to barriers to tradein services and found a 1.45 percent positive effect on U.S. welfare.144
Both studies were based on CGE models with service barriers constructedsimilarly to tariff barriers.
Services liberalization may provide greater gains from liberalizationthan those generated by goods liberalization, particularly where tariffson goods have already reached low levels. Several papers suggest thatlowering barriers to trade in services can produce a welfare effect 8 to12 times greater than an equivalent decrease in goods barriers.145 Theresult from Robinson, Wang, and Martin was something of an anomaly:they estimate up to 124 times greater benefits for services liberalization,primarily because they estimated an unusually small effect from goodsliberalization.
To illustrate a potential best-case scenario, Bradford, Grieco, andHufbauer used a number of elements from the right hand column of table3.3 and arrived at several extremely large values for the benefits fromtrade liberalization.146 For example, they calculated that trade policyliberalization after World War II had increased U.S. GDP by between 7
142Robinson, Wang, and Martin, “Capturing the Implications of Services TradeLiberalization,” 2002.
143Ibid., 23.144Brown, Deardorff, and Stern, “Multilateral, Regional and Bilateral Trade Policy,”
2003.145Hoekman, “Liberalizing Trade in Services,” 2006, 24.146Bradford, Grieco, and Hufbauer, “The Payoff to America from Globalisation,” July
2006.
THE ECONOMIC EFFECTS OF TRADE LIBERALIZATION 105
and 13 percent. Also, they found that the removal of all remaining traderestrictions will raise U.S. GDP by an additional 4 to 12 percent annually.This calculation provides a useful illustration of potential gains, althoughcaution is in order as economists have not yet completely delineatedeach individual channels’ contribution to the domestic economy, andthere are likely overlapping effects that must be dealt with carefully. Itmay, however, establish an upper bound on the economic effects of tradeliberalization.
There is also a considerable body of econometric work that useshistorical data to determine the effect of a past policy decision on aneconomy. Many of these studies focused on NAFTA, as well as theU.S.-Canada Free Trade Agreement. The consensus is that trade amongpartners increased after signing NAFTA, although this effect was generallymore pronounced between the United States and Mexico. However,the research was divided between those that estimate a small level oftrade diversion and those that estimate significant trade diversion. Thepotential for trade diversion is a major drawback of free trade agreements(FTAs). For example, suppose that the United States has historicallyimported a good from Malaysia when the tariffs imposed on Malaysianand Mexican goods were the same (presumably because Malaysia is themost efficient producer). NAFTA, by reducing Mexican tariffs, createsan incentive to purchase Mexican goods, even if they are produced ina less efficient manner. As a result, even if trade between two partnersincreases subsequent to a trade agreement, some of this increase couldsimply be replacing trade with countries outside of the free trade area.Romalis found evidence on the trade diversion side of the debate, arguingthat despite significant increases in trade among NAFTA signatories, alarge portion of this was made up of trade diversion, implying only smallnet gains from NAFTA.147 On the other hand, Clausing estimated only asmall trade diversion effect, with far more significant net welfare effects.148
Aside from these agreements, a series of bilateral agreements have beenstruck since 2002. These agreements, while generally having economicsignificance for the partner country and political significance for boththe United States and the partner country, have small effects on U.S.welfare.149
147Romalis, “NAFTA’s and CUSFTA’s Impact on International Trade,” 2005.148Clausing, “Trade Creation and Trade Diversion,” 2001. See USITC, The Impact of
Trade Agreements, 2003, 93–100, for a detailed summary of the literature addressing thisquestion.
149See table F.1 for a summary of these agreements.
106 CHAPTER 3 U.S. TRADE POLICY SINCE 1934
Negotiations for the Doha Round, assuming that they continue, havebeen estimated to provide little in the way of specific benefits to membercountries. Two papers provided analysis of the economic effects ofproposed tariff rate changes. Anderson and Martin examined the potentialeffects on agriculture,150 while Gootiiz and Mattoo examined services, andboth papers come to similar results.151 Currently, many countries have setmany of their tariffs below the bound rates (rates that define the upperbound on tariffs that a country can levy) agreed upon in the UruguayRound. The bound rates proposed in the DDA are substantially lower thanthose in the Uruguay Round, but are mostly still well above the currentapplied rates. As Gootiiz and Mattoo point out, the DDA therefore doesnot increase liberalization; rather it formalizes the current status, which ata minimum prevents future increases in tariffs.
Decreux and Fontagne used a CGE model to measure the potentialeffects of the DDA. Given that no agreements have been reached, theauthors focused on a large number of potential scenarios, including tariffreductions on agriculture, nonagricultural market access, and services.Applied tariff rates were used, with assumptions made regarding the effectof lowering the bound rates. As with the literature for the Uruguay Round,these authors also found that cuts in services barriers have a much largereffect on welfare than do cuts in goods barriers; for example, servicesbarriers may only need to be cut by a mere 25 percent to provide thesame welfare gains as a 70 percent cut in goods barriers.152 The models(summarized in table 3.8) provide additional estimates of the potentialeffects of the DDA. Trade facilitation is modeled as a reduction in tradecosts of between 1 to 3 percent of total world trade.153 The main differencebetween the results obtained by Brown, Deardorff, and Stern and thosefound by Francois, Hoekman, and Woerz is in the effects of servicesbarriers, where the former obtain far higher gains from liberalization witha more modest liberalization assumption (33 percent for Brown, Deardorff,and Stern, versus 50 percent for Francois, Hoekman, and Woerz).
150Anderson and Martin, “Agricultural Trade Reform,” 2005.151Gootiiz and Mattoo, “Services in Doha,” 2008.152Decreux and Fontagne, “A Quantitative Assessment of the Outcome of the Doha
Development Agenda,” 2006, 6.153Piermartini and Teh, “Demystifying Modelling Methods,” 2005, 35.
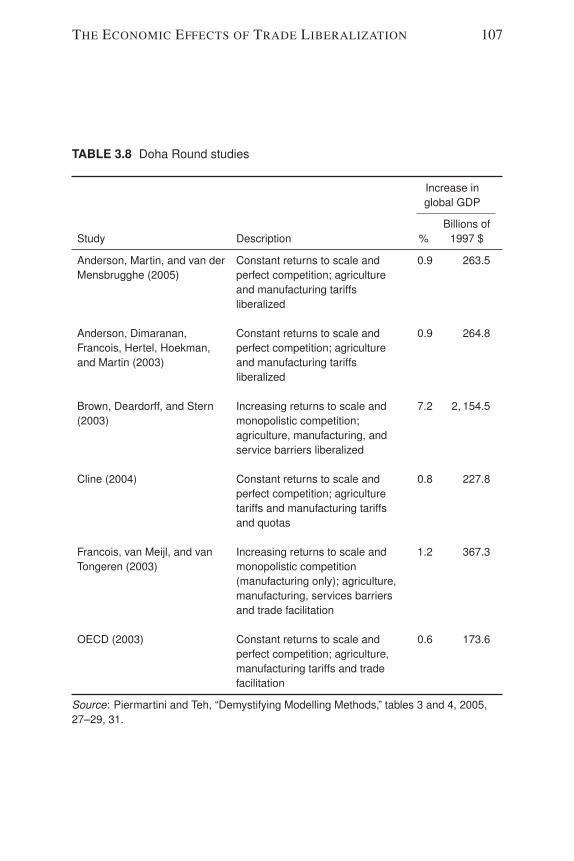
THE ECONOMIC EFFECTS OF TRADE LIBERALIZATION 107
TABLE 3.8 Doha Round studies
Increase inglobal GDP
Billions ofStudy Description % 1997 $
Anderson, Martin, and van derMensbrugghe (2005)
Constant returns to scale andperfect competition; agricultureand manufacturing tariffsliberalized
0.9 263.5
Anderson, Dimaranan,Francois, Hertel, Hoekman,and Martin (2003)
Constant returns to scale andperfect competition; agricultureand manufacturing tariffsliberalized
0.9 264.8
Brown, Deardorff, and Stern(2003)
Increasing returns to scale andmonopolistic competition;agriculture, manufacturing, andservice barriers liberalized
7.2 2, 154.5
Cline (2004) Constant returns to scale andperfect competition; agriculturetariffs and manufacturing tariffsand quotas
0.8 227.8
Francois, van Meijl, and vanTongeren (2003)
Increasing returns to scale andmonopolistic competition(manufacturing only); agriculture,manufacturing, services barriersand trade facilitation
1.2 367.3
OECD (2003) Constant returns to scale andperfect competition; agriculture,manufacturing tariffs and tradefacilitation
0.6 173.6
Source: Piermartini and Teh, “Demystifying Modelling Methods,” tables 3 and 4, 2005,27–29, 31.
108 CHAPTER 3 U.S. TRADE POLICY SINCE 1934
Conclusion and Timeline
An enormous amount of constructive work has been done to establishtrade liberalization as a common international goal and to constructthe necessary regulations and institutions to support that goal. Asidefrom the tangible and quantifiable reductions in barriers to trade and theestablishment of the World Trade Organization, the liberalization processhas resulted in a legacy of conventions and procedures intended to reducethe possibility of reversals of trade liberalization commitments. Therehave, of course, been obstacles along the way. These include domesticeconomic and political struggles within negotiating countries that spill overinto international trade negotiations and conflicts between developed anddeveloping nations regarding the role of international trade in development.The economic literature has extensively evaluated the progress of tradeliberalization. The consensus of this literature is that the United States hasbenefited substantially from past tariff liberalization. Moreover, significantfuture gains are expected as liberalization of services and other nontariffmeasures are negotiated.
Currently trade liberalization faces three potential obstacles. TheDoha Development Agenda faces an uncertain future. These talks havebeen ongoing since 2001 and may still be completed, but it is farfrom certain when, or if, this will occur. The President’s authority topresent agreement-implementing legislation to Congress for a simple up-or-down vote—trade promotion authority—has lapsed, and it is unclearwhen this will be reinstated by Congress. Finally, the global financialcrisis has raised the possibility of an increase in protectionist sentiment.There are a large number of institutional mechanisms in place thatwill make a retreat to the levels of protection seen during the GreatDepression unlikely; nevertheless, the current economic situation mayhave a substantial influence on the future direction of trade policy.
Important legislation, policy changes, and events of the past 75 yearsof U.S. trade policy are summarized in a timeline below.
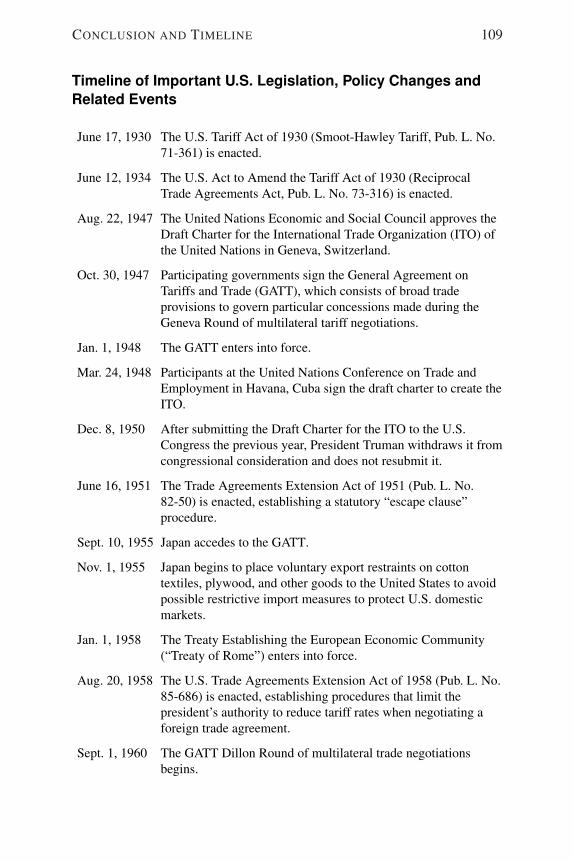
CONCLUSION AND TIMELINE 109
Timeline of Important U.S. Legislation, Policy Changes andRelated Events
June 17, 1930 The U.S. Tariff Act of 1930 (Smoot-Hawley Tariff, Pub. L. No.71-361) is enacted.
June 12, 1934 The U.S. Act to Amend the Tariff Act of 1930 (ReciprocalTrade Agreements Act, Pub. L. No. 73-316) is enacted.
Aug. 22, 1947 The United Nations Economic and Social Council approves theDraft Charter for the International Trade Organization (ITO) ofthe United Nations in Geneva, Switzerland.
Oct. 30, 1947 Participating governments sign the General Agreement onTariffs and Trade (GATT), which consists of broad tradeprovisions to govern particular concessions made during theGeneva Round of multilateral tariff negotiations.
Jan. 1, 1948 The GATT enters into force.
Mar. 24, 1948 Participants at the United Nations Conference on Trade andEmployment in Havana, Cuba sign the draft charter to create theITO.
Dec. 8, 1950 After submitting the Draft Charter for the ITO to the U.S.Congress the previous year, President Truman withdraws it fromcongressional consideration and does not resubmit it.
June 16, 1951 The Trade Agreements Extension Act of 1951 (Pub. L. No.82-50) is enacted, establishing a statutory “escape clause”procedure.
Sept. 10, 1955 Japan accedes to the GATT.
Nov. 1, 1955 Japan begins to place voluntary export restraints on cottontextiles, plywood, and other goods to the United States to avoidpossible restrictive import measures to protect U.S. domesticmarkets.
Jan. 1, 1958 The Treaty Establishing the European Economic Community(“Treaty of Rome”) enters into force.
Aug. 20, 1958 The U.S. Trade Agreements Extension Act of 1958 (Pub. L. No.85-686) is enacted, establishing procedures that limit thepresident’s authority to reduce tariff rates when negotiating aforeign trade agreement.
Sept. 1, 1960 The GATT Dillon Round of multilateral trade negotiationsbegins.
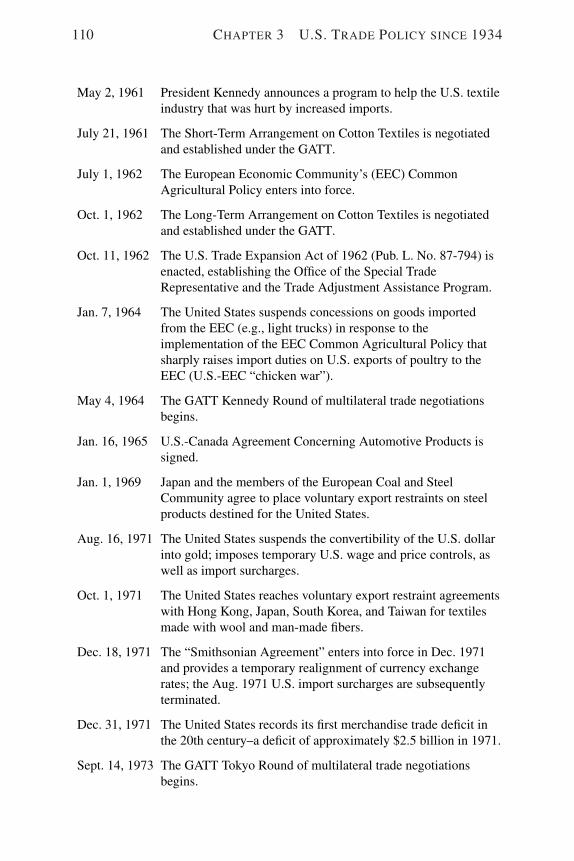
110 CHAPTER 3 U.S. TRADE POLICY SINCE 1934
May 2, 1961 President Kennedy announces a program to help the U.S. textileindustry that was hurt by increased imports.
July 21, 1961 The Short-Term Arrangement on Cotton Textiles is negotiatedand established under the GATT.
July 1, 1962 The European Economic Community’s (EEC) CommonAgricultural Policy enters into force.
Oct. 1, 1962 The Long-Term Arrangement on Cotton Textiles is negotiatedand established under the GATT.
Oct. 11, 1962 The U.S. Trade Expansion Act of 1962 (Pub. L. No. 87-794) isenacted, establishing the Office of the Special TradeRepresentative and the Trade Adjustment Assistance Program.
Jan. 7, 1964 The United States suspends concessions on goods importedfrom the EEC (e.g., light trucks) in response to theimplementation of the EEC Common Agricultural Policy thatsharply raises import duties on U.S. exports of poultry to theEEC (U.S.-EEC “chicken war”).
May 4, 1964 The GATT Kennedy Round of multilateral trade negotiationsbegins.
Jan. 16, 1965 U.S.-Canada Agreement Concerning Automotive Products issigned.
Jan. 1, 1969 Japan and the members of the European Coal and SteelCommunity agree to place voluntary export restraints on steelproducts destined for the United States.
Aug. 16, 1971 The United States suspends the convertibility of the U.S. dollarinto gold; imposes temporary U.S. wage and price controls, aswell as import surcharges.
Oct. 1, 1971 The United States reaches voluntary export restraint agreementswith Hong Kong, Japan, South Korea, and Taiwan for textilesmade with wool and man-made fibers.
Dec. 18, 1971 The “Smithsonian Agreement” enters into force in Dec. 1971and provides a temporary realignment of currency exchangerates; the Aug. 1971 U.S. import surcharges are subsequentlyterminated.
Dec. 31, 1971 The United States records its first merchandise trade deficit inthe 20th century–a deficit of approximately $2.5 billion in 1971.
Sept. 14, 1973 The GATT Tokyo Round of multilateral trade negotiationsbegins.
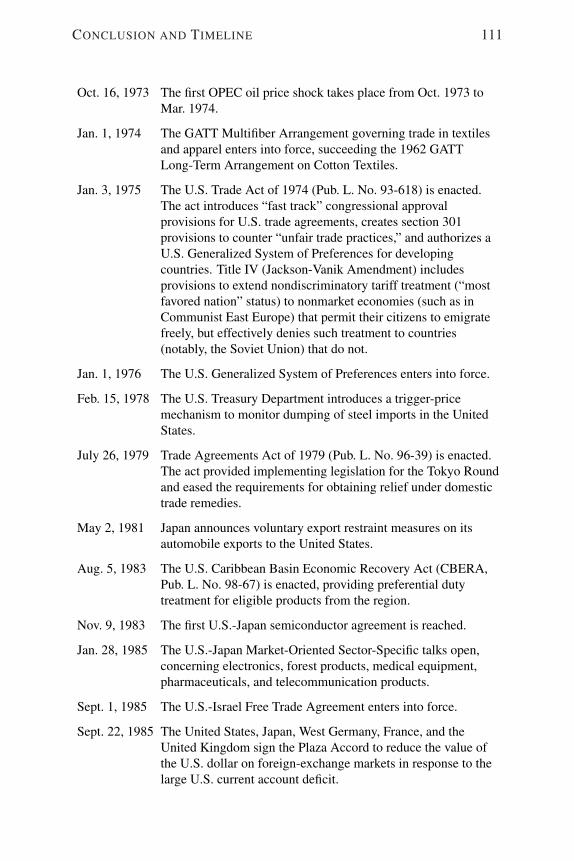
CONCLUSION AND TIMELINE 111
Oct. 16, 1973 The first OPEC oil price shock takes place from Oct. 1973 toMar. 1974.
Jan. 1, 1974 The GATT Multifiber Arrangement governing trade in textilesand apparel enters into force, succeeding the 1962 GATTLong-Term Arrangement on Cotton Textiles.
Jan. 3, 1975 The U.S. Trade Act of 1974 (Pub. L. No. 93-618) is enacted.The act introduces “fast track” congressional approvalprovisions for U.S. trade agreements, creates section 301provisions to counter “unfair trade practices,” and authorizes aU.S. Generalized System of Preferences for developingcountries. Title IV (Jackson-Vanik Amendment) includesprovisions to extend nondiscriminatory tariff treatment (“mostfavored nation” status) to nonmarket economies (such as inCommunist East Europe) that permit their citizens to emigratefreely, but effectively denies such treatment to countries(notably, the Soviet Union) that do not.
Jan. 1, 1976 The U.S. Generalized System of Preferences enters into force.
Feb. 15, 1978 The U.S. Treasury Department introduces a trigger-pricemechanism to monitor dumping of steel imports in the UnitedStates.
July 26, 1979 Trade Agreements Act of 1979 (Pub. L. No. 96-39) is enacted.The act provided implementing legislation for the Tokyo Roundand eased the requirements for obtaining relief under domestictrade remedies.
May 2, 1981 Japan announces voluntary export restraint measures on itsautomobile exports to the United States.
Aug. 5, 1983 The U.S. Caribbean Basin Economic Recovery Act (CBERA,Pub. L. No. 98-67) is enacted, providing preferential dutytreatment for eligible products from the region.
Nov. 9, 1983 The first U.S.-Japan semiconductor agreement is reached.
Jan. 28, 1985 The U.S.-Japan Market-Oriented Sector-Specific talks open,concerning electronics, forest products, medical equipment,pharmaceuticals, and telecommunication products.
Sept. 1, 1985 The U.S.-Israel Free Trade Agreement enters into force.
Sept. 22, 1985 The United States, Japan, West Germany, France, and theUnited Kingdom sign the Plaza Accord to reduce the value ofthe U.S. dollar on foreign-exchange markets in response to thelarge U.S. current account deficit.
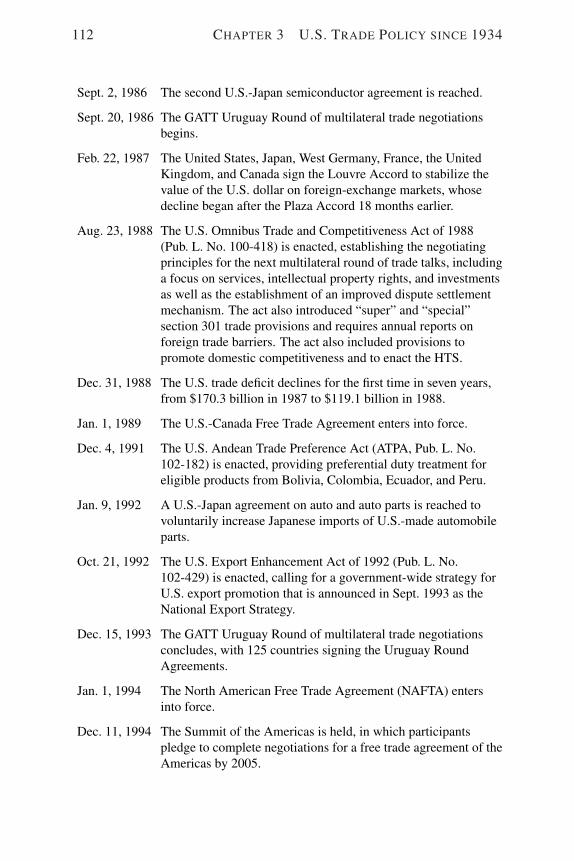
112 CHAPTER 3 U.S. TRADE POLICY SINCE 1934
Sept. 2, 1986 The second U.S.-Japan semiconductor agreement is reached.
Sept. 20, 1986 The GATT Uruguay Round of multilateral trade negotiationsbegins.
Feb. 22, 1987 The United States, Japan, West Germany, France, the UnitedKingdom, and Canada sign the Louvre Accord to stabilize thevalue of the U.S. dollar on foreign-exchange markets, whosedecline began after the Plaza Accord 18 months earlier.
Aug. 23, 1988 The U.S. Omnibus Trade and Competitiveness Act of 1988(Pub. L. No. 100-418) is enacted, establishing the negotiatingprinciples for the next multilateral round of trade talks, includinga focus on services, intellectual property rights, and investmentsas well as the establishment of an improved dispute settlementmechanism. The act also introduced “super” and “special”section 301 trade provisions and requires annual reports onforeign trade barriers. The act also included provisions topromote domestic competitiveness and to enact the HTS.
Dec. 31, 1988 The U.S. trade deficit declines for the first time in seven years,from $170.3 billion in 1987 to $119.1 billion in 1988.
Jan. 1, 1989 The U.S.-Canada Free Trade Agreement enters into force.
Dec. 4, 1991 The U.S. Andean Trade Preference Act (ATPA, Pub. L. No.102-182) is enacted, providing preferential duty treatment foreligible products from Bolivia, Colombia, Ecuador, and Peru.
Jan. 9, 1992 A U.S.-Japan agreement on auto and auto parts is reached tovoluntarily increase Japanese imports of U.S.-made automobileparts.
Oct. 21, 1992 The U.S. Export Enhancement Act of 1992 (Pub. L. No.102-429) is enacted, calling for a government-wide strategy forU.S. export promotion that is announced in Sept. 1993 as theNational Export Strategy.
Dec. 15, 1993 The GATT Uruguay Round of multilateral trade negotiationsconcludes, with 125 countries signing the Uruguay RoundAgreements.
Jan. 1, 1994 The North American Free Trade Agreement (NAFTA) entersinto force.
Dec. 11, 1994 The Summit of the Americas is held, in which participantspledge to complete negotiations for a free trade agreement of theAmericas by 2005.
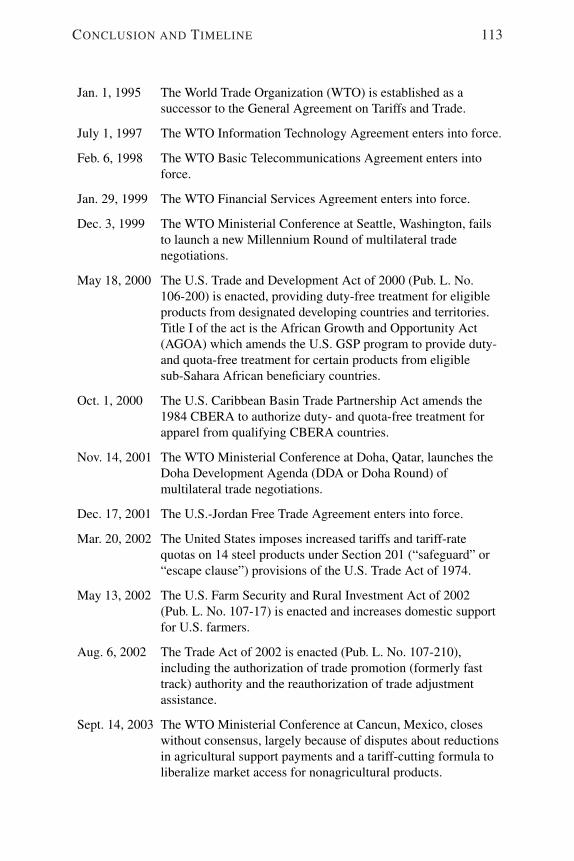
CONCLUSION AND TIMELINE 113
Jan. 1, 1995 The World Trade Organization (WTO) is established as asuccessor to the General Agreement on Tariffs and Trade.
July 1, 1997 The WTO Information Technology Agreement enters into force.
Feb. 6, 1998 The WTO Basic Telecommunications Agreement enters intoforce.
Jan. 29, 1999 The WTO Financial Services Agreement enters into force.
Dec. 3, 1999 The WTO Ministerial Conference at Seattle, Washington, failsto launch a new Millennium Round of multilateral tradenegotiations.
May 18, 2000 The U.S. Trade and Development Act of 2000 (Pub. L. No.106-200) is enacted, providing duty-free treatment for eligibleproducts from designated developing countries and territories.Title I of the act is the African Growth and Opportunity Act(AGOA) which amends the U.S. GSP program to provide duty-and quota-free treatment for certain products from eligiblesub-Sahara African beneficiary countries.
Oct. 1, 2000 The U.S. Caribbean Basin Trade Partnership Act amends the1984 CBERA to authorize duty- and quota-free treatment forapparel from qualifying CBERA countries.
Nov. 14, 2001 The WTO Ministerial Conference at Doha, Qatar, launches theDoha Development Agenda (DDA or Doha Round) ofmultilateral trade negotiations.
Dec. 17, 2001 The U.S.-Jordan Free Trade Agreement enters into force.
Mar. 20, 2002 The United States imposes increased tariffs and tariff-ratequotas on 14 steel products under Section 201 (“safeguard” or“escape clause”) provisions of the U.S. Trade Act of 1974.
May 13, 2002 The U.S. Farm Security and Rural Investment Act of 2002(Pub. L. No. 107-17) is enacted and increases domestic supportfor U.S. farmers.
Aug. 6, 2002 The Trade Act of 2002 is enacted (Pub. L. No. 107-210),including the authorization of trade promotion (formerly fasttrack) authority and the reauthorization of trade adjustmentassistance.
Sept. 14, 2003 The WTO Ministerial Conference at Cancun, Mexico, closeswithout consensus, largely because of disputes about reductionsin agricultural support payments and a tariff-cutting formula toliberalize market access for nonagricultural products.
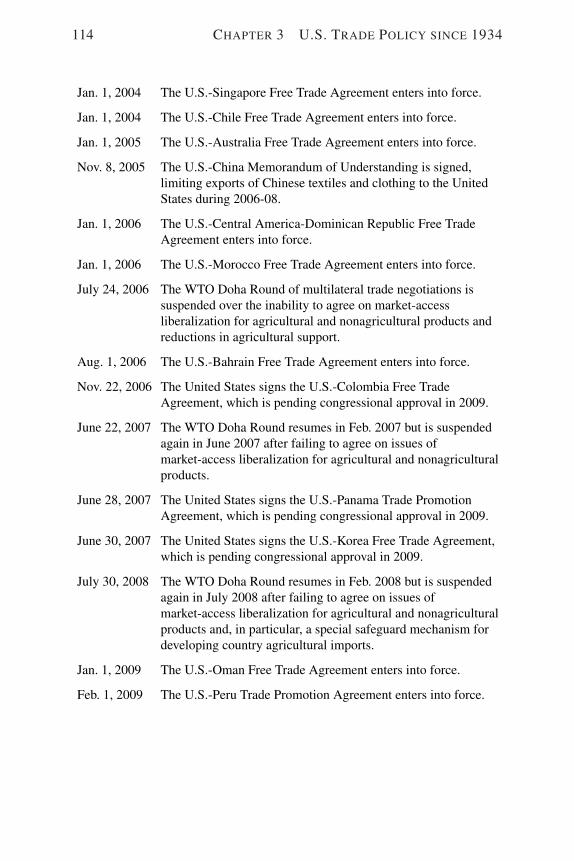
114 CHAPTER 3 U.S. TRADE POLICY SINCE 1934
Jan. 1, 2004 The U.S.-Singapore Free Trade Agreement enters into force.
Jan. 1, 2004 The U.S.-Chile Free Trade Agreement enters into force.
Jan. 1, 2005 The U.S.-Australia Free Trade Agreement enters into force.
Nov. 8, 2005 The U.S.-China Memorandum of Understanding is signed,limiting exports of Chinese textiles and clothing to the UnitedStates during 2006-08.
Jan. 1, 2006 The U.S.-Central America-Dominican Republic Free TradeAgreement enters into force.
Jan. 1, 2006 The U.S.-Morocco Free Trade Agreement enters into force.
July 24, 2006 The WTO Doha Round of multilateral trade negotiations issuspended over the inability to agree on market-accessliberalization for agricultural and nonagricultural products andreductions in agricultural support.
Aug. 1, 2006 The U.S.-Bahrain Free Trade Agreement enters into force.
Nov. 22, 2006 The United States signs the U.S.-Colombia Free TradeAgreement, which is pending congressional approval in 2009.
June 22, 2007 The WTO Doha Round resumes in Feb. 2007 but is suspendedagain in June 2007 after failing to agree on issues ofmarket-access liberalization for agricultural and nonagriculturalproducts.
June 28, 2007 The United States signs the U.S.-Panama Trade PromotionAgreement, which is pending congressional approval in 2009.
June 30, 2007 The United States signs the U.S.-Korea Free Trade Agreement,which is pending congressional approval in 2009.
July 30, 2008 The WTO Doha Round resumes in Feb. 2008 but is suspendedagain in July 2008 after failing to agree on issues ofmarket-access liberalization for agricultural and nonagriculturalproducts and, in particular, a special safeguard mechanism fordeveloping country agricultural imports.
Jan. 1, 2009 The U.S.-Oman Free Trade Agreement enters into force.
Feb. 1, 2009 The U.S.-Peru Trade Promotion Agreement enters into force.
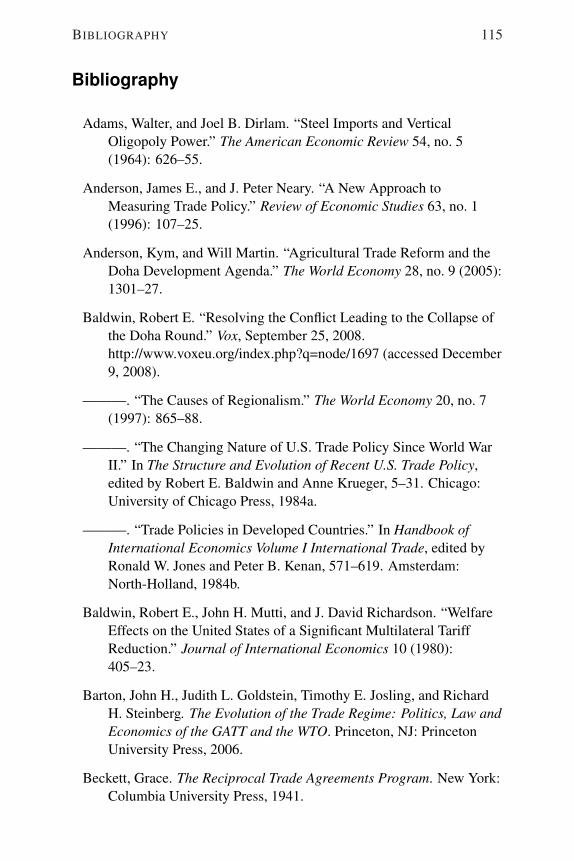
BIBLIOGRAPHY 115
Bibliography
Adams, Walter, and Joel B. Dirlam. “Steel Imports and VerticalOligopoly Power.” The American Economic Review 54, no. 5(1964): 626–55.
Anderson, James E., and J. Peter Neary. “A New Approach toMeasuring Trade Policy.” Review of Economic Studies 63, no. 1(1996): 107–25.
Anderson, Kym, and Will Martin. “Agricultural Trade Reform and theDoha Development Agenda.” The World Economy 28, no. 9 (2005):1301–27.
Baldwin, Robert E. “Resolving the Conflict Leading to the Collapse ofthe Doha Round.” Vox, September 25, 2008.http://www.voxeu.org/index.php?q=node/1697 (accessed December9, 2008).
———. “The Causes of Regionalism.” The World Economy 20, no. 7(1997): 865–88.
———. “The Changing Nature of U.S. Trade Policy Since World WarII.” In The Structure and Evolution of Recent U.S. Trade Policy,edited by Robert E. Baldwin and Anne Krueger, 5–31. Chicago:University of Chicago Press, 1984a.
———. “Trade Policies in Developed Countries.” In Handbook ofInternational Economics Volume I International Trade, edited byRonald W. Jones and Peter B. Kenan, 571–619. Amsterdam:North-Holland, 1984b.
Baldwin, Robert E., John H. Mutti, and J. David Richardson. “WelfareEffects on the United States of a Significant Multilateral TariffReduction.” Journal of International Economics 10 (1980):405–23.
Barton, John H., Judith L. Goldstein, Timothy E. Josling, and RichardH. Steinberg. The Evolution of the Trade Regime: Politics, Law andEconomics of the GATT and the WTO. Princeton, NJ: PrincetonUniversity Press, 2006.
Beckett, Grace. The Reciprocal Trade Agreements Program. New York:Columbia University Press, 1941.
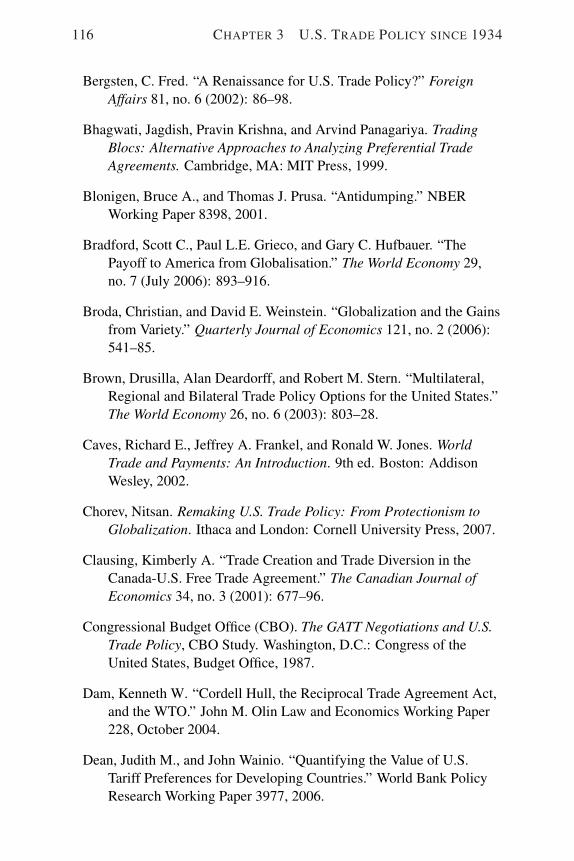
116 CHAPTER 3 U.S. TRADE POLICY SINCE 1934
Bergsten, C. Fred. “A Renaissance for U.S. Trade Policy?” ForeignAffairs 81, no. 6 (2002): 86–98.
Bhagwati, Jagdish, Pravin Krishna, and Arvind Panagariya. TradingBlocs: Alternative Approaches to Analyzing Preferential TradeAgreements. Cambridge, MA: MIT Press, 1999.
Blonigen, Bruce A., and Thomas J. Prusa. “Antidumping.” NBERWorking Paper 8398, 2001.
Bradford, Scott C., Paul L.E. Grieco, and Gary C. Hufbauer. “ThePayoff to America from Globalisation.” The World Economy 29,no. 7 (July 2006): 893–916.
Broda, Christian, and David E. Weinstein. “Globalization and the Gainsfrom Variety.” Quarterly Journal of Economics 121, no. 2 (2006):541–85.
Brown, Drusilla, Alan Deardorff, and Robert M. Stern. “Multilateral,Regional and Bilateral Trade Policy Options for the United States.”The World Economy 26, no. 6 (2003): 803–28.
Caves, Richard E., Jeffrey A. Frankel, and Ronald W. Jones. WorldTrade and Payments: An Introduction. 9th ed. Boston: AddisonWesley, 2002.
Chorev, Nitsan. Remaking U.S. Trade Policy: From Protectionism toGlobalization. Ithaca and London: Cornell University Press, 2007.
Clausing, Kimberly A. “Trade Creation and Trade Diversion in theCanada-U.S. Free Trade Agreement.” The Canadian Journal ofEconomics 34, no. 3 (2001): 677–96.
Congressional Budget Office (CBO). The GATT Negotiations and U.S.Trade Policy, CBO Study. Washington, D.C.: Congress of theUnited States, Budget Office, 1987.
Dam, Kenneth W. “Cordell Hull, the Reciprocal Trade Agreement Act,and the WTO.” John M. Olin Law and Economics Working Paper228, October 2004.
Dean, Judith M., and John Wainio. “Quantifying the Value of U.S.Tariff Preferences for Developing Countries.” World Bank PolicyResearch Working Paper 3977, 2006.
BIBLIOGRAPHY 117
Deardorff, Alan V., and Robert M. Stern. “A Disaggregated Model ofWorld Production and Trade: An Estimate of the Impact of theTokyo Round.” Journal of Policy Modeling 3, no. 2 (1981): 127–52.
———. An Economic Analysis of the Effects of the Tokyo Round ofMultilateral Trade Negotiations on the United States and the OtherMajor Industrialized Countries. MTN Studies no. 5. Committee onFinance, U.S. Senate 96th Congress, 1st Session.Washington, D.C.: U.S. Government Printing Office, 1979.
Decreux, Yvan, and Lionel Fontagne. “A Quantitative Assessment ofthe Outcome of the Doha Development Agenda.” CEPII WorkingPaper 2006-10, 2006.
Destler, I.M. American Trade Politics. 3d ed. New York: The TwentiethCentury Fund, 1995.
De Melo, Jaime, and David Tarr. “Welfare Costs of U.S. Quotas inTextiles, Steel and Autos.” The Review of Economics and Statistics72 (1990): 489–97.
Diebold, William. “The End of the ITO.” In Essays in InternationalFinance 16. Princeton, NJ: Princeton University Press, 1952.
Dixon, Peter, Brian Parmenter, John Sutton, and Dave Vincent. ORANI:A Multisectoral Model of the Australian Economy. Amsterdam:North Holland, 1997.
Dobson, John M. Two Centuries of Tariffs. Washington, D.C.: USITC,1976.
Eaton, Jonathan, and Samuel Kortum. “Technology, Geography, andTrade.” Econometrica 70, no. 5 (2002): 1741–79.
———. “Trade in Capital Goods.” European Economic Review 45,no. 7 (2001): 1195–1235.
Economist. “The WTO Under Fire,” September 18, 2003.
Eichengreen, Barry. “The Political Economy of the Smoot-HawleyTariff.” NBER Working Paper 2001, August 1986.
Eichengreen, Barry, and Douglas A. Irwin. “Trade Blocs, CurrencyBlocs, and the Reorientation of World Trade in the 1930s.” Journalof International Economics 38 (February 1995): 1–24.
118 CHAPTER 3 U.S. TRADE POLICY SINCE 1934
Farrell, Roger. Japanese Investment in the World Economy: A Study ofStrategic Themes in the Internationalization of Japanese Industry.Cheltenham, UK: Edward Elgar Publishing, 2008.
Feenstra, Robert C. Advanced International Trade: Theory andEvidence. Princeton, NJ: Princeton University Press, 2004.
———. “Integration of Trade and Disintegration of Production in theGlobal Economy,” Journal of Economic Perspectives 12 no. 4(1998): 31–50.
———. “Voluntary Export Restraints in U.S. Autos, 1980-81: Quality,Employment, and Welfare Effects.” In Structure and Evolution ofRecent U.S. Trade Policy, edited by Robert E. Baldwin and Anne O.Krueger, 35–59. Chicago: University of Chicago Press, 1984.
Ferrantino, Michael. “Quantifying the Trade and Economic Effects ofNon-Tariff Measures.” OECD Trade Policy Working Paper 28,2006.
Francois, Joseph, Bernard Hoekman, and Julia Woerz. “Does GravityApply to Intangibles? Measuring Openness in Services.” Paperpresented at the CEPII-OECD Workshop on Recent Developmentsin International Trade in Services, Paris, 2007.
Gallaway, Michael P., Bruce A. Blonigen, and Joseph E. Flynn.“Welfare Costs of the U.S. Antidumping and Countervailing DutyLaws.” Journal of International Economics 49 (1999): 211–44.
Gootiiz, Batshur, and Aaditya Mattoo. “Services in Doha: What’s onthe Table?” Development Economics Research Group WorkingPaper, 2008.
Grossman, Gene M., and Elhanan Helpman. “Technology and Trade.”In Handbook of International Economics, Volume III, edited byGene M. Grossman and Elhanan Helpman, 1279–1337.Amsterdam: North-Holland, 1995.
Helmers, Henrik O. The United States-Canadian AutomobileAgreement: A Study in Industry Adjustment. Michigan InternationalCommerce Reports 1. Ann Arbor, MI: Bureau of BusinessAdministration, University of Michigan, 1967.
BIBLIOGRAPHY 119
Hertel, T., Martin, W., Yanagishima, K. and B. Dimaranan.“Liberalizing Manufactures in a Changing World Economy.” In TheUruguay Round and the Developing Economies, edited by W.Martin and L.A. Winters, 183–215. Cambridge: CambridgeUniversity Press, 1996.
Hoekman, Bernard. “Liberalizing Trade in Services: A Survey.” WorldBank Policy Research Working Paper 4030, 2006.
———. “Strengthening the Global Trade Architecture forDevelopment.” World Trade Review 1, no. 1 (2002): 2–45.
Hoekman, Bernard M., and Michael M. Kostecki. The PoliticalEconomy of the World Trading System: The WTO and Beyond. 2nded. Oxford: Oxford University Press, 2001.
Hoekman, Bernard M., William J. Martin, and Carlos A. Primo Braga.“Preference Erosion: The Terms of the Debate.” In Trade, Dohaand Development, edited by Richard Newfarmer, 329-40.Washington DC: World Bank, 2005.
Hunter, Janet, and Helen Macnaughtan. “Textile Workers in Japan.” InThe Ashgate Companion to the History of Textile Workers, edited byLex Heerma van Voss, Els Hiemstra-Kuperus and Elise vanNederveen Meerkerk, forthcoming. Surrey, UK: AshgatePublishers. http://www.iisg.nl/research/japan-rev.doc
Irwin, Douglas A. “From Smoot-Hawley to Reciprocal TradeAgreements: Changing the Course of U.S. Trade Policy in the1930s.” In The Defining Moment: The Great Depression and theAmerican Economy in the Twentieth Century, edited by Michael D.Bordo, Claudia Goldin, and Eugene N. White, 325-352. Chicago:University of Chicago Press for the NBER, 1998.
———. “The GATT in Historical Perspective.” American EconomicReview Papers and Proceedings 85, no. 2 (1995): 323–28.
———. “The Smoot-Hawley Tariff: A Quantitative Assessment.” TheReview of Economics and Statistics 80, no. 2 (May 1998): 326–34.
———. “Trade Restrictiveness and Deadweight Losses from U.S.Tariffs, 1859–1961.” NBER Working Paper 13450, 2007.
120 CHAPTER 3 U.S. TRADE POLICY SINCE 1934
Jackson, John H. The World Trading System: Law and Policy ofInternational Economic Relations. 2nd ed. Cambridge, MA: MITPress, 1997.
———. World Trade and the Law of GATT. Indianapolis, IN:Bobbs-Merrill, 1969.
Jones, Joseph M. Tariff Retaliation: Repercussions of the Hawley-SmootBill. Philadelphia: University of Pennsylvania Press, 1934.
Keck, Alexander, and Patrick Low. “Special and Differential Treatmentin the WTO: Why, Where and How?” WTO Staff Working PaperERSD-2004-03, 2004.
Keesing, Donald B., and Martin Wolf. Textile Quotas AgainstDeveloping Countries. London: Trade Policy Research Centre,1980.
Kenan, Peter B. The International Economy. 4th ed. Cambridge:Cambridge University Press, 2000.
Krueger, Anne O. “Are Preferential Trade ArrangementsTrade-Liberalizing or Protectionist?” The Journal of EconomicPerspectives 13, no. 4 (1999): 105–24.
Krugman, Paul. “Increasing Returns, Monopolistic Competition, andInternational Trade.” Journal of International Economics 9, no. 4(1979): 469–79.
———. “Ricardo’s Difficult Idea,” paper for the ManchesterConference on Free Trade, March 1996.http://web.mit.edu/krugman/www/ricardo.htm (accessed April 20,2009).
———. “Scale Economies, Product Differentiation, and the Pattern ofTrade.” The American Economic Review 70, no. 5 (1980): 950–59.
Krugman, Paul, and Maurice Obstfeld. International Economics:Theory and Policy. 5th ed. Boston: Addison-Wesley, 2000.
Laird, Sam, and Alexander Yeats. “Trends in Nontariff Barriers ofDeveloped Countries, 1966–1986.” Review of World Economics126, no. 2 (1990): 299–325.

BIBLIOGRAPHY 121
McClenahan, William. “The Growth of Voluntary Export Restraints andAmerican Foreign Economic Policy, 1956–1969.” Business andEconomic History, 2nd ser. 20 (1991): 180–90.
McGovern, Edmond. International Trade Regulation. 3d ed. Exeter:Globefeld Press, 1995.
Mehta, Pradeep S. “The Doha Development Agenda: The Road Ahead.”In Canadian Development Report 2003. Ottawa: The North-SouthInstitute, 2003.
Melitz, Marc J. “The Impact of Trade on Intra-Industry Reallocationsand Aggregate Industry Productivity.” Econometrica 71, no. 6(2003): 1695–1725.
Office of the U.S. Trade Representative (USTR). “History of the U.S.Trade Representative,” undated. http://www.ustr.gov/ (accessedFebruary 2, 2009).
Oyejide, T. Ademola. “Interests and Options of Developing andLeast-developed Countries in a New Round of Multilateral TradeNegotiations.” G-24 Discussion Paper Series 2. United NationsConference on Trade and Development–Center for InternationalDevelopment, Harvard University. 2000.
Panagariya, Arvind. “Alternative Approaches to Measuring the Cost ofProtection.” 2002. Mimeo.
Pearson, Charles S. United States Trade Policy: A Work in Progress.Hoboken, NJ: John Wiley & Sons, 2004.
Piermartini, Roberta, and Robert Teh. “Demystifying ModellingMethods for Trade Policy.” WTO Discussion Papers 10, 2005.
Robinson, Sherman, Zhi Wang, and Will Martin. “Capturing theImplications of Services Trade Liberalization.” Economic SystemsResearch 14, no. 1 (2002): 3–33.
Romalis, John. “NAFTA’s and CUSFTA’s Impact on InternationalTrade.” NBER Working Paper 11059, 2005.
Rosen, Howard. “Free Trade Agreements as Foreign Policy Tools: TheU.S.-Israel and U.S.-Jordan FTAs.” In Free Trade Agreements: U.S.Strategies and Priorities, edited by Jeffrey J. Schott, 53–58.Washington, D.C.: Peterson Institute, 2004.
122 CHAPTER 3 U.S. TRADE POLICY SINCE 1934
Shoven, John B. and John Whalley. Applying General Equilibrium.Cambridge: Cambridge University Press, 1992.
Taussig, Frank W. The Tariff History of the United States. 6th ed. NewRochelle: G.P. Putnam’s Sons, 1914.
Taussig, Frank W. The Tariff History of the United States. 8th ed. NewRochelle: G.P. Putnam’s Sons, 1931.
Trebilcock, Michael J., and Robert Howse. The Regulation ofInternational Trade. 3rd ed. London and New York: Routledge,2005.
U.S. Department of Commerce. U.S. Census Bureau. Official U.S. tradestatistics. http://www.census.gov/foreign-trade/download/dvd/index.html#merch (accessed monthly).
U.S. House of Representatives. Committee on Ways and Means.Overview and Compilation of U.S. Trade Statutes, 1993 ed.
U.S. House of Representatives. Committee on Ways and Means.Overview and Compilation of U.S. Trade Statutes, 1995 ed.
U.S. Tariff Commission. Operation of the Trade Agreements Program,June 1934 to April 1948 – Part II. History of the Trade AgreementsProgram. Report no. 160, Second Series. Washington, D.C.: U.S.Tariff Commission, 1949.
U.S. International Trade Commission (USITC). Antidumping andCountervailing Duty Handbook. 13th ed. USITC Publication 4056.Washington, D.C.: USITC, 2008.
———. Hearing transcript in connection with inv. no. 332-325, TheEconomic Effects of Significant U.S. Import Restraints: SixthUpdate, January 8, 2009.
———. Foreign Protection of Intellectual Property Rights and theEffect on U.S. Industry and Trade. USITC Publication 2065.Washington, D.C.: USITC, 1988.
———. The History and Current Status of the Multifiber Arrangement,USITC Publication 850. Washington, D.C.: USITC, 1978.
BIBLIOGRAPHY 123
———. The Impact of Trade Agreements: Effect of the Tokyo Round,U.S.-Israel FTA, U.S.-Canada FTA, NAFTA, and the UruguayRound on the U.S. Economy, USITC Publication 3621.Washington, D.C.: USITC, 2003.
Washington Trade Daily. “US Certifies Peru FTA.” Volume 18. no 13.January 19, 2009. Trade Reports International Group.
Whalley, John. “An Evaluation of the Tokyo Round Trade AgreementUsing General Equilibrium Computational Methods.” Journal ofPolicy Modeling 4, no. 3 (1982): 341–61.
Whalley, John, and R. Wigle. “Price and Quantity Rigidities inAdjustment to Trade Policy Changes: Alternative Formulation andInitial Calculations.” 1982. Mimeo (cited in Baldwin (1984)).
World Bank Group. World Development Indicators Online.http://go.worldbank.org/3SGLDH5V10 (accessed February 2,2009).
World Trade Organization (WTO). “Agriculture: Fairer Markets forFarmers,” undated.http://www.wto.org/english/thewto e/whatis e/tif e/agrm3 e.htm(accessed January 2, 2009).
———. “Sanitary and Phytosanitary Measures: Gateway,” undated.http://www.wto.org/english/tratop e/sps e/sps e.htm (accessedDecember 9, 2008).
———. World Trade Report 2007. Geneva: WTO Publications, 2007.http://www.wto.org/english/res e/reser e/wtr arc e.htm.


Appendix A
Request Letters
125

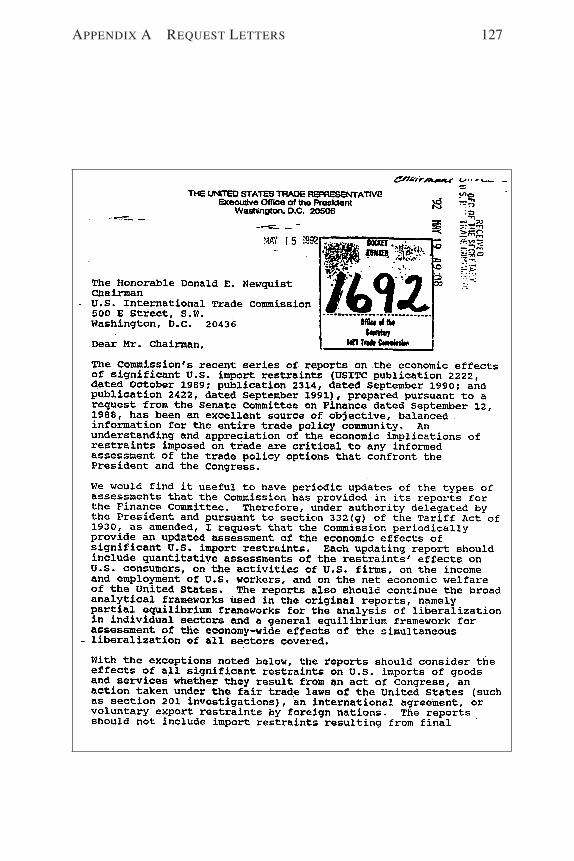
APPENDIX A REQUEST LETTERS 127
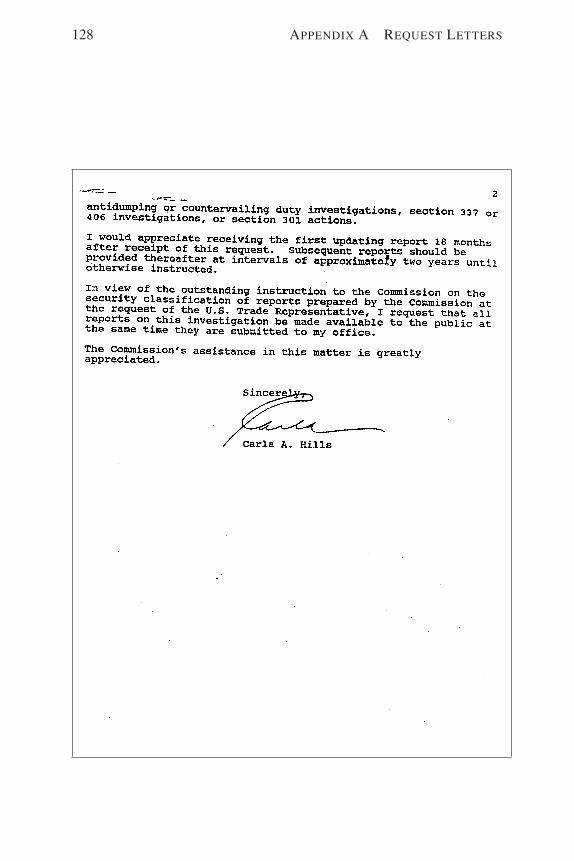
128 APPENDIX A REQUEST LETTERS
APPENDIX A REQUEST LETTERS 129


Appendix B
Federal Register Notice
131

APPENDIX B FEDERAL REGISTER NOTICE 133
61905 Federal Register / Vol. 73, No. 202 / Friday, October 17, 2008 / Notices
prompt competitive interest in unleased Federal coal in this area. The alternate tract configurations for each of the LBAs that BLM is evaluating are described and analyzed as separate alternatives in the DEIS. Under these alternatives, competitive sales would be held and leases issued for Federal coal lands included in tracts modified by the BLM. The DEIS also analyzes the alternative of rejecting the application(s) to lease Federal coal as the No Action Alternative. The Proposed Actions and alternatives for each of the LBAs being considered in the DEIS are in conformance with the Approved Resource Management Plan for Public Lands Administered by the Bureau of Land Management Buffalo Field Office (2001).
Requests to be included on the mailing list for this project and to request copies of the DEIS or notification of the comment period or hearing date, or both, may be sent in writing, by facsimile, or electronically to the addresses previously stated at the beginning of this notice. The BLM asks that those submitting comments on the DEIS make them as specific as possible with reference to page numbers and chapters of the document. Comments that contain only opinions or preferences will not receive a formal response; however, they will be considered as part of the BLM decision- making process.
Please note that comments and information submitted including names, street addresses, and e-mail addresses of respondents will be available for public review and disclosure at the above address during regular business hours (7:45 a.m. to 4:30 p.m.), Monday through Friday, except holidays.
Before including your address, phone number, e-mail address, or other personal identifying information in your comment, you should be aware that your entire comment—including your personal identifying information—may be made publicly available at any time. While you can ask us in your comment to withhold your personal identifying information from public review, we cannot guarantee that we will be able to do so.
Donald A. Simpson,
Acting State Director.
[FR Doc. E8–24632 Filed 10–16–08; 8:45 am]
BILLING CODE 4310–22–P
DEPARTMENT OF THE INTERIOR
Bureau of Land Management
[OR–930–6350–DQ–047H] HAG–08–0204
Notice of Availability of the Final Environmental Impact Statement for the Revision of the Resource Management Plans of the Western Oregon Bureau of Land Management Districts of Salem, Eugene, Roseburg, Coos Bay, and Medford, and the Klamath Falls Resource Area of the Lakeview District
AGENCY: Bureau of Land Management, Interior.
ACTION: Notice of Availability.
SUMMARY: In accordance with the National Environmental Policy Act of 1969 and the Federal Land Policy and Management Act of 1976, the Bureau of Land Management (BLM) has prepared six Resource Management Plans with a single associated Final Environmental Impact Statement (RMP/FEIS) for the Salem, Eugene, Roseburg, Coos Bay, and Medford Districts and the Klamath Falls Resource Area of the Lakeview District in western Oregon.
DATES: The Assistant Secretary of the Interior for Land and Minerals Management is the responsible official for the RMP. Accordingly, there will be no administrative review ‘‘protest’’ on the RMP/FEIS under 43 CFR 1610.5–2. The Record of Decision (ROD) will not be signed until at least 30 days after the Environmental Protection Agency (EPA) publishes this notice of availability of the Final EIS in the Federal Register.
ADDRESSES: Copies of the RMP/FEIS have been sent to affected federal, state, and local government agencies, and to tribal governments. Interested persons may review the RMP/FEIS on the Internet at http://www.blm.gov/or/ plans/wopr/index.php. Copies of the RMP/FEIS are available for public inspection at Salem, Eugene, Roseburg, Coos Bay, and Medford District offices and the Grants Pass, Klamath Falls and Tillamook Resource Area offices.
FOR FURTHER INFORMATION, CONTACT: Jerry Hubbard, Western Oregon Plan Revisions Public Outreach Coordinator; at (503) 808–6115.
SUPPLEMENTARY INFORMATION: The BLM has analyzed revision of six Resource Management Plans with this single Environmental Impact Statement. These plans are the Salem, Eugene, Roseburg, Medford, and Coos Bay District RMPs and the Klamath Falls Resource Area RMP. The RMP/FEIS for the Western Oregon Bureau of Land Management Districts has identified and analyzed
four action alternatives, including the RMP, for managing approximately 2,550,000 acres of federal land, most of which are revested Oregon and California Railroad Grant and Coos Bay Wagon Road Grant lands, within the western Oregon planning area.
The major resource management plan issues include:
• Providing a sustainable supply of wood and other forest products, as mandated by the Oregon & California Lands Act of 1937, while also meeting other applicable laws.
• Providing for conservation of species listed under the Endangered Species Act.
• Contributing to meeting the goals of the Clean Water Act and the Safe Drinking Water Act.
• Reducing the risk of wildfire and integrating fire back into the ecosystem.
Comments received on the Draft Environmental Impact Statement (DEIS) were important in shaping the Resource Management Plans. The RMP is based on Alternative 2 from the DEIS, but includes portions of the other alternatives in the DEIS.
Some of the key changes include: • Wider riparian management areas,
as described in Alternative 1 of the DEIS.
• Late successional management areas were reconfigured to match the Final Northern Spotted Owl Recovery Plan.
• Deferring harvest for 15 years in ‘‘older and more structurally complex multi-layered conifer stands,’’ as described in Final Northern Spotted Owl Recovery Plan in the timber management area.
• Using uneven-aged management, as described in Alternative 3 of the DEIS, in the southern portion of the Medford District and the Klamath Falls Resource Area to decrease fire hazard and increase fire resiliency.
Dated: September 8, 2008.
Edward W. Shepard,
State Director, Oregon/Washington, Bureau of Land Management.
[FR Doc. E8–24655 Filed 10–16–08; 8:45 am]
BILLING CODE 4310–33–P
INTERNATIONAL TRADE COMMISSION
[Investigation 332–325]
The Economic Effects of Significant U.S. Import Restraints: Sixth Update
AGENCY: United States International Trade Commission. ACTION: Notice of sixth update report and scheduling of public hearing.
134 APPENDIX B FEDERAL REGISTER NOTICE
61906 Federal Register / Vol. 73, No. 202 / Friday, October 17, 2008 / Notices
SUMMARY: This notice announces the schedule and scope of the Commission’s sixth update report in investigation No. 332–325, The Economic Effects of Significant U.S. Import Restraints, including the expansion in scope to include a summary of the major steps and results of U.S. trade liberalizing efforts since 1934 and effects of liberalization as reported in the economic literature, as requested in the U.S. Trade Representative’s (USTR) letter received on August 22, 2008. This series of reports was originally requested in a letter from the USTR dated May 15, 1992.
DATES: December 2, 2008: Deadline for filing requests to appear at the public hearing.
December 11, 2008: Deadline for filing pre-hearing briefs and statements.
January 8, 2009: Public hearing. February 6, 2009: Deadline for filing
post-hearing briefs and statements. August 20, 2009: Transmittal of
Commission report to USTR.
ADDRESSES: All Commission offices, including the Commission’s hearing rooms, are located in the United States International Trade Commission Building, 500 E Street SW., Washington, DC. All written submissions should be addressed to the Secretary, United States International Trade Commission, 500 E Street SW., Washington, DC 20436. The public record for this investigation may be viewed on the Commission’s electronic docket (EDIS) at http://www.usitc.gov/secretary/ edis.htm.
FOR FURTHER INFORMATION CONTACT: William Deese, Project Leader ([email protected] or 202–205– 2626) or Kyle Johnson, Deputy Project Leader ([email protected] or 202– 205–3229) for information specific to this sixth update report. For information on the legal aspects of this investigation, contact William Gearhart of the Commission’s Office of the General Counsel (202–205–3091 or [email protected]). The media should contact Margaret O’Laughlin, Office of External Relations (202–205– 1819 or [email protected]). Hearing-impaired individuals may obtain information on this matter by contacting the Commission’s TDD terminal at 202–205–1810. General information concerning the Commission may also be obtained by accessing its Internet server (http://www.usitc.gov). Persons with mobility impairments who will need special assistance in gaining access to the Commission should contact the Office of the Secretary at 202–205–2000.
Background: The Commission instituted this investigation under section 332(g) of the Tariff Act of 1930 (19 U.S.C. 1332(g)) following receipt on May 15, 1992 of a request from the USTR. The request asked that the Commission conduct an investigation assessing the quantitative economic effects of significant U.S. import restraints on the U.S. economy and prepare periodic update reports after the initial report. The Commission published a notice of institution of the investigation in the Federal Register of June 17, 1992 (57 FR 27063). The first report was delivered to the USTR in November 1993, the first update in December 1995, the second update in May 1999, the third update in June 2002, the fourth update in June 2004, and the fifth update in February 2007.
As requested by the USTR in a letter received on August 22, 2008, the Commission in this sixth update will include a summary of the major steps and results of U.S. trade liberalizing efforts since 1934 and the effects of liberalization as reported in the economic literature. The USTR asked that the summary be accessible to readers who may not be professional economists. As in previous reports in this series, the sixth update will continue to assess the economic effects of significant import restraints on U.S. consumers and firms, the income and employment of U.S. workers, and the net economic welfare of the United States. This assessment will use the Commission’s computable general equilibrium model. However, as per earlier instructions from the USTR, the Commission will not assess import restraints resulting from antidumping or countervailing duty investigations, section 337 and 406 investigations, or section 301 actions.
Public Hearing: A public hearing in connection with this investigation will be held beginning at 9:30 a.m. on January 8, 2009, at the United States International Trade Commission, 500 E Street SW., Washington DC. Requests to appear at the hearing should be filed with the Secretary no later than 5:15 p.m., December 2, 2008, in accordance with the requirements in the ‘‘Written Submissions’’ section below. In the event that, as of the close of business on December 2, 2008, no witnesses are scheduled to appear at the hearing, the hearing will be canceled. Any person interested in attending the hearing as an observer or non-participant may call the Secretary to the Commission (202–205– 2000) after December 2, 2008 to determine whether the hearing will be held.
Written Submissions: In lieu of or in addition to participating in the hearing, interested parties are invited to submit written statements or briefs concerning this investigation. All written submissions, including requests to appear at the hearing, statements, and briefs, should be addressed to the Secretary. Any pre-hearing statements or briefs should be filed not later than 5:15 p.m., December 11, 2008; and post- hearing statements and briefs and all other written submissions should be filed not later than 5:15 p.m., February 6, 2009. All written submissions must conform with the provisions of section 201.8 of the Commission’s Rules of Practice and Procedure (19 CFR 201.8). Section 201.8 of the rules requires that a signed original (or a copy designated as an original) and fourteen (14) copies of each document be filed. In the event that confidential treatment of the document is requested, at least four (4) additional copies must be filed, in which the confidential information must be deleted (see the following paragraph for further information regarding confidential business information). The Commission’s rules do not authorize filing submissions with the Secretary by facsimile or electronic means, except to the extent permitted by section 201.8 of the rules (see Handbook for Electronic Filing Procedures, http:// www.usitc.gov/secretary/ fed_reg_notices/rules/documents/ handbook_on_electronic_filing.pdf ; persons with questions regarding electronic filing should contact the Secretary at 202–205–2000. Any submissions that contain confidential business information must also conform with the requirements of section 201.6 of the Commission’s Rules of Practice and Procedure (19 CFR 201.6). Section 201.6 of the rules requires that the cover of the document and the individual pages be clearly marked as to whether they are the ‘‘confidential’’ or ‘‘non- confidential’’ version, and that the confidential business information be clearly identified by means of brackets. All written submissions, except for confidential business information, will be made available in the Office of the Secretary to the Commission for inspection by interested parties.
The USTR stated that her office intends to make the Commission’s report in this investigation available to the public in its entirety and asked that the Commission not include any confidential business or national security information in this report. Consequently, the report that the Commission sends to the USTR will not contain any such information. Any
APPENDIX B FEDERAL REGISTER NOTICE 135
61907 Federal Register / Vol. 73, No. 202 / Friday, October 17, 2008 / Notices
confidential business information received by the Commission in this investigation and used in preparing its report will not be published in a manner that would reveal the operations of the firm supplying the information.
By order of the Commission.
Issued: October 10, 2008.
Marilyn R. Abbott,
Secretary to the Commission.
[FR Doc. E8–24607 Filed 10–16–08; 8:45 am]
BILLING CODE 7020–02–P
INTERNATIONAL TRADE COMMISSION
[Investigation No. 701–TA–431 (Review)]
Drams and Dram Modules From Korea
AGENCY: United States International Trade Commission. ACTION: Termination of five-year review.
SUMMARY: The subject five-year review was initiated in July 2008 to determine whether revocation of the countervailing duty order on DRAMs and DRAM modules from Korea would be likely to lead to continuation or recurrence of material injury. On October 3, 2008, the Department of Commerce published notice that it was revoking the order effective August 11, 2008, ‘‘{b}ecause the domestic interested party did not file a substantive response by the applicable deadline and has withdrawn its notice of intent to participate in this sunset review * * *’’ (73 FR 57594). Accordingly, pursuant to section 751(c) of the Tariff Act of 1930 (19 U.S.C. 1675(c)), the subject review is terminated.
DATES: Effective Date: August 11, 2008. FOR FURTHER INFORMATION CONTACT: Mary Messer (202–205–3193), Office of Investigations, U.S. International Trade Commission, 500 E Street, SW., Washington, DC 20436. Hearing- impaired individuals are advised that information on this matter can be obtained by contacting the Commission’s TDD terminal on 202– 205–1810. Persons with mobility impairments who will need special assistance in gaining access to the Commission should contact the Office of the Secretary at 202–205–2000. General information concerning the Commission may also be obtained by accessing its Internet server (http:// www.usitc.gov).
Authority: This review is being terminated under authority of title VII of the Tariff Act of 1930; this notice is published pursuant to section 207.69 of the Commission’s rules (19 CFR 207.69).
By order of the Commission. Issued: October 10, 2008.
Marilyn R. Abbott,
Secretary to the Commission.
[FR Doc. E8–24601 Filed 10–16–08; 8:45 am]
BILLING CODE 7020–02–P
INTERNATIONAL TRADE COMMISSION
[USITC SE–08–028]
Government in the Sunshine Act Meeting Notice
AGENCY HOLDING THE MEETING: United States International Trade Commission.
TIME AND DATE: October 21, 2008 at 11 a.m.
PLACE: Room 101, 500 E Street SW., Washington, DC 20436, Telephone: (202) 205–2000.
STATUS: Open to the public.
MATTERS TO BE CONSIDERED: 1. Agenda for future meetings: none. 2. Minutes. 3. Ratification List. 4. Inv. Nos. 731–TA–1131–1134
(Final)(Polyethylene Terephthalate Film, Sheet, and Strip from Brazil, China, Thailand, and the United Arab Emirates)—briefing and vote. (The Commission is currently scheduled to transmit its determinations and Commissioners’ opinions to the Secretary of Commerce on or before October 31, 2008.)
5. Outstanding action jackets: none. In accordance with Commission
policy, subject matter listed above, not disposed of at the scheduled meeting, may be carried over to the agenda of the following meeting.
By order of the Commission.
Issued: October 14, 2008.
William R. Bishop,
Hearings and Meetings Coordinator.
[FR Doc. E8–24769 Filed 10–16–08; 8:45 am]
BILLING CODE 7020–02–P
DEPARTMENT OF JUSTICE
Notice of Lodging of Amended Consent Decree; Under the Comprehensive Environmental Response, Compensation, and Liability Act of 1980 (‘‘CERCLA’’)
Consistent with Section 122(d) of the Comprehensive Environmental Response, Compensation, and Liability Act of 1980, as amended (‘‘CERCLA’’), 42 U.S.C. 9622(d), and 28 CFR 50.7, notice is hereby given that on October 7, 2008, the United States lodged an Amended Consent in United States of
America v. Lockheed Martin Corporation, et al., Civil No. 4:02–cv– 146 (USDC W.D. Ky.) for the Green River Landfill Superfund Site, located in Maceo, Daviess County, Kentucky (the ‘‘Site’’). This Court originally approved a Consent Decree in this matter on September 27, 2002. Since the time the original Consent Decree was approved by the Court, the ‘‘Settling Defendants’’ as defined therein, and the United States Environmental Protection Agency (‘‘EPA’’) have been unable to implement the institutional controls required at the Site by Section IX of the Consent Decree. Under the proposed Amended Consent Decree, one ‘‘Settling Defendant,’’ Browning-Ferris Industries of Kentucky, Inc. (‘‘BFIKY’’) has or will acquire the property needed to institute the necessary institutional controls and, after entry of the Amended Consent Decree, will transfer such property to de maximus inc., defined in the proposed Amended Consent Decree as the ‘‘Owner Settling Defendant.’’ In addition, BFIKY will donate another parcel to Daviess County, which desires to keep it as open space. These property transfers will permit the remaining defendants to institute the required institutional controls and the open space will be an important buffer around the Site.
Under the proposed Amended Consent Decree, in exchange for the property transfers referenced above, BFIKY will have no further obligations under the Amended Consent Decree and will receive from the United States a covenant not to sue or to take administrative action pursuant to Sections 106 or 107 of Comprehensive Environmental Response, Compensation, and Liability Act of 1980 (‘‘CERCLA’’), 42 U.S.C. 9606 and 9607 as amended, and Section 7003 of the Resource Conservation and Recovery Act (‘‘RCRA’’), 42 U.S.C. 6973, for the United States’ past and future costs at the Site. The remaining Settling Defendants will receive from the United States a covenant not to sue or to take administrative action pursuant to Sections 106 and 107 of CERCLA, 42 U.S.C. 9606 and 9607 as amended, and Section 7003 of RCRA, in exchange for implementing the remedy and required institutional controls at the Site and paying EPA’s remaining costs under the terms of the proposed Amended Consent Decree.
The Department of Justice will receive for a period of thirty (30) days from the date of this publication comments relating to the Consent Decree Amendments. Comments should be addressed to the Assistant Attorney General, Environment and Natural
sro
bert
s o
n P
RO
D1P
C70 w
ith N
OT
ICE
S


Appendix C
Positions of InterestedParties
137

INTRODUCTION 139
Introduction
The summaries of the positions of interested parties are based oninformation provided at a public hearing held January 8, 2009 and materialsubmitted to the USITC in conjunction with this investigation. The U.S.Association of Importers of Textiles and Apparel, the Sweetener UsersAssociation, and the U.S. Industrial Users Coalition provided testimonyat the hearing. The U.S. Association of Importers of Textiles and Appareland the Sweetener Users Association submitted prehearing and posthearingbriefs. Additionally, the American Sugar Alliance, the Meat ImportersCouncil of America, and the National Milk Producers Federation, all ofwhom did not participate in the hearing, made posthearing submissions.
The summaries express the views of the submitting parties and notthose of the Commission, whose staff did not attempt to confirm theaccuracy of or make corrections to the information provided. The fulltext of the hearing testimony and written submissions associated withthe Economic Effects of Significant U.S. Import Restraints, Sixth Update(investigation no. 332-325) can be found by searching the Commission’sElectronic Docket Information System (http://searchapp.usitc.gov/edis3/app).
American Sugar Alliance1
The American Sugar Alliance (ASA) represents domestic sugar beetand sugarcane growers, sugar beet refiners, sugarcane millers, cane sugarrefiners, and providers of goods and services to the domestic sugar industry.The ASA reiterates its position in prior Commission import restraintinvestigations and states that previous Commission analyses regarding U.S.import restraints on sugar have been fundamentally flawed. The ASA statesthat the Commission has underestimated sugar industry employment andthe price effects that would result from sugar import-tariff elimination. TheASA further states that the Commission has overestimated the extent towhich domestic food manufactures would pass any savings from lowersugar prices to consumers, the consumer demand reaction to any suchsavings, the gain in exports of sweetened products, the growth in foodmanufacturing industry employment, and the capacity of U.S. cane sugar
1ASA, written submission to the USITC, February 6, 2009.
140 APPENDIX C POSITIONS OF INTERESTED PARTIES
refiners to process larger quantities of imported raw cane sugar. The ASAalso maintains that the Commission ignored quality and safety concernsregarding increased imports of refined sugar for human consumption thatoccurred as a result of weather disasters in 2005. The ASA concluded thatlifting import restraints in the sugar sector would have a more damagingeffect on U.S. producers and a less beneficial effect on U.S. consumersthan indicated in previous Commission analyses.
Meat Importers Council of America2
The Meat Importers Council of America (MICA) represents the inter-ests of U.S. importers of fresh, chilled, and frozen beef into the UnitedStates. It states that its regular members account for most non-NAFTAimports of fresh, chilled, or frozen beef. Its members also include somewho provide associated services, such as customs brokers and refrigeratedwarehouses.
MICA states that it is incorrect to view domestic and imported beef asdirectly competitive and instead asserts that they are complementary. Mostdomestic beef is grain-fed and table-ready, while imported beef is grass-fedand destined for manufacturing use. MICA notes that lean beef is mixedwith fat trimmings that are a byproduct of grain-fed beef production inorder to achieve the desired fat content to produce processed beef productssuch as hamburgers, meat balls, and hot dogs. Further, MICA states thatimported frozen lean beef is not directly competitive with domestic leanbeef, which is normally not frozen, because processors require a mix offresh and frozen beef. The difference between imported and domestic beefis highlighted by the discrepancy in prices that generally exists betweenimported and domestic beef.
According to MICA, curtailing beef imports would not aid U.S. cattleproducers because these producers have not been adversely affected byimports. MICA argues that returns to cattle producers have been at recordhighs for several years and that the recent downturn in 2008 cannot beattributed to imports because imports of beef declined sharply in 2008. Inthe past 5 years, the discovery of BSE severely impacted beef trade flowsin North America. MICA asserts that the resulting increased supply of beefin the domestic market could not meet the needs of domestic grinders and
2MICA, written submission to the USITC, February 6, 2009.
NATIONAL MILK PRODUCERS FEDERATION 141
processors for manufacturing grade beef. According to MICA, the factorthat has had the biggest negative impact on the profitability of beef tradehas been the unprecedented rise in feed costs as a result of the increaseduse of corn to produce ethanol.
MICA states that imports of beef in the United States have fallen inrecent years because of the decline in cattle stock since 2006. Further, aweak U.S. dollar and strong demand from Europe and Russia combinedto attract product from suppliers who had traditionally supplied the U.S.market, creating a shortage of frozen beef in the United States. MICAasserts that this has forced processors to freeze fresh domestic beef despitethe resulting additional cost.
MICA asks that the Commission not listen to requests to treat live cattleas a perishable commodity. It asserts that in many other cases (such asCommerce Department dumping cases, the CBERA, and the Andean TradePreference Act) live cattle are not considered perishable, and asks that thisrule be followed in trade statutes. MICA does not view cattle as a foodproduct that will perish or decay beyond marketability within a limitedperiod of time. MICA looks forward to an analysis by the Commissionthat considers imported beef not just as a product that competes to a limiteddegree with U.S. beef (as it has been treated historically), but as a productthat complements the U.S. beef industry. MICA argues that both effectsshould be integrated into the ITC’s economic model so that more balancedand accurate conclusions may be reached.
National Milk Producers Federation3
The National Milk Producers Federation (NMPF) represents U.S. dairyproducers and cooperatives that are collectively owned. It states that themembers of the 31 cooperatives that it represents produce the majority ofthe U.S. milk supply.
The NMPF states that many countries maintain a variety of importrestraints, subsidies, and other trade distortions that affect the world dairymarket. Levels of protection differ widely between countries even for thesame product, such as skim milk powder. According to them, U.S. importrestraints are designed, in part, to counteract the exorbitant levels of exportsubsidies in the EU.
3NMPF, written submission to the USITC, February 6, 2009.
142 APPENDIX C POSITIONS OF INTERESTED PARTIES
The NMPF acknowledges that the United States imposes TRQs on anumber of dairy products and operates a price support program to supportthe domestic dairy industry. Despite this, the NMPF says that the U.S.dairy industry cannot be accurately described as highly protected. Of theapproximately 400 HTS tariff lines that relate to dairy, approximately one-third are subject to low, fixed tariffs or are duty-free. An NMPF analysisshows that in practice, significant import restraints apply to less than one-half of dairy products.
The NMPF draws the Commission’s attention to one notable exceptionto the U.S. TRQ framework, namely milk protein concentrate (MPC), ca-sein, and caseinates. Imports of these products enjoy virtually unrestrictedaccess to U.S. dairy markets, are increasing in importance, and may growto such an extent that they interfere with the operation of the dairy pricesupport system.
Sweetener Users Association4
The Sweetener Users Association (SUA) represents users of sugar,including confectioners, beverage companies, food manufacturers, bakers,dairy product manufacturers, cereal makers, and other companies andtrade associations.5 The SUA states that the current system of importrestraints on sugar is inefficient and negatively affects domestic sugarusers and consumers. The SUA states that changes in the price of sugarare eventually passed through to the consumer, although there have beenperiods in which prices remained the same.6 The SUA focuses on recentdevelopments that have affected the sweetener trade. First, as of January 1,2008, trade in sweeteners with Mexico was fully liberalized under NAFTA.The SUA states that, while this could increase the availability of importedsugar, the U.S. sugar industry has attempted to manage such trade. Second,SUA notes that the 2008 farm bill made several significant changes thatnegatively affect the availability of sugar imports.7 These changes involvesetting the WTO TRQs at minimum commitment levels and setting morerestrictive conditions for raising them, setting a guaranteed domesticmarket share of 85 percent for domestic producers, and establishing a
4SUA, written submissions to the USITC, December 11, 2008, and February 5, 2009;USITC, Hearing transcript, January 8, 2009, 12-19 (testimony of Thomas Earley, SUA).
5SUA, written submission to the USITC, December 11, 2008, 1.6SUA, written submission to the USITC, February 5, 2009.7USITC, Hearing transcript, January 8, 2009, 14 (testimony of Thomas Earley, SUA).
U.S. INDUSTRIAL USERS COALITION 143
feedstock flexibility program whereby surplus sugar must be converted toethanol. Third, the SUA states that several characteristics of the TRQsnegatively impact U.S. sugar users and consumers. The SUA notes that thehistorical basis for the establishment of the TRQs is outdated and results ininefficiencies such as shortfalls and that the HTS classification boundarybetween raw and refined sugar is compromising the administration of theTRQs. The SUA urges a modern market-based and efficient sugar policy, arestructuring of the TRQ system, and a thorough study of both the refinedand raw sugar price gaps and their employment impact. The SUA statesthat present U.S. sugar policies are poorly designed and distort markets tothe long-term detriment of the entire sugar industry.
U.S. Industrial Users Coalition8
The U.S. Industrial Users Coalition (USIUC) states that it representsthe interests of U.S. manufacaturers that use imported raw materials andother inputs.9 It stated that in order to compete globally from theirU.S. manufacturing bases, its members need access to inputs at globallycomptetive prices.
The USIUC claims that the Commission’s analysis of the impacts ontrade of lowering or removing import restraints is incomplete; the USITCspecifically excludes certain import restraints from its analysis that hamperthe ability of U.S. companies to compete globally. The USIUC statedthat the largest category of remaining import restraints is antidumpingand countervailing duties (AD/CVD). It added that AD/CVD orders canprovide important protection against truly unfair trade practices, but theymay also have negative effects on the U.S. economy if they are misappliedor continue beyond their effective date. The coalition provided informationat the hearing about the potential negative impacts of AD/CVD importrestrictions on U.S. manufacturers.10 The Coalition maintains that boththe positive and negative effects of AD/CVD policies should be brought tolight.
8USIUC, written submission to the USITC, February 6, 2009; USITC, Hearingtranscript, January 8, 2009, 20-26 (testimony of Laurin Baker, USIUC).
9The USIUC stated that it has members in a variety of industries, such as theautomotive, heavy equipment, and appliance industries; however, its members are notpublicly listed because of concerns about retaliation from suppliers.
10USIUC, Hearing transcript, January 8, 2009, 20–26 (testimony of Laurin Baker,USIUC).
144 APPENDIX C POSITIONS OF INTERESTED PARTIES
According to USIUC, in recent years U.S. manufacturers have rou-tinely experienced severe problems in securing adequate supplies ofraw materials and basic inputs at world prices for their manufacturingprocesses, making it difficult for them to compete globally from theirU.S. manufacturing base (USIUC points to steel as one such example). Inthe Coalition’s view, both domestic producers of raw materials and basicinputs and their customers would benefit if U.S. industrial users were ableto compete globally from their U.S. manufacturing base. The Coalitionadded that free trade in raw materials and basic inputs to manufacturingwould strengthen the U.S. manufacturing base that relies on these inputs,thereby improving the long-term viability of domestic producers of thoseraw materials and basic inputs. The Coalition states that industrial users donot participate in the process to determine whether and at what level traderelief should be granted, even though such industrial users must pay thecost if the relief is improperly granted or if it continues beyond such timeas it is needed. The Coalition urges the ITC to be aware of the potentialmisuse of laws that protect domestic industries against predatory and unfairtrade practices.
U.S. Association of Importers of Textiles andApparel11
The U.S. Association of Importers of Textiles and Apparel (USA-ITA) states that it represents the interests of approximately 200 U.S. firms,including retailers, apparel manufacturers, distributors, and related serviceproviders. It indicates that one of its roles is to articulate and advocatethe concerns and interests of the textile and apparel importing communitybefore Congress, the executive branch agencies, and the courts.12 Inits submissions to and testimony before the Commission, the USA-ITAindicates that although the United States eliminated the remaining quotason imports of textiles and apparel at the end of 2008, significant importrestraints remain in the form of high tariffs (including compound tariffs)and complicated requirements pertaining to rules of origin (ROOs) underU.S. preference programs and free trade areas.
11USA-ITA, written submissions to the USITC, December 11, 2008, and February 6,2009; USITC, Hearing transcript, January 8, 2009, 6-12 (testimony of Brenda Jacobs,USA-ITA).
12USA-ITA Web site. http://www.usaita.com/685.html (accessed January 8, 2009).
U.S. ASSOCIATION OF IMPORTERS OF TEXTILES AND APPAREL 145
The USA-ITA states that textiles and apparel will be imported into theUnited States in 2009 without absolute quotas for the first time in nearly 50years.13 It expressed the view that the termination of quotas on textile andapparel imports from China on December 31, 2008 would only minimallyaffect prices because most of the quotas were not binding, resulting inlow quota rents on the 34 affected products during 2005-07.14 It statesthat it now intends to focus its efforts on lowering tariffs on U.S. importsof textiles and apparel, which it said remain high compared with dutieson other manufactured items. The USA-ITA notes that while textile andapparel imports accounted for 5 percent of total entered value in fiscalyear 2008, such imports represented 42 percent of total duties collectedduring the same period.15 Further, the association pointed out the “highlyregressive” nature of the U.S. tariff schedule, citing higher tariffs on man-made-fiber garments than on “luxury” garments of silk or cashmere.16
According to the USA-ITA, burdensome ROOs also constitute asignificant import restraint, as they increase the costly risk of non-compliance and even discourage the use of U.S. trade preference programsand free trade agreements. It stated that complicated ROOs also increasecompliance costs for U.S. importers by adding costs related to training inrelevant rules and processes, paperwork to certify compliance, hiring staffto oversee and handle compliance issues, and legal fees associated withensuring and confirming compliance. The USA-ITA indicated that suchcosts can discourage U.S. importers from utilizing the preference programsin order to reduce potential errors and other risks; in some cases, the risksof non-compliance offset the potential benefits from lower duties under theprograms.17
The USA-ITA indicated in its prehearing brief that U.S. employment intextiles and apparel decreased from 1990 to 2007 despite significant levelsof protection in the U.S. market in the form of quotas and high tariffs.18 Itpoints out that clothing stores, clothing accessory stores, and departmentstores employed roughly 3.2 million workers in 2007, equal to roughly six
13USA-ITA, written submission to the USITC, December 11, 2008, 1.14USITC, Hearing transcript, January 8, 2009, 28 (testimony of Brenda Jacobs, USA-
ITA).15USA-ITA, written submission to the USITC, December 11, 2008, 1; USITC, Hearing
transcript, January 8, 2009, 98 (testimony of Brenda Jacobs, USA-ITA).16USITC, Hearing transcript, January 8, 2009, 9 (testimony of Brenda Jacobs, USA-
ITA).17USA-ITA, written submission to the USITC, February 6, 2009, 4.18USA-ITA, written submission to the USITC, December 11, 2008, 4.
146 APPENDIX C POSITIONS OF INTERESTED PARTIES
times the size of textile and apparel employment in the United States.19
From such data, the USA-ITA concluded that protection has not stoppedjob loss in the sector, but has added to the price that consumers pay forapparel.20
Bibliography
American Sugar Alliance (ASA). Written submission to the U.S.International Trade Commission in connection with inv. no.332-325, The Economic Effects of Significant U.S. ImportRestraints: Sixth Update, February 6, 2009.
Meat Importers Council of America (MICA). Written submission to theU.S. International Trade Commission in connection with inv. no.332-325, The Economic Effects of Significant U.S. ImportRestraints: Sixth Update, February 6, 2009.
National Milk Producers Federation (NMPF). Written submission to theU.S. International Trade Commission in connection with inv. no.332-325, The Economic Effects of Significant U.S. ImportRestraints: Sixth Update, February 6, 2009.
Sweetener Users Association (SUA). Written submission to the U.S.International Trade Commission in connection with inv. no.332-325, The Economic Effects of Significant U.S. ImportRestraints: Sixth Update, December 11, 2008.
———. Written submission to the U.S. International TradeCommission in connection with inv. no. 332-325, The EconomicEffects of Significant U.S. Import Restraints: Sixth Update,February 5, 2009.
19USA-ITA, written submission to the USITC, December 11, 2008, 6.20USITC, Hearing transcript, January 8, 2009, 10 (testimony of Brenda Jacobs, USA-
ITA).
BIBLIOGRAPHY 147
U.S. Association of Importers of Textiles and Apparel (USA-ITA).Written submission to the U.S. International Trade Commission inconnection with inv. no. 332-325, The Economic Effects ofSignificant U.S. Import Restraints: Sixth Update, December 11,2008.
———. Written submission to the U.S. International TradeCommission in connection with inv. no. 332-325, The EconomicEffects of Significant U.S. Import Restraints: Sixth Update,February 6, 2009.
U.S. Industrial Users Coalition (USIUC). Written submission to theU.S. International Trade Commission in connection with inv. no.332-325, The Economic Effects of Significant U.S. ImportRestraints: Sixth Update, February 6, 2009.
U.S. International Trade Commission (USITC). Hearing transcript inconnection with inv. no. 332-325, The Economic Effects ofSignificant U.S. Import Restraints: Sixth Update, January 8, 2009.


Appendix D
Calendar of Public Hearing
149

APPENDIX D CALENDAR OF PUBLIC HEARING 151
CALENDAR OF PUBLIC HEARING
Those listed below appeared as witnesses at the United States Interna-tional Trade Commission’s hearing:
Subject: The Economic Effects of Significant U.S.Import Restraints: Sixth Update
Inv. No.: 332-325Date and Time: January 8, 2009 - 9:30 a.m.
Sessions were held in connection with this investigation in the MainHearing Room (room 101), 500 E Street, S.W., Washington, D.C.
ORGANIZATION AND WITNESS:
Sidley Austin LLPWashington, D.C.on behalf of
U.S. Association of Importers of Textiles and Apparel, USA-ITA
Julia K. Hughes, Senior Vice President, USA-ITA
Brenda A. Jacobs ) - OF COUNSEL
Sweetener Users AssociationWashington, D.C.
Thomas Earley, Economic Consultant, Promar International
U.S. Industrial Users CoalitionWashington, D.C.
Laurin M. Baker, Executive Director
-END-

Appendix E
The USITC ModelingFramework
153

INTRODUCTION 155
Introduction
This appendix describes the USAGE model and presents tables thatshow details from the baseline and policy simulations.1
The distinguishing features of computable general equilibrium (CGE)models are related to the combination of scope and detail afforded by theframework: an economy-wide focus coupled with an explicit, detailedmodeling of multi-sectoral linkages and recognition of the interactionsbetween all flows in the economy. For example, CGE models considermarket interactions between producers and consumers for produced goodsand services, explicitly model upstream and downstream production andconsumption linkages, and address competition among industries for pri-mary factors (e.g. land, labor, and capital) and income transfers associatedwith quotas and tariffs.
The USAGE-ITC framework is similar to the framework employedin previous reports. Many behavioral and structural parameters of theprotected sectors are updated, and some innovations in the frameworkstructure have been incorporated.2 The most important changes includethe dynamic mechanisms contained in the current USAGE-ITC frameworkand the explicit modeling of tariff-rate quotas (TRQs).
Overview of the USAGE-ITC Framework
The USAGE-ITC framework has three components: (1) input-output(I-O) accounts for over 500 industries and more than 500 commodities,(2) behavioral parameters, and (3) a system of equations that constitute themodel specification or theory. The I-O accounts specify the transactionsamong all economic agents in the U.S. economy for 2005 (the base year inthis study), derived from I-O accounts for 498 industries and 40 types of
1The USAGE-ITC framework was developed at the Centre of Policy Studies, MonashUniversity in collaboration with the USITC. For a complete specification of the USAGE-ITC framework, see Dixon and Rimmer, “USAGE-ITC: Theoretical Structure,” April 2002.For more detail on the CGE approach to economic analysis, see Dixon and Rimmer,Dynamic General Equilibrium Modelling for Forecasting and Policy, 2002.
2Many of the import substitution elasticities, which describe the degree ofsubstitutability between imported and domestic products, were scrutinized and adjustedwhen necessary by USITC staff, based on industry knowledge and comparisons betweenU.S. -produced products and imports.
156 APPENDIX E THE USITC MODELING FRAMEWORK
final demand (i.e., imports, exports, private and government consumptionand investment expenditures, and inventory changes) published by theBureau of Economic Analysis, U.S. Department of Commerce.3
While the I-O accounts provide information on the initial equilibriumof the U.S. economy, a set of elasticities (i.e., behavioral parameters) helpthe framework determine how the economy would respond to a policychange.4 Examples of the types of elasticities used by USAGE-ITC are:
1. elasticities of substitution between imported and domestic goods2. elasticities of import supply3. elasticities of export demand4. elasticities of substitution between inputs in production5. income elasticities.
Where possible, the USITC has estimated some of these parameters usingtime series data, and otherwise, relied on published studies for estimates.With the exception of textiles and apparel and meatpacking, the elasticitiesof substitution between imported and domestic goods (i.e., the Armingtonelasticities) are documented in Donnelly et al.5 The Armington elasticitiesfor the meatpacking plants sector and for the textiles and apparel sectorsare based on Hertel et al.6
The final component of the USAGE-ITC framework is the system ofequations that model the U.S. economy. These equations characterizethree general conditions that, once solved simultaneously, represent anArrow-Debreu competitive general equilibrium.7 First, all constant returnsactivities must earn zero real economic profits at the margin, and allthe production technologies and preferences are derived from theoretical
3The 535 industries and 539 commodities in USAGE-ITC are derived from theindustries and final demands found in the BEA I-O accounts (see Dixon and Rimmer,“MONASH-USA: Creating a 1992 Benchmark Input-Output Database,” May 2001; andWinston, “Enhancing Agriculture and Energy Sector Analysis in CGE Modelling,” (2009)).
4An elasticity specifies the percentage change that occurs in an economic variable inresponse to a 1 percent change in another economic variable. For example, an incomeelasticity of demand for a good is the percentage change in demand for that good thatoccurs in response to a 1 percent change in household income.
5Donnelly et al., “Revised Armington Elasticities of Substitution,” January 2004.6The Armington elasticity for the beef-packing plants sector is the lower bound, while
the textiles and apparel elasticities are the mid-point estimates. See Hertel et al., “HowConfident Can We Be in CGE-Based Assessments?” May 2003.
7Debreu, The Theory of Value, 1959.
OVERVIEW OF THE USAGE-ITC FRAMEWORK 157
formulations constrained by these zero-profit conditions.8 Second, themarket for each product must clear such that supply equals demand.The third general condition is that income must balance (i.e., income isexhausted on final demand and savings).
Dynamic Mechanisms in the USAGE-ITC Model
The USAGE-ITC model contains four dynamic mechanisms that linksuccessive years:
1. capital at the start of year t equals capital at the end of year t − 1;
2. net foreign liabilities at the start of year t equals net foreign liabilitiesat the end of year t − 1;
3. public sector debt at the start of year t equals public sector debt atthe end of year t − 1; and
4. the deviation in the real wage rate away from its forecast path in yeart caused by a policy shock equals the deviation in year t − 1 plus aterm reflecting the gap in year t between the employment deviationand the deviation in labor supply.9
In addition, the following six assumptions underlie the simulations inthis report:
1. The simulated removal of significant import restraints has no effecton real national savings (household savings plus the public sectorsurplus divided by the price deflator for investment). Thus, it isassumed that the quantity of capital owned by U.S. residents isunaffected by the policy change.
2. Real government expenditures are not affected by the simulation.Thus, under assumptions 1 and 2, movements in real private con-sumption are interpreted as movements in economic welfare.
8Using the analogy in duality theory between cost and expenditure functions, allpreferences are captured in a zero-profit condition on the activity that produces utility orwelfare.
9For a more detailed discussion of the dynamic mechanisms in the USAGE-ITC modelsee Dixon and Rimmer, “Mini-USAGE: Reducing Barriers to Entry,” June 2005; and Dixonand Rimmer (2002), Dynamic General Equilibrium Modelling for Forecasting and Policy,2002.
158 APPENDIX E THE USITC MODELING FRAMEWORK
3. Real private consumption is related to real disposable income. Thegovernment adjusts the tax rate on labor income to ensure that thepolicy-induced movement in real private consumption is consistentwith maintenance of real national savings.
4. Real wage rates adjust sluggishly so that the policy has no effect onaggregate employment in the long run. The policy has no effect ontechnology or consumer preferences in the simulation.
5. The policy has no effect on the aggregate price index for privateconsumption in the simulation; that is, the aggregate price index forprivate consumption is the numeraire price.10
Specification of the USAGE-ITC Model
The following sections describe briefly the four key components of theUSAGE-ITC model: final demand behavior, production technology, factorsupplies, and the trade equilibrium.11
Final Demand Behavior
The USAGE-ITC model considers three separate components of do-mestic final demand: household consumption, government demand, andinvestment demand.
Household consumption is derived from a linear expenditure system(LES) of commodity demands, which is based on the Stone-Geary orKlein-Rubin utility function.12 The LES is a generalization of the Cobb-Douglas utility function in which the origin is translated such that incomeelasticities can differ from unity. While the income expansion paths are
10The numeraire price is the price relative to which all other prices and income aremeasured in this analysis.
11For a complete specification of the USAGE-ITC framework, see Dixon and Rimmer,“USAGE-ITC: Theoretical Structure,” April 2002.
12For an introduction to the LES, see chap. 5 of Layard and Walters, MicroeconomicTheory 1978; chap. 3 of Deaton and Muellbauer, Economics and Consumer Behavior,1980; app. A.5 of Dervis, de Melo, and Robinson, General Equilibrium Models forDevelopment Policy, 1982; chap. 11 of Silberberg, The Structure of Economics, 1990; andchap. 2 of Chung, Utility and Production Functions, 1994.
OVERVIEW OF THE USAGE-ITC FRAMEWORK 159
linear, the displaced origin allows preferences to be nonhomothetic.13
Practically, this allows consumers’ relative preferences for goods andservices to vary with their income levels.
In the specification of government demand, real government spendingis exogenous and fixed. This assumption is imposed on the model toreflect the belief that trade policy changes do not directly influence thespending behavior of governments. Exogenous real government spendingis accommodated by endogenously adjusting government transfers tohouseholds such that changes in government revenues are compensatedvia a tax.
In modeling investment demand, investors (or “capital creators”) inan industry are assumed to choose their input mix to minimize the costsof producing capital subject to a constant-returns-to-scale capital-creationfunction. The only prices affecting the demand for domestic and importedinputs to capital creation are the prices of these inputs.14
Production Technology
Production technologies are modeled using nested combinations ofconstant ratios of elasticities of substitution, homothetic (CRESH), con-stant elasticity of substitution (CES), Cobb-Douglas and Leontief func-tions. Figure E.1 illustrates these relationships.
In the lower half of figure E.1, a primary-factor composite andintermediate-goods composites are combined to produce output of a givencommodity. At this level, it is assumed that the primary factor bundle andthe intermediate goods composite are combined in nearly fixed proportions(i.e. close to a Leontief specification), reflecting assumptions regardingthe technical constraints on their substitutability in production. This ishandled by setting the relevant substitution elasticities to relatively smallvalues. Each intermediate goods composite is created via an Armington(CES) nest of the domestic and foreign sources. The primary factor
13Homothetic preferences imply that the ratio of consumption of any two goods isthe same for all income levels, i.e. the income expansion paths are linear and they passthrough the origin; and the income elasticities are unitary (see Silberberg, The Structure ofEconomics, 1990.). Preferences that do not have this property are known as nonhomotheticpreferences.
14Unlike current production, for capital creation there are no inputs of primary factors.The use of primary factors in capital creation is recognized via inputs of construction andother investment-related services.
160 APPENDIX E THE USITC MODELING FRAMEWORK
composite is created in the “value-added nest” where land, capital, andlabor substitution possibilities are based on the CRESH specification.15
Capital and labor units are the results of nesting functions of investmentgoods and occupations, respectively, while investment goods flow throughfrom an Armington (CES) nest of the foreign and domestic sources.
In the upper half of figure E.1, it is assumed that domestic outputsof commodity i produced by industry j are supplied based on a CRETH(i.e., constant ratios of elasticities of transformation, homothetic) specifi-cation.16 The resulting combinations and relative outputs of commoditiesby an industry inform the notion of an industry “activity” level. This isstrictly distinct from the concept of “output” only in cases where industriescan make multiple products.
Factor Supplies
The supply of primary factors of production–land, labor, and capital–ischanging from year to year because of investment or exogenous changeswhich are reflected in the baseline.
Trade Equilibrium
For each commodity in USAGE-ITC, there is a distinction between twovarieties. There is a domestic variety destined for domestic consumption(DDi ) and exports and an imported variety (IMi ) or imports) destinedfor domestic consumption.17 In each case, the substitution possibilitiesbetween the domestic and the imported variety (i.e., the degree of productdifferentiation) are specified with a CES substitution parameter, ¾Di .Figure E.2 summarizes the structure of product differentiation, which isgenerally known as an Armington aggregation.18 The resulting output isthe composite commodity Ai , which is available for domestic absorption.19
15Hanoch, “CRESH Production Functions,” September 1971.16Dixon, Vincent, and Powell, “Factor Demand and Product Supply Relations in
Australian Agriculture,” 1976.17The treatment of traded goods follows de Melo and Robinson, “Product Differentiation
and the Treatment of Foreign Trade,” August 1989.18The CES elasticity ¾ is often referred to as the “Armington” elasticity; see Armington,
“A Theory of Demand for Products Distinguished by Place of Production,” March 1969.19Domestic absorption is the measure of both intermediate and final demand for a
product.
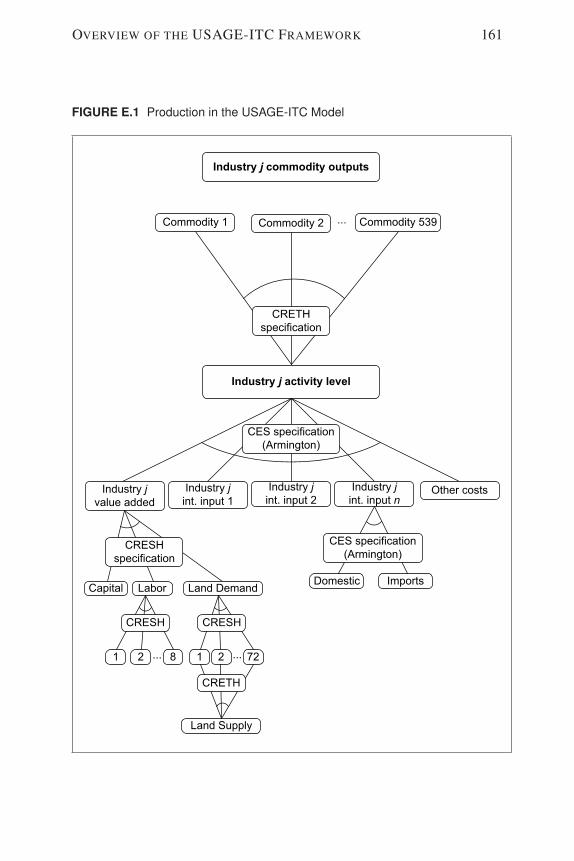
OVERVIEW OF THE USAGE-ITC FRAMEWORK 161
FIGURE E.1 Production in the USAGE-ITC Model
Commodity 1 Commodity 539Commodity 2
CRETH
specification
Industry j commodity outputs
Industry j activity level
Industry j
int. input 1
Industry j
int. input n
Industry j
int. input 2
CES specification
(Armington)
Other costsIndustry j
value added
Capital Land DemandLabor
CRESH
specification
821
CRESH
Domestic Imports
CES specification
(Armington)
7221
CRESH
CRETH
Land Supply
...
... ...
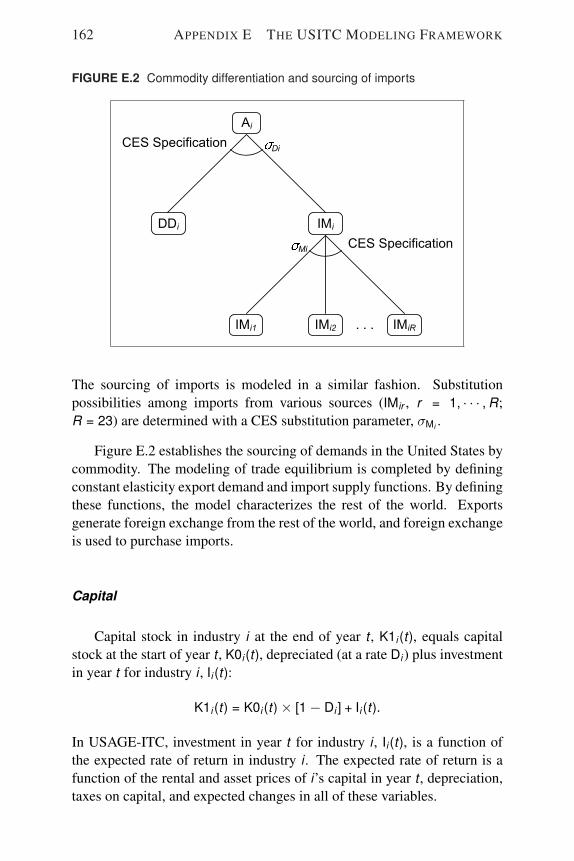
162 APPENDIX E THE USITC MODELING FRAMEWORK
FIGURE E.2 Commodity differentiation and sourcing of imports
Ai
DDi IMi
IMi1 IMiRIMi2
Di
Mi
CES Specification
CES Specification
. . .
The sourcing of imports is modeled in a similar fashion. Substitutionpossibilities among imports from various sources (IMir , r = 1, ⋅ ⋅ ⋅ , R;R = 23) are determined with a CES substitution parameter, ¾Mi .
Figure E.2 establishes the sourcing of demands in the United States bycommodity. The modeling of trade equilibrium is completed by definingconstant elasticity export demand and import supply functions. By definingthese functions, the model characterizes the rest of the world. Exportsgenerate foreign exchange from the rest of the world, and foreign exchangeis used to purchase imports.
Capital
Capital stock in industry i at the end of year t , K1i (t), equals capitalstock at the start of year t , K0i (t), depreciated (at a rate Di ) plus investmentin year t for industry i , Ii (t):
K1i (t) = K0i (t) × [1 − Di ] + Ii (t).
In USAGE-ITC, investment in year t for industry i , Ii (t), is a function ofthe expected rate of return in industry i . The expected rate of return is afunction of the rental and asset prices of i’s capital in year t , depreciation,taxes on capital, and expected changes in all of these variables.
OVERVIEW OF THE USAGE-ITC FRAMEWORK 163
Net Foreign Liabilities
Net foreign liabilities at the end of year t , NFL1(t), equal net foreignliabilities at the start of year t , NFL0(t), plus the current account deficit foryear t , CADEF(t):
NFL1(t) = NFL0(t) + CADEF(t).
The current account deficit for year t is imports less exports plus interestpayments for foreign liabilities less exports of royalties and less nettransfers from foreigners to U.S. residents. In USAGE-ITC all foreignliabilities are debt repayable in U.S. currency. In calculating interestcharges on the foreign debt we apply an interest rate to the start-of-yearforeign debt.
Public Sector Debt
Public sector debt at the end of year t , PSD1(t), equals public sectordebt at the start of year t , PSD0(t), plus the public sector deficit for year t ,GOVDEF(t):
PSD1(t) = PSD0(t) + GOVDEF(t).
In calculating net interest on public sector debt, we apply an interest rateto the start-of-year public sector debt.
Wage Determination in Policy Runs
In USAGE-ITC, real wages are sticky in the short run and flexible inthe long run. In this case, favorable shocks generate short-run gains inaggregate employment and long-run gains in real wages.
More specifically, in USAGE-ITC simulations, the deviation in thereal wage rate from its baseline forecast level increases at a rate that isproportional to the deviation in aggregate hours of employment from itsbaseline forecast level:
{Wp(t)Wf(t)
− 1}
={
Wp(t − 1)Wf(t − 1)
− 1}
+ ®×{
Ep(t − 1)Ef(t − 1)
− 1}
where Wp(t) and Wf(t) are the real before-tax wage rate in the policyand forecast runs in year t ; Ep(t) and Ef(t) are aggregate employment
164 APPENDIX E THE USITC MODELING FRAMEWORK
in the policy and forecast runs in year t ; and ® is a positive parameter.The coefficient of proportionality, ®, is chosen so that the employmenteffects of a shock to the economy are largely eliminated after five years.This model of wage determination is consistent with conventional macro-economic modeling in which the NAIRU (non-accelerating inflation rateof unemployment) is either exogenous or only weakly dependent on realwage rates.20
Significant Import Restraint Analysis with USAGE-ITC
The dynamic CGE analysis considers the effects of removing sig-nificant U.S. import restraints relative to a projection that incorporatesexpected changes in the United States over eight years.
USAGE-ITC is calibrated to 2005 data with the significant importrestraints in place.21 Simulation of significant import restraint removal isaccomplished by setting the relevant tariffs (and/or the tariff-equivalentsof quotas) and TRQ rates to zero, removing remaining TRQ quotas,and solving the model for new equilibrium prices and quantities. Acomparison of the new equilibrium prices and quantities to the baselineprices and quantities gives estimates of the economic effects of removingthe significant import restraints.
The USAGE-ITC model is solved for 535 industries and 539 commodi-ties and simulated effects are reported for certain sectors and commodities.To provide a summary of effects on the broad structure of the U.S.economy, effects are also reported for the following nine aggregates:22
1. Agriculture, forestry, and fishing2. Mining and mineral resources3. Construction4. Nondurable manufacturing
20If U∗ is the NAIRU and U is the observed unemployment rate, the NAIRU theorypostulates that: if U < U∗ for a few years, inflationary expectations rise, so that the inflationrate tends to accelerate; if U > U∗ for a few years, inflationary expectations fall, so that theinflation rate tends to slow; and if U = U∗, the inflation rate tends to stay the same.
21Tariffs are taken from official statistics of the U.S. Department of Commerce; the tariffequivalents of quotas are estimated by USITC staff.
22The nine aggregates cover all industries and commodities in USAGE-ITC, i.e., the nineaggregates include the sectors with significant import restraints.
OVERVIEW OF THE USAGE-ITC FRAMEWORK 165
5. Durable manufacturing6. Transportation, communication, and utilities7. Wholesale and retail trade8. Finance, insurance, and real estate9. Personal, business, and public services
For the purposes of this report, the main outputs of the USAGE-ITC modelreported are the equilibrium prices and quantities computed in solving thesystem of equations. The model also calculates a measure of the change ineconomic welfare due to trade liberalization. Under the assumptions statedearlier, the change in real private consumption provides a valid measure ofthe welfare impact of the policy change.
USAGE-ITC Data and Parameters
The USAGE-ITC data are based on (1) 2005 national income and prod-uct accounts data published by the Bureau of the Census, (2) the 1992 and1997 BEA I-O accounts, (3) 2005 trade flows from the U.S. Department ofCommerce (DOC), (4) the final text of free trade agreements provided bythe United States Trade Representative (USTR), (5) 2005 tariffs on U.S.exports from the United Nations Conference on Trade and Development(UNCTAD) Trade Analysis and Information System (TRAINS) and WorldTrade Organization (WTO) statistics, and (6) agriculture value-added datafrom the USDA ARMS survey.23 The other major inputs into the USAGE-ITC model are the elasticity parameters discussed earlier.
A quantitative analysis of the removal of significant U.S. importrestraints requires measures of the magnitudes of these restraints. Amongthese restraints, tariffs are readily quantifiable. For each sector, an averagead valorem rate is calculated using import data and estimated dutiescollected by the U.S. Treasury from official statistics of DOC.
The current version of USAGE-ITC explicitly models most U.S. TRQs.All three instruments of a TRQ are modeled: the quota level, as wellas the in-quota and over-quota tariff rates. The commodities with full
23For a complete discussion of the data, see Dixon and Rimmer, “MONASH-USA:Creating a 1992 Benchmark Input-Output Database,” May 2001; Dixon and Rimmer,“USAGE-ITC: Creating Historical Shocks for 1992 to 1998,” June 2003; and Dixon,Rimmer, and Tsigas, “Creating a USAGE-ITC Database for 2002,” February 2004.
166 APPENDIX E THE USITC MODELING FRAMEWORK
TRQs are raw cane and refined sugar; butter; cheese; dry dairy products;concentrated and evaporated dairy products; ice cream; ethanol; andtobacco.24
If the demand for imports is close to the trigger quantity that requiresthe over-quota duty rate, the economic agent who owns the right to trade atthe in-quota tariff rate could earn rents by charging higher prices. Removalof the TRQ would then transfer rents from those agents to the users of thecommodity in the form of lower prices. Market conditions, such as thedegree of competition and market power, as well as the ownership of rightsto trade at the in-quota tariff rate determine who earns economic rents.25
Based on research findings and earlier USITC work, it is assumed that (1)rents due to the butter and cheese TRQs are shared equally between U.S.and foreign traders and that (2) foreign traders capture TRQ rents due toall other TRQs.26 The assumption that foreign traders capture some or allTRQ rents is implemented in the USAGE-ITC model as a tax levied byforeign governments on exports to the United States. It is also assumedthat U.S. import tariff rates are equal to those observed in 2005 tradestatistics. The combined direct price impact of TRQ rents and the U.S.tariff rate is a price gap based on U.S. and world prices for 2005. Therelationship between price gap, U.S. import tariff, and TRQ rents is that (1+price gap/100) = (1+U.S. import tariff/100)×(1+rate of TRQ rents/100).
Setting the Exogenous Variables in the Forecast Simulation
In creating a forecast for the period 2005–13, we start with a completedataset (values for every model variable) for 2005. Then we apply shocksto exogenous variables to represent movements from their 2005 values totheir forecast values for 2013. The exogenous variables that are shockedin our 2005–13 forecast simulation can be partitioned into the followinggroups:
24While canned tuna is subject to a TRQ, it is not modeled as such in our framework.Because the vast majority of tuna imported to the United States enters over quota, the over-quota rate is used as the prevailing tariff to be removed.
25See Boughner, de Gorter, and Sheldon, “The Economics of Two-Tier Tariff-RateImport Quotas in Agriculture,” April 2000.
26USITC, The Economic Effects of Significant U.S. Import Restraints: Second Update1999, 1999, 52–53; USITC, The Economic Effects of Significant U.S. Import Restraints,First Biannual Update 1995, 1995, 4-9; Horning, Boisvert, and Blandford, “Explainingthe Distribution of Quota Rents for U.S. Cheese Imports,” April 1990, 1–20; and Horning,Boisvert, and Blandford, “Quota Rents and Subsidies,” 1990, 421–34.
OVERVIEW OF THE USAGE-ITC FRAMEWORK 167
1. Macro variables. Our shocks for these variables are derived fromforecasts made by U.S. government agencies.
2. Technology and consumer preferences. Our shocks for these vari-ables are obtained from extrapolations from historical simulations.
3. Shifts in foreign demand curves for U.S. products and foreign-currency prices for U.S. imports. Our shocks for these variables arederived mainly from extrapolations from historical simulations.
4. Interest, dividend, and revaluation rates for U.S. foreign assetsand liabilities. Our shocks for these variables are derived fromextrapolations from historical simulations.
Macro Variables
The macroeconomic assumptions underlying our baseline forecasts for2005–13 are based on forecasts from the Congressional Budget Office,the U.S. Department of Agriculture, the U.S. Bureau of Labor Statistics,and the U.S. Energy Information Administration. For variables for whichforecasts are provided by more than one agency, there is a high degree ofconsensus.
Technology and Consumer Preferences, Exports and Imports
USAGE-ITC contains many technology and preference variables.Technology variables in USAGE-ITC are predominantly of the input- oroutput-augmenting/savings type. Nearly all of the USAGE-ITC tech-nology and preference variables are treated exogenously in the 2005–13 forecast simulation and are given the same movements that they had,either endogenously or exogenously, in our historical simulation for 1998to 2005. Technology and preference variables that were given non-zeroshocks in 2005 to 2013 are listed in table E.1. The first of these, a1prim(j),imparts a uniform shock in industry j’s production function. Biasesin industry j’s primary-factor-saving technical change are introduced viaf twistlk(j). The a0ci(i , j) variables refer to shocks to the A0 variables in j’sproduction function. In our historical simulations, we have only aggregatedata on the use of commodity i as a margin service and as an inputto current production and capital creation. Consequently, our historicalsimulations reveal only a single value for commodity-i-using technicalchange which is projected forward from 2005 to 2013 through shocks to the
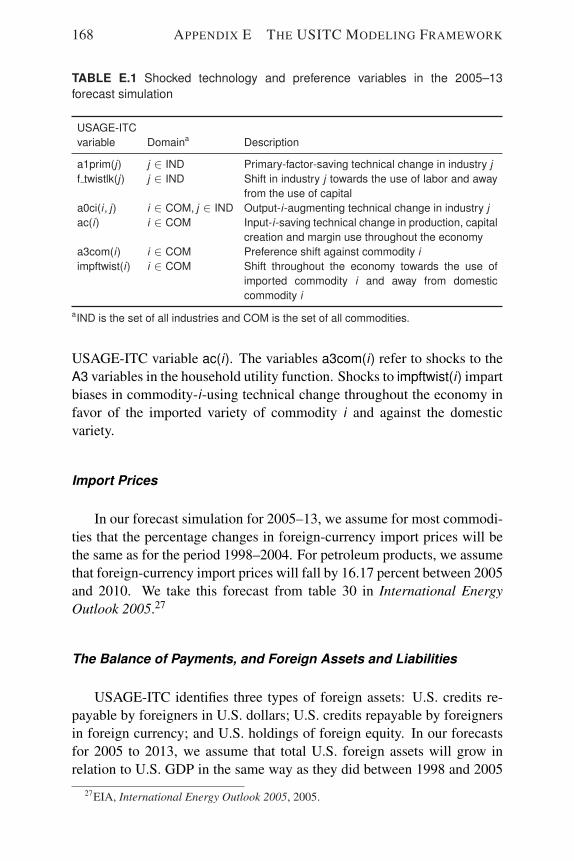
168 APPENDIX E THE USITC MODELING FRAMEWORK
TABLE E.1 Shocked technology and preference variables in the 2005–13forecast simulation
USAGE-ITCvariable Domaina Description
a1prim(j) j ∈ IND Primary-factor-saving technical change in industry jf twistlk(j) j ∈ IND Shift in industry j towards the use of labor and away
from the use of capitala0ci(i , j) i ∈ COM, j ∈ IND Output-i-augmenting technical change in industry jac(i) i ∈ COM Input-i-saving technical change in production, capital
creation and margin use throughout the economya3com(i) i ∈ COM Preference shift against commodity iimpftwist(i) i ∈ COM Shift throughout the economy towards the use of
imported commodity i and away from domesticcommodity i
aIND is the set of all industries and COM is the set of all commodities.
USAGE-ITC variable ac(i). The variables a3com(i) refer to shocks to theA3 variables in the household utility function. Shocks to impftwist(i) impartbiases in commodity-i-using technical change throughout the economy infavor of the imported variety of commodity i and against the domesticvariety.
Import Prices
In our forecast simulation for 2005–13, we assume for most commodi-ties that the percentage changes in foreign-currency import prices will bethe same as for the period 1998–2004. For petroleum products, we assumethat foreign-currency import prices will fall by 16.17 percent between 2005and 2010. We take this forecast from table 30 in International EnergyOutlook 2005.27
The Balance of Payments, and Foreign Assets and Liabilities
USAGE-ITC identifies three types of foreign assets: U.S. credits re-payable by foreigners in U.S. dollars; U.S. credits repayable by foreignersin foreign currency; and U.S. holdings of foreign equity. In our forecastsfor 2005 to 2013, we assume that total U.S. foreign assets will grow inrelation to U.S. GDP in the same way as they did between 1998 and 2005
27EIA, International Energy Outlook 2005, 2005.
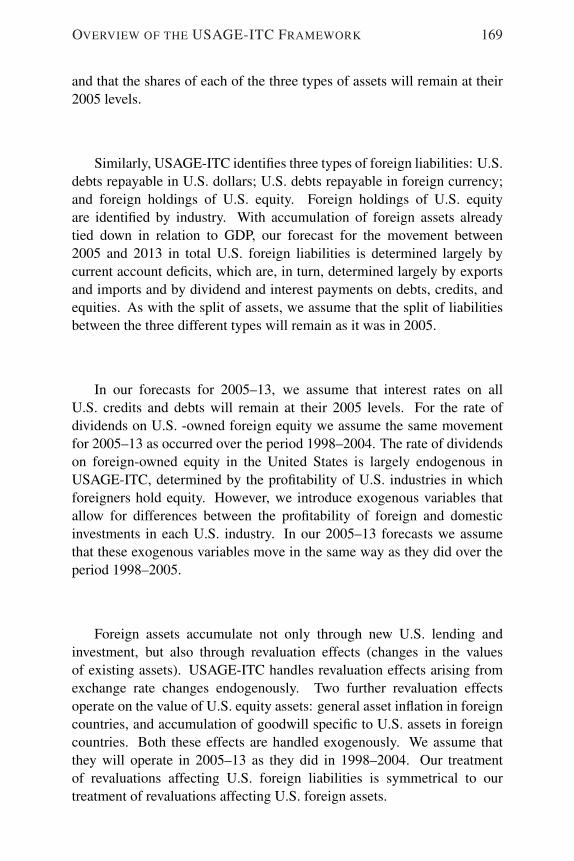
OVERVIEW OF THE USAGE-ITC FRAMEWORK 169
and that the shares of each of the three types of assets will remain at their2005 levels.
Similarly, USAGE-ITC identifies three types of foreign liabilities: U.S.debts repayable in U.S. dollars; U.S. debts repayable in foreign currency;and foreign holdings of U.S. equity. Foreign holdings of U.S. equityare identified by industry. With accumulation of foreign assets alreadytied down in relation to GDP, our forecast for the movement between2005 and 2013 in total U.S. foreign liabilities is determined largely bycurrent account deficits, which are, in turn, determined largely by exportsand imports and by dividend and interest payments on debts, credits, andequities. As with the split of assets, we assume that the split of liabilitiesbetween the three different types will remain as it was in 2005.
In our forecasts for 2005–13, we assume that interest rates on allU.S. credits and debts will remain at their 2005 levels. For the rate ofdividends on U.S. -owned foreign equity we assume the same movementfor 2005–13 as occurred over the period 1998–2004. The rate of dividendson foreign-owned equity in the United States is largely endogenous inUSAGE-ITC, determined by the profitability of U.S. industries in whichforeigners hold equity. However, we introduce exogenous variables thatallow for differences between the profitability of foreign and domesticinvestments in each U.S. industry. In our 2005–13 forecasts we assumethat these exogenous variables move in the same way as they did over theperiod 1998–2005.
Foreign assets accumulate not only through new U.S. lending andinvestment, but also through revaluation effects (changes in the valuesof existing assets). USAGE-ITC handles revaluation effects arising fromexchange rate changes endogenously. Two further revaluation effectsoperate on the value of U.S. equity assets: general asset inflation in foreigncountries, and accumulation of goodwill specific to U.S. assets in foreigncountries. Both these effects are handled exogenously. We assume thatthey will operate in 2005–13 as they did in 1998–2004. Our treatmentof revaluations affecting U.S. foreign liabilities is symmetrical to ourtreatment of revaluations affecting U.S. foreign assets.
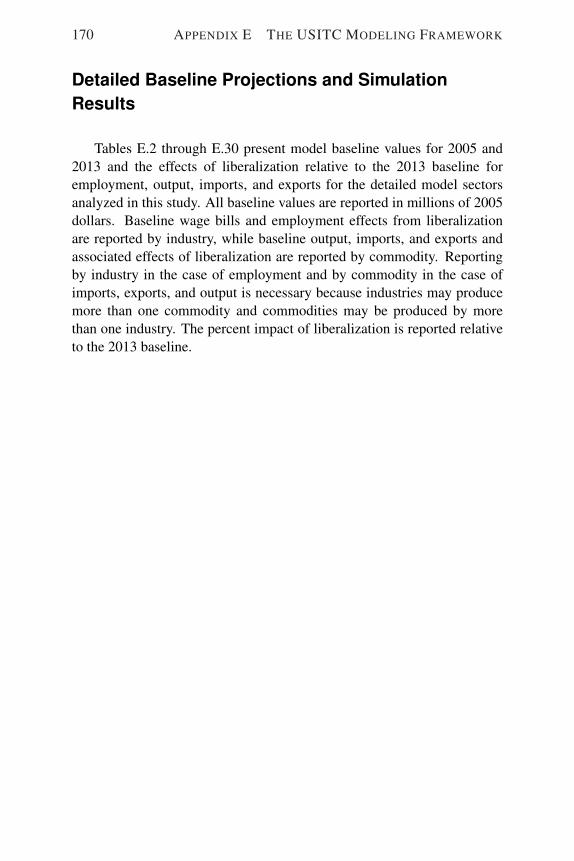
170 APPENDIX E THE USITC MODELING FRAMEWORK
Detailed Baseline Projections and SimulationResults
Tables E.2 through E.30 present model baseline values for 2005 and2013 and the effects of liberalization relative to the 2013 baseline foremployment, output, imports, and exports for the detailed model sectorsanalyzed in this study. All baseline values are reported in millions of 2005dollars. Baseline wage bills and employment effects from liberalizationare reported by industry, while baseline output, imports, and exports andassociated effects of liberalization are reported by commodity. Reportingby industry in the case of employment and by commodity in the case ofimports, exports, and output is necessary because industries may producemore than one commodity and commodities may be produced by morethan one industry. The percent impact of liberalization is reported relativeto the 2013 baseline.
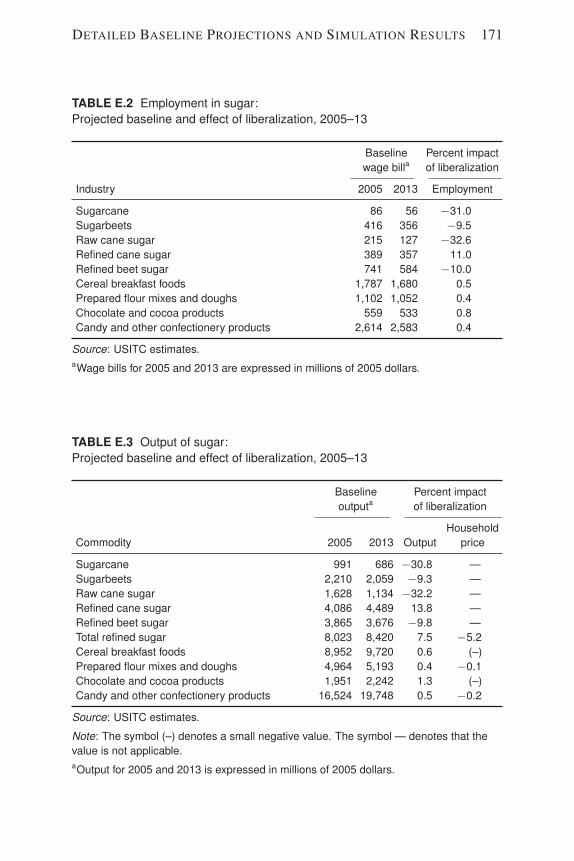
DETAILED BASELINE PROJECTIONS AND SIMULATION RESULTS 171
TABLE E.2 Employment in sugar:Projected baseline and effect of liberalization, 2005–13
Baseline Percent impactwage billa of liberalization
Industry 2005 2013 Employment
Sugarcane 86 56 −31.0Sugarbeets 416 356 −9.5Raw cane sugar 215 127 −32.6Refined cane sugar 389 357 11.0Refined beet sugar 741 584 −10.0Cereal breakfast foods 1,787 1,680 0.5Prepared flour mixes and doughs 1,102 1,052 0.4Chocolate and cocoa products 559 533 0.8Candy and other confectionery products 2,614 2,583 0.4
Source: USITC estimates.aWage bills for 2005 and 2013 are expressed in millions of 2005 dollars.
TABLE E.3 Output of sugar:Projected baseline and effect of liberalization, 2005–13
Baseline Percent impactoutputa of liberalization
HouseholdCommodity 2005 2013 Output price
Sugarcane 991 686 −30.8 —Sugarbeets 2,210 2,059 −9.3 —Raw cane sugar 1,628 1,134 −32.2 —Refined cane sugar 4,086 4,489 13.8 —Refined beet sugar 3,865 3,676 −9.8 —Total refined sugar 8,023 8,420 7.5 −5.2Cereal breakfast foods 8,952 9,720 0.6 (–)Prepared flour mixes and doughs 4,964 5,193 0.4 −0.1Chocolate and cocoa products 1,951 2,242 1.3 (–)Candy and other confectionery products 16,524 19,748 0.5 −0.2
Source: USITC estimates.
Note: The symbol (–) denotes a small negative value. The symbol — denotes that thevalue is not applicable.aOutput for 2005 and 2013 is expressed in millions of 2005 dollars.
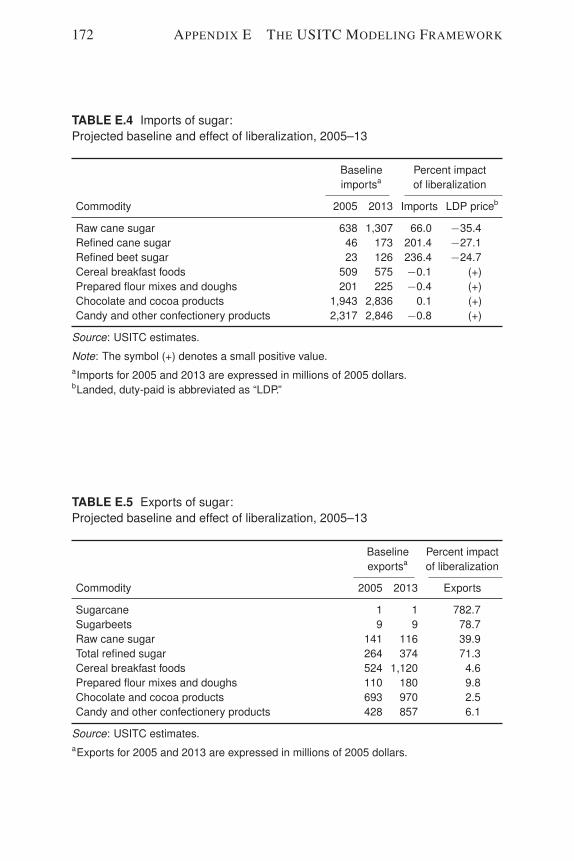
172 APPENDIX E THE USITC MODELING FRAMEWORK
TABLE E.4 Imports of sugar:Projected baseline and effect of liberalization, 2005–13
Baseline Percent impactimportsa of liberalization
Commodity 2005 2013 Imports LDP priceb
Raw cane sugar 638 1,307 66.0 −35.4Refined cane sugar 46 173 201.4 −27.1Refined beet sugar 23 126 236.4 −24.7Cereal breakfast foods 509 575 −0.1 (+)Prepared flour mixes and doughs 201 225 −0.4 (+)Chocolate and cocoa products 1,943 2,836 0.1 (+)Candy and other confectionery products 2,317 2,846 −0.8 (+)
Source: USITC estimates.
Note: The symbol (+) denotes a small positive value.aImports for 2005 and 2013 are expressed in millions of 2005 dollars.bLanded, duty-paid is abbreviated as “LDP.”
TABLE E.5 Exports of sugar:Projected baseline and effect of liberalization, 2005–13
Baseline Percent impactexportsa of liberalization
Commodity 2005 2013 Exports
Sugarcane 1 1 782.7Sugarbeets 9 9 78.7Raw cane sugar 141 116 39.9Total refined sugar 264 374 71.3Cereal breakfast foods 524 1,120 4.6Prepared flour mixes and doughs 110 180 9.8Chocolate and cocoa products 693 970 2.5Candy and other confectionery products 428 857 6.1
Source: USITC estimates.aExports for 2005 and 2013 are expressed in millions of 2005 dollars.
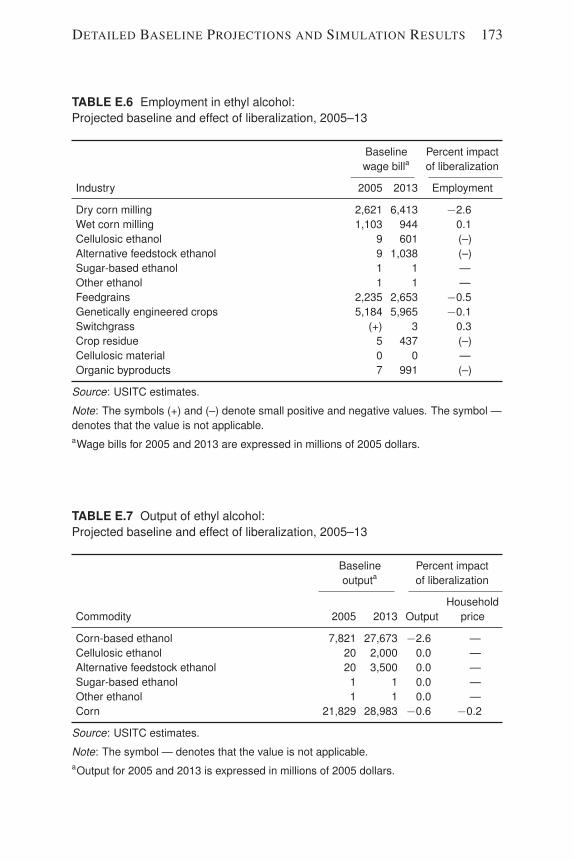
DETAILED BASELINE PROJECTIONS AND SIMULATION RESULTS 173
TABLE E.6 Employment in ethyl alcohol:Projected baseline and effect of liberalization, 2005–13
Baseline Percent impactwage billa of liberalization
Industry 2005 2013 Employment
Dry corn milling 2,621 6,413 −2.6Wet corn milling 1,103 944 0.1Cellulosic ethanol 9 601 (–)Alternative feedstock ethanol 9 1,038 (–)Sugar-based ethanol 1 1 —Other ethanol 1 1 —Feedgrains 2,235 2,653 −0.5Genetically engineered crops 5,184 5,965 −0.1Switchgrass (+) 3 0.3Crop residue 5 437 (–)Cellulosic material 0 0 —Organic byproducts 7 991 (–)
Source: USITC estimates.
Note: The symbols (+) and (–) denote small positive and negative values. The symbol —denotes that the value is not applicable.aWage bills for 2005 and 2013 are expressed in millions of 2005 dollars.
TABLE E.7 Output of ethyl alcohol:Projected baseline and effect of liberalization, 2005–13
Baseline Percent impactoutputa of liberalization
HouseholdCommodity 2005 2013 Output price
Corn-based ethanol 7,821 27,673 −2.6 —Cellulosic ethanol 20 2,000 0.0 —Alternative feedstock ethanol 20 3,500 0.0 —Sugar-based ethanol 1 1 0.0 —Other ethanol 1 1 0.0 —Corn 21,829 28,983 −0.6 −0.2
Source: USITC estimates.
Note: The symbol — denotes that the value is not applicable.aOutput for 2005 and 2013 is expressed in millions of 2005 dollars.
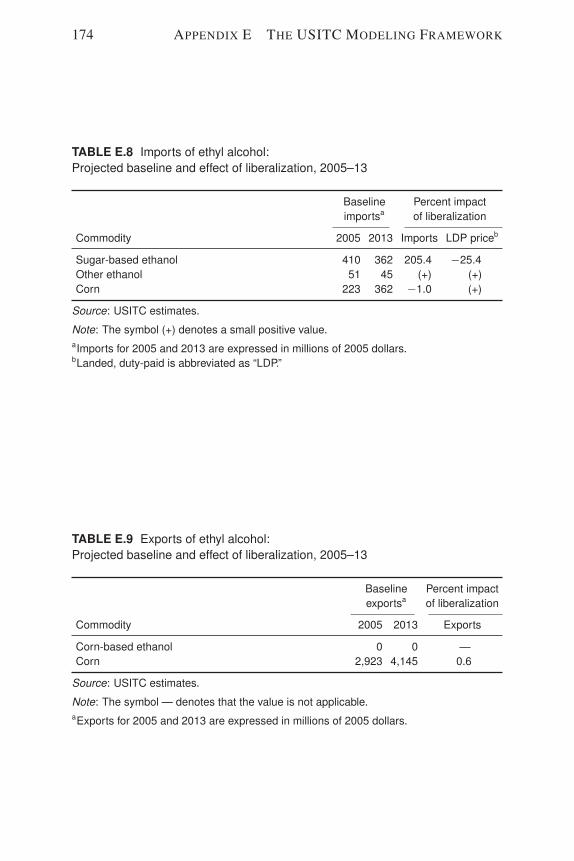
174 APPENDIX E THE USITC MODELING FRAMEWORK
TABLE E.8 Imports of ethyl alcohol:Projected baseline and effect of liberalization, 2005–13
Baseline Percent impactimportsa of liberalization
Commodity 2005 2013 Imports LDP priceb
Sugar-based ethanol 410 362 205.4 −25.4Other ethanol 51 45 (+) (+)Corn 223 362 −1.0 (+)
Source: USITC estimates.
Note: The symbol (+) denotes a small positive value.aImports for 2005 and 2013 are expressed in millions of 2005 dollars.bLanded, duty-paid is abbreviated as “LDP.”
TABLE E.9 Exports of ethyl alcohol:Projected baseline and effect of liberalization, 2005–13
Baseline Percent impactexportsa of liberalization
Commodity 2005 2013 Exports
Corn-based ethanol 0 0 —Corn 2,923 4,145 0.6
Source: USITC estimates.
Note: The symbol — denotes that the value is not applicable.aExports for 2005 and 2013 are expressed in millions of 2005 dollars.
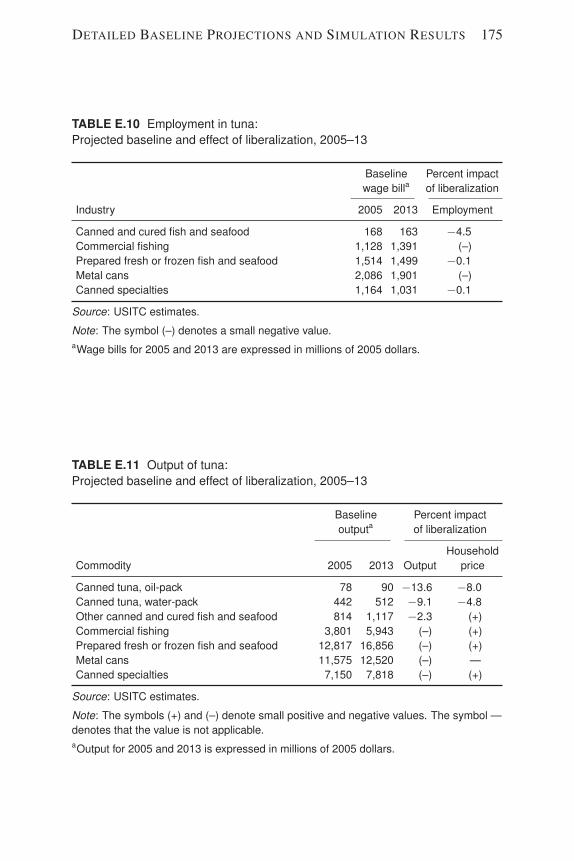
DETAILED BASELINE PROJECTIONS AND SIMULATION RESULTS 175
TABLE E.10 Employment in tuna:Projected baseline and effect of liberalization, 2005–13
Baseline Percent impactwage billa of liberalization
Industry 2005 2013 Employment
Canned and cured fish and seafood 168 163 −4.5Commercial fishing 1,128 1,391 (–)Prepared fresh or frozen fish and seafood 1,514 1,499 −0.1Metal cans 2,086 1,901 (–)Canned specialties 1,164 1,031 −0.1
Source: USITC estimates.
Note: The symbol (–) denotes a small negative value.aWage bills for 2005 and 2013 are expressed in millions of 2005 dollars.
TABLE E.11 Output of tuna:Projected baseline and effect of liberalization, 2005–13
Baseline Percent impactoutputa of liberalization
HouseholdCommodity 2005 2013 Output price
Canned tuna, oil-pack 78 90 −13.6 −8.0Canned tuna, water-pack 442 512 −9.1 −4.8Other canned and cured fish and seafood 814 1,117 −2.3 (+)Commercial fishing 3,801 5,943 (–) (+)Prepared fresh or frozen fish and seafood 12,817 16,856 (–) (+)Metal cans 11,575 12,520 (–) —Canned specialties 7,150 7,818 (–) (+)
Source: USITC estimates.
Note: The symbols (+) and (–) denote small positive and negative values. The symbol —denotes that the value is not applicable.aOutput for 2005 and 2013 is expressed in millions of 2005 dollars.
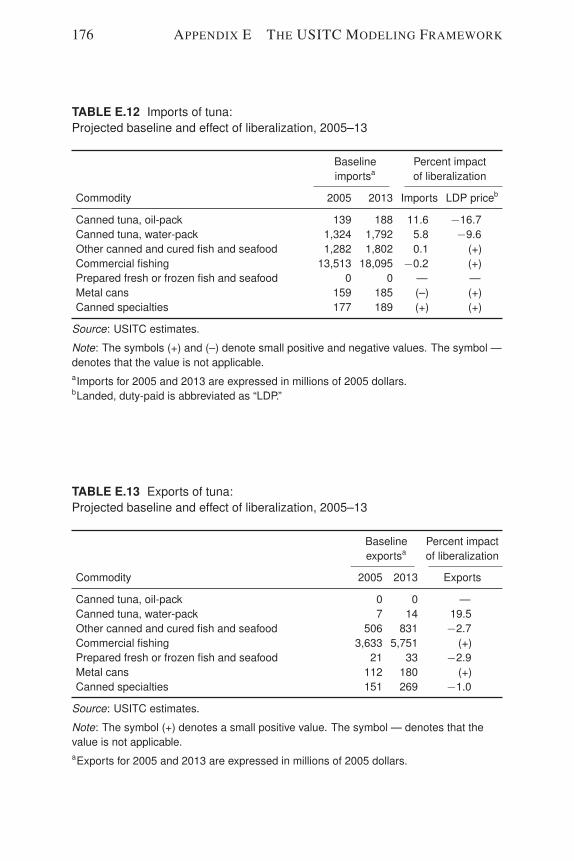
176 APPENDIX E THE USITC MODELING FRAMEWORK
TABLE E.12 Imports of tuna:Projected baseline and effect of liberalization, 2005–13
Baseline Percent impactimportsa of liberalization
Commodity 2005 2013 Imports LDP priceb
Canned tuna, oil-pack 139 188 11.6 −16.7Canned tuna, water-pack 1,324 1,792 5.8 −9.6Other canned and cured fish and seafood 1,282 1,802 0.1 (+)Commercial fishing 13,513 18,095 −0.2 (+)Prepared fresh or frozen fish and seafood 0 0 — —Metal cans 159 185 (–) (+)Canned specialties 177 189 (+) (+)
Source: USITC estimates.
Note: The symbols (+) and (–) denote small positive and negative values. The symbol —denotes that the value is not applicable.aImports for 2005 and 2013 are expressed in millions of 2005 dollars.bLanded, duty-paid is abbreviated as “LDP.”
TABLE E.13 Exports of tuna:Projected baseline and effect of liberalization, 2005–13
Baseline Percent impactexportsa of liberalization
Commodity 2005 2013 Exports
Canned tuna, oil-pack 0 0 —Canned tuna, water-pack 7 14 19.5Other canned and cured fish and seafood 506 831 −2.7Commercial fishing 3,633 5,751 (+)Prepared fresh or frozen fish and seafood 21 33 −2.9Metal cans 112 180 (+)Canned specialties 151 269 −1.0
Source: USITC estimates.
Note: The symbol (+) denotes a small positive value. The symbol — denotes that thevalue is not applicable.aExports for 2005 and 2013 are expressed in millions of 2005 dollars.
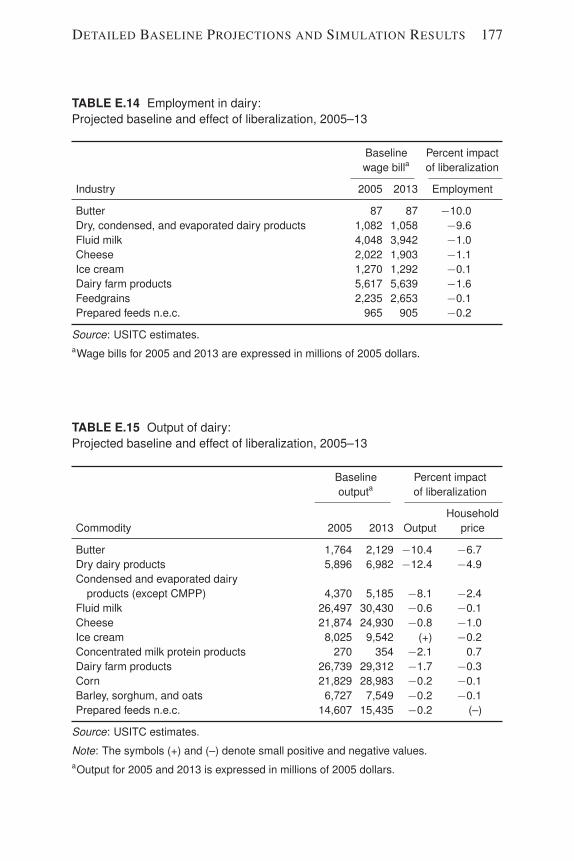
DETAILED BASELINE PROJECTIONS AND SIMULATION RESULTS 177
TABLE E.14 Employment in dairy:Projected baseline and effect of liberalization, 2005–13
Baseline Percent impactwage billa of liberalization
Industry 2005 2013 Employment
Butter 87 87 −10.0Dry, condensed, and evaporated dairy products 1,082 1,058 −9.6Fluid milk 4,048 3,942 −1.0Cheese 2,022 1,903 −1.1Ice cream 1,270 1,292 −0.1Dairy farm products 5,617 5,639 −1.6Feedgrains 2,235 2,653 −0.1Prepared feeds n.e.c. 965 905 −0.2
Source: USITC estimates.aWage bills for 2005 and 2013 are expressed in millions of 2005 dollars.
TABLE E.15 Output of dairy:Projected baseline and effect of liberalization, 2005–13
Baseline Percent impactoutputa of liberalization
HouseholdCommodity 2005 2013 Output price
Butter 1,764 2,129 −10.4 −6.7Dry dairy products 5,896 6,982 −12.4 −4.9Condensed and evaporated dairy
products (except CMPP) 4,370 5,185 −8.1 −2.4Fluid milk 26,497 30,430 −0.6 −0.1Cheese 21,874 24,930 −0.8 −1.0Ice cream 8,025 9,542 (+) −0.2Concentrated milk protein products 270 354 −2.1 0.7Dairy farm products 26,739 29,312 −1.7 −0.3Corn 21,829 28,983 −0.2 −0.1Barley, sorghum, and oats 6,727 7,549 −0.2 −0.1Prepared feeds n.e.c. 14,607 15,435 −0.2 (–)
Source: USITC estimates.
Note: The symbols (+) and (–) denote small positive and negative values.aOutput for 2005 and 2013 is expressed in millions of 2005 dollars.
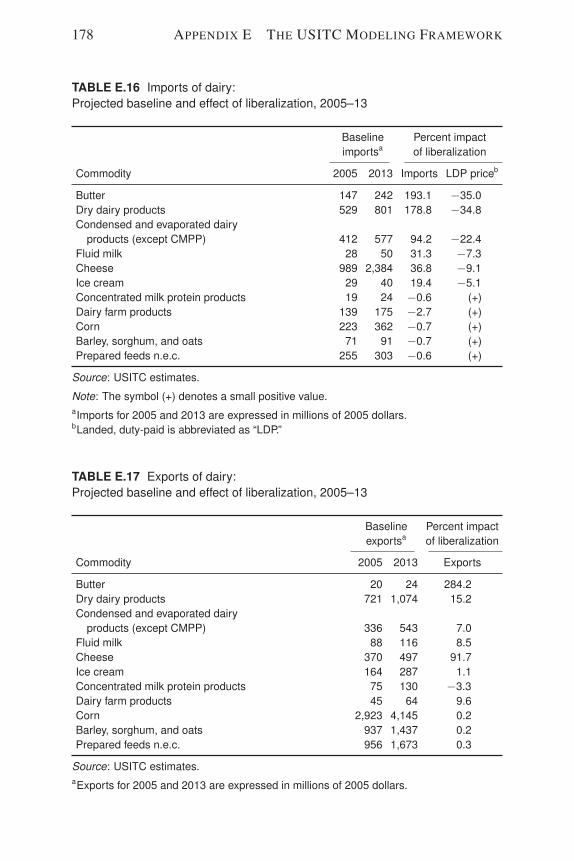
178 APPENDIX E THE USITC MODELING FRAMEWORK
TABLE E.16 Imports of dairy:Projected baseline and effect of liberalization, 2005–13
Baseline Percent impactimportsa of liberalization
Commodity 2005 2013 Imports LDP priceb
Butter 147 242 193.1 −35.0Dry dairy products 529 801 178.8 −34.8Condensed and evaporated dairy
products (except CMPP) 412 577 94.2 −22.4Fluid milk 28 50 31.3 −7.3Cheese 989 2,384 36.8 −9.1Ice cream 29 40 19.4 −5.1Concentrated milk protein products 19 24 −0.6 (+)Dairy farm products 139 175 −2.7 (+)Corn 223 362 −0.7 (+)Barley, sorghum, and oats 71 91 −0.7 (+)Prepared feeds n.e.c. 255 303 −0.6 (+)
Source: USITC estimates.
Note: The symbol (+) denotes a small positive value.aImports for 2005 and 2013 are expressed in millions of 2005 dollars.bLanded, duty-paid is abbreviated as “LDP.”
TABLE E.17 Exports of dairy:Projected baseline and effect of liberalization, 2005–13
Baseline Percent impactexportsa of liberalization
Commodity 2005 2013 Exports
Butter 20 24 284.2Dry dairy products 721 1,074 15.2Condensed and evaporated dairy
products (except CMPP) 336 543 7.0Fluid milk 88 116 8.5Cheese 370 497 91.7Ice cream 164 287 1.1Concentrated milk protein products 75 130 −3.3Dairy farm products 45 64 9.6Corn 2,923 4,145 0.2Barley, sorghum, and oats 937 1,437 0.2Prepared feeds n.e.c. 956 1,673 0.3
Source: USITC estimates.aExports for 2005 and 2013 are expressed in millions of 2005 dollars.
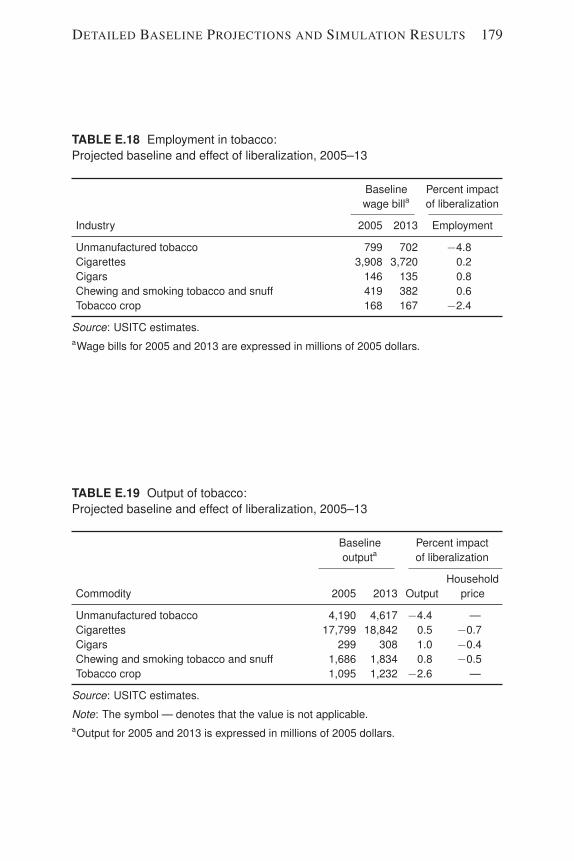
DETAILED BASELINE PROJECTIONS AND SIMULATION RESULTS 179
TABLE E.18 Employment in tobacco:Projected baseline and effect of liberalization, 2005–13
Baseline Percent impactwage billa of liberalization
Industry 2005 2013 Employment
Unmanufactured tobacco 799 702 −4.8Cigarettes 3,908 3,720 0.2Cigars 146 135 0.8Chewing and smoking tobacco and snuff 419 382 0.6Tobacco crop 168 167 −2.4
Source: USITC estimates.aWage bills for 2005 and 2013 are expressed in millions of 2005 dollars.
TABLE E.19 Output of tobacco:Projected baseline and effect of liberalization, 2005–13
Baseline Percent impactoutputa of liberalization
HouseholdCommodity 2005 2013 Output price
Unmanufactured tobacco 4,190 4,617 −4.4 —Cigarettes 17,799 18,842 0.5 −0.7Cigars 299 308 1.0 −0.4Chewing and smoking tobacco and snuff 1,686 1,834 0.8 −0.5Tobacco crop 1,095 1,232 −2.6 —
Source: USITC estimates.
Note: The symbol — denotes that the value is not applicable.aOutput for 2005 and 2013 is expressed in millions of 2005 dollars.
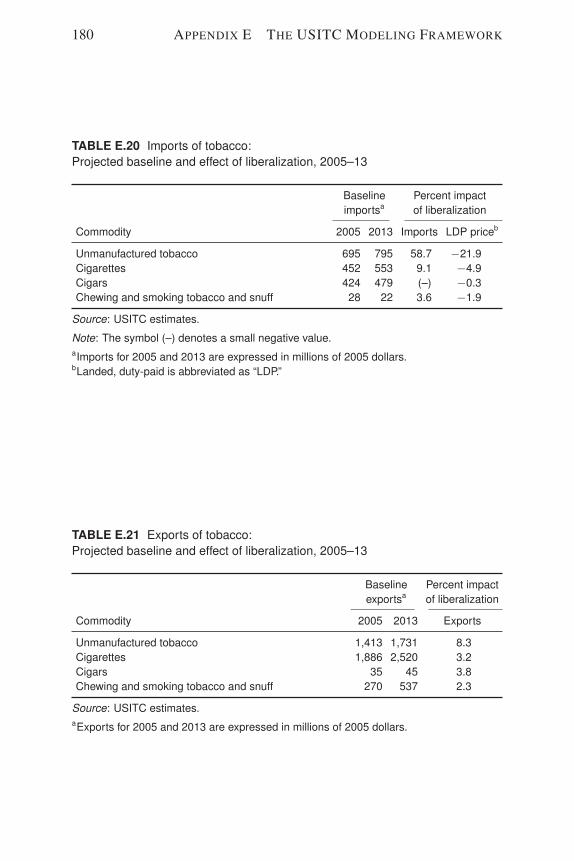
180 APPENDIX E THE USITC MODELING FRAMEWORK
TABLE E.20 Imports of tobacco:Projected baseline and effect of liberalization, 2005–13
Baseline Percent impactimportsa of liberalization
Commodity 2005 2013 Imports LDP priceb
Unmanufactured tobacco 695 795 58.7 −21.9Cigarettes 452 553 9.1 −4.9Cigars 424 479 (–) −0.3Chewing and smoking tobacco and snuff 28 22 3.6 −1.9
Source: USITC estimates.
Note: The symbol (–) denotes a small negative value.aImports for 2005 and 2013 are expressed in millions of 2005 dollars.bLanded, duty-paid is abbreviated as “LDP.”
TABLE E.21 Exports of tobacco:Projected baseline and effect of liberalization, 2005–13
Baseline Percent impactexportsa of liberalization
Commodity 2005 2013 Exports
Unmanufactured tobacco 1,413 1,731 8.3Cigarettes 1,886 2,520 3.2Cigars 35 45 3.8Chewing and smoking tobacco and snuff 270 537 2.3
Source: USITC estimates.aExports for 2005 and 2013 are expressed in millions of 2005 dollars.
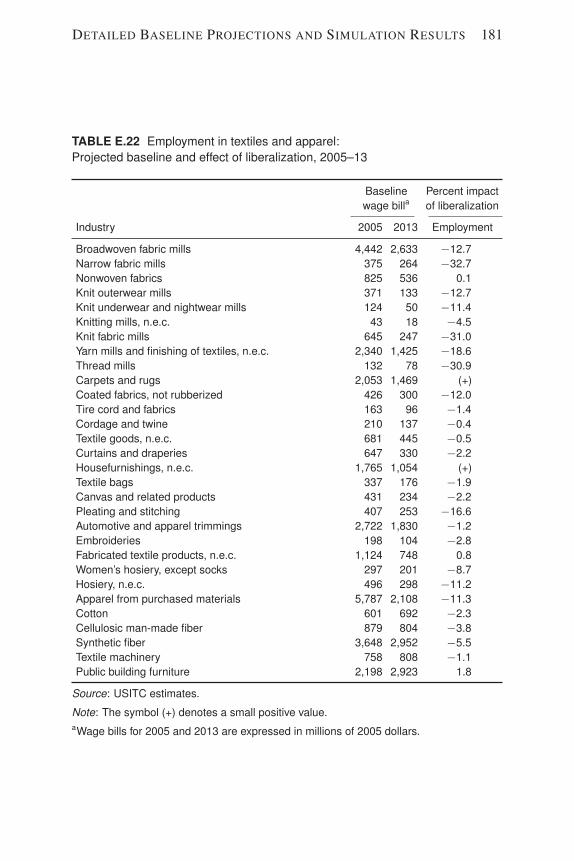
DETAILED BASELINE PROJECTIONS AND SIMULATION RESULTS 181
TABLE E.22 Employment in textiles and apparel:Projected baseline and effect of liberalization, 2005–13
Baseline Percent impactwage billa of liberalization
Industry 2005 2013 Employment
Broadwoven fabric mills 4,442 2,633 −12.7Narrow fabric mills 375 264 −32.7Nonwoven fabrics 825 536 0.1Knit outerwear mills 371 133 −12.7Knit underwear and nightwear mills 124 50 −11.4Knitting mills, n.e.c. 43 18 −4.5Knit fabric mills 645 247 −31.0Yarn mills and finishing of textiles, n.e.c. 2,340 1,425 −18.6Thread mills 132 78 −30.9Carpets and rugs 2,053 1,469 (+)Coated fabrics, not rubberized 426 300 −12.0Tire cord and fabrics 163 96 −1.4Cordage and twine 210 137 −0.4Textile goods, n.e.c. 681 445 −0.5Curtains and draperies 647 330 −2.2Housefurnishings, n.e.c. 1,765 1,054 (+)Textile bags 337 176 −1.9Canvas and related products 431 234 −2.2Pleating and stitching 407 253 −16.6Automotive and apparel trimmings 2,722 1,830 −1.2Embroideries 198 104 −2.8Fabricated textile products, n.e.c. 1,124 748 0.8Women’s hosiery, except socks 297 201 −8.7Hosiery, n.e.c. 496 298 −11.2Apparel from purchased materials 5,787 2,108 −11.3Cotton 601 692 −2.3Cellulosic man-made fiber 879 804 −3.8Synthetic fiber 3,648 2,952 −5.5Textile machinery 758 808 −1.1Public building furniture 2,198 2,923 1.8
Source: USITC estimates.
Note: The symbol (+) denotes a small positive value.aWage bills for 2005 and 2013 are expressed in millions of 2005 dollars.
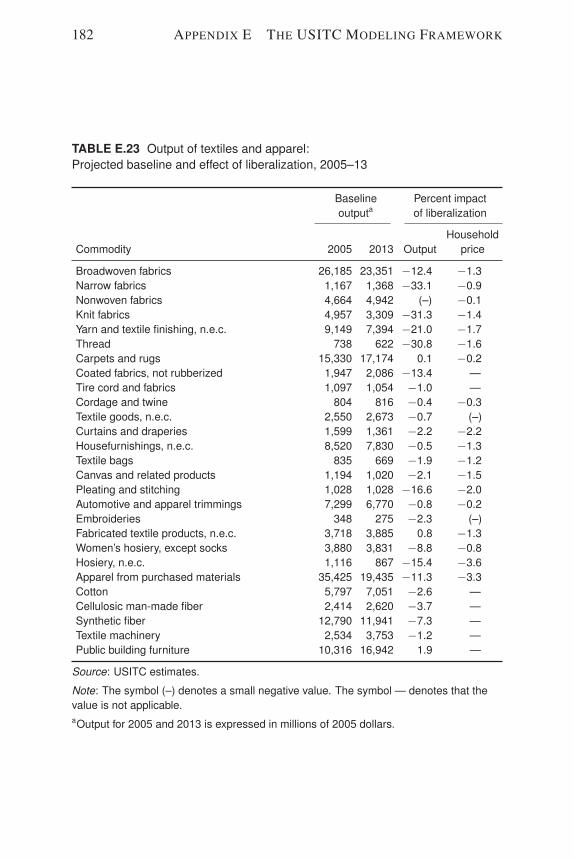
182 APPENDIX E THE USITC MODELING FRAMEWORK
TABLE E.23 Output of textiles and apparel:Projected baseline and effect of liberalization, 2005–13
Baseline Percent impactoutputa of liberalization
HouseholdCommodity 2005 2013 Output price
Broadwoven fabrics 26,185 23,351 −12.4 −1.3Narrow fabrics 1,167 1,368 −33.1 −0.9Nonwoven fabrics 4,664 4,942 (–) −0.1Knit fabrics 4,957 3,309 −31.3 −1.4Yarn and textile finishing, n.e.c. 9,149 7,394 −21.0 −1.7Thread 738 622 −30.8 −1.6Carpets and rugs 15,330 17,174 0.1 −0.2Coated fabrics, not rubberized 1,947 2,086 −13.4 —Tire cord and fabrics 1,097 1,054 −1.0 —Cordage and twine 804 816 −0.4 −0.3Textile goods, n.e.c. 2,550 2,673 −0.7 (–)Curtains and draperies 1,599 1,361 −2.2 −2.2Housefurnishings, n.e.c. 8,520 7,830 −0.5 −1.3Textile bags 835 669 −1.9 −1.2Canvas and related products 1,194 1,020 −2.1 −1.5Pleating and stitching 1,028 1,028 −16.6 −2.0Automotive and apparel trimmings 7,299 6,770 −0.8 −0.2Embroideries 348 275 −2.3 (–)Fabricated textile products, n.e.c. 3,718 3,885 0.8 −1.3Women’s hosiery, except socks 3,880 3,831 −8.8 −0.8Hosiery, n.e.c. 1,116 867 −15.4 −3.6Apparel from purchased materials 35,425 19,435 −11.3 −3.3Cotton 5,797 7,051 −2.6 —Cellulosic man-made fiber 2,414 2,620 −3.7 —Synthetic fiber 12,790 11,941 −7.3 —Textile machinery 2,534 3,753 −1.2 —Public building furniture 10,316 16,942 1.9 —
Source: USITC estimates.
Note: The symbol (–) denotes a small negative value. The symbol — denotes that thevalue is not applicable.aOutput for 2005 and 2013 is expressed in millions of 2005 dollars.
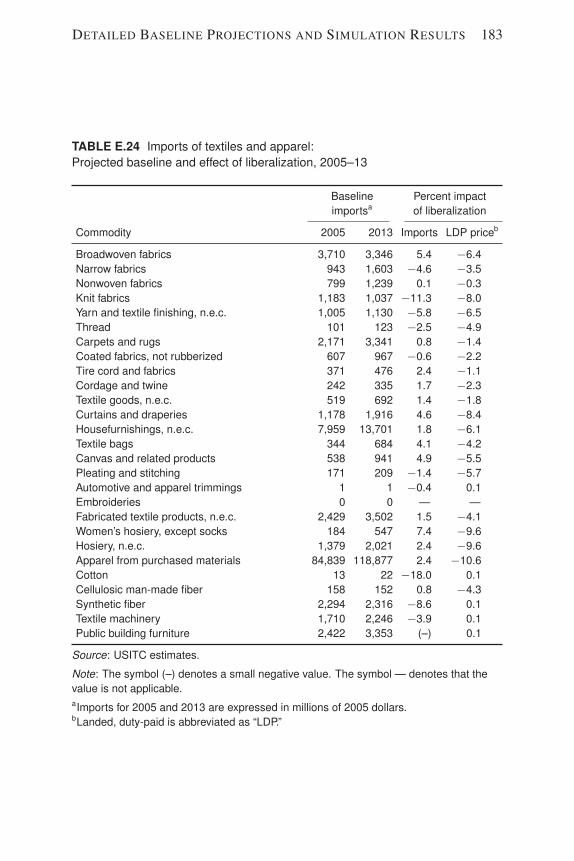
DETAILED BASELINE PROJECTIONS AND SIMULATION RESULTS 183
TABLE E.24 Imports of textiles and apparel:Projected baseline and effect of liberalization, 2005–13
Baseline Percent impactimportsa of liberalization
Commodity 2005 2013 Imports LDP priceb
Broadwoven fabrics 3,710 3,346 5.4 −6.4Narrow fabrics 943 1,603 −4.6 −3.5Nonwoven fabrics 799 1,239 0.1 −0.3Knit fabrics 1,183 1,037 −11.3 −8.0Yarn and textile finishing, n.e.c. 1,005 1,130 −5.8 −6.5Thread 101 123 −2.5 −4.9Carpets and rugs 2,171 3,341 0.8 −1.4Coated fabrics, not rubberized 607 967 −0.6 −2.2Tire cord and fabrics 371 476 2.4 −1.1Cordage and twine 242 335 1.7 −2.3Textile goods, n.e.c. 519 692 1.4 −1.8Curtains and draperies 1,178 1,916 4.6 −8.4Housefurnishings, n.e.c. 7,959 13,701 1.8 −6.1Textile bags 344 684 4.1 −4.2Canvas and related products 538 941 4.9 −5.5Pleating and stitching 171 209 −1.4 −5.7Automotive and apparel trimmings 1 1 −0.4 0.1Embroideries 0 0 — —Fabricated textile products, n.e.c. 2,429 3,502 1.5 −4.1Women’s hosiery, except socks 184 547 7.4 −9.6Hosiery, n.e.c. 1,379 2,021 2.4 −9.6Apparel from purchased materials 84,839 118,877 2.4 −10.6Cotton 13 22 −18.0 0.1Cellulosic man-made fiber 158 152 0.8 −4.3Synthetic fiber 2,294 2,316 −8.6 0.1Textile machinery 1,710 2,246 −3.9 0.1Public building furniture 2,422 3,353 (–) 0.1
Source: USITC estimates.
Note: The symbol (–) denotes a small negative value. The symbol — denotes that thevalue is not applicable.aImports for 2005 and 2013 are expressed in millions of 2005 dollars.bLanded, duty-paid is abbreviated as “LDP.”
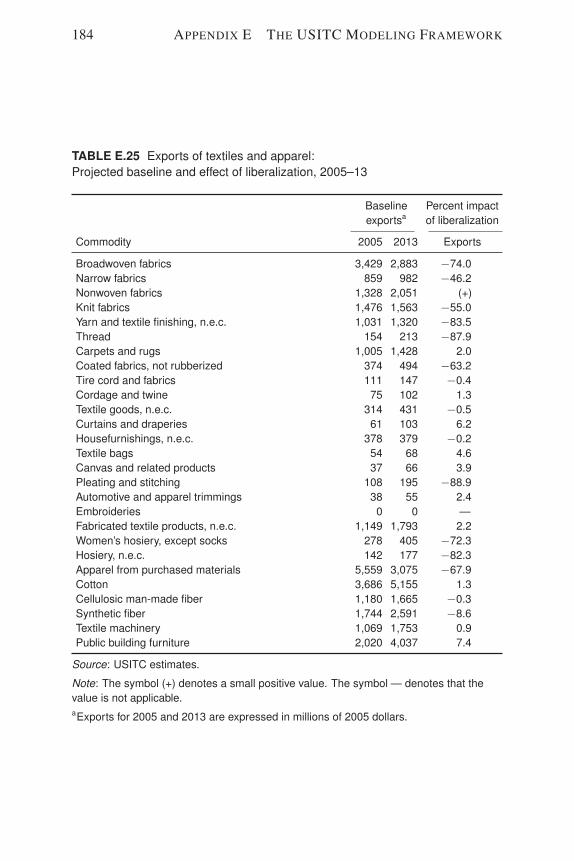
184 APPENDIX E THE USITC MODELING FRAMEWORK
TABLE E.25 Exports of textiles and apparel:Projected baseline and effect of liberalization, 2005–13
Baseline Percent impactexportsa of liberalization
Commodity 2005 2013 Exports
Broadwoven fabrics 3,429 2,883 −74.0Narrow fabrics 859 982 −46.2Nonwoven fabrics 1,328 2,051 (+)Knit fabrics 1,476 1,563 −55.0Yarn and textile finishing, n.e.c. 1,031 1,320 −83.5Thread 154 213 −87.9Carpets and rugs 1,005 1,428 2.0Coated fabrics, not rubberized 374 494 −63.2Tire cord and fabrics 111 147 −0.4Cordage and twine 75 102 1.3Textile goods, n.e.c. 314 431 −0.5Curtains and draperies 61 103 6.2Housefurnishings, n.e.c. 378 379 −0.2Textile bags 54 68 4.6Canvas and related products 37 66 3.9Pleating and stitching 108 195 −88.9Automotive and apparel trimmings 38 55 2.4Embroideries 0 0 —Fabricated textile products, n.e.c. 1,149 1,793 2.2Women’s hosiery, except socks 278 405 −72.3Hosiery, n.e.c. 142 177 −82.3Apparel from purchased materials 5,559 3,075 −67.9Cotton 3,686 5,155 1.3Cellulosic man-made fiber 1,180 1,665 −0.3Synthetic fiber 1,744 2,591 −8.6Textile machinery 1,069 1,753 0.9Public building furniture 2,020 4,037 7.4
Source: USITC estimates.
Note: The symbol (+) denotes a small positive value. The symbol — denotes that thevalue is not applicable.aExports for 2005 and 2013 are expressed in millions of 2005 dollars.
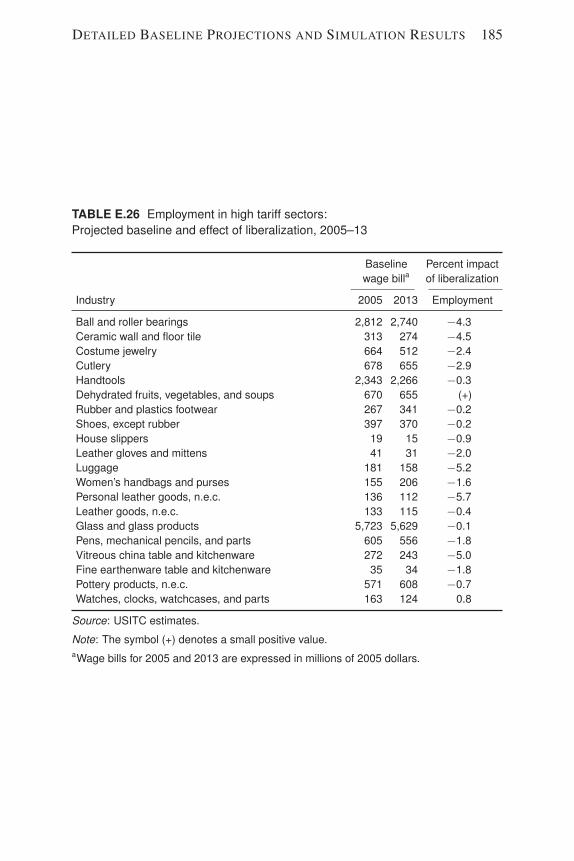
DETAILED BASELINE PROJECTIONS AND SIMULATION RESULTS 185
TABLE E.26 Employment in high tariff sectors:Projected baseline and effect of liberalization, 2005–13
Baseline Percent impactwage billa of liberalization
Industry 2005 2013 Employment
Ball and roller bearings 2,812 2,740 −4.3Ceramic wall and floor tile 313 274 −4.5Costume jewelry 664 512 −2.4Cutlery 678 655 −2.9Handtools 2,343 2,266 −0.3Dehydrated fruits, vegetables, and soups 670 655 (+)Rubber and plastics footwear 267 341 −0.2Shoes, except rubber 397 370 −0.2House slippers 19 15 −0.9Leather gloves and mittens 41 31 −2.0Luggage 181 158 −5.2Women’s handbags and purses 155 206 −1.6Personal leather goods, n.e.c. 136 112 −5.7Leather goods, n.e.c. 133 115 −0.4Glass and glass products 5,723 5,629 −0.1Pens, mechanical pencils, and parts 605 556 −1.8Vitreous china table and kitchenware 272 243 −5.0Fine earthenware table and kitchenware 35 34 −1.8Pottery products, n.e.c. 571 608 −0.7Watches, clocks, watchcases, and parts 163 124 0.8
Source: USITC estimates.
Note: The symbol (+) denotes a small positive value.aWage bills for 2005 and 2013 are expressed in millions of 2005 dollars.
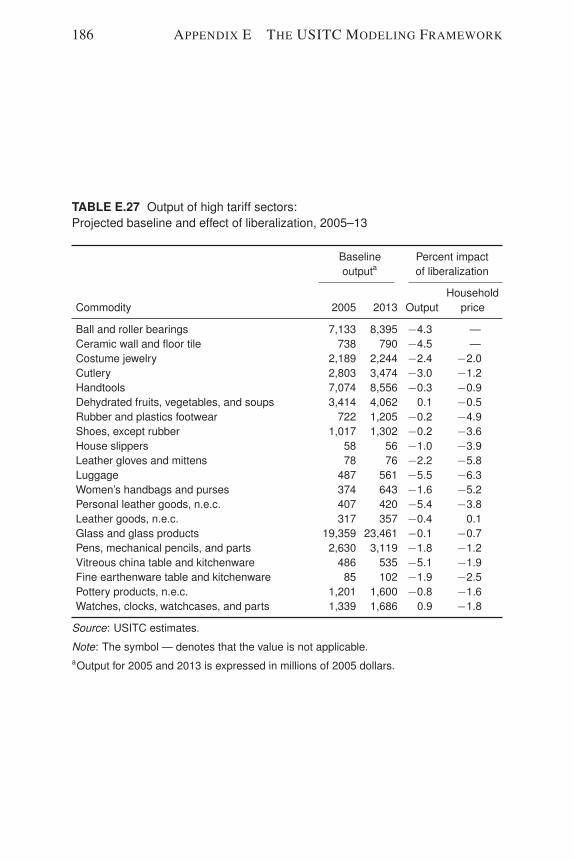
186 APPENDIX E THE USITC MODELING FRAMEWORK
TABLE E.27 Output of high tariff sectors:Projected baseline and effect of liberalization, 2005–13
Baseline Percent impactoutputa of liberalization
HouseholdCommodity 2005 2013 Output price
Ball and roller bearings 7,133 8,395 −4.3 —Ceramic wall and floor tile 738 790 −4.5 —Costume jewelry 2,189 2,244 −2.4 −2.0Cutlery 2,803 3,474 −3.0 −1.2Handtools 7,074 8,556 −0.3 −0.9Dehydrated fruits, vegetables, and soups 3,414 4,062 0.1 −0.5Rubber and plastics footwear 722 1,205 −0.2 −4.9Shoes, except rubber 1,017 1,302 −0.2 −3.6House slippers 58 56 −1.0 −3.9Leather gloves and mittens 78 76 −2.2 −5.8Luggage 487 561 −5.5 −6.3Women’s handbags and purses 374 643 −1.6 −5.2Personal leather goods, n.e.c. 407 420 −5.4 −3.8Leather goods, n.e.c. 317 357 −0.4 0.1Glass and glass products 19,359 23,461 −0.1 −0.7Pens, mechanical pencils, and parts 2,630 3,119 −1.8 −1.2Vitreous china table and kitchenware 486 535 −5.1 −1.9Fine earthenware table and kitchenware 85 102 −1.9 −2.5Pottery products, n.e.c. 1,201 1,600 −0.8 −1.6Watches, clocks, watchcases, and parts 1,339 1,686 0.9 −1.8
Source: USITC estimates.
Note: The symbol — denotes that the value is not applicable.aOutput for 2005 and 2013 is expressed in millions of 2005 dollars.
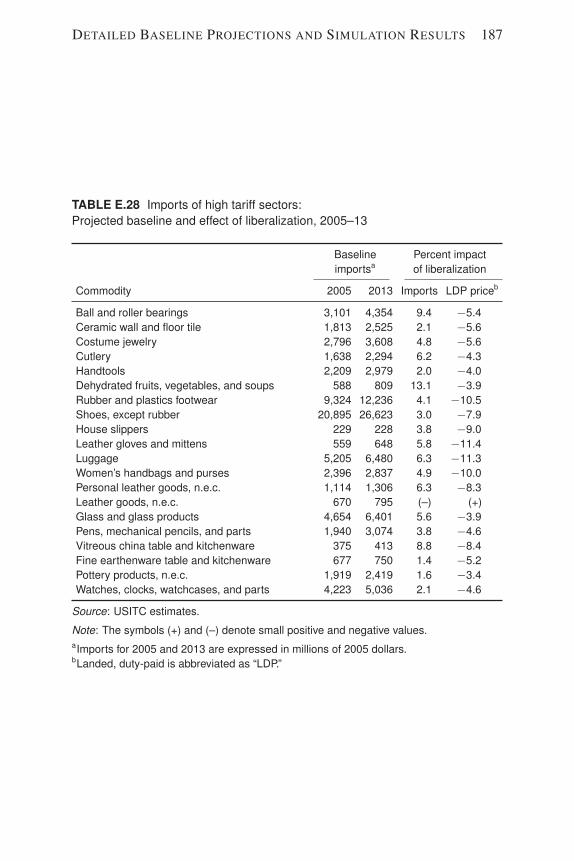
DETAILED BASELINE PROJECTIONS AND SIMULATION RESULTS 187
TABLE E.28 Imports of high tariff sectors:Projected baseline and effect of liberalization, 2005–13
Baseline Percent impactimportsa of liberalization
Commodity 2005 2013 Imports LDP priceb
Ball and roller bearings 3,101 4,354 9.4 −5.4Ceramic wall and floor tile 1,813 2,525 2.1 −5.6Costume jewelry 2,796 3,608 4.8 −5.6Cutlery 1,638 2,294 6.2 −4.3Handtools 2,209 2,979 2.0 −4.0Dehydrated fruits, vegetables, and soups 588 809 13.1 −3.9Rubber and plastics footwear 9,324 12,236 4.1 −10.5Shoes, except rubber 20,895 26,623 3.0 −7.9House slippers 229 228 3.8 −9.0Leather gloves and mittens 559 648 5.8 −11.4Luggage 5,205 6,480 6.3 −11.3Women’s handbags and purses 2,396 2,837 4.9 −10.0Personal leather goods, n.e.c. 1,114 1,306 6.3 −8.3Leather goods, n.e.c. 670 795 (–) (+)Glass and glass products 4,654 6,401 5.6 −3.9Pens, mechanical pencils, and parts 1,940 3,074 3.8 −4.6Vitreous china table and kitchenware 375 413 8.8 −8.4Fine earthenware table and kitchenware 677 750 1.4 −5.2Pottery products, n.e.c. 1,919 2,419 1.6 −3.4Watches, clocks, watchcases, and parts 4,223 5,036 2.1 −4.6
Source: USITC estimates.
Note: The symbols (+) and (–) denote small positive and negative values.aImports for 2005 and 2013 are expressed in millions of 2005 dollars.bLanded, duty-paid is abbreviated as “LDP.”
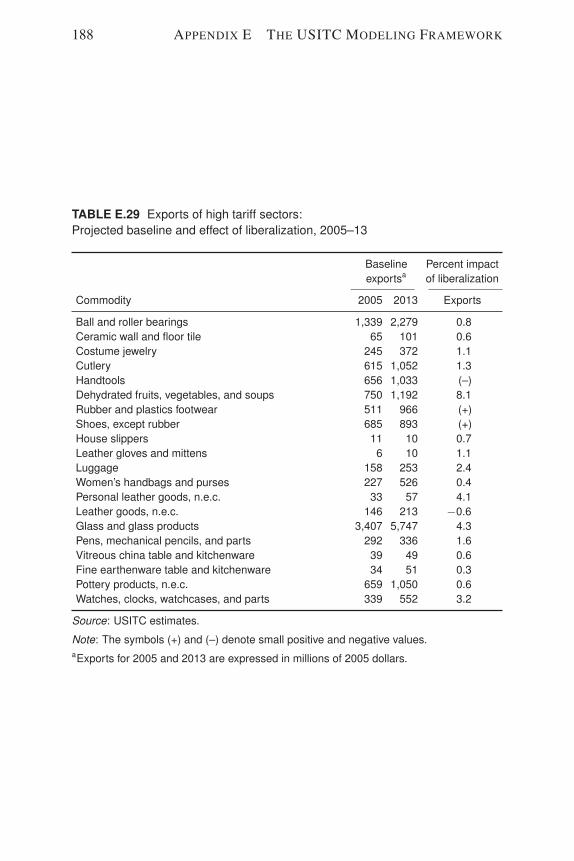
188 APPENDIX E THE USITC MODELING FRAMEWORK
TABLE E.29 Exports of high tariff sectors:Projected baseline and effect of liberalization, 2005–13
Baseline Percent impactexportsa of liberalization
Commodity 2005 2013 Exports
Ball and roller bearings 1,339 2,279 0.8Ceramic wall and floor tile 65 101 0.6Costume jewelry 245 372 1.1Cutlery 615 1,052 1.3Handtools 656 1,033 (–)Dehydrated fruits, vegetables, and soups 750 1,192 8.1Rubber and plastics footwear 511 966 (+)Shoes, except rubber 685 893 (+)House slippers 11 10 0.7Leather gloves and mittens 6 10 1.1Luggage 158 253 2.4Women’s handbags and purses 227 526 0.4Personal leather goods, n.e.c. 33 57 4.1Leather goods, n.e.c. 146 213 −0.6Glass and glass products 3,407 5,747 4.3Pens, mechanical pencils, and parts 292 336 1.6Vitreous china table and kitchenware 39 49 0.6Fine earthenware table and kitchenware 34 51 0.3Pottery products, n.e.c. 659 1,050 0.6Watches, clocks, watchcases, and parts 339 552 3.2
Source: USITC estimates.
Note: The symbols (+) and (–) denote small positive and negative values.aExports for 2005 and 2013 are expressed in millions of 2005 dollars.
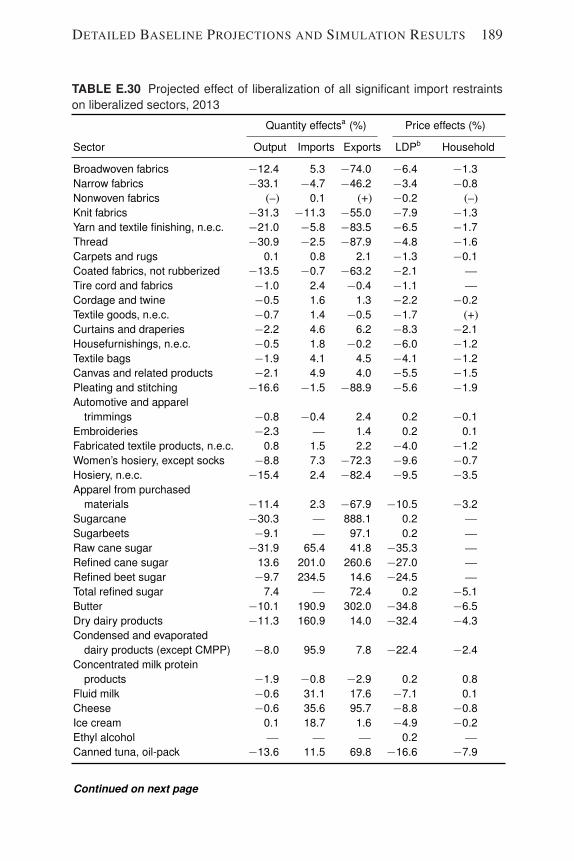
DETAILED BASELINE PROJECTIONS AND SIMULATION RESULTS 189
TABLE E.30 Projected effect of liberalization of all significant import restraintson liberalized sectors, 2013
Quantity effectsa (%) Price effects (%)
Sector Output Imports Exports LDPb Household
Broadwoven fabrics −12.4 5.3 −74.0 −6.4 −1.3Narrow fabrics −33.1 −4.7 −46.2 −3.4 −0.8Nonwoven fabrics (–) 0.1 (+) −0.2 (–)Knit fabrics −31.3 −11.3 −55.0 −7.9 −1.3Yarn and textile finishing, n.e.c. −21.0 −5.8 −83.5 −6.5 −1.7Thread −30.9 −2.5 −87.9 −4.8 −1.6Carpets and rugs 0.1 0.8 2.1 −1.3 −0.1Coated fabrics, not rubberized −13.5 −0.7 −63.2 −2.1 —Tire cord and fabrics −1.0 2.4 −0.4 −1.1 —Cordage and twine −0.5 1.6 1.3 −2.2 −0.2Textile goods, n.e.c. −0.7 1.4 −0.5 −1.7 (+)Curtains and draperies −2.2 4.6 6.2 −8.3 −2.1Housefurnishings, n.e.c. −0.5 1.8 −0.2 −6.0 −1.2Textile bags −1.9 4.1 4.5 −4.1 −1.2Canvas and related products −2.1 4.9 4.0 −5.5 −1.5Pleating and stitching −16.6 −1.5 −88.9 −5.6 −1.9Automotive and apparel
trimmings −0.8 −0.4 2.4 0.2 −0.1Embroideries −2.3 — 1.4 0.2 0.1Fabricated textile products, n.e.c. 0.8 1.5 2.2 −4.0 −1.2Women’s hosiery, except socks −8.8 7.3 −72.3 −9.6 −0.7Hosiery, n.e.c. −15.4 2.4 −82.4 −9.5 −3.5Apparel from purchased
materials −11.4 2.3 −67.9 −10.5 −3.2Sugarcane −30.3 — 888.1 0.2 —Sugarbeets −9.1 — 97.1 0.2 —Raw cane sugar −31.9 65.4 41.8 −35.3 —Refined cane sugar 13.6 201.0 260.6 −27.0 —Refined beet sugar −9.7 234.5 14.6 −24.5 —Total refined sugar 7.4 — 72.4 0.2 −5.1Butter −10.1 190.9 302.0 −34.8 −6.5Dry dairy products −11.3 160.9 14.0 −32.4 −4.3Condensed and evaporated
dairy products (except CMPP) −8.0 95.9 7.8 −22.4 −2.4Concentrated milk protein
products −1.9 −0.8 −2.9 0.2 0.8Fluid milk −0.6 31.1 17.6 −7.1 0.1Cheese −0.6 35.6 95.7 −8.8 −0.8Ice cream 0.1 18.7 1.6 −4.9 −0.2Ethyl alcohol — — — 0.2 —Canned tuna, oil-pack −13.6 11.5 69.8 −16.6 −7.9
Continued on next page
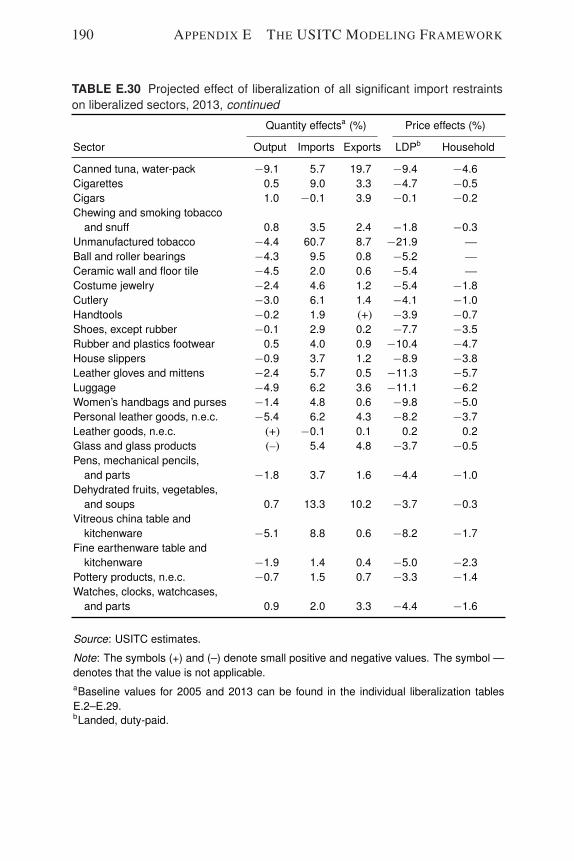
190 APPENDIX E THE USITC MODELING FRAMEWORK
TABLE E.30 Projected effect of liberalization of all significant import restraintson liberalized sectors, 2013, continued
Quantity effectsa (%) Price effects (%)
Sector Output Imports Exports LDPb Household
Canned tuna, water-pack −9.1 5.7 19.7 −9.4 −4.6Cigarettes 0.5 9.0 3.3 −4.7 −0.5Cigars 1.0 −0.1 3.9 −0.1 −0.2Chewing and smoking tobacco
and snuff 0.8 3.5 2.4 −1.8 −0.3Unmanufactured tobacco −4.4 60.7 8.7 −21.9 —Ball and roller bearings −4.3 9.5 0.8 −5.2 —Ceramic wall and floor tile −4.5 2.0 0.6 −5.4 —Costume jewelry −2.4 4.6 1.2 −5.4 −1.8Cutlery −3.0 6.1 1.4 −4.1 −1.0Handtools −0.2 1.9 (+) −3.9 −0.7Shoes, except rubber −0.1 2.9 0.2 −7.7 −3.5Rubber and plastics footwear 0.5 4.0 0.9 −10.4 −4.7House slippers −0.9 3.7 1.2 −8.9 −3.8Leather gloves and mittens −2.4 5.7 0.5 −11.3 −5.7Luggage −4.9 6.2 3.6 −11.1 −6.2Women’s handbags and purses −1.4 4.8 0.6 −9.8 −5.0Personal leather goods, n.e.c. −5.4 6.2 4.3 −8.2 −3.7Leather goods, n.e.c. (+) −0.1 0.1 0.2 0.2Glass and glass products (–) 5.4 4.8 −3.7 −0.5Pens, mechanical pencils,
and parts −1.8 3.7 1.6 −4.4 −1.0Dehydrated fruits, vegetables,
and soups 0.7 13.3 10.2 −3.7 −0.3Vitreous china table and
kitchenware −5.1 8.8 0.6 −8.2 −1.7Fine earthenware table and
kitchenware −1.9 1.4 0.4 −5.0 −2.3Pottery products, n.e.c. −0.7 1.5 0.7 −3.3 −1.4Watches, clocks, watchcases,
and parts 0.9 2.0 3.3 −4.4 −1.6
Source: USITC estimates.
Note: The symbols (+) and (–) denote small positive and negative values. The symbol —denotes that the value is not applicable.aBaseline values for 2005 and 2013 can be found in the individual liberalization tablesE.2–E.29.bLanded, duty-paid.
BIBLIOGRAPHY 191
Bibliography
Armington, P. S. “A Theory of Demand for Products Distinguished byPlace of Production.” IMF Staff Papers 16, (March 1969): 159–76.
Boughner, Devry S., Harry de Gorter, and Ian M. Sheldon. “TheEconomics of Two-Tier Tariff-Rate Import Quotas in Agriculture.”Agricultural and Resource Economics Review 29, no. 1 (April2000): 58–69.
Chung, Jae Wan. Utility and Production Functions: Theory andApplications. Cambridge, MA: Blackwell Publishers, 1994.
Deaton, Angus, and John Muellbauer. Economics and ConsumerBehavior. Cambridge, UK: Cambridge University Press, 1980.
Debreu, Gerard. The Theory of Value. New York: Wiley, 1959.
Dervis, Kermal, Jaime de Melo, and Sherman Robinson. GeneralEquilibrium Models for Development Policy. Cambridge, UK:Cambridge University Press, 1982.
De Melo, Jaime, and Sherman Robinson. “Product Differentiation andthe Treatment of Foreign Trade in Computable General EquilibriumModels of Small Economies.” Journal of International Economics27 (August 1989): 489–97.
Dixon, Peter B., and Maureen T. Rimmer. Dynamic GeneralEquilibrium Modelling for Forecasting and Policy: A PracticalGuide and Documentation of MONASH. Amsterdam: Elsevier,2002.
———. “Mini-USAGE: Reducing Barriers to Entry in Dynamic CGEModelling.” Paper presented at the 8th Annual Conference onGlobal Economic Analysis, Lubeck, Germany, and June 2005.
———. “MONASH-USA: Creating a 1992 Benchmark Input-OutputDatabase.” COPS Working Paper. Centre of Policy Studies,Monash University, May 2001.
———. “USAGE-ITC: Creating Historical Shocks for 1992 to 1998.”COPS Working Paper. Centre of Policy Studies, MonashUniversity, June 2003.
192 APPENDIX E THE USITC MODELING FRAMEWORK
———. “USAGE-ITC: Theoretical Structure.” COPS Working Paper.Centre of Policy Studies, Monash University, April 2002.
Dixon, Peter B., Maureen T. Rimmer, and Marinos Tsigas. “Creating aUSAGE-ITC Database for 2002.”Centre of Policy Studies, MonashUniversity, February 2004.
Dixon, Peter B., David P. Vincent, and Alan A. Powell. “Factor Demandand Product Supply Relations in Australian Agriculture: TheCRESH/CRETH Production System.” IMPACT PreliminaryWorking Paper no. OP-08. Mimeo, 1976. .
Donnelly, William A., Kyle Johnson, Marinos Tsigas, and DaveIngersoll. “Revised Armington Elasticities of Substitution for theUSITC Model and the Concordance for Constructing a ConsistentSet for the GTAP Model.” Office of Economics Research Noteno. 2004-01-A. U.S. International Trade Commission, Office ofEconomics, January 2004.
Energy Information Administration (EIA). International EnergyOutlook 2005. Washington, DC, EIA, 2005.http://www.eia.doe.gov/oiaf/ieo/oil.html.
Hanoch, Giora. “CRESH Production Functions.” Econometrica 39(September 1971): 695–712.
Hertel, Thomas, David Hummels, Maros Ivanic, and Roman Keeney.“How Confident Can We Be in CGE-Based Assessments of FreeTrade Agreements?” GTAP Working Paper no. 26. Center forGlobal Trade Analysis, May 2003.
Horning, Ellen, Richard N. Boisvert, and David Blandford. “Explainingthe Distribution of Quota Rents for U.S. Cheese Imports.”Australian Journal of Agricultural Economics 34 (April 1990):1–20.
———. “Quota Rents and Subsidies: The Case of U.S. Cheese ImportQuotas.” European Review of Agricultural Economics 17, no. 4(1990): 421–34.
Layard, P.R.G., and A.A. Walters. Microeconomic Theory. New York:McGraw-Hill, 1978.
Silberberg, Eugene. The Structure of Economics. New York:McGraw-Hill, 1990.
BIBLIOGRAPHY 193
U.S. International Trade Commission (USITC). The Economic Effects ofSignificant U.S. Import Restraints: First Biannual Update 1995,USITC Publication 2935. Washington DC: USITC, 1995.
———. The Economic Effects of Significant U.S. Import Restraints:Second Update 1999, USITC Publication 3201. Washington DC:USITC, 1999.
Winston, R. Ashley P. “Enhancing Agriculture and Energy SectorAnalysis in CGE Modelling: An Overview to Modifications of theUSAGE Model.” COPS Working Paper. Centre of Policy Studies,Monash University, January 2009.


Appendix F
Trade Negotiation Tables
195

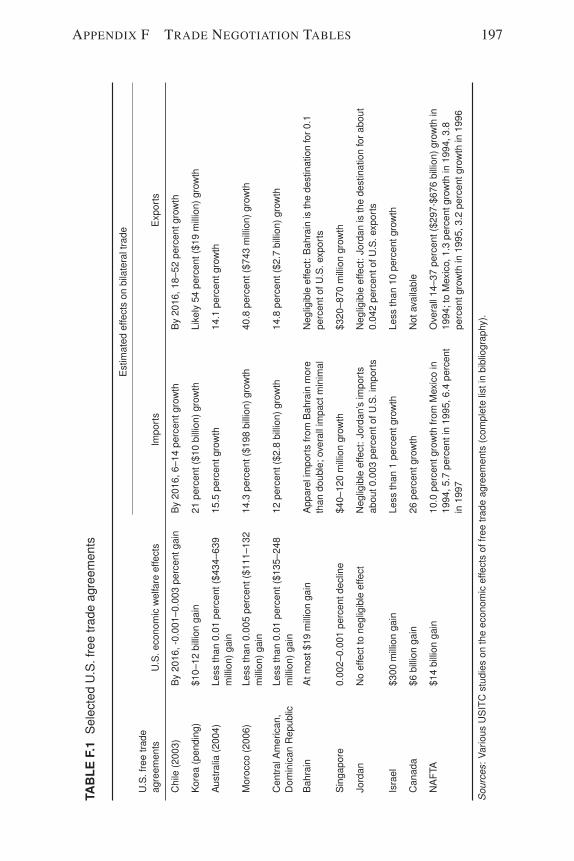
APPENDIX F TRADE NEGOTIATION TABLES 197
TAB
LEF.
1S
elec
ted
U.S
.fre
etra
deag
reem
ents
Est
imat
edef
fect
son
bila
tera
ltra
de
U.S
.fre
etra
deag
reem
ents
U.S
.eco
nom
icw
elfa
reef
fect
sIm
port
sE
xpor
ts
Chi
le(2
003)
By
2016
,-0.
001–
0.00
3pe
rcen
tgai
nB
y20
16,6
–14
perc
entg
row
thB
y20
16,1
8–52
perc
entg
row
th
Kor
ea(p
endi
ng)
$10–
12bi
llion
gain
21pe
rcen
t($1
0bi
llion
)gro
wth
Like
ly54
perc
ent(
$19
mill
ion)
grow
th
Aus
tralia
(200
4)Le
ssth
an0.
01pe
rcen
t($4
34–6
39m
illio
n)ga
in15
.5pe
rcen
tgro
wth
14.1
perc
entg
row
th
Mor
occo
(200
6)Le
ssth
an0.
005
perc
ent(
$111
–132
mill
ion)
gain
14.3
perc
ent(
$198
billi
on)g
row
th40
.8pe
rcen
t($7
43m
illio
n)gr
owth
Cen
tralA
mer
ican
,D
omin
ican
Rep
ublic
Less
than
0.01
perc
ent(
$135
–248
mill
ion)
gain
12pe
rcen
t($2
.8bi
llion
)gro
wth
14.8
perc
ent(
$2.7
billi
on)g
row
th
Bah
rain
Atm
ost$
19m
illio
nga
inA
ppar
elim
port
sfro
mB
ahra
inm
ore
than
doub
le;o
vera
llim
pact
min
imal
Neg
ligib
leef
fect
:B
ahra
inis
the
dest
inat
ion
for0
.1pe
rcen
tofU
.S.e
xpor
ts
Sin
gapo
re0.
002–
0.00
1pe
rcen
tdec
line
$40–
120
mill
ion
grow
th$3
20–8
70m
illio
ngr
owth
Jord
anN
oef
fect
tone
glig
ible
effe
ctN
eglig
ible
effe
ct:
Jord
an’s
impo
rts
abou
t0.0
03pe
rcen
tofU
.S.i
mpo
rts
Neg
ligib
leef
fect
:Jo
rdan
isth
ede
stin
atio
nfo
rabo
ut0.
042
perc
ento
fU.S
.exp
orts
Isra
el$3
00m
illio
nga
inLe
ssth
an1
perc
entg
row
thLe
ssth
an10
perc
entg
row
th
Can
ada
$6bi
llion
gain
26pe
rcen
tgro
wth
Not
avai
labl
e
NA
FTA
$14
billi
onga
in10
.0pe
rcen
tgro
wth
from
Mex
ico
in19
94,5
.7pe
rcen
tin
1995
,6.4
perc
ent
in19
97
Ove
rall
14–3
7pe
rcen
t($2
97-$
676
billi
on)g
row
thin
1994
;to
Mex
ico,
1.3
perc
entg
row
thin
1994
,3.8
perc
entg
row
thin
1995
,3.2
perc
entg
row
thin
1996
Sou
rces
:Va
rious
US
ITC
stud
ies
onth
eec
onom
icef
fect
sof
free
trade
agre
emen
ts(c
ompl
ete
listi
nbi
blio
grap
hy).
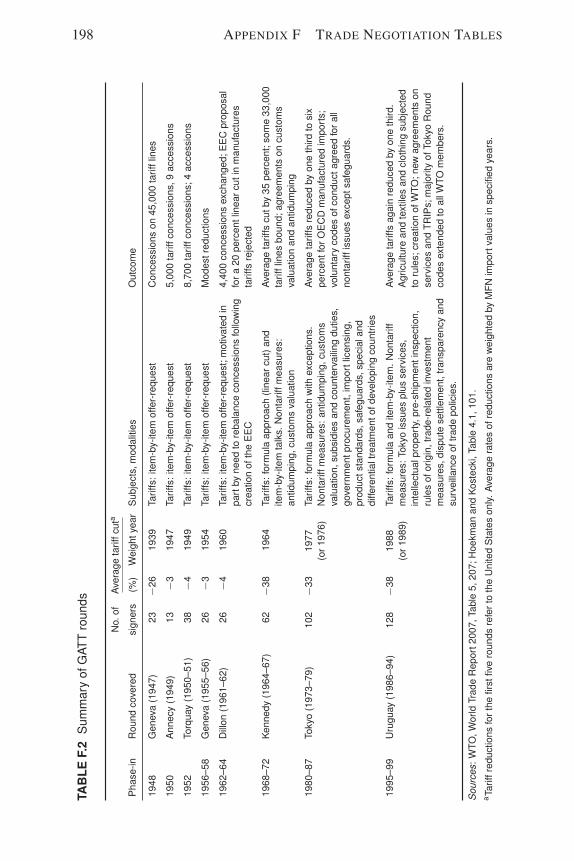
198 APPENDIX F TRADE NEGOTIATION TABLES
TAB
LEF.
2S
umm
ary
ofG
ATT
roun
ds
No.
ofA
vera
geta
riffc
uta
Pha
se-in
Rou
ndco
vere
dsi
gner
s(%
)W
eigh
tyea
rS
ubje
cts,
mod
aliti
esO
utco
me
1948
Gen
eva
(194
7)23
−26
1939
Tarif
fs:
item
-by-
item
offe
r-re
ques
tC
once
ssio
nson
45,0
00ta
riffl
ines
1950
Ann
ecy
(194
9)13
−319
47Ta
riffs
:ite
m-b
y-ite
mof
fer-
requ
est
5,00
0ta
riffc
once
ssio
ns,9
acce
ssio
ns
1952
Torq
uay
(195
0–51
)38
−419
49Ta
riffs
:ite
m-b
y-ite
mof
fer-
requ
est
8,70
0ta
riffc
once
ssio
ns;4
acce
ssio
ns
1956
–58
Gen
eva
(195
5–56
)26
−319
54Ta
riffs
:ite
m-b
y-ite
mof
fer-
requ
est
Mod
estr
educ
tions
1962
–64
Dill
on(1
961–
62)
26−4
1960
Tarif
fs:
item
-by-
item
offe
r-re
ques
t;m
otiv
ated
inpa
rtby
need
tore
bala
nce
conc
essi
ons
follo
win
gcr
eatio
nof
the
EE
C
4,40
0co
nces
sion
sex
chan
ged;
EE
Cpr
opos
alfo
ra20
perc
entl
inea
rcut
inm
anuf
actu
res
tarif
fsre
ject
ed
1968
–72
Ken
nedy
(196
4–67
)62
−38
1964
Tarif
fs:
form
ula
appr
oach
(line
arcu
t)an
dite
m-b
y-ite
mta
lks.
Non
tarif
fmea
sure
s:an
tidum
ping
,cus
tom
sva
luat
ion
Ave
rage
tarif
fscu
tby
35pe
rcen
t;so
me
33,0
00ta
riffl
ines
boun
d;ag
reem
ents
oncu
stom
sva
luat
ion
and
antid
umpi
ng
1980
–87
Toky
o(1
973–
79)
102
−33
1977
(or1
976)
Tarif
fs:
form
ula
appr
oach
with
exce
ptio
ns.
Non
tarif
fmea
sure
s:an
tidum
ping
,cus
tom
sva
luat
ion,
subs
idie
san
dco
unte
rvai
ling
dutie
s,go
vern
men
tpro
cure
men
t,im
port
licen
sing
,pr
oduc
tsta
ndar
ds,s
afeg
uard
s,sp
ecia
land
diffe
rent
ialt
reat
men
tofd
evel
opin
gco
untr
ies
Ave
rage
tarif
fsre
duce
dby
one
third
tosi
xpe
rcen
tfor
OE
CD
man
ufac
ture
dim
port
s;vo
lunt
ary
code
sof
cond
ucta
gree
dfo
rall
nont
ariff
issu
esex
cept
safe
guar
ds.
1995
–99
Uru
guay
(198
6–94
)12
8−3
819
88(o
r198
9)Ta
riffs
:fo
rmul
aan
dite
m-b
y-ite
m.
Non
tarif
fm
easu
res:
Toky
ois
sues
plus
serv
ices
,in
telle
ctua
lpro
pert
y,pr
e-sh
ipm
enti
nspe
ctio
n,ru
les
ofor
igin
,tra
de-r
elat
edin
vest
men
tm
easu
res,
disp
ute
settl
emen
t,tra
nspa
renc
yan
dsu
rvei
llanc
eof
trade
polic
ies.
Ave
rage
tarif
fsag
ain
redu
ced
byon
eth
ird.
Agr
icul
ture
and
text
iles
and
clot
hing
subj
ecte
dto
rule
s;cr
eatio
nof
WTO
;new
agre
emen
tson
serv
ices
and
TRIP
s;m
ajor
ityof
Toky
oR
ound
code
sex
tend
edto
allW
TOm
embe
rs.
Sou
rces
:W
TO,W
orld
Trad
eR
epor
t200
7,Ta
ble
5,20
7;H
oekm
anan
dK
oste
cki,
Tabl
e4.
1,10
1.aTa
riffr
educ
tions
fort
hefir
stfiv
ero
unds
refe
rto
the
Uni
ted
Sta
tes
only
.A
vera
gera
tes
ofre
duct
ions
are
wei
ghte
dby
MFN
impo
rtva
lues
insp
ecifi
edye
ars.