the economic impact of huawei...5 t w huawei’s procurement spending in canada economic impacts...
TRANSCRIPT

THE ECONOMIC IMPACT OF
NOVEMBER 2019
THE ECONOMIC IMPACT OF HUAWEI IN CANADA


1
The economic impact of Huawei in Canada
NOVEMBER 2019
TABLE OF CONTENTS
Executive summary 2
1. Introduction 7
2. Direct economic impact 10
2.1 Sales performance 10
2.2 Direct contribution to GDP 10
2.3 Direct employment 12
2.4 Productivity 13
2.5 Wages 13
2.6 Direct tax contribution 14
3. Total economic impact 16
3.1 Indirect effects arising from Huawei’s supply chain spending 16
3.2 Induced effects arising from wages being spent 19
3.3 Huawei’s total economic impact in Canada 20
3.4 Huawei’s economic impact by province and territory 21
4. The catalytic impact of Huawei in Canada 22
4.1 Huawei’s contribution to Canada’s innovation landscape 22
4.2 Huawei’s contribution to Canada’s ICT skills base 28
4.3 Enhancing Canada’s productivity through digital connectivity 29
5. Conclusion 32
Appendix 33

2
The economic impact of Huawei in Canada
EXECUTIVE SUMMARY
This report explores the impact of Huawei Technologies Canada on the economy of Canada and its provinces and territories, between 2012 and 2018. To do this, Oxford Economics analysed the company’s expenditure and the economic activity this has stimulated, both in Canada as a whole and at province and territory level. We also investigated how Huawei Technologies Canada (hereafter referred to as “Huawei Canada”) contributes to the longer-term productive potential of the Canadian economy through its investments in research and development (R&D), the ICT skills base, and by providing equipment to enable digital connectivity.
HUAWEI CANADA’S TOTAL ECONOMIC IMPACT IN 2018
Huawei Canada’s total economic impact comprises its contribution to Canadian GDP, the employment it supports across the country, and the tax revenues it generates for the Canadian authorities.
In 2018, we calculate that Huawei supported a contribution to Canadian GDP worth $690 million.1 This consisted of a $304 million contribution by Huawei Canada’s own operations (its “direct” impact); a $154 million contribution supported along its supply chain as a result of procurement expenditures (its “indirect” impact); and a $231 million contribution stimulated by the spending of those working at Huawei and in its Canadian supply chain (its “induced” impact).
Through all this activity, Huawei Canada is also found to have supported 4,760 Canadian jobs in 2018, and generated $204 million in tax revenues for the Canadian authorities.
Huawei Canada boasts very high levels of productivity. We calculate that each employee contributed an average of $315,000 to the Canadian economy in 2018—more than two and a half times the national average.
HUAWEI’S IMPACT IN CANADA HAS GROWN SIGNIFICANTLY
Huawei’s economic impact in Canada has grown significantly since 2012, the first year of our analysis. The company’s workforce has increased substantially, along with its procurement spending on goods and services from Canadian suppliers.
In real terms, Huawei Canada’s contribution to GDP was 243% greater in 2018 than in 2012 (see Fig. 1). Over the same period, there was a 166% rise in the number of Canadian jobs supported by Huawei Canada, and a 195% real-terms increase in the tax revenues stimulated by this activity.
1 1 $ = Canadian Dollar
$690 millionHuawei’s total contribution to Canada’s GDP in 2018.
It also supported 4,760 jobs and generated tax receipts of $204 million last year.
243%Percentage increase in Huawei’s contribution to Canadian GDP between 2012 and 2018.
3
The economic impact of Huawei in Canada
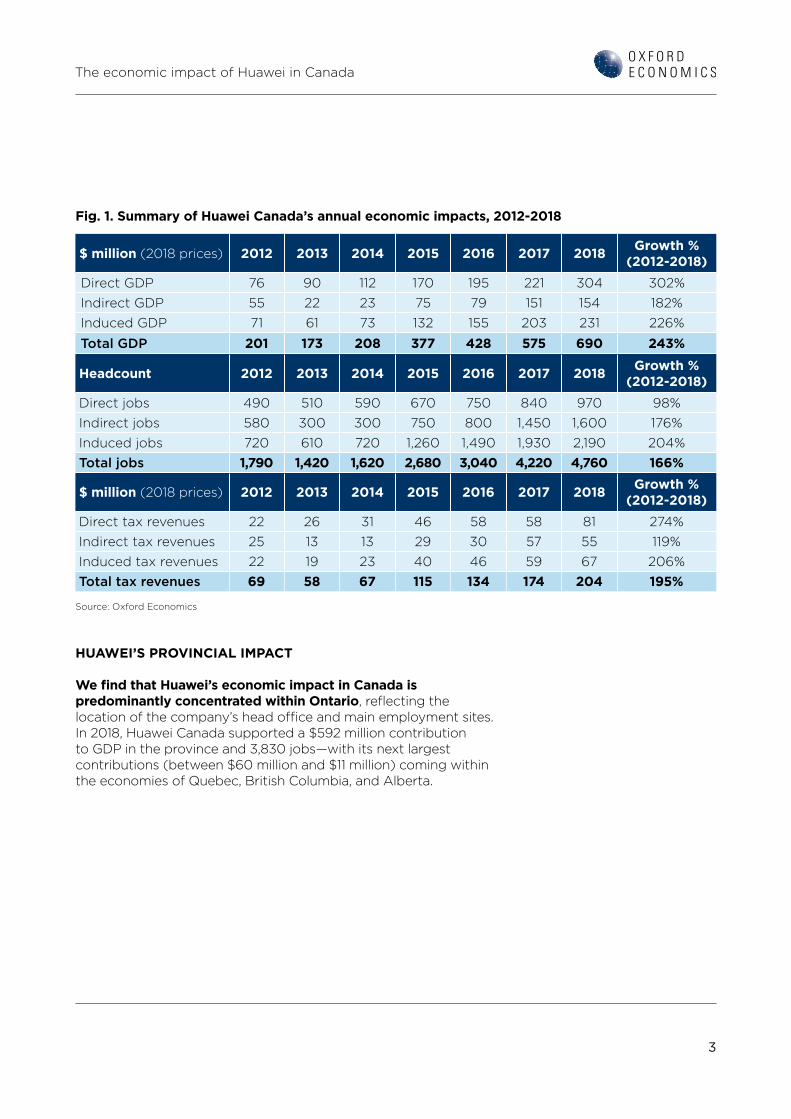
Fig. 1. Summary of Huawei Canada’s annual economic impacts, 2012-2018
$ million (2018 prices) 2012 2013 2014 2015 2016 2017 2018 Growth % (2012-2018)
Direct GDP 76 90 112 170 195 221 304 302%Indirect GDP 55 22 23 75 79 151 154 182%Induced GDP 71 61 73 132 155 203 231 226%
Total GDP 201 173 208 377 428 575 690 243%
Headcount 2012 2013 2014 2015 2016 2017 2018 Growth % (2012-2018)
Direct jobs 490 510 590 670 750 840 970 98%Indirect jobs 580 300 300 750 800 1,450 1,600 176%Induced jobs 720 610 720 1,260 1,490 1,930 2,190 204%Total jobs 1,790 1,420 1,620 2,680 3,040 4,220 4,760 166%
$ million (2018 prices) 2012 2013 2014 2015 2016 2017 2018 Growth % (2012-2018)
Direct tax revenues 22 26 31 46 58 58 81 274%Indirect tax revenues 25 13 13 29 30 57 55 119%Induced tax revenues 22 19 23 40 46 59 67 206%Total tax revenues 69 58 67 115 134 174 204 195%
Source: Oxford Economics
HUAWEI’S PROVINCIAL IMPACT
We find that Huawei’s economic impact in Canada is predominantly concentrated within Ontario, reflecting the location of the company’s head office and main employment sites. In 2018, Huawei Canada supported a $592 million contribution to GDP in the province and 3,830 jobs—with its next largest contributions (between $60 million and $11 million) coming within the economies of Quebec, British Columbia, and Alberta.

4
The economic impact of Huawei in Canada
HUAWEI’S IMPACT ON CANADA’S PRODUCTIVE CAPACITY
Huawei also supports a wider, “catalytic” contribution to the Canadian economy by boosting the nation’s productive potential. The company does this through its own R&D spending, its collaborations with universities, the ICT training it delivers to Canadian workers and students, and by boosting the country’s digital connectivity levels through its products.
In all, Huawei invested $164 million in R&D in Canada in 2018, and collaborated with 22 universities and research institutes. The company aims to provide ICT training to 1,000 Canadians by 2020, including in the country’s Far North. To date, Huawei Canada has included 87 students on its Seeds for the Future program, which provides the opportunity to visit its global headquarters in China for training and study.
Huawei is also supporting the Canadian government’s ambitions to broaden the population’s access to high-speed broadband and wireless networks by partnering with operators with the goal of helping to connect more than 70 remote and rural communities by 2025.
$164 millionAmount invested by Huawei in R&D in Canada in 2018.
5
The economic impact of Huawei in Canada
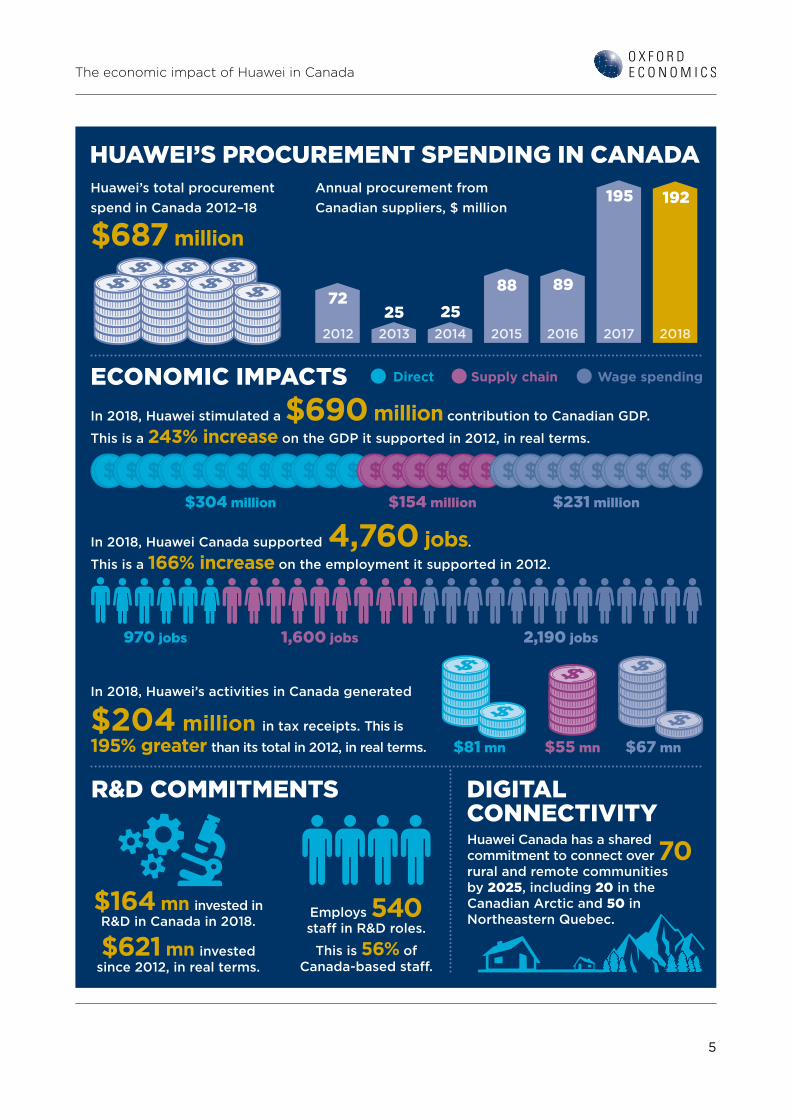
HUAWEI’S PROCUREMENT SPENDING IN CANADA
ECONOMIC IMPACTS
R&D COMMITMENTS
Huawei’s total procurement spend in Canada 2012–18
$687 million
In 2018, Huawei stimulated a $690 million contribution to Canadian GDP.
This is a 243% increase on the GDP it supported in 2012, in real terms.
In 2018, Huawei Canada supported 4,760 jobs.
This is a 166% increase on the employment it supported in 2012.
In 2018, Huawei’s activities in Canada generated
$204 million in tax receipts. This is 195% greater than its total in 2012, in real terms.
$304 million
970 jobs
$81 mn $55 mn $67 mn
$154 million
1,600 jobs
$231 million
2,190 jobs
2572
88
25
89
195 192
Direct Supply chain Wage spending
Employs 540 staff in R&D roles.
This is 56% of Canada-based staff.
Annual procurement from Canadian suppliers, $ million
20142012 20152013 2016 2017 2018
DIGITAL CONNECTIVITYHuawei Canada has a shared commitment to connect over 70 rural and remote communities by 2025, including 20 in the Canadian Arctic and 50 in Northeastern Quebec.
$164 mn invested in R&D in Canada in 2018.
$621 mn invested since 2012, in real terms.


7
The economic impact of Huawei in Canada
This report explores the impact of Huawei Technologies Canada—the Canadian subsidiary of the global telecommunications company, Huawei—on the economy of Canada and its provinces and territories, between 2012 and 2018. Hereafter, we refer to “Huawei Technologies Canada” as “Huawei Canada”.
Huawei has a firmly established presence in Canada. The company operates across eight locations in Canada, with its national headquarters in Markham, and further sites in Ottawa, Waterloo, Calgary, Edmonton, Vancouver, Montreal and Quebec City.
The economic footprint of Huawei Canada is assessed using a standard means of analysis called an economic impact assessment. This technique allows us to model the company’s economic impact in terms of its contribution to annual GDP, number of jobs supported and the tax revenues generated. A summary of the methodology is provided in the box below, with more details in the Appendix at the end of this report.
Huawei’s economic impact in Canada is not limited to the footprint of its ongoing operations. We also explore how the company’s investment in R&D acts as a catalyst for further economic activity, enhancing Canada’s longer-term productive potential.
1. INTRODUCTION
Fig. 2. Huawei’s sites in Canada
YukonNorthwestTerritories
Sask
atch
ewan
BritishColumbia
Alberta
Manitoba
Ontario
Nunavut
Newfoundland& Labrador
New BrunswickVancouver
Calgary EdmontonWaterloo
Markham(Headquarters)
Ottawa
Quebec City
Montreal
Nova Scotia
Prince Edward Island
Quebec
8
The economic impact of Huawei in Canada
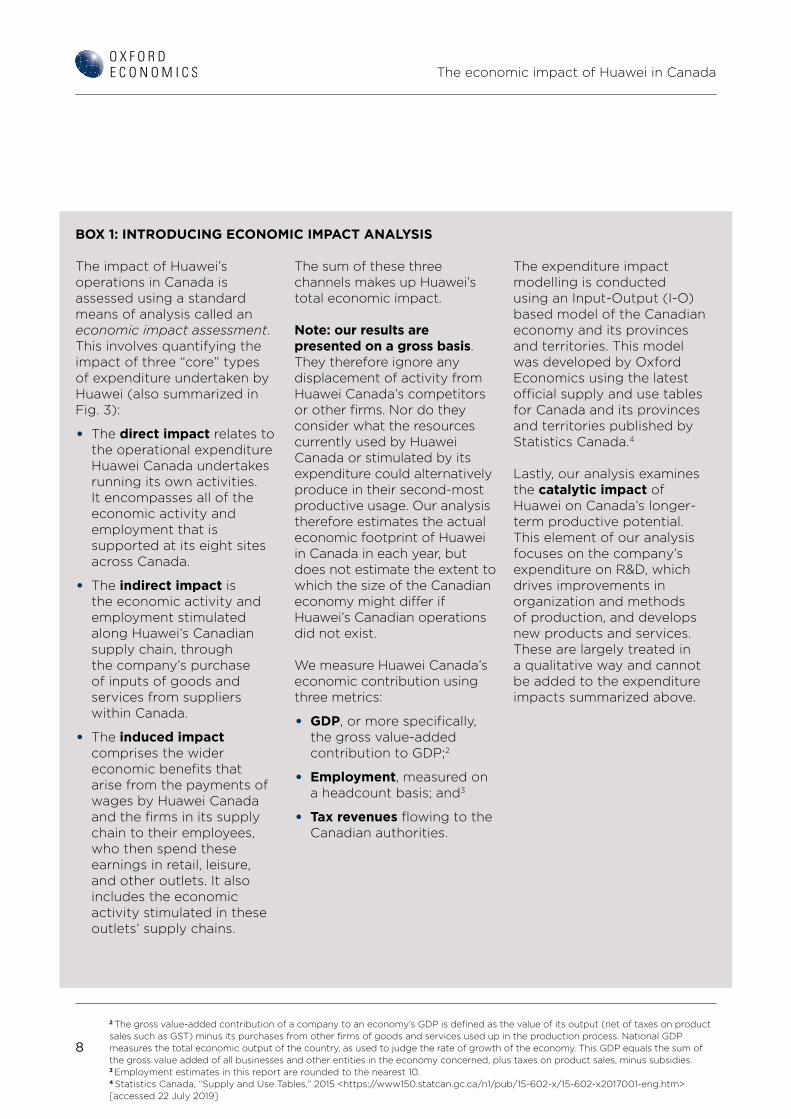
BOX 1: INTRODUCING ECONOMIC IMPACT ANALYSIS
2 The gross value-added contribution of a company to an economy’s GDP is defined as the value of its output (net of taxes on product sales such as GST) minus its purchases from other firms of goods and services used up in the production process. National GDP measures the total economic output of the country, as used to judge the rate of growth of the economy. This GDP equals the sum of the gross value added of all businesses and other entities in the economy concerned, plus taxes on product sales, minus subsidies. 3 Employment estimates in this report are rounded to the nearest 10.4 Statistics Canada, “Supply and Use Tables,” 2015 <https://www150.statcan.gc.ca/n1/pub/15-602-x/15-602-x2017001-eng.htm> [accessed 22 July 2019]
The impact of Huawei’s operations in Canada is assessed using a standard means of analysis called an economic impact assessment. This involves quantifying the impact of three “core” types of expenditure undertaken by Huawei (also summarized in Fig. 3):
• The direct impact relates to the operational expenditure Huawei Canada undertakes running its own activities. It encompasses all of the economic activity and employment that is supported at its eight sites across Canada.
• The indirect impact is the economic activity and employment stimulated along Huawei’s Canadian supply chain, through the company’s purchase of inputs of goods and services from suppliers within Canada.
• The induced impact comprises the wider economic benefits that arise from the payments of wages by Huawei Canada and the firms in its supply chain to their employees, who then spend these earnings in retail, leisure, and other outlets. It also includes the economic activity stimulated in these outlets’ supply chains.
The sum of these three channels makes up Huawei’s total economic impact.
Note: our results are presented on a gross basis. They therefore ignore any displacement of activity from Huawei Canada’s competitors or other firms. Nor do they consider what the resources currently used by Huawei Canada or stimulated by its expenditure could alternatively produce in their second-most productive usage. Our analysis therefore estimates the actual economic footprint of Huawei in Canada in each year, but does not estimate the extent to which the size of the Canadian economy might differ if Huawei’s Canadian operations did not exist.
We measure Huawei Canada’s economic contribution using three metrics:
• GDP, or more specifically, the gross value-added contribution to GDP;2
• Employment, measured on a headcount basis; and3
• Tax revenues flowing to the Canadian authorities.
The expenditure impact modelling is conducted using an Input-Output (I-O) based model of the Canadian economy and its provinces and territories. This model was developed by Oxford Economics using the latest official supply and use tables for Canada and its provinces and territories published by Statistics Canada.4
Lastly, our analysis examines the catalytic impact of Huawei on Canada’s longer-term productive potential. This element of our analysis focuses on the company’s expenditure on R&D, which drives improvements in organization and methods of production, and develops new products and services. These are largely treated in a qualitative way and cannot be added to the expenditure impacts summarized above.

9
The economic impact of Huawei in Canada
Fig. 3. Schematic of Huawei’s contribution to the Canadian economy
DIRECTIMPACT
INDIRECTIMPACT
TOTALIMPACT
INDUCEDIMPACT
CATALYTICIMPACT
A company or sector employs lots of sta�. Its operations generate GDP and tax for the authorities.
Employees (including of the suppliers) spend their wages in the wider economy, generating more GDP, jobs and tax revenues.
Added together, these three e�ects—direct, indirect, induced—comprise the total economic impact of the company or sector.
In addition, a company or sector’s activities and services have wider e�ects, boosting activity elsewhere in the economy. These—such as R&D spillovers or training—represent the wider benefits that governments, consumers and society derive.
It also spends money with suppliers who employ sta�, generate GDP and pay taxes. They use other suppliers in turn.

10
The economic impact of Huawei in Canada
2. DIRECT ECONOMIC IMPACT
This chapter describes the direct impact of Huawei’s own operations on the Canadian economy from 2012 to 2018. We start by reviewing Huawei Canada’s sales performance over this seven-year period, and estimating its direct contribution to Canadian GDP. We then examine the company’s impact on the labour market by assessing the levels of employment, productivity and wages it supports at its eight sites. Finally, we look at the tax revenues sustained by Huawei’s direct operations.
5 Further details on taxes on production can be found here: “ Statistics Canada, “Taxes less subsidies on production,” <https://www150.statcan.gc.ca/n1/pub/13-607-x/2016001/v62295559-eng.htm> [accessed 23 August 2019]6 $ = Canadian Dollar
2.1 SALES PERFORMANCE
Huawei Canada’s sales increased by 183% between 2012 and 2018. The bulk of sales revenue over this period was generated from Canadian customers: domestic sales accounted for 77% of revenue. Nonetheless, the importance of sales to other parts of the Huawei Group outside of Canada has steadily increased. Between 2012 and 2018, these export sales grew by an average of 39% per year, compared to an average of 15% for domestic sales.
2.2 DIRECT CONTRIBUTION TO GDP
We estimated Huawei’s annual direct contribution to Canada’s GDP using the “income approach”. Under this method, Huawei Canada’s direct GDP contribution is the sum of:
• the profits made by the company, measured in terms of earnings before interest, tax, depreciation and amortization (EBITDA);
• employee compensation, which includes wages and employer social contributions; and
• the taxes on production paid to Canadian tax authorities, such as land transfer taxes, property taxes, vehicle licences, and taxes on insurance.5
On this basis, we estimate that Huawei directly contributed $304 million to Canadian GDP in 2018. This represents an increase of more than 300% from the value in 2012, after adjusting for inflation (see Fig. 5).6
This large rise in Huawei Canada’s direct contribution to GDP translates into an average growth rate of 26.1% a year over the period 2012–2018. In comparison, the ICT sector increased its contribution to GDP by just 2.7% per year over the same period.
$, millions
2012 20142013 2015 2016 2017 20180
100
200
300
400
500
600
700
800
900
Domestic sales
Overseas sales to other parts of the Huawei Group
Source: Huawei Technologies Canada Totals may not sum due to rounding
238 224272
372434 441
55028 41
63
110
139 156
204
266 265
335
482
573596
753
Fig. 4. Huawei Canada’s sales revenue, 2012-2018

11
The economic impact of Huawei in Canada
Fig. 5. Huawei Canada’s annual direct contribution to Canadian GDP, 2012–2018
Fig. 6. Compound annual growth rate in real GDP of Huawei Canada, other related sectors, and the Canadian economy, 2012–20187,8
7 $ = Comparison industries growth rates were developed using historical industry GDP data from Statistics Canada. The specific series can be found at: Statistics Canada, “Gross domestic product (GDP) at basic prices, by industry, provinces and territories,” 1997 - 2018 <https://www150.statcan.gc.ca/t1/tbl1/en/tv.action?pid=3610048701> [accessed August 2019] and Statistics Canada, “Gross domestic product (GDP) at basic prices, by industry, monthly, growth rates (x 1,000,000),” <https://www150.statcan.gc.ca/t1/tbl1/en/tv.action?pid=3610043402>8 ICT comprises all North American Industry Classification System (NAICS) codes that relate to information and communication technology industries. This includes portions of the following sectors: “Manufacturing” (NAICS 31-33), “Wholesale trade” (NAICS 41), “Information and cultural industries” (NAICS 51), “Professional, scientific and technical services” (NAICS 54) and “Other services (except public administration)” (NAICS 81). Source: Statistics Canada, “Variant of NAICS 2012 - Information and communication technology (ICT) sector,” <http://www23.statcan.gc.ca/imdb/p3VD.pl?Function=getVD&TVD=128313&CVD=128314&CPV=ICT%20/%20TIC&CST=01012012&CLV=1&MLV=6>
$, millions (in 2018 prices)
2012 201520142013 2016 2017 20180
Source: Huawei Technologies Canada and Oxford Economics
7690
112
170195
221
304
50
100
150
200
250
300
350
Source: Huawei Technologies Canada, Statistics Canada and Oxford Economics
0% 5% 10% 20%15% 25% 30%-5%
26.1%Huawei Canada
ICT
Canadian economy
Telecommunications
Electrical equipmentmanufacturing
Computer and electronicmanufacturing
2.7%
0.5%
0.4%
-0.3%
2.0%

12
The economic impact of Huawei in Canada
2.3 DIRECT EMPLOYMENT
The number of people employed by Huawei in Canada has grown steadily as the company has grown. Between 2012 and 2018, the total number of employees almost doubled from 490 to 970 people. Throughout this period all employees were employed on a full-time basis.
These figures do not include agency workers, the numbers of which had grown to 280 full-time staff by 2018. These agency workers are considered within the indirect impact for the purposes of this report.
Over the 2012-2018 period, the vast majority of Huawei Canada’s workforce were located at its three sites in Ontario. These sites were home to 95% of Huawei’s Canadian workforce in 2018.
Fig. 7. Direct jobs supported by Huawei Canada, 2012-2018
Fig. 8. Share of Huawei Canada’s direct employment, by province of workplace, 2018
Headcount
201420132012 2015 2016 2017 20180
600
400
200
800
1,000
1,200
Source: Huawei Technologies Canadas
490 510590
670750
840
970
Source: Huawei Technologies Canada
Ontario95%
Alberta0.4%
Quebec2%
British Columbia3%
Total:970 jobs

13
The economic impact of Huawei in Canada
Fig. 9. Huawei Canada’s labour productivity compared to other related sectors, and whole Canadian economy, 20189
Fig. 10. Average weekly wage for Huawei Canada and all industries, 201810,11
9 Productivity levels were developed using historic industry GDP and employment data from Statistics Canada. The specific datasets can be found at: Statistics Canada, “Gross domestic product (GDP) at basic prices, by industry, provinces and territories,” 1997 - 2018 <https://www150.statcan.gc.ca/t1/tbl1/en/tv.action?pid=3610048701> [accessed August 2019] and Statistics Canada, “Labour statistics consistent with the System of National Accounts (SNA), by job category and industry,” 1997 - 2018 <https://www150.statcan.gc.ca/t1/tbl1/en/tv.action?pid=3610048901> [accessed August 2019]10 The all industries average equates to the 2018 full-time employee average weekly wage rate. Source: Statistics Canada, “Employee wages by industry, annual,” 2018 <https://www150.statcan.gc.ca/t1/tbl1/en/tv.action?pid=1410006401> [accessed August 2019]11 Average weekly wages are defined as wages before taxes and other deductions, and include tips, commissions and bonuses.
2.4 PRODUCTIVITY
Combining Huawei Canada’s direct contributions to GDP and employment suggests that each of Huawei’s workers contributed an average of $315,000 to the Canadian economy in 2018. This is significantly greater (164%) than the average for the Canadian economy as a whole, although 7% lower than the average for the Canadian telecommunications sector.
2.5 WAGES
Huawei Canada’s high levels of productivity allow the company to reward its staff with high salaries. In 2018, the average weekly wage offered by the organization was almost $3,500, three times higher than the full-time all-industries average for Canada.
Source: Huawei Technologies Canada, Statistics Canada and Oxford Economics
0 150 200 300250 350 40010050
Huawei Canada
ICT
Canadian economy
Telecommunications
Electrical equipmentmanufacturing
Computer and electronicmanufacturing
337
315
143
127
126
119
GDP per worker: $, 000s
$
All industries averageHuawei Canada0
2,500
2,000
1,500
1,000
500
3,000
3,500
4,000
Source: Huawei Technologies Canada, Statistics Canada and Oxford Economics
3,492
1,121

14
The economic impact of Huawei in Canada
2.6 DIRECT TAX CONTRIBUTION
12 Note: Huawei has received a total of $103 million in Scientific Research and Experimental Development (SR&ED) tax credits through its R&D investments in Canada since incorporation. Over the period 2009 to 2018, Huawei has used $76.96 million of the tax credit to reduce income tax payments and, as of 2019, there is currently $24.4 million of unused tax credits being carried forward to apply towards future tax payments. The direct tax figures presented above and in the rest of this report are the actual taxes contributed by Huawei after available tax credits have been applied.
Huawei Canada and its employees made significant tax contributions over the period 2012-2018. In 2018 alone, Huawei Canada directly contributed $81 million in taxes to federal, provincial and municipal government authorities in Canada, with the majority coming from worker income tax payments. (Fig. 11).12
Fig. 11. Taxes paid by Huawei Canada and its employees, 2018
$, millions
Employersocial securitycontributions
Corporate tax Employeesocial securitycontributions
Employeepayments of
personal income tax
Other taxes0
40
30
20
10
50
60
70
Source: Huawei Technologies Canada and Oxford Economics
60
84 63

15
The economic impact of Huawei in Canada

16
The economic impact of Huawei in Canada
3. TOTAL ECONOMIC IMPACT
In this chapter, we broaden our analysis to consider the wider supply chain and worker spending impacts supported by Huawei’s operations in Canada. By adding these to the company’s direct impact we can estimate its total economic impact. We estimate this “footprint” in terms of the company’s overall contribution to GDP, jobs and tax revenues over the period 2012-2018.
3.1 INDIRECT EFFECTS ARISING FROM HUAWEI CANADA’S SUPPLY CHAIN SPENDING
The activity supported by Huawei’s direct operations represents only part of the company’s total impact on the Canadian economy. To build a fuller picture of Huawei Canada’s economic contribution, we need to consider its purchases of inputs of goods and services from Canadian suppliers (i.e. its Canadian supply chain). This includes Huawei Canada’s capital investments, such as on new facilities and IT equipment, as well as that of
its day-to-day purchases.
Between 2012 and 2018, Huawei spent $687 million (in nominal terms) with Canadian suppliers. The annual value of such purchases has increased substantially in the last two years, with 2017 and 2018 accounting for more than half of spending with Canadian suppliers since 2012.
Fig. 12. Huawei Canada’s annual procurement and capital spend, 2012-2018
$, millions
2012 20142013 2015 2016 2017 20180
150
250
350
100
50
200
300
400
450
500
550
Purchases from overseas
Purchases from other businesses in Canada
Source: Huawei Technologies Canada
154181
235 264333
223
31672 25
25
88
89
195
192
226207
261
352
422 418
509
Totals may not sum due to rounding
17
The economic impact of Huawei in Canada
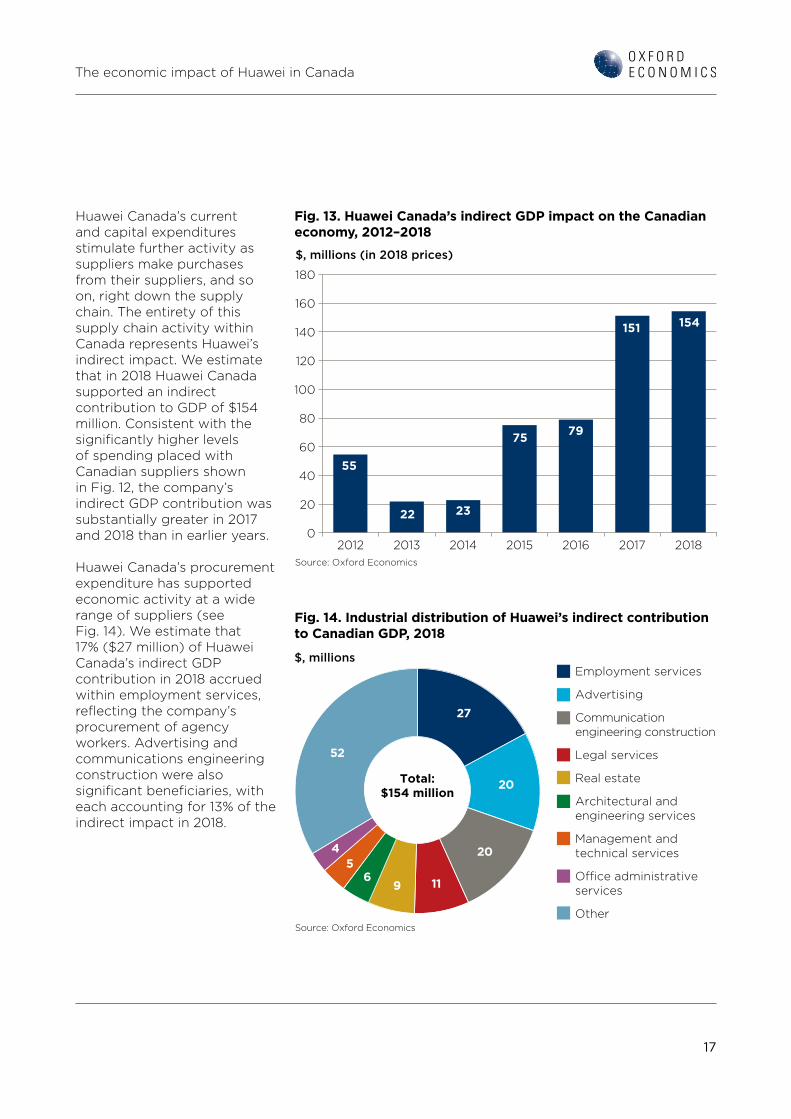
Fig. 13. Huawei Canada’s indirect GDP impact on the Canadian economy, 2012–2018
Huawei Canada’s current and capital expenditures stimulate further activity as suppliers make purchases from their suppliers, and so on, right down the supply chain. The entirety of this supply chain activity within Canada represents Huawei’s indirect impact. We estimate that in 2018 Huawei Canada supported an indirect contribution to GDP of $154 million. Consistent with the significantly higher levels of spending placed with Canadian suppliers shown in Fig. 12, the company’s indirect GDP contribution was substantially greater in 2017 and 2018 than in earlier years.
Huawei Canada’s procurement expenditure has supported economic activity at a wide range of suppliers (see Fig. 14). We estimate that 17% ($27 million) of Huawei Canada’s indirect GDP contribution in 2018 accrued within employment services, reflecting the company’s procurement of agency workers. Advertising and communications engineering construction were also significant beneficiaries, with each accounting for 13% of the indirect impact in 2018.
Fig. 14. Industrial distribution of Huawei’s indirect contribution to Canadian GDP, 2018
$, millions (in 2018 prices)
2012 201520142013 2016 2017 20180
Source: Oxford Economics
60
40
20
80
100
120
140
160
180
55
22 23
75 79
151 154
$, millions
Source: Oxford Economics
Total:$154 million
27
20
20
1196
54
52
Employment services
Advertising
Communicationengineering construction
Legal services
Real estate
Architectural andengineering services
Management andtechnical services
O�ce administrativeservices
Other

18
The economic impact of Huawei in Canada
To calculate the total number of Canadian jobs supported by Huawei’s supply chain spending over the 2012-2018 period, in most cases we combined the company’s annual indirect GDP impacts on each sector with estimates of productivity. The number of temporary workers procured through employment agencies and based at Huawei Canada’s sites was provided directly by the company. The numbers of such workers are shown separately in Fig. 15.
In 2017 and 2018, the years with the greatest procurement spend, we estimate that Huawei sustained 1,500 and 1,600 jobs respectively through its Canadian supply chain. The 2018 figure represented an increase of 176% over the equivalent value in 2012.
Using information on the geographical distribution of supply chain spending and the location of agency workers, we can estimate how the indirect jobs were distributed across Canada. This analysis suggests that, in 2018, the province with the largest indirect employment impact was Ontario, with 1,200 jobs supported by Huawei Canada’s supply chain spending (Fig. 16).
As well as GDP and employment, the economic activity sustained by Huawei’s supply chain spending provided taxes to the Canadian authorities.
We calculate that Huawei’s supply chain spending in Canada indirectly contributed an estimated $222 million (2018 prices) in tax revenues over the period 2012-2018.
Fig. 15. Huawei Canada’s indirect employment impact on the Canadian economy, 2012-2018
Fig. 16. Jobs supported by Huawei Canada’s supply chain spending, by province, 2018
Headcount
2012 20142013 2015 2016 2017 20180
Agency workers based at Huawei sites
Other indirect employment
Source: Oxford Economics
200
400
600
800
1,000
1,200
1,400
1,600
1,800
60
520
580
100200300
120180300
130
620
750
170
630
800
210
1,240
1,450
280
1,320
1,600
Totals may not sum due to rounding
Source: Oxford Economics
0 200 400 800600 1,000 1,200
50
20
10
Headcount
Other
Alberta
British Columbia
Quebec
Ontario
Agency workers based at Huawei sites
Other indirect employment
1,180
330

19
The economic impact of Huawei in Canada
3.2 INDUCED EFFECTS ARISING FROM WAGES BEING SPENT
13 Our induced effects are based on consumption financed by wage income only. To the extent that capital income also results in wage consumption effects within Canada, the induced effects reported here may be conservative.
Over the period 2012-2018, Huawei Canada paid its employees a total of $723 million. In addition, we estimate that Huawei Canada’s procurement expenditure supported $298 million of wage payments for those employed in the company’s Canadian supply chain.
The payment of wages to people either working for Huawei Canada, or within its Canadian supply chain, supports further economic activity, in the form of consumer spending on a wide range of goods and services from Canadian businesses. This is known as the induced impact of Huawei Canada on the economy.13
We estimate that this wage-financed consumption supported a GDP contribution of $71 million (in 2018 prices) in 2012. This increased to $231 million in 2018, representing an increase of 226%. In 2018, Huawei Canada’s induced effects also supported 2,200 jobs, and a $67 million tax contribution to the Canadian authorities.
Taking a closer look at 2018, we find that the employment sustained by this consumer spending benefits a wide range of industries (see Fig. 17). The largest among them was the retail trade sector, where the payment of wages by Huawei Canada and its suppliers is estimated to have supported 450 jobs in 2018 (21% of the total). The accommodation and food services sector was the second-largest beneficiary.
Fig. 17. Industrial distribution of induced contribution to employment, 2018
Headcount
Source: Oxford Economics
Total:2,200 jobs
450
280
200
180150140
120
120
100
440
Retail trade
Accommodation andfood services
Finance and real estate
Household services
Administrative services
Professional services
Health care
Manufacturing
Transportation
Other

20
The economic impact of Huawei in Canada
3.3 HUAWEI’S TOTAL ECONOMIC IMPACT IN CANADA
Adding the direct economic impact discussed in Chapter 2 to the multiplier effects above gives the total economic impact of Huawei in Canada. On this basis, we find Huawei’s total contribution to Canadian GDP increased from $201 million in 2012 to $690 million in 2018, in real terms—an overall increase of 243%.
We calculate that, overall, Huawei’s activities in Canada supported a total of 4,760 jobs in 2018. This represents an increase of 166% from 2012 employment levels. In 2018, the vast majority (80%) of the jobs were supported by Huawei’s purchases from Canadian suppliers and workers’ spending, the remainder was made up of Huawei’s own employees.
Huawei’s activities in Canada also supported a total tax contribution of $204 million in 2018. The total value of tax receipts supported across the three impact channels increased by 195% in real terms between 2012 and 2018.
Fig. 18. Huawei Canada’s total gross value-added contributions to the Canadian economy in real terms, 2012-2018
Fig. 19. Huawei Canada’s total employment contributions to the Canadian economy, 2012-2018
$, millions (2018 prices)
2012 20142013 2015 2016 2017 20180
Direct
Indirect
Induced
Source: Oxford Economics
100
200
300
400
500
600
700
800
55
71
76
201
2261
90
173
2373
112
20875
132
170
377
79
155
195
428
151
203
221
575
154
231
304
690
Totals may not sum due to rounding
Headcount
2012 20142013 2015 2016 2017 20180
Direct
Indirect
Induced
Source: Oxford Economics Totals may not sum due to rounding
1,000
2,000
3,000
4,000
5,000
6,000
580
720
490
1,790
300610
510
1,420
300
720
590
1,620
750
1,260
670
2,680
800
1,490
750
3,040
1,450
1,930
840
4,220
1,600
2,190
970
4,760

21
The economic impact of Huawei in Canada
Fig. 20. Huawei Canada’s total Canadian tax contributions, 2012-2018
3.4 HUAWEI’S ECONOMIC IMPACT BY PROVINCE AND TERRITORY
14 We used the value of wages paid to Huawei employees in each province and territory to apportion Huawei’s direct GDP to Canada’s provinces and territories.
Using information on the location of company supply chain spending, the number of Huawei Canada employees in each province or territory, and the value of wages paid to these employees, we can estimate the direct, indirect, and induced gross value-added and employment contributions accruing to each part of Canada.14
Consistent with the findings in earlier sections, we find that Huawei’s economic impact within Canada is predominantly concentrated within Ontario, reflecting the location of the company’s head office and main employment sites. Specifically, Huawei supported a $592 million total value added contribution to GDP and 3,830 jobs in Ontario in 2018.
Fig. 21. Huawei Canada’s total contribution to Canadian GDP and employment by province and territory, 2018
Province or territory
GDP ($, millions)
Employment (Headcount)
Ontario 592 3,830
Quebec 60 610
British Columbia 20 160
Alberta 11 90
Other 7 70
Total 690 4,760
$, millions (2018 prices)
2012 20142013 2015 2016 2017 20180
Direct
Indirect
Induced
Source: Oxford Economics Totals may not sum due to rounding
50
100
150
200
250
300
22 26 31 46 58 58 8125 13 1329 30
5755
22 19 23
4046
5967
6958 67
115134
174
204

22
The economic impact of Huawei in Canada
4. THE CATALYTIC IMPACT OF HUAWEI IN CANADA
The contribution that Huawei makes to Canada extends beyond the core economic channels described so far in this report. In this chapter, we examine the “catalytic” impacts of Huawei on Canada’s longer-term productive potential. To do this, we have analysed Huawei’s research and development (R&D) activity; its contribution to Canada’s ICT skills base; and how it supports productivity and innovation right across the economy through the provision of equipment which sustains and enhances Canada’s digital connectivity.
15 Industry Canada, “Innovation Canada: A Call to Action,” Review of Federal Support to Research and Development – Expert Panel Report, 201116 Selected countries are all those available on the OECD Database for 2017, the latest available period. Source: OECD, “Gross domestic spending on R&D,” 2019, <https://data.oecd.org/rd/gross-domestic-spending-on-r-d.htm> [accessed September 2019].
4.1 HUAWEI’S CONTRIBUTION TO CANADA’S INNOVATION LANDSCAPE
In the long run, productivity growth is the main driver of a country’s economic prosperity, measured in terms of income per capita. Innovation is, in turn, a key driver of productivity growth.15 The amount a country invests in R&D is therefore of critical importance to its long-term economic prospects.
R&D investment in Canada is currently low by both historical and international standards (see Fig. 22). Total domestic expenditure on R&D (as a
percentage of GDP) by all Canadian resident companies, research institutes, universities and government laboratories stood at 1.6% in 2017, down from 1.9% a decade earlier. This compares to 2.8% for the USA and 2.0% for the EU28, which now surpasses Canada, having increased its R&D expenditure from 1.7% 10 years earlier.
Fig. 22. Gross domestic spending on R&D as a percentage of GDP, OECD and selected other countries, 201716
Source: OECD
Korea
Israel
Switzerland
Japan
USA
OECD average
China
Iceland
Norway
EU28 average
Singapore
Canada
New Zealand
Russia
Argentina
Chile
0.0% 0.5% 1.0% 1.5% 2.0% 2.5% 3.0% 3.5% 4.0% 4.5% 5.0%

23
The economic impact of Huawei in Canada
However, the Canadian government is taking steps to address these trends. In a report on the government’s flagship Innovation and Skills Plan, innovation was described as “the key to competitiveness, productivity, economic growth, creating jobs and making life better for all Canadians”.17 The plan, launched in the 2017 Budget, focuses on developing the following potential high-growth industries: advanced manufacturing, agri-food, clean technology, digital industries, health- and bio-sciences, and resources of the future.
The 2018 Budget followed up by pledging $4 billion of funding for science over the subsequent five years, including $1.3 billion for investment in laboratories and equipment.18 According to Federal Finance Minister Morneau, this was “the single largest investment in investigator-led fundamental research in Canadian history”.19
The government has also set a target to increase business expenditure on R&D to $30 billion in 2025, up from $17.6 billion in 2017, and to keep pace with the OECD average as a percentage of GDP.20
17 Source: Innovation, Science and Economic Development Canada, “Building A Nation of Innovators,” 2019, <https://www.ic.gc.ca/eic/site/062.nsf/vwapj/ISEDC_19-044_INNOVATION-SKILLS_E_web.pdf/$file/ISEDC_19-044_INNOVATION-SKILLS_E_web.pdf> 18 Canadian Government, “Equality Growth, A Strong Middle Class,” 2018, <https://www.budget.gc.ca/2018/docs/plan/budget-2018-en.pdf>19 Nature International Journal of Science, “Canadian Science Wins Billions in New Budget,” 2018, <https://www.nature.com/articles/d41586-018-02529-6>20 Government of Canada, “Indicators and targets: Growing business investment in research and development,” 2019, <https://www.ic.gc.ca/eic/site/062.nsf/eng/00088.html> [Accessed: September 2019]21 See, for example, Myeongwan Kim and John Lester, “R&D spillovers in Canadian industry: results from a new micro database,” CSLS Research Report 2019-02, 201922 Research Infosource Inc, “Canada’s Top 100 Corporate R&D Spenders,” 2018, <https://researchinfosource.com/top-100-corporate-rd-spenders/2018/list> [Accessed: September 2019]
Huawei Canada’s significant R&D expenditures support the Canadian government as it works towards these objectives, as well as wider innovation ambitions. When a company invests in R&D, the benefits do not just accrue to that firm; the activity will usually enhance the productive capacity of the wider Canadian business sector. This is known as the “spill-over benefits” of R&D, as the knowledge and skills built up over time transfer from one entity to another through various forms of contact between businesses and research institutions.21 While these benefits will ultimately spread across national borders, entities physically located within the same economy tend to benefit more quickly.
Huawei’s innovation activities in Canada include seven City Research Centres in Vancouver, Edmonton, Waterloo, Markham, Ottawa, Montreal, and Quebec City. A publication by Research Infosource ranked Huawei Canada 22nd among Canadian corporates in terms of R&D expenditure in 2017. This compares to a ranking of 29th in 2015.22
24
The economic impact of Huawei in Canada
BOX 2: ENABLING SMART CITIES
23 Source: Huawei press release dated [6th February 2019]
The City of Markham, Ontario worked with one of Huawei’s partner companies in early 2019 to launch its Smart City Accelerator Research Program. This aims to improve the efficiency of municipal operations and enhance city services for residents using a smart city platform powered by the city broadband network and Huawei equipment.
Another Huawei partner company will aggregate data gathered from IOT monitoring equipment with the city’s open data to provide a dashboard view of the city’s operations. Analytics provided by the system will enable municipal workers from across city departments to collaborate in real time, leading to better-informed decisions.
Planned initiatives for the Markham Smart City program include helping with asset management through the remote tracking of usage and location of municipal equipment. Water leak detection and energy management optimization will also be enabled by sensors on water mains, hydrants, and municipal buildings. Lastly, environmental sensors will provide information on temperature, humidity, and water levels to give warnings on storm and floods, as well as helping to guide the day-to-day decisions of city operators.23
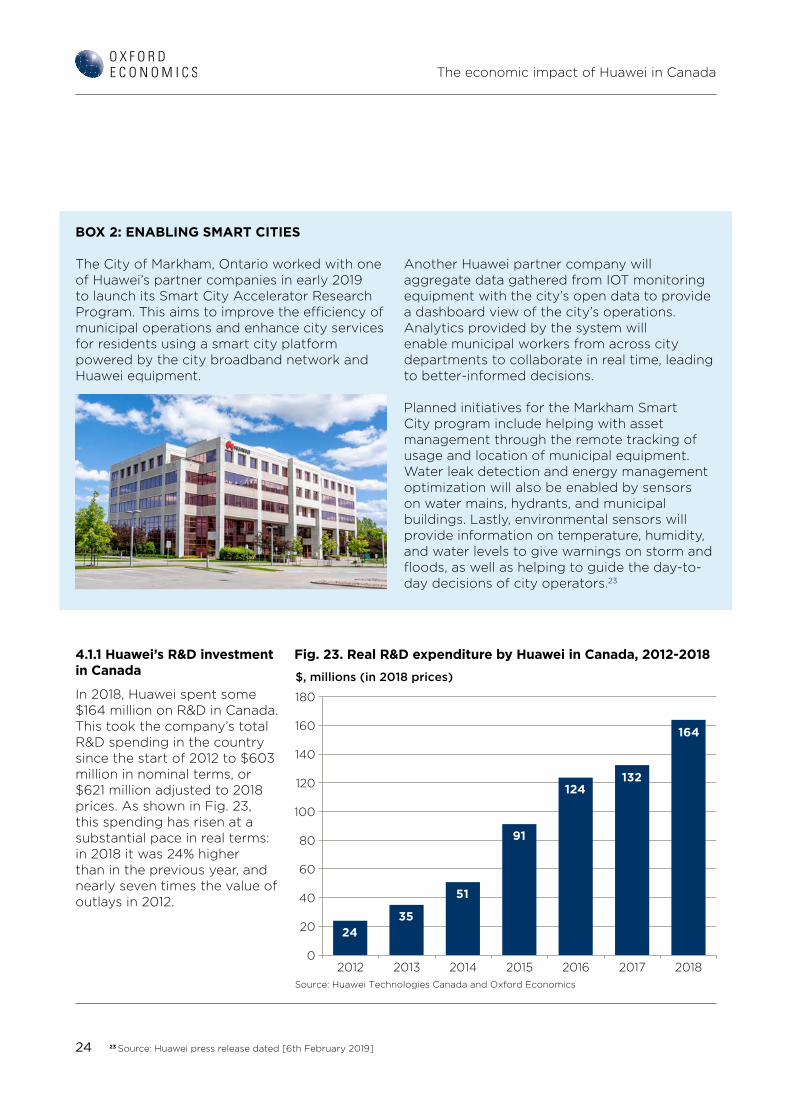
4.1.1 Huawei’s R&D investment in Canada
In 2018, Huawei spent some $164 million on R&D in Canada. This took the company’s total R&D spending in the country since the start of 2012 to $603 million in nominal terms, or $621 million adjusted to 2018 prices. As shown in Fig. 23, this spending has risen at a substantial pace in real terms: in 2018 it was 24% higher than in the previous year, and nearly seven times the value of outlays in 2012.
Fig. 23. Real R&D expenditure by Huawei in Canada, 2012-2018
$, millions (in 2018 prices)
2012 201520142013 2016 2017 20180
Source: Huawei Technologies Canada and Oxford Economics
60
40
20
80
100
120
140
160
180
2435
51
91
124132
164

25
The economic impact of Huawei in Canada
In 2015 (the latest year for which comparator data were available), Huawei Canada’s R&D spending was equivalent to 54% of its direct contribution to Canadian GDP. In comparison, R&D spending in the communications manufacturing sector that year was equivalent to 22% of its GDP contribution,24
while R&D spending in the telecommunications sector and the broader information and communication sector (which includes telecommunications) was equivalent to 1% and 7% of their respective GDP contributions.
Huawei Canada has maintained its high levels of R&D spending as a percentage of GDP since 2015. In 2018, the figure was in line with the value in 2015, although it had risen above 60% in 2016 and 2017.
The number of Huawei employees in Canada who specialise in R&D activity grew from 140 in 2012 to 540 in 2018 (see Fig. 25). This means R&D staff accounted for 56% of Huawei’s Canada-based employees in 2018, up from 29% six years earlier.
24 Data on comparator industry R&D was sourced from the OECD’s Analytical Business Enterprise R&D database: OECD, “ANBERD (Analytical Business Enterprise R&D) database,” <https://stats.oecd.org/Index.aspx?DataSetCode=ANBERD_REV4> [accessed August 2019]
Fig. 25. Huawei Canada’s employees by function, 2012-2018
Fig. 24. R&D as a percentage of GDP contributions of Huawei Canada and comparator Canadian industries, 2015
Source: Huawei Technologies Canada, Supply and Use tables 2015, Statistics Canda, OECD and Oxford Economics
0% 60%50%40%30%20%10%
Huawei Canada
Telecommunications
Communicationsmanufacturing
Information andcommunication
54%
22%
7%
1%
Headcount
2012 20142013 2015 2016 2017 20180
R&D
Non-R&D
Source: Huawei Technologies Canadaand Oxford Economics
200
100
300
400
500
600
700
800
900
1,000
140 170260 300 360
420540
350 340
340370
390
420
430
490 510
590
670750
840
970
Totals may not sum due to rounding

26
The economic impact of Huawei in Canada
BOX 3: WINERIES, AGRICULTURE, AND THE INTERNET OF THINGS
25 Source: Huawei press release dated [11th September 2017]26 Source: Huawei press release dated [24th July 2019]
Huawei Canada has partnered with a telecoms company and an industrial internet of things (IOT) specialist to implement an IOT system at a vineyard in the Niagara Peninsula. The partnership, announced in late 2017, allows the winery to remotely monitor environmental variables such as temperature, humidity, air pressure, water, and light levels in real time on handheld or desktop devices.25
The system deploys wireless sensors that connect to the telecoms network (a low-power, wide area network designed for IOT applications), which the vineyard staff use to help prevent vine disease and improve the health of its plants—for example, by remotely activating fans when temperature levels change. Ultimately, this will help lower operating costs and increase yields.
In mid-2019, Huawei Canada and five partners signed a memorandum of understanding (MOU) to explore new, “smart agriculture” wireless technology applications. The MOU commits all parties to explore ways that 5G-enabled tools can transform the agriculture sector and strengthen economic performance. This is expected to focus on tools that respond to a changing climate—for example, better management and conservation of water, and real-time responses to incremental changes in the environment.26
4.1.2 Huawei’s research partnerships and collaborations
27 Huawei press release, “New Huawei and University of British Columbia Partnership Agreement to Advance Next Gen Communications,” 2017, <https://www.huawei.com/ca/press-events/news/ca-en/20171013ubc-announcement-draft>28 University of Toronto press release, “U of T, Huawei Extend Research Partnership,” 2018, <https://www.utoronto.ca/news/u-t-huawei-extend-research-partnership>29 University of Toronto student newspaper article, “U of T, Huawei Extend Multimillion-Dollar Research Partnership by Five Years,” 2018, <https://thevarsity.ca/2018/10/01/u-of-t-huawei-extend-multimillion-dollar-research-partnership-by-five-years/>
In total, Huawei Canada has invested around $50 million in Canadian university research in the past 10 years. The majority of this funding has been used to support graduate students: Huawei has supported more than 700 Master’s degree students and more than 350 PhD candidates, helping enable them to achieve their advanced degrees.
Huawei Canada and universities operate a shared intellectual property (IP) model, where IP is shared equally between the company and the institution.
Huawei has engaged and collaborated with 22 universities and research institutes on information and communications technology-related research projects in 2018—up from 10 in 2012.
Examples of these collaborative efforts include a three-year, $3 million agreement signed in 2017 between Huawei and the University of British Columbia’s Faculties of Applied Science and Science, to support research into advanced communications including 5G.27
In 2018, the University of Toronto and Huawei agreed to extend an existing research partnership for a further five years.28 The company has already provided more than $3.5 million in funding to dozens of research projects at the university.29

27
The economic impact of Huawei in Canada
30 Huawei press release, “CENGN Welcomes Huawei as Newest member of Growing Consortium,” 2012, <https://www.huawei.com/ca/press-events/news/ca-en/20171201cengn-welcomes-huawei-as-newest-member-of-growing-consortium>
Huawei Canada has also had the opportunity to work with SMEs and start-ups on issues related to 5G deployment since joining Canada’s Centre of Excellence in Next Generation Networks (CENGN) in late 2017. CENGN is a consortium of experts from industry and academia, plus research leaders, that is focused on commercialising next generation communications solutions. It is based in Kanata, Ontario, alongside Huawei’s Canada Research Centre.30
Fig. 26. Annual number of universities and research institutes with which Huawei Canada collaborated, 2012-2018
Number of research institute collaborations
2012 201520142013 2016 2017 20180
Source: Huawei Technologies Canada and Oxford Economics
5
10
15
20
25
2435
51
91
124132
164
10
1716
17
20
17
22

28
The economic impact of Huawei in Canada
BOX 4: CONNECTED CAR TECHNOLOGY
31 Intel press release, “Data is the New Oil in the Future of Automated Driving,” 2016, <https://newsroom.intel.com/editorials/krzanich-the-future-of-automated-driving/#gs.5q1n2a>32 Huawei press release, “Huawei Canada Demonstrates Connected Car Technology in Toronto,” 2019, <https://www.huawei.com/ca/press-events/news/ca-en/huawei-canada-demonstrates-connected-car-technology-in-toronto>
Huawei is a founding member of the 5G Automobile Association (5GAA), a global organization of companies from the automotive, technology, and telecommunications industries. According to Huawei Canada’s Chief Technology Officer, Robert Backhouse: “The future of connected cars requires the strength and dependability of 5G wireless networks.” Some estimates suggest a connected car will generate as much as 4,000 gigabytes of data every day.31
Huawei is working to define the cellular “vehicle-to-everything” standards that will help enable these connected cars to operate.
In August 2019, Huawei and other 5GAA members participated in three 5G-enabled, proof-of-concept live demonstrations which
showcased the practical applications of ultra-fast 5G technology. These included:
• remote vehicle piloting over a cellular network, demonstrated using vehicle-to-network “Tele-Operated Driving” technologies;
• high definition mapping, wherein a 3D map was downloaded over a cellular network to highlight the real-time navigation requirements of connected/autonomous cars; and
• safety features, including how real-time detection over a cellular network allows for the monitoring and protection of vulnerable road users such as pedestrians and cyclists.32
29
The economic impact of Huawei in Canada
4.2 HUAWEI’S CONTRIBUTION TO CANADA’S ICT SKILLS BASE
33 Huawei press release, “Huawei Canada Helping Bring High-Speed Wireless to 70 More Remote Communities,” 2019, <https://www.huawei.com/ca/press-events/news/ca-en/huawei-canada-helping-bring-high-speed-wireless> 34 World Bank DataBank, “Population Density,” 2019, <https://data.worldbank.org/indicator/EN.POP.DNST> [Accessed: September 2019]35 Statistics Canada, “Annual Demographic Estimates – Subprovincial Areas,” 2017, <https://www150.statcan.gc.ca/n1/pub/91-214-x/2018000/section01-eng.htm> [Accessed: September 2019]36 Ofcom, “The Economic Impact of Broadband,” 2018, <https://www150.statcan.gc.ca/n1/pub/91-214-x/2018000/section01-eng.htm>37 Federation of Canadian Municipalities, “Rural Challenges, National Opportunity,” 2018, <https://fcm.ca/sites/default/files/documents/resources/report/rural-challenges-national-opportunities.pdf>
In mid-2019, Huawei Canada announced that by 2020, it will provide ICT training to more than 1,000 Canadians as part of a broader global “Information and Communications Talent Development Program”.
As part of this initiative, Huawei Canada will work with partner organizations to engage post-secondary technology instructors in customised training schemes, bringing world-class technology to Canada via the “Train the Trainers” program, which may include an opportunity to travel to visit Huawei facilities in China.33
Huawei partnered with Seneca College to launch the first Huawei Authorized Learning Partner (HALP) program in Canada, delivering industry-leading training in Huawei Enterprise products and solutions through a leading academic institution.
Huawei also runs an initiative called “Seeds for the Future”, a work-study program that offers undergraduate students the opportunity to travel to China for a two-week period.
During the first week, participants will stay in Beijing for an introduction to Chinese language and culture. In week two, the students stay in Shenzhen and work with the Huawei team at the global headquarters, learning about Huawei’s international culture and strategy, as well as receiving technical training from Huawei staff.
Since 2015, Huawei has offered the Seeds for the Future program to third- and fourth-year engineering students in Canadian universities. To date, 87 students have participated in the program.
4.3 ENHANCING CANADA’S PRODUCTIVITY THROUGH DIGITAL CONNECTIVITY
Canada has one of the lowest population densities in the world,34 with approximately 30% of the population living outside of metropolitan areas.35 This creates challenges for developing comprehensive, modern telecoms networks and infrastructure.
Ofcom, the UK telecoms regulator, has highlighted the strong link between broadband connectivity and
economic development in OECD countries. Research published by Ofcom found that an increase in broadband adoption over the 15 year period studied (2002-2016) led to an increase in GDP of 0.3% per annum on average across the 35 OECD countries.36 With non-metropolitan areas contributing 27% of Canada’s GDP in 2016 across a wide range of industries,37 providing
access to high-speed fixed and wireless internet in all areas of the country is vital for maintaining its growth prospects. Internet access is also important for households with regard to the provision of public services and public safety information, and participation in the democratic process.

30
The economic impact of Huawei in Canada
A study by Opensignal found that in Q1 2019, Canada had the third-fastest mobile “download speed experience” in the world, averaging 42 megabits per second (Mbps).38 Separate data published by the Canadian Radio-television and Telecommunications Commission (CRTC), showed that 4G mobile services were available to 99% of Canadians at the end of 2017.39
38 Opensignal, “The State of Mobile Network Experience,” 2019, <https://www.opensignal.com/sites/opensignal-com/files/data/reports/global/data-2019-05/the_state_of_mobile_experience_may_2019_0.pdf>. Download Speed Experience shows the average download speed experienced by Opensignal users across an operator’s 3G and 4G networks. It factors in 3G and 4G download speeds along with the availability of each technology.39 Figure 1.11, Canadian Radio-television and Telecommunications Commission, “Communications Monitoring Report,” 2019, <https://crtc.gc.ca/pubs/cmr2019-en.pdf>. Figure cited is the availability of the LTE (Long-Term Evolution) network standard.40 Canadian Radio-television and Telecommunications Commission, “Communications Monitoring Report,” 2018, <https://crtc.gc.ca/pubs/cmr2018-en.pdf>41 Huawei, “Connecting Canada’s North,” 2019, <https://www.huawei.com/ca/about-huawei/corporate-citizenship/connecting-canadas-north?ic_medium=direct&ic_source=shorturl>
However, connectivity challenges remain in many of Canada’s rural areas. In particular, the same CRTC dataset showed that access to 4G is lower among people in rural communities, at 96% at the end of 2017. Further, only 39% of rural households in 2017 were able to access home broadband services with download speeds of 50Mbps or more (CRTC’s new “universal service objective” target speed). In Yukon and the Northwest Territories, no households had access to these services—in contrast to the 88% access rate across Canada’s small population centres, and “near ubiquitous availability” in its medium and large centres.40
To tackle these rural connectivity challenges, the federal government has created a new Minister of Rural Economic Development, appointing Bernadette Jordan in early 2019. In June 2019, the Minister unveiled a new federal economic development strategy for rural Canada, which aims to remove challenges such as access to high-speed broadband and enable all communities to access the digital and global economies.
To support these objectives, in July 2019 Huawei Canada announced it would partner with two companies to help connect more than 70 rural and remote communities by 2025. These include 20 in the Canadian Arctic and 50 in Northeastern Quebec, as well as others planned for unconnected areas of Newfoundland and Labrador. Huawei Canada also aims to help operators with the challenge of connecting remote communities by, for example, ensuring that wireless network equipment will function in the very cold temperatures experienced by Northern Canada.41
These announcements follow more than a decade of Huawei Canada working with major Canadian carriers and regional operators to build their wired and wireless networks. This includes working with partners on their 4G and 4.5G mobile networks; fixed wireless networks; and fibre-to-the-home broadband access network.
70Number of remote and rural Canadian communities to be connected by 2025 thanks to a new Huawei collaboration.

31
The economic impact of Huawei in Canada
BOX 5: CONNECTING RURAL COMMUNITIES
42 Huawei, “Bridging the Digital Divide,” 2019, <https://www.huawei.com/ca/about-huawei/corporate-citizenship/connecting-canadas-north?ic_medium=direct&ic_source=shorturl>43 Source: Huawei press release dated [1st February 2019]
Huawei has been helping to connect rural committees in Canada to telecommunication networks since it first established a Canadian presence in 2008. In early 2016, the company and its partners in Saskatchewan initiated cellular service to the remote First Nations communities of Black Lake and Stony Rapids—the completion of a three-year development project that also saw services provided to the Northern Saskatchewan communities of Wollaston Lake and Fond du Lac.
The first of the cellular sites supporting these new services was brought online in July 2014, to coincide with the popular Back to Batoche festival—the largest cultural event for the Métis Nation in North America. This new service supports the communities of St. Isidore-de-Bellevue First Nation, One Arrow First Nation, Batoche, and surrounding residents, bringing significant economic benefits to the region.42
In February 2019, one of Huawei Canada’s partners announced it would conduct internet service trials in Lac La Hache in British Columbia, using Huawei’s “Massive MIMO” rural broadband system. Massive MIMO is a new technology, part-developed by Huawei’s Canada Research Team over the last decade, that will deliver internet speeds of up to 100Mbps to rural residents. One Massive MIMO antenna can replace multiple antennas that use alternative technologies, helping to reduce the costs for internet service providers deploying services in remote communities.43
32
The economic impact of Huawei in Canada
5. CONCLUSION
This study explores the impact that Huawei has had on the economy of Canada, and also its provinces and territories, between 2012 and 2018. Huawei is firmly established in Canada: the company operates across eight locations, with its national headquarters in Markham, and further sites in Ottawa, Waterloo, Calgary, Edmonton, Vancouver, Montreal, and Quebec City.
The report details the contribution that Huawei’s expenditure has made to the Canadian economy through (i) its operational spending; (ii) its procurement and capital purchases from Canadian suppliers; and (iii) the boost its wage payments bring to the consumer economy.
Our analysis shows that, in 2018, Huawei sustained an overall contribution to Canadian GDP of $690 million. It also supported some 4,760 jobs and $204 million in tax revenues that year.
We find that Huawei’s economic impact within Canada is concentrated in Ontario, reflecting the location of the company’s head office and main employment sites. Specifically, Huawei supported a $592 million contribution to GDP and 3,830 jobs in the province in 2018.
In addition, the company supports GDP contributions of between $60 million and $11 million in the economies of Quebec, British Columbia and Alberta.
Huawei also has a positive impact on Canada’s long-term productive potential through its R&D activity and skills training, and by enhancing the country’s connectivity. In 2018, the company invested $164 million in R&D in Canada, including collaborating with 22 universities and research institutes. Huawei also aims to train over 1,000 Canadians in ICT skills, as well as providing engineering students with the opportunity to visit Huawei’s headquarters in China to receive training.
Furthermore, Huawei is supporting the Canadian government’s ambitions to provide greater broadband connectivity across the country, collaborating with partner operators to connect remote communities, and working to protect network equipment from extreme temperatures.

33
The economic impact of Huawei in Canada
APPENDIX
METHODOLOGY FOR ESTIMATING DIRECT IMPACTS
The direct impacts of Huawei Canada—including gross value added, jobs created, and taxes paid by the businesses and employees—were estimated from information provided by the company. As noted in Chapter 2, the direct GDP contribution was estimated under the income approach as the sum of EBITDA and Compensation of Employees.
44 Statistics Canada, “Supply and Use Tables,” 2015 <https://www150.statcan.gc.ca/n1/pub/15-602-x/15-602-x2017001-eng.htm> [accessed 22 July 2019]45 In consultation with Huawei, we have mapped each of Huawei’s supplier categories to the sector breakdown contained in the IO model.46 Statistics Canada, “Gross domestic product (GDP) at basic prices, by industry, provinces and territories,” 1997 - 2018 <https://www150.statcan.gc.ca/t1/tbl1/en/tv.action?pid=3610048701> [accessed August 2019]47 Statistics Canada, “Labour statistics consistent with the System of National Accounts (SNA), by job category and industry,” 1997 - 2018 <https://www150.statcan.gc.ca/t1/tbl1/en/tv.action?pid=3610048901> [accessed August 2019]
METHODOLOGY FOR ESTIMATING INDIRECT AND INDUCED IMPACTS
To estimate Huawei Canada’s indirect and induced impacts, Oxford Economics used an input-output model of the Canadian economy, using the latest official supply and use tables for Canada and its provinces and territories published by Statistics Canada.44
An input-output model gives a snapshot of an economy at any point in time. The model shows the major spending flows from “final demand” (i.e. consumer spending, government spending investment and exports to the rest of the world); intermediate spending patterns (i.e. what each sector buys from every other sector—the supply chain); how much of that spending stays within the economy; and the distribution of income between employment income and other income (mainly profits). In essence an input-output model is a table which shows who buys what from whom in the economy.
The total value of the procurement from Canadian suppliers by Huawei’s operations was provided by the company. Each year’s data were fed into the model to arrive at total sales throughout the Canadian supply chain, by sector of supplier for that year.45 The indirect gross value added contribution to GDP was worked out from there, using gross value added-to-turnover ratios for each industry for that year. The indirect employment impact was calculated using productivity estimates for each industry for that year. Gross value added-to-turnover ratios were developed using the supply and use tables; productivity estimates were developed using industry GDP and employment data from Statistics Canada.46,47

34
The economic impact of Huawei in Canada
The induced sales figures for each year were developed in two stages. The impact relating to spending by employees in Huawei Canada’s supply chain was worked out alongside the indirect impact, taking Huawei Canada’s procurement as the starting point. This calculation used an extended part of the input-output model, which takes into account the pattern of Canadian household consumption as well as intra-industry transactions. The impact relating to spending by Huawei Canada’s own employees was modelled separately, using estimates of their spending power—Huawei Canada’s wage bill net of employees’ tax and national insurances—as the starting point. The two estimates of induced sales, on an industry-by-industry basis, were added together and the induced value added and jobs impacts estimated from there.
48 Effective employee income tax rates were established using data on the household sector from Statistics Canada’s current account. These rates were compared to rates derived from Statistics Canada’s T1 Final Statistics (which presents data from individual income tax and benefit returns) and were found to be broadly comparable. Sources: Statistics Canada, “Household sector, current accounts, provincial and territorial, annual,” 2013 - 2017 <https://www150.statcan.gc.ca/t1/tbl1/en/tv.action?pid=3610022401> [accessed August 2019] and Statistics Canada, “T1 Final Statistics 2018 edition (for the 2016 tax year),” <https://www.canada.ca/en/revenue-agency/programs/about-canada-revenue-agency-cra/income-statistics-gst-hst-statistics/t1-final-statistics/2016-tax-year.html#_Tables_in_CSV_1> [accessed October 2019]
49 Statistics Canada, “T2 Corporate Statistics – 2019 Edition,” 2012-2016 tax years <https://open.canada.ca/data/en/dataset/767a00da-05e2-439e-bc16-4aa74dad3587> [accessed August 2019]
50 Statistics Canada, “Supply and Use Tables,” 2015 <https://www150.statcan.gc.ca/n1/pub/15-602-x/15-602-x2017001-eng.htm> [accessed 22 July 2019]
Finally, tax contributions were estimated taking into account sales, value added and employment by industrial sector, and applying various appropriate tax-to-expenditure and tax-to-income ratios, sourced from supply and uses tables and Statistics Canada.48,49
Indirect and induced impacts at the province and territory level were estimated using province and territory-level input-output models developed by Oxford Economics, based on the latest supply and use tables for Canada’s provinces and territories published by Statistics Canada.50 These input-output models work in the same way as the national-level input-output model described above. However, they also incorporate inter-province trade flows, which were estimated using inter-province import flow estimates from the sub-national supply and use tables.
IMPLIED MULTIPLIERS
By comparing the direct effect with the indirect and induced effects in 2018, we can say that for every $1 million Huawei contributes to GDP itself, it supported another $1.3 million elsewhere in the Canadian economy in 2018. This means that Huawei’s GDP multiplier was 2.3 in that year. The multiplier is calculated as: (Direct GDP + Indirect GDP + Induced GDP) / Direct GDP.
In 2018, for every direct job supported by Huawei, another 3.9 were supported elsewhere in the Canadian economy. This means that Huawei’s employment multiplier was 4.9 in 2018. The employment multiplier is larger than the GDP multiplier because of Huawei’s relatively high productivity levels compared to the average productivity of employees supported in the supply chain and induced impacts i.e. $1 of direct output supports fewer jobs than $1 of indirect or induced output.

35
The economic impact of Huawei in Canada
OXFORD ECONOMICSOxford Economics was founded in 1981 as a commercial venture with Oxford University’s business college to provide economic forecasting and modelling to UK companies and financial institutions expanding abroad. Since then, we have become one of the world’s foremost independent global advisory firms, providing reports, forecasts and analytical tools on more than 200 countries, 250 industrial sectors, and 7,000 cities and regions. Our best-in-class global economic and industry models and analytical tools give us an unparalleled ability to forecast external market trends and assess their economic, social and business impact.
Headquartered in Oxford, England, with regional centres in New York, London, Frankfurt, and Singapore, Oxford Economics has offices across the globe in Belfast, Boston, Cape Town, Chicago, Dubai, Hong Kong, Los Angeles, Melbourne, Mexico City, Milan, Paris, Philadelphia, Stockholm, Sydney, Tokyo, and Toronto. We employ 400 full-time staff, including more than 250 professional economists, industry experts, and business editors—one of the largest teams of macroeconomists and thought leadership specialists. Our global team is highly skilled in a full range of research techniques and thought leadership capabilities from econometric modelling, scenario framing, and economic impact analysis to market surveys, case studies, expert panels, and web analytics.
Oxford Economics is a key adviser to corporate, financial and government decision-makers and thought leaders. Our worldwide client base now comprises over 1,500 international organizations, including leading multinational companies and financial institutions; key government bodies and trade associations; and top universities, consultancies, and think tanks.
November 2019
All data shown in tables and charts are Oxford Economics’ own data, except where otherwise stated and cited in footnotes, and are copyright © Oxford Economics Ltd.
This report is confidential to Huawei Technologies Canada and may not be published or distributed without their prior written permission.
The modelling and results presented here are based on information provided by third parties, upon which Oxford Economics has relied in producing its report and forecasts in good faith. Any subsequent revision or update of those data will affect the assessments and projections shown.
To discuss the report further please contact:
Matthew Dass: [email protected]
Oxford Economics 4 Millbank, Westminster, London, SW1P 3JA, UK
Photo CreditsCover: Ronnie Chua, Shutterstock.com
Inside cover: P. Leclerc, Shutterstock.com
Page 6: Bist, Shutterstock.com
Page 15: Image Source, Alamy Stock Photo
Page 24: JHVEPhoto, iStockphoto.com
Page 26: Daniel Krylov, Shutterstock.com
Page 27: Huawei
Page 28: B.Zhou, Shutterstock.com
Page 31: Earl D. Walker, Shutterstock.com
Page 32: Maridavr, Shutterstock.com

Global headquartersOxford Economics Ltd Abbey House 121 St Aldates Oxford, OX1 1HBUKTel: +44 (0)1865 268900
London4 MillbankLondon, SW1P 3JA UKTel: +44 (0)203 910 8000
FrankfurtMarienstr. 15 60329 Frankfurt am Main GermanyTel: +49 69 96 758 658
New York5 Hanover Square, 8th Floor New York, NY 10004USATel: +1 (646) 786 1879
Singapore6 Battery Road#38-05Singapore 049909Tel: +65 6850 0110
Europe, Middle Eastand Africa
Oxford
LondonBelfast
FrankfurtParisMilan
StockholmCape Town
Dubai
Americas
New YorkPhiladelphia
BostonChicago
Los Angeles Toronto
Mexico City
Asia Pacific
SingaporeHong Kong
TokyoSydney
Melbourne
Email:[email protected]
Website:www.oxfordeconomics.com
Further contact details:www.oxfordeconomics.com/about-us/worldwide-offices