the economic impact of tourism in new york economic impact of tourism in new york . 2 key themes in...
TRANSCRIPT

2012 Calendar Year
The Economic Impact of Tourism in New York
2
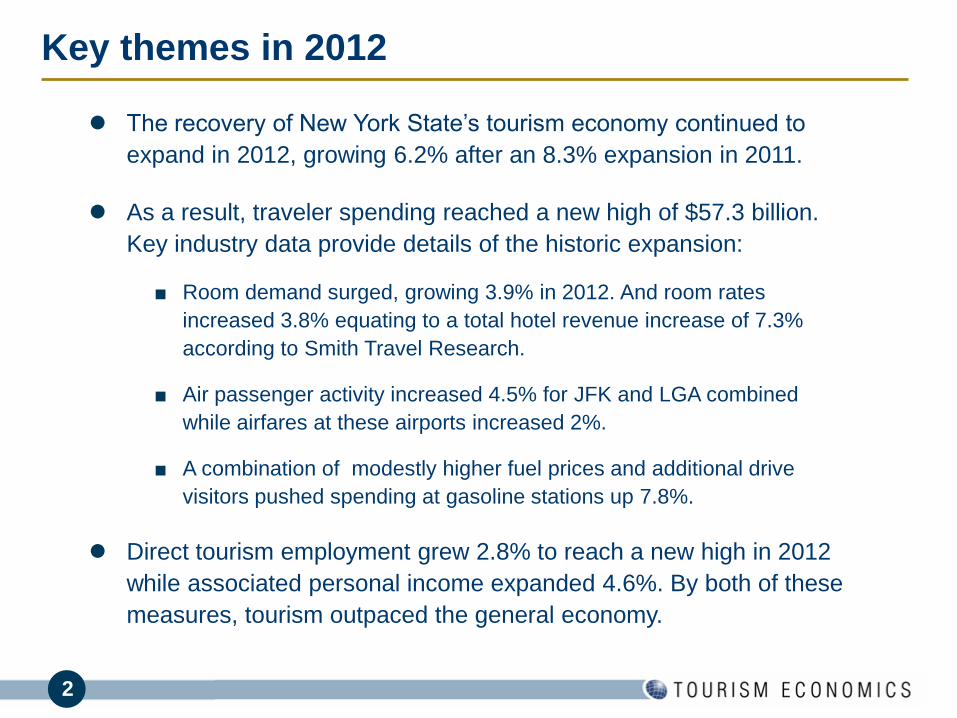
Key themes in 2012
The recovery of New York State’s tourism economy continued to
expand in 2012, growing 6.2% after an 8.3% expansion in 2011.
As a result, traveler spending reached a new high of $57.3 billion.
Key industry data provide details of the historic expansion:
■ Room demand surged, growing 3.9% in 2012. And room rates
increased 3.8% equating to a total hotel revenue increase of 7.3%
according to Smith Travel Research.
■ Air passenger activity increased 4.5% for JFK and LGA combined
while airfares at these airports increased 2%.
■ A combination of modestly higher fuel prices and additional drive
visitors pushed spending at gasoline stations up 7.8%.
Direct tourism employment grew 2.8% to reach a new high in 2012
while associated personal income expanded 4.6%. By both of these
measures, tourism outpaced the general economy.
3
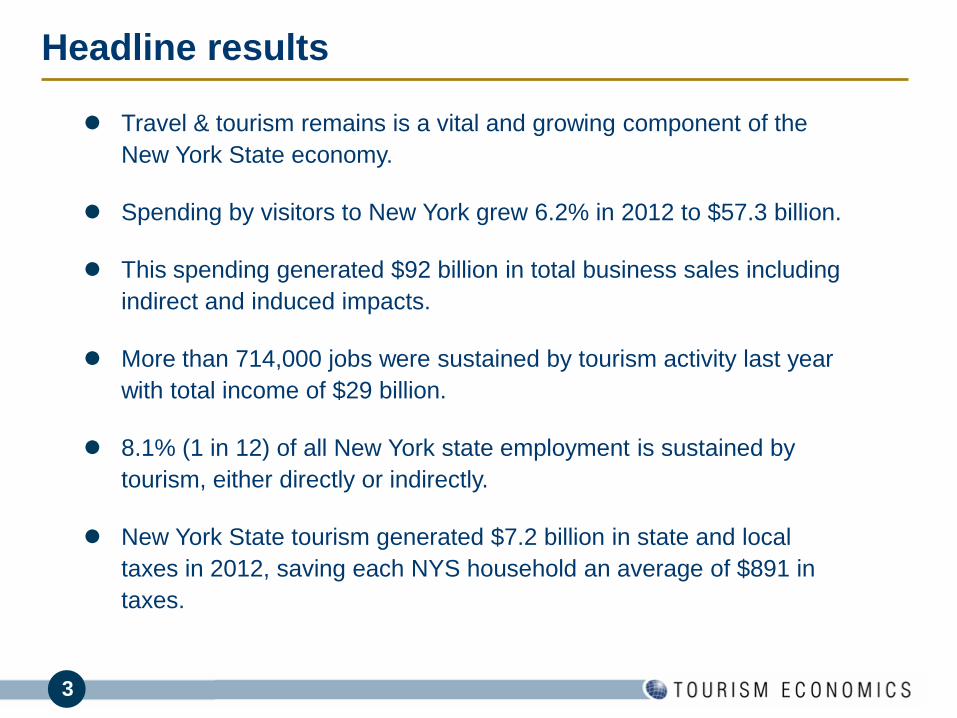
Headline results
Travel & tourism remains is a vital and growing component of the
New York State economy.
Spending by visitors to New York grew 6.2% in 2012 to $57.3 billion.
This spending generated $92 billion in total business sales including
indirect and induced impacts.
More than 714,000 jobs were sustained by tourism activity last year
with total income of $29 billion.
8.1% (1 in 12) of all New York state employment is sustained by
tourism, either directly or indirectly.
New York State tourism generated $7.2 billion in state and local
taxes in 2012, saving each NYS household an average of $891 in
taxes.
4
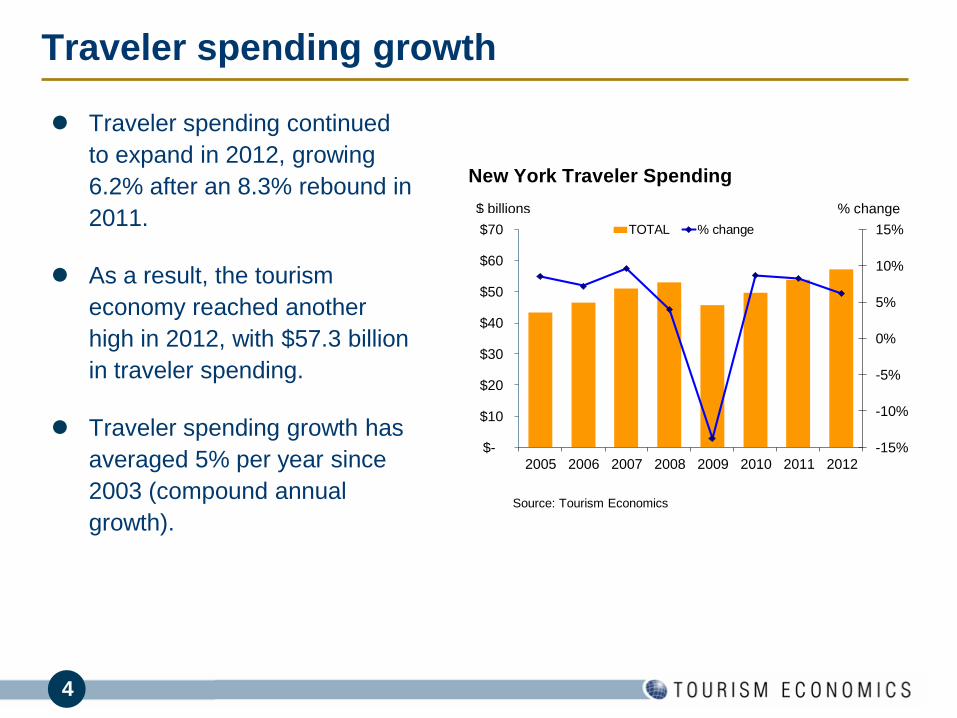
Traveler spending growth
Traveler spending continued
to expand in 2012, growing
6.2% after an 8.3% rebound in
2011.
As a result, the tourism
economy reached another
high in 2012, with $57.3 billion
in traveler spending.
Traveler spending growth has
averaged 5% per year since
2003 (compound annual
growth).
-15%
-10%
-5%
0%
5%
10%
15%
$-
$10
$20
$30
$40
$50
$60
$70
2005 2006 2007 2008 2009 2010 2011 2012
TOTAL % change
T
A
New York Traveler Spending
$ billions
Source: Tourism Economics
% change
5
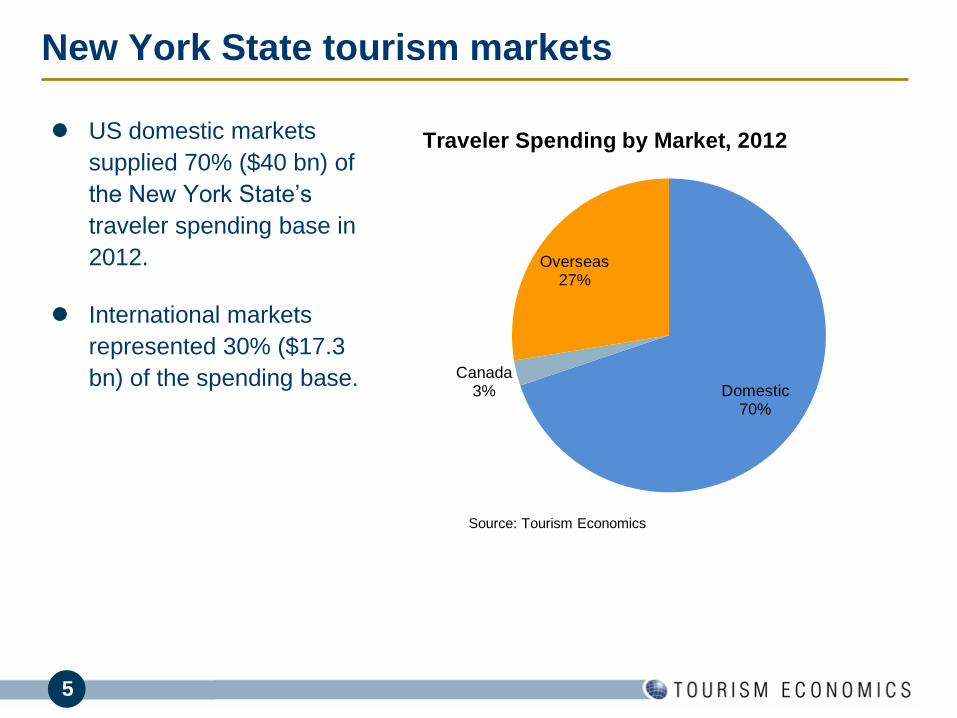
New York State tourism markets
US domestic markets
supplied 70% ($40 bn) of
the New York State’s
traveler spending base in
2012.
International markets
represented 30% ($17.3
bn) of the spending base.
Domestic70%
Canada3%
Overseas27%
Traveler Spending by Market, 2012
Source: Tourism Economics
6
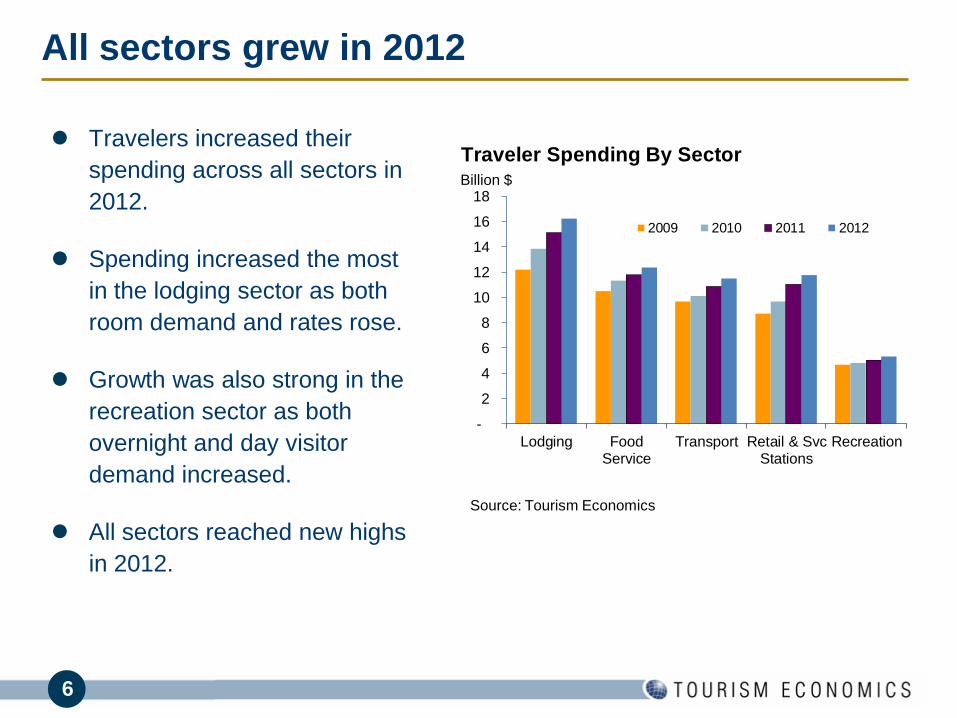
All sectors grew in 2012
Travelers increased their
spending across all sectors in
2012.
Spending increased the most
in the lodging sector as both
room demand and rates rose.
Growth was also strong in the
recreation sector as both
overnight and day visitor
demand increased.
All sectors reached new highs
in 2012.
-
2
4
6
8
10
12
14
16
18
Lodging FoodService
Transport Retail & SvcStations
Recreation
2009 2010 2011 2012
Traveler Spending By SectorBillion $
Source: Tourism Economics
7
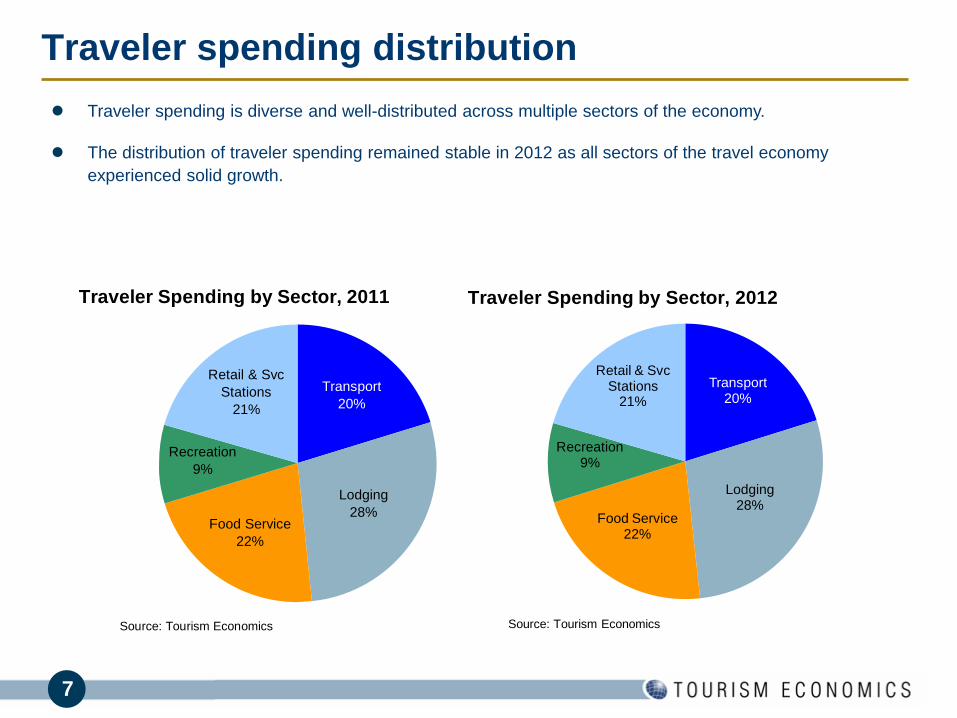
Traveler spending distribution
Traveler spending is diverse and well-distributed across multiple sectors of the economy.
The distribution of traveler spending remained stable in 2012 as all sectors of the travel economy
experienced solid growth.
Transport
20%
Recreation
9%
Food Service
22%
Lodging
28%
Retail & Svc
Stations
21%
Traveler Spending by Sector, 2011
Source: Tourism Economics
Transport20%
Lodging28%
Food Service22%
Recreation9%
Retail & Svc Stations
21%
Traveler Spending by Sector, 2012
Source: Tourism Economics
8
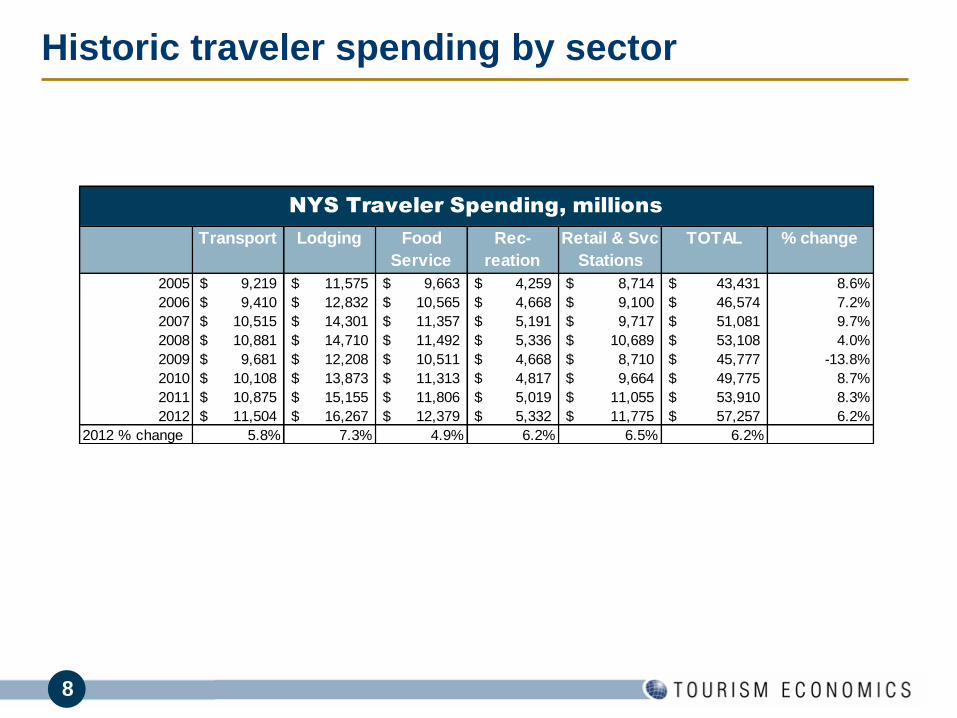
Historic traveler spending by sector
Transport Lodging Food
Service
Rec-
reation
Retail & Svc
Stations
TOTAL % change
2005 9,219$ 11,575$ 9,663$ 4,259$ 8,714$ 43,431$ 8.6%
2006 9,410$ 12,832$ 10,565$ 4,668$ 9,100$ 46,574$ 7.2%
2007 10,515$ 14,301$ 11,357$ 5,191$ 9,717$ 51,081$ 9.7%
2008 10,881$ 14,710$ 11,492$ 5,336$ 10,689$ 53,108$ 4.0%
2009 9,681$ 12,208$ 10,511$ 4,668$ 8,710$ 45,777$ -13.8%
2010 10,108$ 13,873$ 11,313$ 4,817$ 9,664$ 49,775$ 8.7%
2011 10,875$ 15,155$ 11,806$ 5,019$ 11,055$ 53,910$ 8.3%
2012 11,504$ 16,267$ 12,379$ 5,332$ 11,775$ 57,257$ 6.2%
2012 % change 5.8% 7.3% 4.9% 6.2% 6.5% 6.2%
NYS Traveler Spending, millions
9
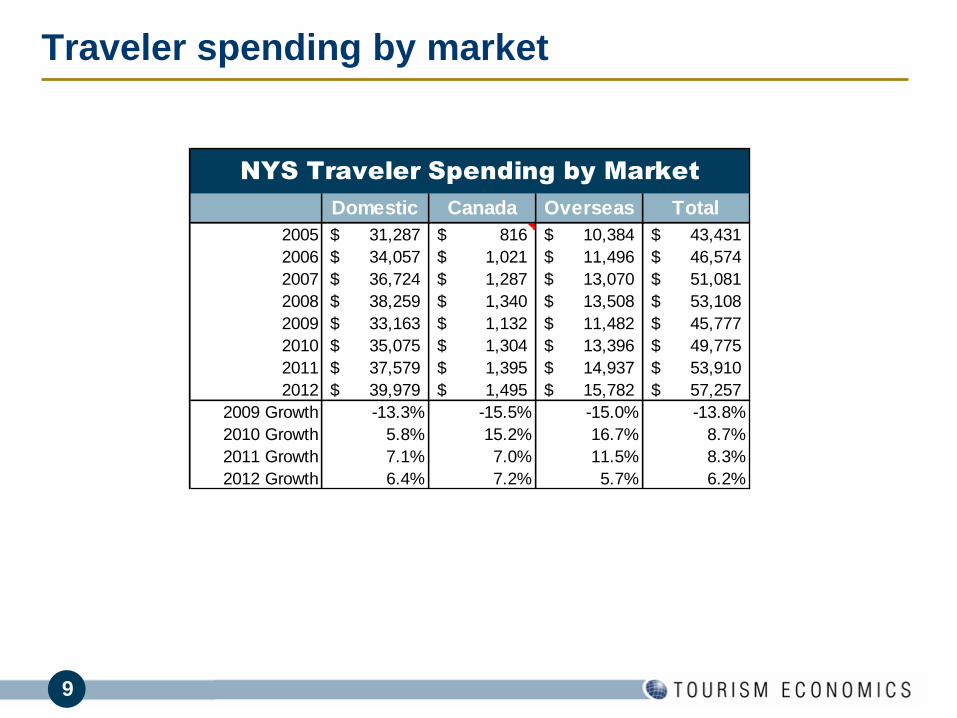
Traveler spending by market
Domestic Canada Overseas Total
2005 31,287$ 816$ 10,384$ 43,431$
2006 34,057$ 1,021$ 11,496$ 46,574$
2007 36,724$ 1,287$ 13,070$ 51,081$
2008 38,259$ 1,340$ 13,508$ 53,108$
2009 33,163$ 1,132$ 11,482$ 45,777$
2010 35,075$ 1,304$ 13,396$ 49,775$
2011 37,579$ 1,395$ 14,937$ 53,910$
2012 39,979$ 1,495$ 15,782$ 57,257$
2009 Growth -13.3% -15.5% -15.0% -13.8%
2010 Growth 5.8% 15.2% 16.7% 8.7%
2011 Growth 7.1% 7.0% 11.5% 8.3%
2012 Growth 6.4% 7.2% 5.7% 6.2%
NYS Traveler Spending by Market

10
How traveler spending generates impact
• Lastly, the induced impact is
generated when employees
whose incomes are
generated either directly or
indirectly by tourism, spend
those incomes in the city
economy.
• Travelers create direct economic value within a discreet group of sectors (e.g. recreation,
transportation). This supports a relative proportion of jobs, wages, taxes, and GDP within
each sector.
• Each directly affected sector also purchases goods and services as inputs (e.g. food
wholesalers, utilities) into production. These impacts are called indirect impacts.
11
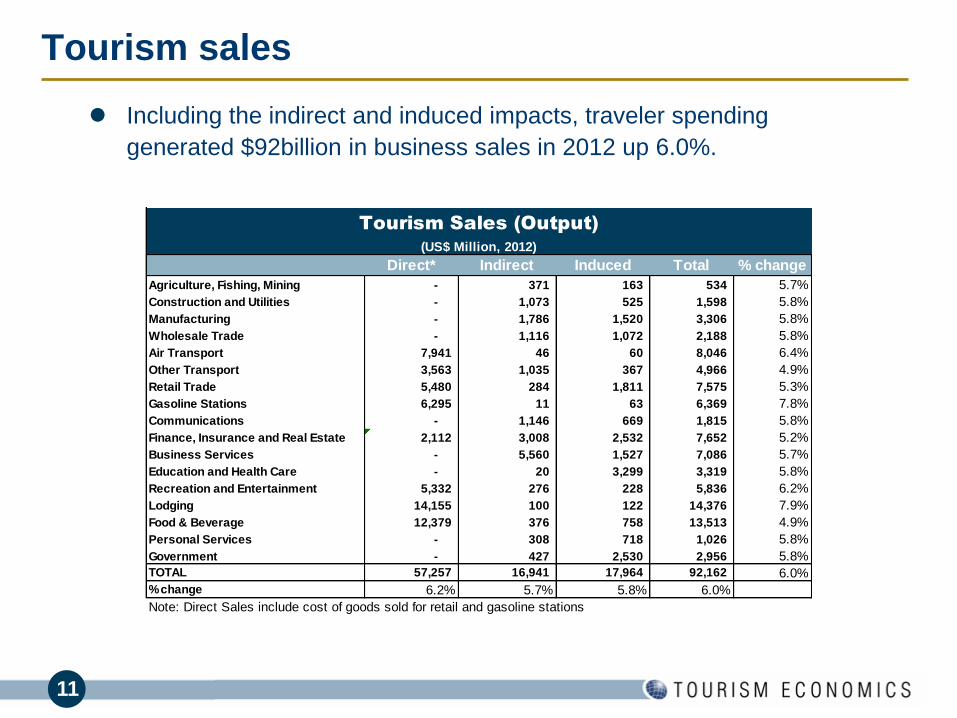
Tourism sales
Business Day
Including the indirect and induced impacts, traveler spending
generated $92billion in business sales in 2012 up 6.0%.
Direct* Indirect Induced Total % change
Agriculture, Fishing, Mining - 371 163 534 5.7%
Construction and Utilities - 1,073 525 1,598 5.8%
Manufacturing - 1,786 1,520 3,306 5.8%
Wholesale Trade - 1,116 1,072 2,188 5.8%
Air Transport 7,941 46 60 8,046 6.4%
Other Transport 3,563 1,035 367 4,966 4.9%
Retail Trade 5,480 284 1,811 7,575 5.3%
Gasoline Stations 6,295 11 63 6,369 7.8%
Communications - 1,146 669 1,815 5.8%
Finance, Insurance and Real Estate 2,112 3,008 2,532 7,652 5.2%
Business Services - 5,560 1,527 7,086 5.7%
Education and Health Care - 20 3,299 3,319 5.8%
Recreation and Entertainment 5,332 276 228 5,836 6.2%
Lodging 14,155 100 122 14,376 7.9%
Food & Beverage 12,379 376 758 13,513 4.9%
Personal Services - 308 718 1,026 5.8%
Government - 427 2,530 2,956 5.8%
TOTAL 57,257 16,941 17,964 92,162 6.0%
% change 6.2% 5.7% 5.8% 6.0%
Note: Direct Sales include cost of goods sold for retail and gasoline stations
Tourism Sales (Output)
(US$ Million, 2012)
12
0
2,000
4,000
6,000
8,000
10,000
12,000
14,000
Lo
dg
ing
Resta
ura
nts
Air
Tra
nsp
ort
FIR
E
Reta
il T
rd
Bu
sin
ess S
vc
Ga
s s
tatio
ns
Recre
atio
n
Oth
er
Tra
nsp
Ed
uc, H
ea
lth
Ma
nu
factu
rin
g
Go
ve
rnm
en
t
Wh
ole
sa
le T
rd
Induced
Indirect
Direct
$ million
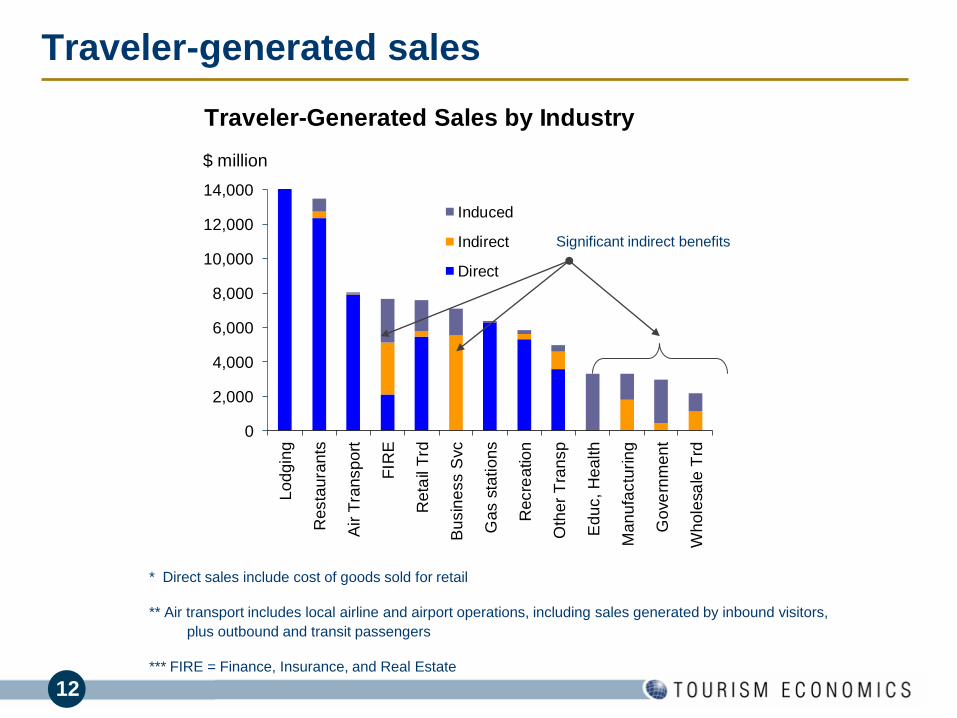
Traveler-Generated Sales by Industry
Traveler-generated sales
Business
* Direct sales include cost of goods sold for retail
** Air transport includes local airline and airport operations, including sales generated by inbound visitors,
plus outbound and transit passengers
*** FIRE = Finance, Insurance, and Real Estate
Significant indirect benefits
13
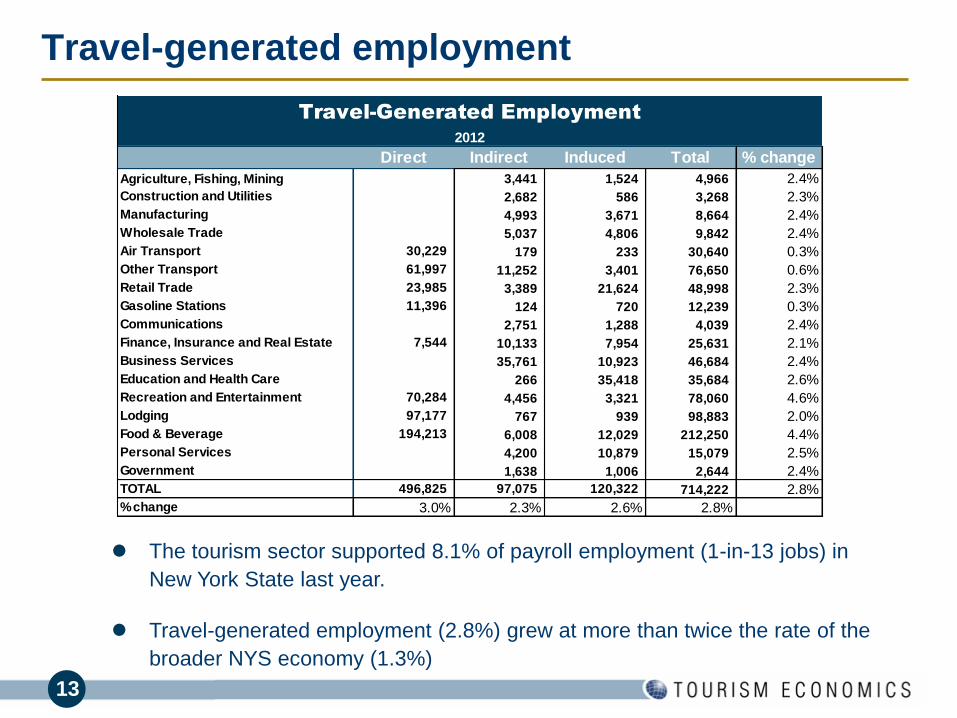
Travel-generated employment
Business Day
The tourism sector supported 8.1% of payroll employment (1-in-13 jobs) in
New York State last year.
Travel-generated employment (2.8%) grew at more than twice the rate of the
broader NYS economy (1.3%)
Direct Indirect Induced Total % change
Agriculture, Fishing, Mining 3,441 1,524 4,966 2.4%
Construction and Utilities 2,682 586 3,268 2.3%
Manufacturing 4,993 3,671 8,664 2.4%
Wholesale Trade 5,037 4,806 9,842 2.4%
Air Transport 30,229 179 233 30,640 0.3%
Other Transport 61,997 11,252 3,401 76,650 0.6%
Retail Trade 23,985 3,389 21,624 48,998 2.3%
Gasoline Stations 11,396 124 720 12,239 0.3%
Communications 2,751 1,288 4,039 2.4%
Finance, Insurance and Real Estate 7,544 10,133 7,954 25,631 2.1%
Business Services 35,761 10,923 46,684 2.4%
Education and Health Care 266 35,418 35,684 2.6%
Recreation and Entertainment 70,284 4,456 3,321 78,060 4.6%
Lodging 97,177 767 939 98,883 2.0%
Food & Beverage 194,213 6,008 12,029 212,250 4.4%
Personal Services 4,200 10,879 15,079 2.5%
Government 1,638 1,006 2,644 2.4%
TOTAL 496,825 97,075 120,322 714,222 2.8%
% change 3.0% 2.3% 2.6% 2.8%
Travel-Generated Employment
2012
14
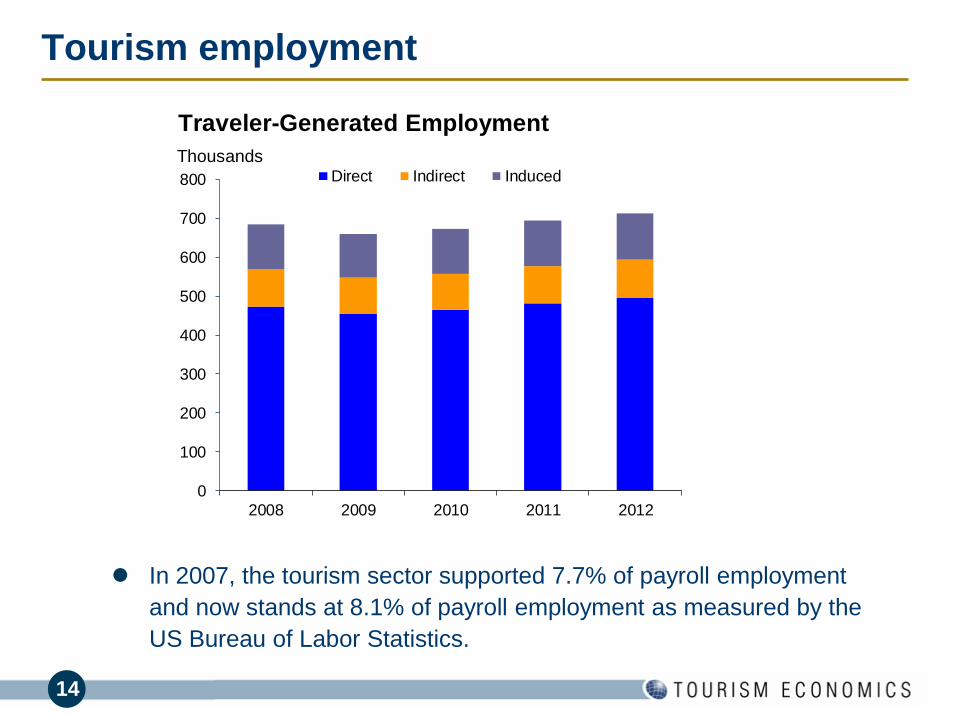
Tourism employment
Business Day
In 2007, the tourism sector supported 7.7% of payroll employment
and now stands at 8.1% of payroll employment as measured by the
US Bureau of Labor Statistics.
0
100
200
300
400
500
600
700
800
2008 2009 2010 2011 2012
Direct Indirect Induced
Thousands
Traveler-Generated Employment
15
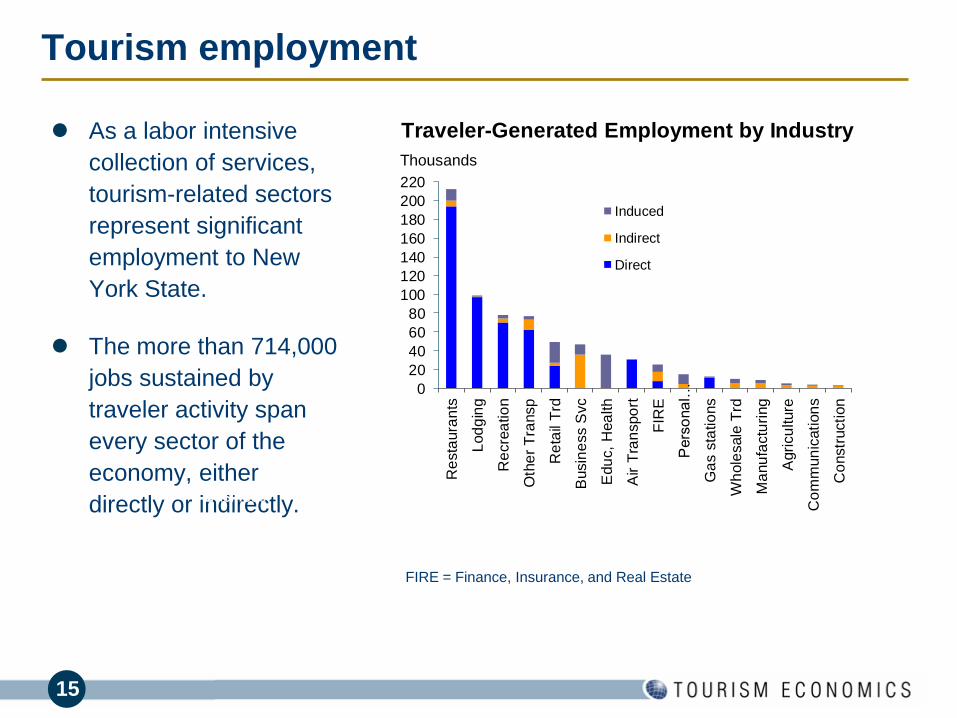
Tourism employment
As a labor intensive
collection of services,
tourism-related sectors
represent significant
employment to New
York State.
The more than 714,000
jobs sustained by
traveler activity span
every sector of the
economy, either
directly or indirectly. Business Day
FIRE = Finance, Insurance, and Real Estate
0
20
40
60
80
100
120
140
160
180
200
220
Re
sta
ura
nts
Lod
gin
g
Re
cre
atio
n
Oth
er
Tra
nsp
Re
tail
Trd
Busin
ess S
vc
Edu
c,
Hea
lth
Air T
ran
spo
rt
FIR
E
Pers
ona
l…
Ga
s s
tatio
ns
Wh
ole
sale
Trd
Ma
nu
factu
ring
Agri
cu
lture
Co
mm
un
ication
s
Co
nstr
uction
Induced
Indirect
Direct
Thousands
Traveler-Generated Employment by Industry
16
Tourism employment
Tourism-generated
employment has
contributed to the
economic recovery
of New York.
After growing 2.8%
in 2012 (including
direct, indirect, and
induced impacts),
tourism employment
reached a new high
of 714,222.
Business Day 0
100
200
300
400
500
600
700
800
2008 2009 2010 2011 2012
Direct Indirect Induced
Thousands
Traveler-Generated Employment
17
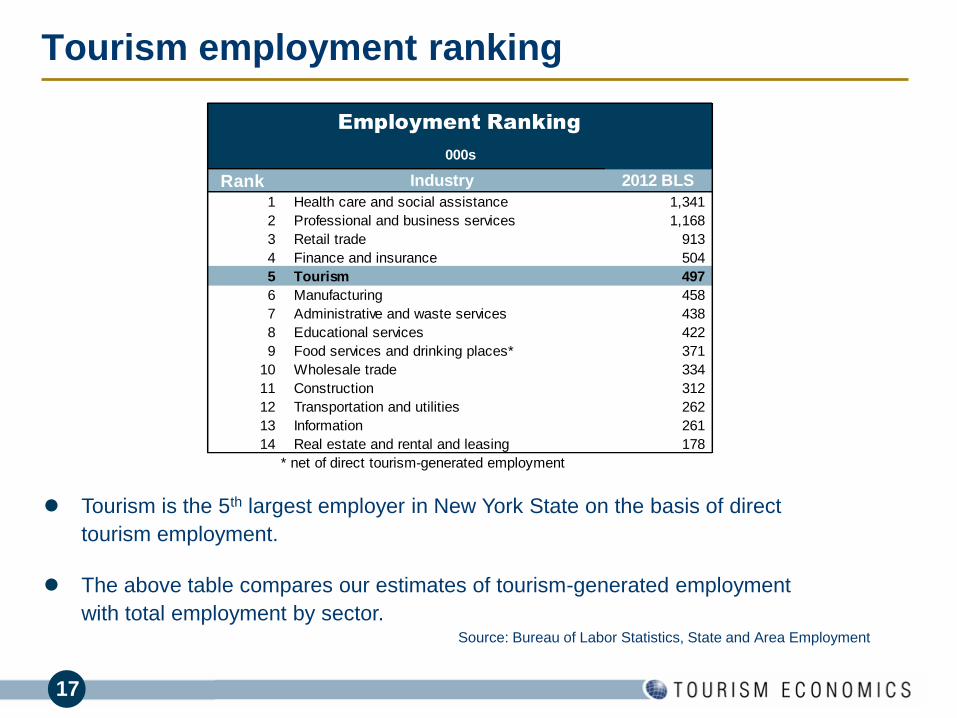
Tourism employment ranking
Business Day Tourism is the 5th largest employer in New York State on the basis of direct
tourism employment.
The above table compares our estimates of tourism-generated employment
with total employment by sector. Source: Bureau of Labor Statistics, State and Area Employment
Rank Industry 2012 BLS
1 Health care and social assistance 1,341
2 Professional and business services 1,168
3 Retail trade 913
4 Finance and insurance 504
5 Tourism 497
6 Manufacturing 458
7 Administrative and waste services 438
8 Educational services 422
9 Food services and drinking places* 371
10 Wholesale trade 334
11 Construction 312
12 Transportation and utilities 262
13 Information 261
14 Real estate and rental and leasing 178
* net of direct tourism-generated employment
Employment Ranking
000s
18
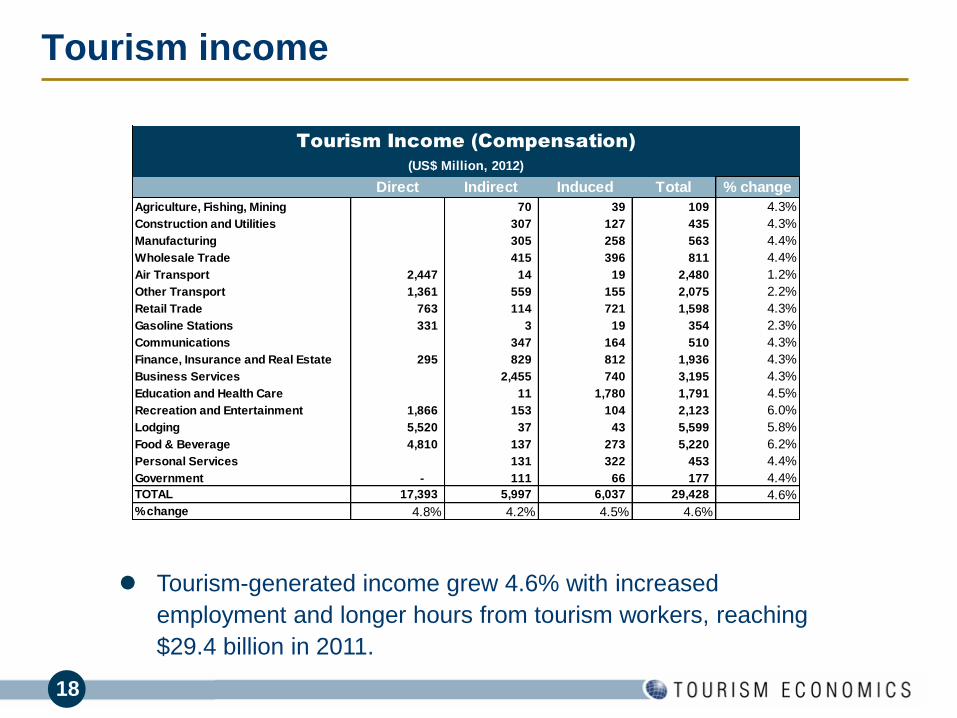
Tourism income
Business Day
Tourism-generated income grew 4.6% with increased
employment and longer hours from tourism workers, reaching
$29.4 billion in 2011.
Direct Indirect Induced Total % change
Agriculture, Fishing, Mining 70 39 109 4.3%
Construction and Utilities 307 127 435 4.3%
Manufacturing 305 258 563 4.4%
Wholesale Trade 415 396 811 4.4%
Air Transport 2,447 14 19 2,480 1.2%
Other Transport 1,361 559 155 2,075 2.2%
Retail Trade 763 114 721 1,598 4.3%
Gasoline Stations 331 3 19 354 2.3%
Communications 347 164 510 4.3%
Finance, Insurance and Real Estate 295 829 812 1,936 4.3%
Business Services 2,455 740 3,195 4.3%
Education and Health Care 11 1,780 1,791 4.5%
Recreation and Entertainment 1,866 153 104 2,123 6.0%
Lodging 5,520 37 43 5,599 5.8%
Food & Beverage 4,810 137 273 5,220 6.2%
Personal Services 131 322 453 4.4%
Government - 111 66 177 4.4%
TOTAL 17,393 5,997 6,037 29,428 4.6%
% change 4.8% 4.2% 4.5% 4.6%
Tourism Income (Compensation)
(US$ Million, 2012)
19
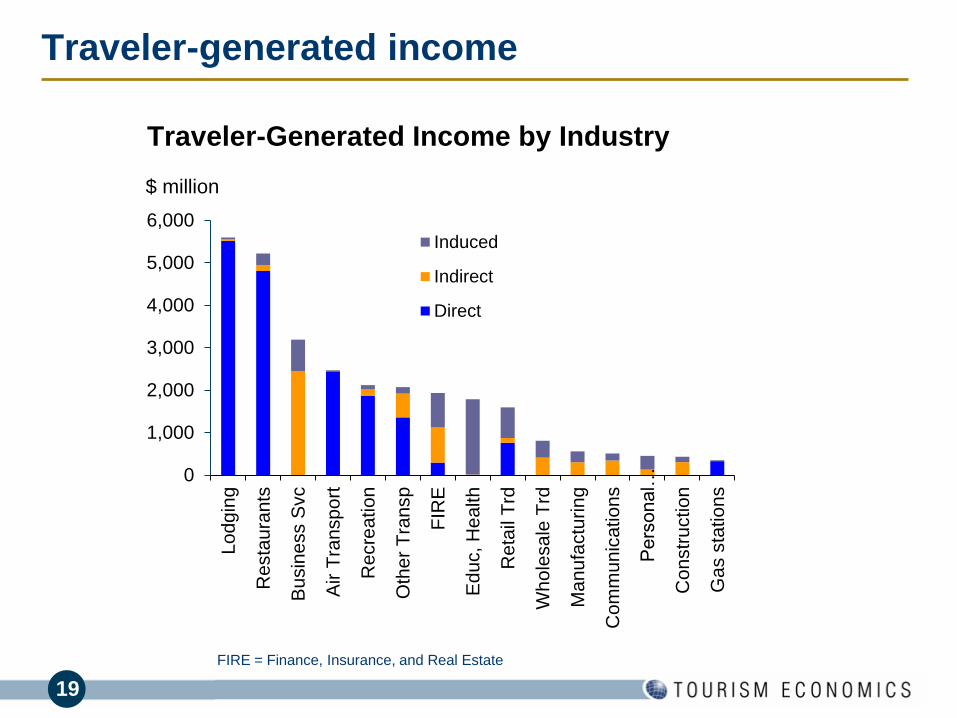
Traveler-generated income
Business Day
FIRE = Finance, Insurance, and Real Estate
0
1,000
2,000
3,000
4,000
5,000
6,000Lodg
ing
Resta
ura
nts
Busin
ess S
vc
Air T
ran
sport
Recre
ation
Oth
er
Tra
nsp
FIR
E
Educ, H
ealth
Reta
il T
rd
Wh
ole
sale
Trd
Ma
nufa
ctu
ring
Com
munic
ations
Pers
onal…
Constr
uction
Gas s
tation
s
Induced
Indirect
Direct
$ million
Traveler-Generated Income by Industry
20
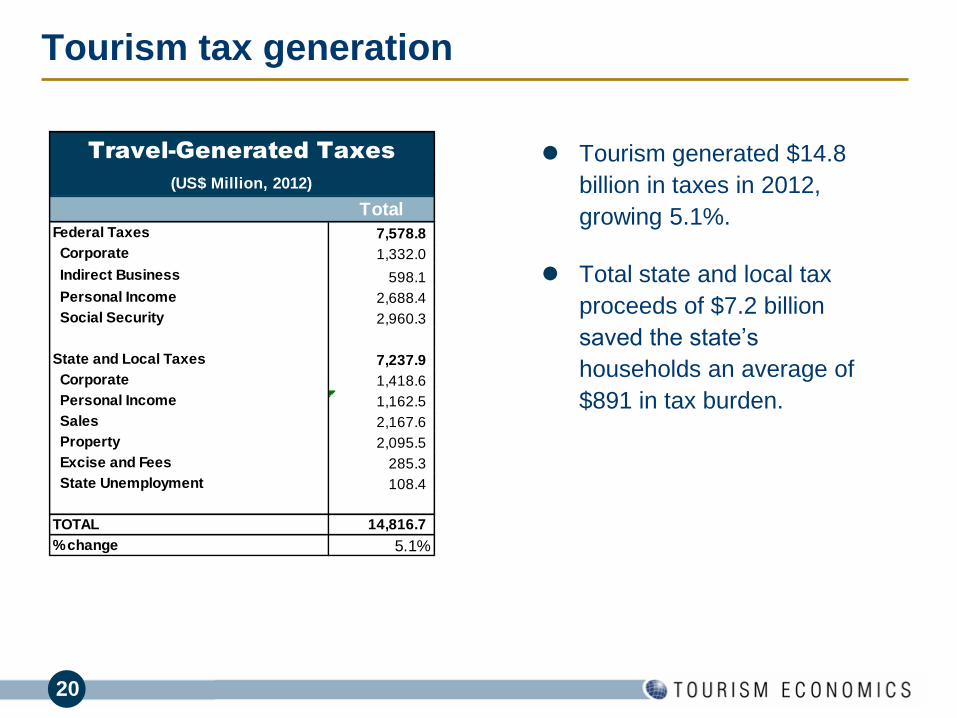
Tourism tax generation
Tourism generated $14.8
billion in taxes in 2012,
growing 5.1%.
Total state and local tax
proceeds of $7.2 billion
saved the state’s
households an average of
$891 in tax burden.
Business Day
Total
Federal Taxes 7,578.8
Corporate 1,332.0
Indirect Business 598.1
Personal Income 2,688.4
Social Security 2,960.3
State and Local Taxes 7,237.9
Corporate 1,418.6
Personal Income 1,162.5
Sales 2,167.6
Property 2,095.5
Excise and Fees 285.3
State Unemployment 108.4
TOTAL 14,816.7
% change 5.1%
Travel-Generated Taxes
(US$ Million, 2012)
21
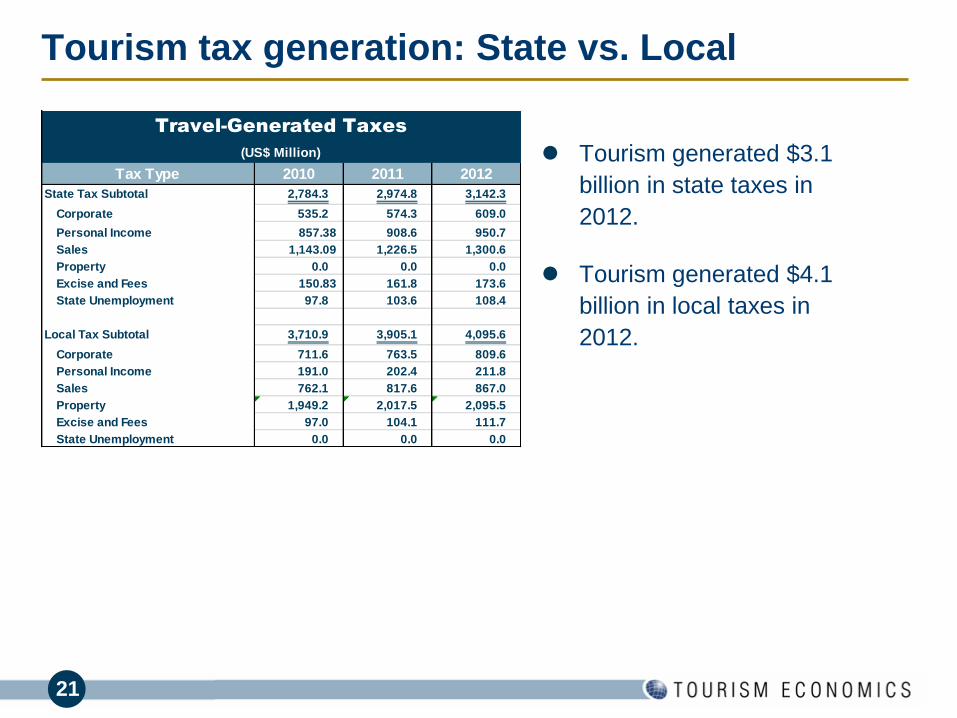
Tourism tax generation: State vs. Local
Tourism generated $3.1
billion in state taxes in
2012.
Tourism generated $4.1
billion in local taxes in
2012.
Business Day
Tax Type 2010 2011 2012
State Tax Subtotal 2,784.3 2,974.8 3,142.3
Corporate 535.2 574.3 609.0
Personal Income 857.38 908.6 950.7
Sales 1,143.09 1,226.5 1,300.6
Property 0.0 0.0 0.0
Excise and Fees 150.83 161.8 173.6
State Unemployment 97.8 103.6 108.4
Local Tax Subtotal 3,710.9 3,905.1 4,095.6
Corporate 711.6 763.5 809.6
Personal Income 191.0 202.4 211.8
Sales 762.1 817.6 867.0
Property 1,949.2 2,017.5 2,095.5
Excise and Fees 97.0 104.1 111.7
State Unemployment 0.0 0.0 0.0
Travel-Generated Taxes
(US$ Million)
22
• Household surveys from the US Travel Association and Longwoods International have provided
key inputs in establishing traveler spending figures. Industry data on lodging, airports, Amtrak, and
attractions contribute to year-over-year growth analysis.
• Employment definitions. The basis of our data and modeling is the Regional Economic Information
System (REIS), Bureau of Economic Analysis, U.S. Department of Commerce. This is different
than the NYS Department of Labor data source (ES202/QCEW). The main definitional difference
is that sole-proprietors, which do not require unemployment insurance and are not counted in the
ES202 data. BEA data shows (for example) state accommodations employment at 89,124,
compared with QCEW at 82,190. For total employment (across all sectors), the difference is 20%.
• International methodology. Our approach (through Travel Industry Association calculations) is
based the estimates on direct survey responses to the Department of Commerce in-flight survey
and Statistics Canada data – constrained to BEA international balance of payments data. The NY
data are consistent with TIA’s state-by-state distribution which ensures against overestimation.
• All employment and income results are constrained to known industry measurements for key
tourism sectors.
Methods and data sources
23
• Local taxes are a build-up of individual categories (sales, occupancy, property). The model is
not equipped to deal with individual exemptions such as Indian gaming.
• Second home expenditures are based on the stock of seasonal second home inventory.
Annual average expenditures for housing are pro-rated to the season length to account for
various levels of expenditures not accounted in visitor surveys.
• Lodging sector. Our models use survey information and constrains this to the value of the
hotel sector in each county. This can vary from certain bed tax estimates of total revenue for
several reasons. One is that the bed tax may only be based on room revenue while total sales
for the industry may include other revenue sources (room service, phone, etc.). Another is
that certain smaller establishments may not fully report or be required to report their revenue.
Methods and data sources
24
Tourism Economics utilized the IMPLAN input-output model for New York State to
track the flow of sales through the economy to the generation of GDP, employment,
wages, and taxes.
The impacts are measured on three levels:
■ Direct impact: The immediate benefit to persons and companies directly
providing goods or services to travelers.
■ Indirect impact: The secondary benefit to suppliers of goods and services to the
directly-involved companies. For example, a food wholesaler providing goods to
a restaurant. The model is careful to exclude imports from the impact
calculations.
■ Induced impact: The tertiary benefit to the local economy as incomes in the prior
two levels of impact are spent on goods and services. For example, a restaurant
employee spends his wages at a grocery store, generating addition economic
output.
Methods and data sources
25
About Tourism Economics
Tourism Economics, headquartered in Philadelphia, is an Oxford Economics company dedicated to providing high value, robust, and relevant analyses of the tourism sector that reflects the dynamics of local and global economies. By combining quantitative methods with industry knowledge, Tourism Economics designs custom market strategies, project feasibility analysis, tourism forecasting models, tourism policy analysis, and economic impact studies.
Our staff have worked with over 100 destinations to quantify the economic value of tourism, forecast demand, guide strategy, or evaluate tourism policies.
Oxford Economics is one of the world’s leading providers of economic analysis, forecasts and consulting advice. Founded in 1981 as a joint venture with Oxford University’s business college, Oxford Economics is founded on a reputation for high quality, quantitative analysis and evidence-based advice. For this, it draws on its own staff of 40 highly-experienced professional economists; a dedicated data analysis team; global modeling tools; close links with Oxford University, and a range of partner institutions in Europe, the US and in the United Nations Project Link.
For more information: [email protected].