the economic impacts of outbound fdi and trade: the · pdf filethe economic impacts of...
TRANSCRIPT

The Economic Impacts of Outbound FDI and Trade:
The Case of Korea
Sanghoon Ahn, Dongheon Lee, Siwook Lee, and Cheonsik Woo
Korea Development Institute
1. Introduction
The Korean economy has recovered markedly from the financial crisis of 1997, through well-concerted efforts to restructure its corporate and financial sectors. However, even as Korea managed to come out of the crisis with better macro-fundamentals and institutional foundation, Korea continues to face a stock of new challenges in maintaining the growth momentum and social integrity. Indeed, the financial crisis brought Korea into a new, distinctive phase of economic and social development, and Korea is expected to continue to go through deep and fast structural changes as it has experienced over the past 8 years, or so.
Focusing on industrial dimension, the financial crisis ushered in at least three fundamental changes. The first pertains to an overall industrial landscape of Korea. Before the crisis, Korea's industrial landscape was dominated by a handful of Chaebol-affiliated large firms, with the roles of foreign firms and SMEs very limited. After the crisis, however, a mass of global MNEs entered the Korean market and came to have greater market influences in many critical nodes of industrial supply-chain including core intermediate products. On the other hand, in the course of massive restructuring and downsizing efforts, Korea's leading conglomerate companies themselves pursued new business strategies including outsourcing and offshoring, resulting in serious undermining of traditional subcontract relations with SMEs. Although this put many traditional SMEs in deep trouble, a group of SMEs with independent technological capabilities managed to capitalize on new market environments, forging up so- called NTBFs (new technology-based firms). As a result of all these changes, a new tripod competitiveness structure has emerged in Korea, in which foreign MNEs and a group of NTBFs came to fore as two additional pillars of Korea's industrial competitiveness together with the Chaebol-affiliated firms.
Second, the activities of Korean firms have been upgraded in large. In respect of corporate
1

value-chain, the focus has shifted from production to higher value-added activities such as marketing and R&D. Reflecting ever-maturing demand and supply conditions, stimulated by variegated policy supports, inter-firm and inter-institutional transactions/collaboration have increased considerably amongst various agents comprising Korea's innovation network. Although these new development was most pronounced among the leading large firms, many SME followed the lead, especially the NTBFs. A substantial portion of SMEs increased investment in R&D and IT as well as stepping up efforts to strengthen cooperation with overseas enterprises and to enter foreign markets.
Third, in terms of the market performance, a small group of vanguard firms in Korea's flagship industries such as semi-conductors and automobiles are leaping forward in the global market, helped by much harnessed technological and financial base. In contrast, a majority of firms competing in the unsophisticated commodity markets are struggling increasingly more, in the face of ever-mounting competitive pressure from China. Overall, Korea has become more export-oriented with the GDP share of exports amounting to 37% in 2004, but the upward stride is led by a few vanguard firms, with the rest lagging seriously behind. Actually, as KDI’s study(2003) shows, since the financial crisis, productivity differentials between large firms and SMEs have increased sharply in industries where technological competitiveness matters most.
The future prospect of the Korean economy and industry is uncertain. As the latest experiences allude, a low and unstable growth could be a norm for a while, which will be accompanied by a widening income disparity. Regardless of upturn or downturn of the economy, what stands firm is that all above-mentioned turbulent and severe structural changes in Korea will go on for a substantial amount of time, possibly in an amplified fashion.
Major driving forces are already in place and expected to amplify further. Externally, the fierce forces of globalization, technological changes, surge of China, and other late-industrializing countries will combine to exert greater competitive pressure on Korea than ever, while bringing about profound structural changes in the global economy on the whole. Domestically, the regime shift of the Korean economy itself, set in and entrenched in the wake of the crisis management, is a powerful dynamo that will make ongoing structural changes of the Korean economy to sustain into the future.
Essentially, Korea may well be said to be in great transition from its old, globally semi-connected development model to a new model of full global connection. In coming decade or so, the global market condition will be very volatile and turbulent. In so much as Korea is a small open economy with large external sector, it is all the more critical for Korean firms to pro-actively respond to such an global market condition, seeking for a way to capitalize on the vast
2

opportunities global market and production chain provides.
Outbound FDI (overseas investment) and trade are two principal modes of global connection. Compared to much heightened interest in FDI into Korea, overseas investment by Korean firms has not received enough attention until lately, with the volume of outbound FDI plunging right after the financial crisis. However, as the volume of outbound FDI rises fast lately surpassing the pre-crisis peak level, policy attention has been renewed amid increasing concerns over its possible industrial "hollowing-out" effect. Nonetheless, the economic impacts of outbound FDI, especially its relation with trade and other industrial performance, such as productivity and employment, still remains an under-explored research area in Korea, thereby hampering sound policy making. This paper purports to fill this gap.
The rest of the paper will unfold as follows. The next section will provide a brief literature survey, including those directly addressing Korea-specific issues. In Section 3, we will go over the overall trends pertaining to the outbound FDI and trade in Korea. Covering the period of 1990~2003 and using three-digits industrial level data, we will look into the trend changes and other salient features of Korea's outbound FDI and trade. Special attention will be given to identify changes in their compositions by region, by industry, and by firm size. In addition, the relationship between the outbound FDI and trade will be examined through a simple regression analysis, so as to tell whether the relationship is subject to some systematic differences across different regions, industries, and time.
Section 4 then attempts a rigorous regression analysis of the economic impacts of the outbound FDI and trade in Korea. The focus will be the impacts on total factors productivity (TFP) and employment in Korea's manufacturing sector. As with the preceding section, the analysis will be conducted at both the aggregate and industrial branch levels, with special interests given to identify the impacts from transactions with China, Japan, and the U.S. The final section will summary the main findings of the paper.
2. A Selective Review of the Recent Literature on FDI
FDI has grown remarkably over the last two decades, at a higher rate than trade in manufacturing, which has in turn increased faster than income. This led to the emergence of considerable research that investigates the fundamental characteristics and impacts of affiliate operations abroad. This section provides a selective review of some of this existing literature.
3

While there exists a large literature on FDI, we limit our focus on the following two issues1; first, we begin with discussing a relatively recent and burgeoning strand of research, which explains who chooses to serve foreign markets through FDI. Second, we present recent empirical studies regarding the economic impacts of outbound FDI on domestic activities in home countries.
2.1 Who chooses to serve foreign markets through FDI?
The literature often classifies FDI as being a the horizontal or vertical type according to firms’ motives for affiliate operations abroad. Vertical FDI is the case where a firm pursues FDI in order to take advantage of international differences in factor prices, by locating its labor-intensive processing abroad and keeping capital-intensive input production and knowledge-intensive designing and R&D at home. On the other hand, horizontal FDI arises when a firm can reduce trade costs by setting up foreign affiliates replicating the parent firm. Hence, the literature of horizontal FDI emphasizes the importance of trade costs and access to local markets as the main motives of FDI location decisions.
Recent attention among economists has been drawn to explain the conditions under which firms engage in investment abroad. For instance, Helpman, Melitz and Yeaple (2004, HMY hereafter) propose a multi-country, multi-sector general equilibrium model in order to explain the decisions of heterogeneous firms whether to serve in overseas markets through exports or horizontal FDI. A basic idea of the model is that FDI involves higher sunk costs but lower per-unit costs than does exporting in serving the overseas market. The model suggests that only the more productive firms will choose to serve foreign markets and that the most productive firms among them will further choose FDI to serve the overseas market. In addition, the model predicts that the greater the heterogeneity of firms’ productivity, the greater will be FDI sales relative to export sales. These predictions are strongly supported by data on US exports and sales of overseas US affiliates in 38 different countries and 52 sectors.
Along a similar vein, Head and Ries (2003) develop and test a hypothesis that firms choosing FDI are more productive than firms choosing exports. Their findings, based on data for 1,070 large Japanese firms, show that firms using both FDI and exports to serve foreign markets are more productive than firms that rely exclusively on exports. Using a non-parametric test for first order stochastic dominance, Wagner (2005) suggests empirical evidence for
1 See Blonigen (2005) for a survey of recent empirical work on FDI determinants.
4

German firms, which is consistent with HMY.2 Specifically, he finds that the productivity distribution of foreign direct investors dominates that of exporters, which in turn dominates that of non-exporters.3 Recently, Lee (2005) empirically analyzes the choice of Korean firms in conducting foreign investments. He finds that Korean multinationals outperform their domestic counterparts in all dimensions; they are larger, pay higher wages and are more productive as well.
Using firm-level data on US multinationals’ trade in intermediate inputs, Hanson et al. (2003) show that vertical production networks are shaping trade patterns between US parent companies and their foreign affiliates. From the patterns of trade in intermediate inputs by industry, they find that certain industries (machinery, transportation equipment, and electronics, including computers) appear to be good candidates for vertical production networks.4 They point out that these industries share the following common features: First, production tends to involve distinct stages that are physically separable; and second, these production stages exhibit different factor intensities. As design activities and component production are more skill-intensive, while assembly activities are more labor-intensive, firms may have an incentive to locate labor-intensive activities in labor-abundant countries.
2.2 What are the economic impacts of FDI?
Given that our primary focus in this paper is the role of outbound FDI on Korea, our discussion here is concentrated on existing empirical research on the effects of multinationals on home countries, rather than those on host countries. Specifically, we discuss the relationship between FDI and trade on the one hand and the economic impact of FDI on other domestic activities, including equipment investment, employment and productivity, on the other.
2 Given two cumulative distribution functions from independent random samples, a non-parametric test for first order stochastic dominance provides statistical inference on differences in all moments of two samples. See Girma, Kneller and Pisu (2003) for more details. 3 Girma, Kneller and Pisu (2003) and Girma, Görg and Strobl (2004) also employ a test for stochastic dominance for the case of UK and Irish firms, respectively. While both find robust support for the HMY hypothesis, the latter does not indicate clear differences in performance between exporters and non-exporters. 4 Incidentally, those industries identified by Hanson et al. (2003) as good candidates for vertical specialization are also the leading export industries of Japan and Korea. It seems obvious that outward FDI will become more and more important for Japanese and Korean firms.
5

2.2.1 Outbound FDI and Exports
Are foreign production and exports substitutes or complements? While standard trade theory predicts that they are substitutes, recent empirical work largely indicates a complementary relationship between them. As discussed in Blonigen (2001), there are several reasons to suggest both substitution and complementarity effects. Substitution between them arises if intangible assets specific to the firm, such as technology and managerial skills, may induce a firm to operate production facilities abroad rather than export. It is often difficult to properly appropriate rents from such assets via contact with a third-party, which leads the firm to establish its own facilities abroad. FDI also replaces trade when there are sufficient costs to external transactions such as exporting or licensing.
On the other hand, we expect a complementary effect when a firm’s production presence in a foreign market with one product may increase total demand for all of its products. For instance, the presence itself may increase the firm’s knowledge about the market and thus help tilt consumer preferences in the firm’s favor. Furthermore, recent empirical evidence reveals that almost half of trade flows are parent-to-affiliate input trade. This may imply that foreign affiliate activities may increase exports of inputs to the host market from home countries.
Empirical tests regarding to what extent FDI changes exports have been largely based on an FDI-augmented gravity model. By considering FDI patterns as an additional determinant of trade, a majority of research using this framework finds positive feedback from FDI to exports. For example, Lipsey and Weiss (1981) and Blomstrom et al. (1987) are among the early studies adopting this approach.5 By employing the detailed data of U.S. multinational firms, Clausing (2000) again finds complementarity between multinational activity and intra-firm trade. Hejazi and Safarian (2001) argue that U.S. outbound FDI has a larger predicted positive impact on U.S. exports than inbound FDI.
On the other hand, there has been growing research indicating that the impact of FDI on trade could vary depending on FDI type, data-level, etc. For instance, Head and Ries (2003) suggest that horizontal investment tends to substitute for home production and exports, while vertical FDI expands home exports via intra-firm in intermediate inputs. In addition, Swenson (1998) argues that less substantial complementarity and even substitution effects are revealed as one moves from more aggregated industry FDI data to less aggregated data. Finally, Blonigen (2001) emphasizes the importance of adopting the level of data aggregation appropriate for the
5 On the other hand, Lipsey and Weiss (1984) find a strong complementary relationship between U.S. affiliate production and U.S. exports of intermediate goods, but no evidence for either complementarity or substitution in the case between finished goods affiliate production and finished goods exports.
6

hypothesis being tested. He finds a complementarity effect in the case of Japanese automobile parts for the U.S. market, but a substitution effect using product-level data on Japanese final consumer products. He also finds evidence that, when firms locate production abroad, the substitution effects are large one-time changes, not gradual steps over time.
2.2.2 Outbound FDI, Trade and Domestic Activities
Another strand of FDI research that has attracted much attention from international economists is the relationship between FDI and domestic activities, especially employment, productivity and domestic investment. The recent surge of outward FDI has sparked debate on whether the home economy is hollowing out as productive capacity is moving abroad, thus hurting domestic growth and employment. So far, the FDI literature produces quite mixed results on this issue, and consequently remains an open question
Using firm-level data from US and Swedish multinationals, Blomstrom et al. (1997) examine the effects of affiliate net sales on employment of the parent companies. They find that U.S. parent firms tend to substitute foreign production in developing countries for home employment, but this is not the case for foreign production in developed countries. On the other hand, in case of Swedish firms, they provide evidence that foreign affiliate production raises the demand for home labor, regardless of FDI locations. In a different context, Feldstein (1995) provides aggregate level evidence that foreign investment diverts resources from domestic investment in OECD economies. On the other hand, Desai, Foley and Hines (2005a) find that foreign and domestic investments are positively correlated for U.S. multinationals.
Recently, Desai, Foley and Hines (2005b) highlight the fact that foreign and domestic operations are jointly determined by other economic factors. This indicates that there are likely to be substantial questions of endogeneity in a regression of foreign operations on domestic activities, unless these determinants are explicitly controlled in estimation. In this context, they employ an instrumental variable approach in analyzing the detailed affiliate-level data of U.S. multinationals. They find that the estimated effect of foreign investment on domestic investment has a larger positive magnitude in the instrumental variables equation than does the corresponding estimated coefficient in the OLS equation. This result implies that omitted variables have the effect of making foreign and domestic investment look more like substitutes than is really the case.
7

3. The Recent Pattern of Korean Outbound FDI
The history of the Korean outbound FDI began in 1968, but its size remained relatively small until the mid-80s, due to various regulations to control foreign reserves and firms’ inability to conduct investments abroad. Since then, outward FDI has grown steadily, particularly due to liberalization policies first adopted in the mid-80s.6 As depicted in Figure 3.1, outbound FDI rapidly increased during the years 1993-96,7 but there have been a relative slowdown afterward. The share of total FDI stocks in GDP increased from 0.2% in 1980 to 5.7% in 2003, even though it is still well below that of the U.S. (18.8%) or of most developed countries (26.4% on average).8 This indicates that, as a late starter in conducting investments abroad, the importance of outbound FDI is ever increasing for Korea.
[Figure 3.1: Outbound FDI for Korea (1980-2003)]
Figure 3.2 shows the geographic distribution of outstanding FDI across countries or regions at the end of 2003. The U.S. accounts for 26% of total outstanding investment, followed by Asia, China and Europe in order.9 There has been a sharp increase in the amount of outbound FDI into China since 1998, notably by the small and medium-sized enterprises. As of 2003, China accounts for 19% of the total FDI stock (and 48% of the total number of affiliates, respectively). This is quite a remarkable increase given that investments into China gained momentum only after 1992.
[Figure 3.2: Outbound FDI for Korea, by Destination]
Investments destined for China have been concentrated in manufacturing (84.8% of total FDI stock into China at the end of 2003). Consequently, as of 2003, the share of net FDI stock into China relative to the total net stock in the manufacturing sector exceeded that of any other destination, as shown in Figure 3.3. On the other hand, in the case of Korean FDI into the U.S., FDI in the service sector (55.8%) is larger than that in manufacturing sector (41.5%).
6 Lee (2003) explains several reasons for the surge of outbound FDI from Korea since the late-80s; first, Korea opted for a liberalization policy on outbound FDI in the mid-80s. For instance, FDI up to 2 million US dollars has not required the government approval since 1989. Second, the government began offering tax incentives including a reserve for losses incurred by FDI. Third, the Korean Export-Import bank provided subsidized loans for outbound FDI, financing up to 80% of the investment. 7 The main reasons were rapid increases in real wage costs, the appreciation of the Korean won and the liberalization policy toward outbound FDI, etc. 8 These figures are based on UNCTAD’s World Investment Report, 2004. 9 Asia includes all the Korean FDI-hosting countries in the Asian region, except China, Japan and countries in the Middle East.
8

[Figure 3.3: Korean Outbound FDI in Manufacturing, by Destination]
Figure 3.4 contains recent trends in outstanding FDI, export and imports by technology levels of manufacturing industries. Following the OECD (1997) approach in classifying manufacturing industries according to technology intensity, we divide manufacturing sectors into low, medium-low, medium-high and high technology industries.10 As depicted in the figure, the importance of high and medium-high tech industries has substantially increased for outbound FDI as well as trade. This reflects the fact that major firms in leading export industries such as computers, telecommunication equipment and automobiles have recently relocated some segments of their production lines and established new export bases, notably in China.
[Figure 3.4: FDI and Trade in Manufacturing sector, by technology intensity]
Figure 3.5 presents the recent trends of Korea’s FDI into China and of bilateral trade between two countries. We can observe that outbound FDI toward China has substantially grown since the 1990s, regardless of technology intensity. Imports from China followed a similar pattern. On the other hand, the rapid growth of exports into China has driven mostly by those of high and medium-high tech industries. A possible interpretation for this is that Korean multinational firms are vertically integrated, so production requiring relatively simply assembly processes was relocated abroad, while capital-intensive input production and knowledge-intensive designing and R&D are kept at home. Hence, the host country is used as export platform for finished products through a labor-intensive simple processing.
[Figure 3.5: Korean FDI and Trade into China, by technology intensity]
Finally, Figure 3.6 contains the patterns of FDI and trade with the U.S. Unlike China’s case, FDI into the U.S. is mostly concentrated in high tech industries, while others remain relatively stable over time. As we can expect, the relative share of high and medium-high tech industries in both exports and imports is bigger than that of other counterparts.
[Figure 3.6: Korean FDI and Trade into the U.S., by technology intensity]
10 See Appendix for the detailed list of these industries.
9

4. The Economic Impacts of Outbound FDI and Trade: Evidence from Micro-data
4.1 Data Description
For empirical analyses on economic impacts of outbound FDI and trade in Korea, we have constructed a plant- and industry-level dataset for Korean manufacturing from 1990 to 2003. This dataset has three sources of information: Annual Report on Mining and Manufacturing Survey (Korean National Statistical Office), UN Commodity Trade Statistics Database (United Nations Statistics Division), and Overseas Direct Investment Statistics Yearbook (The Export-Import Bank of Korea).
The Korea National Statistical Office conducts Mining and Manufacturing Survey annually. The survey covers all plants with five or more employees in mining and manufacturing industries and contains plant-level information on output, input, and a variety of additional information including the 5-digit Korean Standard Industry Classification (KSIC) code assigned to each plant based on its major product. Variables such as plant-level employment growth, capital-labor ratio, non-production- to production-worker ratio, labor productivity, and total factor productivity were calculated at plant-level based on information from this Survey.
The UN Statistics Division compiles the UN Commodity Trade Statistics Database (“UN COMTRADE”), which contains annual amounts of imports, exports, and re-exports in US dollars by commodity and by trading partners. Commodities are classified according to the International Trade Classification (SITC: Rev.1 from 1962, Rev.2 from 1976 and Rev.3 from 1988) and the Harmonized System (HS) (from 1988 with revisions in 1996 and 2002). Imports from and exports to Korea’s major trading partners by commodities based on the SITC Rev.3 and on the HS system from 1990 to 2003 were downloaded from the UN COMTRADE website [http://unstats.un.org/unsd/COMTRADE/].
The Export-Import Bank of Korea is an official export credit agency providing comprehensive credit and guarantee for trade and overseas investment. It publishes the Overseas Direct Investment Statistics Yearbook, which reports flows and stock of outbound foreign direct investment by industry and by destination. The Export-Import Bank has its own code for industry classification (“EXIM code”) that is by and large comparable to the 3-digit KSIC code. For example, total manufacturing sector consists of 71 industries according to the 3-
10

digit KSIC code and of 70 industries according to the EXIM code. Information on annual FDI flows and stock disaggregated by the EXIM code industries and by destination countries was downloaded from the Bank’s website [http://www.koreaexim.go.kr/en/].
While the Manufacturing Survey contains plant-level information, the trade database and the FDI database that we have now do not provide plant-level information. To put these three different sources of data together, therefore, we were able to link them only at a certain level of industry-wide aggregation. As the Manufacturing Survey and the UN COMTRADE has finer industry classification codes, we converted their industry classification codes and match them to the EXIM code. As a result, we could construct our database having detailed unified industry-level information on production, trade, and FDI.
In the following sections, we will report our main findings from regression analyses on: (i) the links between FDI and trade, (ii) the impacts of outbound FDI and Trade on employment growth, and (iii) the impacts of outbound FDI and Trade on employment growth. The first group of regression analyses on the links between FDI and trade are inevitably performed at the industry level due to the data limitation, and yet, information on the 70 industries over the 14-year period form 1990 to 2003 will allow us to have observations as many as 980. The second and the third group of regression analyses on employment growth and productivity growth will take advantage of a still larger number of plant-level observations, at the order of magnitude of 100,000. Using the plant-level information from the Manufacturing Survey, we will run regressions for the plant-level employment growth and productivity growth on plant-level variables as well as on industry-level variables including FDI- and trade-related variables.
4.2 Relationship between FDI and Trade: Complements or Substitutes?
In this section, we empirically examine the economic impact of outbound FDI on exports. We use 71 Korean manufacturing sectors for the period of 1991-2003 in estimation. Consider the following simple regression model;
(4.1) ___ ,1,21,1, titjtiti growthExportsgrowthFDIgrowthExports ναα +⋅+⋅= −−
where ,0, tiiti T εξαν ++= . 0iα represents an unobserved industry fixed effect affecting
exports growth, T is a vector of year dummies, ξ is a parameter vector for time dummies and
finally ti,ε is a white noise error term. The dependent variable is the annual growth rate of
11

exports in sector i at year t, while the regressors are the one-year lagged growth rates of FDI and exports. All growth rates are calculated as annual changes normalized by dividing averages of beginning and ending years. Estimation results are reported in the first three columns of Table 4.1. The first Columns I use all samples, while columns II (III) uses only observations pertaining to low tech and medium-low tech industries (medium high and high tech industries). Heteroskedasticity-consistent standard errors are reported in brackets below parameter estimates.
As shown in Table 4.1, the complimentarity effect of FDI on exports appears from the data for the case of relatively high-tech industries. The coefficient for FDI growth rates is statistically significant and positive. This result seems to support the hypothesis that Korean multinational firms are vertically integrated in these industries, so production requiring relatively simply assembly processes was relocated abroad. The host country is used as export platform for finished products through a labor-intensive simple processing.
[Table 4.1: Relationship between FDI and Exports; OLS and 2SLS Estimations]
One possible specification issue entailed in equation (4.1) is endogeneity problem.11 In a similar spirit with Desai, Foley and Hines (2005b), we could expect that foreign production and exports are jointly determined by some common factors. For instance, the more productive firms would conduct more foreign production and exports at the same time. Therefore, unless these common factors are properly controlled in estimation, it could appear that the causal relationship between FDI and exports exists when in fact it does not. As aforementioned, an FDI-augmented gravity model has been frequently used to investigate the substitution-versus-complementarity effects of FDI on exports. Unfortunately, the current empirical literature, including those based on FDI-augmented gravity models, has paid little attention to this issue. 12
In this context, we adopt here an instrumental variable approach, similar to Desai, Foley and Hines (2005b) and re-estimate the effect of outbound FDI on exports for Korean manufacturing. In general, instrumental variables, which predict foreign investment but do not directly affect exports, could help us to identify the relationship between foreign investment and exports. If a host economy grows fast, then multinationals would like to expand foreign production in that country. As argued in Desai, Foley and Hines (2005b), multinationals with prior local experience would have advantage in expanding foreign production because they have better knowledge about the local market. Furthermore, local experience reflects unmeasured
11 We plan to pursue research by applying our approach in this section to a FDI-augmented gravity model in the near future. 12 The direction of causality is another issue. Aizenman and Noy (2005) find evidence that most of the relationship between FDI and trade can be explained by Granger-causality from FDI flows to trade openness, but also by that from trade to FDI at a lesser extent.
12
firms’ characteristics to serve a local market better than the other markets. At the same time, an industry’s initial distribution of foreign activity does not directly affect subsequent changes in exports.
In this respect, our instrument variables procedure uses GDP growth rates of affiliate host countries and then aggregate them using weights equal to an industry’s initial outstanding investment share in each host country, relative to that industry’s total outstanding investment. We call the resulting variable as MARKET. In addition, in order to include vertical FDI motives to take advantage of international differences in factor prices, we also include the relative cost differences between home and foreign countries, proxied by the ratio of per capital GDP level of Korea to that of host countries. Again, these cost differences are weighted by initial distribution of foreign activity. We define this variable as COSTS.
Our empirical strategy is follows: at the first stage, we run a regression of FDI annual growth rate on MARKET and COSTS.
(4.2) _ ,1,21,101, titititi COSTSMARKETgrowthFDI υγγγ +⋅+⋅+= −−−
Then predicted FDI growth rates in the first stage, defined as 1,_ −tigrowthFDI , are
included as independent variables in second stage equation:
titjtiti growthExportsgrowthFDIgrowthExports ,1,21,1, ___ ναα +⋅+⋅= −− (4.3)
where ,0, tiiti T εξαν ++= .
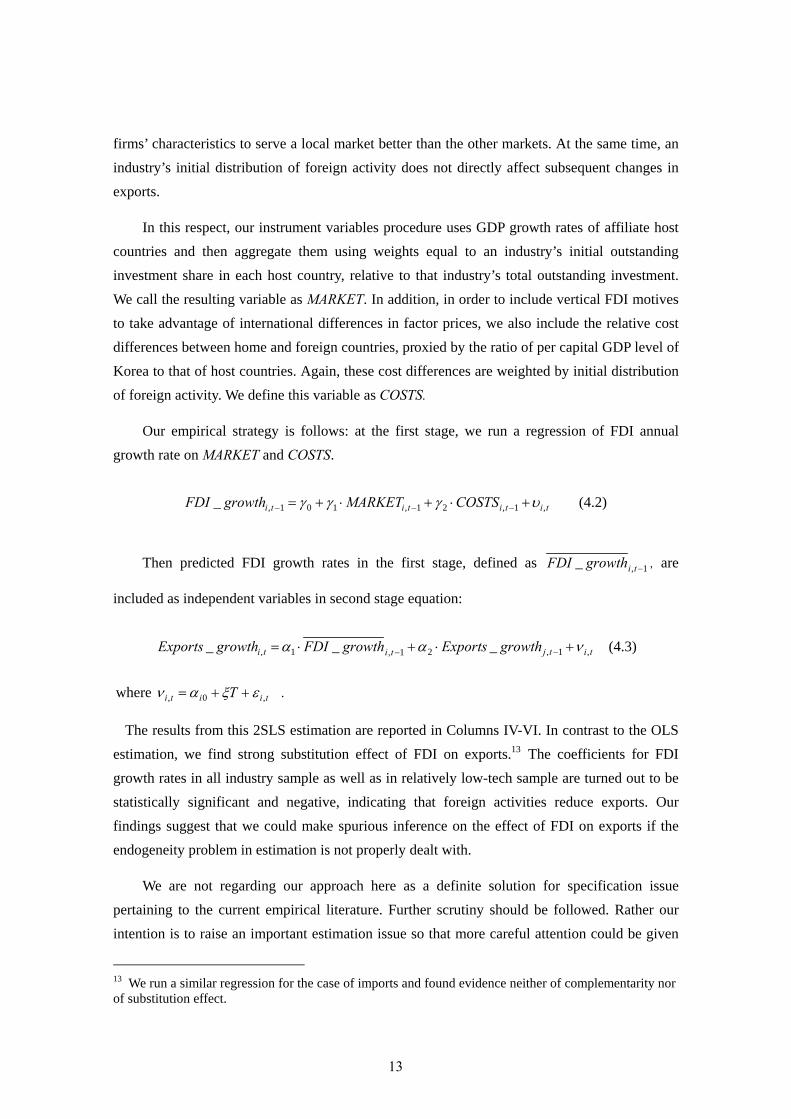
The results from this 2SLS estimation are reported in Columns IV-VI. In contrast to the OLS estimation, we find strong substitution effect of FDI on exports.13 The coefficients for FDI growth rates in all industry sample as well as in relatively low-tech sample are turned out to be statistically significant and negative, indicating that foreign activities reduce exports. Our findings suggest that we could make spurious inference on the effect of FDI on exports if the endogeneity problem in estimation is not properly dealt with.
We are not regarding our approach here as a definite solution for specification issue pertaining to the current empirical literature. Further scrutiny should be followed. Rather our intention is to raise an important estimation issue so that more careful attention could be given
13 We run a similar regression for the case of imports and found evidence neither of complementarity nor of substitution effect.
13

to this issue in subsequent research.
4.3 Economic Impacts of FDI and Trade on Employment Growth
Does an increase in outbound FDI have a negative impact on job-creation in home country? Or, in which sector and under what circumstances could outbound FDI hinder domestic employment growth? This must be a very important question not only for researchers but also for policymakers. But, answers to this question in the empirical literature are rather mixed, suggesting that this important issue still remains unsettled. The Korean case where outflows of both horizontal and vertical FDI surged in the 1990s will offer some useful evidence on this issue. Taking advantage of our rich micro-data, we will try to shed light on the impacts of FDI and trade on employment in Korea from various angles. We will pay special attention to heterogeneity in the FDI outflows and in the trade flows: by region, by industry, by technology level, by the size of producers, etc. Using the same approach, we will look into the impacts of FDI and trade on productivity growth as well.
Results of various regressions on the determinants of plant-level employment growth are to be reported in this subsection. Considering close links between FDI and trade analyzed in the previous section, both outbound FDI growth and trade growth (or, instead, export and import growth) are included as explanatory variables. As we have seen in Section 3, major destination countries for the outbound FDI from Korea are China and the US, and major trading partner countries are China, Japan, and the US. But, their industry composition (especially composition of high-tech, medium-tech, and low-tech industries) varies substantially from country to country and also over time. To take such variations into account, we will include shares of major partner countries in FDI and trade as additional explanatory variables. The growth rates and country shares of FDI and trade are measured at a relatively detailed industry level based on the EXIM code having 70 industries in manufacturing.
Our regression equation for the employment growth is:
titDtjIndustrytiPlantti
titi DYXL
LL,,,0
,
,1, εαααα +⋅+⋅+⋅+=−+ (4.4)
where the left-hand-side variable is the employment growth rate in terms of the number of workers at plant i from year t to year (t +1) and the right-hand-side variables are as follows.
14

● Xi,t: Vector of plant-specific variables for plant i in year t (i = 1, …, Nt; t = 1990, 1991, …, 2002), which includes shipment growth rate, share of non-production workers, capital-labor ratio, and number of workers.
● Yj,t: Vector of industry-specific variables for industry j to which plant i belongs in year t (j = 1, …, 70; t = 1990, 1991, …, 2002), including industry-level non-production worker share, industry-level capital-labor ratio, outward FDI growth rate, shares of FDI to China and the US, export growth rate, shares of export to China, Japan, and the US, import growth rate, shares of import from China, Japan, and the US, etc.
● Dt: Vector of year dummy variables. (t = 1991, 1992, …, 2002)
We have run three sets of regressions using the Equation (4.4). In the first set of regressions, the independent variable is the annual growth rate of employment for each plant in each year.14 Each observation is pooled together with year dummies to control for economy-wide year effects over the business cycle, and then, the ordinary least square (OLS) regression is applied. Table 4.2 summarizes the results of the first set of regressions.
[Table 4.2 Regression Results for the Annual Employment Growth Rates]
Column I and II show the results of regressions for the whole sample, where the number of observation is 476,819. According to the result reported in the Column I, it appears that shipment growth, non-production workers’ share, and capital-labor share at the plant-level have significantly positive effects on the employment growth at the plant level. On the other hand, logarithm of the initial size of the plant measured by number of workers has a negative effect on the employment growth, reflecting a trivial fact that smaller plants will have bigger room for further growth than bigger plants. At the industry-level, we controlled for capital-labor ratio and non-production workers’ share.
Now, we are ready to focus on major variables in which we are most interested. In Column I, the growth rate of outbound FDI at the industry-level has a positive coefficient (0.01239) with a very high heteroscedasticity-robust t-ratio (5.49), suggesting that outbound FDI tends to have a positive effect on job-creation. On the other hand, the estimated coefficient for the share of
14. To check the robustness of the regression results, we have performed the second and the third set of regressions. In both sets of regressions, 3-year average annual growth rate of employment for each plant in each year was used as the independent variable. In the second set, the average of the employment growth rate over the subsequent three years was calculated each year. In the third set, we have avoided overlapping periods in averaging by choosing Year 1990, Year 1993, Year 1996, and Year 1999, only. The results of the second and the third set of regressions are reported in the appendix at the end of this paper. They show that the main findings of the paper remain robust.
15

FDI to China is negative (-0.04702) and statistically significant (its heteroskedasticity-robust t-ratio being -8.78), while the coefficient for the share of FDI to the US is positive but statistically insignificant.
Estimated coefficients for trade related variables (export growth, export shares, import growth, and import shares) are statistically insignificant in the majority of variables in Column I. Instead, trade (sum of import and export) growth and trade shares are used as industry-level explanatory variables for employment growth in Column II. Trade appears to have a positive effect on employment growth (coefficient: 0.02966) but with marginal significance (robust t-ratio: 1.80). Similar to FDI, trade with China appears to have a negative effect (coefficient: -0.04214) while trade with the US, a positive effect (coefficient: 0.04482).
It is often reported that the impacts of globalization on domestic sectors tend to create strong disparities on various dimensions, including disparity between large internationalized firms and small and medium size enterprises (SMEs). We have tried to detect such disparities by separating our sample into two groups: plants with more than 300 workers and plants with less than 300 workers.
Column III and IV of Table 4.2 report the regression results for the large plants (number of observation: 5,951), while Column V and VI for the small and medium size plants (number of observation: 470,823). The observation that growth rate of outbound FDI has a positive and highly significant coefficient and that FDI to China share has a negative and highly significant coefficient remains robust across Column I through Column VI. It is worth noting, however, that the positive impact of FDI growth and the negative impact of China FDI on employment growth have turned out to be much bigger for large plants. On the other hand, the positive impact of trade growth and the negative impact of trade with China on employment growth look more conspicuous for plants with less than 300 workers.
16

4.4 Impacts of FDI and Trade on Productivity Growth
Extending our scope from job-creation to productivity growth, we have investigated impacts of FDI and trade on productivity growth hiring a similar regression approach as above. Our regression equation for total factor productivity (TFP) growth is:
titDtjIndustrytiPlanttiti DYXTFPTFP ,,,0,1, lnln εββββ +⋅+⋅+⋅+=−+ (4.5)
where the left-hand-side variable is the log growth rate of total factor productivity (TFP) at plant i from year t to year (t +1) and the right-hand-side variables are the same as those in Equation 4.x1 except that Xi,t here contains the level of ln TFP for a plant i at year t instead of the shipment growth rate.
Following Good, Nadiri, and Sickles (1999), Aw, Chen, and Roberts (2001), , Hahn (2004), and Ahn, Fukao, and Kwon (2004), plant-level total factor productivity (TFP) is estimated by the chained-multilateral index number approach. It uses a separate reference point for each cross-section of observations and then chain-links the reference points together over time as in Tornqvist-Theil index. The output, input, and productivity level of each plant in each year is measured relative to the hypothetical plant at the base time period. This approach allows us to make transitive comparisons of productivity levels among observations in a panel data set. The productivity index for plant i at time t is measured in the following way.
itTFPln = ( tit YY lnln − ) + ∑=
−−t
YY2
1)lnln(τ
ττ
− { }∑ ∑∑= =
−−
=
−++−+N
n
N
nnnnn
t
ntnitntnit XXSSXXSS1 1
112
)lnln)((21)ln)(ln(
21
ττττ
τ
where Y, X, S, and TFP denote output, input, input share, TFP level, respectively and symbols
with upper bar are corresponding measures for hypothetical firms. The subscripts τ and n are indices for time and inputs, respectively. Here, capital, labor, energy and real intermediate inputs were considered as factor inputs.
Again, we have run three sets of regressions using the Equation (4.5). In the first set of regressions, the independent variable is the annual log growth rate of TFP for each plant in each year.15 Each observation is pooled together with year dummies to control for economy-wide
15. Once again, we have performed the second and the third set of regressions. In both sets of regressions, 3-year average annual log growth rate of TFP for each plant in each year was used as the independent variable. In the second set, the average of the TFP growth rate over the subsequent three years was calculated each year. In the third set, we have avoided overlapping periods in averaging by choosing Year 1990, Year 1993, Year 1996, and Year 1999, only. The results of the second and the third set of
17

year effects over the business cycle, and then, the ordinary least square (OLS) regression is applied. Table 4.3 summarizes the results of the first set of regressions.
[Table 4.3 Regression Results for the Annual TFP Growth Rates]
Column I and II show the results of regressions for the whole sample. Natural log of TFP level at year t is so-called convergence term in a typical growth regression. In our regressions, the estimated coefficient was consistently negative. Similar to employment growth regression results, non-production workers’ share appears to have a positive effect on productivity growth. Logarithm of the initial size of the plant measured by number of workers has a positive effect on TFP growth, reflecting economies of scale. At the industry-level, we have controlled for capital-labor ratio and non-production workers’ share.
In Column I, the growth rate of outbound FDI at the industry-level has a positive coefficient (0.00577) with a sufficiently high heteroskedasticity-robust t-ratio (4.07), suggesting that outbound FDI tends to have a positive effect on productivity growth. On the other hand, the estimated coefficient for the share of FDI to China is negative (-0.02735) and statistically significant (its heteroscedasticity-robust t-ratio being -8.42), while the coefficient for the share of FDI to the US is positive (0.01178) and statistically significant (robust t-ratio: 3.81). Such pattern persists across Column I through Column VI.
Among estimated coefficients for trade related variables (export growth, export shares, import growth, and import shares), both export to and import from Japan have shown significantly negative coefficients. Again, Column II shows that trade with Japan has a negative effect on TFP growth (coefficient: -0.03859) while trade with China or with the US has a positive effect (coefficients: 0.13198 and 0.14360, respectively).
Column III and IV of Table 4.3 report the TFP growth regression results for the large plants, while Column V and VI for the small and medium size plants. Once again, the positive impact of FDI growth and the negative impact of FDI to China on TFP growth have turned out to be much bigger for large plants. The negative impact of trade with Japan on TFP growth appears to be quite robust.
regressions are reported in the appendix at the end of this paper, showing that the main findings of the paper are not affected.
18

5. Conclusion
This paper analyzed the economic impacts of outbound FDI of Korea, with focus given to its relation with trade and other industrial performance such as productivity and employment. We used trade and overseas investments and manufacturing survey data, which have been re-aligned consistently at a detailed (3-digit) industry level. We focused on three major transaction partners of Korea, viz. the U.S., Japan, and China, and explored how the effects of transactions with these countries could differ across countries. In many cases, we grouped industries into four by their technological attributes (OECD classification) and adopted typical large firms vs. SMEs classification so as to examine how technological and size characteristics of firms affect all the relationship and effects under concern.
The main findings of this paper can be summarized as follows.
On the relationship between the outbound FDI and trade The ultimate concern is whether these two are 'substitute' or 'complementary.' According to
the regression results of our paper, which encompasses about 70 groups of industries and covers the period of 1990~2003:
● No meaningful relationship is found by a simple aggregate OLS analysis lumping all industries together.
● As for high-tech and medium high-tech industries, the outbound FDI turns out to induce an increase in trade, when an OLS analysis is conducted with respect to these two industrial groups only.
● However, the above result may be obtained simply because the outbound FDI and trade may be positively correlated with each other by the third unspecified factor. Controlling such endogeneity problem by using an instrumental variable technique, it turns out that an outbound FDI leads to a decrease in trade for low-tech and medium low-tech industries
The impacts of the outbound FDI and trade on employment According to the regression results on the employment increase effects for individual
establishments, (with both establishment and industry level data used as explanatory variables):
● An increase in the growth rate of outbound FDI in certain industry leads to an average increase in the employment growth of establishments in that industry
19

● However, the higher the share of outward FDI into China in certain industry, the lower is the average employment growth of establishments in that industry.
● All these patterns are more pronounced among large firms than among SMEs.
The impacts of the outbound FDI and trade on TFP According to the regression results on the TFP growth effects for individual establishments
(with both establishment and industry level data used as explanatory variables):
● An increase in the growth rate of outbound FDI in certain industry leads to an average increase in the TFP growth of establishments in that industry
● However, the higher the share of outward FDI into China in certain industry, the lower is the average TFP growth of establishments in that industry. In Contrast, the greater share of outward FDI into US has the opposite effect.
● All these patterns are more pronounced among large firms than among SMEs.
● The higher the share of trade with Japan in certain industry, the average TFP growth is lower in establishments in that industry.
The overall effects of outward FDI on domestic activities in Korea While existing literature split in the predicted direction of effects, we find:
● In general, outward FDI tends to affect employment and TFP positively
● But the outward FDI into China exerts negative effect.
● On the other hand, in those industries trading heavily with Japan, employment and TFP growth of individual establishment tend to be suppressed.
Overall, the internationalization of production, as captured by outbound FDI and trade, could have positive effects on the Korean economy. But, their precise effects differ considerably, depending on the characteristics of industries, characteristics of trading partners, and the size of business establishments under concern.
20

References
Ahn, S., Fukao, K.and H. Kwon (2004), “The Internationalization and Performance of Korean and
Japanese Firms: An Empirical Analysis Based on Micro-Data,” Seoul Journal of Economics, vol. 17,
no.4, pp.439-82.
Aizenman, J. and I. Noy (2005), “FDI and Trade-Two Way Linkages?,” NBER Working Paper #
11403.
Aw, B. Y., Chen, X., and M. J. Roberts (2001), “Firm-Level Evidence on Productivity Differentials,
Turnover, and Exports in Taiwanese Manufacturing,” Journal of Development Economics, vol. 66,
pp.51-86.
Blomstrom, M., Fors, G. and R.E. Lipsey (1987), “Foreign Direct Investment and Employment:
Home Country Experience in the United States and Sweden,” Economic Journal 107, pp. 1787-97.
Blonigen, A. B. (2001), “In Search of Substitution between Foreign Production and Exports,”
Journal of International Economics 53, pp. 81-104.
Clausing, A. K. (2000), “Does Multinational Activity Displace Trade?,” Economic Inquiry, Vol. 38,
No. 2, pp. 190-205.
Desai, A. M., Foley, C. F., and J. R. Hines (2005a), “Foreign Direct Investment and the Domestic
Capital Stock,” NBER Working Paper # 11075.
Desai, A. M., Foley, C. F., and J. R. Hines (2005b), “Foreign Direct Investment and Domestic
Economic Activity,” Mimeo, August 2005.
Feldstein, M. (1995), “The Effects of Outbound Foreign Direct Investment on the Domestic Capital
Stock,” in Feldstein et al. (eds), The Effects of Taxation on Multinational Corporations, University of
Chicago Press, pp. 43-63.
Girma, S., Kneller, R., and M. Pisu (2003), “Exports versus FDI : An Empirical Test,” Research on
Globalization and Economic Policy 21.
Girma, S., Gorg, H. and E. Strobl (2004)., "Exports, International Investment, and Plant
21

Performance: Evidence from a Non-Parametric Test," Economics Letters, Vol.83, pp. 317-324.
Good, H. D., Nadiri, M. I., and R. Sickles (1999) “Index Number and Factor Demand Approaches to
the Estimation of Productivity,” Handbook of Applied Econometrics: Microeconometrics, pp. 14-80.
Hahn, C. (2004) “Exporting and Performance of Plants: Evidence from Korean Manufacturing,”
NBER Working Paper #10208.
Hanson, G. H., Mataloni, R.J. and M.J. Slaughter (2004), “Vertical Networks in Multinational
Firms,” mimeo.
Head, K. and J. Ries (2001), “Overseas Investment and Firm Exports,” Review of International
Economics 9, pp.108-22.
Head, K. and J. Ries (2003), “Heterogeneity and the Foreign Direct Investment versus Exports
Decision of Japanese Manufacturers,” Journal of the Japanese and International Economies 17,
pp.448-467.
Hejazi, W. and A. E. Safarian (2001), “The Complementarity Between U.S. Foreign Direct
Investment Stock and Trade,” Atlantic Economic Journal 29(4), pp. 420-437.
Helpman, E., Melitz, M. J. and S. R. Yeaples (2004), “Export versus FDI with Heterogeneous
Firms,” American Economic Review, Vol. 94, No.1, pp.300-316.
Wagner, J. (2005), “Exports, Foreign Direct Investment, and Productivity: Evidence from German
Firm Level Data,” HWWA Discussion Paper 318, Hamburg Institute of International Economics.
Lee, H. (2005), “The Decision to Invest Abroad: The Case of South Korean Multinationals,” mimeo,
Korea Institute for International Economic Policy.
Lipsey, R.E. and M.Y., Weiss (1981), “Foreign Production and Exports in Manufacturing
Industries,” Review of Economics and Statistics, May, pp.488-94.
Lipsey, R.E. and M.Y., Weiss (1984), “Foreign Production and Exports of Individual Firms,”
Review of Economics and Statistics, May, pp.304-08.
OECD (1997), Science, Technology and Industry: Scoreboard of Indicators, Paris.
22

<Figure 3.1> Outbound FDI for Korea
0
500
1000
1500
2000
2500
3000
1980 1982 1984 1986 1988 1990 1992 1994 1996 1998 2000 20020
1,000
2,000
3,000
4,000
5,000
6,000
US$Million
Number of Affiliate Total Investment
23

<Figure 3.2> Outbound FDI for Korea, by Destination
<Figure 3.3> Korea Outbound FDI in Manufacturing, by Destination
FDI Share in Whole Industries(Outstanding Invested Amount by 2003)
China19%
Japan2%
USA26%Europe
18%
Asia20%
Other15%
China Japan USA Europe Asia Other
FDI Share in Manufacturing(Outstanding Invested Amount by 2003)
China31%
Japan1%
USA21%
Europe20%
Asia20%
Other7%
China Japan USA Europe Asia Other
24

<Figure 3.4> FDI and Trade in Manufacturing
FDI Trend by Technology Level(Outstanding Invested Amount across Countries)
0
10002000
3000
4000
50006000
7000
8000
1990 1991 1992 1993 1994 1995 1996 1997 1998 1999 2000 2001 2002 2003
US$Mill ion
Export by Technology Level
0
10000
20000
30000
40000
50000
60000
1990 1991 1992 1993 1994 1995 1996 1997 1998 1999 2000 2001 2002 2003
Import by Technology Level
0
10000
20000
30000
40000
50000
1990 1991 1992 1993 1994 1995 1996 1997 1998 1999 2000 2001 2002 2003
Low Lower Middle Upper Middle High
25

<Figure 3.5 > FDI and Trade into China
FDI Trend by Technology Level(Outstanding Invested Amount to China)
0200400600800
10001200140016001800
1990 1991 1992 1993 1994 1995 1996 1997 1998 1999 2000 2001 2002 2003
US$Mill ion
Export to China by Technology Level
0
2000
4000
6000
8000
10000
12000
14000
1990 1991 1992 1993 1994 1995 1996 1997 1998 1999 2000 2001 2002 2003
Import from China by Technology Level
0500
100015002000250030003500400045005000
1990 1991 1992 1993 1994 1995 1996 1997 1998 1999 2000 2001 2002 2003
Low Lower Middle Upper Middle High
26

<Figure 3.6> FDI and Trade into the U.S.
FDI Trend by Technology Level(Outstanding Invested Amount to USA)
0
500
1000
1500
2000
2500
1990 1991 1992 1993 1994 1995 1996 1997 1998 1999 2000 2001 2002 2003
US$Million
Export to USA by Technology Level
0
2000
4000
6000
8000
10000
12000
14000
16000
1990 1991 1992 1993 1994 1995 1996 1997 1998 1999 2000 2001 2002 2003
Import from USA by Technology Level
0
2000
4000
6000
8000
10000
12000
1990 1991 1992 1993 1994 1995 1996 1997 1998 1999 2000 2001 2002 2003
Low Lower Middle Upper Middle High
27

< Table 4.1 > Relationship between FDI and Exports; OLS and 2SLS Estimations
I II III IV V VI
FDI_growthi,t-1 - 0.0047
(0.0096)
-0.0219
(0.0162)
0.0186
(0.0101)*
-0.1437
(0.0602)**
-0.2955
(0.1479)**
-0.0556
(0.0641)
Exports_growthi,t-1 - 0.1007
(0.0827)
-0.1647
(0.1031)
0.0577
(0.1016)
-0.1183
(0.9010)
-0.18380
(0.1256)
0.0448
(0.1160)
F-test
Fixed effect
Year effect
R2
No of Observations
1.99***
11.01***
0.2819
642
2.20***
5.91***
0.2663
315
1.54**
7.72***
0.3602
327
2.25***
7.80***
-
626
1.85***
2.46***
-
308
1.00
6.88***
-
318
The dependent variable is the annual growth rate of exports in sector i at year t. All growth rates are calculated as
annual changes normalized by dividing averages of beginning and ending years. Estimation results in the first three
columns are based on the OLS regression estimations and the others are on the IV estimations. The first Columns I
and IV use all samples, while columns II and V (columns III and VI) use only observations pertaining to low tech and
medium-low tech industries (medium high and high tech industries). Heteroskedasticity-consistent standard errors are
reported in brackets below parameter estimates.
28

< Table 4.2 > Regression Results for the Annual Employment Growth Rates
The values in parentheses are heteroskedasticity-robust t-statistics *: P=.10, **: P=.05, ***: P=0.01.
Annual EmploymentGrowth Rates(Li,t+1-Li,t)/Li,t
0.03687 *** 0.03687 *** 0.11128 *** 0.11148 *** 0.02678 *** 0.02677 ***
(5.36) (5.36) (3.62) (3.62) (5.54) (5.54)0.00769 *** 0.00778 *** -0.00820 *** -0.00785 *** 0.00977 *** 0.01000 ***
(7.76) (7.80) (-3.10) (-3.34) (8.75) (8.89)0.00059 *** 0.00058 *** 0.00044 ** 0.00043 ** 0.00060 *** 0.00060 ***
(9.27) (9.26) (2.40) (2.34) (8.33) (8.34)-0.06183 *** -0.06166 *** -0.51762 *** -0.50220 *** -0.07390 *** -0.07395 ***
(-55.28) (-54.89) (-5.93) (-5.94) (-72.24) (-71.63)
0.02443 *** 0.03498 *** -0.11560 -0.11330 0.01628 *** 0.02282 ***
(4.03) (6.04) (-1.41) (-1.48) (2.81) (4.13)-0.00009 *** -0.00008 *** -0.00031 -0.00051 * -0.00008 *** -0.00010 ***
(-4.51) (-3.46) (-0.98) (-1.88) (-4.23) (-4.56)0.01239 *** 0.01237 *** 0.12221 *** 0.09553 ** 0.00851 *** 0.00968 ***
(5.49) (5.67) (2.84) (2.45) (3.81) (4.59)-0.04702 *** -0.03772 *** -0.32073 *** -0.30675 *** -0.04738 *** -0.03825 ***
(-8.78) (-7.36) (-3.33) (-3.33) (-9.04) (-7.74)0.00548 0.00022 0.12216 0.10677 -0.00151 -0.00502
(1.10) (0.04) (1.32) (1.19) (-0.30) (-1.02)0.00290 -0.00005 0.03294 ***
(1.36) (-0.06) (4.80)-0.03073 *** -0.29375 * -0.03739 ***
(-3.43) (-1.84) (-4.38)-0.04706 *** -0.15898 -0.04904 ***
(-6.90) (-1.42) (-7.36)-0.00033 0.38384 -0.00355
(-0.03) (1.59) (-0.39)0.00484 * -0.00072 0.00303
(1.66) (-0.11) (0.43)-0.00214 -0.05092 0.01072
(-0.27) (-0.27) (1.43)0.03759 *** 0.37032 * 0.02926 ***
(6.25) (1.71) (4.44)0.08426 *** -0.07111 0.08836 ***
(5.39) (-0.25) (5.86)0.02966 * 0.00204 0.08791 ***
(1.80) (0.58) (5.57)-0.04214 *** -0.02383 -0.02541 ***
(-5.17) (-0.11) (-3.31)0.00833 0.23367 -0.03323 **
(0.58) (1.07) (-2.39)0.04482 *** 0.39562 0.06283 ***
(3.85) (0.94) (6.03)0.18154 *** 0.17551 *** 3.46286 *** 3.33775 *** 0.20927 *** 0.20171 ***
(25.60) (26.85) (5.69) (5.75) (31.25) (33.18)Year Dummies Yes Yes Yes Yes Yes Yes
Number of observations 476819 476819 5951 5951 470823 470823R2 adjusted 0.11718 0.11705 0.50703 0.50669 0.08715 0.08716
(Trade with China share)j,t
(Trade with Japan share)j,t
(Trade with US share)j,t
Intercept
(Import from China share)j,t
(Import from Japan share)j,t
(Import from US share)j,t
(Trade growth)j,t
(Export to China share)j,t
(Export to Japan share)j,t
(Export to US share)j,t
(Import growth)j,t
(FDI growth)j,t
(FDI to China share)j,t
(FDI to US share)j,t
(Export growth)j,t
(Sales growth)i,t
(Capital-labor ratio)j,t
I II
(Non-production workershare)i,t
(Capital-labor ratio)i,t
ln(Number of workers)i,t
(Non-production workershare)j,t
III IV V VI
29

< Table 4.3 > Regression Results for the Annual TFP Growth Rates
The values in parentheses are heteroskedasticity-robust t-statistics *: P=.10, **: P=.05, ***: P=0.01.
Annual TFPGrowth Rates
ln(TFP)i,t+1-ln(TFP)i,t
-0.54259 *** -0.53687 *** -0.36413 *** -0.34760 *** -0.54878 *** -0.54126 ***
(-276.09) (-274.21) (-19.74) (-19.18) (-269.57) (-267.39)0.01155 *** 0.01150 *** 0.00200 0.00200 0.01333 *** 0.01335 ***
(12.75) (12.60) (1.58) (1.60) (13.95) (13.80)-0.00021 *** -0.00021 *** -0.00004 *** -0.00003 ** -0.00028 *** -0.00028 ***
(-7.25) (-7.20) (-2.70) (-2.51) (-7.46) (-7.42)0.01391 *** 0.01396 *** 0.00698 * 0.00269 0.01349 *** 0.01330 ***
(27.02) (27.07) (1.66) (0.67) (24.45) (24.22)
0.03517 *** 0.02651 *** 0.02938 * 0.03565 ** 0.03686 *** 0.02810 ***
(9.88) (8.03) (1.75) (2.26) (10.07) (8.38)-0.00001 -0.00001 0.00001 0.00003 0.00000 0.00001
(-1.14) (-0.70) (0.15) (0.88) (0.22) (0.59)0.00577 *** 0.01764 *** 0.02558 *** 0.02661 *** 0.00834 *** 0.01688 ***
(4.07) (10.25) (4.05) (4.35) (5.22) (9.74)-0.02735 *** -0.05867 *** -0.09969 *** -0.08032 *** -0.02633 *** -0.05651 ***
(-8.42) (-18.91) (-5.22) (-4.32) (-8.02) (-17.99)0.01178 *** 0.01269 *** -0.03052 -0.01694 0.01867 *** 0.01318 ***
(3.81) (4.13) (-1.52) (-0.82) (5.66) (4.23)-0.00185 0.00081 ** -0.04846 ***
(-0.66) (2.06) (-7.05)0.13532 *** -0.03286 0.14890 ***
(25.14) (-0.99) (26.43)-0.11899 *** 0.09825 *** -0.12904 ***
(-29.23) (3.23) (-31.43)0.12341 *** -0.02060 0.12486 ***
(21.69) (-0.57) (21.70)0.01557 ** 0.00106 ** 0.04505 ***
(2.55) (2.04) (8.38)0.02237 *** -0.00327 0.02093 ***
(5.01) (-0.12) (4.59)-0.06058 *** -0.07558 *** -0.04665 ***
(-15.61) (-3.03) (-10.06)-0.00048 0.09788 * 0.01513
(-0.05) (1.86) (1.59)-0.00453 0.00230 *** -0.02322 ***
(-0.75) (4.54) (-4.98)0.13198 *** -0.05664 0.13074 ***
(27.86) (-1.62) (27.51)-0.03859 *** -0.07363 ** -0.02344 ***
(-6.20) (-2.21) (-4.16)0.14360 *** 0.04015 0.13696 ***
(21.86) (0.81) (20.93)0.05702 *** 0.05409 *** 0.05657 0.07484 ** 0.05081 *** 0.05276 ***
(16.73) (17.54) (1.62) (2.20) (14.29) (16.28)Year Dummies Yes Yes Yes Yes Yes Yes
Number of observations 476841 476841 5952 5952 470844 470844R2 adjusted 0.31031 0.30718 0.22868 0.22279 0.31276 0.30886
V VI
ln(TFP)i,t
(Non-production workershare)i,t
I II III IV
(Capital-labor ratio)i,t
ln(Number of workers)i,t
(Non-production workershare)j,t
(Capital-labor ratio)j,t
(FDI growth)j,t
(FDI to China share)j,t
(FDI to US share)j,t
(Export growth)j,t
(Export to China share)j,t
(Export to Japan share)j,t
(Export to US share)j,t
(Import growth)j,t
(Import from China share)j,t
(Import from Japan share)j,t
(Import from US share)j,t
(Trade growth)j,t
(Trade with China share)j,t
(Trade with Japan share)j,t
(Trade with US share)j,t
Intercept
30
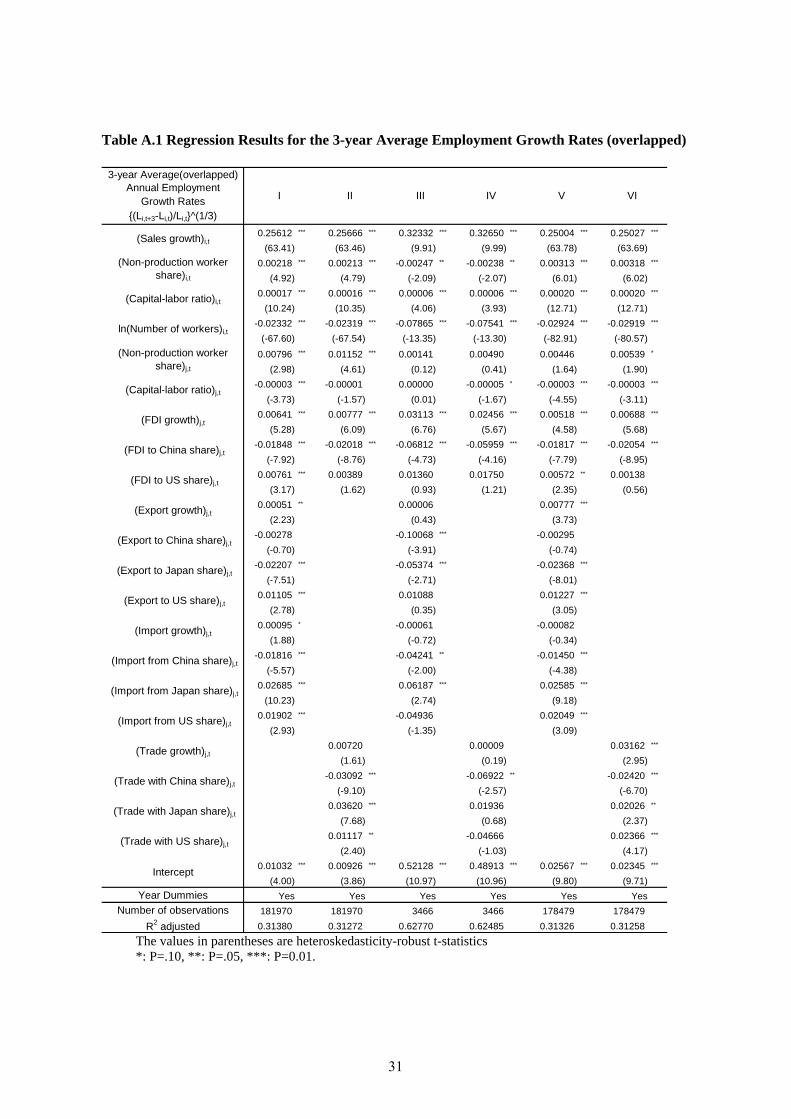
Table A.1 Regression Results for the 3-year Average Employment Growth Rates (overlapped)
The values in parentheses are heteroskedasticity-robust t-statistics *: P=.10, **: P=.05, ***: P=0.01.
3-year Average(overlapped)Annual Employment
Growth Rates{(Li,t+3-Li,t)/Li,t}^(1/3)
0.25612 *** 0.25666 *** 0.32332 *** 0.32650 *** 0.25004 *** 0.25027 ***
(63.41) (63.46) (9.91) (9.99) (63.78) (63.69)0.00218 *** 0.00213 *** -0.00247 ** -0.00238 ** 0.00313 *** 0.00318 ***
(4.92) (4.79) (-2.09) (-2.07) (6.01) (6.02)0.00017 *** 0.00016 *** 0.00006 *** 0.00006 *** 0.00020 *** 0.00020 ***
(10.24) (10.35) (4.06) (3.93) (12.71) (12.71)-0.02332 *** -0.02319 *** -0.07865 *** -0.07541 *** -0.02924 *** -0.02919 ***
(-67.60) (-67.54) (-13.35) (-13.30) (-82.91) (-80.57)
0.00796 *** 0.01152 *** 0.00141 0.00490 0.00446 0.00539 *
(2.98) (4.61) (0.12) (0.41) (1.64) (1.90)-0.00003 *** -0.00001 0.00000 -0.00005 * -0.00003 *** -0.00003 ***
(-3.73) (-1.57) (0.01) (-1.67) (-4.55) (-3.11)0.00641 *** 0.00777 *** 0.03113 *** 0.02456 *** 0.00518 *** 0.00688 ***
(5.28) (6.09) (6.76) (5.67) (4.58) (5.68)-0.01848 *** -0.02018 *** -0.06812 *** -0.05959 *** -0.01817 *** -0.02054 ***
(-7.92) (-8.76) (-4.73) (-4.16) (-7.79) (-8.95)0.00761 *** 0.00389 0.01360 0.01750 0.00572 ** 0.00138
(3.17) (1.62) (0.93) (1.21) (2.35) (0.56)0.00051 ** 0.00006 0.00777 ***
(2.23) (0.43) (3.73)-0.00278 -0.10068 *** -0.00295
(-0.70) (-3.91) (-0.74)-0.02207 *** -0.05374 *** -0.02368 ***
(-7.51) (-2.71) (-8.01)0.01105 *** 0.01088 0.01227 ***
(2.78) (0.35) (3.05)0.00095 * -0.00061 -0.00082
(1.88) (-0.72) (-0.34)-0.01816 *** -0.04241 ** -0.01450 ***
(-5.57) (-2.00) (-4.38)0.02685 *** 0.06187 *** 0.02585 ***
(10.23) (2.74) (9.18)0.01902 *** -0.04936 0.02049 ***
(2.93) (-1.35) (3.09)0.00720 0.00009 0.03162 ***
(1.61) (0.19) (2.95)-0.03092 *** -0.06922 ** -0.02420 ***
(-9.10) (-2.57) (-6.70)0.03620 *** 0.01936 0.02026 **
(7.68) (0.68) (2.37)0.01117 ** -0.04666 0.02366 ***
(2.40) (-1.03) (4.17)0.01032 *** 0.00926 *** 0.52128 *** 0.48913 *** 0.02567 *** 0.02345 ***
(4.00) (3.86) (10.97) (10.96) (9.80) (9.71)Year Dummies Yes Yes Yes Yes Yes Yes
Number of observations 181970 181970 3466 3466 178479 178479R2 adjusted 0.31380 0.31272 0.62770 0.62485 0.31326 0.31258
(Trade with China share)j,t
(Trade with Japan share)j,t
(Trade with US share)j,t
Intercept
(Import from China share)j,t
(Import from Japan share)j,t
(Import from US share)j,t
(Trade growth)j,t
(Export to China share)j,t
(Export to Japan share)j,t
(Export to US share)j,t
(Import growth)j,t
(FDI growth)j,t
(FDI to China share)j,t
(FDI to US share)j,t
(Export growth)j,t
(Sales growth)i,t
(Capital-labor ratio)j,t
I II
(Non-production workershare)i,t
(Capital-labor ratio)i,t
ln(Number of workers)i,t
(Non-production workershare)j,t
III IV V VI
31

Table A.2 Regression Results for the 3-year Average Employment Growth Rates (non-overlapped)
The values in parentheses are heteroskedasticity-robust t-statistics *: P=.10, **: P=.05, ***: P=0.01.
3-year Average(non-overlapped)
Annual Employment GrowthRates
{(Li,t+3-Li,t)/Li,t}^(1/3)0.25047 *** 0.25076 *** 0.24537 *** 0.24570 *** 0.29054 *** 0.29484 ***
(32.61) (32.58) (32.60) (32.56) (4.79) (4.84)0.00370 *** 0.00366 *** 0.00436 *** 0.00432 *** -0.00058 -0.00049
(5.25) (5.16) (5.20) (5.12) (-0.24) (-0.22)0.00018 *** 0.00018 *** 0.00021 *** 0.00020 *** 0.00001 0.00001
(9.21) (9.21) (7.81) (7.81) (1.09) (1.09)-0.02434 *** -0.02422 *** -0.02972 *** -0.02958 *** -0.08327 *** -0.07868 ***
(-45.44) (-44.81) (-50.37) (-49.57) (-7.53) (-7.41)
0.00263 0.00678 0.00092 0.00447 -0.00711 -0.00048(0.60) (1.63) (0.21) (1.05) (-0.33) (-0.02)
-0.00004 *** -0.00003 ** -0.00003 *** -0.00003 * 0.00006 -0.00001(-3.37) (-2.21) (-2.91) (-1.89) (1.17) (-0.18)
0.00735 *** 0.00892 *** 0.00592 *** 0.00781 *** 0.03822 *** 0.02607 ***
(4.23) (5.38) (3.24) (4.53) (4.79) (3.38)-0.02060 *** -0.02124 *** -0.01920 *** -0.02064 *** -0.08936 *** -0.07032 ***
(-5.44) (-5.85) (-4.95) (-5.58) (-3.74) (-3.19)0.00766 ** 0.00420 0.00663 * 0.00307 -0.00297 0.00141
(1.97) (1.08) (1.69) (0.78) (-0.12) (0.06)0.00530 * 0.00780 ** -0.00262
(1.84) (2.49) (-0.16)-0.00592 -0.00526 -0.12718 ***
(-0.93) (-0.82) (-2.86)-0.02428 *** -0.02524 *** -0.09118 ***
(-5.07) (-5.23) (-2.64)0.01648 ** 0.01618 ** 0.01577
(2.56) (2.48) (0.34)0.00031 -0.00175 -0.00172 ***
(0.59) (-0.59) (-3.57)-0.02409 *** -0.02117 *** -0.02569
(-4.56) (-3.96) (-0.65)0.02513 *** 0.02649 *** 0.07556 *
(5.65) (5.97) (1.73)0.01632 0.01609 -0.03231
(1.51) (1.47) (-0.46)0.01965 * 0.02088 * 0.00033
(1.71) (1.68) (0.01)-0.03518 *** -0.03195 *** -0.05854
(-6.19) (-5.53) (-1.36)0.02657 *** 0.02733 *** 0.01096
(2.66) (2.58) (0.21)0.01483 * 0.01792 ** -0.02490
(1.85) (2.19) (-0.34)0.03480 *** 0.03163 *** 0.04796 *** 0.04479 *** 0.57701 *** 0.52594 ***
(8.66) (8.45) (11.60) (11.67) (6.64) (6.53)Year Dummies Yes Yes Yes Yes Yes Yes
Number of observations 69874 69874 68605 68605 1263 1263R2 adjusted 0.29753 0.29638 0.29755 0.29632 0.58922 0.58436
(Trade with China share)j,t
(Trade with Japan share)j,t
(Trade with US share)j,t
Intercept
(Import from China share)j,t
(Import from Japan share)j,t
(Import from US share)j,t
(Trade growth)j,t
(Export to China share)j,t
(Export to Japan share)j,t
(Export to US share)j,t
(Import growth)j,t
(FDI growth)j,t
(FDI to China share)j,t
(FDI to US share)j,t
(Export growth)j,t
(Sales growth)i,t
(Capital-labor ratio)j,t
I II
(Non-production workershare)i,t
(Capital-labor ratio)i,t
ln(Number of workers)i,t
(Non-production workershare)j,t
III IV V VI
32

Table A.3 Regression Results for the 3-year Average TFP Growth Rates (overlapped)
The values in parentheses are heteroskedasticity-robust t-statistics *: P=.10, **: P=.05, ***: P=0.01.
3-year Average(overlapped)Annual TFP Growth Rates
ln(TFP)i,t+3-ln(TFP)i,t
-0.23131 *** -0.22984 *** -0.17538 *** -0.16195 *** -0.23379 *** -0.23181 ***
(-253.09) (-252.43) (-22.58) (-20.42) (-253.05) (-252.63)0.00488 *** 0.00485 *** 0.00037 0.00035 0.00585 *** 0.00582 ***
(9.48) (9.40) (0.86) (0.82) (11.75) (11.56)-0.00003 *** -0.00003 *** -0.00002 *** -0.00001 *** -0.00005 *** -0.00005 ***
(-5.19) (-5.10) (-2.83) (-3.46) (-6.58) (-6.55)0.00646 *** 0.00641 *** 0.00470 *** 0.00260 0.00580 *** 0.00570 ***
(27.67) (27.58) (2.69) (1.52) (22.36) (22.09)
0.02097 *** 0.01826 *** -0.00475 0.00246 0.02220 *** 0.01845 ***
(10.23) (9.69) (-0.52) (0.28) (10.48) (9.33)0.00002 *** 0.00002 *** 0.00001 0.00002 0.00002 *** 0.00003 ***
(4.72) (5.25) (0.47) (1.38) (5.10) (5.24)0.00168 ** 0.00507 *** 0.01057 *** 0.01003 *** 0.00163 ** 0.00461 ***
(2.31) (4.95) (3.87) (3.77) (2.10) (4.60)-0.01666 *** -0.02452 *** -0.05493 *** -0.04069 *** -0.01473 *** -0.02372 ***
(-9.59) (-14.00) (-5.83) (-4.41) (-8.41) (-13.46)0.00383 ** 0.00632 *** -0.01768 * -0.00989 0.00519 *** 0.00680 ***
(2.27) (3.72) (-1.71) (-0.92) (2.97) (3.94)0.00042 0.00028 -0.00908 ***
(1.41) (1.39) (-2.99)0.04676 *** -0.02548 * 0.05122 ***
(16.03) (-1.70) (16.95)-0.03096 *** 0.06618 *** -0.03581 ***
(-13.17) (4.23) (-15.03)0.03660 *** -0.01043 0.03800 ***
(11.63) (-0.56) (11.84)0.00283 *** 0.00003 0.00967 ***
(3.54) (0.16) (5.95)0.01159 *** 0.01178 0.01153 ***
(4.74) (0.91) (4.59)-0.01977 *** -0.04060 *** -0.01694 ***
(-10.34) (-3.34) (-7.70)0.01257 ** 0.09177 *** 0.01254 **
(2.51) (3.74) (2.45)0.00123 0.00087 *** -0.00219
(1.56) (4.73) (-0.68)0.04778 *** -0.01554 0.04997 ***
(18.10) (-0.87) (18.56)-0.01255 *** -0.05037 *** -0.00880 ***
(-5.00) (-3.10) (-2.59)0.04784 *** 0.04759 * 0.04609 ***
(13.01) (1.71) (11.98)0.02605 *** 0.02512 *** 0.04831 *** 0.06003 *** 0.02651 *** 0.02702 ***
(14.23) (14.65) (3.14) (4.00) (13.98) (15.33)Year Dummies Yes Yes Yes Yes Yes Yes
Number of observations 181979 181979 3467 3467 178487 178487R2 adjusted 0.41148 0.40978 0.32749 0.31203 0.41438 0.41219
(Trade with China share)j,t
(Trade with Japan share)j,t
(Trade with US share)j,t
Intercept
(Import from China share)j,t
(Import from Japan share)j,t
(Import from US share)j,t
(Trade growth)j,t
(Export to China share)j,t
(Export to Japan share)j,t
(Export to US share)j,t
(Import growth)j,t
(FDI growth)j,t
(FDI to China share)j,t
(FDI to US share)j,t
(Export growth)j,t
ln(TFP)i,t
(Capital-labor ratio)j,t
I II
(Non-production workershare)i,t
(Capital-labor ratio)i,t
ln(Number of workers)i,t
(Non-production workershare)j,t
III IV V VI
33

Table A.4 Regression Results for the 3-year Average TFP Growth Rates (non-overlapped)
The values in parentheses are heteroskedasticity-robust t-statistics *: P=.10, **: P=.05, ***: P=0.01.
3-year Average(non-overlapped)
Annual TFP Growth Ratesln(TFP)i,t+3-ln(TFP)i,t
-0.22984 *** -0.22838 *** -0.16735 *** -0.15394 *** -0.23174 *** -0.23002 ***
(-154.58) (-154.27) (-15.26) (-13.72) (-153.35) (-153.11)0.00454 *** 0.00455 *** -0.00053 -0.00052 0.00531 *** 0.00532 ***
(5.95) (5.86) (-0.87) (-0.87) (6.64) (6.50)-0.00004 *** -0.00004 *** -0.00002 *** -0.00002 ** -0.00005 *** -0.00004 ***
(-4.61) (-4.48) (-2.68) (-2.31) (-3.84) (-3.77)0.00672 *** 0.00663 *** 0.00379 0.00199 0.00595 *** 0.00585 ***
(18.36) (18.22) (1.29) (0.69) (14.43) (14.24)
0.01897 *** 0.01886 *** -0.00610 -0.00379 0.01952 *** 0.01901 ***
(5.80) (6.39) (-0.36) (-0.24) (5.83) (6.29)0.00001 0.00001 0.00000 0.00000 0.00001 0.00001
(1.10) (1.39) (0.03) (0.00) (0.90) (1.20)0.00307 ** 0.00687 *** 0.01404 *** 0.01280 *** 0.00225 * 0.00607 ***
(2.50) (5.91) (2.97) (3.08) (1.78) (5.12)-0.02040 *** -0.02530 *** -0.06412 *** -0.05745 *** -0.01820 *** -0.02398 ***
(-7.17) (-9.50) (-4.19) (-3.89) (-6.30) (-8.87)0.00368 0.00370 0.00078 0.00138 0.00351 0.00352
(1.29) (1.33) (0.04) (0.07) (1.23) (1.25)-0.00552 * -0.01898 -0.00595 **
(-1.70) (-1.35) (-2.50)0.04444 *** -0.02463 0.04653 ***
(9.31) (-0.99) (9.68)-0.03173 *** 0.06820 *** -0.03578 ***
(-8.36) (2.60) (-9.39)0.01959 *** -0.01756 0.02105 ***
(3.87) (-0.58) (4.08)0.00216 *** -0.00030 0.00472 *
(2.76) (-0.98) (1.66)0.01805 *** 0.02453 0.01857 ***
(4.57) (1.17) (4.61)-0.00853 ** -0.00019 -0.00884 ***
(-2.48) (-0.01) (-2.68)0.03654 *** 0.08806 ** 0.03468 ***
(4.49) (1.98) (4.16)0.00418 ** -0.00732 0.00439 **
(2.04) (-0.48) (2.23)0.04037 *** -0.00557 0.04263 ***
(9.59) (-0.22) (10.01)-0.00964 ** -0.01944 -0.00913 **
(-2.30) (-0.72) (-2.17)0.04035 *** 0.03479 0.04002 ***
(6.74) (0.80) (6.61)0.03164 *** 0.03303 *** 0.06504 *** 0.08289 *** 0.03269 *** 0.03443 ***
(11.84) (13.61) (2.63) (3.43) (11.80) (13.74)Year Dummies Yes Yes Yes Yes Yes Yes
Number of observations 69876 69876 1263 1263 68607 68607R2 adjusted 0.39485 0.39311 0.27877 0.26566 0.39758 0.39555
(Trade with China share)j,t
(Trade with Japan share)j,t
(Trade with US share)j,t
Intercept
(Import from China share)j,t
(Import from Japan share)j,t
(Import from US share)j,t
(Trade growth)j,t
(Export to China share)j,t
(Export to Japan share)j,t
(Export to US share)j,t
(Import growth)j,t
(FDI growth)j,t
(FDI to China share)j,t
(FDI to US share)j,t
(Export growth)j,t
(Capital-labor ratio)i,t
ln(Number of workers)i,t
(Non-production workershare)j,t
(Capital-labor ratio)j,t
V VI
ln(TFP)i,t
(Non-production workershare)i,t
I II III IV
34

Appendix:
OECD classification of Manufacturing by Technology Intensity (1997)
High-technology industries Aircraft and spacecraft Pharmaceuticals Office, accounting and computing machinery Radio, television and communication equipments
Medium-high-technology industries Electrical machinery and apparatus, n.e.c. Motor vehicles, trailers and semi-trailers Chemicals excluding pharmaceuticals Railroad equipment and transport equipment, n.e.c. Machinery and equipment, n.e.c.
Medium-low-technology industries Coke, refined petroleum products and nuclear fuel Rubber and plastic products Other non-metallic mineral products Building and repairing of ships and boats Basic metals Fabricated metal products, except machinery and equipment
Low-technology industries Manufacturing, n.e.c. and recycling Wood, pulp, paper, paper products, printing and publishing Food products, beverages and tobacco Textiles, textile products, leather and footwear
35