the economic impacts of senate bill 1 on california · artba’s transportation market intelligence...
TRANSCRIPT

The Economic Impacts of Senate Bill 1 on California
FEBRUARY 2018
Commissioned by
The California Alliance for JobsThe California Transit Association
Transportation California
Prepared by

About the AuthorsThis research was conducted for a coalition of California transportation associations – The California Alliance for Jobs, The California Transit Association and Transportation California – by the economics & research team at the Washington, D.C.-based American Road & Transportation Builders Association (ARTBA). This analysis was led by Dr. Alison Premo Black, the association’s senior vice president and chief economist. ARTBA Market Research Associate Lital Shair Nada made significant contributions to the research and analysis. Since joining ARTBA in 2000, Dr. Black has led teams and authored over 80 studies examining state transportation funding and investment patterns. Dr. Black also leads the operation of the Transportation Investment Advocacy Center ™. She has a Ph.D. in economics from the George Washington University and a master’s in international economics and Latin American Studies from the Johns Hopkins School of Advanced International Studies. Ms. Nada is pursuing a Master’s of Science in Applied Economics degree at Johns Hopkins University. She graduated magna cum laude from Brandeis University with degrees in Economics and International & Global Studies. Since joining ARTBA in 2012, Ms. Nada has authored over 25 custom reports for clients. She also manages ARTBA’s transportation market intelligence subscription reports and is assistant director for the ARTBA Research & Education Division.
About the American Road & Transportation Builders AssociationThe Washington, D.C.-based American Road & Transportation Builders Association (ARTBA) is a federation whose primary goal is to aggressively grow and protect transportation infrastructure investment to meet the public and business demand for safe and efficient travel. In support of this mission, ARTBA also provides programs and services designed to give its more than 8,000 public and private sector members a global competitive edge. ARTBA’s The Transportation Investment Advocacy Center ™ (TIAC), a first-of-its kind, dynamic education program and Internet-based information resource designed to help private citizens, legislators, organizations and businesses successfully grow transportation investment at the state and local levels through the legislative and ballot initiative processes. It’s powered by: www.transportationinvestment.org.
About The California Alliance for JobsThe California Alliance for Jobs is a unique labor-management partnership that advocates for responsible investments in public infrastructure projects. Representing over 2,000 heavy construction companies and 80,000 union construction workers, the Alliance focuses on the core of what keeps California’s people and economy moving as the state’s population grows: transportation networks, water systems, and increasing the quality of infrastructure for all Californians.
About The California Transit Association The California Transit Association is dedicated to advocating for the creation of transit-friendly policy, to protect and increase transit funding, and to support a balanced transportation system.
About Transportation CaliforniaTransportation California is a diversified, non-partisan, non-profit coalition representing a broad spectrum of business, labor, and local agencies which have united to create the state’s leading transportation advocacy and public education group. Founded in 1990, today its member companies and groups account for more than 200,000 California jobs.
Published February 2018 by the American Road & Transportation Builders Association (ARTBA). All rights reserved. No part of this document may be used or transmitted in any form or by any means, electronic, mechanical, photocopying, recording, or otherwise, without prior written permission of ARTBA.

3
TABLE OF CONTENTS
I. Executive Summary ............................................................................................................................... 4II. The Economic Impact of Transportation Investment in California ............................................7 The Economic Impacts of SB 1 .....................................................................................................7 AdditionalUserBenefitsandSavingsforCaliforniaDriversandBusinesses ............... 13 Models Used ................................................................................................................................... 16
III. Transportation Investment is Key to Economic Growth and Business Success ................. 17
IV.ChallengesFacingCalifornia’sTransportationNetwork ........................................................... 21
V.BroaderEconomicChallenges ......................................................................................................... 26
VI. The Economic Impacts of SB 1 on Major Industry Sectors ...................................................... 28 Agriculture,forestry,fishing,andhunting .............................................................................. 33 Mining ............................................................................................................................................... 34 Utilities ............................................................................................................................................. 35 Construction ................................................................................................................................... 36 Manufacturing ................................................................................................................................ 37 Wholesale trade ............................................................................................................................. 38 Retail trade ...................................................................................................................................... 39 Transportationandwarehousing ..............................................................................................40 Information .....................................................................................................................................41 Financeandinsurance ..................................................................................................................42 Realestateandrentalandleasing ............................................................................................43 Professional,scientific,andtechnicalservices......................................................................44 Managementofcompaniesandenterprises ...........................................................................45 Administrativeandwastemanagementservices ..................................................................46 Educational services .....................................................................................................................47 Health care and social assistance ..............................................................................................48 Arts,entertainment,andrecreation ..........................................................................................49 Accommodation and food services ........................................................................................... 50 Other services ................................................................................................................................ 51
MethodologyandSources ........................................................................................................................ 52
Appendix1:SupportingStudies .............................................................................................................. 55
Appendix2:SB1RevenueandExpenditure10-YearForecast ...................................................... 58
Appendix3:SB1SpendingbyType ....................................................................................................... 59
Appendix 4: Total Economic Impacts of SB 1 on California over 10 Years .................................. 60
Appendix 5: What is SB 1? ........................................................................................................................ 61
Appendix6:HowisTransportationInvestmentFundedinCalifornia? ......................................... 62
The Economic Impacts of Senate Bill 1 on California

4
The transportation investment enacted under California Senate Bill 1 (SB 1)—signed into law April 28, 2017— will support at least $182.6 billion in increased economic activity and benefits for California residents and businesses over the next 10 years, averaging $18.3 billion per year. As the investment increases during this period, SB 1 will support an additional 682,029 job-years1 throughout all sectors of the state’s economy, over the 10 years. This translates to an average of 68,203 jobs each year.
A sustained increase in California highway, street, bridge and transit investment will reduce costs for users of the transportation system, provide broad economic benefits to communities across the state and improve the quality of infrastructure.
This report quantifies how the investments made under SB 1 will create benefits for users of the transportation system as well as stimulate economic activity across all sectors of the state economy.
As repairs and upgrades are made to California’s highway, street, bridge and transit networks, drivers, businesses and transit riders will save time and money. These user benefits are a result of decreased congestion, less money spent on vehicle repairs, safer roads, and an improved infrastructure network.
n Total user benefits average $3.8 billion per year in savings for California drivers, transit riders and businesses, which will add up to $38.2 billion over 10 years. This is an annual savings of nearly $300 per household in California. Commuters will spend less time sitting in traffic and the cost of maintaining and operating their vehicles will go down as roadway conditions improve. Truck drivers will spend less time idling on congested highways and transit riders will take more trips and have greater access to goods and services.
n SB 1 will support the repair, repaving and reconstruction of over 84,000 lane miles on nearly 19,000 miles of roadway, including work on over 18,300 lane miles of urban interstate, and 7,000 lane miles of rural interstate over 10 years.
n With improved conditions, drivers will spend less money on fixing their cars and trucks. Drivers will save an average of $818 million per year in operating costs, adding up to $8.2 billion over 10 years.
n Better roads also mean safer roads. This adds up to an average of $58 million per year in additional safety benefits, or $584 million over 10 years. As crash, injury and fatality rates decline, there will be fewer costs associated with injuries, fatalities and property damage.
n Additional investment under SB 1 will enable the replacement of an additional 556 state and local bridges in the first five years of the program. This will result in 387 fewer structurally deficient or functionally obsolete bridges.
I. Executive Summary
Total Impacts of SB 1 over 10 Years
User Benefits $38.2 billion Highway, Street & Bridge $23.6 billion Transit $14.6 billionEconomic Impacts Economic Output $111.8 billion Earnings $32.6 billion Employment 682,029 job-yearsTotal Impact $182.6billion
1 A job-year of employment is defined as employment for one person during one year. Thus, this number will include people whose jobs are created/supported by SB 1 over multiple years. For example, if a person is hired in the manufacturing sector and remains in her position for five years, this is counted as five job-years.

5
The second type of benefit captures the direct, indirect and induced economic impacts of SB 1, which is measured by increases in economic output, value-added, employment, earnings, and tax revenues. The direct economic impacts of SB 1 are a result of the increased investment in road, bridge and transit construction, project support activities and transit operations. This activity generates additional indirect and induced economic impacts throughout all sectors of the economy.
How does this ripple effect work? Highway, street, bridge and transit contractors purchase inputs (such as materials) from California businesses, in addition to other firms outside of the state, as they complete work on projects. These suppliers then purchase items from other firms, creating an indirect effect.
These employees of the construction firms and supplier industries spend their earnings by purchasing clothing, food and other goods and services, thereby creating induced demand in other sectors of the state economy. As jobs are created or sustained, employees receive additional income and spend more, and businesses increase sales. Subsequently, taxes grow due to larger payroll and sales volumes, providing the state and local municipalities with additional revenues to reinvest in California.
The combined direct, indirect and induced economic impacts from SB 1 include:
n Sales and output by California businesses in all sectors will increase by $11 billion each year, totaling $111.8 billion over 10 years.
n This additional investment will support or create an additional 68,203 jobs on average each year, adding up to 682,029 job-years over 10 years.
n Those workers will earn an average of $3.3 billion per year, resulting in $32.6 billion in additional earnings over 10 years.
The additional economic activity from the implementation of SB 1 is significant—over 10 years, this will add up to $182.6 billion in additional output, earnings and user benefits, which will contribute $57.9 billion to the state gross domestic product (GSP).2
In addition to the economic impacts quantified in the report, there are additional benefits for California residents and businesses that are harder to quantify (outlined in Section III of the report), suggesting that thequantifiedbenefitsof$182.6billioninthisreportarejusttheminimum. As investment levels continue to grow under SB 1 in the future, these benefits and economic impacts will continue to improve conditions and the quality of life for the next generation.
2 GSP is the value added by an industry to the overall economy. This is the state equivalent of national Gross Domestic Product, or GDP. California’s GSP was $2.62 trillion in 2016, according to the U.S. Bureau of Economic Analysis. That is the difference between total sales and the intermediate goods. Gross output is the measure of total sales for both intermediate and final goods. California’s gross output in 2016 is estimated to be $4.52 trillion.

6
$0
$1
$2
$3
$4
$5
$6
$7
2017-2018 2018-2019 2019-2020 2020-2021 2021-2022 2022-2023 2023-2024 2024-2025 2025-2026 2026-2027
Billi
ons
SB 1 Investment over 10 Years,by Fiscal Year
Design, Engineering, Right of Way and Project Support Transit ConstructionOther Transit Activity Highway, Bridge & Street Construction
SB 1 Investment over 10 Years,by Fiscal Year

7
This report uses a series of sophisticated models to quantify both the immediate economic activity from increased highway, street, bridge and transit program spending levels under SB 1 and the longer-term user benefits that accrue from improving the transportation system. A complete description of those models can be found at the end of this section, and with more detail in the Methodology and Sources section.
The Economic Impacts of SB 1The sustained increase in California highway, street, bridge and transit investment provided by SB 1 will have significant immediate economic effects on all sectors of the state’s economy. Transportation capital investments trigger immediate economic activity that creates and sustains jobs and tax revenues, yet yield long-lived capital assets that facilitate economic growth for the next generation by providing access to jobs, services, materials and markets.
This ripple effect is felt through all sectors of the California economy – contractors purchase materials and workers spend their earnings while they work on projects, creating demand in other sectors of the state economy. As jobs are created or sustained, these employees earn more and spend more, and businesses increase sales. This results in larger payroll and sales volumes, providing the state and local municipalities with additional tax revenues to reinvest in California.
The economic activity from a sustained $5.3 billion annual increase in California’s highway, street, bridge and transit investment over the next 10 years will yield the following benefits:
n Generate nearly $11.2 billion annually in additional economic output as businesses throughout the economy sell more goods and services to both other businesses and consumers, totaling $112 billion over 10 years.
n Increase GSP by over $5.7 billion per year, adding up to $57.9 billion over 10 years.
II. The Economic Impacts of Transportation Investment in California
n Support or create an additional 68,203 jobs on average each year, with 77 percent of the employment outside of the construction industry, including an estimated 13,964 jobs in transportation and warehousing, 7,466 jobs in other services, 4,308 jobs in retail trade and 3,867 jobs in real estate and rental and leasing. This will add up to a total of 682,029 job-years supported or created by additional SB 1 spending over the next 10 years.
n These workers will earn nearly $3.3 billion in wages annually, totaling $32.6 billion over 10 years.
n $738.3 million in additional tax revenues each year, adding up to $7.4 billion over 10 years. This includes:• $22.2 million in annual state payroll taxes,
totaling $221.8 million over 10 years• $249.6 million in annual federal payroll
taxes, totaling $2.5 billion million over 10 years
• $356.2 million in annual state income taxes, totaling $3.6 billion over 10 years
• $110.4 million in annual state and local sales taxes, totaling $1.1 billion over 10 years
Overthefirst10yearsofthebill,thiswilladduptoanadditional$111.8billionineconomicoutputand682,029job-years.Theseworkerswillearnnearly$33billion.
This economic activity is driven by construction spending as well as expenditures on transit operations, planning and design work, right-of-way purchases, construction support, administration and research. Of the $53.1 billion in SB 1 spending, $27.8 billion is estimated to go toward highway, street and bridge construction, $3.2 billion toward transit construction and $5.4 billion for other transit activity. The remaining $16.6 billion of SB 1 spending will go toward planning and design work, right of way purchases and other project support activities.

8
AverageAnnualEconomicImpactsofSB1
Impacts of Highway, Bridge
and Street Construction
Impacts of Transit
Construction
Impacts of Other Transit Activity
Impacts of Design,
Engineering, Right of Way and Project Support
Total Annual Impacts
Total Output $5.5 billion $678.2 million $1.3 billion $3.7 billion $11.2 billionTotal Value Added (GSP) $2.9 billion $370.5 million $656.1 million $1.8 billion $5.8 billionEarnings $1.6 billion $225.0 million $456.2 million $1.0 billion $3.3 billionEmployment 28,421 jobs 4,302 jobs 16,950 jobs 18,529 jobs 68,203 jobsTotal Tax Revenues $344.5 million $49.2 million $135.1 million $209.6 million $738.3 million
State Payroll Tax $10.7 million $1.5 million $3.1 million $6.8 million $22.2 millionFederalPayrollTax $120.4 million $17.2 million $34.9 million $77.0 million $249.6 million
State Income Tax $157.7 million $23.4 million $84.6 million $90.6 million $356.2 million
State & Local Sales Tax $55.7 million $7.1 million $12.5 million $35.1 million $110.4 million
Sources: U.S. Bureau of Economic Analysis, U.S. Census Bureau RIMS, U.S. Department of Labor, U.S. Census Bureau County Business Patterns, California State Comptroller’s Office, California State Board of Equalization, State of California Franchise Tax Board
Total Economic Impacts of SB 1
Impacts of Highway, Bridge
and Street Construction
Impacts of Transit
Construction
Impacts of Other Transit Activity
Impacts of Design,
Engineering, Right of Way and Project Support
Total Annual Impacts
Total Output $55.3 billion $6.8 billion $12.8 billion $36.9 billion $111.8 billionTotal Value Added (GSP) $29.2 billion $3.7 billion $6.6 billion $18.4 billion $57.9 billionEarnings $15.7 billion $2.3 billion $4.6 billion $10.1 billion $32.6 billionEmployment 284,214 job-years 43,019 job-years 169,503 job-years 185,292 job-years 682,029 job-years
Total Tax Revenues $3.4 billion $492.0 million $1.4 billion $2.1 billion $7.4 billion
State Payroll Tax $107.0 million $15.3 million $31.0 million $68.5 million $221.8 million
FederalPayrollTax $1.2 billion $172.1 million $349.0 million $770.2 million $2.5 billion
State Income Tax $1.6 billion $234.0 million $845.8 million $906.0 million $3.6 billion
State & Local Sales Tax $557.0 million $70.6 million $125.0 million $351.2 million $1.1 billion

9
Mining <1%
Construction 24%
Manufacturing 5%
Wholesale trade 2%
Retail trade 6%
Transportation and warehousing
21%
Finance and insurance 3%
Real estate and rental and leasing
6%
Professional, scientific, and technical services
4%
Administrative and waste management services
5%
Educational services 1%
Health care and social assistance
5%
Accommodation and Food Services
4%
Other Industries 14%
Additional California Jobs Supported/Created by an Annual $5.3 Billion Increase in Highway, Bridge,
Street and Transit Investment Additional California Jobs Supported/Created
by SB 1 Investment

10
AverageAnnualEconomicImpactsofSB1
Industry Impact on Industry Output (in millions)
Jobs Supported/Created
Agriculture,forestry,fishing,andhunting $27.3 208
Mining $126.6 329
Utilities $102.1 132
Construction $3,382.7 15,962
Manufacturing $1,215.8 3,289
Wholesale trade $365.6 1,696
Retail trade $366.0 4,308
Transportationandwarehousing $768.5 13,964
Information $242.9 685
Financeandinsurance $526.4 2,114
Realestateandrentalandleasing $739.6 3,867
Professional,scientific,andtechnicalservices $486.2 2,967
Managementofcompaniesandenterprises $90.8 330
Administrativeandwastemanagementservices $227.1 3,197
Educational services $52.3 768
Health care and social assistance $341.6 3,219
Arts,entertainment,andrecreation $62.1 712
AccommodationandFoodServices $194.3 2,664
Other services $1,863.0 7,466
Total industry impact* $11,181.2 68,203
*Does not include impact on government output.

11
Total Economic Impacts of SB 1 over 10 Years
Industry Impact on Industry Output (in millions)
Job-Years Supported/Created
Agriculture,forestry,fishing,andhunting $272.6 2,077
Mining $1,266.3 3,290
Utilities $1,020.9 1,316
Construction $33,827.3 159,616
Manufacturing $12,157.7 32,891
Wholesale trade $3,655.9 16,957
Retail trade $3,660.3 43,076
Transportationandwarehousing $7,684.9 139,641
Information $2,429.4 6,852
Financeandinsurance $5,263.9 21,143
Realestateandrentalandleasing $7,396.0 38,674
Professional,scientific,andtechnicalservices $4,862.1 29,673
Managementofcompaniesandenterprises $907.5 3,304
Administrativeandwastemanagementservices $2,271.5 31,967
Educational services $522.7 7,677
Health care and social assistance $3,415.7 32,187
Arts,entertainment,andrecreation $620.8 7,117
AccommodationandFoodServices $1,942.6 26,641
Other services $18,630.1 74,656
Total industry impact* $111,811.9 682,029
*Does not include impact on government output.

12
Annual Impacts of SB 1 on Output and GDP
$6.00
$15.56 $25.34
$35.73
$46.81
$58.52
$70.87
$83.87
$97.52
$111.82
$3.11 $8.06 $13.12 $18.50 $24.24
$30.31 $36.70 $43.44
$50.51 $57.91
$0
$20
$40
$60
$80
$100
$120
2017-2018 2018-2019 2019-2020 2020-2021 2021-2022 2022-2023 2023-2024 2024-2025 2025-2026 2026-2027
Billi
ons
Annual Impact of SB 1 on Output and GDP
Cumulative Impact on Output Cumulative Impact on GDP
99,573160,728
224,183
291,453
362,304
436,754
514,847
596,610682,052
39,834 59,740 61,154 63,456 67,269 70,852 74,449 78,094 81,763 85,442
0
100,000
200,000
300,000
400,000
500,000
600,000
700,000
2017-2018 2018-2019 2019-2020 2020-2021 2021-2022 2022-2023 2023-2024 2024-2025 2025-2026 2026-2027
Annual Impact of SB 1 on Employment
Cumulative Employment (Job-Years) Annual Employment (Number of Jobs)
Annual Impacts of SB 1 on EmploymentJobs vs. Job-Years

13
Additional User Benefits and Savings for California Drivers and BusinessesIn addition to the immediate economic impacts from highway, street, bridge and transit investment and construction activity, California residents and businesses will gain additional savings from a safer and more efficient transportation system. The improvement in California’s transportation network will provide long term benefits for businesses and users, including improved safety, lower operating costs, reduced congestion and an increase in both mobility and efficiency.
This does not include the additional benefits of improving access to critical facilities like schools and hospitals or increases in business productivity.
Businesses will have access to a larger pool of labor, supplies and customers. An improved highway, street and bridge network will also result in lower operating costs, allowing business to increase investment in other capital outlays.
Beyond the jobs supported by the immediate highway, street and bridge construction work, the economic activity and employment for many California companies relies on the mobility provided by the highway, street and bridge system.
Without the infrastructure built, maintained and managed by California’s transportation construction industry, virtually all major industry sectors that comprise the California economy—and the local jobs they sustain—would not exist or could not function.
The higher investment levels under SB 1 will have significant user benefits for California residents and businesses over the next 10 years. Depending on the mix of projects, some of the potential benefits include:
n California drivers, transit riders and businesses will save an estimated $3.8 billion per year. This includes lower operating costs for cars and trucks, less time spent idling in traffic and congestion, safety benefits and lower maintenance costs for travel on improved roads. The benefits from transit investment include additional work and medical-related trips, transportation cost savings and greater mobility. Over 10 years, this adds up to $38.2 billion in savings that can be used for other purposes. • With improved conditions, drivers will
spend less money on fixing their cars and trucks. Drivers will save an average of $818 million per year in operating costs, adding up to $8.2 billion over 10 years, or an average savings of $310 per driver over that time period.
• As they are spending less time in congestion, annual savings will be as high as $2.6 billion per year, or $14.7 billion over 10 years. This is an average of over $550 per driver. Individuals will have more time for leisure or work-related activities.
• Better roads also mean safer roads. This adds up to an average of $58 million per year in additional safety benefits or $584 million over 10 years. As crash, injury and fatality rates decline, there will be fewer costs associated with injuries, fatalities and property damage.
• Delays in repairing roads cause costs to rise substantially. As roads are maintained and fixed before they need major reconstruction work, total maintenance costs for Caltrans and local governments will decrease by an average of $9 million per year, or $87 million over 10 years.
• Transit improvements will support cost savings and other benefits of an average of $1.5 billion per year. Over 10 years, this will add up to $14.6 billion.

14
n A more efficient transportation network will have positive impacts not only on congestion, but also on the environment. The improvements made under SB 1 will decrease emissions costs by about 31 percent. As traffic speeds increase and vehicles spend less time idling in traffic, emissions costs will decline.
n The reduced costs in travel time alone for truck drivers in California will be significant. Trucks account for 27 percent of the travel on California’s urban interstates. Additional savings under SB 1 will add up to nearly $1.6 billion per year for the 14 million trucks that use the urban interstate. That is an average cost of over $114,000 per truck, each year. That is money that businesses can use to reinvest in other capital equipment or increase employment.
n Depending on the mix of projects, this increased Caltrans spending level supported by SB 1 will support the repair, repaving and reconstruction of over 84,000 lane miles on nearly 19,000 miles of roadway. This includes work on over 18,300 lane miles of urban interstate, plus an additional 7,000 lane miles of rural interstate. Additionally, California will be able to address capacity constraints, widening existing roadways to add 13,500 lane-miles to existing right of way in order to help ease congestion.
n By accelerating bridge investment through SB 1, California will be able to make needed bridge repairs sooner, resulting in an improved bridge network and a safer drive for California residents. • Additional investment under SB 1 enables
the replacement of an additional 556 state and local bridges in the first five years of the program. This will result in 387 fewer structurally deficient or functionally obsolete bridges across the state.
• Bridge conditions will improve sooner with this additional investment, as Caltrans and local agencies will be able to address needed deck and superstructure repairs. The number of bridges with decks rated as excellent or very good will increase by 527 in the first few years of investment, and the number of bridge with excellent or very good superstructures will increase by 551.
• Overall, Caltrans and local agencies will be able to accelerate the improvement of 682 bridges across the state. When added to baseline state and local bridge investment levels, over 10 years, the implementation of SB 1 will allow a total of 2,192 state and local bridges to be improved.

15
Total Benefits of SB 1 Investment over 10 Years,by Fiscal Year
$0
$5
$10
$15
$20
$25
2017-2018 2018-2019 2019-2020 2020-2021 2021-2022 2022-2023 2023-2024 2024-2025 2025-2026 2026-2027
Bill
ions
Total Benefits of SB 1 Investment over 10 Years,by Fiscal Year
User Benefits from Highway, Street and Bridge Construction Investment
User Benefits from Transit Investment
Economic Impact: Output and Earnings

16
3 Ranhjit Doavarthy, Jeremy Mattson & Elvis Ndembe, “Cost-Benefit Analysis of Rural and Small Urban Transit,” National Center for Transit Research, North Dakota State University. Prepared for the U.S. DOT, October 2014
4 A full explanation of the RIMS-II models is available from BEA: https://www.bea.gov/regional/pdf/rims/rimsii_user_guide.pdf>.
Models UsedThe U.S. Department of Transportation’s Highway Economic Requirements System State Version (HERS-ST) model analyzes the changes in highway conditions, user costs and other key variables for roads in California under different investment scenarios.
The National Bridge Investment Analysis System (NBIAS), developed by the U.S. Federal Highway Administration (FHWA), is a modeling tool to estimate bridge performance for various budget levels. NBIAS models all bridges in the FHWA’s National Bridge Inventory, which comprises all bridges that carry traffic.
Using HERS-ST and NBIAS, we can not only examine the impact of investing at baseline levels before the implementation of SB 1 on improvements to the road and bridge network in California, but also analyze the impact of new investment levels including SB 1. The difference between these two scenarios is illustrative of the additional benefits of implementing SB 1.
A number of academic studies have created multipliers for the long-run benefits of transit investment. For this study, we use the California-specific state-wide multiplier from the National Center for Transit Research.3 They estimate that every $1 in transit spending yields $1.69 in user benefits. The authors’ benefit-cost analysis includes quantifying savings from the cost of foregone medical and work trips, emissions, crashes, travel time and vehicle ownership and operation expenses.
The economic impacts of highway, street, bridge and transit investment are analyzed using the Regional Input-Output Modeling System (RIMS-II) from the U.S. Bureau of Economic Analysis (BEA).4 The models estimate the output, employment levels, earnings and value added (contribution to state GSP) specific to industry sectors in the state. Although construction and other related activity will require some inputs and materials from other states, the model captures only the impact on California businesses.
The RIMS-II model does not include the longer term benefits to users, which are captured as part of HERS-ST, NBIAS and the transit multipliers. It is also important to note that the improvements selected by the HERS-ST and NBIAS models are based on benefit-cost ratios. This means the model will implement improvements with the greatest benefit relative to the cost. Although the exact projects selected by the California Department of Transportation (Caltrans) and local governments will likely be different, the difference between the two investment levels illustrates the differences in economic impacts.

17
California’s highway, street, bridge and transit network is integral to the success of the state economy—facilitating the shipment of over $1.5 trillion in goods produced by California businesses. The efficient and safe movement of goods and people is critical to the economic competitiveness of California and the quality of life for its citizens. Every employee, customer and business pays a price when the system is congested, unsafe or in poor condition.
In addition to spurring immediate economic growth, investment in California’s infrastructure creates tangible assets that are long-lived and facilitates economic activity for many years to come by providing access to jobs, services, materials and markets. An improved transportation network results in reduced operating costs and increased market access for California businesses. Sustained investment in highways, bridges and transit is critical to making the best use of these capital assets.
The importance of a robust transportation network has been well documented by business analysts, economists and the research community.5 Overall estimates are that every $1 increase in the highway, street and bridge capital stock generates a total of 30 cents in business savings.6
III. Transportation Investment is Key to Economic Growth and Business Success
Some of these specific benefits include:
n StayingCompetitive:The overall business environment in the United States is changing, and there is likely to be a greater importance placed on logistics and global transportation networks.7 The value of total truck freight shipments on California roads is expected increase from $1.8 trillion in 2015 to $3.9 trillion in 2045. Truck shipments of California goods for export alone are estimated to increase from $127.5 billion in 2015 to $720.3 billion—an increase of over 475 percent.8
n AccesstoLabor:A better transportation system means that it is easier for employees to get to work and businesses are able to recruit from a larger pool of potential workers. Investment in highway, street, bridge and transit allows businesses to benefit from an expanded labor pool of specialized workers, which means access to more productive employees. Investing in a high-quality transit system specifically allows density to develop and business clusters to grow.9 Downtown office district locations, which are often focused on financial services and related business sectors, usually coincide with the location of higher availability and usage of public transportation.10
5 Glen Weisbrod, Don Very, & George Treyz, “Measuring Economic Costs of Urban Traffic Congestion to Business.”
6 Nadiri, M. Ishaq and Theofanis P. Mamuneas, “Contribution of Highway Capital to Output and Productivity Growth in the U.S. Economy and Industries,” Federal Highway Administration, 1998.
7 Ronald McQuaid, Malcom Greig, Austin Smith, & James Cooper, “The Importance of Transport in Business’ Location Decisions,” January 2004, < http://stopstanstedexpansion.com/documents/sse10_appendix_9.pdf>.
8 Freight Analysis Framework
9 Daniel Graham, “Agglomeration Economies and Transport Investments,” Imperial College, December 2007.
10 Weisbrod, 20.

18
n IncreasedMarketShare&MoreCustomers: A good transportation system means that California businesses can reach a greater pool of customers. For example, if a pharmaceutical company can count on better roads for its employees and key product delivery and supply routes, the company will be able to increase employment and its market access to hospitals and other linked industries. Local industries will benefit from these larger markets and reduced transaction costs.11
n Business Expansion: California businesses will increase their output of goods and services at higher levels of investment. A modern transportation system enables business growth, expansion, and increased hiring. Reducing congestion has a demonstrable impact on shipping volume and on prices, with a rate of return of about 10 percent a year, as a conservative estimate.12 Lower transport costs also have a quantifiable effect on firm choices with respect to suppliers and relatively improve firm hiring ability.
n IncreaseinDemandforInputs:As the economy expands, businesses will purchase more goods from their suppliers and will increase their demand for private capital. This includes buying more vehicles, equipment, office supplies or even building new plants and factories.13
n ReducingProductionCosts:Economic studies show that reduced costs for inputs is one of the main business benefits from an increase in transportation investment. Typically businesses pay less for inputs when they have access to larger markets.14
n AgglomerationEconomies:Firms benefit by locating near one another, even if they are competitors. This is known as the agglomeration of market activity. This happens because a group of firms will attract a greater number of suppliers and customers than one company alone. Lower transportation costs are a key factor for agglomeration, and will be important in attracting new firms to an area.15 Increasing returns to local industries can be anticipated in areas with intermodal linkages or intra-modally, as between major highways.
Agglomeration effects are seen in public transportation as well, with clustering of economic activity around station stops. This clustering results in a smaller distance that California residents have to travel to access job opportunities. Subsequently, job seekers can expand the geographic area in which they can search for jobs, making a greater number of jobs available to them.16 Additionally, by locating near public transit, businesses save money since they can build less parking infrastructure. A Washington Metropolitan Area Transit Authority study estimates that building parking for the federal employees who take the Metro instead each day will cost the government $2.4 billion.17
11 McQuaid, 29.
12 Zhigang Li and Yu Chen, “Estimating the Social Return to Transport Infrastructure: A Price-Difference Approach Applied to a Quasi-Experiment,” 2013, Journal of Comparative Economics, Vol. 41 (3), pg. 669-683.
13 The magnitude of the effect of highway capital on output will differ by industry, with the largest difference observed between manufacturing and non-manufacturing industries.
14 It is an industry standard to use elasticities of supply and demand for materials as a measure of the impact of a change in transportation infrastructure investment. Based on a study conducted by the FHWA, the output elasticity of materials is usually the largest. The elasticity of labor and capital inputs is the second largest.
15 Jean-Paul Rodrigue, “Transport and Location,” The Geography of Transport Systems, 2017, <https://people.hofstra.edu/geotrans/eng/ch2en/conc2en/ch2c4en.html>.
16 Anthony Venables, “Evaluating Urban Transport Improvements: Cost-Benefit Analysis in the Presence of Agglomeration and Income Taxation,” September 2004.
17 “Making the Case for Transit: WMATA Regional Benefits of Transit,” WMATA, November 2011: 4.

19
n MoreEfficientOperations: With an efficient transportation system, businesses can make better decisions about their products, inputs and workforce without worrying about poor roadways or congestion. Businesses respond in a variety of ways to congestion. Some businesses may change their mix of labor and capital, reduce the daily deliveries made by a driver or serve a smaller, more specialized market. All of these adjustments can mean a loss for business productivity and market share.18
n Intra-IndustryLinkages: California industries are heavily interlinked, relying on other industries for the supply of inputs or for final processing. These linkages rely on an efficient network of well-maintained highways, roads, bridges and railways.
n FosteringInnovation:Transportation infrastructure investment is closely linked with economic competitiveness. Research suggests that highway investment results in industry growth and innovation.19 Innovation results from infrastructure better supporting business activity. Infrastructure also attracts research and development firms for the large return on investment it offers.
n AccesstoGlobalMarkets: Many California firms depend on connections to global markets. A robust and efficient transportation system makes California firms less vulnerable to economic shocks and to losing their competitive edge compared to other emerging industries. Industries also benefit from access to secondary markets, supported by a modern transportation infrastructure system.
n EmergencyManagementOperations:A well-invested transportation system will help ensure that evacuation routes remain efficient and accessible during major storms. In addition, the proper transportation investments will ensure that road networks are resilient to future super storms.
n SpilloverSavings: In addition to the cost-lowering impacts of reducing road roughness, increasing average speed, and reducing total user and travel time costs on firms, reducing congestion has a demonstrable effect on shipping volume and on prices, with a return of about 10 percent a year, as a conservative estimate.20 Lower transport costs also have a quantifiable effect on firm choices with respect to suppliers and relatively improve firm hiring ability. Reducing transportation costs will have a significant spillover effect on all industries in the state and can be expected to be reflected in relatively lowering the cost of goods within the state, for both consumers and businesses.21
Consider the benefits to a business when the state makes transportation improvements. The increase in construction activity will mean more demand for products and services in the area. A local business will sell more of its products and may even hire additional employees to increase output. With an improved transportation network, local businesses on the many main streets will thrive.
The business will also have lower distribution costs because of the improved highways, bridges and transit in the area. More customers will be able to reach the business, and the owner may be able to hire more talented, educated and skilled workers that live further away.
18 Weisbrod, 4.
19 Katherine Bell. “Investing in Infrastructure Means Investing in Innovation.” Harvard Business Review, March 2012. In 2011, researchers at the University of Texas A&M found a critical link between the forecasted growth of the industry and investment in the transportation infrastructure system, using standard supply and demand analysis (Rosson 2011)
20 Li, 669-683.
21 ICF Consulting, “Economic Effects of Transportation: The Freight Story,” 2002.

20
The increase in demand may also lead the business to expand, opening another store, plant or business location. Finally, the business will demand more inputs and raw materials from their own suppliers, creating economic ripple effects throughout the economy. The business owner may also be able to purchase cheaper inputs because they have greater access to more markets.
In addition to business benefits, households also see significant benefits from transit investment:
n ReducingHouseholdExpenditures: Research by the American Public Transportation Association (APTA) estimates that a two-car family living in a transit-rich area can eliminate one of its vehicles, saving over $9,900 a year. These savings are significant to families, and will likely shift household spending to more productive uses, which will in turn stimulate the local economy.22 The Center for Neighborhood Technology also found that households that have access to high quality public transit spend less on housing and transportation as a percentage of their income.23
In addition, Weisbrod and Reno (2009) estimate that each person traveling by public transportation generates cost savings to both themselves and drivers of $1,505 to $2,455 per year. The average public transportation user who does not drive saves about $905 per year in costs (in 2008 dollars). Additionally, non-transit users will see a benefit from reduced congestion of $1.20 to $3.10 per public transportation trip, or $600 to $1,550 per year.24
n IncreasingAccesstoJobs,ParticularlyforDisadvantagedResidents: Investment in public transportation provides better and more consistent access to jobs, particularly for service and entry level employees with limited mobility options, as well as the more than 51 million Americans with disabilities. Eighty three percent of older Americans say public transit provides them with easy access to everyday necessities.25
n TravelTimeSavingsforTransitUsers:Making improvements to transit networks will result in more direct or frequent service. This means that transit users will spend less time waiting for trains or buses, and benefit from faster travel times on their way to work or entertainment.
n BenefitsofDecreasedCongestion:Increased investment in public transportation will result in expanded service and increased utilization of transit systems. This will result in fewer cars on the roads, and therefore less congestion for households traveling by car and by bus. A reduction in congestion levels has a positive effect on air quality, the quality of life and household costs, as cars waste less gasoline by idling in traffic.
n ImprovedReliability:With less congestion, workers benefit from a more reliable commute, which is particularly important to those whose jobs depend on getting to work on time. This holds true for both transit users and those who drive to work; transit users can get to work faster and more consistently using an improved transit network, while drivers can benefit from fewer delays since there are fewer cars on the road.
22 APTA, “Commuters Who Resolve to Save Money in 2012 Take Note: Transit Riders Save More As Gas Prices Increase.”
23 “Penny Wise, Pound Foolish,” Center for Neighborhood Technology, March 2010.
24 Glen Weisbrod and Arlee Reno, “Economic Impact of Public Transportation Investment,” APTA, October 2009.
25 APTA, “Economic Recovery: Promoting Growth.”

21
California faces some of the most challenging road and bridge conditions in the country. Increasing investment to improve the safety, efficiency and conditions of the state’s highway, street and bridge network will help all system users.
n Road Conditions—According to FHWA, California has 180,800 miles of roadway.26 Of the state’s 56,758 miles of roadway eligible for federal aid, 50 percent are rated “not acceptable” and need major repairs or replacement. This is the fourth highest percentage in all 50 states.
According to the American Society of Civil Engineers, driving on California roads in need of repair costs each driver $844 per year.27
A 2016 study commissioned jointly by the League of California Cities and the California State Association of Counties uses the Pavement Condition Index (PCI) to evaluate the grade or condition of roads across the state. The PCI ranges from 0 to 100, with a score of 100 for new roads, a score over 70 for good to excellent roads, and a score of 25 or less for failed roads. This study, which captured data from over 99 percent of the California’s local roads, found that the statewide average PCI was 65, in the “at risk” category. Additionally, 52 out of the 58 California counties have either “at risk” or “poor” pavements. This rating can have significant impacts on road conditions going forward, since deterioration occurs much more quickly at that point in the pavement life cycle. And if there are delays repairing “at risk” roads, the cost of repair may rise substantially. Overall, just over half (54.8 percent) of local streets and roads are in good condition across the state.28
The state of California’s roads highlights the need for this additional investment provided by SB 1. Under 2016 funding levels, this study estimated that almost a quarter of local streets and roads would be in “failed” conditions by 2026 absent additional investment, and there would be a backlog of $59 billion. Funding would be unable to keep up with necessary investment, and the state would also see a funding shortfall of $71.3 billion for pavements and other components by that time.29
IV. Challenges Facing the California Transportation Network
26 FHWA Highway Statistics 2016 Table HM-10, <https://www.fhwa.dot.gov/policyinformation/statistics/2016/hm10.cfm>.
27 American Society of Civil Engineers, “2017 Infrastructure Report Card,” <https://www.infrastructurereportcard.org/state-item/california/>.
28 Save California Streets, “Final Report: California Statewide Local Streets and Roads Needs Assessment,” October 2016. This study was managed by the Metropolitan Transportation Commission, and other members of the Oversight Committee included: the League of California Cities; the California State Association of Counties; the County Engineers Association of California; California Regional Transportation Planning Agencies; the California Rural Counties Task Force; and the County of Los Angeles Department of Public Works.
29 Ibid.

22
n DeficientBridges— California has 25,657 roadway bridges, captured by the FHWA National Bridge Inventory (NBI) data. FHWA reports 23.6 percent of these bridges are either “structurally deficient” (1,603 bridges) or “functionally obsolete” (4,441 bridges). This is above the national average of 22 percent. Bridge owners estimate it will cost at least $12 billion to make needed bridge repairs in the state.
The Save California Streets Coalition estimates the total number of non-NBI bridges in California at 4,000, with needs ranging from $80 to $100 million.30
n Road Safety—The National Highway Traffic Safety Administration reports there were 3,357 fatal motor vehicle crashes, resulting in 3,623 fatalities, in California during 2016. Of these, 42 percent of fatalities occurred on rural roads and 28 percent occurred on the National Highway System. Motor vehicle crashes are the number one cause of death and permanently disabling injuries for young Americans under age 21.
n FreightTraffic—Inter-state truck shipments along California’s highway, street and bridge network are vital to the economic growth of the state. California businesses shipped a total of $2.22 trillion in freight in 2015. Of this total, 67 percent was shipped via truck. Truck traffic alone is expected to increase by 127 percent by 2045, reaching $3.39 trillion in value.
n TransitNeeds—Trains, buses, tracks and transit stations across California are growing older; many are approaching the end of their useful life, while transit needs are expected to continue growing. According to a report by the California Transit Association, which performed a detailed analysis of transit asset conditions in 2013, the average age of the state’s bus fleet (which makes up almost half of total transit vehicles) is 11 years, just shy of the 12 year replacement age recommended by the Federal Transit Administration. Additionally, 46 percent of buses are 12 years old or older, meaning that many will need to be replaced in the near term. The rail fleet, while older than the bus fleet, has a longer useful life, so only 13 percent of rail vehicles are older than 25 years. Additionally, components of some transit stations are in need of replacement; transit station buildings on average are slightly older than their useful lives, and station escalators are almost six years older than their useful lives, on average.31
Additionally, at 2013 funding levels, there would be more transit assets beyond their useful life in 2020 than in 2010, growing the backlog of transit capital needs. In this analysis, the California Transit Association estimates that capital projects, including preservation, service expansion and major new service (such as extending a rail line) projects, would only see 33 percent of needed funding.32
30 Ibid.
31 California Transit Association, “California’s Unmet Transit Funding Needs: Fiscal Years 2011-2020,” Jul. 13, 2013.
32 Ibid.

23
n Congestion—Traffic congestion occurs when the number of vehicles on a roadway is greater than the road was designed to handle. Traffic is not able to move at speed, and the resulting slowdowns have a ripple effect along the roadway. Traffic congestion has adverse impacts on air quality, the quality of life and business activity. In California, this can cost urban drivers anywhere from $31 to $1,711 per year.33
Air quality is affected due to increased vehicle emissions from cars and trucks stuck in traffic. Poor air quality has an impact on the health of at-risk populations, including the elderly and small children.
Personal time delays mean that commuters and other system users are behind the wheel longer, rather than spending more time at work or at leisure, impacting their quality of life. This increased traffic congestion means additional costs, which are associated with a reduced service area for business suppliers, customer markets and workforces.
A survey of business owners found that typical ways businesses deal with congestion include:34 • Costs for additional drivers and trucks due to longer travel
times• “Rescue drivers” to avoid missed deliveries due to
unexpected delays• Loss of productivity due to missed deliveries• Shift changes to allow earlier production cut off• Reduced market areas• Increased inventories• Costs for additional crews and decentralized operations to
serve the same market area• Businesses that are local can absorb the cost or pass it on• Trade-oriented businesses can respond by moving their
operations
33 Texas Transportation Institute 2015 Urban Mobility Scorecard
34 Economic Development Research Group, “The Cost of Congestion to the Economy of the Portland Region,” November 2005, <https://www.edrgroup.com/pdf/trade_trans_studies_cocreport1128final.pdf>.

24
AnnualCostofCongestioninCaliforniaCities
Urban Area
Cost Per Commuter Total Cost
Annual Hours of Delay Per Commuter
Annual Cost of Congestion Per
Commuter
Total Annual Hours of Delay (in thousands)
Total Annual Cost of Congestion
(in millions)
Los Angeles-Long Beach-Anaheim CA 80 $1,711 622,509 $13,318 San Francisco-Oakland CA 78 $1,675 146,013 $3,143 San Jose CA 67 $1,422 104,559 $2,230 Riverside-San Bernardino CA 59 $1,316 99,058 $2,201 Sacramento CA 43 $958 79,412 $1,334 San Diego CA 42 $887 60,220 $1,658 Concord CA 35 $752 21,712 $466 Mission Viejo-Lake Forest-San Clemente CA 28 $590 17,389 $361 Thousand Oaks CA 25 $527 11,823 $116 Stockton CA 18 $516 8,001 $148
Bakersfield CA 19 $512 6,656 $215
Fresno CA 23 $495 5,115 $251 Oxnard CA 23 $494 6,282 $134 Vallejo CA 21 $456 5,915 $83 Santa Cruz CA 21 $444 5,486 $82 Santa Barbara CA 20 $434 4,286 $89 Modesto CA 18 $421 4,448 $159 Santa Rosa CA 19 $407 3,993 $128 Camarillo CA 17 $368 4,181 $27 Livermore CA 16 $358 3,703 $31 Lancaster-Palmdale CA 17 $349 3,828 $88 Antioch CA 15 $347 3,806 $100 Redding CA 16 $345 3,084 $46 Santa Clarita CA 15 $341 2,037 $86 Watsonville CA 14 $315 1,980 $25 Gilroy-Morgan Hill CA 14 $311 2,093 $33 Fairfield CA 14 $303 1,890 $42 Santa Maria CA 13 $299 1,980 $43 Victorville-Hesperia CA 12 $292 1,531 $102 Yuma AZ-CA 11 $292 1,685 $41 Napa CA 13 $290 1,606 $26 Seaside-Monterey CA 13 $287 1,474 $35 Salinas CA 10 $233 1,317 $47 Yuba City CA 9 $227 1,395 $30 Merced CA 9 $218 1,212 $33
Source: Texas Transportation Institute 2015 Urban Mobility Scorecard

25
AnnualCostofCongestioninCaliforniaCities(continued)
Urban Area
Cost Per Commuter Total Cost
Annual Hours of Delay Per Commuter
Annual Cost of Congestion Per
Commuter
Total Annual Hours of Delay (in thousands)
Total Annual Cost of Congestion
(in millions)
San Luis Obispo CA 10 $218 1,229 $18 Petaluma CA 9 $201 1,178 $15 Visalia CA 8 $190 1,118 $46 Chico CA 8 $179 829 $19 Lodi CA 8 $179 822 $13 Manteca CA 7 $177 623 $16 Davis CA 7 $169 634 $13 Murrieta-Temecula-Menifee CA 7 $162 690 $72 Indio-Cathedral City CA 6 $149 665 $40 Vacaville CA 7 $143 571 $14 Lompoc CA 6 $126 553 $10 Simi Valley CA 5 $110 495 $14 El Paso de Robles-Atascadero CA 4 $106 439 $8 El Centro-Calexico CA 4 $87 440 $10 Madera CA 4 $87 314 $8 Porterville CA 3 $73 360 $6 Hemet CA 3 $62 228 $11 Tracy CA 1 $38 106 $3 Hanford CA 1 $37 111 $4 Turlock CA 1 $31 126 $3 Total California Cities 1,263,210 $27,294
Source: Texas Transportation Institute 2015 Urban Mobility Scorecard
26
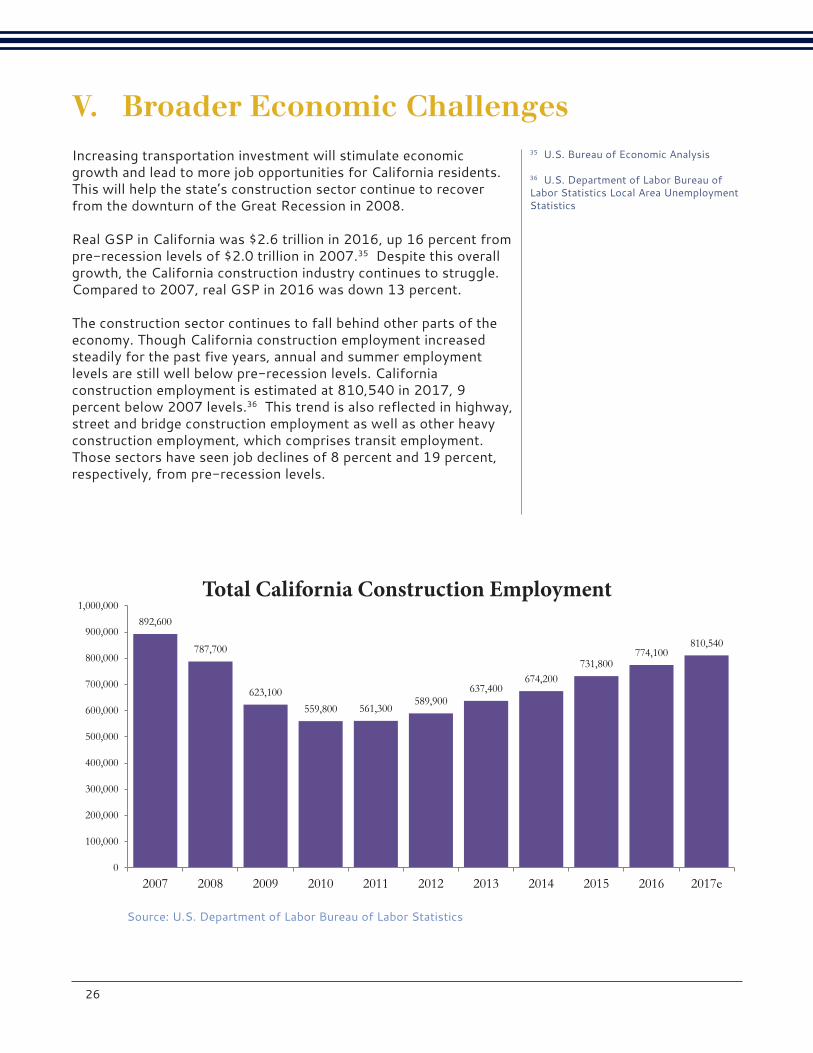
Increasing transportation investment will stimulate economic growth and lead to more job opportunities for California residents. This will help the state’s construction sector continue to recover from the downturn of the Great Recession in 2008.
Real GSP in California was $2.6 trillion in 2016, up 16 percent from pre-recession levels of $2.0 trillion in 2007.35 Despite this overall growth, the California construction industry continues to struggle. Compared to 2007, real GSP in 2016 was down 13 percent.
The construction sector continues to fall behind other parts of the economy. Though California construction employment increased steadily for the past five years, annual and summer employment levels are still well below pre-recession levels. California construction employment is estimated at 810,540 in 2017, 9 percent below 2007 levels.36 This trend is also reflected in highway, street and bridge construction employment as well as other heavy construction employment, which comprises transit employment. Those sectors have seen job declines of 8 percent and 19 percent, respectively, from pre-recession levels.
V. Broader Economic Challenges35 U.S. Bureau of Economic Analysis
36 U.S. Department of Labor Bureau of Labor Statistics Local Area Unemployment Statistics
892,600
787,700
623,100 559,800 561,300
589,900 637,400
674,200 731,800
774,100 810,540
0
100,000
200,000
300,000
400,000
500,000
600,000
700,000
800,000
900,000
1,000,000
2007 2008 2009 2010 2011 2012 2013 2014 2015 2016 2017e
Total California Construction Employment Total California Construction Employment
Source: U.S. Department of Labor Bureau of Labor Statistics

27
9,600 9,000
7,900
6,900 7,100
9,400 8,700
7,800 7,800 7,600 7,760
0
2,000
4,000
6,000
8,000
10,000
12,000
2007 2008 2009 2010 2011 2012 2013 2014 2015 2016 2017e
California Other Heavy and Civil Engineering Construction Employment
Source: U.S. Department of Labor Bureau of Labor Statistics
California Other Heavy and Civil Engineering Construction Employment
26,700
24,600
21,200 19,800 20,000
20,900 21,900 21,700
22,600 23,300 24,550
0
5,000
10,000
15,000
20,000
25,000
30,000
2007 2008 2009 2010 2011 2012 2013 2014 2015 2016 2017e
California Highway, Street, and Bridge Construction Employment California Highway, Street, and Bridge
Construction Employment
Source: U.S. Department of Labor Bureau of Labor Statistics

28
SB 1 will increase highway, street, bridge and transit investment each year, resulting in a significant immediate effect on all sectors of the state economy. This investment comprises highway, street and bridge construction, transit construction, other transit spending, and the remainder of SB 1 annual spending which goes toward construction support activities, right-of-way, planning, design, research, and administration.
The economic ripple effect of Caltrans spending on construction, transit and support activities will impact every sector in the economy. This is the demand that is created when economic activity is stimulated across the state.
In this section, the economic impacts for each component of SB 1 spending are calculated for each of the state’s 19 major industry sectors.
VI. The Economic Impacts of SB 1 on Major Industry Sectors

29
AverageAnnualEconomicImpactsofSB1Industry Output (in millions)
Industry
Impacts of Highway, Bridge
and Street Construction
Impacts of Transit
Construction
Impacts of Other Transit
Activity
Impacts of Design,
Engineering, Right of Way and Project Support
Total Annual Impacts
Agriculture, forestry, fishing, and hunting $12.5 $2.3 $3.6 $8.8 $27.3
Mining $65.7 $4.3 $15.8 $40.9 $126.6
Utilities $49.0 $6.3 $14.5 $32.4 $102.1
Construction $2,802.9 $326.9 $11.8 $241.1 $3,382.7
Manufacturing $760.9 $79.5 $136.6 $238.7 $1,215.8
Wholesale trade $210.6 $25.1 $46.5 $83.4 $365.6
Retail trade $175.0 $37.9 $41.9 $111.3 $366.0
Transportation and warehousing $116.8 $13.0 $564.6 $74.1 $768.5
Information $104.6 $15.1 $34.2 $89.0 $242.9
Finance and insurance $176.4 $24.2 $86.4 $239.4 $526.4
Real estate and rental and leasing $359.4 $47.3 $98.1 $234.8 $739.6
Professional, scientific, and technical services $167.5 $23.7 $60.9 $234.1 $486.2
Management of companies and enterprises $48.1 $6.0 $11.2 $25.4 $90.8
Administrative and waste management services $74.0 $10.3 $38.8 $104.0 $227.1
Educational services $25.0 $3.6 $7.3 $16.3 $52.3
Health care and social assistance $165.5 $23.7 $47.6 $104.8 $341.6
Arts, entertainment, and recreation $28.9 $4.2 $8.5 $20.4 $62.1
Accommodation and Food Services $91.3 $12.7 $26.1 $64.1 $194.3
Other services $91.0 $12.0 $29.4 $1,730.6 $1,863.0
Total industry impact* $5,525.5 $678.2 $1,283.8 $3,693.7 $11,181.2
*Does not include impact on government output.

30
AverageAnnualEconomicImpactsofSB1JobsSupported/Created
Industry
Impacts of Highway, Bridge
and Street Construction
Impacts of Transit
Construction
Impacts of Other Transit
Activity
Impacts of Design,
Engineering, Right of Way and Project Support
Total Annual Impacts
Agriculture, forestry, fishing, and hunting 93 20 30 65 208
Mining 198 11 33 88 329
Utilities 63 8 19 42 132
Construction 12,529 2,022 73 1,338 15,962
Manufacturing 2,071 253 273 691 3,289
Wholesale trade 977 116 216 387 1,696
Retail trade 2,056 446 494 1,312 4,308
Transportation and warehousing 737 88 12,640 499 13,964
Information 295 42 94 254 685
Finance and insurance 716 100 340 959 2,114
Real estate and rental and leasing 1,819 254 519 1,276 3,867
Professional, scientific, and technical services 1,010 141 362 1,454 2,967
Management of companies and enterprises 176 22 41 92 330
Administrative and waste management services 1,130 153 503 1,411 3,197
Educational services 373 51 102 241 768
Health care and social assistance 1,559 223 449 988 3,219
Arts, entertainment, and recreation 336 46 93 236 712
Accommodation and Food Services 1,265 171 349 879 2,664
Other services 861 112 274 6,219 7,466
Total industry impact* 28,421 4,302 16,950 18,529 68,203

31
Total Economic Impacts of SB 1 over 10 YearsIndustry Output (in millions)
Industry
Impacts of Highway, Bridge
and Street Construction
Impacts of Transit
Construction
Impacts of Other Transit
Activity
Impacts of Design,
Engineering, Right of Way and Project Support
Total Annual Impacts
Agriculture, forestry, fishing, and hunting $125.2 $23.3 $36.0 $88.1 $272.6
Mining $656.6 $43.4 $157.6 $408.7 $1,266.3
Utilities $489.6 $62.5 $144.7 $324.0 $1,020.9
Construction $28,029.4 $3,268.9 $118.4 $2,410.6 $33,827.3
Manufacturing $7,609.0 $795.4 $1,365.9 $2,387.4 $12,157.7
Wholesale trade $2,106.0 $251.1 $464.8 $834.0 $3,655.9
Retail trade $1,749.9 $378.7 $418.5 $1,113.1 $3,660.3
Transportation and warehousing $1,168.5 $129.9 $5,645.6 $741.0 $7,684.9
Information $1,046.1 $150.6 $342.2 $890.5 $2,429.4
Finance and insurance $1,763.8 $242.0 $864.0 $2,394.0 $5,263.9
Real estate and rental and leasing $3,594.4 $473.3 $980.7 $2,347.5 $7,396.0
Professional, scientific, and technical services $1,674.8 $237.5 $609.0 $2,340.9 $4,862.1
Management of companies and enterprises $481.3 $59.6 $112.4 $254.2 $907.5
Administrative and waste management services $740.0 $103.0 $388.4 $1,040.0 $2,271.5
Educational services $250.4 $36.3 $73.2 $162.8 $522.7
Health care and social assistance $1,655.3 $236.5 $475.6 $1,048.3 $3,415.7
Arts, entertainment, and recreation $289.3 $42.1 $85.0 $204.3 $620.8
Accommodation and Food Services $912.5 $127.3 $261.5 $641.3 $1,942.6
Other services $909.7 $120.2 $293.7 $17,306.5 $18,630.1
Total industry impact* $55,254.8 $6,782.1 $12,837.8 $36,937.2 $111,811.9
*Does not include impact on government output.

32
Total Economic Impacts of SB 1 over 10 YearsJob-YearsSupported/Created
Industry
Impacts of Highway, Bridge
and Street Construction
Impacts of Transit
Construction
Impacts of Other Transit
Activity
Impacts of Design,
Engineering, Right of Way and Project Support
Total Annual Impacts
Agriculture, forestry, fishing, and hunting 926 204 300 646 2,077
Mining 1,975 109 326 881 3,290
Utilities 626 81 187 422 1,316
Construction 125,294 20,217 731 13,376 159,616
Manufacturing 20,713 2,534 2,735 6,910 32,891
Wholesale trade 9,771 1,164 2,156 3,866 16,957
Retail trade 20,557 4,459 4,945 13,117 43,076
Transportation and warehousing 7,372 879 126,397 4,992 139,641
Information 2,949 416 945 2,542 6,852
Finance and insurance 7,155 1,002 3,400 9,586 21,143
Real estate and rental and leasing 18,189 2,537 5,192 12,756 38,674
Professional, scientific, and technical services 10,104 1,413 3,621 14,535 29,673
Management of companies and enterprises 1,755 217 408 924 3,304
Administrative and waste management services 11,298 1,533 5,030 14,105 31,967
Educational services 3,734 508 1,022 2,414 7,677
Health care and social assistance 15,591 2,229 4,490 9,877 32,187
Arts, entertainment, and recreation 3,361 465 934 2,357 7,117
Accommodation and Food Services 12,653 1,707 3,492 8,789 26,641
Other services 8,611 1,118 2,739 62,188 74,656
Total industry impact* 284,214 43,019 169,503 185,292 682,029
*Does not include impact on government output.

33
Increasing transportation spending from SB 1 will have positive economic impacts on this sector in two ways. The first is through direct purchases from transportation construction firms and suppliers involved in building, maintaining and operating California’s highways, bridges and transit systems. The second effect is when employees of transportation firms spend their wages and make purchases throughout the economy.
Agriculture, forestry, fishing, and huntingIncreased spending on California’s highways, bridges and transit as a result of SB 1 will generate over $273 million in output in the Agriculture, Forestry, Fishing, and Hunting sector over 10 years, supporting over 2,000 job-years.*
The average annual economic benefits of SB 1 spending on this sector include:
n Over $27 million in additional economic output
n A $13.7 million increase in gross state product (GSP)**
n Supporting or creating an additional 208 jobs. These workers will earn nearly $8 million in wages
n $1.3 million in additional tax revenues
* A job-year of employment is defined as employment for one person during one year. Thus, this number will include people whose jobs are created/supported by SB 1 over multiple years. For example, if a person is hired in this sector and remains in her position for five years, this is counted as five job-years.
** GSP is the value added by an industry to the overall economy. California’s GSP was $2.62 trillion in 2016, according to the U.S. Bureau of Economic Analysis. That is the difference between total sales and the intermediate goods. Gross output is the measure of total industry sales for both intermediate and final goods. California’s gross output in 2016 is estimated to be $4.52 trillion.
The Economic Benefits of SB 1 on …
SECTOR OVERVIEWAgriculture, forestry, fishing, and hunting contributed $36.0 billion to state economic activity in 2016, accounting for 1.4 percent of the state’s Gross State Product (GSP).** Total sales in the industry were an estimated $62.0 billion, which includes goods and services for final consumers as well as any inputs sold to other industries.
This sector includes 16,150 establishments and sole proprietorships in California with an existing payroll valued at $13.7 billion. These businesses contribute an estimated $1.1 billion in state and federal payroll taxes. Individuals working in this sector earn an average of $32,316 each year. The Agriculture, Forestry, Fishing and Hunting sector comprises establishments primarily engaged in growing crops, raising animals, harvesting timber, and harvesting fish and other animals from a farm, ranch, or their natural habitats.
AverageAnnual Impacts of SB 1
Total Economic Impacts of SB 1 over 10 Years
Industry Output $27.3 million $272.6 million
Value Added (contribution to GSP) $13.7 million $137.2 million
Employment 208 jobs 2,077 job-years
Total Payroll $7.9 million $79.3 million
Total Tax Revenues $1.3 million $13.1 million
State Payroll Tax Contribution $53.9 thousand $539.2 thousand
Federal Payroll Tax Contribution $606.6 thousand $6.1 million
State Income Tax Contribution $623.1 thousand $6.2 million
State & Local Sales Tax Contribution $24.2 thousand $242.4 thousand
Current Value CaliforniaRanking PercentageofStateTotal
Industry Output $62.0 billion 16 1.4%
Value Added (contribution to GSP) $36.0 billion 16 1.4%
Establishments 16,150 businesses 15 1.8%
Employment 423,926 jobs 13 2.9%
Average Annual Salary $32,316 17
Total Payroll $13.7 billion 17 1.6%
Total Tax Revenues $2.5 billion 17 1.2%
State Payroll Tax Contribution $93.2 million 17 1.6%
Federal Payroll Tax Contribution $1.0 billion 17 1.6%
State Income Tax Contribution $1.3 billion 17 1.6%
State & Local Sales Tax Contribution $63.5 million 17 0.1%

34
Increasing transportation spending from SB 1 will have positive economic impacts on this sector in two ways. The first is through direct purchases from transportation construction firms and suppliers involved in building, maintaining and operating California’s highways, bridges and transit systems. The second effect is when employees of transportation firms spend their wages and make purchases throughout the economy.
MiningIncreased spending on California’s highways, bridges and transit as a result of SB 1 will generate over $1 billion in output in the Mining sector over 10 years, supporting over 3,000 job-years.*
The average annual economic benefits of SB 1 spending on this sector include:
n Nearly $127 million in additional economic output
n A $85.4 million increase in gross state product (GSP)**
n Supporting or creating an additional 329 jobs. These workers will earn over $22 million in wages
n $4.9 million in additional tax revenues
* A job-year of employment is defined as employment for one person during one year. Thus, this number will include people whose jobs are created/supported by SB 1 over multiple years. For example, if a person is hired in this sector and remains in her position for five years, this is counted as five job-years.
** GSP is the value added by an industry to the overall economy. California’s GSP was $2.62 trillion in 2016, according to the U.S. Bureau of Economic Analysis. That is the difference between total sales and the intermediate goods. Gross output is the measure of total industry sales for both intermediate and final goods. California’s gross output in 2016 is estimated to be $4.52 trillion.
The Economic Benefits of SB 1 on …
SECTOR OVERVIEWMining contributed $8.3 billion to state economic activity in 2016, accounting for 0.3% of the state’s Gross State Product (GSP).** Total sales in the industry were an estimated $14.3 billion, which includes goods and services for final consumers as well as any inputs sold to other industries.
This sector includes 839 establishments and sole proprietorships in California with an existing payroll valued at $2.1 billion. These businesses contribute an estimated $178.5 million in state and federal payroll taxes. Individuals working in this sector earn an average of $87,880 each year. The Mining, Quarrying, and Oil and Gas Extraction sector comprises establishments that extract naturally occurring mineral solids, such as coal and ores; liquid minerals, such as crude petroleum; and gases, such as natural gas.
AverageAnnual Impacts of SB 1
Total Economic Impacts of SB 1 over 10 Years
Industry Output $126.6 million $1.3 billion
Value Added (contribution to GSP) $85.4 million $853.6 million
Employment 329 jobs 3,290 job-years
Total Payroll $22.3 million $223.5 million
Total Tax Revenues $4.9 million $49.4 million
State Payroll Tax Contribution $151.9 thousand $1.5 million
Federal Payroll Tax Contribution $1.7 million $17.1 million
State Income Tax Contribution $2.7 million $26.8 million
State & Local Sales Tax Contribution $398.5 thousand $4.0 million
Current Value CaliforniaRanking PercentageofStateTotal
Industry Output $14.3 billion 19 0.3%
Value Added (contribution to GSP) $8.3 billion 19 0.3%
Establishments 839 businesses 19 0.1%
Employment 24,380 jobs 19 0.2%
Average Annual Salary $87,880 6
Total Payroll $2.1 billion 19 0.2%
Total Tax Revenues $416.2 million 19 0.2%
State Payroll Tax Contribution $14.6 million 19 0.2%
Federal Payroll Tax Contribution $163.9 million 19 0.2%
State Income Tax Contribution $198.9 million 19 0.2%
State & Local Sales Tax Contribution $38.8 million 18 0.1%

35
Increasing transportation spending from SB 1 will have positive economic impacts on this sector in two ways. The first is through direct purchases from transportation construction firms and suppliers involved in building, maintaining and operating California’s highways, bridges and transit systems. The second effect is when employees of transportation firms spend their wages and make purchases throughout the economy.
UtilitiesIncreased spending on California’s highways, bridges and transit as a result of SB 1 will generate over $1 billion in output in the Utilities sector over 10 years, supporting over 1,000 job-years.*
The average annual economic benefits of SB 1 spending on this sector include:
n Over $102 million in additional economic output
n A $53.0 million increase in gross state product (GSP)**
n Supporting or creating an additional 132 jobs. These workers will earn nearly $16 million in wages
n $2.9 million in additional tax revenues
* A job-year of employment is defined as employment for one person during one year. Thus, this number will include people whose jobs are created/supported by SB 1 over multiple years. For example, if a person is hired in this sector and remains in her position for five years, this is counted as five job-years.
** GSP is the value added by an industry to the overall economy. California’s GSP was $2.62 trillion in 2016, according to the U.S. Bureau of Economic Analysis. That is the difference between total sales and the intermediate goods. Gross output is the measure of total industry sales for both intermediate and final goods. California’s gross output in 2016 is estimated to be $4.52 trillion.
The Economic Benefits of SB 1 on …
SECTOR OVERVIEWUtilities contributed $28.8 billion to state economic activity in 2016, accounting for 1.1% of the state’s Gross State Product (GSP).** Total sales in the industry were an estimated $49.5 billion, which includes goods and services for final consumers as well as any inputs sold to other industries.
This sector includes 1,219 establishments and sole proprietorships in California with an existing payroll valued at $7.3 billion. These businesses contribute an estimated $610.3 million in state and federal payroll taxes. Individuals working in this sector earn an average of $122,784 each year. The Utilities sector comprises establishments engaged in the provision of the following utility services: electric power, natural gas, steam supply, water supply, and sewage removal.
AverageAnnual Impacts of SB 1
Total Economic Impacts of SB 1 over 10 Years
Industry Output $102.1 million $1.0 billion
Value Added (contribution to GSP) $53.0 million $530.1 million
Employment 132 jobs 1,316 job-years
Total Payroll $15.7 million $156.7 million
Total Tax Revenues $2.9 million $29.3 million
State Payroll Tax Contribution $106.6 thousand $1.1 million
Federal Payroll Tax Contribution $1.2 million $12.0 million
State Income Tax Contribution $1.5 million $15.0 million
State & Local Sales Tax Contribution $126.5 thousand $1.3 million
Current Value CaliforniaRanking PercentageofStateTotal
Industry Output $49.5 billion 17 1.1%
Value Added (contribution to GSP) $28.8 billion 17 1.1%
Establishments 1,219 businesses 18 0.1%
Employment 59,668 jobs 18 0.4%
Average Annual Salary $122,784 3
Total Payroll $7.3 billion 18 0.8%
Total Tax Revenues $1.4 billion 18 0.7%
State Payroll Tax Contribution $49.8 million 18 0.8%
Federal Payroll Tax Contribution $560.5 million 18 0.8%
State Income Tax Contribution $680.2 million 18 0.8%
State & Local Sales Tax Contribution $68.6 million 16 0.1%

36
Increasing transportation spending from SB 1 will have positive economic impacts on this sector in two ways. The first is through direct purchases from transportation construction firms and suppliers involved in building, maintaining and operating California’s highways, bridges and transit systems. The second effect is when employees of transportation firms spend their wages and make purchases throughout the economy.
ConstructionIncreased spending on California’s highways, bridges and transit as a result of SB 1 will generate nearly $34 billion in output in the Construction sector over 10 years, supporting nearly 160,000 job-years.*
The average annual economic benefits of SB 1 spending on this sector include:
n Over $3 billion in additional economic output
n A $1.8 billion increase in gross state product (GSP)**
n Supporting or creating an additional 15,962 jobs. These workers will earn over $1 billion in wages
n $193.1 million in additional tax revenues
* A job-year of employment is defined as employment for one person during one year. Thus, this number will include people whose jobs are created/supported by SB 1 over multiple years. For example, if a person is hired in this sector and remains in her position for five years, this is counted as five job-years.
** GSP is the value added by an industry to the overall economy. California’s GSP was $2.62 trillion in 2016, according to the U.S. Bureau of Economic Analysis. That is the difference between total sales and the intermediate goods. Gross output is the measure of total industry sales for both intermediate and final goods. California’s gross output in 2016 is estimated to be $4.52 trillion.
The Economic Benefits of SB 1 on …
SECTOR OVERVIEWConstruction contributed $101.7 billion to state economic activity in 2016, accounting for 3.9% of the state’s Gross State Product (GSP).** Total sales in the industry were an estimated $175.1 billion, which includes goods and services for final consumers as well as any inputs sold to other industries.
This sector includes 69,900 establishments and sole proprietorships in California with an existing payroll valued at $42.5 billion. These businesses contribute an estimated $3.5 billion in state and federal payroll taxes. Individuals working in this sector earn an average of $61,946 each year. The Construction sector comprises establishments primarily engaged in the construction of buildings or engineering projects (e.g., highways and utility systems).
AverageAnnual Impacts of SB 1
Total Economic Impacts of SB 1 over 10 Years
Industry Output $3.4 billion $33.8 billion
Value Added (contribution to GSP) $1.8 billion $17.7 billion
Employment 15,962 jobs 159,616 job-years
Total Payroll $1.0 billion $10.3 billion
Total Tax Revenues $193.1 million $1.9 billion
State Payroll Tax Contribution $7.0 million $69.8 million
Federal Payroll Tax Contribution $78.5 million $785.2 million
State Income Tax Contribution $91.8 million $918.0 million
State & Local Sales Tax Contribution $15.8 million $158.0 million
Current Value CaliforniaRanking PercentageofStateTotal
Industry Output $175.1 billion 9 3.9%
Value Added (contribution to GSP) $101.7 billion 9 3.9%
Establishments 69,900 businesses 6 7.6%
Employment 686,757 jobs 8 4.7%
Average Annual Salary $61,946 9
Total Payroll $42.5 billion 10 4.8%
Total Tax Revenues $8.4 billion 10 4.1%
State Payroll Tax Contribution $289.3 million 10 4.8%
Federal Payroll Tax Contribution $3.3 billion 10 4.8%
State Income Tax Contribution $3.9 billion 10 4.8%
State & Local Sales Tax Contribution $908.2 million 6 1.8%

37
Increasing transportation spending from SB 1 will have positive economic impacts on this sector in two ways. The first is through direct purchases from transportation construction firms and suppliers involved in building, maintaining and operating California’s highways, bridges and transit systems. The second effect is when employees of transportation firms spend their wages and make purchases throughout the economy.
ManufacturingIncreased spending on California’s highways, bridges and transit as a result of SB 1 will generate over $12 billion in output in the Manufacturing sector over 10 years, supporting nearly 33,000 job-years.*
The average annual economic benefits of SB 1 spending on this sector include:
n Over $1 billion in additional economic output
n A $407.1 million increase in gross state product (GSP)**
n Supporting or creating an additional 3,289 jobs. These workers will earn nearly $224 million in wages
n $43.1 million in additional tax revenues
* A job-year of employment is defined as employment for one person during one year. Thus, this number will include people whose jobs are created/supported by SB 1 over multiple years. For example, if a person is hired in this sector and remains in her position for five years, this is counted as five job-years.
** GSP is the value added by an industry to the overall economy. California’s GSP was $2.62 trillion in 2016, according to the U.S. Bureau of Economic Analysis. That is the difference between total sales and the intermediate goods. Gross output is the measure of total industry sales for both intermediate and final goods. California’s gross output in 2016 is estimated to be $4.52 trillion.
The Economic Benefits of SB 1 on …
SECTOR OVERVIEWManufacturing contributed $291.6 billion to state economic activity in 2016, accounting for 11.1% of the state’s Gross State Product (GSP).** Total sales in the industry were an estimated $502.3 billion, which includes goods and services for final consumers as well as any inputs sold to other industries.
This sector includes 38,532 establishments and sole proprietorships in California with an existing payroll valued at $75.6 billion. These businesses contribute an estimated $6.3 billion in state and federal payroll taxes. Individuals working in this sector earn an average of $65,052 each year. The Manufacturing sector comprises establishments engaged in the mechanical, physical, or chemical transformation of materials, substances, or components into new products.
AverageAnnual Impacts of SB 1
Total Economic Impacts of SB 1 over 10 Years
Industry Output $1.2 billion $12.2 billion
Value Added (contribution to GSP) $407.1 million $4.1 billion
Employment 3,289 jobs 32,891 job-years
Total Payroll $223.7 million $2.2 billion
Total Tax Revenues $43.1 million $431.1 million
State Payroll Tax Contribution $1.5 million $15.2 million
Federal Payroll Tax Contribution $17.1 million $171.1 million
State Income Tax Contribution $19.9 million $198.6 million
State & Local Sales Tax Contribution $4.6 million $46.1 million
Current Value CaliforniaRanking PercentageofStateTotal
Industry Output $502.3 billion 2 11.1%
Value Added (contribution to GSP) $291.6 billion 2 11.1%
Establishments 38,532 businesses 11 4.2%
Employment 1,162,646 jobs 6 7.9%
Average Annual Salary $65,052 8
Total Payroll $75.6 billion 4 8.6%
Total Tax Revenues $16.6 billion 5 8.1%
State Payroll Tax Contribution $514.3 million 4 8.6%
Federal Payroll Tax Contribution $5.8 billion 4 8.6%
State Income Tax Contribution $7.0 billion 4 8.6%
State & Local Sales Tax Contribution $3.3 billion 4 6.6%

38
Increasing transportation spending from SB 1 will have positive economic impacts on this sector in two ways. The first is through direct purchases from transportation construction firms and suppliers involved in building, maintaining and operating California’s highways, bridges and transit systems. The second effect is when employees of transportation firms spend their wages and make purchases throughout the economy.
Wholesale tradeIncreased spending on California’s highways, bridges and transit as a result of SB 1 will generate nearly $4 billion in output in the Wholesale Trade sector over 10 years, supporting nearly 17,000 job-years.*
The average annual economic benefits of SB 1 spending on this sector include:
n Nearly $366 million in additional economic output
n A $247.7 million increase in gross state product (GSP)**
n Supporting or creating an additional 1,696 jobs. These workers will earn over $117 million in wages
n $33.6 million in additional tax revenues
* A job-year of employment is defined as employment for one person during one year. Thus, this number will include people whose jobs are created/supported by SB 1 over multiple years. For example, if a person is hired in this sector and remains in her position for five years, this is counted as five job-years.
** GSP is the value added by an industry to the overall economy. California’s GSP was $2.62 trillion in 2016, according to the U.S. Bureau of Economic Analysis. That is the difference between total sales and the intermediate goods. Gross output is the measure of total industry sales for both intermediate and final goods. California’s gross output in 2016 is estimated to be $4.52 trillion.
The Economic Benefits of SB 1 on …
SECTOR OVERVIEWWholesale trade contributed $142.6 billion to state economic activity in 2016, accounting for 5.4% of the state’s Gross State Product (GSP).** Total sales in the industry were an estimated $245.7 billion, which includes goods and services for final consumers as well as any inputs sold to other industries.
This sector includes 59,353 establishments and sole proprietorships in California with an existing payroll valued at $73.8 billion. These businesses contribute an estimated $6.2 billion in state and federal payroll taxes. Individuals working in this sector earn an average of $86,439 each year. The Wholesale Trade sector comprises establishments engaged in wholesaling merchandise, generally without transformation, and rendering services incidental to the sale of merchandise.
AverageAnnual Impacts of SB 1
Total Economic Impacts of SB 1 over 10 Years
Industry Output $365.6 million $3.7 billion
Value Added (contribution to GSP) $247.7 million $2.5 billion
Employment 1,696 jobs 16,957 job-years
Total Payroll $117.3 million $1.2 billion
Total Tax Revenues $33.6 million $335.6 million
State Payroll Tax Contribution $797.8 thousand $8.0 million
Federal Payroll Tax Contribution $9.0 million $89.8 million
State Income Tax Contribution $13.6 million $136.1 million
State & Local Sales Tax Contribution $10.2 million $101.8 million
Current Value CaliforniaRanking PercentageofStateTotal
Industry Output $245.7 billion 7 5.4%
Value Added (contribution to GSP) $142.6 billion 7 5.4%
Establishments 59,353 businesses 7 6.5%
Employment 854,203 jobs 7 5.8%
Average Annual Salary $86,439 7
Total Payroll $73.8 billion 5 8.4%
Total Tax Revenues $18.9 billion 3 9.2%
State Payroll Tax Contribution $502.1 million 5 8.4%
Federal Payroll Tax Contribution $5.6 billion 5 8.4%
State Income Tax Contribution $6.9 billion 5 8.4%
State & Local Sales Tax Contribution $5.9 billion 3 11.7%

39
Increasing transportation spending from SB 1 will have positive economic impacts on this sector in two ways. The first is through direct purchases from transportation construction firms and suppliers involved in building, maintaining and operating California’s highways, bridges and transit systems. The second effect is when employees of transportation firms spend their wages and make purchases throughout the economy.
Retail tradeIncreased spending on California’s highways, bridges and transit as a result of SB 1 will generate nearly $4 billion in output in the Retail Trade sector over 10 years, supporting over 43,000 job-years.*
The average annual economic benefits of SB 1 spending on this sector include:
n Over $366 million in additional economic output
n A $241.6 million increase in gross state product (GSP)**
n Supporting or creating an additional 4,308 jobs. These workers will earn over $132 million in wages
n $70.2 million in additional tax revenues
* A job-year of employment is defined as employment for one person during one year. Thus, this number will include people whose jobs are created/supported by SB 1 over multiple years. For example, if a person is hired in this sector and remains in her position for five years, this is counted as five job-years.
** GSP is the value added by an industry to the overall economy. California’s GSP was $2.62 trillion in 2016, according to the U.S. Bureau of Economic Analysis. That is the difference between total sales and the intermediate goods. Gross output is the measure of total industry sales for both intermediate and final goods. California’s gross output in 2016 is estimated to be $4.52 trillion.
The Economic Benefits of SB 1 on …
SECTOR OVERVIEWRetail trade contributed $146.4 billion to state economic activity in 2016, accounting for 5.6% of the state’s Gross State Product (GSP).** Total sales in the industry were an estimated $252.2 billion, which includes goods and services for final consumers as well as any inputs sold to other industries.
This sector includes 108,542 establishments and sole proprietorships in California with an existing payroll valued at $52.3 billion. These businesses contribute an estimated $4.4 billion in state and federal payroll taxes. Individuals working in this sector earn an average of $30,942 each year. The Retail Trade sector comprises establishments engaged in retailing merchandise, generally without transformation, and rendering services incidental to the sale of merchandise.
AverageAnnual Impacts of SB 1
Total Economic Impacts of SB 1 over 10 Years
Industry Output $366.0 million $3.7 billion
Value Added (contribution to GSP) $241.6 million $2.4 billion
Employment 4,308 jobs 43,076 job-years
Total Payroll $132.4 million $1.3 billion
Total Tax Revenues $70.2 million $702.4 million
State Payroll Tax Contribution $900.1 thousand $9.0 million
Federal Payroll Tax Contribution $10.1 million $101.3 million
State Income Tax Contribution $12.4 million $123.7 million
State & Local Sales Tax Contribution $46.8 million $468.4 million
Current Value CaliforniaRanking PercentageofStateTotal
Industry Output $252.2 billion 6 5.6%
Value Added (contribution to GSP) $146.4 billion 6 5.6%
Establishments 108,542 businesses 3 11.8%
Employment 1,690,005 jobs 2 11.5%
Average Annual Salary $30,942 18
Total Payroll $52.3 billion 8 5.9%
Total Tax Revenues $37.6 billion 1 18.3%
State Payroll Tax Contribution $355.6 million 8 5.9%
Federal Payroll Tax Contribution $4.0 billion 8 5.9%
State Income Tax Contribution $4.9 billion 8 5.9%
State & Local Sales Tax Contribution $28.4 billion 1 56.7%

40
Increasing transportation spending from SB 1 will have positive economic impacts on this sector in two ways. The first is through direct purchases from transportation construction firms and suppliers involved in building, maintaining and operating California’s highways, bridges and transit systems. The second effect is when employees of transportation firms spend their wages and make purchases throughout the economy.
Transportation and warehousingIncreased spending on California’s highways, bridges and transit as a result of SB 1 will generate nearly $8 billion in output in the Transportation and Warehousing sector over 10 years, supporting nearly 140,000 job-years.*
The average annual economic benefits of SB 1 spending on this sector include:
n Nearly $769 million in additional economic output
n A $358.7 million increase in gross state product (GSP)**
n Supporting or creating an additional 13,964 jobs. These workers will earn nearly $316 million in wages
n $94.3 million in additional tax revenues
* A job-year of employment is defined as employment for one person during one year. Thus, this number will include people whose jobs are created/supported by SB 1 over multiple years. For example, if a person is hired in this sector and remains in her position for five years, this is counted as five job-years.
** GSP is the value added by an industry to the overall economy. California’s GSP was $2.62 trillion in 2016, according to the U.S. Bureau of Economic Analysis. That is the difference between total sales and the intermediate goods. Gross output is the measure of total industry sales for both intermediate and final goods. California’s gross output in 2016 is estimated to be $4.52 trillion.
The Economic Benefits of SB 1 on …
SECTOR OVERVIEWTransportation and warehousing contributed $64.5 billion to state economic activity in 2016, accounting for 2.5% of the state’s Gross State Product (GSP).** Total sales in the industry were an estimated $111.2 billion, which includes goods and services for final consumers as well as any inputs sold to other industries.
This sector includes 23,153 establishments and sole proprietorships in California with an existing payroll valued at $25.1 billion. These businesses contribute an estimated $2.1 billion in state and federal payroll taxes. Individuals working in this sector earn an average of $51,732 each year. The Transportation and Warehousing sector includes industries providing transportation of passengers and cargo, warehousing and storage for goods, scenic and sightseeing transportation, and support activities related to modes of transportation.
AverageAnnual Impacts of SB 1
Total Economic Impacts of SB 1 over 10 Years
Industry Output $768.5 million $7.7 billion
Value Added (contribution to GSP) $358.7 million $3.6 billion
Employment 13,964 jobs 139,641 job-years
Total Payroll $315.7 million $3.2 billion
Total Tax Revenues $94.3 million $942.5 million
State Payroll Tax Contribution $2.1 million $21.5 million
Federal Payroll Tax Contribution $24.2 million $241.5 million
State Income Tax Contribution $67.1 million $670.7 million
State & Local Sales Tax Contribution $890.9 thousand $8.9 million
Current Value CaliforniaRanking PercentageofStateTotal
Industry Output $111.2 billion 12 2.5%
Value Added (contribution to GSP) $64.5 billion 12 2.5%
Establishments 23,153 businesses 13 2.5%
Employment 486,149 jobs 12 3.3%
Average Annual Salary $51,732 12
Total Payroll $25.1 billion 12 2.9%
Total Tax Revenues $4.6 billion 13 2.2%
State Payroll Tax Contribution $171.0 million 12 2.9%
Federal Payroll Tax Contribution $1.9 billion 12 2.9%
State Income Tax Contribution $2.3 billion 12 2.9%
State & Local Sales Tax Contribution $160.3 million 12 0.3%

41
Increasing transportation spending from SB 1 will have positive economic impacts on this sector in two ways. The first is through direct purchases from transportation construction firms and suppliers involved in building, maintaining and operating California’s highways, bridges and transit systems. The second effect is when employees of transportation firms spend their wages and make purchases throughout the economy.
InformationIncreased spending on California’s highways, bridges and transit as a result of SB 1 will generate over $2 billion in output in the Information sector over 10 years, supporting nearly 7,000 job-years.*
The average annual economic benefits of SB 1 spending on this sector include:
n Nearly $243 million in additional economic output
n A $138.8 million increase in gross state product (GSP)**
n Supporting or creating an additional 685 jobs. These workers will earn over $53 million in wages
n $12.8 million in additional tax revenues
* A job-year of employment is defined as employment for one person during one year. Thus, this number will include people whose jobs are created/supported by SB 1 over multiple years. For example, if a person is hired in this sector and remains in her position for five years, this is counted as five job-years.
** GSP is the value added by an industry to the overall economy. California’s GSP was $2.62 trillion in 2016, according to the U.S. Bureau of Economic Analysis. That is the difference between total sales and the intermediate goods. Gross output is the measure of total industry sales for both intermediate and final goods. California’s gross output in 2016 is estimated to be $4.52 trillion.
The Economic Benefits of SB 1 on …
SECTOR OVERVIEWInformation contributed $222.7 billion to state economic activity in 2016, accounting for 8.5% of the state’s Gross State Product (GSP).** Total sales in the industry were an estimated $383.7 billion, which includes goods and services for final consumers as well as any inputs sold to other industries.
This sector includes 22,943 establishments and sole proprietorships in California with an existing payroll valued at $85.1 billion. These businesses contribute an estimated $7.1 billion in state and federal payroll taxes. Individuals working in this sector earn an average of $124,319 each year. The Information sector comprises establishments engaged in the following processes: (a) producing and distributing information and cultural products, (b) providing the means to transmit or distribute these products as well as data or communications, and (c) processing data.
AverageAnnual Impacts of SB 1
Total Economic Impacts of SB 1 over 10 Years
Industry Output $242.9 million $2.4 billion
Value Added (contribution to GSP) $138.8 million $1.4 billion
Employment 685 jobs 6,852 job-years
Total Payroll $53.3 million $532.6 million
Total Tax Revenues $12.8 million $127.8 million
State Payroll Tax Contribution $362.2 thousand $3.6 million
Federal Payroll Tax Contribution $4.1 million $40.7 million
State Income Tax Contribution $7.9 million $79.1 million
State & Local Sales Tax Contribution $437.9 thousand $4.4 million
Current Value CaliforniaRanking PercentageofStateTotal
Industry Output $383.7 billion 3 8.5%
Value Added (contribution to GSP) $222.7 billion 3 8.5%
Establishments 22,943 businesses 14 2.5%
Employment 684,853 jobs 9 4.7%
Average Annual Salary $124,319 2
Total Payroll $85.1 billion 3 9.7%
Total Tax Revenues $15.7 billion 6 7.7%
State Payroll Tax Contribution $579.0 million 3 9.7%
Federal Payroll Tax Contribution $6.5 billion 3 9.7%
State Income Tax Contribution $7.9 billion 3 9.7%
State & Local Sales Tax Contribution $702.8 million 8 1.4%

42
Increasing transportation spending from SB 1 will have positive economic impacts on this sector in two ways. The first is through direct purchases from transportation construction firms and suppliers involved in building, maintaining and operating California’s highways, bridges and transit systems. The second effect is when employees of transportation firms spend their wages and make purchases throughout the economy.
Finance and insuranceIncreased spending on California’s highways, bridges and transit as a result of SB 1 will generate over $5 billion in output in the Finance and Insurance sector over 10 years, supporting over 21,000 job-years.*
The average annual economic benefits of SB 1 spending on this sector include:
n Over $526 million in additional economic output
n A $268.0 million increase in gross state product (GSP)**
n Supporting or creating an additional 2,114 jobs. These workers will earn nearly $144 million in wages
n $34.2 million in additional tax revenues
* A job-year of employment is defined as employment for one person during one year. Thus, this number will include people whose jobs are created/supported by SB 1 over multiple years. For example, if a person is hired in this sector and remains in her position for five years, this is counted as five job-years.
** GSP is the value added by an industry to the overall economy. California’s GSP was $2.62 trillion in 2016, according to the U.S. Bureau of Economic Analysis. That is the difference between total sales and the intermediate goods. Gross output is the measure of total industry sales for both intermediate and final goods. California’s gross output in 2016 is estimated to be $4.52 trillion.
The Economic Benefits of SB 1 on …
SECTOR OVERVIEWFinance and insurance contributed $130.1 billion to state economic activity in 2016, accounting for 5.0% of the state’s Gross State Product (GSP).** Total sales in the industry were an estimated $224.1 billion, which includes goods and services for final consumers as well as any inputs sold to other industries.
This sector includes 50,303 establishments and sole proprietorships in California with an existing payroll valued at $66.1 billion. These businesses contribute an estimated $5.5 billion in state and federal payroll taxes. Individuals working in this sector earn an average of $111,895 each year. The Finance and Insurance sector comprises establishments primarily engaged in financial transactions (transactions involving the creation, liquidation, or change in ownership of financial assets) and/or in facilitating financial transactions.
AverageAnnual Impacts of SB 1
Total Economic Impacts of SB 1 over 10 Years
Industry Output $526.4 million $5.3 billion
Value Added (contribution to GSP) $268.0 million $2.7 billion
Employment 2,114 jobs 21,143 job-years
Total Payroll $143.5 million $1.4 billion
Total Tax Revenues $34.2 million $341.8 million
State Payroll Tax Contribution $975.5 thousand $9.8 million
Federal Payroll Tax Contribution $11.0 million $109.7 million
State Income Tax Contribution $22.0 million $219.6 million
State & Local Sales Tax Contribution $266.0 thousand $2.7 million
Current Value CaliforniaRanking PercentageofStateTotal
Industry Output $224.1 billion 8 5.0%
Value Added (contribution to GSP) $130.1 billion 8 5.0%
Establishments 50,303 businesses 9 5.5%
Employment 591,037 jobs 10 4.0%
Average Annual Salary $111,895 4
Total Payroll $66.1 billion 7 7.5%
Total Tax Revenues $11.8 billion 9 5.7%
State Payroll Tax Contribution $449.7 million 7 7.5%
Federal Payroll Tax Contribution $5.1 billion 7 7.5%
State Income Tax Contribution $6.1 billion 7 7.5%
State & Local Sales Tax Contribution $129.1 million 13 0.3%

43
Increasing transportation spending from SB 1 will have positive economic impacts on this sector in two ways. The first is through direct purchases from transportation construction firms and suppliers involved in building, maintaining and operating California’s highways, bridges and transit systems. The second effect is when employees of transportation firms spend their wages and make purchases throughout the economy.
Real estate and rental and leasingIncreased spending on California’s highways, bridges and transit as a result of SB 1 will generate over $7 billion in output in the Real Estate and Rental and Leasing sector over 10 years, supporting nearly 39,000 job-years.*
The average annual economic benefits of SB 1 spending on this sector include:
n Nearly $740 million in additional economic output
n A $517.3 million increase in gross state product (GSP)**
n Supporting or creating an additional 3,867 jobs. These workers will earn over $120 million in wages
n $33.8 million in additional tax revenues
* A job-year of employment is defined as employment for one person during one year. Thus, this number will include people whose jobs are created/supported by SB 1 over multiple years. For example, if a person is hired in this sector and remains in her position for five years, this is counted as five job-years.
** GSP is the value added by an industry to the overall economy. California’s GSP was $2.62 trillion in 2016, according to the U.S. Bureau of Economic Analysis. That is the difference between total sales and the intermediate goods. Gross output is the measure of total industry sales for both intermediate and final goods. California’s gross output in 2016 is estimated to be $4.52 trillion.
The Economic Benefits of SB 1 on …
SECTOR OVERVIEWReal estate and rental and leasing contributed $441.7 billion to state economic activity in 2016, accounting for 16.8% of the state’s Gross State Product (GSP).** Total sales in the industry were an estimated $760.9 billion, which includes goods and services for final consumers as well as any inputs sold to other industries.
This sector includes 52,378 establishments and sole proprietorships in California with an existing payroll valued at $17.1 billion. These businesses contribute an estimated $1.4 billion in state and federal payroll taxes. Individuals working in this sector earn an average of $59,809 each year. The Real Estate and Rental and Leasing sector comprises establishments primarily engaged in renting, leasing, or otherwise allowing the use of tangible or intangible assets, and establishments providing related services.
AverageAnnual Impacts of SB 1
Total Economic Impacts of SB 1 over 10 Years
Industry Output $739.6 million $7.4 billion
Value Added (contribution to GSP) $517.3 million $5.2 billion
Employment 3,867 jobs 38,674 job-years
Total Payroll $120.3 million $1.2 billion
Total Tax Revenues $33.8 million $337.7 million
State Payroll Tax Contribution $818.0 thousand $8.2 million
Federal Payroll Tax Contribution $9.2 million $92.0 million
State Income Tax Contribution $21.5 million $214.7 million
State & Local Sales Tax Contribution $2.3 million $22.8 million
Current Value CaliforniaRanking PercentageofStateTotal
Industry Output $760.9 billion 1 16.8%
Value Added (contribution to GSP) $441.7 billion 1 16.8%
Establishments 52,378 businesses 8 5.7%
Employment 286,606 jobs 17 1.9%
Average Annual Salary $59,809 10
Total Payroll $17.1 billion 14 1.9%
Total Tax Revenues $5.0 billion 12 2.4%
State Payroll Tax Contribution $116.6 million 14 1.9%
Federal Payroll Tax Contribution $1.3 billion 14 1.9%
State Income Tax Contribution $1.6 billion 14 1.9%
State & Local Sales Tax Contribution $1.9 billion 5 3.9%

44
Increasing transportation spending from SB 1 will have positive economic impacts on this sector in two ways. The first is through direct purchases from transportation construction firms and suppliers involved in building, maintaining and operating California’s highways, bridges and transit systems. The second effect is when employees of transportation firms spend their wages and make purchases throughout the economy.
Professional, scientific, and technical servicesIncreased spending on California’s highways, bridges and transit as a result of SB 1 will generate nearly $5 billion in output in the Professional, Scientific, and Technical Services sector over 10 years, supporting nearly 30,000 job-years.*
The average annual economic benefits of SB 1 spending on this sector include:
n Over $486 million in additional economic output
n A $302.3 million increase in gross state product (GSP)**
n Supporting or creating an additional 2,967 jobs. These workers will earn over $216 million in wages
n $44.0 million in additional tax revenues
* A job-year of employment is defined as employment for one person during one year. Thus, this number will include people whose jobs are created/supported by SB 1 over multiple years. For example, if a person is hired in this sector and remains in her position for five years, this is counted as five job-years.
** GSP is the value added by an industry to the overall economy. California’s GSP was $2.62 trillion in 2016, according to the U.S. Bureau of Economic Analysis. That is the difference between total sales and the intermediate goods. Gross output is the measure of total industry sales for both intermediate and final goods. California’s gross output in 2016 is estimated to be $4.52 trillion.
The Economic Benefits of SB 1 on …
SECTOR OVERVIEWProfessional, scientific, and technical services contributed $218.5 billion to state economic activity in 2016, accounting for 8.3% of the state’s Gross State Product (GSP).** Total sales in the industry were an estimated $376.5 billion, which includes goods and services for final consumers as well as any inputs sold to other industries.
This sector includes 122,589 establishments and sole proprietorships in California with an existing payroll valued at $115.6 billion. These businesses contribute an estimated $9.6 billion in state and federal payroll taxes. Individuals working in this sector earn an average of $91,851 each year. The Professional, Scientific, and Technical Services sector comprises establishments that specialize in performing professional, scientific, and technical activities for others.
AverageAnnual Impacts of SB 1
Total Economic Impacts of SB 1 over 10 Years
Industry Output $486.2 million $4.9 billion
Value Added (contribution to GSP) $302.3 million $3.0 billion
Employment 2,967 jobs 29,673 job-years
Total Payroll $216.0 million $2.2 billion
Total Tax Revenues $44.0 million $439.5 million
State Payroll Tax Contribution $1.5 million $14.7 million
Federal Payroll Tax Contribution $16.5 million $165.3 million
State Income Tax Contribution $25.3 million $253.0 million
State & Local Sales Tax Contribution $654.9 thousand $6.5 million
Current Value CaliforniaRanking PercentageofStateTotal
Industry Output $376.5 billion 4 8.3%
Value Added (contribution to GSP) $218.5 billion 4 8.3%
Establishments 122,589 businesses 1 13.3%
Employment 1,258,225 jobs 5 8.5%
Average Annual Salary $91,851 5
Total Payroll $115.6 billion 1 13.1%
Total Tax Revenues $20.8 billion 2 10.2%
State Payroll Tax Contribution $785.9 million 1 13.1%
Federal Payroll Tax Contribution $8.8 billion 1 13.1%
State Income Tax Contribution $10.7 billion 1 13.1%
State & Local Sales Tax Contribution $473.5 million 9 0.9%

45
Increasing transportation spending from SB 1 will have positive economic impacts on this sector in two ways. The first is through direct purchases from transportation construction firms and suppliers involved in building, maintaining and operating California’s highways, bridges and transit systems. The second effect is when employees of transportation firms spend their wages and make purchases throughout the economy.
Management of companies and enterprisesIncreased spending on California’s highways, bridges and transit as a result of SB 1 will generate nearly $908 million in output in the Management of Companies and Enterprises sector over 10 years, supporting over 3,000 job-years.*
The average annual economic benefits of SB 1 spending on this sector include:
n Nearly $91 million in additional economic output
n A $54.5 million increase in gross state product (GSP)**
n Supporting or creating an additional 330 jobs. These workers will earn over $38 million in wages
n $7.5 million in additional tax revenues
* A job-year of employment is defined as employment for one person during one year. Thus, this number will include people whose jobs are created/supported by SB 1 over multiple years. For example, if a person is hired in this sector and remains in her position for five years, this is counted as five job-years.
** GSP is the value added by an industry to the overall economy. California’s GSP was $2.62 trillion in 2016, according to the U.S. Bureau of Economic Analysis. That is the difference between total sales and the intermediate goods. Gross output is the measure of total industry sales for both intermediate and final goods. California’s gross output in 2016 is estimated to be $4.52 trillion.
The Economic Benefits of SB 1 on …
SECTOR OVERVIEWManagement of companies and enterprises contributed $38.6 billion to state economic activity in 2016, accounting for 1.5% of the state’s Gross State Product (GSP).** Total sales in the industry were an estimated $66.5 billion, which includes goods and services for final consumers as well as any inputs sold to other industries.
This sector includes 5,308 establishments and sole proprietorships in California with an existing payroll valued at $44.3 billion. These businesses contribute an estimated $3.7 billion in state and federal payroll taxes. Individuals working in this sector earn an average of $140,343 each year. The Management of Companies and Enterprises sector comprises (1) establishments that hold the securities of (or other equity interests in) companies and enterprises for the purpose of owning a controlling interest or influencing management decisions or (2) establishments (except government establishments) that administer, oversee, and manage establishments of the company or enterprise and that normally undertake the strategic or organizational planning and decision making role of the company or enterprise.
AverageAnnual Impacts of SB 1
Total Economic Impacts of SB 1 over 10 Years
Industry Output $90.8 million $907.5 million
Value Added (contribution to GSP) $54.5 million $545.4 million
Employment 330 jobs 3,304 job-years
Total Payroll $38.1 million $381.2 million
Total Tax Revenues $7.5 million $74.9 million
State Payroll Tax Contribution $259.2 thousand $2.6 million
Federal Payroll Tax Contribution $2.9 million $29.2 million
State Income Tax Contribution $4.3 million $43.1 million
State & Local Sales Tax Contribution $6.1 thousand $61.0 thousand
Current Value CaliforniaRanking PercentageofStateTotal
Industry Output $66.5 billion 14 1.5%
Value Added (contribution to GSP) $38.6 billion 14 1.5%
Establishments 5,308 businesses 17 0.6%
Employment 315,604 jobs 16 2.1%
Average Annual Salary $140,343 1
Total Payroll $44.3 billion 9 5.0%
Total Tax Revenues $7.8 billion 11 3.8%
State Payroll Tax Contribution $301.2 million 9 5.0%
Federal Payroll Tax Contribution $3.4 billion 9 5.0%
State Income Tax Contribution $4.1 billion 9 5.0%
State & Local Sales Tax Contribution $4.3 million 19 0.01%

46
Increasing transportation spending from SB 1 will have positive economic impacts on this sector in two ways. The first is through direct purchases from transportation construction firms and suppliers involved in building, maintaining and operating California’s highways, bridges and transit systems. The second effect is when employees of transportation firms spend their wages and make purchases throughout the economy.
Administrative and waste management servicesIncreased spending on California’s highways, bridges and transit as a result of SB 1 will generate over $2 billion in output in the Administrative and Waste Management Services sector over 10 years, supporting nearly 32,000 job-years.*
The average annual economic benefits of SB 1 spending on this sector include:
n Over $227 million in additional economic output
n A $144.4 million increase in gross state product (GSP)**
n Supporting or creating an additional 3,197 jobs. These workers will earn over $99 million in wages
n $23.0 million in additional tax revenues
* A job-year of employment is defined as employment for one person during one year. Thus, this number will include people whose jobs are created/supported by SB 1 over multiple years. For example, if a person is hired in this sector and remains in her position for five years, this is counted as five job-years.
** GSP is the value added by an industry to the overall economy. California’s GSP was $2.62 trillion in 2016, according to the U.S. Bureau of Economic Analysis. That is the difference between total sales and the intermediate goods. Gross output is the measure of total industry sales for both intermediate and final goods. California’s gross output in 2016 is estimated to be $4.52 trillion.
The Economic Benefits of SB 1 on …
SECTOR OVERVIEWAdministrative and waste management services contributed $76.7 billion to state economic activity in 2016, accounting for 2.9% of the state’s Gross State Product (GSP).** Total sales in the industry were an estimated $132.0 billion, which includes goods and services for final consumers as well as any inputs sold to other industries.
This sector includes 43,631 establishments and sole proprietorships in California with an existing payroll valued at $66.7 billion. These businesses contribute an estimated $5.6 billion in state and federal payroll taxes. Individuals working in this sector earn an average of $47,994 each year. The Administrative and Support and Waste Management and Remediation Services sector comprises establishments performing routine support activities for the day-to-day operations of other organizations.
AverageAnnual Impacts of SB 1
Total Economic Impacts of SB 1 over 10 Years
Industry Output $227.1 million $2.3 billion
Value Added (contribution to GSP) $144.4 million $1.4 billion
Employment 3,197 jobs 31,967 job-years
Total Payroll $99.2 million $992.4 million
Total Tax Revenues $23.0 million $229.7 million
State Payroll Tax Contribution $674.8 thousand $6.7 million
Federal Payroll Tax Contribution $7.6 million $75.9 million
State Income Tax Contribution $14.2 million $142.4 million
State & Local Sales Tax Contribution $458.3 thousand $4.6 million
Current Value CaliforniaRanking PercentageofStateTotal
Industry Output $132.0 billion 10 2.9%
Value Added (contribution to GSP) $76.7 billion 10 2.9%
Establishments 43,631 businesses 10 4.7%
Employment 1,389,206 jobs 4 9.4%
Average Annual Salary $47,994 14
Total Payroll $66.7 billion 6 7.6%
Total Tax Revenues $12.0 billion 8 5.8%
State Payroll Tax Contribution $453.4 million 6 7.6%
Federal Payroll Tax Contribution $5.1 billion 6 7.6%
State Income Tax Contribution $6.2 billion 6 7.6%
State & Local Sales Tax Contribution $243.3 million 11 0.5%

47
Increasing transportation spending from SB 1 will have positive economic impacts on this sector in two ways. The first is through direct purchases from transportation construction firms and suppliers involved in building, maintaining and operating California’s highways, bridges and transit systems. The second effect is when employees of transportation firms spend their wages and make purchases throughout the economy.
Educational servicesIncreased spending on California’s highways, bridges and transit as a result of SB 1 will generate nearly $523 million in output in the Educational Services sector over 10 years, supporting nearly 8,000 job-years.*
The average annual economic benefits of SB 1 spending on this sector include:
n Over $52 million in additional economic output
n A $31.9 million increase in gross state product (GSP)**
n Supporting or creating an additional 768 jobs. These workers will earn nearly $25 million in wages
n $5.0 million in additional tax revenues
* A job-year of employment is defined as employment for one person during one year. Thus, this number will include people whose jobs are created/supported by SB 1 over multiple years. For example, if a person is hired in this sector and remains in her position for five years, this is counted as five job-years.
** GSP is the value added by an industry to the overall economy. California’s GSP was $2.62 trillion in 2016, according to the U.S. Bureau of Economic Analysis. That is the difference between total sales and the intermediate goods. Gross output is the measure of total industry sales for both intermediate and final goods. California’s gross output in 2016 is estimated to be $4.52 trillion.
The Economic Benefits of SB 1 on …
SECTOR OVERVIEWEducational services contributed $25.2 billion to state economic activity in 2016, accounting for 1.0% of the state’s Gross State Product (GSP).** Total sales in the industry were an estimated $43.5 billion, which includes goods and services for final consumers as well as any inputs sold to other industries.
This sector includes 13,957 establishments and sole proprietorships in California with an existing payroll valued at $16.5 billion. These businesses contribute an estimated $1.4 billion in state and federal payroll taxes. Individuals working in this sector earn an average of $39,737 each year. The Educational Services sector comprises establishments that provide instruction and training in a wide variety of subjects.
AverageAnnual Impacts of SB 1
Total Economic Impacts of SB 1 over 10 Years
Industry Output $52.3 million $522.7 million
Value Added (contribution to GSP) $31.9 million $319.4 million
Employment 768 jobs 7,677 job-years
Total Payroll $24.8 million $247.7 million
Total Tax Revenues $5.0 million $50.1 million
State Payroll Tax Contribution $168.4 thousand $1.7 million
Federal Payroll Tax Contribution $1.9 million $18.9 million
State Income Tax Contribution $2.8 million $28.3 million
State & Local Sales Tax Contribution $111.3 thousand $1.1 million
Current Value CaliforniaRanking PercentageofStateTotal
Industry Output $43.5 billion 18 1.0%
Value Added (contribution to GSP) $25.2 billion 18 1.0%
Establishments 13,957 businesses 16 1.5%
Employment 414,712 jobs 14 2.8%
Average Annual Salary $39,737 15
Total Payroll $16.5 billion 16 1.9%
Total Tax Revenues $3.0 billion 16 1.5%
State Payroll Tax Contribution $112.1 million 16 1.9%
Federal Payroll Tax Contribution $1.3 billion 16 1.9%
State Income Tax Contribution $1.5 billion 16 1.9%
State & Local Sales Tax Contribution $87.9 million 15 0.2%

48
Increasing transportation spending from SB 1 will have positive economic impacts on this sector in two ways. The first is through direct purchases from transportation construction firms and suppliers involved in building, maintaining and operating California’s highways, bridges and transit systems. The second effect is when employees of transportation firms spend their wages and make purchases throughout the economy.
Health care and social assistanceIncreased spending on California’s highways, bridges and transit as a result of SB 1 will generate over $3 billion in output in the Health Care and Social Assistance sector over 10 years, supporting over 32,000 job-years.*
The average annual economic benefits of SB 1 spending on this sector include:
n Nearly $342 million in additional economic output
n A $204.3 million increase in gross state product (GSP)**
n Supporting or creating an additional 3,219 jobs. These workers will earn over $157 million in wages
n $30.2 million in additional tax revenues
* A job-year of employment is defined as employment for one person during one year. Thus, this number will include people whose jobs are created/supported by SB 1 over multiple years. For example, if a person is hired in this sector and remains in her position for five years, this is counted as five job-years.
** GSP is the value added by an industry to the overall economy. California’s GSP was $2.62 trillion in 2016, according to the U.S. Bureau of Economic Analysis. That is the difference between total sales and the intermediate goods. Gross output is the measure of total industry sales for both intermediate and final goods. California’s gross output in 2016 is estimated to be $4.52 trillion.
The Economic Benefits of SB 1 on …
SECTOR OVERVIEWHealth care and social assistance contributed $161.6 billion to state economic activity in 2016, accounting for 6.2% of the state’s Gross State Product (GSP).** Total sales in the industry were an estimated $278.4 billion, which includes goods and services for final consumers as well as any inputs sold to other industries.
This sector includes 109,285 establishments and sole proprietorships in California with an existing payroll valued at $106.3 billion. These businesses contribute an estimated $8.9 billion in state and federal payroll taxes. Individuals working in this sector earn an average of $56,739 each year. The Health Care and Social Assistance sector comprises establishments providing health care and social assistance for individuals.
AverageAnnual Impacts of SB 1
Total Economic Impacts of SB 1 over 10 Years
Industry Output $341.6 million $3.4 billion
Value Added (contribution to GSP) $204.3 million $2.0 billion
Employment 3,219 jobs 32,187 job-years
Total Payroll $157.0 million $1.6 billion
Total Tax Revenues $30.2 million $301.6 million
State Payroll Tax Contribution $1.1 million $10.7 million
Federal Payroll Tax Contribution $12.0 million $120.1 million
State Income Tax Contribution $17.0 million $169.5 million
State & Local Sales Tax Contribution $131.6 thousand $1.3 million
Current Value CaliforniaRanking PercentageofStateTotal
Industry Output $278.4 billion 5 6.2%
Value Added (contribution to GSP) $161.6 billion 5 6.2%
Establishments 109,285 businesses 2 11.9%
Employment 1,873,857 jobs 1 12.7%
Average Annual Salary $56,739 11
Total Payroll $106.3 billion 2 12.1%
Total Tax Revenues $18.8 billion 4 9.2%
State Payroll Tax Contribution $723.0 million 2 12.1%
Federal Payroll Tax Contribution $8.1 billion 2 12.1%
State Income Tax Contribution $9.9 billion 2 12.1%
State & Local Sales Tax Contribution $104.1 million 14 0.2%

49
AverageAnnual Impacts of SB 1
Total Economic Impacts of SB 1 over 10 Years
Industry Output $62.1 million $620.8 million
Value Added (contribution to GSP) $35.8 million $358.1 million
Employment 712 jobs 7,117 job-years
Total Payroll $20.1 million $201.2 million
Total Tax Revenues $5.3 million $52.5 million
State Payroll Tax Contribution $136.8 thousand $1.4 million
Federal Payroll Tax Contribution $1.5 million $15.4 million
State Income Tax Contribution $3.3 million $33.0 million
State & Local Sales Tax Contribution $272.6 thousand $2.7 million
Increasing transportation spending from SB 1 will have positive economic impacts on this sector in two ways. The first is through direct purchases from transportation construction firms and suppliers involved in building, maintaining and operating California’s highways, bridges and transit systems. The second effect is when employees of transportation firms spend their wages and make purchases throughout the economy.
Arts, entertainment, and recreationIncreased spending on California’s highways, bridges and transit as a result of SB 1 will generate nearly $621 million in output in the Arts, Entertainment, and Recreation sector over 10 years, supporting over 7,000 job-years.*
The average annual economic benefits of SB 1 spending on this sector include:
n Over $62 million in additional economic output
n A $35.8 million increase in gross state product (GSP)**
n Supporting or creating an additional 712 jobs. These workers will earn over $20 million in wages
n $5.3 million in additional tax revenues
* A job-year of employment is defined as employment for one person during one year. Thus, this number will include people whose jobs are created/supported by SB 1 over multiple years. For example, if a person is hired in this sector and remains in her position for five years, this is counted as five job-years.
** GSP is the value added by an industry to the overall economy. California’s GSP was $2.62 trillion in 2016, according to the U.S. Bureau of Economic Analysis. That is the difference between total sales and the intermediate goods. Gross output is the measure of total industry sales for both intermediate and final goods. California’s gross output in 2016 is estimated to be $4.52 trillion.
The Economic Benefits of SB 1 on …
SECTOR OVERVIEWArts, entertainment, and recreation contributed $36.2 billion to state economic activity in 2016, accounting for 1.4% of the state’s Gross State Product (GSP).** Total sales in the industry were an estimated $62.3 billion, which includes goods and services for final consumers as well as any inputs sold to other industries.
This sector includes 23,840 establishments and sole proprietorships in California with an existing payroll valued at $16.6 billion. These businesses contribute an estimated $1.4 billion in state and federal payroll taxes. Individuals working in this sector earn an average of $50,013 each year. The Arts, Entertainment, and Recreation sector includes a wide range of establishments that operate facilities or provide services to meet varied cultural, entertainment, and recreational interests of their patrons.
Current Value CaliforniaRanking PercentageofStateTotal
Industry Output $62.3 billion 15 1.4%
Value Added (contribution to GSP) $36.2 billion 15 1.4%
Establishments 23,840 businesses 12 2.6%
Employment 332,743 jobs 15 2.3%
Average Annual Salary $50,013 13
Total Payroll $16.6 billion 15 1.9%
Total Tax Revenues $3.2 billion 15 1.6%
State Payroll Tax Contribution $113.2 million 15 1.9%
Federal Payroll Tax Contribution $1.3 billion 15 1.9%
State Income Tax Contribution $1.5 billion 15 1.9%
State & Local Sales Tax Contribution $275.5 million 10 0.6%

50
Increasing transportation spending from SB 1 will have positive economic impacts on this sector in two ways. The first is through direct purchases from transportation construction firms and suppliers involved in building, maintaining and operating California’s highways, bridges and transit systems. The second effect is when employees of transportation firms spend their wages and make purchases throughout the economy.
Accommodation and food servicesIncreased spending on California’s highways, bridges and transit as a result of SB 1 will generate nearly $2 billion in output in the Accommodation and Food Services sector over 10 years, supporting nearly 27,000 job-years.*
The average annual economic benefits of SB 1 spending on this sector include:
n Over $194 million in additional economic output
n A $108.0 million increase in gross state product (GSP)**
n Supporting or creating an additional 2,664 jobs. These workers will earn over $62 million in wages
n $19.7 million in additional tax revenues
* A job-year of employment is defined as employment for one person during one year. Thus, this number will include people whose jobs are created/supported by SB 1 over multiple years. For example, if a person is hired in this sector and remains in her position for five years, this is counted as five job-years.
** GSP is the value added by an industry to the overall economy. California’s GSP was $2.62 trillion in 2016, according to the U.S. Bureau of Economic Analysis. That is the difference between total sales and the intermediate goods. Gross output is the measure of total industry sales for both intermediate and final goods. California’s gross output in 2016 is estimated to be $4.52 trillion.
The Economic Benefits of SB 1 on …
SECTOR OVERVIEWAccommodation and food services contributed $76.0 billion to state economic activity in 2016, accounting for 2.9% of the state’s Gross State Product (GSP).** Total sales in the industry were an estimated $131.0 billion, which includes goods and services for final consumers as well as any inputs sold to other industries.
This sector includes 83,829 establishments and sole proprietorships in California with an existing payroll valued at $34.2 billion. These businesses contribute an estimated $2.9 billion in state and federal payroll taxes. Individuals working in this sector earn an average of $21,266 each year. The Accommodation and Food Services sector comprises establishments providing customers with lodging and/or reparing meals, snacks, and beverages for immediate consumption.
AverageAnnual Impacts of SB 1
Total Economic Impacts of SB 1 over 10 Years
Industry Output $194.3 million $1.9 billion
Value Added (contribution to GSP) $108.0 million $1.1 billion
Employment 2,664 jobs 26,641 job-years
Total Payroll $62.2 million $622.3 million
Total Tax Revenues $19.7 million $197.4 million
State Payroll Tax Contribution $423.2 thousand $4.2 million
Federal Payroll Tax Contribution $4.8 million $47.6 million
State Income Tax Contribution $5.3 million $52.6 million
State & Local Sales Tax Contribution $9.3 million $92.9 million
Current Value CaliforniaRanking PercentageofStateTotal
Industry Output $131.0 billion 11 2.9%
Value Added (contribution to GSP) $76.0 billion 11 2.9%
Establishments 83,829 businesses 4 9.1%
Employment 1,609,306 jobs 3 10.9%
Average Annual Salary $21,266 19
Total Payroll $34.2 billion 11 3.9%
Total Tax Revenues $12.6 billion 7 6.1%
State Payroll Tax Contribution $232.7 million 11 3.9%
Federal Payroll Tax Contribution $2.6 billion 11 3.9%
State Income Tax Contribution $3.2 billion 11 3.9%
State & Local Sales Tax Contribution $6.5 billion 2 13.1%

51
Increasing transportation spending from SB 1 will have positive economic impacts on this sector in two ways. The first is through direct purchases from transportation construction firms and suppliers involved in building, maintaining and operating California’s highways, bridges and transit systems. The second effect is when employees of transportation firms spend their wages and make purchases throughout the economy.
Other servicesIncreased spending on California’s highways, bridges and transit as a result of SB 1 will generate nearly $19 billion in output in the Other Services sector over 10 years, supporting nearly 75,000 job-years.*
The average annual economic benefits of SB 1 spending on this sector include:
n Nearly $2 billion in additional economic output
n A $806.3 million increase in gross state product (GSP)**
n Supporting or creating an additional 7,466 jobs. These workers will earn over $462 million in wages
n $72.3 million in additional tax revenues
* A job-year of employment is defined as employment for one person during one year. Thus, this number will include people whose jobs are created/supported by SB 1 over multiple years. For example, if a person is hired in this sector and remains in her position for five years, this is counted as five job-years.
** GSP is the value added by an industry to the overall economy. California’s GSP was $2.62 trillion in 2016, according to the U.S. Bureau of Economic Analysis. That is the difference between total sales and the intermediate goods. Gross output is the measure of total industry sales for both intermediate and final goods. California’s gross output in 2016 is estimated to be $4.52 trillion.
The Economic Benefits of SB 1 on …
SECTOR OVERVIEWOther services contributed $56.2 billion to state economic activity in 2016, accounting for 2.1% of the state’s Gross State Product (GSP).** Total sales in the industry were an estimated $96.8 billion, which includes goods and services for final consumers as well as any inputs sold to other industries.
This sector includes 73,293 establishments and sole proprietorships in California with an existing payroll valued at $19.2 billion. These businesses contribute an estimated $1.6 billion in state and federal payroll taxes. Individuals working in this sector earn an average of $33,407 each year. The Other Services (except Public Administration) sector comprises establishments engaged in providing services not specifically provided for elsewhere in the classification system, including equipment and machinery repairing, promoting or administering religious activities, grantmaking, advocacy, drycleaning and laundry services, personal care services, death care services, pet care services, photofinishing services, temporary parking services, and dating services.
AverageAnnual Impacts of SB 1
Total Economic Impacts of SB 1 over 10 Years
Industry Output $1.9 billion $18.6 billion
Value Added (contribution to GSP) $806.3 million $8.1 billion
Employment 7,466 jobs 74,656 job-years
Total Payroll $462.2 million $4.6 billion
Total Tax Revenues $72.3 million $722.6 million
State Payroll Tax Contribution $3.1 million $31.4 million
Federal Payroll Tax Contribution $35.4 million $353.6 million
State Income Tax Contribution $23.2 million $231.5 million
State & Local Sales Tax Contribution $10.6 million $106.0 million
Current Value CaliforniaRanking PercentageofStateTotal
Industry Output $96.8 billion 13 2.1%
Value Added (contribution to GSP) $56.2 billion 13 2.1%
Establishments 73,293 businesses 5 8.0%
Employment 575,034 jobs 11 3.9%
Average Annual Salary $33,407 16
Total Payroll $19.2 billion 13 2.2%
Total Tax Revenues $4.1 billion 14 2.0%
State Payroll Tax Contribution $130.6 million 13 2.2%
Federal Payroll Tax Contribution $1.5 billion 13 2.2%
State Income Tax Contribution $1.8 billion 13 2.2%
State & Local Sales Tax Contribution $739.1 million 7 1.5%

52
The FHWA HERS-ST model is used to estimate the investment needs for California on the National Highway System, using the same modeling techniques as those employed by FHWA when preparing the federal Needs and Conditions report on the nation’s transportation infrastructure.
HERS-ST selects a set of optimal improvements based on funding constraints, or can determine the cost of making all cost-beneficial improvements over a given time period to the state roads that are part of the federal aid system. Both approaches were used for the purposes of this study. All data used in the model is submitted by Caltrans to FHWA as part of the Highway Performance Monitoring System.
The FHWA NBIAS model is used to estimate the investment needs for bridges in California, also using the same modeling techniques as those employed by FHWA when preparing the federal Needs and Conditions report on the nation’s transportation infrastructure. Similar to HERS-ST, NBIAS selects a set of optimal improvements based on funding constraints, or can determine the cost of making all cost-beneficial improvements over a given time period to roadway bridges across the state. The funding constraint approach was used for the purposes of this study, utilizing the NBIAS model which maximizes benefits. All data used in this model was submitted by Caltrans to FHWA as its’ National Bridge Inventory data, which is collected by FHWA annually from all states.
The investment levels used in this report are from the California Department of Finance’s forecast of SB 1 revenues and expenditures from the Governor’s 2017-2018 Enacted Budget (included in Appendix 2). Baseline highway, street, bridge and transit investment levels (investment levels without additional SB 1 funding) are based on levels provided in the California 2017-18 State Budget for Caltrans and State Transit Assistance. Absent implementation of SB 1, funding levels are expected to rise at the rate of California inflation projected by the California Department of Finance in its inflation forecast.
SB 1 spending estimates by program area and type of work, as well as the methodology used, were developed with input from the California Department of Finance.
SB 1 spending on highways, bridges and transit was estimated based on the line items included in the SB 1 revenue and expenditure forecast. Highway, street and bridge spending comprises the following line items: Total Local Streets and Roads; Local Partnership; STIP (Local Share); Total State SHOPP/Maintenance; Bridges and Culverts; STIP (State Share); and a portion of Trade Corridor Enhancement and Congested Corridors spending. Transit spending comprises the following line items: State Transit Assistance; Transit and Intercity Rail Capital Program; Commuter Rail and Intercity Rail; and a portion of Trade Corridor Enhancement and Congested Corridors spending. There are two line items (Trade Corridor Enhancement and Congested Corridors) that can be used for either highways, bridges or transit, so those items were split among highway, street and bridge spending and transit spending based on the average split between highway, street and bridge versus transit spending in the SB 1 forecast; eighty three percent of Trade Corridor Enhancement and Congested Corridors spending is expected to go toward highways and bridges, and the remaining 17 percent is expected to go toward transit.
The split between highway, street and bridge SB 1 spending is estimated using the split between the value of state highway, street and bridge projects funded by SB 1 available at the Rebuilding California website (http://rebuildingca.ca.gov) and accessed on Dec. 4, 2017. Highway spending is estimated to be 68 percent of total highway, street and bridge spending each year, with bridge spending estimated at 32 percent.
VII. Methodology and Sources

53
For baseline levels, the split between highway, street and bridge spending is estimated using the split between the value of highway, street and bridge projects in the California 2016 State Highway Operation and Protection Program (SHOPP) for 2016-17 through 2019-20. This document was released in March 2016, so numbers do not reflect the implementation of SB 1. Similar to the SB 1 split, highway spending is estimated to be 68 percent of total highway, street and bridge spending each year, with bridge spending estimated at 32 percent.
Actual highway, street and bridge construction spending is estimated based on construction and non-construction spending levels in the revised California 2016 SHOPP for 2015-16 through 2021-22. This document was revised after October 2017, so numbers reflect the implementation of SB 1. This document details spending breakdowns for capital outlays for right of way, planning and actual construction work. Highway, street and bridge construction spending are estimated to be 67 percent of highway, street and bridge spending each year, respectively.
Transit construction spending is estimated based on National Transit Database data from 2016 that includes spending by California transit agencies on capital and operations. Transit capital investment includes spending on rolling stock such as train cars and buses in addition to stations, buildings and rail. Thirty eight percent of spending by California transit agencies in 2016 is capital spending, therefore 38 percent of transit investment each year is estimated to be transit construction spending. Though capital investment is not analogous to construction spending, comprising construction support activities in addition to construction activities, in the absence of a more precise estimate for transit construction spending, the capital spending percentage is used as a conservative estimate (since it is much lower than the highway, street and bridge construction percentage) of the percent of transit construction spending.
To calculate the higher investment level resulting from the implementation of SB 1, SB 1 expenditures from the revenue and expenditure forecast were added to the baseline highway, street, bridge and transit spending level for each year. SB 1 spending on highways, bridges and transit is estimated at $50.3 billion over 10 years, or $5.0 billion each year on average. When added to the baseline spending level of $107.2 billion, the new level of highway, street, bridge and transit investment is expected to total $157.5 billion, or $15.8 billion annually.
The immediate impact of an increase in transportation construction spending is calculated using the U.S. Department of Commerce Regional Input-Output Modeling System (RIMS II). RIMS II is based on input output (I-O) tables. For a given industry, the I-O tables show the industrial distribution of inputs purchased and outputs sold. In this analysis, four separate California-specific multipliers were used to estimate the impact of highway, street and bridge construction, transit construction, transit non-construction activity, and remaining spending from SB 1. The total immediate impact was calculated by adding up the impact values for each of the four multipliers, for each type of impact and for each industry.
Research shows that RIMS II multipliers are similar to other regional I-O models based on in-depth and often expensive surveys. According to the U.S. Department of Commerce, RIMS multipliers have been used to estimate such things as the regional impact of military base closings, tourist expenditures, new energy facilities, offshore drilling and the opening or closing of manufacturing plants and other facilities. These multipliers are also used frequently to analyze the impact of new construction projects, including transportation construction.
Industry value added (contribution to GSP) for California is the most recent data from the U.S. Bureau of Economic Analysis GSP estimates for the state, broken out by industry, for 2016. Industry output for California was estimated by taking California’s percent share of national GSP for each industry and multiplying it by national gross output by industry.

54
Foradditionalinformationpleasecontact:
Alison Premo Black, Ph.D.ARTBA Senior Vice President of Policy & Chief [email protected] Lital Shair NadaARTBA Market Research Associate Assistant Director, ARTBA Research & Education [email protected]
The state payroll tax rate is calculated using the average employer tax rate as a percent of total wages. The source for this information is the National Association of State Workforce Agencies (NASWA) and the U.S. Department of Labor Employment Training Administration (ETA) Financial Handbook 394. The federal payroll tax rate is estimated to be 7.65 percent.
Income tax contributions are calculated by adding up the California State Comptroller’s Office Monthly Statements of General Fund Cash Receipts and Disbursements for January through December 2016. The amount of income tax contributions attributable to each industry was estimated by multiplying the total income tax contributions amount by the percentage of total wages for each industry. Total estimated income tax collections using this method are $81.7 billion. The value of actual income tax collections reported by California in the 2015 U.S. Census of State and Local Government Finance, published by the U.S. Census Bureau, was $77.9 billion. This difference is in part attributable to inflation, an expanded workforce and income taxes paid by government workers. Employment and economic impact of the public sector is not included in the 19 sector analysis.
Total state sales tax revenues are based on the actual collections of sales tax in 2016 as recorded in the California State Comptroller’s Office Monthly Statements of General Fund Cash Receipts and Disbursements for January through December 2016. In 2016, California had a 7.5 percent combined sales and use tax rate that includes both the state rate of 6.5 percent and the local rate of 1.0 percent. The total value of state sales tax receipts is $38.5 billion, the same as the amount reported in the 2015 Census of State and Local Government Finance for state sales tax revenues. The total state and local sales tax revenues amount reported in the 2015 Census of State and Local Government Finance was $49.9 billion, with 77 percent from state sales tax revenues and the remaining 23 percent from local sales tax revenues. Therefore, to calculate the total state and local sales tax value, 2016 collected state sales tax receipts were estimated
to equal 77 percent of total state and local sales tax revenues. Using this methodology, the value of total state and local sales tax revenues used in this report is $50.0 billion. The amount of state and local sales tax revenues attributable to each industry was estimated by multiplying the total state and local sales tax revenue amount by the percentage of taxable sales for each industry, calculated by adding up the California State Board of Equalization’s Statewide Taxable Sales, By Type of Business tables for the first three quarters of 2016.
Employment and establishment data was calculated using the U.S. Census Bureau’s County Business Patterns. All payroll data has been adjusted for inflation to 2016 dollars using the Bureau of Labor Statistics Consumer Price Index.
All bridge information, including conditions, is from FHWA’s National Bridge Inventory and is for 2017 (data released in January 2018), the latest year that data is available.
Fatality and crash information is from the National Highway Traffic Safety Administration for 2016, the latest year that data is available.
State data on freight shipments is from the FHWA Freight Analysis Framework and is for 2015, the latest year that data is available.

55
Transportation capital investments trigger immediate economic activity that creates and sustains jobs and tax revenue, yet yields long-lived capital assets that facilitate economic activity for many decades to come by providing access to jobs, services, materials and markets.
An improved highway, street, bridge and transit network results in lower operating costs, allowing businesses to increase investment in other capital outlays and expand their operations. Commuters spend less time in traffic and congestion as mobility increases, and safety enhancements help save lives and reduce injuries.
The overall economic benefits of transportation investment to a state’s economic activity are well documented in the economics literature. There are numerous studies that have found a positive correlation between transportation infrastructure investment and economic development. Although the exact impact of the investment has varied among studies, the fact that there is a positive relationship is widely accepted.37
Some of the main findings include:
n A recent study commissioned by the U.S. Treasury Department found that for every $1incapitalspentonselectprojects,theneteconomicbenefitrangedbetween$3.50and$7.00.38 Released in December 2016, “40 Proposed U.S. Transportation and Water Infrastructure Projects of Major Economic Significance” also explores some of the challenges of completing the work. The report found that a lack of public funding was “by far the most common factor hindering the completion” of the projects.
n A 2005 report by Dr. Robert Shapiro and Dr. Kevin Hassett found that the U.S. transportation network provides more than $4indirectbenefitsforevery$1indirectcosts that taxpayers pay to build, operate and maintain this system.39 These economic benefits include lower costs and higher productivity for businesses, and time savings and additional income for workers. The authors noted that the estimate substantially understates the full net benefits of the U.S. transportation network and does not take into account the increased benefit from better access to schools and hospitals, or other ways these investments support economic growth and allow American workers and companies to compete successfully on the global stage.
Appendix 1: Supporting Studies37 Economic studies have found output elasticities ranging from as high as 0.56 (Aschauer 1989) to a low of 0.04 (Garcia-Mila and McGuire 1992). This means that a 1 percent increase in highway investment will result in between 0.04 to 0.56 percent increase in output. Most of this variation is because studies have a different focus- looking at different types of investment measures and output at either the national, state or county level.
38 Report available at https://www.treasury.gov/connect/blog/Pages/Importance-of-Infrastructure-Investment-for-Spurring-Growth-.aspx as of February 2017.
39 R. Shapiro and K. Hassett, “Healthy Returns: The Economic Impact of Public Investment in Surface Transportation,” 2005.

56
n According to an analysis by TRIP, a national transportation research group, theaveragereturntoevery$1spentonhighway,streetandbridgeinvestmentis$5.20, which takes the form of lower maintenance costs, fewer delays, improved safety and less congestions. This analysis is based on the U.S. Department of Transportation’s Conditions and Performance Report.
n A study by Dr. Alicia Munnell of the Federal Reserve Bank of Boston concluded that states that invested more in infrastructure tended to have greater output, more private investment and more employment growth.40 Her work found that a1percentincreaseinpubliccapitalwillraisenationaloutputby0.15percent41. She further notes that the major impact of public capital output is from investment in highways and water and sewer systems. Other public capital investments, such as school buildings and hospitals, had virtually no measureable impact on private production.42 Munnell also concludes that public capital and infrastructure investment have a significant positive impact on a state’s private employment growth and private sector output.
n Federal Highway Administration economist Theresa Smith reached similar conclusions, finding that a 10 percent increase inhighwaycapitalstockwillincreaseastate’sgrossstateproductby1.2to1.3percent.43 This means a $1 billion increase in California’s highway capital stock will increase state productivity between $1.21 million to $1.27 million.
n Additional studies have found that transportation infrastructure investments have an impact on the attractiveness of local communities, which helps determine local economic activity and land values. In general, most studies find that locations close to large transportation infrastructure investment have higher land values.44
40 Alicia Munnell, “How Does Public Infrastructure Affect Regional Economic Performance,” New England Economic Review, September/October 1990.
41 Munnell’s elasticity for private capital is 0.31, so that a 1 percent increase in private capital will raise national output by 0.31 percent. This is in line with other studies of returns from private capital investment.
42 Munnell says she is not implying that government-provided education and health services have no effect on productivity, but rather “the stock of buildings … may not be the best indicator of the quality of education services; teachers’ salaries, for example, might be a better measure.”
43 Theresa Smith, “The Impact of Highway Infrastructure on Economic Performance,” Public Roads Vol. 57 – No. 4 (Spring 1994).
44 A synopsis of these studies are available in the Transportation Research Board’s Expanding Metropolitan Highways: Implications for Air Quality and Energy Use – Special Report 245, 1995

57
n M. Ishaq Nadiri of New York University and the National Bureau of Economics Research and Theofanis P. Mamuneas of New York University find significant cost structure and productivity performance impacts on the U.S. manufacturing industry as a result of highway investment. Their work shows that the rate of return on highway investment can be greater than private investment.
Some major findings include:45
• Over the period 1950 to 1989, U.S. industries realized production cost savings averaging 18 cents annually for each $1 invested in the road system.
• Investments in non-local roads yield even higher production cost savings – estimated at 24 cents for each $1 of investment.
• Although the impact of highway investment on productivity has declined since the early 1970s and the initial construction of the Interstate, evidence suggests that highway infrastructure investments more than pay for themselves in terms of industry cost savings.
• The U.S. highway network’s contribution to economic productivity growth was between 7 and 8 percent over the time period 1980 to 1989.
• The net social rate of return on investment in the non-local road system during the 1980s was 16 percent, and the rate of return for the entire road network was 10 percent.46
• This rate of return was significantly higher than the prevailing rate of return on private capital and the long-term interest rate during this time period.
• The higher return to highway capital is due to its network feature, since the benefits are shared by all industries.
Overall, the benefits from investing to maintain and improve a state’s transportation network are greater than the cost, and can help support economic growth throughout the economy for years to come.
45 Summary provided by U.S. Department of Transportation, Productivity and the Highway Network: A Look at the Economic Benefits to Industry form Investment in the Highway Network.
46 The net social rate of return is an estimate of the benefits to private industries derived from the shared use of public highways.

58
Appendix 2: SB 1 Revenue and Expenditure 10-Year Forecast
SB1RevenueandExpenditure10-YearForecast(inmillions)
Year 12017-2018
Year 22018-2019
Year 32019-2020
Year 42020-2021
Year 52021-2022
Year 62022-2023
Year 72023-2024
Year 82024-2025
Year 92025-2026
Year 102026-2027
10-YearTotal
AnnualAverage
Revenues
Gasoline Excise Tax $1,252 $1,866 $1,911 $2,270 $2,474 $2,651 $2,830 $3,009 $3,189 $3,370 $24,823 $2,482
Diesel Excise Tax $401 $656 $651 $702 $724 $746 $768 $790 $813 $836 $7,086 $709
Diesel Sales Tax $200 $313 $326 $339 $353 $368 $384 $400 $417 $434 $3,533 $353
Transportation Improvement Fee $726 $1,453 $1,503 $1,598 $1,686 $1,774 $1,862 $1,950 $2,038 $2,126 $16,716 $1,672
Zero Emission Vehicle Fee (with CPI) $0 $0 $0 $18 $21 $24 $27 $30 $34 $38 $191 $19
Loan Repayment $235 $235 $236 $0 $0 $0 $0 $0 $0 $0 $706 $71
Caltrans Efficiencies (not allocated) $100 $100 $100 $100 $100 $100 $100 $100 $100 $100 $1,000 $100
TotalNewRevenue $2,913 $4,623 $4,726 $5,027 $5,357 $5,663 $5,971 $6,280 $6,591 $6,903 $54,054 $5,405
Expenditures
Local
Local Streets and Roads
Local Streets and Roads (2104-2107) $0 $21 $21 $85 $118 $150 $182 $214 $246 $278 $1,316 $132
Local Streets and Roads (2103) $75 $75 $102 $87 $122 $154 $186 $218 $250 $282 $1,549 $155
RMRA - Local Streets and Roads $371 $1,069 $1,080 $1,172 $1,236 $1,296 $1,353 $1,411 $1,468 $1,526 $11,980 $1,198
Total Local Streets and Roads $446 $1,165 $1,204 $1,344 $1,476 $1,599 $1,721 $1,842 $1,964 $2,086 $14,846 $1,485
State Transit Assistance $280 $380 $394 $409 $424 $440 $456 $473 $491 $509 $4,255 $426
Transit and Intercity Rail Capital Program $330 $333 $340 $261 $267 $274 $281 $288 $295 $302 $2,970 $297
Local Partnership $200 $200 $200 $200 $200 $200 $200 $200 $200 $200 $2,000 $200
Active Transportation $100 $100 $100 $100 $100 $100 $100 $100 $100 $100 $1,000 $100
STIP (Local Share) $0 $0 $20 $65 $91 $115 $139 $163 $187 $211 $993 $99
Commuter Rail and Intercity Rail $25 $39 $41 $42 $44 $46 $48 $50 $52 $54 $442 $44
Local Planning Grants $25 $25 $25 $25 $25 $25 $25 $25 $25 $25 $250 $25
RMRA-Administration (DMV, SCO, CTC) $2 $4 $4 $4 $4 $4 $4 $4 $4 $4 $38 $4
Total Local Expenditures $1,408 $2,246 $2,328 $2,450 $2,632 $2,803 $2,973 $3,145 $3,318 $3,492 $26,794 $2,679
State
SHOPP/Maintenance
SHOPP (44/44/12) $0 $0 $7 $24 $33 $42 $51 $59 $68 $77 $361 $36
SHOPP (2108) $75 $113 $113 $151 $210 $267 $323 $380 $437 $494 $2,565 $257
RMRA - SHOPP/Maintenance $371 $1,069 $1,080 $1,172 $1,236 $1,296 $1,353 $1,411 $1,468 $1,526 $11,980 $1,198
Total SHOPP/Maintenance $446 $1,182 $1,200 $1,347 $1,479 $1,604 $1,727 $1,850 $1,973 $2,097 $14,906 $1,491
Bridges and Culverts $400 $400 $400 $400 $400 $400 $400 $400 $400 $400 $4,000 $400
Trade Corridor Enhancement $200 $298 $296 $309 $314 $318 $323 $328 $333 $338 $3,059 $306
Congested Corridors $250 $250 $250 $250 $250 $250 $250 $250 $250 $250 $2,500 $250
Parks (excise tax on vehicle used off-highway) $54 $80 $80 $83 $85 $86 $87 $88 $90 $91 $823 $82
Agriculture (excise tax on farm vehicle use) $17 $25 $25 $26 $27 $27 $27 $28 $28 $29 $258 $26
STIP (State Share) $0 $0 $7 $22 $30 $38 $46 $54 $62 $70 $331 $33
Freeway Service Program $25 $25 $25 $25 $25 $25 $25 $25 $25 $25 $250 $25
RMRA - Administration (DMV, SCO, CTC) $2 $4 $4 $4 $4 $4 $4 $4 $4 $4 $38 $4
Transportation Workforce Training $5 $5 $5 $5 $5 $0 $0 $0 $0 $0 $25 $3
UC and CSU Transportation Research $7 $7 $7 $7 $7 $7 $7 $7 $7 $7 $70 $7
Total State Expenditures $1,406 $2,277 $2,299 $2,477 $2,625 $2,760 $2,897 $3,035 $3,173 $3,311 $26,260 $2,626
Total Expenditures from SB 1 $2,814 $4,523 $4,627 $4,927 $5,257 $5,563 $5,870 $6,180 $6,491 $6,803 $53,054 $5,305
Source: SB 1 Revenue and Expenditures Forecast from the Governor’s 2017-2018 Enacted Budget

59
Appendix 3: SB 1 Spending by Type
SB1SpendingbyTypeover10Years(inmillions)
Year 12017-2018
Year 22018-2019
Year 32019-2020
Year 42020-2021
Year 52021-2022
Year 62022-2023
Year 72023-2024
Year 82024-2025
Year 92025-2026
Year 102026-2027
10-YearTotal
AnnualAverage
Highway, Bridge, Street & Transit $2,577 $4,247 $4,352 $4,649 $4,975 $5,284 $5,591 $5,898 $6,207 $6,517 $50,302 $5,030
Highway, Bridge & Street $1,865 $3,401 $3,483 $3,841 $4,143 $4,427 $4,708 $4,988 $5,269 $5,551 $41,682 $4,168
Construction $1,245 $2,270 $2,325 $2,564 $2,765 $2,955 $3,142 $3,329 $3,517 $3,705 $27,821 $2,782
Other Highway, Bridge & Street Activity $620 $1,131 $1,158 $1,277 $1,378 $1,472 $1,566 $1,659 $1,752 $1,846 $13,862 $1,386
Transit $712 $846 $869 $808 $832 $857 $883 $910 $938 $966 $8,620 $862
Construction $268 $318 $326 $304 $313 $322 $332 $342 $353 $363 $3,240 $324
Other Transit Activity $444 $528 $542 $504 $519 $535 $551 $568 $585 $603 $5,380 $538
Other SB 1 Spending $237 $276 $275 $278 $282 $279 $279 $282 $284 $286 $2,752 $275
TotalSpending $2,814 $4,523 $4,627 $4,927 $5,257 $5,563 $5,870 $6,180 $6,491 $6,803 $53,054 $5,305

60
Appendix 4: Total Economic Impact of SB 1 on California over 10 Years
Total Economic Impact of SB 1 on California over 10 Years (in millions)
Year 12017-2018
Year 22018-2019
Year 32019-2020
Year 42020-2021
Year 52021-2022
Year 62022-2023
Year 72023-2024
Year 82024-2025
Year 92025-2026
Year 102026-2027
10-YearTotal
AnnualAverage
User Benefits $2,384 $2,634 $3,925 $4,140 $5,224 $4,807 $4,389 $3,973 $3,558 $3,143 $38,176 $3,818
Highway, Street & Bridge $1,181 $1,205 $2,457 $2,775 $3,819 $3,358 $2,896 $2,435 $1,973 $1,511 $23,609 $2,361
Transit $1,203 $1,430 $1,468 $1,365 $1,405 $1,449 $1,493 $1,538 $1,585 $1,632 $14,567 $1,457
Economic Impacts $7,785 $12,368 $12,652 $13,420 $14,304 $15,123 $15,946 $16,777 $17,612 $18,449 $144,433 $14,443
Economic Output $5,999 $9,562 $9,782 $10,389 $11,076 $11,713 $12,352 $12,998 $13,647 $14,297 $111,812 $11,181
Earnings $1,786 $2,806 $2,871 $3,032 $3,228 $3,410 $3,594 $3,779 $3,965 $4,152 $32,621 $3,262
Total Impact $10,169 $15,002 $16,577 $17,561 $19,528 $19,930 $20,335 $20,750 $21,170 $21,592 $182,609 $18,261
Other Economic Impacts
Value Added (GSP) $3,106 $4,952 $5,066 $5,380 $5,736 $6,066 $6,398 $6,733 $7,069 $7,406 $57,911 $5,791
Employment 39,834 59,740 61,154 63,456 67,269 70,852 74,449 78,094 81,763 85,442 682,029 68,203

61
What is SB 1?California’s Senate Bill 1 (SB 1), which was signed in to law on April 28, 2017, will boost transportation funding through a combination of motor fuel and vehicle registration increases. The bill is projected to raise $53.1 billion over the first 10 years, which will be used to fund road and bridge maintenance and improvements, as well as transit and rail infrastructure.
The key components of SB 1 include:
n Increase the state gas tax by 12 cents per gallon and the diesel tax by 20 cents per gallon, with an additional 4 percent increase in the diesel sales tax (beginning Nov. 1, 2017).
n Create a Transportation Improvement Fee based on the market value of the vehicle (beginning Jan. 1, 2018).
n Eliminate the current Board of Equalization “Gas Tax Swap” formula for a variable-rate motor fuel tax based on annual changes to the Consumer Price Index (beginning July 1, 2019).
n Index the state gas tax to inflation (beginning Jan. 1, 2020).
n Implement a Zero-Emission Vehicle Fee of $100 for electric vehicles for model year 2020 or later (beginning Jan. 1, 2020).
n Require the California Department of Transportation (Caltrans) to generate up to $100 million in department efficiencies, overseen by the newly-created Transportation Inspector General.
Appendix 5: What is SB 1?

62
How is Transportation Investment Funded in California?California’s highway, street bridge and transit network is funded from a combination of three sources: federal, state and local funding. Federal and state revenues account for about half of highway and transit funding, with local funds comprising the remaining half.
StateFunds.State revenues are generated from multiple sources, including:
n Gas Tax: Prior to the passage of SB 1, the California state gas tax was comprised of two parts— a flat excise tax of 18 cents per gallon, and an additional variable-rate component.
• The “Gas Tax Swap” of 2010 resulted in an “adjustable” gas tax that added a 2.25 percent sales tax on motor fuel purchases (reduced from the state’s 6 percent general sales tax). To ensure the sales tax percentage on motor fuel does not affect overall cost of taxes paid at the pump when compared to the previous tax structure, the state’s excise tax on fuel is adjusted annually so that any change in the variable-rate percentage is revenue neutral.
• Prior to SB 1, the combined state gas tax was being charged at 27.8 cents per gallon.
n Sales Tax on Diesel: 6.5 percent of the state sales and use tax on diesel fuel is applied to transportation funding.
n Truck Weight Fees: A fee is assessed on commercial vehicles based on gross weight of the vehicle. The nearly $1 billion generated by this fee is used to pay for transportation bond debt (below).
• 2006 Proposition 1B Bond: The 2006 Bond Act approved $19.9 billion to be used for “congestion relief, goods movement facilitation, air quality improvement, and safety and security enhancements to the transportation network.’
• Vehicle License, Registration, and Driver License Fees: Revenue from these fees is allocated to the California Highway Patrol and the Department of Motor Vehicles for traffic law enforcement and regulations.
LocalFunds. Cities and counties are given the ability to implement a local sales tax for transportation purposes through an initiative, which must receive two-thirds support from voters to be enacted. The Transportation Development Act of 1971 initiated a statewide 0.25 percent sales tax for local transportation funding. Additional local revenue sources include bonds, property-related charges (including property taxes, benefits assessment districts, and developer fees), and local General Fund revenue.
Appendix 6: How is Transportation Investment Funded in California?