the economic incentives of cultural transmission: spatial
TRANSCRIPT

The Economic Incentives of Cultural Transmission:Spatial Evidence from Naming Patterns across France∗
Yann Algan† Clement Malgouyres‡ Thierry Mayer§
Mathias Thoenig¶
April 17, 2020
Abstract
This paper studies how economic incentives influence cultural transmission, usinga crucial expression of cultural identity: Child naming decisions. Our focus is onArabic versus Non-Arabic names given in France over the 2003-2007 period. Ourmodel of cultural transmission features three determinants: (i) vertical (parental)cultural transmission culture; (ii) horizontal (neighborhood) influence; (iii) informa-tion on the economic penalty associated with Arabic names. We find that economicincentives largely influence naming choices: Would the parental expectation on theeconomic penalty be zero, the annual number of babies born with an Arabic namewould be more than 50 percent larger.
Keywords: Cultural Economics, Cultural Transmission, First Names, Social Interac-tions.
JEL Classification: Z1, J3.
∗We thank Alberto Alesina, Alberto Bisin, Pascaline Dupas, David Laitin, Paola Giuliano, Laurent Go-billon, Camille Hemet, Raquel Fernandez, Rachel Kranton, Luigi Pistaferri, Nancy Qian, Yves Zenou, andFabrizio Zilibotti, for their helpful comments. We also thank the participants of seminars and conferencesat Stanford, Berkeley, RSAI in Miami, the NBER Summer Institute, CEPR conference on culture andeconomics in Rome, INED in Paris, UCD in Dublin, UAB and Pompeu Fabra in Barcelona, CIFAR IASTat the Toulouse School of Economics, ENSAI in Rennes, Universities of Bern, Lausanne, and Lugano,for their helpful comments. Yann Algan acknowledges financial support from the ERC Starting Grant240923 under the European Community Seventh Framework Programme. Mathias Thoenig acknowledgesfinancial support from the ERC Starting Grant GRIEVANCES-313327.†Sciences Po and CEPR.‡Institut des politiques publiques (IPP), Paris School of Economics (PSE)§Sciences Po, CEPII and CEPR.¶University of Lausanne and CEPR.

1 Introduction
Cultural traits persist across generations, partly because individuals exhibit a preference for
the transmission of their own culture to their offsprings.1 However, external forces might be
operating through both social pressure and the economic environment that restrict how the
individual desire to transmit ones’ culture translates into actual choices. These constraints
are likely to be especially binding for minorities. This is naturally true of immigrants who
live in societies in which natives tend to value conformity/assimilation and express anxiety
with respect to (actual or perceived) rising cultural diversity.2
In this paper, we analyze how social and economic forces constrain the inter-generational
transmission of culture among immigrants and their descendants with particular emphasis
on the tension between the taste for the perpetuation of inherited cultural traits and the
perceived economic discrimination attached to them.3 We study the determinants of this
trade-off for a specific case of transmission: The cultural type of first names parents give
their children. We focus on the decision of whether to give a first name associated with
Arabic/Muslim culture to babies born in France in the early 2000s. We view this deci-
sion as an appropriate object of inquiry for two main reasons: 1) First names are widely
considered important markers of cultural identity—the choice of a first name is available
to all parents, without material constraints, and is thus sometimes referred to as a “pure”
expression of cultural identity (Lieberson, 2000); 2) There can be direct economic conse-
quences to naming decisions.4 Several studies have shown that first names associated with
a cultural minority are perceived negatively by employers (Bertrand and Mullainathan,
2004).
In the French context, Arabic name holders are associated with both severe economic
1See Bisin and Verdier (2011) for a review of theoretical and empirical studies on the intergenerationaltranmission of culture.
2For instance, Hainmueller and Hiscox (2010) provide evidence suggesting that non-economic factors areimportant drivers of hostility to immigration. Hainmueller and Hopkins (2014) survey the literature andhighlight the dominance of concerns over cultural impacts in shaping public attitudes toward immigration.
3We adopt here a popular definition of culture among economists, as being the belief, behavior oridentity patterns that are transmitted from one generation to another Fernandez (2011). Recent surveysinclude Algan and Cahuc (2013) and Alesina and Giuliano (2015).
4Fryer Fryer and Levitt (2004) have provided additional evidence on the cultural component of firstnames by showing that the surge in distinctively Black names in the US since the seventies could beassociated to a rise in Black cultural identity. In their study of two major waves of immigration inthe United States, Abramitzky et al. (2020) emphasize the attractiveness of first-names as a measure ofassimilation. They argue that first names are more likely to reflect preferences and less likely to reflectconstraints imposed by the host society than alternative measures, such as intermarriage—which couldreflect both the demand and supply determinants of assimilation opportunities.
1

discrimination and with cultural elements that potentially conflict with the “traditional”
(native) culture: Religion, migration, political tensions, historical legacy with ex-colonies,
or even consumption habits. First, the largest immigration wave since 1945 originates
from former North African colonies (mostly Algeria, Morocco and Tunisia, three countries
that we will refer to as Maghreb). Accounting for first-generation migrants and their
descendants, this migration wave represents approximately 5.7% of the current French
population INSEE (2016). Second, the decolonization process was conflictual for those
countries—particularly Algerian independence which occurred after several years of violent
war (1952-1964). Third, Arabic names are also a sign of the Muslim religion since most of
those names come from the Quran, and the transmission of first names associated with the
Quran is a natural practice for religious people. By contrast, non-Arabic names in France
are mainly associated with Saints’ names, i.e. coming directly from the French calendar
of Christian Saints (or inspired by it). Fourth, economic prejudice against Arabic name
holders has been largely documented in France. Second-generation migrants from Maghreb
face the highest penalty on the French labor market among the different immigrant groups
(Algan et al., 2010; Duguet et al., 2010). Combes et al. (2016) use the Labor Force survey
to show that Arab immigrants working in customer-facing jobs have much higher risks of
unemployment. Even closer to our main variable of interest, Adida et al. (2010) perform
an audit study using CVs that only differ with respect to the origins of the first name
(Arabic vs Christian). Vitas with an Arabic first name are 2.5 times less likely to receive
a job interview callback compared to their Christian-named counterparts, everything else
being equal, including the last name. Consistent with this recent work on French data,
we document a large penalty attached to Arabic names on the French labor market: The
average unconditional differential of unemployment between Arabic name holders and the
rest of the population amounts to 13% in our sample.
Our empirical design is based on a random-utility discrete-choice model of parental
naming decisions. The choice is binary and pertains to the cultural type of the child’s
first name, Arabic or non-Arabic. The model incorporates the two traditional vertical and
horizontal channels analyzed in the literature on cultural transmission (Bisin and Verdier,
2001), to which an economic channel is added. The vertical transmission channel results
from the utility gain for parents when transmitting their own cultural type. The horizontal
transmission channel stems from spatial externalities associated to the cultural types of
peers and neighbors. The economic channel corresponds to the expected economic penalty
inflicted on one’s children when giving an Arabic first name.
2

The French Labor Force Survey (LFS henceforth) provides a unique source of infor-
mation for measuring and estimating these various cultural transmission channels. The
vertical transmission channel is identified by contrasting the first names of parents and
children, all being reported in the survey. Regarding the measurement of the economic
channel, the LFS allows for the detailed computation across occupations of unemployment
rates associated with Arabic/non-Arabic names. Finally, the LFS data collection is based
on a large representative set of more than 10,000 sampling units spread all over the coun-
try, each unit consisting of a residential block of 20 adjacent households, all of which are
surveyed. This feature enables us to define a set of relevant peers at the very local level
where many social interactions have been shown to occur in France (see Goux and Maurin,
2007; Maurin and Moschion, 2009). We use this set of peers for two purposes: First, to
measure the horizontal transmission of naming choices from nearby neighbors. Second, we
compute the Local Information on Penalty (LIP hereafter) as the average unemployment
differential between Arabic and non-Arabic name holders across these neighbors’ occupa-
tions. The idea underlying this key explanatory variable is that parents use various sources
of information to form a belief about the economic penalty associated with Arabic names
and our hypothesis is that one of the main sources of information is people living in the
same neighborhood. This mechanism is likely to be especially relevant for migrants (and
their descendants), since they should exhibit a low initial knowledge of the local labor mar-
ket (see Hellerstein et al., 2011; Goel and Lang, 2019, for relevant evidence on Canadian
and US labor markets).
A critical issue in estimating our model relates to parents’ endogenous location choices
across residential neighborhoods, resulting in spatial sorting on—possibly unobserved—
characteristics, correlated with the propensity to give Arabic first names to their offspring.
It could be, for instance, that parents most attached to transmitting an Arabic name to
their children choose to live in residential blocks with religious neighbors, who themselves
tend to work in low-discrimination occupations. We mitigate this concern by restricting
our estimation to a sample of households living in the French public housing sector. Due to
legal and binding dispositions, state-owned apartments are allocated to households without
consideration for their cultural background, mixing people indiscriminately. Furthermore,
individuals rarely move since the rents are much lower than market rates. Building on
Algan et al. (2016), we confirm, with a variety of tests, that spatial allocation within the
3

public housing market can be considered as good as random.5
Our main result is that economic factors are important drivers of individual cultural
transmission decisions. We find that an increase in the perceived penalty associated with
Arabic name holders, as measured by our LIP variable, reduces the probability that parents
will give such names. The magnitude of the effect implied by our estimates is also quite
sizable: if the parental expectation of the economic penalty were brought down to zero, the
annual number of babies born with Arabic names in France would be more than 50 percent
larger. In terms of the two other channels, the vertical channel is by far the dominant
factor in the naming decision: A French baby who has at least one parent or grandparent
with an Arabic/Muslim background is twice as likely to be given an Arabic name. The
horizontal channel is statistically significant in some regressions, but quantitatively much
less important. While these findings hold for the sample of all households living in public
housing, they are mainly driven by the behavior of first and second generations of migrants
from Arabic countries. Using our theory-grounded estimates, we are also able to quantify
welfare gains and losses attached to cultural transmission. Focusing on the substitution
rate between the vertical and the economic cost channels, we can express the strength of
cultural attachment in monetary units. For first and second generation of migrants, we
find that vertical transmission of an Arabic name provides the same shift in parents’ utility
as a 3% rise in the child’s lifetime income. Finally, we also assess the welfare effects of
French policies historically aimed at restraining naming choice.
Our paper fits into several strands of research. A substantial body of work by economists
studies the transmission of cultural values and the formation of identity (Akerlof and
Kranton, 2000; Shayo, 2009; Atkin et al., 2019). Bisin and Verdier (2001) provide a seminal
cultural transmission model, distinguishing between vertical transmission by parents and
oblique or horizontal transmission associated with social interactions. Tabellini (2008) and
Guiso et al. (2008) model the interactions between norms and economic incentives in the
inter-generational transmission of values like trust. Bisin et al. (2004) and Bisin et al.
(2016) estimate structural models of transmission of religious values and ethnic identity.
We contribute to this literature by introducing a new channel of cultural transmission
through economic incentives. We also innovate in our empirical application in terms of
measurement, since we observe variation in incentives at the block level as opposed to
5We also consider the possibility that parents retrieve information from the unemployment differentialthey observe in their own occupation. However, while our focus on public housing in the French contextallows us to deal with spatial sorting, there is no similar device to avoid parental sorting across occupations.We therefore prefer the neighborhood-based approach which, as detailed in section 3, features fixed effectsfor the parental occupation and thus account for the fact that parental occupation is not random.
4
more aggregate units. Most important, building on Algan et al. (2016), we exploit the
quasi-random allocation of households across blocks among public housing tenants as an
identification strategy.
The stream of recent work studying the question of migrants’ assimilation and how
discrimination affects it is perhaps the most directly relevant to our findings. Abramitzky
et al. (2016) analyze the co-evolution of cultural and economic assimilation during the age of
mass-migration in the United States: They find significant first-name assimilation among
immigrants which tends to translate into better economic outcomes for their offspring.6
Mazumder (2019) finds that immigrants’ military service in the US army during World
War I increased their rate of cultural assimilation, with potentially positive economic re-
turns. Most closely to our study, Fouka (2019) finds that immigrants from German origins
responded to discrimination during WWI in the United States by increasing their assimi-
lation efforts—partially by changing the “Americanness” of their names. Our results are
consistent with Fouka (2019) since they show that minority parents are willing to undertake
costly assimilation actions when exposed to more information about discrimination. This
could indicate that the discrimination at play is to some extent conditional, meaning that
it is likely to be lower if individuals send signals of loyalty to the dominant culture (Bisin
et al., 2011).7 Our contribution with respect to this literature is twofold. First, we analyze
a channel of cultural transmission directly associated with a measure of discrimination on
the labor market. Second, by focusing on parents who are exogenously allocated to their
neighbors within public housing, we are able to exploit fine-grained exogenous variation
in neighborhood ethnic and occupational composition to estimate jointly the vertical and
horizontal channels as well as the economic cost—whereas most of the previous literature
focuses on the heterogeneous effects of aggregate shocks.
Our paper also relates to the literature on the link between long-run economic and cul-
tural change. First, we document a very high preference for vertical transmission among
parents with Arabic origins, in line with the vast literature highlighting the strong persis-
6In a subsequent version of their paper, Abramitzky et al. (2020) compare first-name assimilation acrosstwo periods of intense immigration in the United States.
7 Naturally, whether the lower transmission of identity through name giving is mostly a strategy or atrue shift in beliefs is an open question. In a closely related paper, Fouka (2020) shows that the secondgeneration of German-origin Americans facing German language bans while at school in the United Statesfollowing World War I displayed signs of lower assimilation. In particular, they were more likely to marrywithin their ethnic group (Germans) and to give German-sounding names to their children. This suggeststhat some form of discriminatory public policies might backlash and feed oppositional identities. At anyrate, given the documented labor market penalty associated with Arabic names, the response we identifyis likely to have long-run real implications on the economic well-being of newly born children even if nameassimilation does not reflect a pure convergence in beliefs.
5

tence of cultural norms (see Guiso et al., 2016, for instance). Faced with adverse economic
consequences of vertical transmission, we find, however, that parents adjust their behav-
ior. This evidence is consistent with the notion that culture tends to be a highly persistent
construct that can nevertheless evolve in the face of changing circumstances—a fact that
has been well documented in the literature on long-run persistence. For instance, Nunn
and Wantchekon (2011) show that the intensity of exposure to slave trade in Africa is as-
sociated with lower level of trust nowadays due to an impact on cultural norms and values.
Relatedly, Voigtlander and Voth (2012) study the persistence of antisemitism in Germany
from the Middle Ages age onward. They document that the persistence of antisemitism,
while high on average, is much lower in cities with an history of demographic expansion
and exposure to economic exchanges (e.g. trade).
Finally, our paper relates to the literature on discrimination and its consequences for
economic decision and public policy. A fairly large body of research has found evidence of
discrimination by employers against first names from a cultural minority. Those studies
exploit either audit study methodology (Bertrand and Mullainathan, 2004; Adida et al.,
2010; Duguet et al., 2010) or representative surveys (Heckman, 1998; Fryer and Levitt,
2004). Our paper differs from this literature in two main respects. First, our ambition
is not to measure economic discrimination, but to analyze how parents react to perceived
information on discrimination. We propose different information channels that parents
can retrieve from the labor market and estimate whether they use this information in
their cultural investment. Second, we analyze the ex-ante decision of adopting (or not) a
cultural trait that could be discriminated against, while the rest of the literature focuses
on the ex-post economic consequences of carrying this cultural trait. We show that the
determinants of cultural identity, and more specifically the economic ones, have substantial
welfare and public policy implications that have been overlooked so far.
The remainder of the paper is as follows. Section 2 provides a detailed description of the
data we use. Section 3 presents our theoretical model of naming decision. Section 4 contains
our baseline estimation results. Section 5 provides various robustness tests. Section 6
quantifies the contributions together with welfare effects of the vertical, horizontal, and
economic channels on cultural transmission.
6

2 Data
2.1 The French Labor Force Survey
Our empirical analysis is based on the French Labor Force Survey (LFS henceforth) from
2003 to 2007. The LFS is a representative survey of the French population, stratified at
levels of around 3500 residential blocks per year, with each block defined as an average of 20
adjacent households. The LFS is a rolling panel of 6 quarters and all the households within
a given block are interviewed every quarter. All household members older than 15 years are
interviewed, and they report information on their socio-economic characteristics, including
employment status (unemployed, inactive and employed), hourly wage and occupation.
The occupation variable covers seven broad categories: farmer, craftsman, unskilled blue-
collar, skilled blue-collar, clerk, intermediate, and executive. But the LFS also provides
a more detailed classification of 29 occupations within those categories depending on the
sector and infra-skill level of the occupation. In addition, the survey records the first names
of all household members, including children below 15 years old.
Since the data collection is based on (very) close neighbors, the LFS provides a unique
opportunity to understand the role of horizontal factors in the transmission of names. Given
that the sampling unit in the LFS consists of small groups of adjacent households, and that
all the members of the households within the same block are interviewed, we get detailed
information on all individuals living in the neighborhood. Another important characteristic
of the LFS is that it distinguishes between the public and the private housing sectors.
As discussed below, our identification strategy will be based on residential allocation of
households within the public housing sector. Thus, we report on both the total sample
and on the sample of public housing residential blocks.
The time span of the rolling panel is too short (6 quarters) to exploit time variation in
the socio-economic composition within residential blocks. Thus, we keep one observation
per member of the household, which generally corresponds to the first wave of interviews.
Table 1 reports the main descriptive statistics of the full database when we use this selection
criterion. Our total sample is made up of 10,541 blocks, with 1,535 blocks belonging to
the state-owned housing market. The average block size is 18.31 adjacent households, and
each household consists of around 3.31 members (babies, children, and adults included).
Overall, the total sample includes 425,210 individuals, among whom 69,458 are living in
public housing.
7

Table 1 – Descriptive statistics of the residential blocks
Total sample Public housingNumber of blocks 10541 1535Number of blocks by department 174.35 45.12Average number of households per block 18.31 17.99Average number of members per household 3.31 3.70Average number of children per household 2.19 2.40(aged below 15 years old)Total number of households 173154 26749Total number of individuals 425210 69458
2.2 Sample of babies’ names
Our main variable of interest is the individuals’ name type and the cultural background
that is associated with it. We focus on the transmission of Arabic first names, as opposed to
non-Arabic names, in French society. In our data, we code Arabic first names according to
the classification of Jouniaux (2001). Arabic names are associated with the most important
population of immigrants in France—Maghreb—and to a lesser extent with the Middle
East (other Arabic countries and Turkey), in the aftermath of decolonization initiated
in the 1960s. According to INSEE (2016), people with Maghreb origins (i.e. Algeria,
Morocco, Tunisia) represent almost 60 percent of non-OECD migrants from first and second
generations in France in 2008; this corresponds to 3.7 million individuals (1.7 million for the
first generation and 2.0 million for the second generation) out of a total French population
of 64.3 million.
We describe in Table 2 our sample of babies along three dimensions of relevance for
our empirical analysis: (i) The cultural type of parents’ first name; (ii) the cultural back-
ground of babies (as captured by the immigration history of the household); (iii) whether
the household lives in private or public housing. We start in the upper panel with the full
sample of 3,541 newborn babies over 2003-2007 for whom we have all the needed informa-
tion on the parents’ and blocks’ characteristics. 3,216 babies (90.8%) receive a non-Arabic
names.8 Among parents with Arabic names, the naming decision is rather balanced since
51.1% of those parents give an Arabic name to their offspring. In contrast, among parents
8Among them, 1,879 babies (58%) are given traditional names, that is names that were already givenin France in the early twentieth century. To identify those, we use INSEE’s national database, “Le fichierdes prenoms”. Those traditional names are generally associated with Christian saint names, or namesdeeply ingrained in the French culture like Leo for boys or Manon for girls.
8

with non-Arabic names, the adoption of Arabic names is marginal, with a frequency of
adoption of 2.8%.9 The main difference when considering the sample of households living
in public housing (reported in parenthesis) is that parents with Arabic names are more
likely to transmit their cultural trait to their offspring.
Table 2 – Transmission of name types
Babies with:non-Arabic name Arabic name
New Born (full sample):Parents with non-Arabic name 2982 (489) 80 (28)Parents with Arabic name 234 (95) 245(132)
0-3 years old (2nd/3rd generation):Parents with non-Arabic name 416 (183) 111 (47)Parents with Arabic name 658 (317) 789(461)
Note: This table reports the number of babies by name type and allocates them accordingto the name type of their parents. The top panel gives figure for the whole sampleof babies born within the year. The bottom panel considers babies aged 0 to 3 attime of survey, born from at least one parent or grandparent with Arabic origins. Inparentheses, the sample of babies in the public housing sector. The term generationrefers to the generation of the babies (e.g. a second generation baby is the child ofa first generation migrant).
Since we observe overall very little adoption of Arabic names by parents with non-
Arabic names in the full sample of babies from all origins, our econometric analysis will
mostly look at the pure transmission decision of giving an Arabic name when it is part of
the original culture. To this purpose, we shall focus on households where at least one parent
or grandparent is a national from Algeria, Morocco, Tunisia, Middle-East and Turkey (see
Section 4.1 for details). The babies are thus born in France, but the parents/grandparents
(babies of second/third generation respectively) were born in an Arabic/Muslim country.
However, restricting the sample to this population would leave us with a too small sample
of newborn babies, especially in the public housing sector. We therefore consider children
between 0 and 3 years old instead of just newborn babies to carry out this analysis. De-
scriptive statistics for this sample are reported in the bottom panel of Table 2. Among
children with parents having themselves an Arabic name, 45% are given a non-Arabic name
9The top Arabic names given by those parents are Louna for girls and Rayan for boys. Those firstnames are rather neutral, they are hardly selected by parents with Arabic names.
9

(658/1447).10 A similar pattern is observed when restricting further to households living
in public housing.
3 Model and Identification of Naming Decision
3.1 A simple model of baby name choice
To estimate the channels driving the transmission of name type, we build a random utility
discrete choice model of baby naming decision. Our framework is rich enough to embed
three different channels of interest (vertical, horizontal, economic) while remaining suffi-
ciently tractable to highlight the underlying estimation issues. The parental decision under
scrutiny is binary and relates to the cultural type attached to the baby’s first name. The
utility for a household i, living in residential block k(i), derived from choosing a given
name type for its baby born in year t is defined as Uit(1) if the name is Arabic and Uit(0)
otherwise,
Uit(Baby) ≡ Vit(Baby) + εit(Baby), (1)
where Baby ∈ {0, 1} denotes alternatives, Vit(Baby) is the observed part of utility and
εit(Baby) is the unobserved parental-specific random shock across alternatives.
In such a discrete-choice setting, only differences in utility over alternatives can be
identified from the data. The econometrician observes a parental choice Babyit = 1 if and
only if ∆Uit ≡ Uit(1)−Uit(0) ≥ 0. Let us denote the difference in the observed part of utility
as ∆Vit ≡ Vit(1) − Vit(0), and the difference in unobserved utility as εit ≡ εit(1) − εit(0),
such that
∆Uit = ∆Vit + εit
= α0 + α1 Parentsi︸ ︷︷ ︸Vertical
+α2 E
1
Nk(i)t
∑j∈k(i),j 6=i
Babyjt
︸ ︷︷ ︸
Horizontal
+α3 E[Cit]︸ ︷︷ ︸Economic Cost
+εit, (2)
where ∆Vit is specified as a three part linear function, which we label “Vertical”, “Hori-
zontal”, and “Economic cost” channels of influence. Parentsi is a parental characteristic
10In this latter case, they rarely choose saint names, but choose instead names that are culturally lessdistinctive. In particular, the two non-Arabic first names that are the more frequently selected are Adamor Yanis for boys, and Ines or Sarah for girls, names that seem to be attached to different cultures and arealso given by the group of parents with non-Arabic names.
10

equal to one when the name of one of the two parents is Arabic and zero otherwise (with
alternative definitions investigated in robustness analysis). Among the Nk(i)t babies born
in residential block k(i) in year t, the variable Babyjt codes for choices of names among
babies born from other parents j living in the block.11 Finally, E[Cit] is the perceived eco-
nomic penalty that parents i expect to be attached to their baby if they choose an Arabic
name.
The Vertical component captures the parental desire to transmit their own cultural
type (as measured by coefficient α1). Our specification of utility is flexible as it allows both
for cultural transmission and cultural adoption. Transmission is the case where the names
of parents and babies belong to the same cultural type. Adoption corresponds to the two
other cases: e.g. parents with Arabic names that do not transmit their cultural type to
their baby or parents with non-Arabic names adopting an Arabic name for their baby.
Both patterns are observed in the data although the latter is less salient (see Table 2).
The Horizontal component reflects social influence, i.e. the share of parents of new-
born babies in residential block k expected to make the same choice as i, with parameter
α2 expected to be positive. In our data, the block k is small enough that household i is
not negligible and this results in a classical Manski (1993) reflection problem. We assume
that parents i form their expectations on lagged decisions of neighbors:
E
1
Nk(i)t
∑j∈k(i),j 6=i
Babyjt
≡ ∑Υτ=1
∑j∈k(i),j 6=i Babyjt−τ∑Υτ=1Nk(i)t−τ
, (3)
that is, they expect the neighbors’ current choices to be, on average, similar to the ones
taken since year t−Υ (we will take Υ = 10 in our application).
The third component (Economic Cost) relates to economic incentives: Presumably,
the higher the expected penalty is, the lower the parents’ desire to give their babies Arabic
names. The perceived expected penalty, is sensitive to the parental information set and
to a wide set of observed and unobserved parental characteristics influencing the future
spatial and social mobility of the baby. We now explain how it is measured in our data.
Our identification strategy exploits the fact that part of the parental information set is
based on information on the labor market that households retrieve from social interac-
tions and communication with their neighbors. A straightforward approach would be to
consider the unemployment differential between Arabic and non-Arabic name holders in
11Note that in the horizontal channel, we scale by Nk(i)t (rather than Nk(i)t − 1) to get a well-definedratio in blocks where only one baby is born.
11

the neighborhood. However the LFS is not representative at such a fine-grained level. In-
stead we use the information conveyed by neighbors’ occupations. The idea is that parents
surrounded by neighbors working in occupations with high levels of penalty tend to up-
date their beliefs on the extent of the penalty upwards. Formally, the perceived expected
penalty is broken down into a block-specific informational component and an unobserved
parent-specific residual component:
E[Cit] =∑l∈O
ωlk(i) × γl + eit, (4)
where O = is the set of occupations, ωlk(i) is the share of neighbors in block k(i) working
in occupation l, γl is an occupation-specific signal on the labor market penalty (see Sec-
tion 4.1) and eit is the unobserved residual parent-specific part. In the remainder of this
paper,∑
l∈O ωlk × γl is labeled as the Local Information on Penalty (LIP) in block k. In
Section A of the online appendix, we show how this functional form is a natural theoretical
prediction in a setup where parents aim at maximizing the expected utility of their child.
In our naming decision model, parents’ utility depends directly on the expected eco-
nomic cost their children face. The intensity of this relationship—captured by the pa-
rameter α3 in Equation (2)—might reflect the fact that parents are more or less likely
to gather information based on their neighbors. The parameter additionally reflects the
degree to which parents value their children’s economic welfare. To the extent that parents
discount such economic welfare heavily, this will translate into a less negative value of α3.
Accordingly, both informational sensitivity and imperfect altruism could explain parents’
willingness-to-pay (in terms of the penalty experienced by their offsprings) to perpetuate
their own culture. The comparison of the coefficients α1 and α3 reflects the parental trade-
off between their own attachment to a particular cultural type and their altruistic concern
toward the future economic performance of their babies.
Combining (2), (3) and (4), utility becomes
∆Uit = ∆Vit + δit
≡ α0 + α1Parentsi + α2
∑Υτ=1
∑j∈k(i),j 6=i Babyjt−τ∑Υτ=1Nk(i)t−τ
+ α3
∑l∈O
ωlk(i)t × γl + δit, (5)
where ∆Vit is the observable utility and δit ≡ α3eit + εit is the new error term.
It is standard to specify δit as having a logistic distribution, with σ as its scaling
parameter, in order to estimate the utility function (5). One can then express, in closed-
12

form, the probability of choosing an Arabic name—a formula that enables, in Section 6,
to run counterfactuals without probabilities going out of bound:
P(Babyit = 1) = 1/[1 + exp(−∆Vit/σ)], (6)
The observable utility differential ∆Vit/σ is retrieved from the coefficients in (5) that can
be estimated readily using standard logit.
3.2 Identification strategy
Estimation challenges. The key empirical challenge relates to spatial sorting of house-
holds. Before going into details, let us summarize the overall idea. In equations (5) and (6),
a key source of identification is based on neighbors from the residential block. Neighbors
are used both as: i) a source of peer-pressure for the horizontal transmission channel, and
ii) a source of information for the LIP. Since individuals tend to self-segregate, e.g., most
households choose their location, our estimation could be biased by endogenous residential
sorting. To address this concern, our identification strategy exploits the specificity of the
French context and consists in restricting estimation to a subsample of households living
in the public housing sector. Previous work (Algan et al., 2016) has shown that households
within public housing units are essentially exogenously allocated to their residential block,
thus circumventing the issue of spatial sorting.
The horizontal transmission channel raises several estimation issues that are well-known
in the social interaction literature. Indeed, in equation (5), the realizations of Babyjt−τ
depend on ∆Ujt−τ . Spatial sorting might lead to a non-zero correlation between δit and
δjt−τ for households i and j belonging to the same residential block k. This would create
a correlation between Babyjt−τ and the error term in (5), δit, potentially capturing unob-
servable taste shocks for the considered cultural type common to households i and j. For
example, it is clear that the degree of devoutness of the household, which is unobserved by
the econometrician, affects positively the choice of an Arabic name for the baby; moreover,
religious people tend to live in the same residential areas (e.g., close to a mosque or to
halal shops). This example makes it clear that spatial clustering of Arabic names is not
only driven by horizontal transmission, but might also be partly driven by unobserved
characteristics of the area. Our estimates could thus be biased by the endogenous spatial
sorting of households. To limit this source of bias, we identify α2 out of regressions run
on a subsample of households that are allocated across the different public housing blocks
13

within a given departement12 in a plausibly exogenous way (we describe the public hous-
ing allocation process at the end of this section). The combination of departement fixed
effects with quasi-random allocation of households, within a departement, should make our
econometric estimates safely immune to spatial sorting bias.
The coefficient α3 associated with the economic cost of a name type may also be ill-
estimated due to self-selection into occupations and locations by parents. The method-
ological concern is that religious (Muslim) parents, attached to giving Arabic names to
their offspring, tend to work in occupations with low discrimination, and are located in
residential blocks with religious neighbors working in non-discriminating occupations. We
address this issue first by controlling for parental occupation and education fixed effects.
Although parental occupation is naturally not a random choice, including fixed effects for
the parental occupation captures all time-invariant co-determinants of parental occupa-
tion and newborn naming choices. Second, rather than using the parental occupation as
a source of information on the perceived expected penalty, we use the block-specific LIP.
Thus the remaining issue relates to the exogeneity of the composition of occupations within
the residential block. We identify the coefficient α3 by restricting once again our estimates
to the subsample of exogenously allocated households living in the public housing sector.
We thus exploit exogenous variation in the composition of occupations across blocks in the
public housing sector as a source of exogenous variation in the LIP.
Even when restricting the sample to households living in public housing, identification
could be threatened by neighborhood-level contextual drivers of both economic penalty and
naming choice. For instance, housing blocks with more unskilled workers could exhibit more
social discrimination against the part of the population identified with immigration from
Maghreb. This could discourage parents from giving an Arabic name, for non-economic
reasons, biasing our estimate of the economic cost effect. We address this concern by
including a set of controls at the local level, such as political and anti-Islamic attitudes
by occupations (aggregated at the block level), or the degree of ethnic fractionalization.
Our results show that those alternative channels are not strong determinants of naming
patterns, and leave the magnitude of the economic channel estimates virtually unchanged.
A last concern is that part of the economic cost channel could operate through the
horizontal channel. Indeed, our model implies that name-giving decisions by other parents
in a given block should themselves be affected by the LIP. In that setting, conditioning
on the local share of children with Arabic names might create a post-treatment bias for
12Metropolitan France is divided into 95 administrative areas, called departements.
14

our estimate of the economic cost channel. On top of using lags in the construction of
the horizontal channel variable, we address this question in the robustness section 5.3
and in the online appendix Table A3. Our analysis shows that the interaction between the
horizontal and economic cost channels, while problematic in principle, is not quantitatively
important for the economic channel point estimate.
Public Housing. The French public housing market is very tight, and highly regulated.
We provide hereafter a short overview of the allocation process of households across public
housing dwellings. The most important feature for our purpose is that households have
very limited control over when and where within a departement they will be assigned if
granted public housing.13
The main eligibility requirements for admittance into the public housing sector are to
be a legal resident of France (as a French citizen or migrant with a valid residence permit)
and under a certain threshold of income per unit of consumption. This income ceiling is
rather high, so that around two thirds of households living in Metropolitan France could
apply for a public housing unit (Jacquot, 2007). The rents are also considerably lower
in public housing than in private housing. As a result, there is a strong excess demand
for public housing. In Paris for example, there were 121,937 ongoing applications, to
be compared to 12,500 public housing units allocated over the year 2010. Due to those
stringent constraints, other eligibility criteria are taken into account: family situation and
household size (to ensure a suitable match with the characteristics of vacant dwellings), as
well as the emergency of the application.14
The selection committees in charge of allocating households to vacant public housing
dwellings are held at the departement level.15 Legally, applicants can refuse up to three
offers but in practice they rarely do, given the large opportunity cost of declining an
13Algan et al. (2016) provide an extensive list of tests showing the absence of self-sorting along ethniclines across public housing dwellings in France. In online appendix G we provide more details on theinstitutional and legal aspects and descriptive statistics; we also briefly review the set of statistical testsby Algan et al. (2016) and expand it to several dimensions. In particular, we show that the observedallocation is not statistically different from a random process generated though Monte-Carlo simulations.
14Five priority criteria—none related to nationality—are defined by law to make sure that vacant housingwill first be distributed to households with obvious social difficulties (see online appendix G).
15At the time of our sample, Metropolitan France was divided into 22 large administrative areas, calledregions, and into 96 smaller administrative areas, called departements. Each departement is hence asubdivision of a region, and several departements can belong to the same region. Each departement isadministered by an elected General Council (Conseil General) and its President, whose main areas ofresponsibility include the management of a number of social and welfare programs, junior high schools,buildings and technical staff, local roads, schools, rural buses, and municipal infrastructure.
15
offer. This makes it unlikely that the selected households could be really picky about
the characteristics of their neighborhood and in practice very few applicants (6.6 percent)
express a preference about the area they want to be allocated within the department due
to the fear of being rejected on this ground. Finally, residential mobility within the public
housing sector is marginal, due to the strong shortage in the supply of public housing
dwellings.
4 Estimation
In this section we start with a description of how the main explanatory variables are
constructed, with a special focus on the local information on penalty (LIP). We then
proceed to our baseline estimation results, leaving our battery of robustness exercises to
section 5.
4.1 Explanatory Variables
The vertical transmission channel is measured by two binary variables, relating to parental
characteristics relevant for the transmission of their cultural traits. The first one, One
parent/grandparent with Muslim country nationality, codes for babies born from parents
or grandparents nationals from a list of countries where Arabic names are prevalent—i.e.
Algeria, Morocco, Tunisia, Middle-East and Turkey.16 The second one, One parent with
Arabic name, codes for the type of parental first names, Arabic/non-Arabic (using the
same list as for babies).
The horizontal channel is measured by the share of Arabic-named children aged 4-10
in the block (defined in equation (3)). We investigate the scope of the horizontal channel
by also considering naming patterns among older cohorts or among larger geographical
units—departement or sectors that consists of 6 adjacent residential blocks.
The LIP is defined as∑
l ωlk × γl, where ωlk is the share of neighbors in block k working
in occupation l and γl is an occupation-specific signal on the labor market penalty attached
to an Arabic name. A difficulty here relates to the abundance of ways to measure this
signal. Different assumptions—in terms of labor market structure, informational frictions,
16There is no obvious way to establish this list. We opted for countries proximate enough spatially andhistorically to account for a large share of the immigration flows that are relevant in terms of the verticaltransmission channel. In our sample, this set of countries accounts for 80% of all parents that are nationalsof a list of countries other than France, Europe, the American continent or former Indochina. The sameratio is 77% for parents living in private housing and 87% for public housing.
16

or parents’ rationality—could point to different measurements.For instance, it is unclear
whether the true penalty is the relevant variable to target in terms of measurement. Indeed,
it would implicitly assume that parents are full-fledged econometricians in the sense that
they would be able to isolate the true unemployment penalty imposed by giving an Arabic
name to their baby when taking the decision. Without a clearly dominating option, we
consider various measurement options of the penalty. In our baseline analysis, we use the
unconditional unemployment differential between Arabic and non-Arabic name holders in
occupation l. Denoting ual and una
l the unemployment rate in occupation l for Arabic and
non-Arabic name holders respectively, we set γl = ual −una
l . This unconditional approach is
simple and compatible with a model where agents naively attribute all the unemployment
penalty they observe solely to the Arabic origin of the name. In contrast, in our first
robustness exercise (section 5.1), we explore the impact of measuring the signal with a
conditional unemployment penalty retrieved from an auxiliary Mincer-type equation. This
alternative approach conceptually relies on a model where sophisticated agents are able
to filter out a large set of confounding factors when assessing the unemployment penalty
attached to an Arabic name. Besides this demanding cognitive assumption, a caveat here
is that there is no guarantee that agents use the same set of confounding factors than
the one used by the econometrician (e.g. non-cognitive skills). Quite remarkably, we find
that the estimations based on unconditional and conditional penalties yield similar results
quantitatively. Accounting for a range of observable unemployment determinants in the
auxiliary Mincer equation has little effect on our coefficients of interest when estimating
our main econometric equation (6). This reassuring result suggests that our findings are
robust to drastically different options for measuring the labor market penalty attached to
an Arabic name.
Table 3 reports basic summary statistics on unemployment rates by occupation and
name type (ual and una
l ) and the associated unconditional unemployment penalty associated
with Arabic names (γl = ual −una
l ). For the sake of exposition (in this table only), we group
together the 29 different occupations listed by INSEE into 7 main categories: farmer,
craftsman, unskilled blue-collar, skilled blue-collar, clerk, intermediate, and executive. On
average, Arabic name holders have an unemployment rate of 20 percent, around three times
as high as the unemployment rate of non-Arabic name holders (7 percent). But this average
comparison hides a lot of variance across occupations. The unemployment rate of Arabic
name holders among executives is only 7 percent and the unemployment gap with non-
Arabic name holders falls to 3 points for this occupation. In contrast, the unemployment
17

rate of Arabic name holders reaches 29 percent among (unskilled) blue collar workers,
which represents an unemployment gap of 14 percentage points with the non-Arabic name
holders in the same occupational category. The unemployment differentials for each of the
29 detailed occupations (which we use in our regressions) are presented in panel (a) of
Figure A3 in the online appendix.17
Table 3 – Unemployment rates by Name type and Occupation
Unemployment rate Unconditional PenaltyArabic name non-Arabic names
Executive 0.07 0.04 0.03Intermediate 0.14 0.05 0.09Clerk 0.20 0.09 0.11Blue collar (skilled) 0.20 0.07 0.13Blue collar (unskilled) 0.29 0.15 0.14Craftman 0.15 0.04 0.09Farmer 0.10 0.00 0.10Total 0.20 0.07 0.13Notes: The sample covers the 4 years of employment survey we have access to (2003-2007). Thestatistics are for adults between 25 and 55 years old.
Explaining the variation in unemployment differentials across occupations goes be-
yond the scope of this paper. We can however think of several mechanisms that have
been put forward by theoretical and empirical research that could generate this type of
cross-occupation variation in discrimination on which our measurement approach relies.
A type of discrimination for which there is direct empirical support in the French case is
customer-based: Combes et al. (2016) correlate the different penalty levels across occupa-
tions to how frequently employees are in direct contact with native customers. Occupations
with higher levels of contact with native customers are characterized by a higher degree of
employment discrimination against minority employees. Another mechanism contributing
to cross-occupation variation in penalty relates to employee-based discrimination (Arrow,
1972). Applied to our context, French natives with non-Arabic names would request a
higher amenity-adjusted wage to work alongside minorities with an immigration back-
ground. To the extent that prejudice/taste for discrimination among non-Arabic workers,
or that the intensity of contact between workers vary across occupations, both mechanisms
are expected to generate variations in unemployment penalty against Arabic names across
17Table A7 in the online appendix presents evidence on the economic penalty at the name level bydisplaying the unemployment rate associated with the 10 most popular non-Arabic and Arabic names.
18

occupations. They also suggest that we should observe less discrimination in occupations
where the labor market is tight and recruitment is difficult (see Baert et al., 2015, for recent
evidence). Finally, empirical work has shown that stereotyping and ensuing discrimination
against a given type of employee (defined based on gender, ethnicity etc.) depends on
how representative this type of employee is in a given occupation. For instance, gender
stereotyping and discrimination against males has been shown to be particularly pervasive
in female-dominated occupations (see e.g. Riach and Rich, 2006; Booth and Leigh, 2010).
Along the same logic, stereotyping based on ethnicity should lead to variations across
occupations in the discrimination intensity.
4.2 Baseline results
Table 4 displays the logit estimation results of equation (6). The dependent variable is a
binary variable coding for the Arabic origins of a baby’s name. Our baseline sample consists
of babies aged between 0 and 3 living in public housing. All specifications add parental
occupation fixed effects, parental education fixed effects, and departement fixed effects (see
Section 3.2). Standard errors are clustered at the residential block level. Average marginal
effects of logit estimates are reported in all regression tables.
Columns (1) to (5) estimate regressions on babies with parents from all origins. Columns
(6) to (9) restrict the sample to children born with parents or grandparents who are nation-
als from our list of Muslim countries described above. Those last four columns therefore
condition on the first of our two vertical transmission dummy variables being turned on.
The first part of the table considers the Muslim origins as a separate determinant. The
second part allows for those Muslim origins to influence all determinants, and particularly
how sensitive parents are with respect to the economic penalty.
The first striking result is that the coefficients on our two vertical transmission variables
are positive and strongly significant in all regressions of columns (1) to (5). In the first
column, we find that having a parent or a grandparent with a Muslim origin increases the
probability of bearing an Arabic name by 11 percentage points. Having a parent with an
Arabic name yields an even stronger effect at 28 p.p, in a sample where the baseline prob-
ability is 24%. The vertical transmission is therefore a first-order determinant, confirming
the broad features of the data described in Section 2.2. The horizontal transmission chan-
nel also exhibits a strong positive effect, significant at the one percent threshold. With
an average marginal effect at 0.11, and a standard deviation of this variable at 0.25, the
magnitude of the effect of horizontal transmission is smaller than vertical determinants,
19

Table 4 – The choice of an Arabic name - Baseline results
(1) (2) (3) (4) (5) (6) (7) (8) (9)Dep. Var: Arabic name for baby
one parent/grandp. w/ Muslim country nat. 0.11a 0.09a 0.09a 0.09a 0.09a
(0.02) (0.01) (0.01) (0.01) (0.01)
one parent with Arabic name 0.28a 0.23a 0.23a 0.23a 0.23a 0.36a 0.36a 0.36a 0.34a
(0.02) (0.01) (0.01) (0.01) (0.01) (0.04) (0.04) (0.04) (0.04)
share of Arabic name in block (aged 4-10) 0.11a 0.09a 0.08a 0.09a 0.07a 0.03 0.06 0.07 0.00(0.03) (0.02) (0.02) (0.02) (0.02) (0.05) (0.06) (0.06) (0.06)
occupational information on penalty -0.05(0.16)
local unemployment penalty -0.02(0.02)
local information on penalty -0.86a -1.00a -1.06a -1.10a -2.95a -2.94a -3.19a -3.18a
(0.33) (0.34) (0.34) (0.36) (1.07) (1.09) (1.09) (1.08)
local Islamophobia 0.16 0.15 0.14 0.03 0.08 -0.10(0.14) (0.14) (0.15) (0.45) (0.49) (0.50)
local ELF index 0.05 0.06 0.04 -0.15 -0.13 -0.20(0.04) (0.04) (0.05) (0.12) (0.12) (0.14)
share of Arabic name in sector (aged 4-10) -0.02 -0.10(0.04) (0.11)
share of Arabic name in dept (aged 4-10) -0.18 0.12(0.13) (0.36)
share of Arabic name in block (aged 11-25) 0.01 0.08(0.04) (0.10)
share of Arabic name in block (aged 26-49) 0.04 0.15(0.04) (0.11)
share of Arabic name in block (aged 50+) -0.05 -0.15c
(0.04) (0.08)
one parent/grandp. w/ Muslim country nat. only Yes Yes Yes YesObservations 2806 3829 3829 3811 3777 992 992 987 973Pseudo R2 0.384 0.399 0.400 0.403 0.402 0.160 0.161 0.164 0.170Mean probability 0.24 0.19 0.19 0.19 0.19 0.50 0.50 0.50 0.51SD LIP 0.02 0.02 0.02 0.02 0.02 0.02 0.02 0.02SD Horizontal 0.25 0.24 0.24 0.24 0.23 0.28 0.28 0.28 0.28
Note: logit estimates (average marginal effects). Standard errors, clustered at the residential block level, are in parentheses witha, b and c respectively denoting significance at the 1%, 5% and 10%. All regressions include dummies for parental educationlevel, parental occupation group, departement of residence, and years.
20

but still important.
Column (1) presents results with a naive information structure of the economic penalty.
In this specification, the two main channels of information we consider, occupation and
neighbors, are entered in the regression separately. Parents are assumed to retrieve infor-
mation from (Arabic vs non-Arabic name-holders) unemployment differential i/ in their
own occupation (nationally), ii/ among their neighbors—independently of their occupa-
tion. Both coefficients are negative but lack statistical significance. Regarding the self-
occupation measurement, one should note that it is likely to be very noisy, since parents
should not systematically infer that their children will have the same occupation as them.
Besides and perhaps more importantly, our empirical strategy is not dealing with the fact
that parents can self-sort into occupation, another source of bias. The second variable,
unemployment penalty observed in the immediate neighborhood, is also likely to be a very
poor proxy for the perceived penalty. The Labour Force Survey is not stratified so as
to be representative at the block level, introducing considerable amount of noise in the
measurement of block-level unemployment by name type.
Column (2), therefore, goes to our preferred specification of the economic cost channel,
using the local information on penalty (LIP) variable. The vertical and horizontal channels
keep similar magnitudes and significance levels. The coefficient associated with the LIP
is negative and statistically significant at the one percent level. The estimated economic
disincentive of giving an Arabic name is larger in households who live in blocks populated
with individuals holding jobs most exposed to an employment penalty. How large is this
effect? A natural way to proceed with quantification in this type of econometric models is
to compute the predicted probability for all observations using the coefficients from column
(2) twice: once using the variables at their “true” levels, and a second time after having
shocked the variable of interest. Increasing LIP by one standard deviation (0.019) reduces
the probability of giving an Arabic name by 1.59 percentage points (8.4% of the mean
probability in this sample). It turns out that multiplying the average marginal effect by
the standard deviation (−0.86×0.019 = −0.01634) yields a very reasonable approximation
of the correct quantification accounting for the non-linearity of the estimator.
One might be concerned with a set of confounding factor related to the way we measure
the economic cost channel. For instance, housing blocks with more unskilled workers could
be more prone to social discrimination against Muslim-origin individuals, discouraging
parents from giving an Arabic name for non-economic reasons. Another concern is that
Arabic identity could be weaker in blocks with higher ethnic heterogeneity. Column (3) tries
21
to address this concern by controlling for two local measures of potential discrimination
against Arabic name holders. We first use answers to a question in a large-scale survey
about attitudes toward Muslims in France, designed to be representative at the occupation
level (Sauger, 2013). The most relevant question for our inquiry reads as: “Can you tell
me if ISLAM means to you something very positive, fairly positive, fairly negative, or very
negative?”. Following the structure of our LIP variable, we weight the occupation-specific
answers by the share of each occupation in the block. As a second control, we also include
a standard ELF (ethno-linguistic fractionalization) index measuring the heterogeneity of
households from different countries of origin within each block. Introducing those controls
in Column (3), we see that those alternative stories do not receive strong empirical support,
while the impact of the economic channel remains essentially unchanged.
Columns (4) and (5) document additional features of the horizontal channel. 18 In
column (4) we add the share of Arabic names for kids aged 4-10 in larger areas, either at the
sector level or at the departement level. Those two variables measure the spatial decay of
the horizontal transmission channel by looking at wider geographical units. Neither of those
two variables exhibit any significant influence, and the block-based horizontal estimate is
unchanged. This points to the importance of studying those channels of transmission at
a very fine-grained geographical level. Column (5) includes the share of Arabic names for
older cohorts with the aim of identifying the reference group of the parents in their naming
decisions. Overall, results from those two columns suggest that the horizontal channel only
operates through recent choices of close neighbors, i.e. local cohorts of children under 10
years old.
In the remaining columns of Table 4, we focus on the sample of “pure transmitters” by
looking at determinants of naming decisions among babies born in France while their par-
ents or grand-parents are born with a nationality from Algeria, Morocco, Tunisia, Turkey
and Middle-East countries. Columns (6) to (9) replicate columns (2) to (5) on that reduced
sample, yielding noticeable changes in our three channels of interest. The vertical channel
(now reduced to one variable by construction of the sample) is stronger than in the general
sample, while the horizontal channel becomes weaker and insignificant. Among the set of
parents with Muslim/Arabic cultural background, the naming patterns of direct neighbors
18In our baseline analysis, we measure the horizontal channel as the share of Arabic names among4-10 year-old children in a given block. This share is driven by the behavior of parents irrespective ofwhether they have Arabic names themselves. We checked whether the strength of the horizontal channelis differentiated when this share is evaluated among all parents in a block or among parents with Arabicnames only. We cannot reject the hypothesis that the effects are different (see Table A4 in the onlineappendix).
22

is much less relevant than the transmission of ones’ own cultural trait. Remarkably, the
effect of LIP is about three times larger for migrants from Muslim/Arabic origins than
for the full sample of parents. Renewing the quantification outlined above, we find that a
one standard deviation increase in the perceived economic cost reduces the probability of
giving an Arabic name to a child by around 5.5 percentage points (estimates from column
6). This is a large effect, representing more than a 10% fall in the baseline probability of
this sample (around 50%). Columns (7) to (9) add control variables for local xenophobia,
peer effects from older cohorts or from larger geographic localities. Like in the full sample,
the coefficients of those additional variables are not statistically significant. This finding
suggests that our estimates are unlikely to be pervasively contaminated by endogenous res-
idential sorting even for the population most likely to transmit their cultural background
(in which case the coefficients for older cohorts should also be non-zero).
We explore further the heterogeneity of the economic cost channel in our online ap-
pendix (Table A6). We show in that appendix that the average effect of the LIP estimated
in column (2) of Table 4 is entirely driven by parents with Muslim/Arabic origins. Naming
decisions by other parents do not react to the economic channel. Our interpretation is
that parents with a migration background have themselves probably been exposed to dis-
crimination over their lifetimes. In contrast, other parents have not and are consequently
less sensitive to the negative premium attached to Arabic names on the labor market.
Accordingly, the trade-off of interest in this paper between vertical transmission and the
economic cost channel seems to be relevant only for households with cultural backgrounds
that make them aware and more sensitive to the economic consequences of transmitting
their trait.
5 Robustness and extensions
In this section, we perform an extensive series of robustness tests. The two most important
ones are presented in details; they relate respectively to an alternative measurement of
the LIP and to the extrapolation of our findings (based on the sample of public housing
tenants) to the rest of the population. Other robustness tests are reported in a more
compact way—all additional details being relegated to the online appendix.
23

5.1 Conditional unemployment Differentials
In our baseline empirical analysis, the LIP is based on γl = ual − una
l , namely the observed
unconditional unemployment gap between Arabic and non-Arabic name holders in each
occupation l. We now investigate the robustness of our findings when the LIP is based
on conditional unemployment gaps retrieved from an auxiliary Mincer-type equation. Our
aim is to test for the stability of our main coefficients when we condition in the Mincer
equation with a wide range of observables (age, sex, Maghreb nationality, and a set of fixed
effects accounting in particular for education). Indeed, the unconditional unemployment
gap might be an imperfect measure of the information truly used by the parents to assess
the labor market penalty, leading to an attenuation bias in the estimation of α3 in (5).
In particular, parents might use additional information from the observed characteristics
of their neighbors, such as education or country of origin, to assess the specific penalty
associated with an Arabic name.
In Table 5 we replicate the set of regressions of Table 4, replacing the unconditional
version of the LIP with the conditional one (omitting the first column of Table 4 which uses
the naive and unsuccessful approach to measuring the economic cost channel). The analysis
related to the auxiliary equations, the estimation of the conditional unemployment gaps
and the construction of the LIP are detailed in section F of the online appendix. Comparing
the estimates obtained in each table, we observe an increase in α3 when estimated with
the second measure. Conditioning on observables therefore does not weaken (and actually
strengthens) the coefficient of interest.
24

Table 5 – The choice of an Arabic name - Conditional penalty
(1) (2) (3) (4) (5) (6) (7) (8)Dep. Var: Arabic name for babyone parent/grandp. w/ Muslim country nat. 0.09a 0.09a 0.09a 0.09a
(0.01) (0.01) (0.01) (0.01)one parent with Arabic name 0.23a 0.23a 0.23a 0.23a 0.36a 0.36a 0.36a 0.34a
(0.01) (0.01) (0.01) (0.01) (0.04) (0.04) (0.04) (0.04)share of Arabic name in block (aged 4-10) 0.08a 0.08a 0.09a 0.07a 0.04 0.06 0.07 -0.01
(0.02) (0.02) (0.02) (0.02) (0.05) (0.06) (0.06) (0.06)local info. on penalty (Mincer-based) -1.35a -1.35a -1.39a -1.44a -3.16a -3.03b -3.14a -3.33a
(0.37) (0.37) (0.37) (0.38) (1.17) (1.19) (1.18) (1.18)local Islamophobia 0.18 0.16 0.14 0.02 0.04 -0.17
(0.14) (0.14) (0.15) (0.45) (0.48) (0.50)local ELF index 0.06 0.07c 0.05 -0.12 -0.10 -0.18
(0.04) (0.04) (0.05) (0.12) (0.12) (0.14)share of Arabic name in sector (aged 4-10) -0.02 -0.09
(0.04) (0.11)share of Arabic name in dept (aged 4-10) -0.19 0.09
(0.13) (0.36)share of Arabic name in block (aged 11-25) 0.01 0.09
(0.04) (0.10)share of Arabic name in block (aged 26-49) 0.04 0.17
(0.04) (0.11)share of Arabic name in block (aged 50+) -0.05 -0.14c
(0.04) (0.08)one parent/grandp. w/ Muslim country nat. only No No No No Yes Yes Yes YesObservations 3829 3829 3811 3777 992 992 987 973Pseudo R2 0.401 0.401 0.404 0.403 0.160 0.161 0.164 0.170Average prob. 0.19 0.19 0.19 0.19 0.50 0.50 0.50 0.51
Note: logit estimates (average marginal effects). Standard errors, clustered at the residential block level, are in parentheseswith a, b and c respectively denoting significance at the 1%, 5% and 10% level. All regressions include dummiesfor parental education level, parental occupation group, departement of residence, and years.
25
5.2 How general are our results?
Beyond the usual econometric questions of identification and estimation, one can wonder
how general the obtained results are. In our case, the baseline regressions are estimated
using a specific part of the population, for which, we believe, biases linked to spatial
sorting in particular are minimized: Public housing tenants. Moreover, our central trade-
off between the vertical and economic cost channels is found to be mostly relevant for
households with Muslim/Arabic cultural background (see Section 4.2 and online appendix
Table A6). This group is also the main population of interest for the type of cultural
transmission under study. Therefore, the most important external validity question is
whether we can generalize results to all households with similar cultural backgrounds,
irrespective of whether or not they live in public housing. We provide two exercises to
that effect below.
Observables in public/private housing. Table 6 contains a number of characteristics
of public vs private housing tenants among our population of interest. The list of variables
covers a range of labor market outcomes and skill-levels. The first point of note is contained
in the last row of the table: A large fraction of households with Muslim/Arabic cultural
background in France lives in public housing. In our dataset, over 50% of babies born
from those households live in public housing units (992 versus 972). This implies that,
independently of potential differences with the private housing sample, the sample we use
for estimation and counterfactual exercises contains most of the relevant observations.
Regarding observable characteristics, Table 6 shows some expected differences in socio-
economic variables: Households living in public housing units have higher unemployment
propensities for both parents, and the mothers’ labor force participation is lower. However,
the differences are not statistically significant for two out of the three variables.
Differences in terms of occupations and education between the two groups are more
marked. Private housing hosts more high-skilled and much less low-skilled occupation
shares of the considered population of fathers, while the middle-skill shares are fairly
similar.19 We do see significant differences in terms of average monthly wages. However, it
is also instructive to look at the overall distribution of wages among the two populations,
which shows substantial overlap, as illustrated in figure 1, showing the densities of monthly
wages, separately for men and women. The “bump” in the low part of the distribution for
19 High-skill occupations refer to executives, managers, and engineers, while middle-skill refers to mid-management and technicians.
26

Table 6 – Characteristics of public vs private housing tenants among households with aMuslim/Arabic cultural background
All Public housing Private Housing Private-Public
Father is unemployed 0.17 0.20 0.15 -0.06**Mother is unemployed 0.13 0.14 0.12 -0.02Mother LFP 0.43 0.42 0.44 0.03Father has high-skill occ. 0.06 0.02 0.10 0.08***Father has middle-skill occ. 0.11 0.10 0.12 0.02Father has low-skill occ. 0.75 0.83 0.68 -0.15***Father: higher ed 0.09 0.07 0.12 0.05***Father’s monthly wage 1504.42 1372.75 1629.11 256.36***Mother’s monthly wage 1109.38 981.20 1214.90 233.69***Observations 1964 992 972 -20
1 Notes: This table presents the mean of a selected list of characteristics of households where atleast one parent or grandparent has a nationality from a Muslim-majority country (as defined insection 4.1). Within this population, it compares households living in public (column 2) versusin private housing (column 3) and test for the statistical significance of the difference (column4). Significance at the 1%, 5% and 10% level is denoted by ***, ** and * respectively.
women is the most noticeable difference, and is probably due to a larger share of part-time
female workers in public vs private housing.
The large overlap across households in public and private housing—even in terms of
observables that are key to gaining access to public housing such as monthly earnings—
might seem surprising. It is probably related to several factors driving the public housing
allocation process. In particular, the large weight given to number of children in households
when determining eligibility creates some overlap in overall income / education. Moreover,
the well-documented public housing shortage in most areas implies long waiting lists. While
the waiting time is a function of socio-economic variables, the actual access to public
housing will still depend largely upon when a family first applied.
27

Figure 1 – Distribution of the monthly wage for fathers (left) and mothers (right) acrossin public and private housing.
0
.0005
.001
.0015
estim
ated
den
sity
0 1000 2000 3000 4000 5000
father wage
public housing private housing
0
.0002
.0004
.0006
.0008
.001
estim
ated
den
sity
0 1000 2000 3000
mother wage
public housing private housing
Notes: This figure displays kernel density estimates for the distribution of public housing tenants (blacksolid line) and private housing tenants (gray dash line) separately among households where at least oneparent or grandparent has a Muslim-majority country nationality (as defined in section 4.1).
Re-weighting regressions. While the statistics displayed above are reassuring as to
the extrapolation of our results to the entire population (of Muslim/Arabic background
parents), small differences in terms of observable characteristics could still translate into
very different behavioral responses if those characteristics exert a strong mediating effect on
the channels (vertical, horizontal and economic) underpinning parental naming decisions.
In order to investigate this possibility, we carry out an additional regression-based test.
An intuitive approach would consist of replicating our baseline analysis for the overall
sample (or for the sample of households living in private housing). However, this would
lead us back to the first-order issue of endogenous spatial sorting of households, which is
likely to yield inconsistent estimates. Therefore, in keeping with our main specification
estimated on the public housing sample, we follow a different route, which involves re-
weighting observations of that sample. The procedure is designed so that the re-weighted
public housing sample displays similar distributions for a selected number of covariates
compared to the targeted sample (either the overall set of households, or the ones living in
private housing). To that effect, we adopt Hainmueller (2012)’s entropy balancing method.
Those entropy weights are computed to ensure the closest possible balance between the
two samples along the first moments of all the categorical variables presented in table
6.20 This test builds on the notion that the contrast between weighted and unweighted
estimates is informative about the presence of potential heterogeneous effects in behavioral
20We focus on categorical variables because for these matching the first moment is the natural target.
28

responses (Solon et al., 2015). Note that the weighted and unweighted estimates could be
similar for two reasons: Either there is indeed limited heterogeneity along the dimension
for which we are re-weighting or the weights are fairly uniformly close to 1 as there is very
limited unbalance between the public housing sample and the targeted sample among the
population studied.
Table 7 – Re-weighting the public housing sample to match the distribution of all and private housingsamples
(1) (2) (3) (4) (5)Public : No weight – : Weights, private –: Weights, all Private All
Father is unemployed 0.20 0.15 0.17 0.15 0.17Mother is unemployed 0.14 0.12 0.13 0.12 0.13Mother lab. force part. 0.42 0.44 0.43 0.44 0.43Father has high-skill occ. 0.02 0.10 0.06 0.10 0.06Father: higher ed 0.07 0.12 0.09 0.12 0.09
1 Notes: This table presents the mean of a selected list of characteristics of households with at least one parentor grandparent has a nationality from a Muslim-majority country (as defined in section 4.1). Column (1)presents statistics for the unweighted public housing sample. Column (2) presents statistics for the weightedpublic housing sample where weights are computed to match the private housing sample which is presentedin Column (4). Column (3) presents statistics public housing sample with weights computed to match theoverall sample which is presented in Column (5). The weights are obtained using Hainmuller (2012)’s entropybalancing. Entropy balancing relies produces a set of unit weights so that the re-weighted sample satisfiesa large set of pre-specified balance conditions based on known sample moments (here the first moments ofbinary variables).
The obtained weights can be used to check the balance between the re-weighted public
housing sample and the targeted sample. Those are displayed in Table 7. We compute two
sets of weights, one matching moments for the subset of households with Muslim/Arabic
background living in the private housing sector (column 2) and the other one matching the
overall household population (column 3). We see that, in both cases, the balance is almost
perfect, and t-tests (not displayed) all fail to reject any systematic differences.
We finally estimate the main specification on the re-weighted sample, using the two sets
of weights contained in Table 7. Results are displayed in Table 8. Comparing columns (2)
and (3), we see that, while the estimated effect of the economic channel is somewhat lower
when using the weights matching the private housing sample’s distribution, the difference
is quite small. The difference in estimate is even smaller when using the second set of
weights—which (as expected) yields results in between the unweighted sample (column 1)
and the weights matching the private sample (column 2). In both cases, the coefficients’
stability suggests that the results obtained from the public housing sample can be plausibly
29

extrapolated to the whole population of Muslim/Arabic background parents.21
Table 8 – Re-weighting the public housing sample to match all/private housinghouseholds
(1) (2) (3)
Reweigthed
Baseline Private Housing All
one parent with Arabic name 0.36a 0.38a 0.37a
(0.04) (0.04) (0.04)
share of Arabic name in block (aged 4-10) 0.03 0.03 0.03(0.05) (0.06) (0.06)
local information on penalty -2.95a -2.75a -2.88a
(1.07) (1.07) (1.07)
Observations 992 992 992Pseudo R2 0.160 0.182 0.168Mean probability 0.51 0.51 0.51
1 Notes: Logit estimates (average marginal effects). Standard errors, clustered at theresidential block level, are in parentheses with a, b and c respectively denoting signifi-cance at the 1%, 5% and 10%. All regressions include dummies for parental educationlevel, parental occupation group, departement of residence, and years. Column (2)and column (3) display results from the estimation of specifications that are identicalto the baseline specification displayed in column (1) except that the samples are nowre-weighted based on the entropy weights computed in order for the public housingsample to match a set of first moments of the distribution of the private housingsample (column 2) or overall sample (column 3). The variable used to compute theweights are presented in Table 7, namely: Binary variables for father and mother un-employment, mother labor force participation, father’s education and occupationalstatus.
5.3 Additional robustness checks
We now provide a number of additional robustness checks. Those are run on the sample
of children living in public housing, aged between 0 and 3, and born from parents with
Muslim/Arabic origins. This corresponds to Column 5 of our baseline results in Table
4. We focus on this specification because it is both one of the most demanding one in
term of sample restrictions, and also the most relevant one given our interest for cultural
21Naturally, our re-weighting procedure is based on a set of observable variables. We cannot exclude thepossibility that unobservable characteristics between the two samples would drive the heterogeneity in theresponses to the channels of interest and therefore would result in different responses among householdsliving private housing. Consequently, we choose to perform our counterfactual simulations in Section 6solely on the basis of the public housing sample, which, as mentioned above, includes a large share of therelevant population.
30
transmission decisions by immigrants and their descendants. The first set of robustness
exercises is provided in the main text, while the remainder is relegated to our online
appendix.
Weighted regressions and placebo tests. In Table 9, we perform two different ex-
ercises, both pertaining to statistical representativeness of the data. First we show that
our estimation results are robust to weighting observational units by their statistical rep-
resentativeness. Second, we perform two placebo tests to establish further that residential
sorting is unlikely to drive our results. For the sake of comparison, we start by reporting
our benchmark specification in the first column, namely the unweighted logit of Column
5 in Table 4. As discussed in Section 2, the LFS is stratified at the departement level
and representativeness is, thus, not guaranteed at the residential block level, our level of
analysis. In Column (2), we report the results for a weighted logit, where the individual
representativeness weights reported in the LFS are applied. We see that the 992 observed
children in the estimation sample of Column (1) represent 618,314 children nationwide.
More importantly, we notice that unweighted logit and weighted logit yield comparable
coefficients. We conclude that imperfect stratification at the block level is not an issue for
the estimation.
In the next two columns, we run placebo tests to rule out the possibility that our
estimated LIP could be driven by some residual statistical bias attached to endogenous
residential sorting. We replicate our benchmark specification on a fake sample of par-
ents/neighbors, artificially reallocated to random occupations in column (3) and to random
residential blocks in column (4). We see that, in both cases, the LIP coefficient, that is
based on neighbors occupations (see equation 4), drops and also loses its statistical signif-
icance. This makes us confident that our identification strategy, based on the sample of
children living in public housing, gets rid of endogenous residential sorting in an efficient
way.
Heterogeneous effects. In Table 10, we look at heterogeneous effects by splitting the
estimation sample along various relevant dimensions. In Columns (1) and (2), we document
the impact of cultural background by looking at couples where both parents have Arabic
origins and at mixed couples, respectively. The LIP coefficient, that captures the magnitude
of the economic cost channel, is larger for the latter (though less significant), while the
vertical transmission motive is stronger when both parents have Arabic origins.
Columns (3) and (4) display separately the results for 2nd generation children only
31

Table 9 – The choice of an Arabic name - Robustness 1
(1) (2) (3) (4)Dep. Var: Arabic name for baby
one parent with Arabic name 0.36a 0.35a 0.36a 0.36a
(0.04) (0.04) (0.04) (0.04)share of Arabic names in block (aged 4-10) 0.03 0.06 0.04 0.04
(0.05) (0.06) (0.05) (0.05)local info. on penalty -2.95a -2.23b 1.32 0.13
(1.07) (1.13) (1.10) (0.36)
Parent/grandp. w/ Muslim country nat. only yes yes yes yesSpecifications Bench. Weighted Placebo occup. Placebo blockObservations 992 618374 992 986Pseudo R2 0.160 0.178 0.155 0.153Mean pred. prob 0.50 0.51 0.50 0.51
Note: logit estimates (average marginal effects). Standard errors, clustered at the residential blocklevel, are in parentheses with a, b and c respectively denoting significance at the 1%, 5%and 10%. All regressions include dummies for parental education level, parental occupationgroup, departement of residence, and years.
(i.e. babies with parents who migrated to France) and for 3rd generation children only
(i.e. babies with parents who are born in France, but with at least one grandparent who
has Muslim/Arabic origins). The economic cost channel is much larger for the latter.
One interpretation is that parents with Arabic origins who are born in France are more
exposed to information on discrimination. For a given level of information, the gap in the
estimated effect could also be driven by different preferences, with newly arrived migrants
displaying a lower willingness to adjust the vertical transmission of their culture in response
to signals about the likely economic cost of such transmission for the economic well-being
of their child. Parents who are first-generation migrants appear to put less weight on
the economic cost of their naming decisions and attach somewhat more importance to the
vertical channel. First-generation parents may be less able to use their surroundings to
gather information on the labor market or less aware of the functioning of the labor market
when they have kids. The parameter additionally reflects the degree to which parents value
the economic welfare of their children. To the extent that parents discount such economic
welfare heavily, this will translate into a less negative value of α3. Accordingly, either
difference in the discount rate attached to their children’s economic welfare or differences in
information sensitivity could explain first-generation parents’ higher willingness-to-pay—in
terms of the penalty experienced by their offspring—to perpetuate their own culture.
In columns (5) and (6) of Table 10, we study how naming decision determinants differ
32
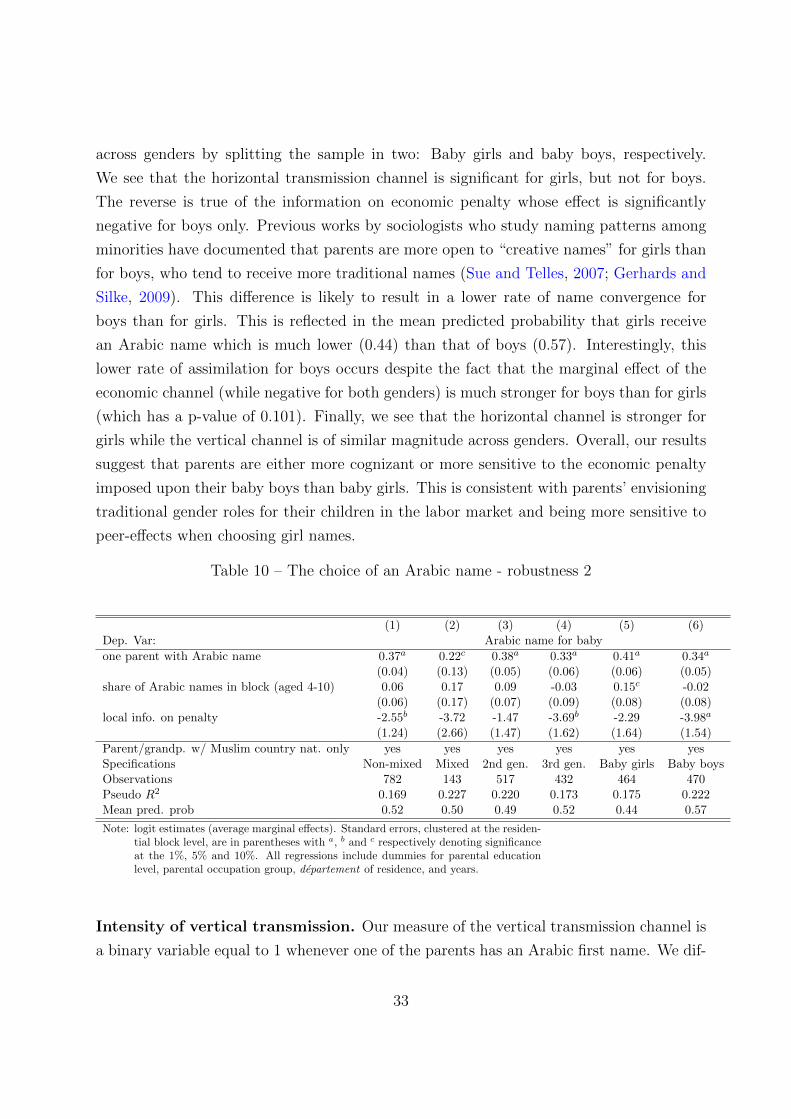
across genders by splitting the sample in two: Baby girls and baby boys, respectively.
We see that the horizontal transmission channel is significant for girls, but not for boys.
The reverse is true of the information on economic penalty whose effect is significantly
negative for boys only. Previous works by sociologists who study naming patterns among
minorities have documented that parents are more open to “creative names” for girls than
for boys, who tend to receive more traditional names (Sue and Telles, 2007; Gerhards and
Silke, 2009). This difference is likely to result in a lower rate of name convergence for
boys than for girls. This is reflected in the mean predicted probability that girls receive
an Arabic name which is much lower (0.44) than that of boys (0.57). Interestingly, this
lower rate of assimilation for boys occurs despite the fact that the marginal effect of the
economic channel (while negative for both genders) is much stronger for boys than for girls
(which has a p-value of 0.101). Finally, we see that the horizontal channel is stronger for
girls while the vertical channel is of similar magnitude across genders. Overall, our results
suggest that parents are either more cognizant or more sensitive to the economic penalty
imposed upon their baby boys than baby girls. This is consistent with parents’ envisioning
traditional gender roles for their children in the labor market and being more sensitive to
peer-effects when choosing girl names.
Table 10 – The choice of an Arabic name - robustness 2
(1) (2) (3) (4) (5) (6)Dep. Var: Arabic name for baby
one parent with Arabic name 0.37a 0.22c 0.38a 0.33a 0.41a 0.34a
(0.04) (0.13) (0.05) (0.06) (0.06) (0.05)share of Arabic names in block (aged 4-10) 0.06 0.17 0.09 -0.03 0.15c -0.02
(0.06) (0.17) (0.07) (0.09) (0.08) (0.08)local info. on penalty -2.55b -3.72 -1.47 -3.69b -2.29 -3.98a
(1.24) (2.66) (1.47) (1.62) (1.64) (1.54)
Parent/grandp. w/ Muslim country nat. only yes yes yes yes yes yesSpecifications Non-mixed Mixed 2nd gen. 3rd gen. Baby girls Baby boysObservations 782 143 517 432 464 470Pseudo R2 0.169 0.227 0.220 0.173 0.175 0.222Mean pred. prob 0.52 0.50 0.49 0.52 0.44 0.57
Note: logit estimates (average marginal effects). Standard errors, clustered at the residen-tial block level, are in parentheses with a, b and c respectively denoting significanceat the 1%, 5% and 10%. All regressions include dummies for parental educationlevel, parental occupation group, departement of residence, and years.
Intensity of vertical transmission. Our measure of the vertical transmission channel is
a binary variable equal to 1 whenever one of the parents has an Arabic first name. We dif-
33
ferentiate the effect depending on whether the mother only, the father only or both parents
have an Arabic first name. Households where none of the parents have an Arabic name is
the reference group. Results are presented in the online appendix Table A5, in which we
see that couples where the mother has an Arabic name are 19% more likely to give an Ara-
bic name to their child than couples where neither of the parents carries an Arabic name.
Interestingly, the father having an Arabic name is associated with a somewhat larger in-
crease in the probability (+22%). Finally, we see that having both parents carry an Arabic
name is associated with a substantially larger effect (+26%). The finding that the father’s
cultural marker has a larger influence on naming is consistent with previous sociological
studies (see Sue and Telles, 2007, who studies naming pattern among Hispanics in the US).
Once we focus on individuals with an immigration background from Muslim countries, we
see the same ordering in terms of the size of the vertical channel across categories of couples.
Use of measure of relative penalty rather than in levels. Our analysis is based
on a measure of occupation-specific penalties expressed in levels, i.e. the difference in
percentage point of unemployment rates between Arabic and non-Arabic name holders. In
section E.1 of our online appendix, we show that using relative unemployment penalties,
i.e. the ratio of unemployment rates of Arabic name holders versus that of individuals with
non-Arabic names, leads to quantitatively similar results (see in particular Table A2 of that
appendix). We further show that our results are unchanged when using the measure of
penalty in levels and controlling for baseline unemployment rate, i.e. unemployment among
non-Arabic-name workers, as predicted by the occupations of neighbors (see Table A1 in
particular).
Interaction between the horizontal and economic cost channels. A concern that
might arise regarding the economic channel is that part of it could operate through the
horizontal channel. Indeed, the intensity of Arabic name-giving in a given block is the
result of individual decisions that are themselves a function of the LIP (since the naming
decision is also the LHS variable, this results in a potential manifestation of the reflection
problem). In that setting, conditioning on the share of children with Arabic names might
bias our estimate of the marginal effect of the LIP due to post-treatment bias (Imai et al.,
2011). A feature of our benchmark regressions, which should mitigate the possibility that
the horizontal channel is a product of the LIP, is that we measure the horizontal channel as
the lagged block-level share of Arabic names given to children. There is, thus, a minimum of
34

1 year between the naming decision of households we are analyzing (as the LHS variable)
and the realization of the same outcome among peers in our measure of the horizontal
channel (as a RHS variable).
In order to further assess how the magnitude of our economic channel estimates depends
upon the presence of the horizontal channel, we provide robustness regressions, where
we re-estimate our baseline specification without measuring the horizontal channel. The
results, reported in Table A3 of the online appendix, show that omitting the horizontal
channel variable leaves the estimated coefficient associated with the economic cost virtually
unchanged. This suggests that, while interactions between the horizontal and economic
cost channels could, in principle, be an issue for our estimation, they do not seem to matter
in practice.
6 Quantification and Welfare Analysis
We now turn to quantifying the effects of vertical, horizontal, and economic channels in the
naming decision. We first analyze the short-run contributions of each channel. We then
perform a welfare analysis. In section D of the online appendix, we also quantify the long-
run effects taking into account the dynamics of inter-generational cultural transmission.
All the analysis is based on estimates from our baseline Table 4.
6.1 Short-run effects
In Table 4, coefficients are reported as average marginal effects over choices in our sample.
Therefore, the change in the baseline probability of an independent change in each channel
is easy to interpret (see section 4.2). An alternative, and interesting, way to quantify those
effects relative to each other is to look at the model’s predicted numbers of babies born with
an Arabic name when we shut down each of the three channels in turn. In order to calculate
such counterfactuals, we adopt the following strategy: We start by running our benchmark
regression to estimate the coefficients of interest, which gives us the benchmark probability
of transmitting an Arabic first name in the sample. Then we run the counterfactual by
changing the values for one or more explanatory variables. For instance, we shut down
the economic cost channel by forcing the LIP variable to be zero for the whole sample.
The logit formula (6) provides the counterfactual naming probability for each observation.
Summing those over the sample gives the counterfactual number of babies born with an
35

Arabic name in each experiment. This procedure ensures that the probability remains
within the admissible range while doing a “what if” experiment.
Results are reported in Table 11, where different lines present different scenarios. We
focus on the sample of babies born from parents with a Muslim/Arabic background and
living in public housing (the point estimates of column (6) in Table 4). The first line reports
the true number of babies with an Arabic name, 501 in this sample; they represent 320,851
babies nationally when survey weights are applied. The second line is the number of babies
born with Arabic names as predicted by the benchmark regression of column (6). We then
remove (in the third row) the vertical channel associated with parental name. The predicted
number of Arabic naming decisions falls to 221 in that case, that is, 44% of true births. This
is a quite drastic cut, especially when compared to the horizontal channel, where a similar
thought experiment removes only 2% of Arabic naming decisions from the benchmark.
The economic channel has a much stronger effect than the horizontal one: removing the
economic penalty completely increases the number of babies receiving an Arabic name by
56%. The line “no ghetto” shows the results from a slightly different experiment. In this
scenario, all blocks in the country had the same neighborhood composition and the same
information on unemployment penalty. This amounts to considering the predicted number
of babies when averaging the horizontal and penalty variables, which induces effects that
almost cancel out in naming choices on average.
Table 11 – Quantification of the 3 channels
# babies with arabic name Mean ∆ Welfare wrt benchmarkScenario: count weighted count change weighted changetrue figure 501 320851 . .benchmark 501 316292 . .no vertical (parental name) 221 139636 -.555 -.567no horizontal 491 310516 -.026 -.024no penalty 783 490945 1.098 1.109no ghetto 500 316275 .002 .005no foreign names 0 0 -.822 -.838Note: This table uses logit estimates (col 6 of Table 5) based on the sample of 992 babies (0-3 years
old) with Arabic origins and living in public housing (representing 618374 nationally). Eachline presents a scenario, removing in turn one of the channels of influence in the regression.
36
6.2 Welfare analysis
Our random-utility, discrete-choice model of naming choice allows for a quite simple charac-
terization of welfare changes associated with the different thought experiments of Table 11.
A natural metric for welfare in this model is the expected value of parental maximum util-
ity between naming choices (the theoretical analysis of welfare analysis in our model is
provided in online appendix B). This varies across households, and we average this welfare
over our sample (a simple average in the third column of Table 11, and a weighted one
in the fourth). Note that we consider welfare from the parental perspective—a natural
approach in this short-run analysis, where parents are the decision makers in term of nam-
ing choice. When it turns to modeling inter-generational dynamics (Online appendix D),
the approach has to be qualified because our underlying model of cultural transmission is
based on an assumption of imperfect altruism (see our theoretical discussion in section 3.1):
This implies that children’s welfare and parents’ welfare cannot be treated as one and the
same.
The absolute level of welfare has no meaningful unit in the logit model—as noted by
Anderson et al. (1992) and Train (2009)—and a natural way to quantify welfare changes
is first to take the difference between welfare in each scenario and the benchmark case and
then compare across scenarios. Looking at the last two columns of Table 11, we see, for
instance, that the negative impact of removing the vertical transmission motive would be
more than twenty times larger than the effect of removing the horizontal one. Consid-
ering economic penalty, the effect naturally varies according to the cut in the additional
unemployment rate associated with Arabic names. If this penalty were brought to zero,
the gain in welfare would be about twice as large as the one arising from the utility boost
linked to vertical transmission. Figure 2 spans over a wider set of changes in economic
penalty and compares it to the welfare changes associated with vertical transmission. The
x-axis reports the counterfactual economic penalty (percentage point differences in unem-
ployment rates). The y-axis measures welfare change differences with the benchmark level
(with zero change occurring at the sample average of economic penalty, around 11 per-
centage point difference). We also represent the utility gain (with respect to benchmark)
associated with vertical transmission. An interesting conclusion from this figure is that we
are now able to gauge cultural attachment strength in monetary units. Indeed the vertical
transmission motive of one’s cultural trait is equivalent in terms of welfare gains to a cut
by around half the perceived economic penalty associated with that trait. Since, in this
sample, this amounts to cutting the penalty by around 6 percentage points, using the esti-
37

mates of unemployment-related income loss reported in section F of the online appendix,
the vertical transmission channel is found to be on the same indifference curve as a 3%
upward shift in lifetime income of one’s child.
It is possible to look for differences in the monetary valuation of cultural attachment
across households. Probably the most meaningful source of heterogeneity is related to
whether the parents choosing a name for their baby are themselves first-generation migrants
from Arabic countries versus being born in France from migrating Arabic parents. This
distinction is done in columns 3 and 4 of Table 10, and we reproduce in online appendix C
the equivalent of figure 2 for the sub-samples of 1st and 2nd generation parents separately
(Figure A1). Interestingly, we find a much stronger monetary equivalent of the vertical
transmission motive for first-generation migrants. For those, the vertical transmission
channel is on the same indifference curve as a 6.2% upward shift in lifetime income of one’s
child while for second generation parents this figure amounts to a 2.3% upward shift in
lifetime income.
Figure 2 – Welfare in the short-run, economic penalty. and vertical transmission
benchmark penalty
-.5
0.5
1W
elfa
re c
hang
e w
rt b
ench
mar
k
0 .05 .1 .15 .2Economic Penalty (additional unemp. propensity)
Economic PenaltyVertical Transmission
Finally, we consider an experiment where France would return to historical naming
regulations. Between 1803 and 1993, the choice of first names was essentially restricted
to Saints’ names, names from ancient Greece and Rome, and names from the Bible. The
legal procedure was that a civil officer had to state whether the name proposed by the
parents respected the 1803 Napoleonic law. If the answer was negative, the parents had
38

to challenge the decision in court. Foreign names were hardly tolerated at all before a
1987 revision explicitly asked civil officers to be more liberal with names coming from a
“foreign or French tradition, whether national or local”. Note that the computation of
this scenario involves shutting down not only all three channels emphasized in our paper,
but also the occupation, regional, and educational controls we have in the regression, in
order to generate a predicted number of babies with Arabic names of 0. The mean welfare
loss from this return to a strict ban on foreign—and therefore Arabic—names would be
substantial, around 50% larger than the cut of the vertical channel alone.
Long-run implications. In Section D of the online appendix, we explore the long-run
implications of our structural model on naming patterns. To this purpose we consider
a simple extension of the static model described in Section 3 that accounts for inter-
generational cultural transmission dynamics. We restrict our focus to a partial equilibrium
setup where any potential feedback effect of naming patterns on the economic penalty is
ignored—admittedly an important simplification in a long-run perspective. We come up
with two main findings. First, our quantification shows that the long-run share of Ara-
bic name-holders predicted by our structural model for the population of Muslim/Arabic
background individuals living in public housing should converge to 9%, which is much
smaller than the actual one in our sample (48%). Hence, the actual share is still far from
its steady-state value and transitory dynamics are expected to bring it down in the future.
This feature might be explained by the fact that migration from Arabic countries is still a
quite recent phenomenon in France, and most babies born in the 2003-2007 period belong
to the third generation of migrants only. Second, our analysis confirms that the economic
cost channel is also a key driver of cultural transmission in the long run. In a counter-
factual scenario, where the labor-market penalty attached to Arabic names is artificially
brought to zero, the long-run share of Arabic name-holders should converge to a much
larger steady-state level, namely 36% instead of 9%. Finally, we refrain from drawing any
strong conclusion with respect to long-run welfare effects. As discussed above, defining
a welfare criterion in an inter-generational model of cultural transmission would require
taking a stance on the degree of parental altruism. This would imply extending the model
beyond the scope of current paper.
39

7 Conclusion
While it might seem natural to consider culture as a deep individual characteristic, our
paper shows that the cultural choices made by a person cannot be completely insulated
from the economic context in which he/she operates. We focus on one cultural trait that
has the advantage of being easily measurable, identified by social sciences as a key marker
of cultural identity, and has economic consequences: First names.
Our results show that the information about economic factors available to parents
deeply shape individual decisions of cultural transmission. While the vertical channel
plays a key role in the cultural transmission process, parents do account for the information
about the economic cost of their cultural trait in their naming decisions. Counterfactually
reducing the economic penalty on Arabic names to zero, the annual number of babies born
with an Arabic name in France would be more than 50 percent larger. The horizontal
channel, which has been the focus of much attention in the social interaction literature,
is found to be much less important in our case. Our theory-based estimates allow us to
perform a welfare analysis where we gauge cultural attachment strength in monetary units.
We find that allowing for a vertical transmission channel provides the same shift to parents’
utility as a 3% raise in lifetime income of the child. We also show that a return to an old
regulation banning choice of names of foreign origins would cause very important losses to
the well-being of parents.
While we have focused on naming decisions, our paper opens new questions on the
welfare effects of public policies aiming at promoting or restraining expressions of cultural
identity, such as wearing religious signs in public areas. It also raises questions about
the use in academic papers of cultural traits as determinants of economic outcomes. It
seems clear from our results that at least some aspects of culture cannot be considered as
exogenous to what happens in the economic sphere.
40
References
Abramitzky, R., Boustan, L. and Eriksson, K. (2020). Do immigrants assimilate
more slowly today than in the past? American Economic Review: Insights, 2 (1), 125–
41.
—, Boustan, L. P. and Eriksson, K. (2016). Cultural assimilation during the age of
mass migration. Tech. rep., National Bureau of Economic Research.
Adida, C. L., Laitin, D. D. and Valfort, M.-A. (2010). Identifying barriers to muslim
integration in france. Proceedings of the National Academy of Sciences, 107 (52), 22384–
22390.
Aeberhardt, R., Fougere, D., Pouget, J. and Rathelot, R. (2010). Wages and
employment of french workers with african origin. Journal of population economics,
23 (3), 881–905.
Akerlof, G. A. and Kranton, R. E. (2000). Economics and identity. The Quarterly
Journal of Economics, 115 (3), 715–753.
Alesina, A., Baqir, R. and Easterly, W. (1999). Public goods and ethnic divisions.
The Quarterly journal of economics, 114 (4), 1243–1284.
— and Giuliano, P. (2015). Culture and institutions. Journal of Economic Literature,
53 (4), 898–944.
Algan, Y. and Cahuc, P. (2013). Trust and growth. Annu. Rev. Econ., 5 (1), 521–549.
—, Dustmann, C., Glitz, A. and Manning, A. (2010). The economic situation of first
and second-generation immigrants in france, germany and the united kingdom.
—, Hemet, C. and Laitin, D. D. (2016). The social effects of ethnic diversity at the local
level: A natural experiment with exogenous residential allocation. Journal of Political
Economy, 124 (3), 696–733.
Anderson, S. P., De Palma, A. and Thisse, J.-F. (1992). Discrete choice theory of
product differentiation. MIT press.
Arrow, K. J. (1972). Models of job discrimination. Racial discrimination in economic
life, 83.
41

Atkin, D., Colson-Sihra, E. and Shayo, M. (2019). How do we choose our identity?
a revealed preference approach using food consumption. Tech. rep., National Bureau of
Economic Research.
Baert, S., Cockx, B., Gheyle, N. and Vandamme, C. (2015). Is there less discrimi-
nation in occupations where recruitment is difficult? ILR Review, 68 (3), 467–500.
Bertrand, M. and Mullainathan, S. (2004). Are emily and greg more employable
than lakisha and jamal? a field experiment on labor market discrimination. American
economic review, 94 (4), 991–1013.
Bisin, A., Patacchini, E., Verdier, T. and Zenou, Y. (2011). Formation and persis-
tence of oppositional identities. European Economic Review, 55 (8), 1046–1071.
—, —, — and — (2016). Bend it like beckham: Ethnic identity and integration. European
Economic Review, 90, 146–164.
—, Topa, G. and Verdier, T. (2004). Religious intermarriage and socialization in the
united states. Journal of political Economy, 112 (3), 615–664.
— and Verdier, T. (2001). The economics of cultural transmission and the dynamics of
preferences. Journal of Economic Theory, 97 (2), 298–319.
— and — (2011). The economics of cultural transmission and socialization. In Handbook
of social economics, vol. 1, Elsevier, pp. 339–416.
Booth, A. and Leigh, A. (2010). Do employers discriminate by gender? a field experi-
ment in female-dominated occupations. Economics Letters, 107 (2), 236–238.
Breuil-Genier, P. (2001). Les variations des revenus individuels entre periodes de
chomage et d’emploi. Economie et Statistiques, pp. 61–79.
Brock, W. A. and Durlauf, S. N. (2001). Discrete choice with social interactions. The
Review of Economic Studies, 68 (2), 235–260.
Combes, P.-P., Decreuse, B., Laouenan, M. and Trannoy, A. (2016). Customer
discrimination and employment outcomes: theory and evidence from the french labor
market. Journal of Labor Economics, 34 (1), 107–160.
42

Duguet, E., Leandri, N., L’horty, Y. and Petit, P. (2010). Are young french
jobseekers of ethnic immigrant origin discriminated against? a controlled experiment in
the paris area. Annals of Economics and Statistics/Annales d’Economie et de Statistique,
pp. 187–215.
Fernandez, R. (2011). Does culture matter? In Handbook of social economics, vol. 1,
Elsevier, pp. 481–510.
Fouka, V. (2019). How do immigrants respond to discrimination? the case of germans in
the us during world war i. American Political Science Review, 113 (2), 405–422.
— (2020). Backlash: The unintended effects of language prohibition in us schools after
world war i. The Review of Economic Studies, 87 (1), 204–239.
Fryer, J. R. G. and Levitt, S. D. (2004). The causes and consequences of distinctively
black names. The Quarterly Journal of Economics, 119 (3), 767–805.
Gerhards, J. and Silke, H. (2009). From hasan to herbert: Name-giving patterns of
immigrant parents between acculturation and ethnic maintenance. American Journal of
Sociology, 114 (4), 1102–1128.
Goel, D. and Lang, K. (2019). Social ties and the job search of recent immigrants. ILR
Review, 72 (2), 355–381.
Goux, D. and Maurin, E. (2007). Close neighbours matter: Neighbourhood effects on
early performance at school. The Economic Journal, 117 (523), 1193–1215.
Guiso, L., Sapienza, P. and Zingales, L. (2008). Social capital as good culture. Journal
of the European Economic Association, 6 (2-3), 295–320.
—, — and — (2016). Long-term persistence. Journal of the European Economic Associ-
ation, 14 (6), 1401–1436.
Hainmueller, J. (2012). Entropy balancing for causal effects: A multivariate reweighting
method to produce balanced samples in observational studies. Political Analysis, 20 (1),
25–46.
— and Hiscox, M. J. (2010). Attitudes toward highly skilled and low-skilled immigration:
Evidence from a survey experiment. American political science review, 104 (1), 61–84.
43

— and Hopkins, D. J. (2014). Public attitudes toward immigration. Annual Review of
Political Science, 17, 225–249.
Heckman, J. J. (1998). Detecting discrimination. Journal of economic perspectives,
12 (2), 101–116.
Hellerstein, J. K., McInerney, M. and Neumark, D. (2011). Neighbors and cowork-
ers: The importance of residential labor market networks. Journal of Labor Economics,
29 (4), 659–695.
Imai, K., Keele, L., Tingley, D. and Yamamoto, T. (2011). Unpacking the black
box of causality: Learning about causal mechanisms from experimental and observational
studies. American Political Science Review, 105 (4), 765–789.
INSEE (2016). France, portrait social. INSEE.
Jacquot, A. (2007). L’occupation du parc hlm: un eclairage a partir des enquetes loge-
ment de l’insee. Document de travail Insee, n. F0708.
Jouniaux, L. (2001). Les 20,000 plus beaux prenoms du monde. Hachette eds.
Lieberson, S. (2000). A matter of taste: How names, fashions, and culture change. Yale
University Press.
Manski, C. F. (1993). Identification of endogenous social effects: The reflection problem.
The review of economic studies, 60 (3), 531–542.
Maurin, E. and Moschion, J. (2009). The social multiplier and labor market partici-
pation of mothers. American Economic Journal: Applied Economics, 1 (1), 251–72.
Mazumder, S. (2019). Becoming white: How mass warfare turned immigrants into amer-
icans. mimeo Harvard.
Neal, D. A. and Johnson, W. R. (1996). The role of premarket factors in black-white
wage differences. Journal of political Economy, 104 (5), 869–895.
Nunn, N. and Wantchekon, L. (2011). The slave trade and the origins of mistrust in
africa. American Economic Review, 101 (7), 3221–52.
44

Rathelot, R. (2014). Ethnic differentials on the labor market in the presence of asym-
metric spatial sorting: Set identification and estimation. Regional Science and Urban
Economics, 48, 154–167.
Riach, P. A. and Rich, J. (2006). An experimental investigation of sexual discrimination
in hiring in the english labor market. Advances in Economic Analysis & Policy, 5 (2).
Sauger, N. (2013). Citoyens et candidats en 2012: convergence ou divergence de vues?
enquete tns sofres/trielec 2012.
Shayo, M. (2009). A model of social identity with an application to political economy:
Nation, class, and redistribution. American Political science review, 103 (2), 147–174.
Solon, G., Haider, S. J. and Wooldridge, J. M. (2015). What are we weighting for?
Journal of Human resources, 50 (2), 301–316.
Sue, C. A. and Telles, E. E. (2007). Assimilation and gender in naming. American
Journal of Sociology, 112 (5), 1383–1415.
Tabellini, G. (2008). The scope of cooperation: Values and incentives. The Quarterly
Journal of Economics, 123 (3), 905–950.
Train, K. E. (2009). Discrete choice methods with simulation. Cambridge university press.
Voigtlander, N. and Voth, H.-J. (2012). Persecution perpetuated: the medieval ori-
gins of anti-semitic violence in nazi germany. The Quarterly Journal of Economics,
127 (3), 1339–1392.
45

ONLINE APPENDIXTheoretical appendix
A Local Information Penalty: Theoretical Motivation
In this section, we motivate the the use of the difference in unemployment rate as the
measure of penalty at the occupational level. We show how the difference enters naturally
the objective function of parents maximizing their child’s expected utility. To see this, it
is useful to consider the level of the utility of parents i living in block k(i) in a simplified
setting where it depends solely on a cultural taste for vertical transmission and an economic
penalty on children (note that in a discrete choice model, only differences in utility over
alternatives can be identified from the data, but it is important to examine the utility level
to see how the penalty should be modeled.) We omit the time subscript for simplicity.
The parents’ utility obtained from choosing an Arabic name for their child is denoted
Ui(1) as specified in equation (1). It is the sum of cultural component C(1) and an altruistic
component which is their child’s expected utility E(U childi (1)), that is we have:
Ui(1) = C(1)︸︷︷︸parental utility from
giving an Arabic name
+β × E(U childi (1))︸ ︷︷ ︸
expected utility of childwhen given an Arabic name
+ εi(1), (7)
where β account for the fact that the parents might be imperfectly altruistic and discount
their child’s utility and εi(1) is an error term.
We consider the case where an Arabic name affects the probability of being unemployed
in a given occupation but not the utility when employed. This assumption is in line with
the evidence showing that discrimination affects the employment probability but not the
wage of individuals with an immigrant background (Aeberhardt et al., 2010; Rathelot,
2014).22 We denote ul(1) the probability of being unemployment in occupation l if given
an Arabic name. We can then write E(U childi (1)) as:
E(U childi (1)) =
∑l
ωl,k(i) × ul(1)× Ul,unemp︸ ︷︷ ︸child expected utility if unemployed
+∑l
ωl,k(i) × (1− ul(1))× Ul,emp︸ ︷︷ ︸child expected utility if employed
,
22The finding of substantial employment ethnic gap combined with little ethnic wage gap conditionalon employment is not specific to the French setting (for an analysis of the Black-White wage gap in theUnited-States case see Neal and Johnson (1996))
A0

where Ul,emp and Ul,unemp refer to the level of utility when employed and when unemployed
respectively and ωl,k are – like in the body of the paper – the share of neighbors in block k
with occupation l. From the point of the view of the parents, what matters for the decision
is the difference in a child’s expected utility between the case where she/he is given Arabic
name or not. We can write this difference as:
E[Cit]︸ ︷︷ ︸Economic Cost
≡ E(U childi (1))− E(U child
i (0))
=∑l
ωl,k(i) × (ul(1)− ul(0))︸ ︷︷ ︸∆ in unemp. rate
×(Ul,unemp − Ul,emp)
=∑l
ωl,k(i) × γl × (Ul,unemp − Ul,emp).
We see that the unemployment penalties in this formulation enter as differences in unem-
ployment probabilities and not as ratios of unemployment probabilities. Note that this
result is independent of how utilities in the state of employment and unemployment are
specified.
B Welfare Analysis
The absolute level of utility of a discrete choice model exposed in the main draft cannot
be identified. Hence, without loss of generality, we can express individual i’s welfare in our
binary model specified in terms of cross-alternative utility differentials:
Wi ≡ E{max [0; ∆Vi + δi]} (8)
With δi logistically distributed and σ its scaling parameter, this expectation becomes
(Small and Rosen 1981, Anderson et al. 1992)
Wi = σ ln [1 + exp(∆Vi/σ)] + λ (9)
where λ is a term that is constant across individuals and alternatives. Note that both λ
and σ cannot be identified from the data and are unknown. This reflects the fact that
the absolute value of utility cannot be interpreted in the logit, and that we can only put
meaningful numbers on relative welfare.
The change in individual welfare between the benchmark condition B and a counterfac-
A1

tual condition A1 is given by
∆W A1i = σ ×
(ln[1 + exp(∆VA1
i /σ)]− ln
[1 + exp(∆VB
i /σ)])
(10)
where ∆VA1i and ∆VB
i correspond to utility differentials (of choosing Arabic vs non-Arabic
names) in the benchmark and counterfactual conditions respectively.
The change in aggregate welfare is obtained by averaging (10) across the sampled
population
∆WA1 =σ
N
(∑i
ln[1 + exp(∆VA1
i /σ)]− ln
[1 + exp(∆VB
i /σ)])
, (11)
which still has no meaningful unit because of the unknown scaling parameter σ. The solu-
tion consists in computing the relative change in aggregate welfare between two different
counterfactuals A1 and A2
∆WA1
∆WA2=
∑i (ln [1 + exp(∆VA1
i /σ)]− ln [1 + exp(∆VBi /σ)])∑
i (ln [1 + exp(∆VA2i /σ)]− ln [1 + exp(∆VB
i /σ)]). (12)
Equation (12) involves a double comparison (i.e. a ratio of welfare change) and its inter-
pretation is subtle. For the sake of exposition, in the main text, Table (11) and Figure
1 report, for each counterfactual A, the welfare change ∆WA under the standard scaling
assumption σ = 1. However, when discussing the effects, we pay attention to analyzing
only the ratio of welfare change between counterfactuals.
C Welfare effects for different generations of migrants
Figure A1 - Appendix reproduces the Figure 1 - Main text for two samples of baby naming
decisions. The (a) panel takes all babies born from parents living in French public housing
themselves being born in an Arabic country. The (b) panel constrains the set of parents
to have Arabic origins, but being born on French territory (the coefficients used come
from the last two columns of Table (10) from the main draft. The x-axis axis reports
the counterfactual economic penalty (percentage point differences in unemployment rates).
The y-axis measures welfare changes (with respect to the benchmark level). The horizontal
bar represents the utility gain (wrt benchmark) associated with vertical transmission.
A2

Figure A1 – Welfare in the short run, economic penalty and vertical transmission
(a) 2nd generation babies, 2006 (b) 3rd generation babies
benchmark penalty-.6
-.3
0.3
.6.9
1.2
1.5
Wel
fare
cha
nge
wrt
ben
chm
ark
0 .05 .1 .15 .2Economic Penalty (additional unemp. propensity)
Economic PenaltyVertical Transmission
benchmark penalty-.6
-.3
0.3
.6.9
1.2
1.5
Wel
fare
cha
nge
wrt
ben
chm
ark
0 .05 .1 .15 .2Economic Penalty (additional unemp. propensity)
Economic PenaltyVertical Transmission
D Long run effects
D.1 The dynamic version of the model
In this section we assess the long run implications of our structural model on the naming
patterns. We run various counterfactual experiments based on our estimates of the naming
decision of descendants of migrants from Arabic countries (Column 6 of Table 4).23 To this
purpose we consider a simple dynamic extension of the static model described in Section
3. We restrict our focus to a partial equilibrium analysis where any potential feedback
effect of naming patterns on the economic penalty is ignored—obviously an important
simplification in a long run perspective.
Let us consider that blocks are populated by a large number of agents N . To keep the
model tractable, we consider that agents differ only in their name type. We denote mt the
share of Arabic name holders at date t. Time is discrete. Abstracting from demographic
and fertility issues, we impose a constant N by assuming that just before death each agent
gives birth to a unique child whose name is chosen by his parent. Mortality is ruled by
a Poisson process with parameter θ. The naming decision follows the model described in
Section 3. We denote (P0,t,P1,t) the probability of giving an Arabic name for, respectively,
a non-Arabic parent and an Arabic parent. Those probabilities potentially differ because
of the vertical transmission channel. The law of motion of the share of Arabic name holders
23Simulations for population of all origins are available upon request from the authors
A3

is given by
mt+1 = (1− θ)×mt + θ[(1−mt)× P0,t +mt × P1,t]. (13)
Labeling µ the steady state value of mt, we have
µ = (1− µ)× P0 + µ× P1, (14)
where the steady state probabilities of transmission, (P0,P1), are characterized by equation
(6). Those can be conveniently rewritten as
PA = [1 + tanh(∆VA/2σ)] /2, (15)
where tanh(x) ≡ (ex− e−x)/(ex + e−x) and ∆VA is the observable utility differential (with
A ∈ {0, 1}). In ∆VA/σ, the steady state value of the horizontal component is equal to
E(mt) = µ and the parameters (α0, α1, α2, α3) correspond to the point estimates retrieved
from our empirical analysis. We thus have
∆VA/σ = α0 + α1A+ α2µ+ α3C with A ∈ {0, 1}, (16)
where C corresponds to an exogenous economic penalty attached to Arabic name holders.
Combining (14), (15) and (16), we obtain µ as a solution to the following fixed point
equation
µ =1
2+
1− µ2× tanh
(α0 + α2µ+ α3C
2
)+µ
2× tanh
(α0 + α1 + α2µ+ α3C
2
), (17)
A first noticeable point is that this equation does not depend on the value of the
Poisson parameter θ. This makes us confident in the innocuity of our dynamic, albeit
simple, demographic structure as long as we focus our analysis strictly on the steady-state,
abstracting from any consideration on the transition dynamics. Second, while existence
of µ follows directly from the Brouwer fixed-point theorem, uniqueness is not guaranteed
and the previous equation may have multiple solutions. Contrary to (Brock and Durlauf,
2001, proposition 2), our dynamic setting with a non-homogenous population of agents
forbids us to simply characterize the presence of multiplicity as a function of parameter
A4

values.24 We consequently rely on numerical computations of (17) to characterize the set
of solutions.
D.2 Long run steady states and counterfactual experiments
The parameters (α0, α1, α2, α3) correspond to the point estimates of a specification similar
to our benchmark where the sample is restricted to descendants from Arabic migrants in
public housing (Column 6, Table 4). A difference is that we remove all added covariates
and fixed-effects which are not directly related to the three channels of our model in
equation (5). The resulting values for our parameters are α0 = −1.37, α1 = 1.8, α2 = 0.17,
and α3 = −14.8. We solve numerically the fixed-point equation (17) for values of Cspanning the range [0, 0.2]; for each value of C this gives us the steady-state share of
Arabic name holders µ(C). We then compute our second variable of interest, U , which
corresponds to the steady-state value of excess-unemployment due to discrimination toward
Arabic name holders
U(C) ≡ µ(C)× C, (18)
The results are displayed on figure A2. The upper left panel depicts the fixed-point
equation (17) for various values of economic penalty C within the range of 0 to 20 percent.
We can check visually in this panel that the equilibrium is unique confirming that the
horizontal channel is not large enough to generate multiple social equilibria. The upper
right panel reports the steady-state value of µ(C). The red cross represents the actual values
of the unemployment penalty (equal to 0.11) and the actual share of Arabic name holders
(equal to 0.48) observed in our sample of first and second generations of migrants from
Arabic countries living in public housing over the 2003-2007 period. We observe that for
C = 0.11, the steady-state share of Arabic name-holders predicted by our structural model
is µ = 0.086 which is much smaller than the actual one. This feature might be explained by
the fact that migration from Arabic countries is still a quite recent phenomenon in France
and that most babies born in the 2003-2007 period belong to the third generation of
migrants only. Hence the actual share is still far from its steady-state value and transitory
dynamics are expected to bring it down in the future. We also see that in absence of
discrimination (C = 0), this steady-state share is predicted to be much larger, at 0.36.
24Without vertical transmission, i.e. with α1 = 0, our model would be included in the class of modelanalyzed by Brock and Durlauf (2001). Indeed, in that case, the population of babies has homogenouscharacteristics with respect to the naming process and our equation (17) is equivalent to their mainequation (12).
A5
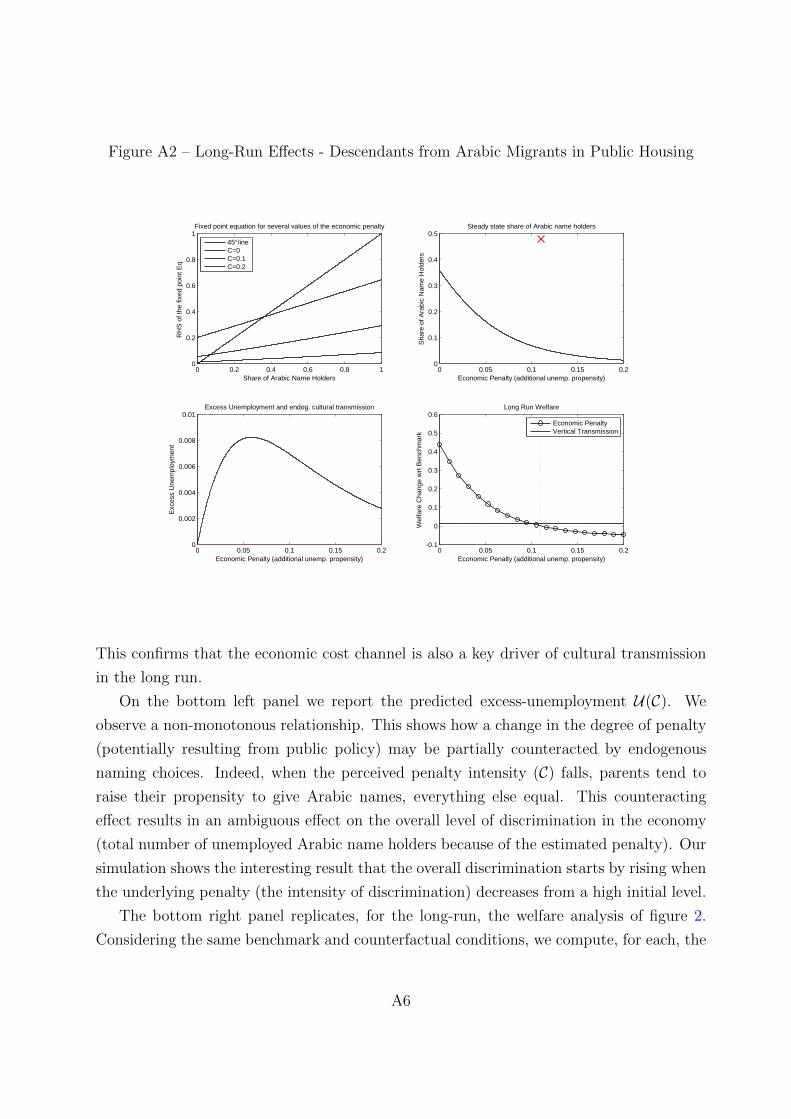
Figure A2 – Long-Run Effects - Descendants from Arabic Migrants in Public Housing
0 0.2 0.4 0.6 0.8 10
0.2
0.4
0.6
0.8
1
Share of Arabic Name Holders
RH
S o
f the
fixe
d po
int E
q.
Fixed point equation for several values of the economic penalty
45° lineC=0C=0.1C=0.2
0 0.05 0.1 0.15 0.20
0.1
0.2
0.3
0.4
0.5
Economic Penalty (additional unemp. propensity)
Sha
re o
f Ara
bic
Nam
e H
olde
rs
Steady state share of Arabic name holders
0 0.05 0.1 0.15 0.2-0.1
0
0.1
0.2
0.3
0.4
0.5
0.6
Economic Penalty (additional unemp. propensity)
Wel
fare
Cha
nge
wrt
Ben
chm
ark
Long Run Welfare
Economic PenaltyVertical Transmission
0 0.05 0.1 0.15 0.20
0.002
0.004
0.006
0.008
0.01
Economic Penalty (additional unemp. propensity)
Exc
ess
Une
mpl
oym
ent
Excess Unemployment and endog. cultural transmission
This confirms that the economic cost channel is also a key driver of cultural transmission
in the long run.
On the bottom left panel we report the predicted excess-unemployment U(C). We
observe a non-monotonous relationship. This shows how a change in the degree of penalty
(potentially resulting from public policy) may be partially counteracted by endogenous
naming choices. Indeed, when the perceived penalty intensity (C) falls, parents tend to
raise their propensity to give Arabic names, everything else equal. This counteracting
effect results in an ambiguous effect on the overall level of discrimination in the economy
(total number of unemployed Arabic name holders because of the estimated penalty). Our
simulation shows the interesting result that the overall discrimination starts by rising when
the underlying penalty (the intensity of discrimination) decreases from a high initial level.
The bottom right panel replicates, for the long-run, the welfare analysis of figure 2.
Considering the same benchmark and counterfactual conditions, we compute, for each, the
A6

steady-state value of aggregate welfare, taking into account the full dynamic impact of the
counterfactual change in parameters. As explained in the main text (Section 6.2), defining
an aggregate welfare criterion in an inter-generational model of cultural transmission is
problematic because of imperfect altruism. We follow a simplistic approach here. It consists
in assessing the long-run outcome from the welfare perspective of the first-generation of
parents who experience the counterfactual change in the economic penalty. Consequently,
the magnitude of the reported effects should be considered an upper bound of long-run
welfare effects. With respect to the short run, we see that the welfare impact of the vertical
channel experiences a fivefold reduction: This stems from the long-run predicted fall of the
share of Arabic name holders in the population (of comparable magnitude), which are the
only individuals for which the vertical channel is relevant. The vertical transmission motive
is now equivalent in terms of welfare gains to a cut by 1.2 percentage points of the penalty,
namely a 0.6% upward shift in lifetime income of one’s child. Naturally, the same figure
calculated on the subsample of the population that keeps an Arabic name in the long run
(8.6% of the considered population) would be much higher, at 6.9% of lifetime income.
Empirical appendix
E Additional empirical results
E.1 Robustness to use of relative of penalty.
We assess the robustness of our results to the use of unemployment penalties that are
measured in relative terms as opposed to absolute differences as in the main analysis of
the paper.
First, in order to ensure that our baseline results based on difference in the absolute
value of unemployment rate penalties (reproduced in columns 1 and 4 of Table A1) is not
driven by variation in unemployment across occupations among non-Arabic name holders,
we introduce the average occupation-specific unemployment rate among non-Arabic name
holders within each block as a control . We see in columns (2) and (4) of the same table
that the negative effect of the LIP based on absolute occupational penalties is not affected
by the introduction of this control. We see this robustness test as attenuating the concern
that our results could be entirely driven by the baseline level of unemployment in neighbors’
occupations.
A7

Second, we run the analysis with unemployment rate differential measured in relative
terms (γl = (ual − unal )/unal )). An issue with the proposed measure based on the relative
penalty is that it is very volatile because measured unemployment in some occupations is
very small among non-Arabic name holders—in particular for farming where it is very low
(0.26%) in comparison with Arabic name holders (9.9%). Note however that the number
of Arabic name holders in that profession is very low. While this gap is not very influential
to our baseline measure in levels it tends to affect the ratio despite the low number of
farmers among neighbors (around 0.5%). To diminish the role of outliers in determining
the value of the LIP based on relative penalties, we “winsorize” the LIP variables at the
5th and 95th percentiles. Results are presented in Table A2. They do show that the LIP
based on relative penalties has a negative effect on the probability of giving Arabic first
names (columns 2 and 5). We notice that winsorizing the LIP based on absolute penalties
barely affects the baseline estimates (columns 1 and 4).
As mentioned above, after some investigation into the reasons for this excessive dis-
persion of the relative LIP measure, we found that farmers (a very small percentage—less
than 0.5%— of the sample) have an unusually high relative penalty ratio (the penalty dif-
ferences and ratios across occupations that we use in the construction of the LIP variable
are provided in figure A3). As a result, the very small gap among farmers between Arabic
and non-Arabic name holders is inflated through a division by (nearly) zero. Excluding
farmers from the computation of the LIP leads to results that are very to the winsorization
as can be seen in columns 3 and 6 of Table A2.
While the coefficients of columns (2)-(3) and (5)-(6) are much smaller than in our
baseline estimation (1) and (4), the economic implication of LIP’s effect of is very close.
Using the interquartile range of the LIP variable provided in the last row of the table, we
can calculate the effect of going from the bottom to the top quartile of the LIP variable
of our sample. This reduces the probability of giving an Arabic name by .86× .02 = 1.72
percentage points in column (1) and by .03× .57 = 1.71 percentage points in columns (2)
and (3). In the social housing sample of the last 3 columns, the baseline reduction amounts
to 3.35 × .02 = 6.7 percentage points in columns (4), while it is 2.75 and 3.24 percentage
points in columns (5) and (6).
A8

Figure A3 – Distribution of the penalty in levels (top) and penalty in relative terms (bot-tom) across detailed occupations.
(a) Penalty in levels: γl = ual − una
l
0
.05
.1
.15
.2
pena
lty in
leve
ls
Clergy
Engine
ers
Libera
l prof
essio
nals
Intell
ectua
l occ
upati
ons
Busine
ss ex
ecuti
ves
Acade
mic
Social
work
ers
Superv
isors
Interm
ediat
e occ
upati
ons (
publi
c sec
tor)
servi
ce st
aff (p
ublic
secto
r)
Interm
ediat
e occ
upati
ons (
priva
te se
ctor)
Low-sk
ill work
ers (h
andli
ng, w
areho
use)
Compa
ny m
anag
ers (>
10 em
ploye
es)
Employe
es in
perso
nal s
ervice
s
Farmers
Skilled
work
ers (in
dustr
y)
Manag
ers (p
ublic
secto
r)
Techn
icians
Retaile
rs
Skilled
work
ers (h
andli
ng, w
areho
use)
Farm w
age w
orkers
Craftsm
en
Retail c
lerks
Skilled
work
ers (c
raftsm
en)
Teach
ers
Securi
ty sta
ff
Drivers
Low-sk
ill work
ers (in
dustr
y)
Clerks
(priv
ate se
ctor)
(b) Relative penalty: γl = ual /u
nal − 1
0
10
20
30
40
rela
tive
pena
lty
Clergy
Intell
ectua
l occ
upati
ons
Busine
ss ex
ecuti
ves
Engine
ers
Low-sk
ill work
ers (h
andli
ng, w
areho
use)
Farm w
age w
orkers
Low-sk
ill work
ers (in
dustr
y)
Employe
es in
perso
nal s
ervice
s
Retail c
lerks
Interm
ediat
e occ
upati
ons (
priva
te se
ctor)
Skilled
work
ers (h
andli
ng, w
areho
use)
Superv
isors
Libera
l prof
essio
nals
servi
ce st
aff (p
ublic
secto
r)
Clerks
(priv
ate se
ctor)
Skilled
work
ers (in
dustr
y)
Skilled
work
ers (c
raftsm
en)
Social
work
ers
Retaile
rs
Acade
mic
Techn
icians
Compa
ny m
anag
ers (>
10 em
ploye
es)
Drivers
Securi
ty sta
ff
Teach
ers
Craftsm
en
Interm
ediat
e occ
upati
ons (
publi
c sec
tor)
Manag
ers (p
ublic
secto
r)
Farmers
A9

Table A1 – U[Arabic]-U[non Arabic] and controlling for U[non Arabic]
(1) (2) (3) (4)arabic arabic arabic arabic
one parent/grandp. w/ Muslim country nat. 0.09a 0.09a
(0.01) (0.01)
one parent with Arabic name 0.23a 0.23a 0.36a 0.36a
(0.01) (0.01) (0.04) (0.04)
share of Arabic name in block (aged 4-10) 0.09a 0.09a 0.03 0.04(0.02) (0.02) (0.05) (0.05)
local information on penalty -0.86a -0.89a -2.95a -3.18a
(0.33) (0.33) (1.07) (1.09)
UR in nghbors’ occ. among N-A name holders (∑
l ωl,kU(0)l) -0.07 -0.38(0.12) (0.34)
Observations 3829 3829 992 992Pseudo R2 0.399 0.399 0.160 0.161Mean probability 0.19 0.19 0.50 0.50Parent/grandp. w/ Muslim country nat. only
√ √
1 Notes: Logit estimates (average marginal effects). Standard errors, clustered at the residential blocklevel, are in parentheses with a, b and c respectively denoting significance at the 1%, 5% and 10%. Allregressions include dummies for parental education level, parental occupation group, departement ofresidence, and years.
A10

Table A2 – Relative Penalty: U[Arabic]-U[non-Arabic])/U[non-Arabic]
(1) (2) (3) (4) (5) (6)level win. rel. win. no farm level win. rel. win. no farm
one parent/grandp. w/ Muslim country nat. 0.09a 0.09a 0.09a
( 0.01) ( 0.01) (0.01)
one parent with Arabic name 0.23a 0.23a 0.23a 0.36a 0.36a 0.36a
(0.01) (0.01) (0.01) (0.04) (0.04) (0.04)
share of Arabic name in block (aged 4-10) 0.09a 0.09a 0.09a 0.03 0.03 0.03(0.02) (0.02) (0.02) (0.05) (0.05) (0.05)
Local information on penalty (LIP) – winsorized -0.86a -3.35a
(0.33) (1.11)
LIP based on relative pen.(∑
l ωl,kU(1)l−U(0)l
U(0)l
)-0.03a -0.03a -0.05c -0.06b
(0.01) (0.01) (0.03) (0.03)
Observations 3829 3829 3829 992 992 992Pseudo R2 0.399 0.400 0.401 0.161 0.157 0.159Mean probability 0.19 0.19 0.19 0.50 0.50 0.50Parent/grandp. w/ Muslim country nat. only
√ √ √
Interquartile range in measure of LIP 0.02 0.57 0.51 0.02 0.55 0.54
1 Notes: Logit estimates (average marginal effects). Standard errors, clustered at the residential block level, are in parenthe-ses with a, b and c respectively denoting significance at the 1%, 5% and 10%. All regressions include dummies for parentaleducation level, parental occupation group, departement of residence, and years.The winsorization is set at the 5th and95th percentile for both the baseline LIP (columns 1 and 4) and the LIP based on relative penalties (columns 2 and 5).Percentiles are computed based on the HLM sample. The correlation between the two measures is 0.37. In columns (3)and (6), the measure of LIP based on relative penalties exclude farmers. The unemployment rate for non Arabic nameholders is very low (3.8%) while it is relatively high for Arabic names (31%), thus resulting in an outlier. Results aresimilar than when using winsorization.
A11

E.2 Omitting the horizontal channel
Table A3 – Omitting measures of the horizontal channel does not affect the esti-mated effect of the economic channel
(1) (2) (3) (4)Arabic name for baby
one parent/grandp. w/ Muslim country nat. 0.09a 0.10a
(0.01) (0.01)
one parent with Arabic name 0.23a 0.24a 0.36a 0.35a
(0.01) (0.01) (0.04) (0.04)
share of Arabic name in block (aged 4-10) 0.09a 0.03(0.02) (0.05)
local information on penalty -0.86a -0.90a -2.95a -2.98a
(0.33) (0.32) (1.07) (1.03)
Observations 3829 3958 992 1020Pseudo R2 0.399 0.397 0.160 0.157Mean probability 0.19 0.19 0.50 0.51Parent/grandp. w/ Muslim country nat. only
√ √
1 Notes: Logit estimates (average marginal effects). Standard errors, clustered atthe residential block level, are in parentheses with a, b and c respectively denotingsignificance at the 1%, 5% and 10%. All regressions include dummies for parentaleducation level, parental occupation group, departement of residence, and years.
E.3 Other robustness checks and additional results
A12
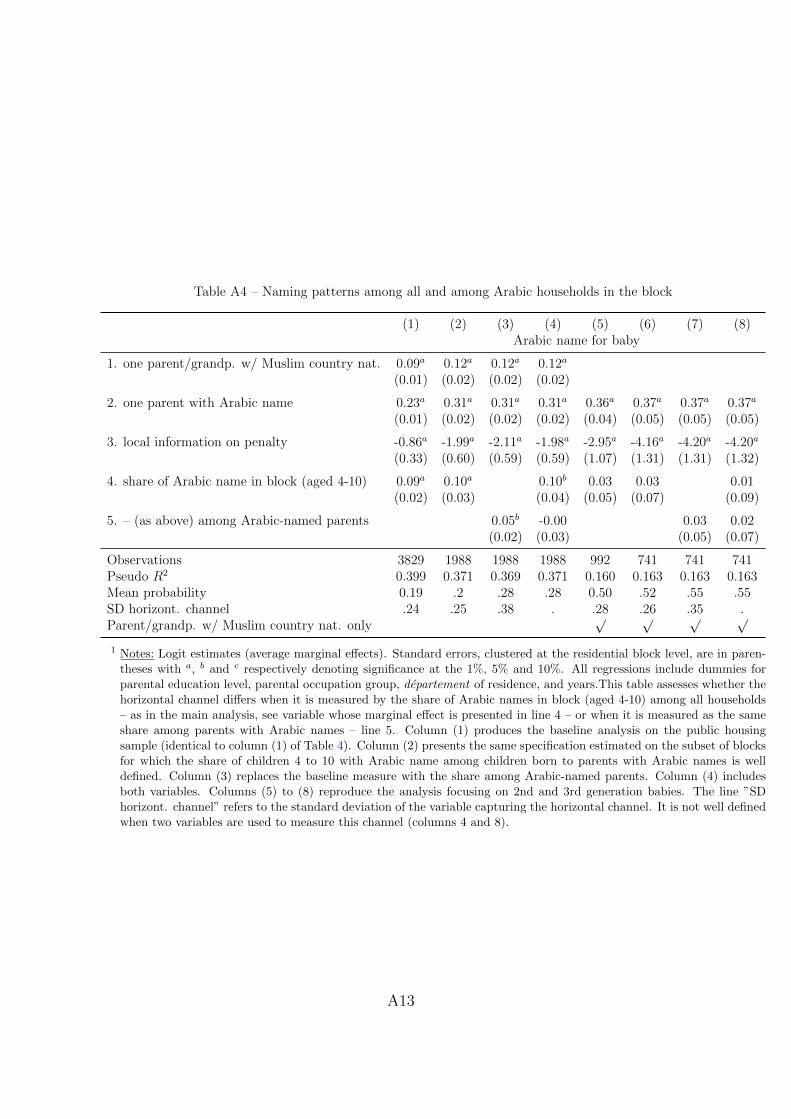
Table A4 – Naming patterns among all and among Arabic households in the block
(1) (2) (3) (4) (5) (6) (7) (8)Arabic name for baby
1. one parent/grandp. w/ Muslim country nat. 0.09a 0.12a 0.12a 0.12a
(0.01) (0.02) (0.02) (0.02)
2. one parent with Arabic name 0.23a 0.31a 0.31a 0.31a 0.36a 0.37a 0.37a 0.37a
(0.01) (0.02) (0.02) (0.02) (0.04) (0.05) (0.05) (0.05)
3. local information on penalty -0.86a -1.99a -2.11a -1.98a -2.95a -4.16a -4.20a -4.20a
(0.33) (0.60) (0.59) (0.59) (1.07) (1.31) (1.31) (1.32)
4. share of Arabic name in block (aged 4-10) 0.09a 0.10a 0.10b 0.03 0.03 0.01(0.02) (0.03) (0.04) (0.05) (0.07) (0.09)
5. – (as above) among Arabic-named parents 0.05b -0.00 0.03 0.02(0.02) (0.03) (0.05) (0.07)
Observations 3829 1988 1988 1988 992 741 741 741Pseudo R2 0.399 0.371 0.369 0.371 0.160 0.163 0.163 0.163Mean probability 0.19 .2 .28 .28 0.50 .52 .55 .55SD horizont. channel .24 .25 .38 . .28 .26 .35 .Parent/grandp. w/ Muslim country nat. only
√ √ √ √
1 Notes: Logit estimates (average marginal effects). Standard errors, clustered at the residential block level, are in paren-theses with a, b and c respectively denoting significance at the 1%, 5% and 10%. All regressions include dummies forparental education level, parental occupation group, departement of residence, and years.This table assesses whether thehorizontal channel differs when it is measured by the share of Arabic names in block (aged 4-10) among all households– as in the main analysis, see variable whose marginal effect is presented in line 4 – or when it is measured as the sameshare among parents with Arabic names – line 5. Column (1) produces the baseline analysis on the public housingsample (identical to column (1) of Table 4). Column (2) presents the same specification estimated on the subset of blocksfor which the share of children 4 to 10 with Arabic name among children born to parents with Arabic names is welldefined. Column (3) replaces the baseline measure with the share among Arabic-named parents. Column (4) includesboth variables. Columns (5) to (8) reproduce the analysis focusing on 2nd and 3rd generation babies. The line ”SDhorizont. channel” refers to the standard deviation of the variable capturing the horizontal channel. It is not well definedwhen two variables are used to measure this channel (columns 4 and 8).
A13

Table A5 – Decomposition of the vertical channel: Differentiated effect dependingon whether only the mother, only the father or both parents have an Arabic name– public housing sample
(1) (2) (3) (4)Arabic name for baby
one parent/grandp. w/ Muslim country nat. 0.09a 0.08a
(0.01) (0.02)
one parent with Arabic name 0.23a 0.36a
(0.01) (0.04)
Mother has Arabic name only 0.19a 0.27a
(0.02) (0.05)
Father has Arabic name only 0.22a 0.29a
(0.02) (0.05)
Both parent with Arabic name 0.26a 0.42a
(0.01) (0.04)
share of Arabic name in block (aged 4-10) 0.09a 0.09a 0.03 0.02(0.02) (0.02) (0.05) (0.05)
local information on penalty -0.86a -0.83b -2.95a -2.71a
(0.33) (0.32) (1.07) (1.05)
Observations 3829 3829 992 992Pseudo R2 0.399 0.405 0.160 0.173Mean probability 0.19 0.19 0.50 0.50Parent/grandp. w/ Muslim country nat. only
√ √
1 Notes: Logit estimates (average marginal effects). Standard errors, clustered atthe residential block level, are in parentheses with a, b and c respectively denotingsignificance at the 1%, 5% and 10%. All regressions include dummies for parentaleducation level, parental occupation group, departement of residence, and years.
A14

Table A6 – Heterogeneity within public housing depending on immigration background.
(1) (2) (3) (4) (5)All PH No Imm. Muslim Imm. Musl. Native French Residual
one parent/grandp. w/ Muslim country nat. 0.09a
(0.01)
one parent with Arabic name 0.23a 0.16a 0.36a 0.17a 0.20a
(0.01) (0.01) (0.04) (0.03) (0.01)
share of Arabic name in block (aged 4-10) 0.09a 0.12a 0.03 0.13a 0.16a
(0.02) (0.02) (0.05) (0.04) (0.03)
local information on penalty -0.86a -0.01 -2.95a -0.27 0.60(0.33) (0.32) (1.07) (0.60) (0.57)
Observations 3829 2517 992 908 1052Pseudo R2 0.399 0.387 0.160 0.286 0.511Mean probability 0.18 0.07 0.25 0.09 0.10Mean prob. Parent Arabic Name 0.27 0.09 0.77 0.05 0.15Parent/grandp. w/ Muslim country nat. Yes2nd/3rd gen. babies Yes — No No Yes No Yes1st/2nd gen. parents Yes — No No Yes No Yes
1 Notes: Logit estimates (average marginal effects). Standard errors, clustered at the residential block level, are in parentheseswith a, b and c respectively denoting significance at the 1%, 5% and 10%. All regressions include dummies for parentaleducation level, parental occupation group, departement of residence, and years.In column (3), immigrant from a Muslimcountry is defined as having one parent or grand parent from our list of Muslim majority country (see Section 4.1). NativeFrench is defined as having no Muslim immigration background and at least one parent of French nationality. The Residualcategory in column (5) refers to households not contained in the sub-samples of columns (3) or (4) which contains individualswith some immigration background but not from a country included in our list of majority Muslim. The table shows thatthe average effect estimated on the entire sample of public housing tenants (column 1) is entirely driven by the response ofhouseholds with some immigration background from a Muslim/Arabic country.
A15

F Unemployment penalty associated with Arabic names
The goal of this section is to document further the unemployment penalty attached to
Arabic first names across occupations. As explained in the main text, our goal is not
to identify perfectly the discrimination associated with an Arabic name. Therefore we
keep our estimation method voluntarily simple. It is however interesting to note that our
estimates of the penalty attached to Arabic first names are very much in line with the
existing findings based on more elaborate econometric methods.25.
Table A7 displays the unconditional unemployment rate associated with the 10 most
popular non-Arabic and Arabic names. The data derives from the population aged 25-55 in
the LFS 2003-2007. The unemployment rate of men with popular Arabic names is between
four to eight times as high as the unemployment rate of men with popular non-Arabic
names. A striking example is given by men named Abdelkader, whose unemployment rate
reaches 37 percent against 5 percent for individuals named Philippe.26 The unemployment
gap is even more pronounced among the female population. Women named Fatma (ranked
6th in the list of the most popular Arabic names for women) have an average unemployment
rate of 42 percent, against 10 percent for women named Sandrine or Patricia (who have the
highest unemployment rate among the most popular non-Arabic names). The cross-name
heterogeneity is also much larger for Arabic names but this is probably driven by small
sample issues.
Table A8 documents the conditional unemployment penalty by running a standard
Mincer-type equation estimated on the LFS subsample of active persons aged between 25
and 55. The left-hand-side variable is the employment status, equal to 1 if the respondent
is employed, and 0 if unemployed. We consider the set of standard controls, including
25In particular, Duguet et al. (2010) use pair auditing to test access to job interviews of individuals whoshare the same characteristics, except Arabic and non-Arabic names. They find that the probability toget interviewed is 7 percentage points lower for Arabic name holders in the French labor market, which isreally close to our results. Adida et al. (2010) isolate the source of discrimination by identifying the effectof being Muslim on the French labor market. Using a large-scale survey on immigrants from Senegal, theyare able to identify typical first names from the Muslim and the Christian parts of this population, whichthey report to be otherwise quite similar on all measurable aspects. The authors then ran an audit surveywith CVs identical in all dimensions, but with a different type of first name. The CVs would in particularhave the same family name, for instance Diouf, a typical Senegalese family name, but one CV would havea typical Muslim first name (e.g. Khadija for women) and the other a well-known Catholic first-name(e.g. Marie). Adida et al. (2010) find a statistically significant difference of 13 percentage points in theresponse’s rates to job applications between the holders of Catholic first names and those with Muslimfirst names.
26Interestingly, Emir Abdelkader was the military leader who led the struggle against the French colonialinvasion of Algeria in the mid-19th century (we thank Nour Meddahi for pointing that out during apresentation of this paper).
A16
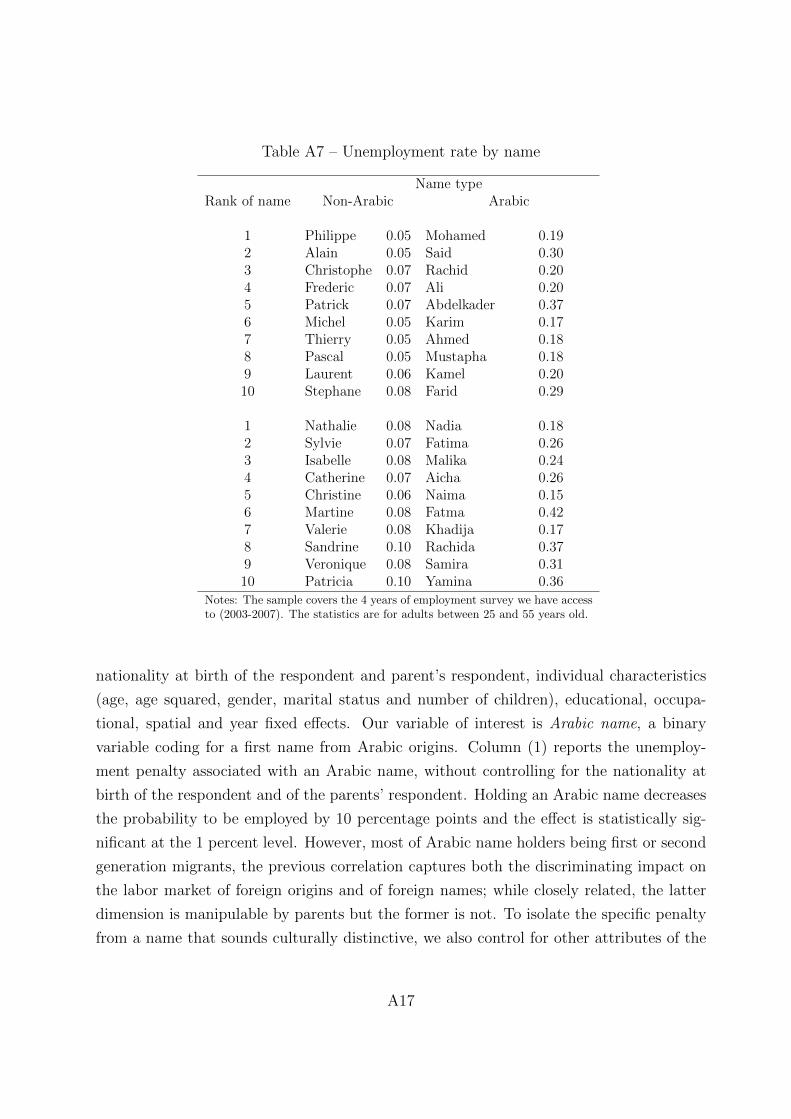
Table A7 – Unemployment rate by name
Name typeRank of name Non-Arabic Arabic
1 Philippe 0.05 Mohamed 0.192 Alain 0.05 Said 0.303 Christophe 0.07 Rachid 0.204 Frederic 0.07 Ali 0.205 Patrick 0.07 Abdelkader 0.376 Michel 0.05 Karim 0.177 Thierry 0.05 Ahmed 0.188 Pascal 0.05 Mustapha 0.189 Laurent 0.06 Kamel 0.2010 Stephane 0.08 Farid 0.29
1 Nathalie 0.08 Nadia 0.182 Sylvie 0.07 Fatima 0.263 Isabelle 0.08 Malika 0.244 Catherine 0.07 Aicha 0.265 Christine 0.06 Naima 0.156 Martine 0.08 Fatma 0.427 Valerie 0.08 Khadija 0.178 Sandrine 0.10 Rachida 0.379 Veronique 0.08 Samira 0.3110 Patricia 0.10 Yamina 0.36
Notes: The sample covers the 4 years of employment survey we have accessto (2003-2007). The statistics are for adults between 25 and 55 years old.
nationality at birth of the respondent and parent’s respondent, individual characteristics
(age, age squared, gender, marital status and number of children), educational, occupa-
tional, spatial and year fixed effects. Our variable of interest is Arabic name, a binary
variable coding for a first name from Arabic origins. Column (1) reports the unemploy-
ment penalty associated with an Arabic name, without controlling for the nationality at
birth of the respondent and of the parents’ respondent. Holding an Arabic name decreases
the probability to be employed by 10 percentage points and the effect is statistically sig-
nificant at the 1 percent level. However, most of Arabic name holders being first or second
generation migrants, the previous correlation captures both the discriminating impact on
the labor market of foreign origins and of foreign names; while closely related, the latter
dimension is manipulable by parents but the former is not. To isolate the specific penalty
from a name that sounds culturally distinctive, we also control for other attributes of the
A17

country of origin. Column (2) includes a dummy variable equal to 1 if the nationality
at birth of the respondent or of the parents’ respondent is from an Arabic country, and
0 otherwise. The estimated unemployment penalty associated with an Arabic name re-
mains fairly high at 7 percentage points and remains highly statistically significant. The
estimated unemployment penalty associated with an Arabic name is of the same order of
magnitude as the one associated with having an Arabic-related nationality, suggesting that
a specific employment penalty is attached to the first name.27 In the next two columns, the
sample is restricted to individuals living in the public housing sector (on which our main
econometric analysis will be based). Column (3) shows that the conditional unemployment
penalty is identical for this subsample and is robust to the inclusion, in Column (4), of a
variable coding for the number of children with Arabic name in the household. This last
variable is likely to be correlated to a bundle of unobservable characteristics related to the
degree of individual attachment to Arabic culture (e.g. religiosity) that may simultane-
ously influence the penalty. Column (5) estimates the conditional unemployment penalty
for each broad occupational category. The reference category is executives.
How large is the implied loss in lifetime expected income associated with an Arabic
name? A simple “back of the envelope” calculation suggests that it is substantial. Breuil-
Genier (2001) provides detailed estimates of income variations induced by a transition
from employment to unemployment on the French labor market (including in particular
social benefits, that we do not observe in the LFS). She finds an average income loss of
50 percent. From Table A8 - Column (2), we know that, in every period, the conditional
unemployment gap of Arabic name holders is 7 percentage points relative to non-Arabic
name holder. This means that the total income loss of typical Arabic name holder during
his/her active life is 0.07× 0.5 = 3.5% of expected income. Since the average participation
to the active population is 39 years in France, this is equivalent to 39 × 0.035 = 1.365
years, i.e. around 16 months of income.
27This might reflect the absence of clear morphological markers of ethnicity (e.g. skin color, size) forindividuals with Arabic origins, living in France. Thus the first name conveys meaningful information onethnic background.
A18
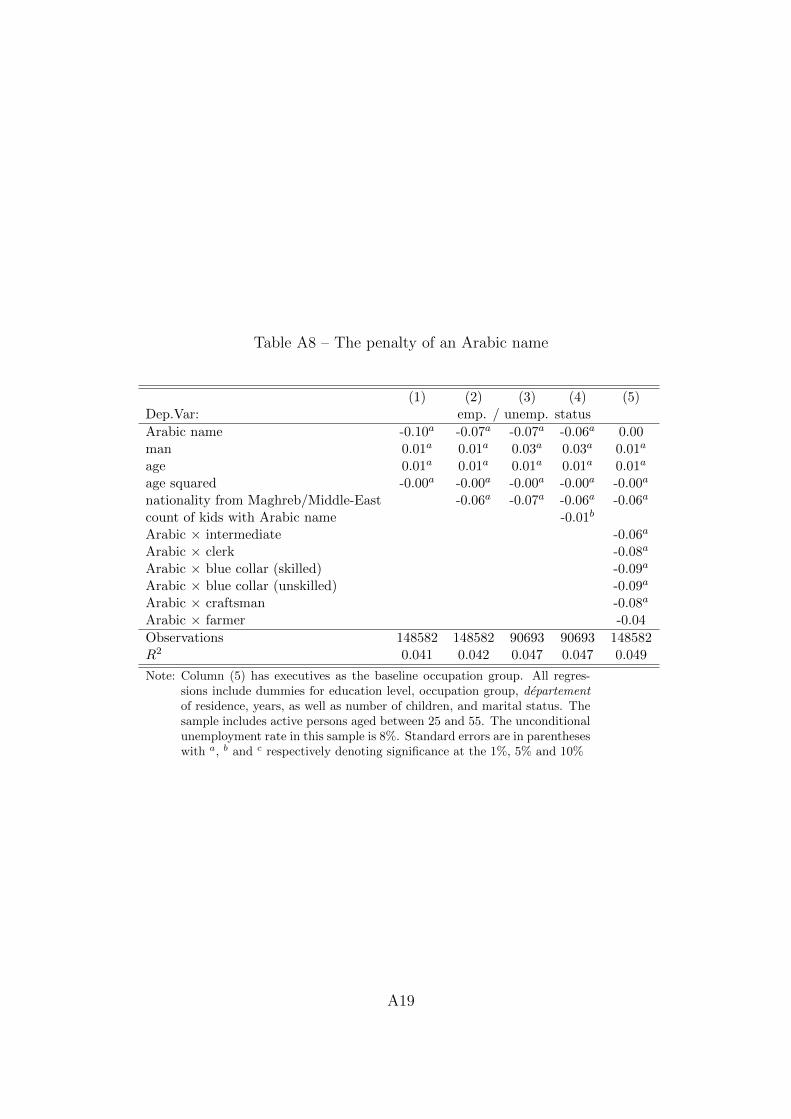
Table A8 – The penalty of an Arabic name
(1) (2) (3) (4) (5)Dep.Var: emp. / unemp. status
Arabic name -0.10a -0.07a -0.07a -0.06a 0.00man 0.01a 0.01a 0.03a 0.03a 0.01a
age 0.01a 0.01a 0.01a 0.01a 0.01a
age squared -0.00a -0.00a -0.00a -0.00a -0.00a
nationality from Maghreb/Middle-East -0.06a -0.07a -0.06a -0.06a
count of kids with Arabic name -0.01b
Arabic × intermediate -0.06a
Arabic × clerk -0.08a
Arabic × blue collar (skilled) -0.09a
Arabic × blue collar (unskilled) -0.09a
Arabic × craftsman -0.08a
Arabic × farmer -0.04
Observations 148582 148582 90693 90693 148582R2 0.041 0.042 0.047 0.047 0.049
Note: Column (5) has executives as the baseline occupation group. All regres-sions include dummies for education level, occupation group, departementof residence, years, as well as number of children, and marital status. Thesample includes active persons aged between 25 and 55. The unconditionalunemployment rate in this sample is 8%. Standard errors are in parentheseswith a, b and c respectively denoting significance at the 1%, 5% and 10%
A19
Institutional context
G Public Housing
G.1 Formal Allocation Process in Public Housings
Due to a strong “Republican ideal”, the French public housing system allocates state-
planned moderate cost rental apartments (HLMs - Habitations a Loyer Modere) to natives
and immigrants without concern for their cultural and ethnic background, mixing people
indiscriminately. The allocation process across public housing blocks is mainly inspired by
theories from the famous architect Le Corbusier (1887-1965). Le Corbusier insisted that
France must avoid the homogeneous ghettoes of the urban landscapes elsewhere, and should
therefore allocate housing blind to ethnicity, not permitting family networks to grow within
housing establishments. These ideas were later translated into state regulation (Bernardot,
2008). This Appendix documents the legal framework for the residential allocation in the
public housing sector. We show that the exogeneity of the allocation with respect to salient
characteristics, such as ethnicity, is built into the law.
We first describe the eligibility criteria and the formal selection process. The only
eligibility requirements for admittance into the public housing sector are to be a legal
resident of France (as a French citizen or migrant with a valid residence permit) and to
be live under a certain threshold of income per unit of consumption. This income ceiling
is usually rather high: in 2009, this threshold was between 36,748 and 50,999 Euros per
year for a four-person family, depending on the region of residence. As a consequence,
the population eligible for public housing is on average three to four times as large as
the available space in vacant dwellings. However, the situation is even tighter in the
most crowded areas, such as Paris. According to the Observatoire du Logement et de
l’Habitat de Paris (2011), as of January 2010, there were 186,017 public housing dwellings
in Paris. Public housing buildings are scattered across all Parisian areas, with a high
concentration (69 percent) in six districts (the 13th, 14th, 15th, 18th, 19th, and 20th
arrondissements). Within Paris, 48.7 percent of households are under the income ceiling
and could, theoretically, be eligible. In practice, only households with very modest incomes
apply (71 percent have an income lower than the minimum ceiling for all France, equivalent
to 2345 euros per month for a household with two children). On the 31st of December
2010, there were 121,937 ongoing applications, to be compared to 12500 public housing
A20

units allocated over the year 2010. Due to those stringent housing supply constraints, other
eligibility criteria are taken into account.28 In addition to household income, the family
situation, and household size are taken into account to ensure a suitable match with the
characteristics of vacant dwellings, as well as the emergency of the application. Those
latter criteria have recently become the main criteria the commission uses due to the boom
in housing prices in the private sector during the mid-90s and the 2000s. In particular,
five priority criteria are defined by law (Article L441-1 of law relative to construction
and housing - Code pour la Construction et l’Habitat) at the national level to ensure
that vacant housing will first be distributed to households with obvious social difficulties.
Households satisfying these priority criteria are those in which there is a (mentally or
physically) disabled person, those living in precarious or hazardous shelter due to financial
constraints, those living in a temporary accommodation, individuals living in a precarious
shelter who recently found a job after a long unemployment spell, and victims of domestic
violence.
Regarding the selection process, the commissions of selection in charge of allocating
households to vacant public housing dwellings are held at the departement level (or at
the city level in the case of Paris which is both a city and a departement due to its size).
The commissions’ composition is regulated by law: it includes six members of the public
housing offices board, a representative of associations for social and economic insertion
(appointed by the head of the departement), mayors of the cities (or districts) in which
vacant housings are to be attributed, as well as a representative of any association defending
tenant rights. In addition, another departement representative may attend the commission
meeting. For each vacant housing unit, at least three households must be considered by
the commissioners, who finally decide which household will be allocated to which housing
unit, according to the eligibility and priority criteria detailed above. Other criteria such
as the number of children in the household are also taken into account in order to allocate
suitable dwellings.
Despite this legal allocation process, one might still be worried about the possibility of
self-sorting of households that refuse the residential allocation proposed by the commission.
28To apply for an apartment in the public housing sector, one has to submit a form showing one’sidentity, family situation, and employment status as well as the resources of one’s household; the reasonsfor applying to the public housing sector (e.g. currently or soon to be homeless, or reasons relatedone’s health situation, family situation, job situation, and inappropriate current housing or unpleasantenvironment); the type of housing that is being sought, and whether the applicant is disabled and whetherit is the first application. It is important to stress the fact that the application form contains very limitedinformation about the ethnicity of the applicant: he or she only needs to state his or her nationality, whichis limited to three possible categories (French, European Union, or non European Union).
A21

In theory, households can refuse up to three offers. However, self-sorting, especially on
ethnic characteristics, seems unlikely to be a common practice. Residential mobility within
the public housing sector is very low, due to the current strong shortage of supply of public
housing dwellings. This makes it unlikely that the selected households could be really
picky about neighborhood diversity (see the study by Simon, 2003). In addition, rents are
considerably lower in public housing than in private housing, increasing the opportunity
cost of moving, so that turnover is very low. More specifically, the mobility rate in the
public housing sector is even lower than for recent owners. Public housing allocation
in Paris serves as a useful concrete example. The mobility rate (defined as the ratio of
new entrants over the total number of public housing dwellings) is particularly low: it
reaches 5.5 percent in 2010. It is formally possible to indicate a precise neighborhood in
the application form, but in practice, very few applicants (6.6 percent) do provide this
information. More than half of the 121,937 applicants (52.9 percent) did mentioned no
particular area at all, probably due to the fear of being rejected on this ground. Among
those who indicated an area of preference, 91.2 percent mentioned the area where they
were already living. People who move within the public housing sector are people who
moved for larger space following an increase in their household size (only 12 percent of the
public housing dwellings have more than three rooms).
G.2 Descriptive statistics on public housing
Table A9 reports the descriptive statistics of the sample of individuals over 15 years old and
who are consequently interviewed in the LFS. There is an over-representation of Arabic
name holders in public housings: the share reaches 14 percent in this type of housing
against 4 percent in the total sample. Similarly, the proportion of individuals who have
Arabic origins is 16.8 percent in public housings. This proportion is three times as high
as in the total sample (5.61 percent). Individuals who enter the public housing sector
have also lower socio-economic backgrounds than the rest of the population. The share of
unemployed is almost twice as high in public housings (9.6 percent) than in the total sample
(5 percent). There is an over-representation of blue collar workers and clerks (78 percent
in the public housing, and 55 percent in the whole sample) and an under-representation of
executives (3 percent in public housing, 12 percent in the whole sample). This table shows
that there is a clear selection of individuals into public housings, since eligibility is based
on the socio-economic characteristics. However, our key identification strategy relies on
the exogeneous spatial allocation of individuals within the public housing sector.
A22

Table A9 – Descriptive statistics of individuals
Total sample Public housingMean (std) Mean (std)
Age 45.22 (19.22) 40.93 (18.19)Gender (Male) 0.48 (0.49) 0.46 (0.49)Married 0.61 (0.48) 0.49 (0.50)Arabic names 0.04 (0.21) 0.14 (0.35)Arabic origins 0.05 (0.23) 0.16 (0.37)Employed 0.52 (0.49) 0.50 (0.49)Unemployed 0.05 (0.20) 0.09 (0.27)Inactive 0.43 (0.49) 0.41 (0.49)Hourly wage (euros) 9.70 (4.29) 8.24 (3.00)Occupation: executive 0.12 (0.33) 0.03 (0.18)Occupation: intermediate 0.20 (0.40) 0.14 (0.34)Occupation: clerk 0.30 (0.46) 0.40 (0.49)Occupation: blue collar (skilled) 0.15 (0.36) 0.20 (0.40)Occupation: blue collar (unskilled) 0.10 (0.30) 0.18 (0.39)Occupation: craftman 0.06 (0.24) 0.02 (0.14)No education 0.21 (0.41) 0.36 (0.48)Elementary school 0.44 (0.49) 0.42 (0.49)High school 0.14 (0.34) 0.11 (0.31)College 0.09 (0.28) 0.05 (0.22)Graduate 0.10 (0.30) 0.04 (0.20)
A23

G.3 Exogenous spatial residential allocation in public housing
We now proceed to more formal statistical tests for the exogenous spatial allocation of
households across public housing residential blocks within a departement.
In their analysis of the impact of fractionalization on local public goods, Algan et
al. (2016) have already provided an extensive list of tests showing the absence of self-
sorting along ethnic lines across public housing dwellings. We briefly summarize those
tests here. First, they run placebo tests on whether, at the block level, diversity correlates
with measures of the distribution of exogenous public housing buildings characteristics.
They showed that block-level ethnic diversity does not correlate with any fixed housing
characteristics, in the sense that residents have no control over them (such as the size of the
building), while it does on outcomes that can be influenced by residents (such as voluntary
degradations). Second, they test the exogeneity of the different steps in the allocation
process during the application and the refusal decision process. They show there is no
self-sorting along ethnic lines focusing on movers into public housing blocks. Since self-
selection could still occur prior to the move, they also focused on households that have
refused a public housing dwelling offer. They show that households declining an offer end
up living in public housing blocks that display the same level of diversity as those who
directly accepted their first offer. Thus, even if households try to be choosy with respect
to the ethnic composition of their neighborhoods, they eventually do not self-segregate in
the public housing sector due to the allocation process and the tight supply constraints of
dwellings.
Here, we complement those previous findings with two direct tests of the allocation
process. Since the allocation is at the department level, we investigate whether households
are allocated exogenously across the different public housings within a given departement.
Table A10 provides a first approach where, for various observable household charac-
teristics, we test for the difference in means between residential blocks. We regress, for
each departement taken separately, each observable on a battery of fixed effects associated
with the different residential blocks located in this departement. Those regressions are
performed on the subsample of household heads who are living in public housing. In case
of endogenous residential sorting in some public housing blocks, the fixed effects associ-
ated with those blocks should be statistically significantly correlated with the household
characteristics, and the F-test will be rejected. We consider the two main characteristics
used in our model of spatial information, e.g the ethnic and occupation composition of the
residential block. We focus on the Arabic origin of the respondent’s name, the nationality
A24

at birth (set to one if the nationality of the respondent or of the respondent’s parent is from
France, and zero otherwise) and the respondent’s occupation (coded as a binary variable
equal to one for blue collars). Column (1) of Table A10 reports, for each observable, the
share of departements for which the F-test is not rejected at the 10 percent level (a more
conservative criterion in our context than the standard 5 percent level). For the sake of
comparison, we run, in Column (2), the same F-test on the full sample of household heads,
including both those who live in the public and private housing sectors. In this case, as
expected, endogenous residential sorting is much more salient.
Table A10 – F-Test of Residential Sorting
% departments without residential sorting relative to households’ characteristics
Public Housing Total SampleHousehold’s characteristics:
Nationality from Maghreb/Middle East 77.35 55.55French Nationality at Birth 81.88 59.52Occupation: blue collar 80.32 54.22
Note: The table reports the share of departement for which F-tests (at the 10 percentlevel) do not reject the null-hypothesis of a null correlation between observablecharacteristics and residential block fixed effects. The F-test are based on a logisticregression of household characteristic on public housing fixed effect within eachdepartement. The sample includes household heads aged over 15 years old.
Our previous approach to testing exogenous spatial allocation has the advantage of
simplicity but might not be ideally suited to our empirical context where the spatial units
under consideration are small. Indeed, in the LFS, the average residential block is com-
posed of only 18.31 household heads. In this context, as first pointed out by Ellison
and Glaeser (1997), parametric test of spatial allocation/concentration (that assume in-
dependent location choices) might be ill-defined to test the null hypothesis of exogenous
allocation.29
29The allocation of households across public housing blocks takes place at the departement level. If themembers of the public housing committee strictly follow the legal criteria and do not take into account theethnic characteristics in the allocation process, we should find a uniform distribution of households of agiven nationality across the various public housing residential blocks only if the size of each block is largeenough. For the sake of illustration, let us assume that 10 percent of individuals with Arabic origins livein the public housing sector in Paris. We would find the same share of 10 percent within each Parisianhousing block if the allocation is truly exogenous with respect to ethnic characteristics only if we have asufficiently large number of individuals within each housing block; otherwise we will observe patterns ofspatial concentration in some blocks.
A25

Thus, we propose an alternative approach. We perform a Monte Carlo simulation gen-
erating artificial random allocations that we later compare to the observed allocation. For
each departement, we pool the public housing population and reallocate it randomly, with-
out replacement, across the different residential blocks of the corresponding departement,
maintaining unchanged the actual size of each block. We get a simulated random distribu-
tion of individuals with a given characteristic across blocks. We then run a Kolmogorov-
Smirnov (KS) test of equality of distribution with the actual spatial distribution. The
final step calculates the percentage of departements for which the actual and simulated
distributions across housing blocks are similar, i.e. those for which we cannot reject the
null hypothesis of equality of the distribution at the 10 percent level. We run 100 draws
of the Monte Carlo simulation. For each draw we compute the tests for the equality of
distributions.
Table A11 shows the values of those tests averaging over 100 Monte Carlo draws.
Column (1) shows that the equality of spatial distribution of ethnic origins and occupations
between the randomly simulated distribution and the observed one is accepted in most
departments in the public housing sector. In particular, the equality of distribution with
respect to Arabic origin (French origin) is not rejected in 80.08 percent (70.23 percent) of
the departements in the public sector. Similarly, the distribution of individuals according
to their occupation across the different housing blocks is close to the simulated distribution.
In contrast, Column (3) shows that in the full sample, the equality of distribution is not
rejected in 54.3 percent of the departments for the characteristic Arabic origin and in 24.8
percent of the department for the characteristic French origins. Thus in the whole sample,
French households do self-segregate a lot, and even more than Arabic-origin households
thanks probably to their social and economic capital. However this strong spatial self-
sorting no longer holds in the public housing sector.
G.4 Additional tests on the Exogeneous Spatial Allocation Pro-
cess in Public Housing
This Appendix G.4 provides a variety of additional tests. First, we focus on movers and
show that, in the public housing sector, movers do not select new neighborhoods where their
ethnic and socio-economic characteristics (education and occupation) is over-represented.
Since self-selection could occur prior to the move, we also look at the characteristics of
households that have refused a public housing dwelling offer. We show that they display
the same characteristics as those who accepted their first offer. Thus, even if households try
A26

Table A11 – Monte-Carlo Test of Random Allocation
% departments without residential sorting relative to households’ characteristics
Public Housing Total SampleHousehold’s characteristicsNationality from Maghreb/Middle East 80.08 54.36French Nationality at Birth 70.23 24.89Occupation: blue collar 97.02 60.95
Note: Comparison between the actual and simulated distributions by ethnic groups shares,education and occupations across public housing blocks (Col. 1) and across thewhole sample of housing blocks (Col. 2). Percentage of departements where equalityis not rejected at the 10 percent level using a Kolmogorov-Smirnov test.
to be choosy with respect to the ethnic and socio-economic composition of their neighbor-
hoods, they cannot self-segregate in the public housing sector due to the allocation process
and the tight supply constraints of dwellings. Overall, those tests are supportive of our
identifying assumption that the allocation of households across the public housing blocks
can be considered as exogenous with respect to their ethnic and occupational backgrounds.
G.4.1 Absence of self-sorting on ethnic backgrounds
Our first set of alternative tests consists in showing that while households tend to self-
segregate in the unconstrained private housing market, there is no such evidence in the
public housing market. We test this using the LFS and focusing on individuals who recently
moved into an area (within the previous year).
We first estimate the correlation between the origin (nationality) of individuals moving
into a new area and the share of the area’s “long term” population of the same origin.30
We expect a significant relationship in the private housing market where location choice is
relatively unconstrained but not in the public housing sector. Table A12 reports the results
from an OLS regression of the share of neighbors from the same origin as new movers on
new movers’ characteristics: nationality group, public housing dummy, quadratic function
of age, hourly wage (log) education, socio-economic category, departement fixed effects,
and interaction of individual characteristics with the public housing dummy. We consider
30A similar test was proposed by Goux and Maurin (2007) to show that the educational achievement ofthe children of newcomers in public housing is uncorrelated with that of the current residents. Individualsdo not self-select in public housing neighborhoods according to the educational achievement of the neigh-bors’ children. By contrast, the authors find a strong self-selection on educational characteristics in theprivate housing sector.
A27
seven different nationality groups: native French, naturalized French, Europeans, Arabic,
other Africans, Asians, and other nationalities, which is taken as the reference group.
Three facts are worth noting here. First, there is indeed evidence that on average native
French are significantly more likely to move in neighborhoods where the share of natives is
higher, compared to households from other nationalities. This is not surprising given the
fact that natives make up a large majority of the French population. The second interesting
point is that the coefficient for living in the public housing sector is negative and significant
at the 5% level. More precisely, it reveals that HLM households move in areas where the
share of individuals from the same origin is on average 18.4% lower than for households
in the private housing sector. This result strengthens the idea that the extent to which
households in the public housing sector live close to those in similar ethnic groups is lower
than in the private sector. Finally, when we interact nationalities with the public housing
dummy, none of the coefficients are statistically significant. This comforts us with the idea
that there is no particular self-segregation along ethnic lines in the public housing sector.
We have run the same kind of test on other individual characteristics, and reach similar
conclusions. We find that in the private sector, highly educated or low skilled workers are
very likely to move into neighborhoods with higher levels of highly educated (respectively
low skilled) people. This is not surprising and illustrates self segregation along education
level in the private sector. On the contrary, such segregation does not appear in the public
housing sector.
G.4.2 Tests on the refusal rate of public housing offers
The previous tests point out the absence of self-selection along ethnic lines among the
movers, but self-selection could occur prior to the move. In this case the sample of movers
that we observe in the database would be biased. We address this issue by looking at
households that have refused a public housing dwelling offer. We show that even if house-
holds declined at least one offer, possibly due to the ethnic diversity or the socio-economic
composition of the neighborhood, they were still unable to choose the ethnic and socio-
economic composition of the housing block in which they ended up living. In this section,
we report the results for the refusal rate of public housing offers depending on the neighbor-
hood’s ethnic composition (measured with a standard fractionalization index; see Alesina
et al., 1999). Similar (unreported) results are obtained when looking at the composition
of the neighborhood by educational levels or occupations.
We run this analysis on an alternative database, the 2002 Housing Survey, to bring
A28

Table A12 – Correlation between new movers’ nationality and the residential share ofneighbors from the same nationality
Dep Var: % of neighbors from the same nationality
Nationality (ref.: Other nat.)Native 0.067b
(0.030)Naturalized French -0.037b
(0.012)European -0.007
(0.011)Arabic 0.007
(0.013)Asian -0.019
(0.047)Public Housing (HLM) -0.184b
(0.066)Nationality × HLM
HLM × Native 0.040(0.033)
HLM × Naturalized 0.051(0.036)
HLM × European 0.010(0.037)
HLM × Arabic 0.024(0.036)
HLM × Asian 0.027(0.078)
Intercept 0.070**(0.035)
R-squared 0.864N 11519Note:The dependent variable is the share of neighbors from the
same ethnic group as new movers in a given housing block.Additional controls are a quadratic function of age, gen-der, hourly wage (in log), education, occupation, housingblock socio-economic characteristics and department fixedeffects. Standard errors, clustered at the residential blocklevel, are in parentheses with a, b and c respectively denot-ing significance at the 1%, 5% and 10%.
A29

additional evidence on the absence of sorting. The Housing Survey (HS) shares exactly
the same structure as the Labor Force survey, with information collected at the housing
block level with adjacent neighbors (an average of 18.2 in the public housing sector). The
HS additionally reports specific questions on household satisfaction with housing quality
and if they have turned down public housing offers.
If there were self-selection upon diversity, we should expect households that turned
down proposals before being allocated to their current public housing dwelling to end up
living in less diverse neighborhoods. To test this conjecture, we run OLS regressions of
a variable indicating whether the household declined at least one offer (during the latest
application process) on the level of ethnic diversity of the neighborhood in which it now
lives. Panel A-I of Table A13 shows various estimates of the effect of ethnic diversity on
the probability of having turned down offers. Column 1 shows the correlation without
any additional control variables. In Column 2, we control for household characteristics.
We add housing project characteristics in Column 3. Column 4 finally includes neighbor-
hood characteristics and departement fixed effects since the allocation of a public housing
dwelling takes place at the departement level. In each specification, the coefficient on
ethnic diversity is not significantly different from zero, showing that households having
declined offers during their past allocation process do not end up living in neighborhoods
with significantly different levels of diversity.
A30

Table A13 – Rejection of Public housing offers and Ethnic diversity
Coeff. associated with Ethnic DiversityRows: Dependent Variables (1) (2) (3) (4)
Panel A: Sample of households who currently live in public housing:
I. Probability of having declined 0.058 0.069 0.017 0.123at least one public housing offer during the (0.058) (0.063) (0.067) (0.0886)previous application processN 1,779 1,779 1,748 1,744
R2 0.001 0.021 0.023 0.089
II. Probability that the reason for having 0.162 0.061 0.017 -0.0310declined a public housing offer during the previous (0.144) (0.158) (0.171) (0.258)application was “unpleasant environment”N 417 417 415 414
R2 0.003 0.035 0.050 0.308
Panel B: Sample of households who are currently applying to public housing:
I. Probability of having declined -0.063 -0.043 -0.088 -0.116at least one public housing offer during the (0.057) (0.064) (0.071) (0.103)current application processN 1,192 1,192 1,173 1,171
R2 0.001 0.014 0.024 0.121
II. Probability that the reason for having 0.004 -0.007 -0.104 -0.122declined a public housing offer during the current (0.194) (0.237) (0.250) (0.506)application was “unpleasant environment”N 198 198 195 194
R2 0.000 0.083 0.115 0.590
Note:Each of the coefficients is estimated from a separate regression of each of the four depen-dent variables described in the first column on an ethnic fractionalization index at thehousing block-level. Column 1 does not include any control. Column 2 includes householdscharacteristics (gender, age, education, employment status and nationality of the head ofhousehold, total income (in log) of the household per unit of consumption, and householdsize). Column 3 adds up the characteristics of the building (number of apartments (inlog) and construction date). On top of that, column 4 includes neighborhood characteris-tics (socio-economic background (Tabard index), and local unemployment rate), as well asdepartement fixed effects. In addition, a dummy variable indicating whether the householdalready lives in the public housing sector is included in specifications 2 to 4 of Panel B.Standard errors, clustered at the residential block level, are in parentheses with a, b and c
respectively denoting significance at the 1%, 5% and 10%.
A31