the economic status of women of color: a snapshot · our nation’s 67 million working women4 hold...
TRANSCRIPT
1
Facts cannot completely describe the challenges faced by working women. But facts are important in painting a picture of the lives of working women and informing policies and actions needed. These fact sheets provide a picture of Black, Hispanic, and Asian working women in the United States in the following areas:
• women’s contribution to family income;
• unemployment and the effects of the recession;
• families in poverty;
• educational attainment and likelihood of unemployment;
• the impact of educational attainment on women’s pay;
• occupational distribution and impact on pay;
• the wage gap between men and women;
• the real cost of the wage gap; and
• the impact of the gender wage gap on the retirement income of older women.
The demographic landscape of the U.S. has changed considerably in recent decades. The nation’s racial and ethnic mix has shifted, driven by high levels of immigration of Hispanics and Asians. More than half of the growth in the total U.S. population between 2000 and 2010 was attributed to the increase in the Hispanic population.1
Changing roles of women have reshaped the landsCape of the ameriCan labor forCe
Fifty-eight percent of women in the United States age 16 and over participate in the labor force (working or looking for work).2 This includes 57 percent of White women, 60 percent of Black women, 57 percent of Hispanic women, and 57 percent of Asian women.3
Our nation’s 67 million working women4 hold nearly half of today’s jobs.5 Of these 67 million working women, about 52.8 million are White, 8.6 million are Black, and 3.6 million are Asian.6 Women of Hispanic or Latino ethnicity (who may be of any race) make up 9.2 million of the 67 million women workers.7
The fact sheets highlight the different situations of the larger populations of women of color in the U.S. labor force. It assembles selected Federal government data and statistical resources to present a picture of the economic status of Black, Asian, and Hispanic women in the labor force.Sufficientdatawerenotavailableontherelativelysmaller populations of American Indian, Alaska Native, NativeHawaiian,andotherPacificIslanderwomeninthelabor force, so they are excluded.
the economic status of women of Color: a snapshot
Fact sheet
2
women’s ContribUtion to familY inCome
Women’searningsaccountforasignificantand growing portion of household income. In 2010, married working women contributed 38 percent of their families’ total income, up from 27 percent in 1970.8
As a result of the tough economic times brought on by the Great Recession between December 2007 and June 2009,9 women have increasingly become the primary breadwinners for their families.10
In 2011, nearly one-half (45 percent) of Black families and 25 percent of Hispanic families were maintained by women heads of household. Twelve percent of Asian families and 16 percent of White families were maintained by women.11
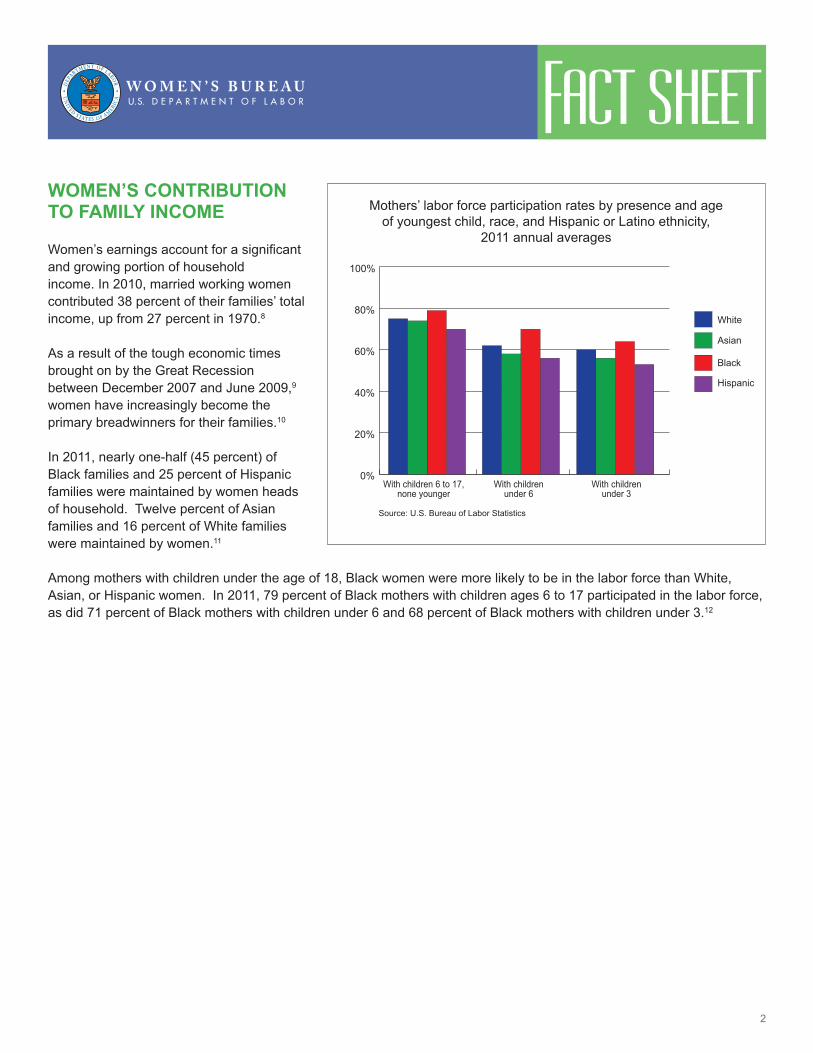
Among mothers with children under the age of 18, Black women were more likely to be in the labor force than White, Asian, or Hispanic women. In 2011, 79 percent of Black mothers with children ages 6 to 17 participated in the labor force, as did 71 percent of Black mothers with children under 6 and 68 percent of Black mothers with children under 3.12
0%
20%
40%
60%
80%
100%
Asian
White
Hispanic
Black
With children 6 to 17, none younger
With children under 6
With children under 3
Source: U.S. Bureau of Labor Statistics
Mothers’ labor force participation rates by presence and age of youngest child, race, and Hispanic or Latino ethnicity,
2011 annual averages
Fact sheet
3
women’s UnemploYment and the effeCt of the reCession
During the Great Recession of December 2007 through June 2009, the unemployment rate for women did not rise as rapidly as the unemployment rate for men. Women were more likely to be employed in the education, health, and government sectors, which continued to create jobs during the recession, while men were more likely to be employed in sectors such as construction and manufacturing that were losing large numbers of jobs.During the recovery, however, more men than women were employed in fast-growing sectors, such as manufacturing and professional and business services, while more women were employed in government, which lost over 700,000 jobs between June 2009 and December 2012.13 As a result, women’s unemployment rate peaked during the recovery.
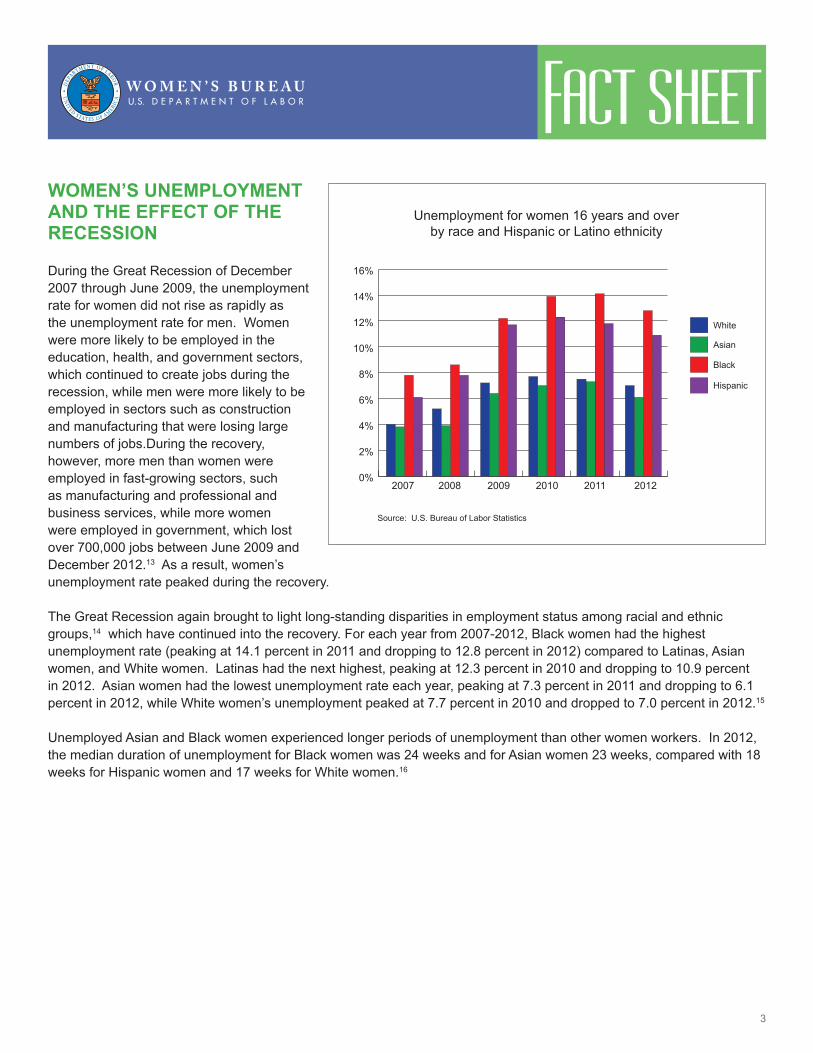
The Great Recession again brought to light long-standing disparities in employment status among racial and ethnic groups,14 which have continued into the recovery. For each year from 2007-2012, Black women had the highest unemployment rate (peaking at 14.1 percent in 2011 and dropping to 12.8 percent in 2012) compared to Latinas, Asian women, and White women. Latinas had the next highest, peaking at 12.3 percent in 2010 and dropping to 10.9 percent in 2012. Asian women had the lowest unemployment rate each year, peaking at 7.3 percent in 2011 and dropping to 6.1 percent in 2012, while White women’s unemployment peaked at 7.7 percent in 2010 and dropped to 7.0 percent in 2012.15
Unemployed Asian and Black women experienced longer periods of unemployment than other women workers. In 2012, the median duration of unemployment for Black women was 24 weeks and for Asian women 23 weeks, compared with 18 weeks for Hispanic women and 17 weeks for White women.16
Source: U.S. Bureau of Labor Statistics
0%
2%
4%
6%
8%
10%
12%
14%
16%
Hispanic
Black
Asian
White
2007 2008 2009 2010 2011 2012
Unemployment for women 16 years and over by race and Hispanic or Latino ethnicity
Fact sheet
4
families in povertY
The U.S. Census Bureau uses a set of income thresholds that vary by family size and composition to determine who is living in poverty. If a family’s total income is less than the family’s threshold, then that family is considered to be in poverty.17 For example, in 2011 the poverty threshold for a single mother living with two children under the age of 18 was $18,123 and for a single mother with three children, $22,891.18
Historically, women have been more likely to be poor than men. Poverty rates for unmarried female householdersi with children are particularly high, and have consistently been two or three times higher than the poverty rates for men and women overall for over four decades.19 Families inpovertyhavedifficultypayingforbasicexpenses, such as rent, food, and clothing, and are at greater risk for homelessness than families above the poverty threshold.
In 2011, 31 percent of families with a female householder, no husband present, lived in poverty compared to six percent of families of married couples and 16 percent of families with a male householder, no wife present.20
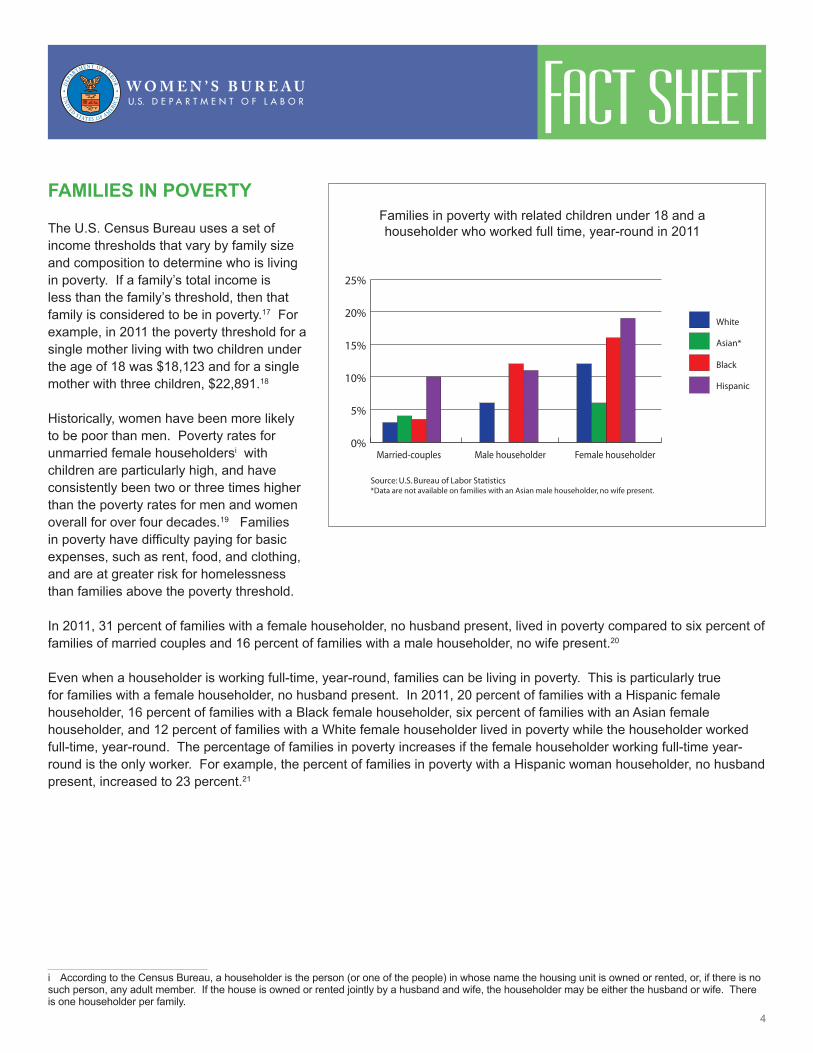
Even when a householder is working full-time, year-round, families can be living in poverty. This is particularly true for families with a female householder, no husband present. In 2011, 20 percent of families with a Hispanic female householder, 16 percent of families with a Black female householder, six percent of families with an Asian female householder, and 12 percent of families with a White female householder lived in poverty while the householder worked full-time, year-round. The percentage of families in poverty increases if the female householder working full-time year-round is the only worker. For example, the percent of families in poverty with a Hispanic woman householder, no husband present, increased to 23 percent.21
i According to the Census Bureau, a householder is the person (or one of the people) in whose name the housing unit is owned or rented, or, if there is no such person, any adult member. If the house is owned or rented jointly by a husband and wife, the householder may be either the husband or wife. There is one householder per family.
Source: U.S. Bureau of Labor Statistics*Data are not available on families with an Asian male householder, no wife present.
0%
5%
10%
15%
20%
25%
Hispanic
Black
Asian*
White
Married-couples Male householder Female householder
Families in poverty with related children under 18 and a householder who worked full time, year-round in 2011
Fact sheet
5
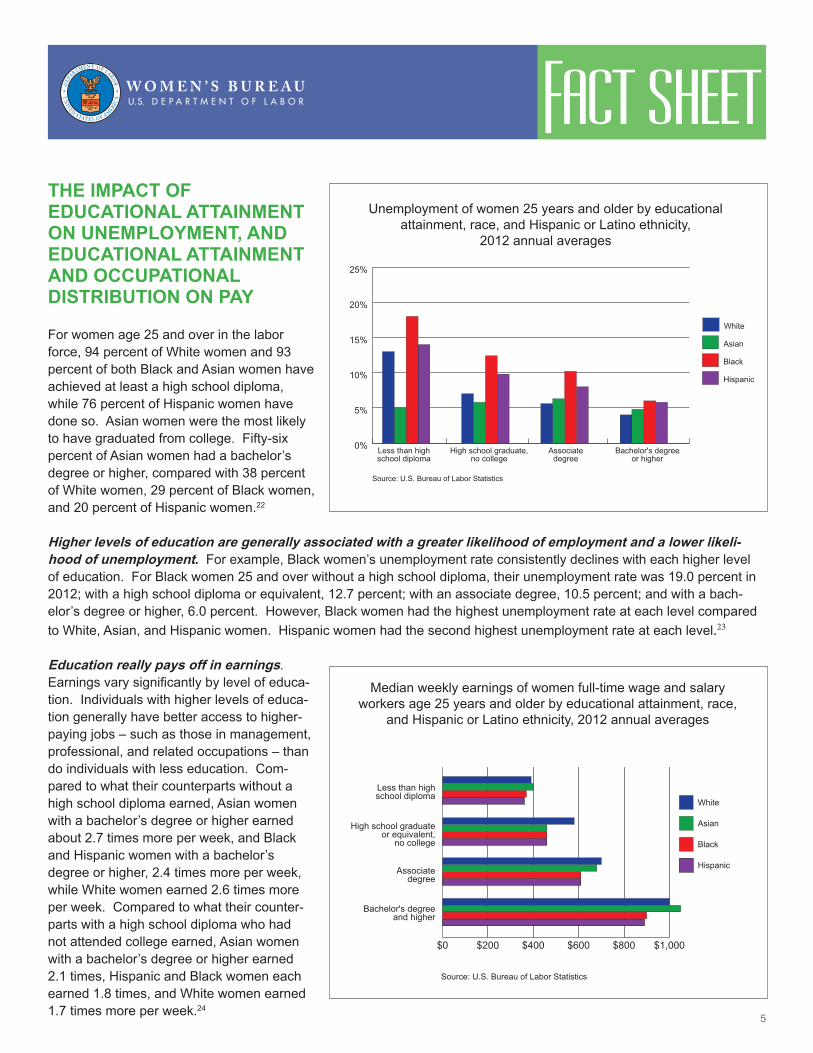
the impaCt of edUCational attainment on UnemploYment, and edUCational attainment and oCCUpational distribUtion on paY
For women age 25 and over in the labor force, 94 percent of White women and 93 percent of both Black and Asian women have achieved at least a high school diploma, while 76 percent of Hispanic women have done so. Asian women were the most likely to have graduated from college. Fifty-six percent of Asian women had a bachelor’s degree or higher, compared with 38 percent of White women, 29 percent of Black women, and 20 percent of Hispanic women.22
higher levels of education are generally associated with a greater likelihood of employment and a lower likeli-hood of unemployment. For example, Black women’s unemployment rate consistently declines with each higher level of education. For Black women 25 and over without a high school diploma, their unemployment rate was 19.0 percent in 2012; with a high school diploma or equivalent, 12.7 percent; with an associate degree, 10.5 percent; and with a bach-elor’s degree or higher, 6.0 percent. However, Black women had the highest unemployment rate at each level compared to White, Asian, and Hispanic women. Hispanic women had the second highest unemployment rate at each level.23
education really pays off in earnings. Earningsvarysignificantlybylevelofeduca-tion. Individuals with higher levels of educa-tion generally have better access to higher-paying jobs – such as those in management, professional, and related occupations – than do individuals with less education. Com-pared to what their counterparts without a high school diploma earned, Asian women with a bachelor’s degree or higher earned about 2.7 times more per week, and Black and Hispanic women with a bachelor’s degree or higher, 2.4 times more per week, while White women earned 2.6 times more per week. Compared to what their counter-parts with a high school diploma who had not attended college earned, Asian women with a bachelor’s degree or higher earned 2.1 times, Hispanic and Black women each earned 1.8 times, and White women earned 1.7 times more per week.24
Source: U.S. Bureau of Labor Statistics
0%
5%
10%
15%
20%
25%
Hispanic
Black
Asian
White
Less than high school diploma
High school graduate, no college
Associate degree
Bachelor's degree or higher
Unemployment of women 25 years and older by educational attainment, race, and Hispanic or Latino ethnicity,
2012 annual averages
$0 $200 $400 $600 $800 $1,000
Hispanic
Black
Asian
White
Source: U.S. Bureau of Labor Statistics
Less than high school diploma
High school graduate or equivalent,
no college
Associate degree
Bachelor's degree and higher
Median weekly earnings of women full-time wage and salary workers age 25 years and older by educational attainment, race,
and Hispanic or Latino ethnicity, 2012 annual averages
Fact sheet
6
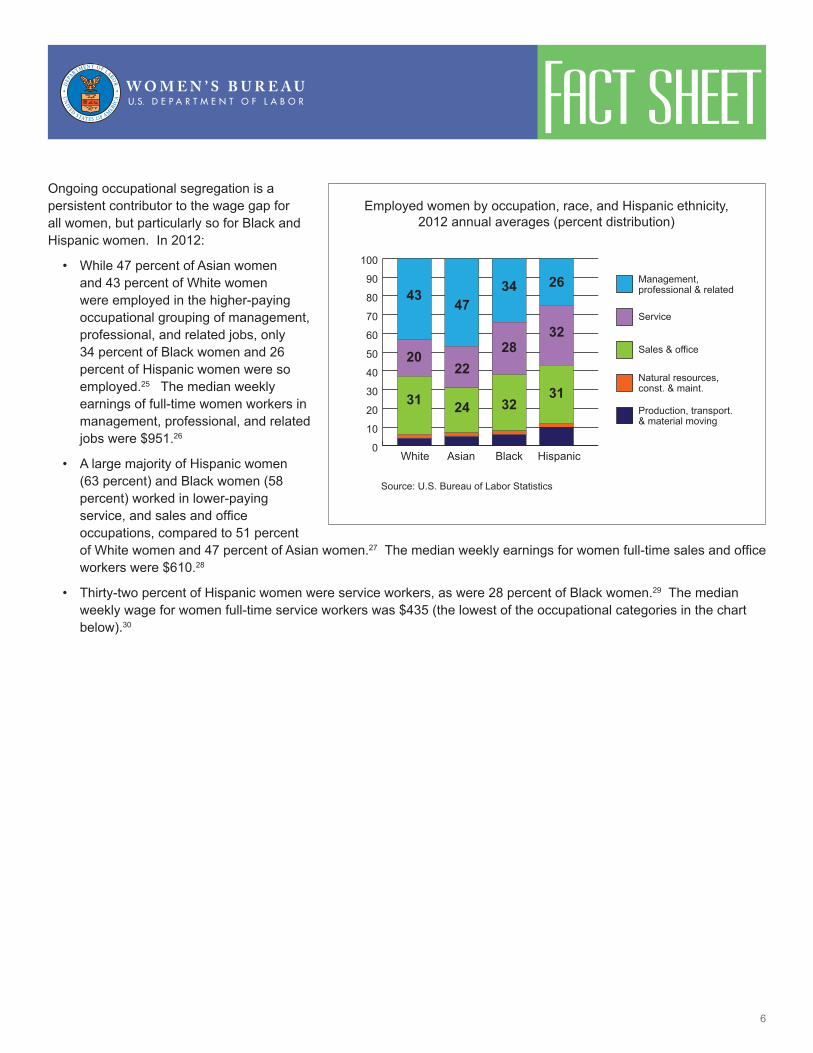
Ongoing occupational segregation is a persistent contributor to the wage gap for all women, but particularly so for Black and Hispanic women. In 2012:
• While 47 percent of Asian women and 43 percent of White women were employed in the higher-paying occupational grouping of management, professional, and related jobs, only 34 percent of Black women and 26 percent of Hispanic women were so employed.25 The median weekly earnings of full-time women workers in management, professional, and related jobs were $951.26
• A large majority of Hispanic women (63 percent) and Black women (58 percent) worked in lower-paying service,andsalesandofficeoccupations, compared to 51 percent of White women and 47 percent of Asian women.27Themedianweeklyearningsforwomenfull-timesalesandofficeworkers were $610.28
• Thirty-two percent of Hispanic women were service workers, as were 28 percent of Black women.29 The median weekly wage for women full-time service workers was $435 (the lowest of the occupational categories in the chart below).30
0
10
20
30
40
50
60
70
80
90
100
HispanicBlackAsianWhite
43
20
31
47
22
24
34
28
32
26
32
31
Source: U.S. Bureau of Labor Statistics
Management, professional & related
Service
Sales & office
Natural resources, const. & maint.
Production, transport.& material moving
Employed women by occupation, race, and Hispanic ethnicity, 2012 annual averages (percent distribution)
Fact sheet
7
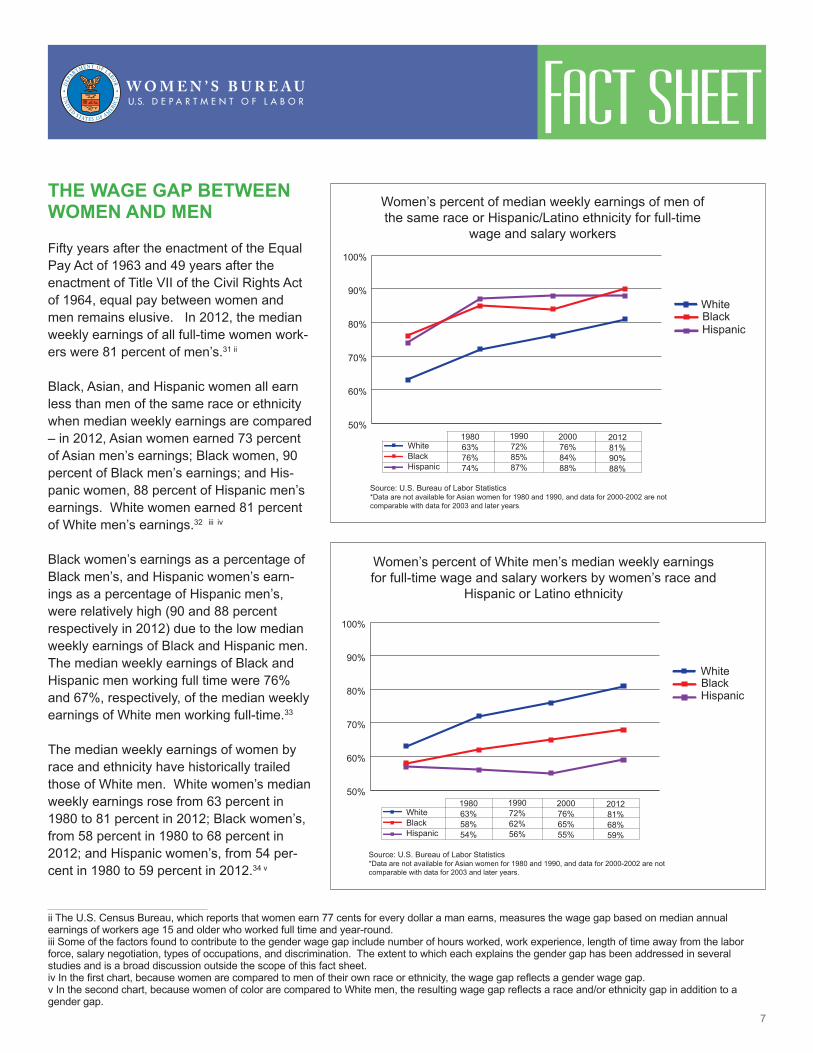
the wage gap between women and men
Fifty years after the enactment of the Equal Pay Act of 1963 and 49 years after the enactment of Title VII of the Civil Rights Act of 1964, equal pay between women and men remains elusive. In 2012, the median weekly earnings of all full-time women work-ers were 81 percent of men’s.31 ii
Black, Asian, and Hispanic women all earn less than men of the same race or ethnicity when median weekly earnings are compared – in 2012, Asian women earned 73 percent of Asian men’s earnings; Black women, 90 percent of Black men’s earnings; and His-panic women, 88 percent of Hispanic men’s earnings. White women earned 81 percent of White men’s earnings.32 iii iv
Black women’s earnings as a percentage of Black men’s, and Hispanic women’s earn-ings as a percentage of Hispanic men’s, were relatively high (90 and 88 percent respectively in 2012) due to the low median weekly earnings of Black and Hispanic men. The median weekly earnings of Black and Hispanic men working full time were 76% and 67%, respectively, of the median weekly earnings of White men working full-time.33
The median weekly earnings of women by race and ethnicity have historically trailed those of White men. White women’s median weekly earnings rose from 63 percent in 1980 to 81 percent in 2012; Black women’s, from 58 percent in 1980 to 68 percent in 2012; and Hispanic women’s, from 54 per-cent in 1980 to 59 percent in 2012.34 v
ii The U.S. Census Bureau, which reports that women earn 77 cents for every dollar a man earns, measures the wage gap based on median annual earnings of workers age 15 and older who worked full time and year-round.iii Some of the factors found to contribute to the gender wage gap include number of hours worked, work experience, length of time away from the labor force, salary negotiation, types of occupations, and discrimination. The extent to which each explains the gender gap has been addressed in several studies and is a broad discussion outside the scope of this fact sheet.ivInthefirstchart,becausewomenarecomparedtomenoftheirownraceorethnicity,thewagegapreflectsagenderwagegap.vInthesecondchart,becausewomenofcolorarecomparedtoWhitemen,theresultingwagegapreflectsaraceand/orethnicitygapinadditiontoagender gap.
50%
60%
70%
80%
90%
100%
HispanicBlackWhite
Source: U.S. Bureau of Labor Statistics*Data are not available for Asian women for 1980 and 1990, and data for 2000-2002 are not comparable with data for 2003 and later years.
WhiteBlackHispanic
198063%58%54%
199072%62%56%
200076%65%55%
201281%68%59%
Women’s percent of White men’s median weekly earnings for full-time wage and salary workers by women’s race and
Hispanic or Latino ethnicity
50%
60%
70%
80%
90%
100%
HispanicBlackWhite
Source: U.S. Bureau of Labor Statistics*Data are not available for Asian women for 1980 and 1990, and data for 2000-2002 are not comparable with data for 2003 and later years.
WhiteBlackHispanic
198063%76%74%
199072%85%87%
200076%84%88%
201281%90%88%
Women’s percent of median weekly earnings of men of thesameraceorHispanic/Latinoethnicityforfull-time
wage and salary workers
Fact sheet
8
Although the wage gap has decreased over time, Black and Hispanic women continue to experience a huge gap in median weekly earnings compared to White men. Black women earn 32 cents less per dollar than White men and Hispanic women receive 41 cents less for every dollar White men are paid.
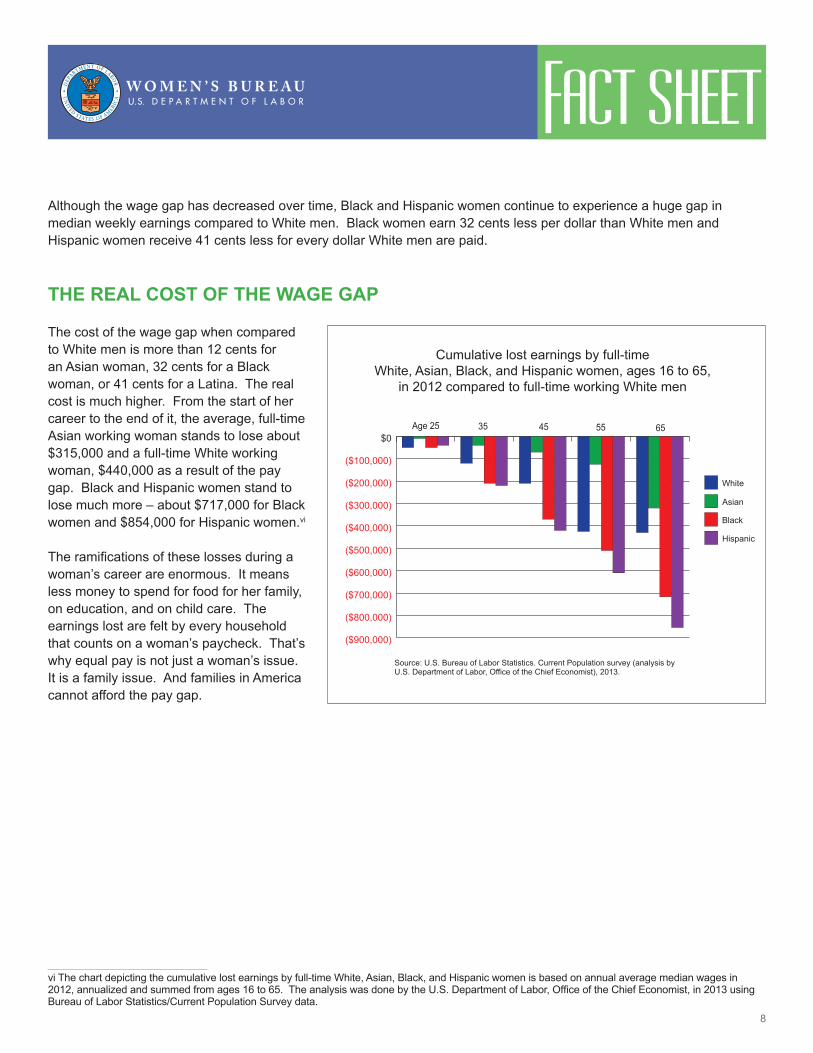
the real Cost of the wage gap
The cost of the wage gap when compared to White men is more than 12 cents for an Asian woman, 32 cents for a Black woman, or 41 cents for a Latina. The real cost is much higher. From the start of her career to the end of it, the average, full-time Asian working woman stands to lose about $315,000 and a full-time White working woman, $440,000 as a result of the pay gap. Black and Hispanic women stand to lose much more – about $717,000 for Black women and $854,000 for Hispanic women.vi
Theramificationsoftheselossesduringawoman’s career are enormous. It means less money to spend for food for her family, on education, and on child care. The earnings lost are felt by every household that counts on a woman’s paycheck. That’s why equal pay is not just a woman’s issue. It is a family issue. And families in America cannot afford the pay gap.
vi The chart depicting the cumulative lost earnings by full-time White, Asian, Black, and Hispanic women is based on annual average median wages in 2012,annualizedandsummedfromages16to65.TheanalysiswasdonebytheU.S.DepartmentofLabor,OfficeoftheChiefEconomist,in2013usingBureauofLaborStatistics/CurrentPopulationSurveydata.
($900,000)
($800,000)
($700,000)
($600,000)
($500,000)
($400,000)
($300,000)
($200,000)
($100,000)
$0
Hispanic
Black
Asian
White
Source: U.S. Bureau of Labor Statistics. Current Population survey (analysis by U.S. Department of Labor, Office of the Chief Economist), 2013.
Age 25 35 45 55 65
Cumulative lost earnings by full-time White, Asian, Black, and Hispanic women, ages 16 to 65,
in 2012 compared to full-time working White men
Fact sheet
9
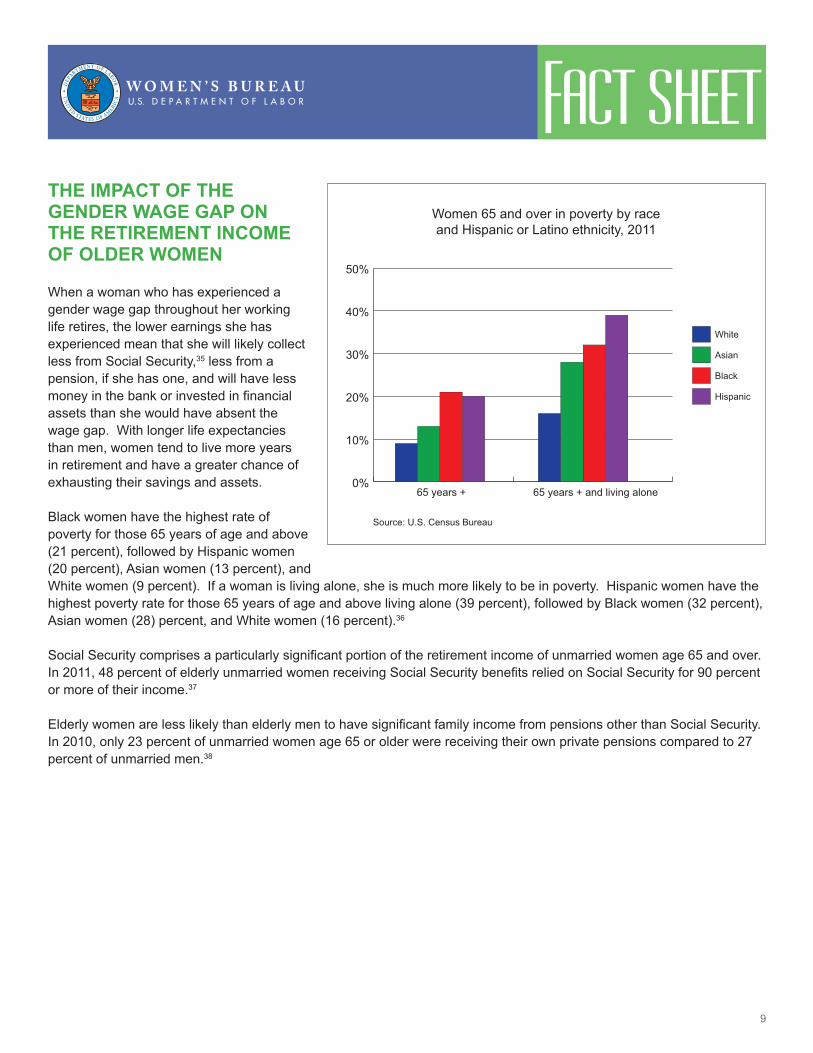
the impaCt of the gender wage gap on the retirement inCome of older women
When a woman who has experienced a gender wage gap throughout her working life retires, the lower earnings she has experienced mean that she will likely collect less from Social Security,35 less from a pension, if she has one, and will have less moneyinthebankorinvestedinfinancialassets than she would have absent the wage gap. With longer life expectancies than men, women tend to live more years in retirement and have a greater chance of exhausting their savings and assets.
Black women have the highest rate of poverty for those 65 years of age and above (21 percent), followed by Hispanic women (20 percent), Asian women (13 percent), and White women (9 percent). If a woman is living alone, she is much more likely to be in poverty. Hispanic women have the highest poverty rate for those 65 years of age and above living alone (39 percent), followed by Black women (32 percent), Asian women (28) percent, and White women (16 percent).36
SocialSecuritycomprisesaparticularlysignificantportionoftheretirementincomeofunmarriedwomenage65andover.In2011,48percentofelderlyunmarriedwomenreceivingSocialSecuritybenefitsreliedonSocialSecurityfor90percentor more of their income.37
ElderlywomenarelesslikelythanelderlymentohavesignificantfamilyincomefrompensionsotherthanSocialSecurity.In 2010, only 23 percent of unmarried women age 65 or older were receiving their own private pensions compared to 27 percent of unmarried men.38
0%
10%
20%
30%
40%
50%
Hispanic
Black
Asian
White
65 years + 65 years + and living alone
Source: U.S. Census Bureau
Women 65 and over in poverty by race and Hispanic or Latino ethnicity, 2011

Fact sheet
10
resoUrCes and ContaCts
The Department of Labor has made ending the pay gap one of its top priorities and has built a strong record of identifyingandeliminatinggender-basedwagediscrimination.ThroughtheeffortsoftheWomen’sBureau,theOfficeofFederal Contract Compliance Programs, and the Wage and Hour Division, the Department has increased enforcement; successfully resolved discrimination cases; increased worker, employer, and advocate outreach and education; and engaged in research and data sharing.
For information on worker protection and employer compliance assistance programs, please contact the U.S. Department of Labor or any of the other resources listed below:
resoUrCesgovernment resources
• The White House § “Your Right to Equal Pay”– http://www.whitehouse.gov/issues/equal-pay#top § Fifty Years After the Equal Pay Act: Assessing the Past, Taking Stock of the Future (2013). National Equal Pay
Task Force. http://www.whitehouse.gov/sites/default/files/image/image_file/equal_pay-task_force_progress_report_june_10_2013.pdf
§ Council on Women and Girls – http://www.whitehouse.gov/women
• U.S. Department of Labor – http://www.dol.gov/ § EmployeeBenefitsSecurityAdministration–http://www.dol.gov/ebsa
❍❍ Women and Retirement Savings. http://www.dol.gov/ebsa/publications/women.html § OfficeofFederalContractCompliancePrograms–http://www.dol.gov/ofccp
❍❍ Advancing Equal Pay Enforcement: More Effective and Transparent Procedures for Investigating Pay Discrimination (2013). http://www.dol.gov/equalpay
❍❍ “MakingGoodonthePromiseofEqualPay.”TheOfficialBlogoftheU.S.DepartmentofLabor,May6,2013. http://social.dol.gov/blog/making-good-on-the-promise-of-equal-pay/
❍❍ Equal Pay Enforcement Fact Sheet (2012). http://www.dol.gov/equalpay § Wage and Hour Division – http://www.dol.gov/whd § Women’s Bureau – http://www.dol.gov/wb
❍❍ A Guide to Women’s Equal Pay Rights (March 2012). http://www.dol.gov/equalpay/ ❍❍ An Employer’s Guide to Equal Pay (March 2012). http://www.dol.gov/equalpay/❍❍ Highlights of Women’s Earnings by Region (March 2013). http://www.dol.gov/equalpay/regions/
• U.S. Department of Justice – http://www.usdoj.gov
• U.S. Equal Employment Opportunity Commission – http://www.eeoc.gov § Facts about Equal Pay and Compensation Discrimination. http://www.eeoc.gov/eeoc/publications/fs-epa.cfm
• U.S.OfficeofPersonnelManagement–http://www.opm.gov
• U.S. Social Security Administration – http://www.ssa.gov § Social Security is Important to Women (February 2013). http://www.socialsecurity.gov/women
ContaCts
U.s. department of laborPhone: 1-866-4-USA-DOL(TTY: 1-877-889-5627)www.dol.gov
women’s bUreaUPhone: 1-800-827-5335http://www.dol.gov/wb
Endnotes
11
endnotes1 U.S. Census Bureau (March 24, 2011). “2010 Census Shows America’s Diversity: Hispanic and Asian Populations Grew Fastest During the Decade.” http://www.census.gov/newsroom/releases/archives/2010_census/cb11-cn125.html 2 U.S. Bureau of Labor Statistics, Current Population Survey, 2012 Annual Averages. Table 3. “Employment status of the civilian noninstitutional population by age, sex, and race.” http://www.bls.gov/cps/cpsaat03.htm 3 Ibid. Table 3 and Table 4. “Employment status of the Hispanic or Latino population by age and sex.” http://www.bls.gov/cps/cpsaat04.htm 4 Ibid. Table 3. “Employment status of the civilian noninstitutional population by age, sex, and race. ” http://www.bls.gov/cps/cpsaat03.htm5 In December 2012 and both January and February 2013, women were 49.3% of total nonfarm employees on employer payrolls (January and February results are preliminary). U.S. Bureau of Labor Statistics (March 8, 2013). Employment Situation, Table B-5. “Employment of women on nonfarm payrolls by industry sector, seasonally adjusted.” http://www.bls.gov/news.release/empsit.t21.htm 6 U.S. Bureau of Labor Statistics, Current Population Survey, 2012 Annual Averages. Table 3. “Employment status of the civilian noninstitutional population by age, sex, and race. ”http://www.bls.gov/cps/cpsaat03.htm7 Ibid. Table 4. “Employment status of the Hispanic or Latino population by age and sex.” http://www.bls.gov/cps/cpsaat04.htm8 U.S. Bureau of Labor Statistics (February 2013). Women in the Labor Force: A Databook, page 3. www.bls.gov/cps/wlf-databook-2012.pdf 9 The dates the recession began and ended were determined by the National Bureau of Economic Research. See “Business Cycle Dating Committee, National Bureau of Economic Research” (September 20, 2010). http://www.nber.org/cycles/sept2010.html 10 U.S. Department of Labor (March 8, 2010). Secretary Solis, International Women’s Day Luncheon remarks, Washington, DC. http://www.dol.gov/_sec/media/speeches/20100308_IWD.htm 11 U.S. Bureau of Labor Statistics (August 2012). Labor Force Characteristics by Race and Ethnicity, 2011 (page 3 and Table 10). “Employment and unemployment of families by type of family, race, and Hispanic or Latino ethnicity, 2011 annual averages” (page 34). www.bls.gov/cps/cpsrace2011.pdf 12 Ibid., page 3 and Table 11. “Labor force participation rates by presence and age of youngest child, sex, race, and Hispanic or Latino ethnicity, 1994-2011 annual averages” (pages 35-40). www.bls.gov/cps/cpsrace2011.pdf 13 U.S. Bureau of Labor Statistics, Current Employment Survey. Establishment Data. Table B-1. “Employees on nonfarm payrolls by industry sector and selected industry detail.” http://www.bls.gov/webapps/legacy/cesbtab1.htm (historical data retrieval page)14 U.S. Department of Labor (March 8, 2010). Secretary Solis, International Women’s Day Luncheon remarks, Washington, DC. http://www.dol.gov/_sec/media/speeches/20100308_IWD.htm15 U.S. Bureau of Labor Statistics (August 2012). Labor Force Characteristics by Race and Ethnicity, 2011. Table 12. “Unemployment rates by sex, race, and Hispanic or Latino ethnicity, 1972-2011 annual averages,” page 42. www.bls.gov/cps/cpsrace2011.pdf Also, Bureau of Labor Statistics, Current Population Survey, 2012 Annual Averages. Table 3. “Employment status of the civilian noninstitutional population by age, sex and race” (http://www.bls.gov/cps/cpsaat03.htm) and Table 4. “Employment status of the Hispanic or Latino population by age and sex” (http://www.bls.gov/cps/cpsaat04.htm). 16 U.S. Bureau of Labor Statistics, Current Population Survey, 2012 Annual Averages. Table 31. “ Unemployed persons by age, sex, race, Hispanic or Latino ethnicity, marital status, and duration of unemployment.” http://www.bls.gov/cps/cpsaat31.htm 17 U.S. Census Bureau. “How the Census Bureau Measures Poverty.” https://www.census.gov/hhes/www/poverty/about/overview/measure.html 18 U.S. Census Bureau. “Poverty Thresholds for 2012 by Size of Family and Number of Related Children Under 18 Years.” https://www.census.gov/hhes/www/poverty/data/threshld/index.html
Endnotes
12
19 Women in America: Indicators of Social and Economic Well-Being. U.S. Department of Commerce, Economics and Statistics Administration and the Executive Office of the President, Office of Management and Budget, for the White House Council on Women and Girls (March 2011), pages 14 and 66 (see “Chart). http://www.whitehouse.gov/administration/eop/cwg/data-on-women 20 U.S. Census Bureau (2012). Income, Poverty, and Health Insurance Coverage in the United States, Table 4 “Families in Poverty by Type of Family: 2010 and 2011,” page 17. http://www.census.gov/hhes/www/poverty/data/incpovhlth/2011/index.html 21 U.S. Census Bureau, Current Population Survey, 2012 Annual Social and Economic Supplement. “POV15: Families with Related Children Under 18 by Householder’s Work Experience and Family Structure.” http://www.census.gov/hhes/www/poverty/data/index.html#cps 22 U.S. Bureau of Labor Statistics, Current Population Survey, 2012 Annual Averages. Unpublished tabulations. 23 Ibid. Unpublished tabulations.24 Ibid. Unpublished tabulations.25 Ibid. Table 10. “Employed persons by occupation, race, Hispanic or Latino ethnicity, and sex.” http://www.bls.gov/cps/cpsaat10.htm 26 Ibid. Table 39. “Median weekly earnings of full-time wage and salary workers by detailed occupation and sex.” shttp://www.bls.gov/cps/cpsaat39.htm 27 Ibid. Table 10. “Employed persons by occupation, race, Hispanic or Latino ethnicity, and sex.” http://www.bls.gov/cps/cpsaat10.htm 28 Ibid. Table 39. “Median weekly earnings of full-time wage and salary workers by detailed occupation and sex.” http://www.bls.gov/cps/cpsaat39.htm 28 Ibid. Table 10. “Employed persons by occupation, race, Hispanic or Latino ethnicity, and sex.” http://www.bls.gov/cps/cpsaat10.htm 30 Ibid. Table 39. “Median weekly earnings of full-time wage and salary workers by detailed occupation and sex.” http://www.bls.gov/cps/cpsaat39.htm 31 Ibid. Table 37. “Median weekly earnings of full-time wage and salary workers by selected characteristics.” http://www.bls.gov/cps/cpsaat37.htm 32 Ibid. 33 Ibid.34 These calculations utilize U.S. Bureau of Labor Statistics data presented in Table 37. “Median weekly earnings of full-time wage and salary workers by selected characteristics,” for 2012 data (seehttp://www.bls.gov/cps/cpsaat37.htm); and Labor Force Characteristic by Race and Ethnicity, 2011. Table 16. “Median usual weekly earnings of full-time wage and salary workers by sex, race, and Hispanic or Latino ethnicity, 1979-2011 annual averages.” page 49, for 1980 and 2000 data (www.bls.gov/cps/cpsrace2011.pdf). 35 The Social Security system is progressive in that lower-wage earners receive a higher percentage benefit than higher-wage earners. U.S. Social Security Administration (February 2013). Social Security is Important to Women. http://www.socialsecurity.gov/pressoffice/factsheets/women.htm36 U.S. Census Bureau, Current Population Survey, 2012 Annual Social and Economic Supplement. “POV01: Age and Sex of All People, Family Members and Unrelated Individuals Iterated by Income-to-Poverty Ratio and Race.” http://www.census.gov/hhes/www/poverty/data/index.html#cps 37 U.S. Social Security Administration (February 2013). Social Security is Important to Women. http://www.socialsecurity.gov/pressoffice/factsheets/women.htm 38 Ibid.