the economic weekly price of tea · the economic weekly price of tea k murti february 19, 1955 the...
TRANSCRIPT

THE ECONOMIC WEEKLY
Price of Tea K M u r t i
February 19, 1955
T H E dizzy heights reached i n the M i n c i n g Lane auctions i n
recent months has drawn the attent i on of even the Br i t i sh Parl iament to the h i g h prices of tea. T h e Min is te r for Food was asked if efforts were be ing made to purchase the crops early this year on a long-term bulk buy ing contract to forestall the excessive prices now being charged by the growers. T h o u g h his reply was in the negative, and the M i n i s ter reiterated the Government ' s policy of relying upon the efforts of private importers to meet the country's demand, the abnormally h i g h price of tea cannot be a matter of indifference to the governments of both tea producing and tea consuming countries.
Indeed, the change that has come over the wor ld tea si tuation is as spectacular as it is sudden- It was only in 1952, that the I n d i a n tea industry was in the gr ip of a vicious s lump: ' in 1953, the pendu lum had swung almost to the other extreme. It should be said to the credit of the Raja Ramrao C o m m i t t e e that i ts assessment of the situation was correct. T h e s lump in prices was a passing phase and when the heavy stocks in the U n i t e d K i n g d o m were depleted, prices d i d go up- N o t wi ths tanding the voluntary restrict ion of product ion adopted by the industry in Ind ia in 1953, growers could not imp lemen t their pol icy owing to adverse weather condi t ions in that year. I n d i a n produc t ion in 1953 was less than that in the previous year. The re was, however, a marked improvement in the qual i ty of I n d i a n tea. T h e wor ld supply, w h i c h upto 1951 had lagged beh ind demand, had in 1952 outstr ipped demand to the extent of 64-100 m i l l i o n lbs. However, d u r i n g 1953 the wor ld ' s tea supply was estimated to be 14 per cent short of demand and was met ou t of carry-over. D u r
ing 1954, demand for tea cont inued to go up,
INDONESIA OUT FROM WORLD MARKET
Indonesia used to be an important marginal supplier of tea to the wor ld market in the pre-war period when her annual product ion was be tween 160 and 184 m i l l i o n lbs. D u r i n g 1942-45, Indonesian tea disappeared f rom the w o r l d market . Tea plantations s u f f e r e d enormous war damages, estimated at 25 per cent in Java and 35 per cent in Sumatra, w i t h the result that out-put dwind led f rom 194 m i l l i o n lbs in 1941 to 10 m i l l i o n lbs in 1944 W h e n tea cul t iva t ion was resumed in Java in 1947 and in Sumatra a year later, it was expected that I n d o nesian tea wou ld soon reappear on the wor ld market. However, facts belied such anticipations. As late as 1953, Indonesia produced only 81 m i l l i o n lbs of tea, w h i c h is only one-half of the pre-war ou tpu t . There was on ly a small rise in 1954 over 1953.
The combined ou tpu t of I nd i a , Pakistan and Ceylon in 1953 exceeded the pre-war p roduc t ion of these countries by over 40 per cent. T h e Indonesian produc t ion declined during the same period by about 56 per cent. T h e increase in product i on in other tea producing countries of the wor ld dur ing the above period was no t appreciable. No doubt , Ind ia and Ceylon have taken advantage of Indonesia's disappearance f rom the w o r l d o f tea. W i t h the increase in w o r l d popula t ion and a general rise in l i v i n g standards, the consumpt ion of tea has been going up. This w o u l d mean, even w i t h the present increased produc t ion , the current supply of Ind ian and Ceylonese teas to the wor ld market w o u l d fall beh ind wor ld de m a n d .
LONDON STOCKS THE KEY
T h e - t r e n d in w o r l d demand and supply is reflected in the stocks of tea held in L o n d o n , since the U n i t ed K i n g d o m is not only the world 's best customer, it is also the world 's clearing house for tea. Stocks in L o n d o n dur ing the last few months were at a dangerously low level. Last year's floods in N o r t h Ind ia and the L o n d o n dock strike further depleted stocks in L o n d o n .
As compared w i t h current supplies, consumption has been increasi n g not only in the U n i t e d K i n g d o m and Western Europe bu t also in the producing countries. F r o m 441.6 m i l l i o n lbs in 1933, consumpt i o n of tea in the U n i t e d K i n g d o m declined to 347.8 m i l l i o n lbs in 1946. D u r i n g the post-war per iod; however, there has been a rise in consumpt ion wh ich rose in 1953 to 464 m i l l i o n lbs. A survey carried out by the Tea Bureau among B r i t ish housewives suggests tha t the average weekly consumpt ion per head in 1954 has risen to 3.3 ozs f rom 3.1 ozs at the t ime of the 1953 survey.
T h e cumulat ive effects of lower o u t p u t in Ind ia owing to f ine r p lucking , low stocks and rising wor ld consumpt ion sent tea prices skyrocketing towards the end of 1954. T h e rise was not confined to I n d i a n teas, of course; all the pr inc ipa l tea p r o d u c i n g countries experienced boom conditions in 1954. T h e comparative prices of tea at the L o n d o n

T H E E C O N O M I C W E E K L Y February 19, 1955
auctions given in Tab le I I are illustrat ive.
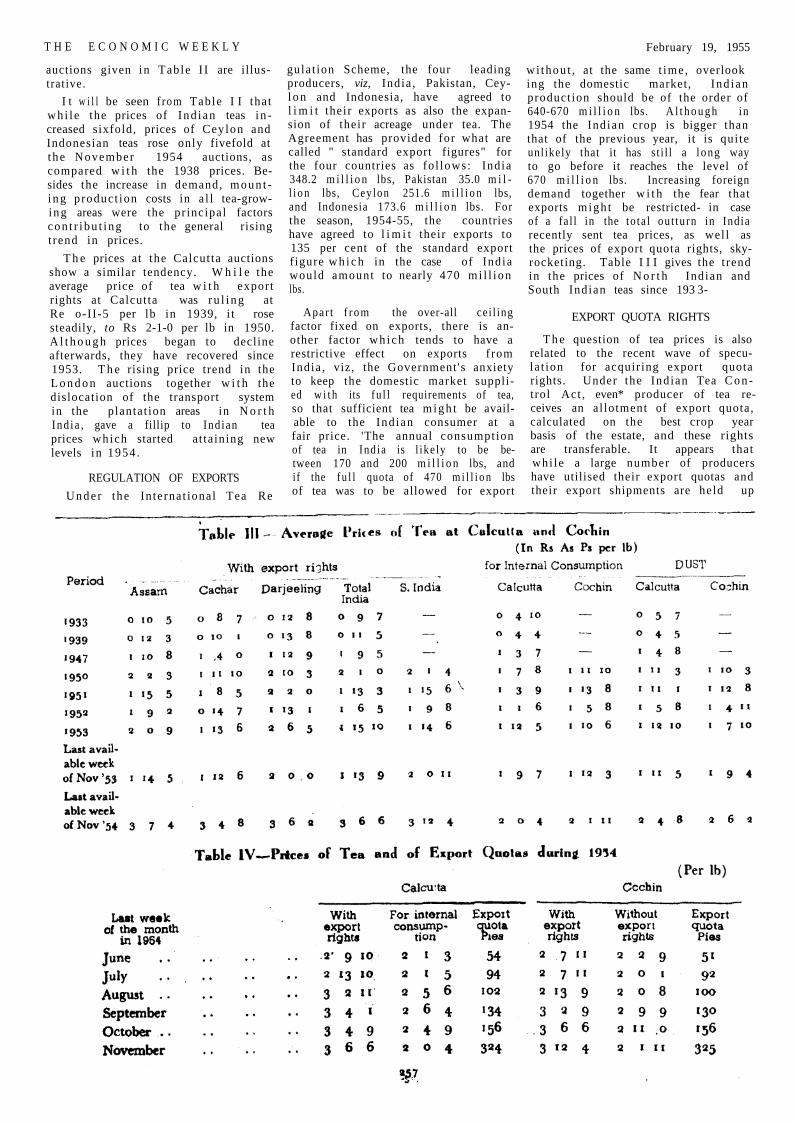
I t w i l l be seen f rom Table I I tha t wh i l e the prices of Ind i an teas i n creased sixfold, prices of Ceylon and Indonesian teas rose only fivefold at t he November 1954 auctions, as compared w i t h the 1938 prices. Besides the increase in demand, m o u n t i n g produc t ion costs in a l l tea-growing areas were the pr incipal factors c o n t r i b u t i n g to the general rising t rend in prices.
T h e prices at the Calcut ta auctions show a similar tendency. W h i l e the average price of tea w i t h export rights at Calcutta was r u l i n g at Re o-II-5 per lb in 1939, i t rose steadily, to Rs 2-1-0 per lb in 1950. A l t h o u g h prices began to decline afterwards, they have recovered since 1953. T h e rising price trend in the L o n d o n auctions together w i t h the dislocation of the transport system in the plantat ion areas in N o r t h Ind ia , gave a fillip to Ind ian tea prices which started a t ta ining new levels in 1954 .
REGULATION OF EXPORTS
U n d e r the In terna t ional Tea Re
gula t ion Scheme, the four leading producers, viz, India , Pakistan, Ceyl o n and Indonesia, have agreed to l i m i t their exports as also the expansion of their acreage under tea. The Agreement has provided for what are called " standard export figures" for the four countries as fo l lows: India 348.2 m i l l i o n lbs, Pakistan 35.0 m i l l i o n lbs, Cey lon 251.6 m i l l i o n lbs, and Indonesia 173.6 m i l l i o n lbs. For the season, 1954-55, the countries have agreed to l i m i t their exports to 135 per cent of the standard export f igure w h i c h in the case of Ind ia would amount to nearly 470 m i l l i o n lbs.
Apar t f rom the over-all cei l ing factor fixed on exports, there is another factor w h i c h tends to have a restrictive effect on exports f rom India , viz, the Government 's anxiety to keep the domestic market supplied w i t h its f u l l requirements of tea, so that sufficient tea m i g h t be available to the Ind ian consumer at a fair price. 'The annual consumption of tea in Ind ia is l ike ly to be between 170 and 200 m i l l i o n lbs, and if the f u l l quota of 470 m i l l i o n lbs of tea was to be allowed for export
w i thou t , at the same t ime , overlook ing the domestic market, Ind ian product ion should be of the order of 640-670 m i l l i o n lbs. A l t h o u g h in 1954 the Indian crop is bigger than that of the previous year, it is qui te unlikely that it has s t i l l a l ong way to go before it reaches the level of 670 m i l l i o n lbs. Increasing foreign demand together w i t h the fear that exports migh t be restricted- in case of a fa l l in the to ta l ou t tu rn in India recently sent tea prices, as wel l as the prices of export quota rights, skyrocketing. Table I I I gives the t rend in the prices of N o r t h Indian and South Indian teas since 193 3-
EXPORT QUOTA RIGHTS
T h e question of tea prices is also related to the recent wave of specula t ion for acquir ing export quota rights. Under the Ind ian Tea C o n trol Act , even* producer of tea re-ceives an a l lotment of export quota, calculated on the best crop year basis of the estate, and these rights are transferable. It appears that whi le a large number of producers have utilised their export quotas and their export shipments are held up
