the economics of lng export contract flexibility · the economics of lng export contract...
TRANSCRIPT
www.eprg.group.cam.ac.uk
Yichi Zhang, Chi Kong Chyong, Pierre Noël
EPRG, University of Cambridge
EPRG Winter Research Seminar – 07 December 2012
The Economics of LNG Export Contract Flexibility:
a quantitative approach
1
www.eprg.group.cam.ac.uk
Introduction: Gas market and long term contracts (LTC)
Research questions
Methodology: Value of LNG contracts flexibility
Gas market equilibrium model
Results: Impact of LTC flexibility on prices
Impact of LTC flexibility on producer profits and market efficiency.
Sensitivity analysis
Conclusion
Contents
2
www.eprg.group.cam.ac.uk
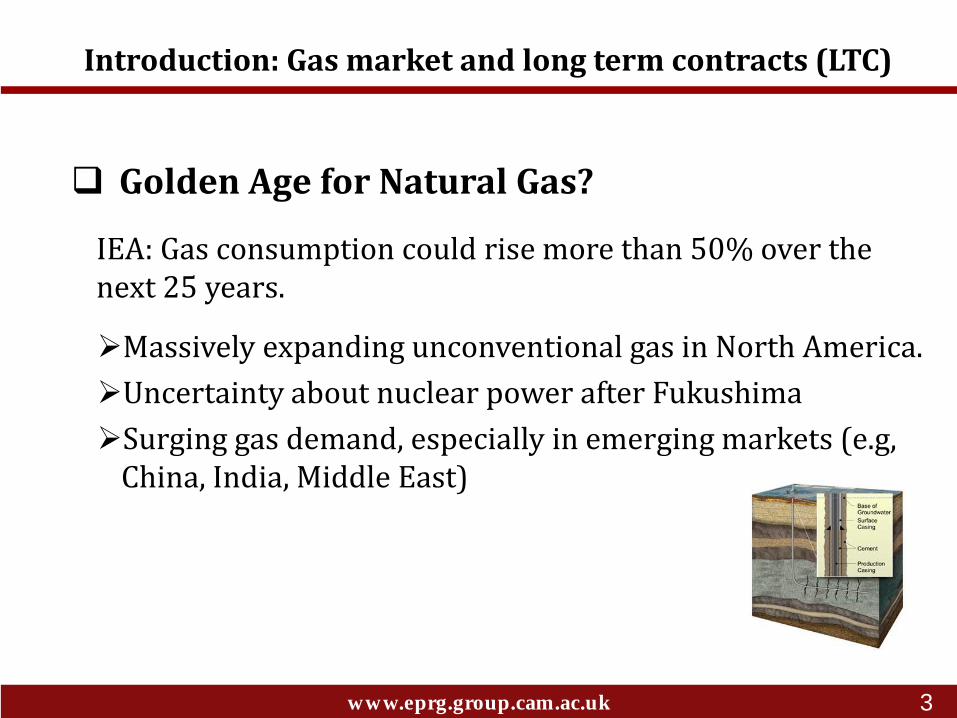
IEA: Gas consumption could rise more than 50% over the next 25 years.
Golden Age for Natural Gas?
Massively expanding unconventional gas in North America.
Uncertainty about nuclear power after Fukushima
Surging gas demand, especially in emerging markets (e.g, China, India, Middle East)
Introduction: Gas market and long term contracts (LTC)
3
www.eprg.group.cam.ac.uk
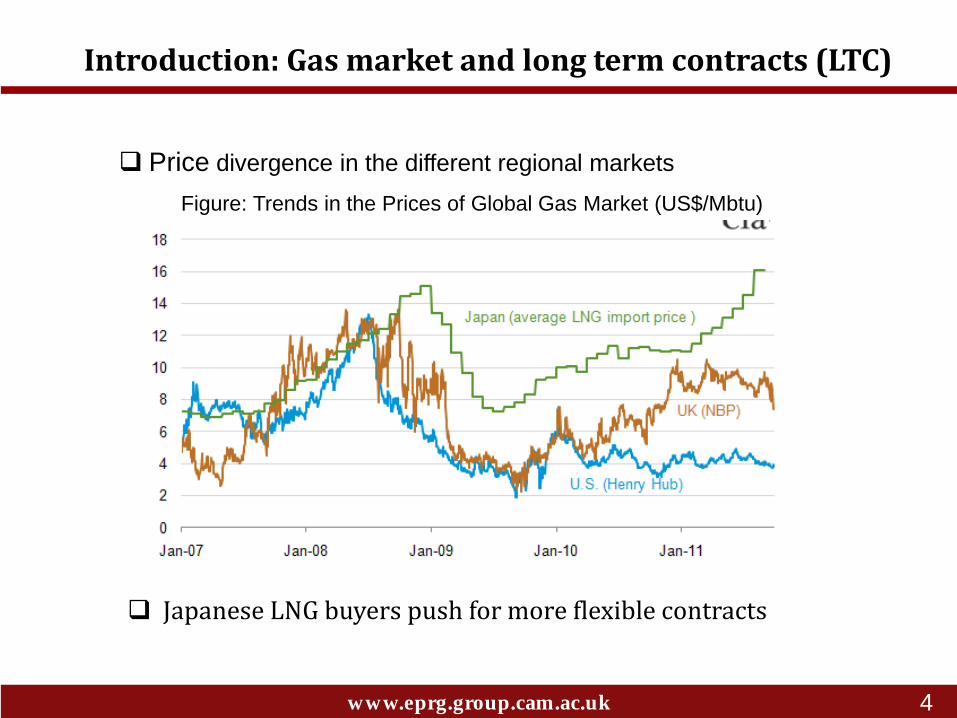
Figure: Trends in the Prices of Global Gas Market (US$/Mbtu)
Price divergence in the different regional markets
Introduction: Gas market and long term contracts (LTC)
Japanese LNG buyers push for more flexible contracts
4
www.eprg.group.cam.ac.uk
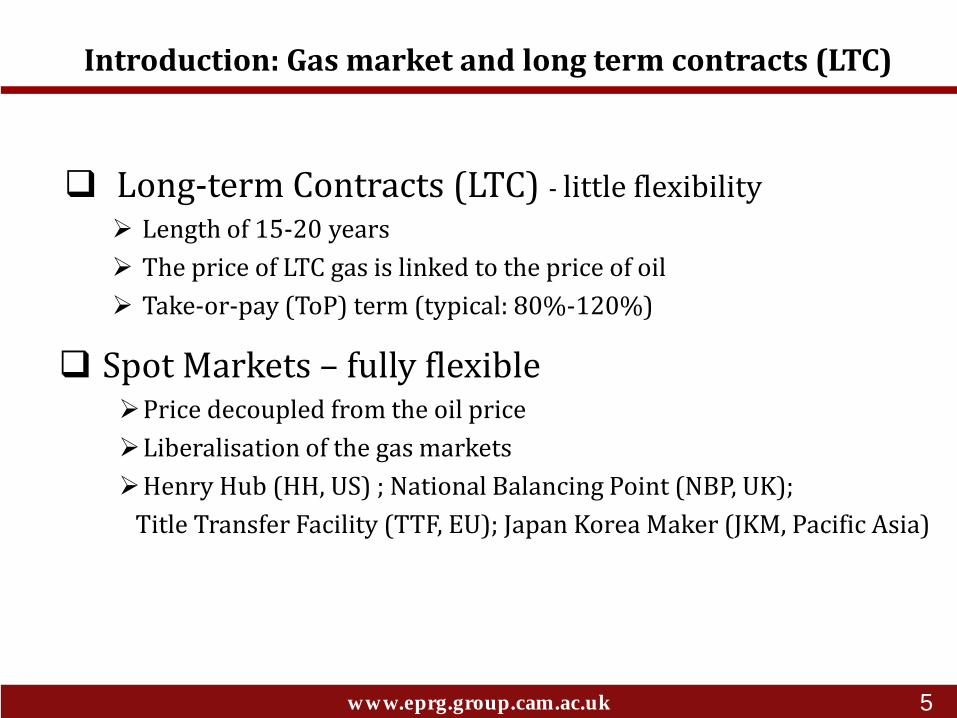
Long-term Contracts (LTC) - little flexibility
Length of 15-20 years
The price of LTC gas is linked to the price of oil
Take-or-pay (ToP) term (typical: 80%-120%)
Spot Markets – fully flexible Price decoupled from the oil price
Liberalisation of the gas markets
Henry Hub (HH, US) ; National Balancing Point (NBP, UK);
Title Transfer Facility (TTF, EU); Japan Korea Maker (JKM, Pacific Asia)
Introduction: Gas market and long term contracts (LTC)
5
www.eprg.group.cam.ac.uk
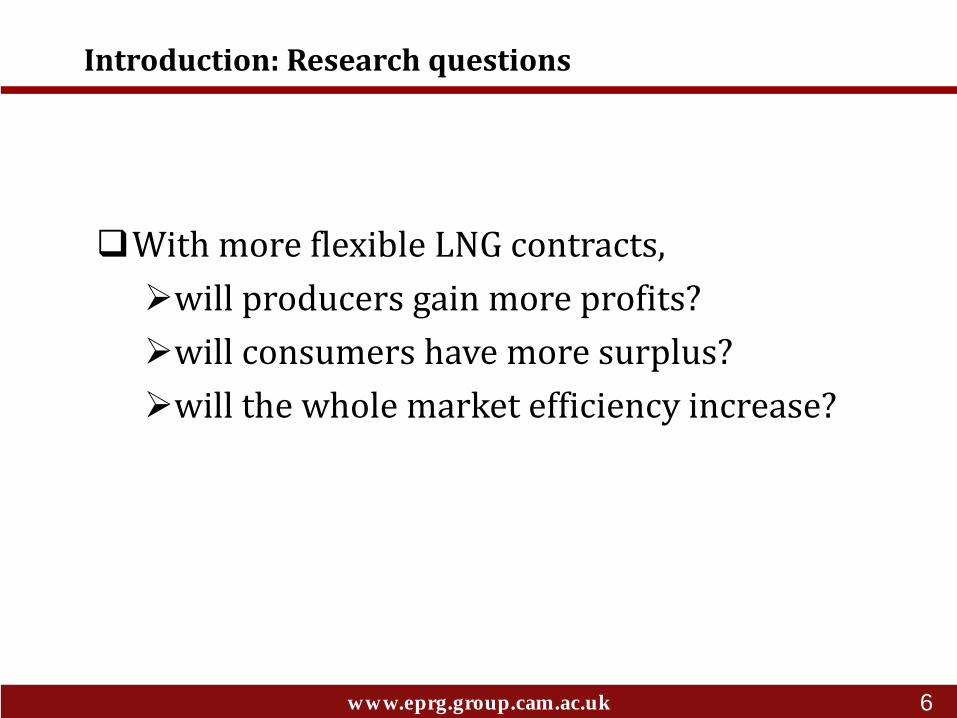
With more flexible LNG contracts,
will producers gain more profits?
will consumers have more surplus?
will the whole market efficiency increase?
Introduction: Research questions
6
www.eprg.group.cam.ac.uk
Introduction: Gas market and long term contracts (LTC)
Research questions
Methodology: Value of LNG contracts flexibility
Gas market equilibrium model
Results: Impact of LTC flexibility on prices
Impact of LTC flexibility on producer profits and market efficiency.
Sensitivity analysis
Conclusion
Contents
7
www.eprg.group.cam.ac.uk
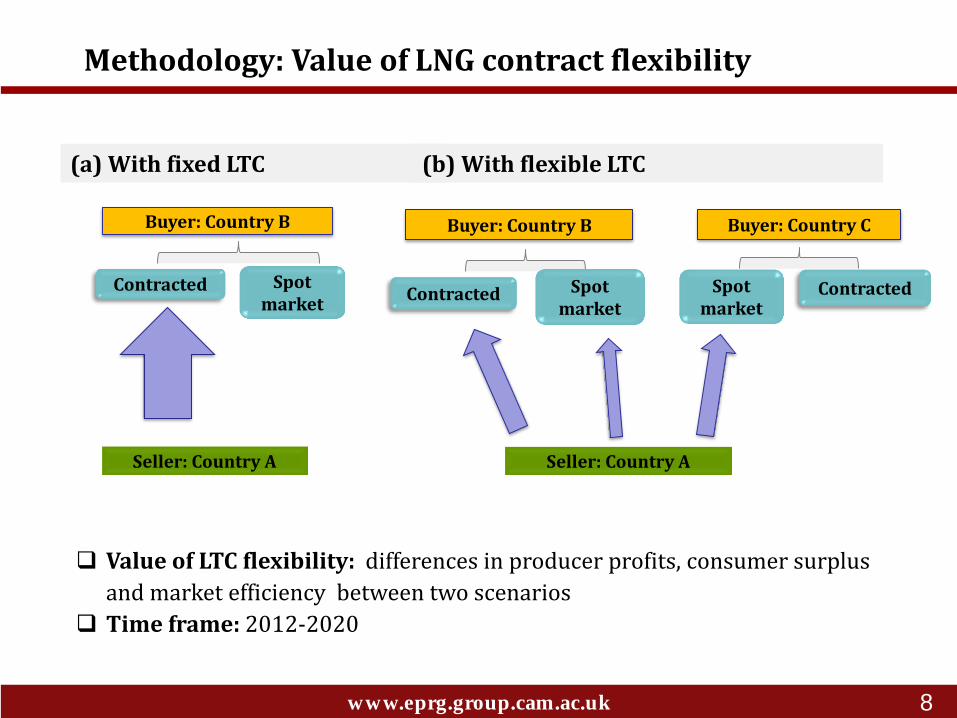
Seller: Country A
Buyer: Country B
Contracted Spot market
(a) With fixed LTC
Seller: Country A
Buyer: Country B
Spot market
Buyer: Country C
Spot market
Contracted
(b) With flexible LTC
Contracted
Methodology: Value of LNG contract flexibility
Value of LTC flexibility: differences in producer profits, consumer surplus
and market efficiency between two scenarios
Time frame: 2012-2020
8
www.eprg.group.cam.ac.uk
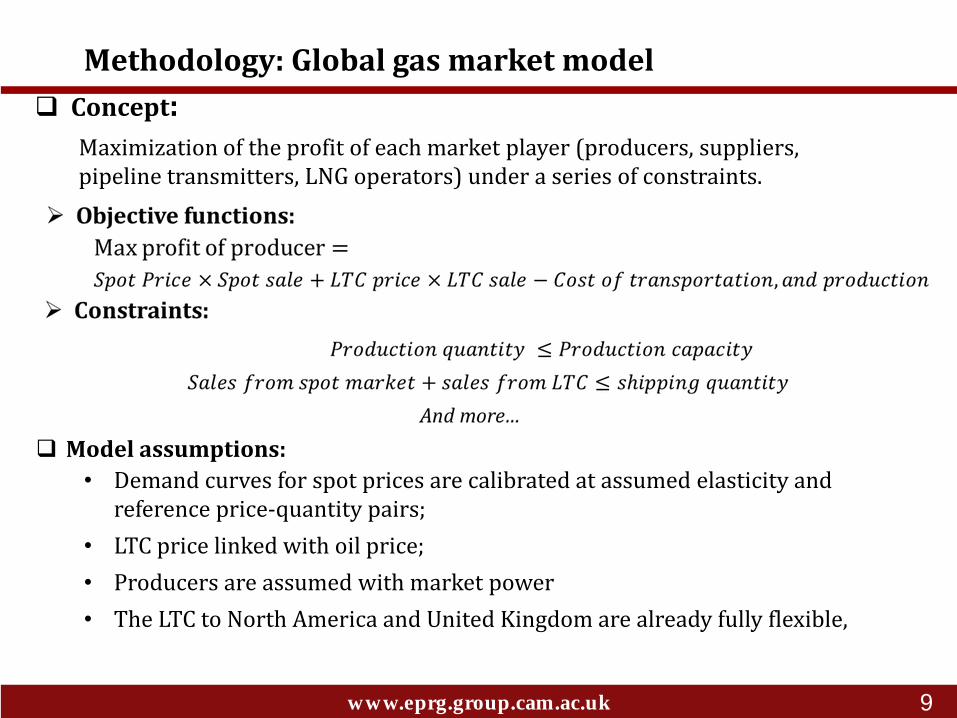
Maximization of the profit of each market player (producers, suppliers, pipeline transmitters, LNG operators) under a series of constraints.
Concept:
Methodology: Global gas market model
Model assumptions:
• Demand curves for spot prices are calibrated at assumed elasticity and reference price-quantity pairs;
• LTC price linked with oil price;
• Producers are assumed with market power
• The LTC to North America and United Kingdom are already fully flexible,
9
www.eprg.group.cam.ac.uk
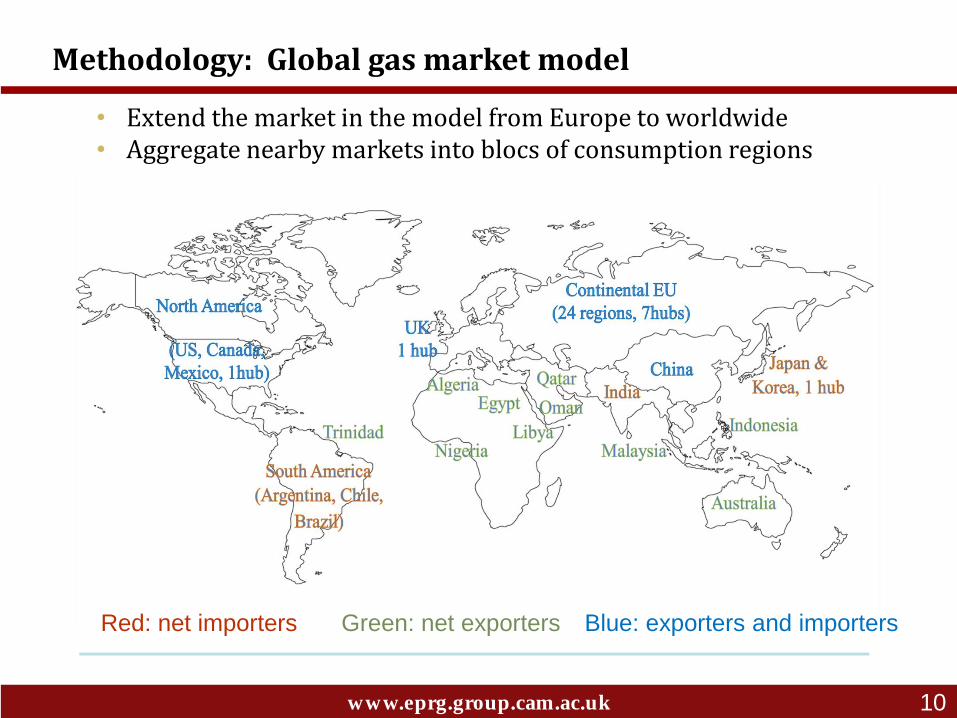
Methodology: Global gas market model
• Extend the market in the model from Europe to worldwide • Aggregate nearby markets into blocs of consumption regions
Red: net importers Green: net exporters Blue: exporters and importers
10
www.eprg.group.cam.ac.uk
…
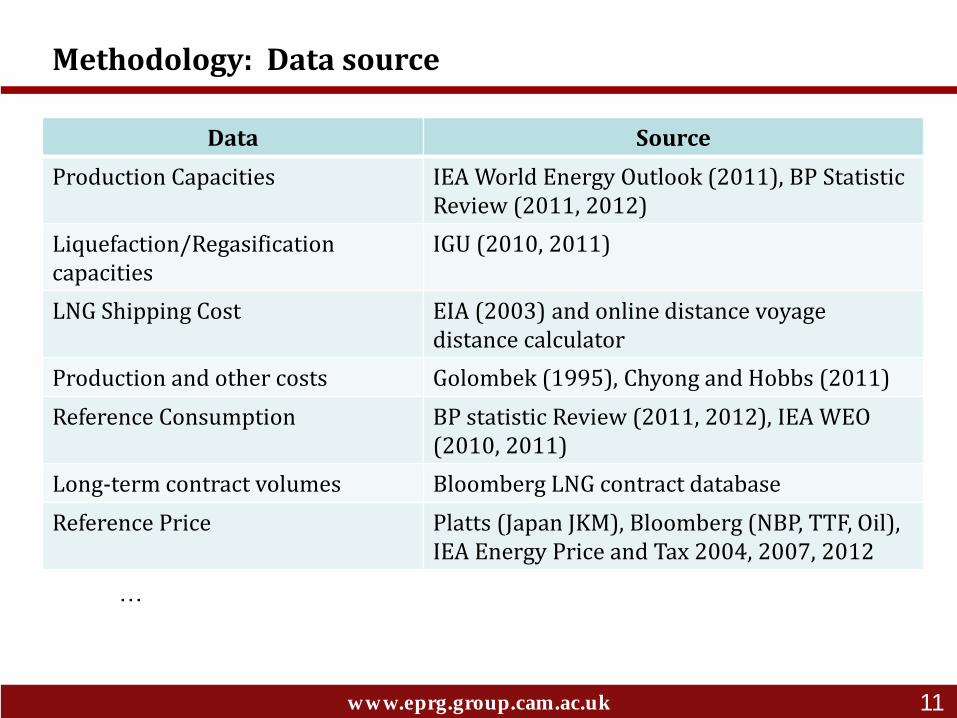
Data Source
Production Capacities IEA World Energy Outlook (2011), BP Statistic Review (2011, 2012)
Liquefaction/Regasification capacities
IGU (2010, 2011)
LNG Shipping Cost EIA (2003) and online distance voyage distance calculator
Production and other costs Golombek (1995), Chyong and Hobbs (2011)
Reference Consumption BP statistic Review (2011, 2012), IEA WEO (2010, 2011)
Long-term contract volumes Bloomberg LNG contract database
Reference Price Platts (Japan JKM), Bloomberg (NBP, TTF, Oil), IEA Energy Price and Tax 2004, 2007, 2012
Methodology: Data source
11
www.eprg.group.cam.ac.uk
Introduction: Gas market and long term contracts (LTC)
Research questions
Methodology: Value of LNG contracts flexibility
Gas market equilibrium model
Results: Impact of LTC flexibility on prices
Impact of LTC flexibility on producer profits and market efficiency.
Sensitivity analysis
Conclusion
Contents
12
www.eprg.group.cam.ac.uk
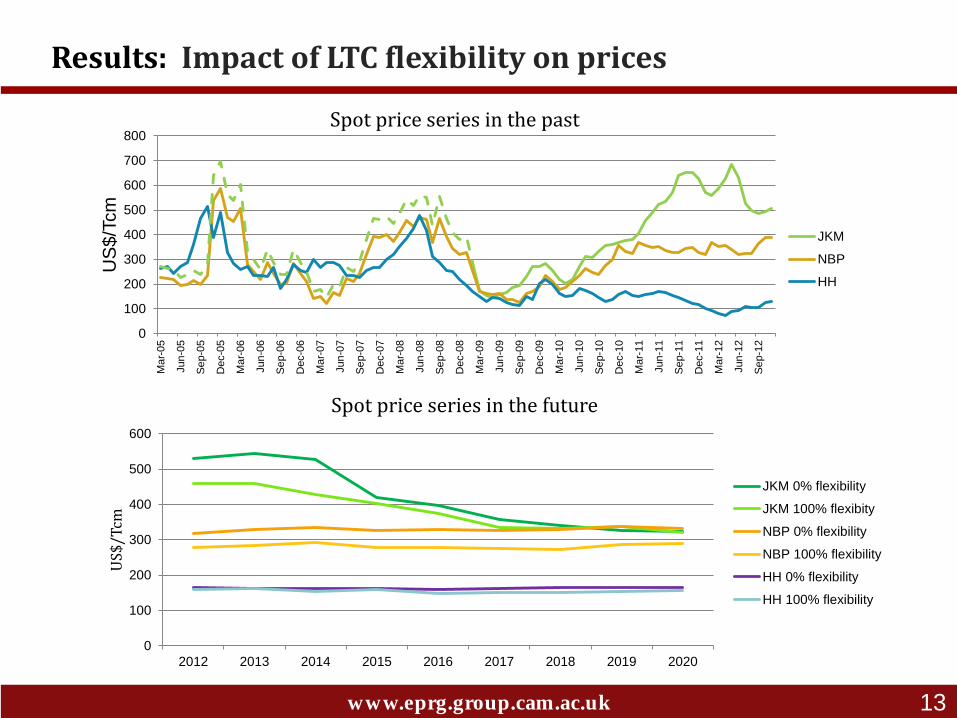
Results: Impact of LTC flexibility on prices
0
100
200
300
400
500
600
700
800
Ma
r-05
Jun
-05
Se
p-0
5
Dec-0
5
Ma
r-06
Jun
-06
Se
p-0
6
Dec-0
6
Ma
r-07
Jun
-07
Se
p-0
7
Dec-0
7
Ma
r-08
Jun
-08
Se
p-0
8
Dec-0
8
Ma
r-09
Jun
-09
Se
p-0
9
Dec-0
9
Ma
r-10
Jun
-10
Se
p-1
0
Dec-1
0
Ma
r-11
Jun
-11
Se
p-1
1
Dec-1
1
Ma
r-12
Jun
-12
Se
p-1
2
US
$/T
cm
JKM
NBP
HH
Spot price series in the past
Spot price series in the future
0
100
200
300
400
500
600
2012 2013 2014 2015 2016 2017 2018 2019 2020
US
$/T
cm
JKM 0% flexibility
JKM 100% flexibity
NBP 0% flexibility
NBP 100% flexibility
HH 0% flexibility
HH 100% flexibility
13
www.eprg.group.cam.ac.uk
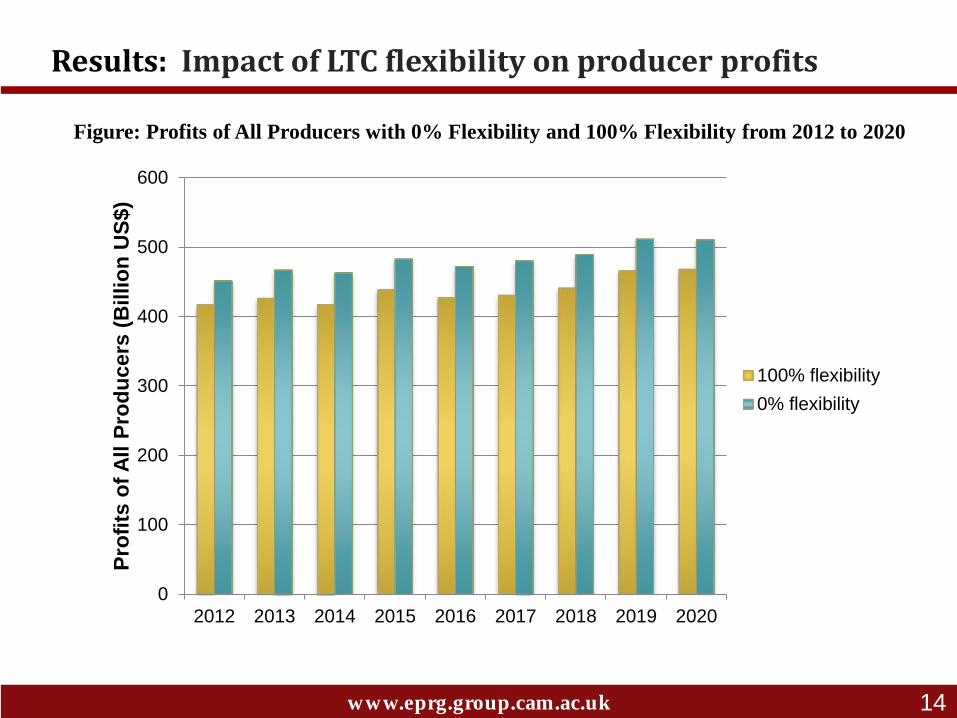
Figure: Profits of All Producers with 0% Flexibility and 100% Flexibility from 2012 to 2020
Results: Impact of LTC flexibility on producer profits
0
100
200
300
400
500
600
2012 2013 2014 2015 2016 2017 2018 2019 2020
Pro
fits
of
All P
rod
ucers
(B
illio
n U
S$)
100% flexibility
0% flexibility
14
www.eprg.group.cam.ac.uk
Country Average
Change
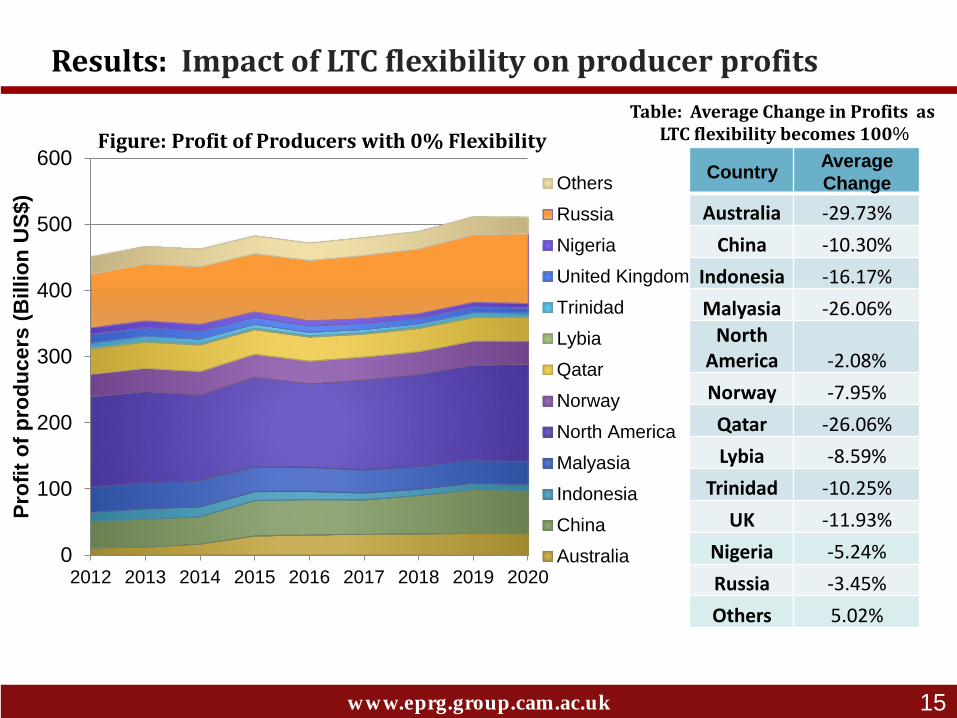
Australia -29.73%
China -10.30%
Indonesia -16.17%
Malyasia -26.06%
North America -2.08%
Norway -7.95%
Qatar -26.06%
Lybia -8.59%
Trinidad -10.25%
UK -11.93%
Nigeria -5.24%
Russia -3.45%
Others 5.02%
Figure: Profit of Producers with 0% Flexibility
Table: Average Change in Profits as LTC flexibility becomes 100%
Results: Impact of LTC flexibility on producer profits
0
100
200
300
400
500
600
2012 2013 2014 2015 2016 2017 2018 2019 2020
Pro
fit
of
pro
du
cers
(B
illio
n U
S$)
Others
Russia
Nigeria
United Kingdom
Trinidad
Lybia
Qatar
Norway
North America
Malyasia
Indonesia
China
Australia
15
www.eprg.group.cam.ac.uk
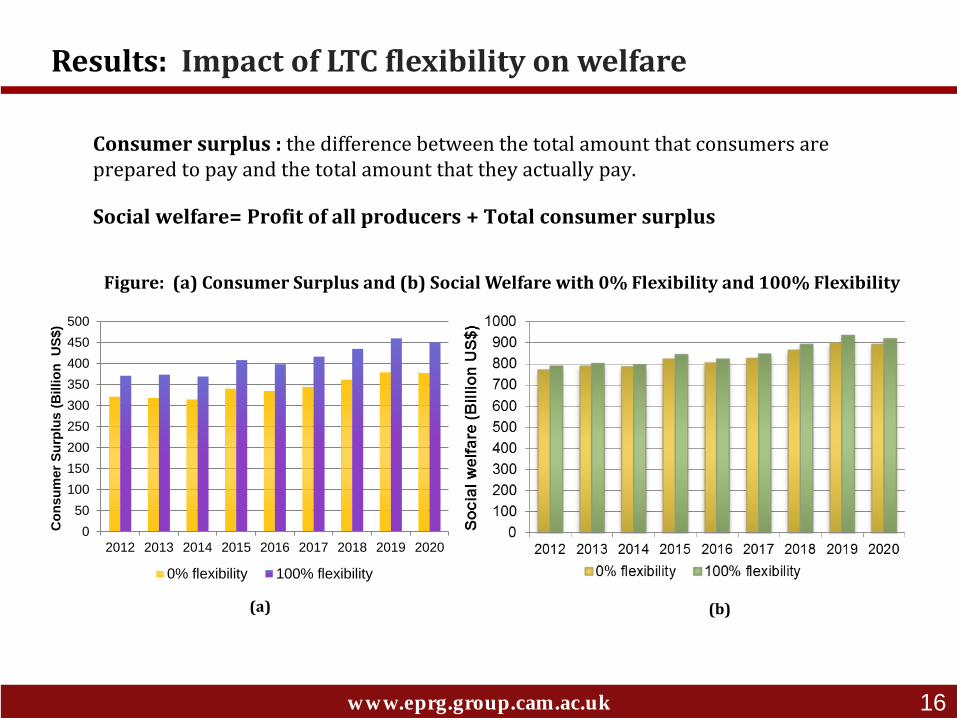
Consumer surplus : the difference between the total amount that consumers are prepared to pay and the total amount that they actually pay.
Figure: (a) Consumer Surplus and (b) Social Welfare with 0% Flexibility and 100% Flexibility
(a) (b)
Social welfare= Profit of all producers + Total consumer surplus
Results: Impact of LTC flexibility on welfare
16
0
50
100
150
200
250
300
350
400
450
500
2012 2013 2014 2015 2016 2017 2018 2019 2020
Co
nsu
mer
Su
rplu
s (
Billio
n U
S$)
0% flexibility 100% flexibility
www.eprg.group.cam.ac.uk
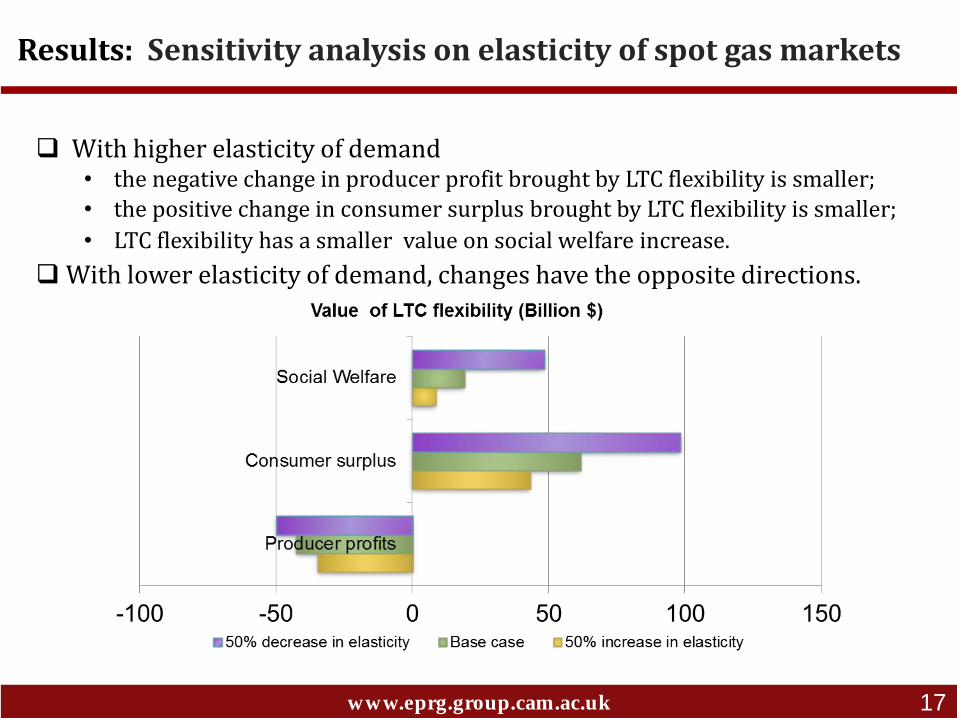
With higher elasticity of demand • the negative change in producer profit brought by LTC flexibility is smaller;
• the positive change in consumer surplus brought by LTC flexibility is smaller;
• LTC flexibility has a smaller value on social welfare increase.
With lower elasticity of demand, changes have the opposite directions.
Results: Sensitivity analysis on elasticity of spot gas markets
17
www.eprg.group.cam.ac.uk
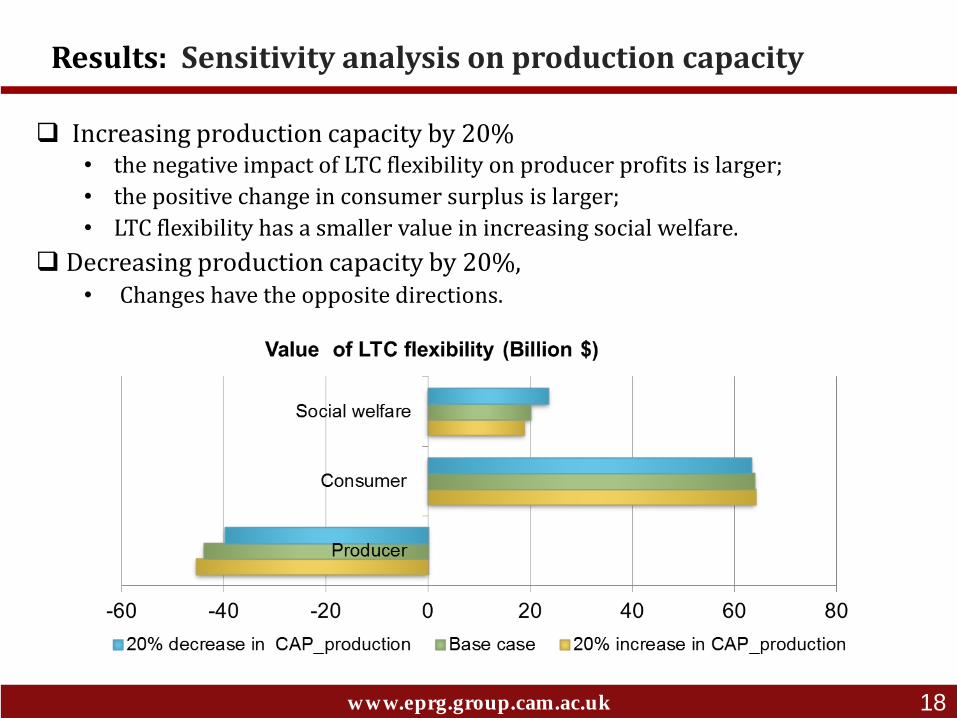
Increasing production capacity by 20% • the negative impact of LTC flexibility on producer profits is larger;
• the positive change in consumer surplus is larger;
• LTC flexibility has a smaller value in increasing social welfare.
Decreasing production capacity by 20%, • Changes have the opposite directions.
Results: Sensitivity analysis on production capacity
18
www.eprg.group.cam.ac.uk
With more flexible LNG contracts,
◦ will producers gain more profits? No
◦ will consumers surplus increase? Yes
◦ will the whole market efficiency increase? Yes
Open questions and future work:
◦ The liquefaction and regasification capacities are considered but not the LNG shipping capacities.
◦ More detailed modelling in the North America market.
Conclusion
19