the economics of malnourished children: a study of
TRANSCRIPT

It
THE ECONOMICS OF MALNOURISHED
CHILDREN: A STUDY OF
DISINVESTMENT IN HUMAN CAPITAL
by
Marcelo Selowsky and Lance Taylor
Discussion Paper No. 13, December 1971
Center for Economic Research
Department of Economics
University of Minnesota
Minneapolis, Minnesota 55455

THE ECONOMICS OF MALNOURISHED CHILDREN:
A STUDY OF DISINVESTMENT IN HUMAN CAPITAL*
by
Marcelo Selowsky and Lance Taylor
I. Introduction
Most Third World children suffer, many of them severely, from mal-
nutrition. 1 There are numerous sociocultural reasons for this, some of
them of recent origin (such as an increasing use of bottle feeding in un-
sanitary conditions) and some ancient (such as taboos against infants'
eating protein foods). Each specialist no doubt can elaborate at great
length on the importance and persistence of his preferred cause of infant
malnutrition; certainly economists have little enough to say about most
of them. As always, though, the costs and benefits are of some policy
import, and thus the economic theory underlying them. This leads to our
proposing here a somewhat modified version of the standard human capital
model, to spell out in formal terms some of the microeconomic implications
of infant deprivation. Naturally, the theory suggests ways to measure the
private and social benefit of alleviating the problem, and much of this
paper is devoted to making initial estimates of these benefits for lower
l,' class populations in Santiago, Chile. As the reader will see, we must
resort to statistical sleight of hand to apply the theory to inadequate
data, but we think that the results -- showing great benefits to amelioration
of infant malnutrition -- are of sufficient interest to justify our method-
ological transgressions. A semi-starved infant is not a pleasant sight,
and we hope that even a partial demonstration of the economic benefits from
doing something about his condition may help induce policy makers to suppress

their normal prudence in such matters, and act.
2. A Theoretical Model
After appropriate correction for region, race, sex, and class (all
of which we magisterially exile to ceteris paribus), the empirical literature
seems to show that adult earnings depend with some regularity on completed
schooling and "abil ity" as measured by something like an IQ test,:.o
(1) y = Y(S, A)
Both of these conditioning variables are the result of an accumulation
process. Schooling, for example, can be said to be accumulated as a simple
function of the time devoted to it,
(2a) dS/dt = S = s
with
(3)
where s is the fraction of an individual's time that he spends being
educated. Alternatively, a more abstract, quality-weighted education might
depend on the pupil's ability. We scarcely lose generality by assuming
that this type of schooling is accumulated according to the rule,
(2b) S = sq(A)
where q(A) presumably obeys the conditions dq/dA > 0, d2q/dA2 < 0 .
According to one school of psychological thought (Bloom [3J is a major
exponent), ability perhaps best interpreted as one's relative position
in the bell-shaped IQ distribution of his population cohort -- is also an
accumulated quantity, in the sense that a favorable environment can lead
- 2 -

"
to ability increases, and the reverse for a poor environment. Bloom pro
vides some empirical support for the simplest possible hypothesis about
the evolution of ability, that it is a "random walk" with ability incre
ments independent of ability levels and other historical influences:
A = h(s, n; many other current environmental factors)
where n stands for the amount of "nutrition" the individual receives. 3,4
We immediately drop the other environmental factors as being too complicated
for a simple model to deal with, but add the twist that the change in ability
depends explicitly on time,
(4) A = h(~(t)s, l3(t)n)
Bloom's empirical results strongly suggest that the ~ and 13 functions
have the shape shown in Figure 1, i.e. ability change is much more influenced
by the environment at an early age than a later one, with about half of the
postnatal change coming before age four· or five.
Besides "factor-reducing" technical progress, another important char
acteristic of a realistic ability change function is that it permits decum
ulation of ability, in the sense of reduction of a child's intelligence test
scores relative to his population cohort. In other words, malnutrition and
other environmental insults can cause "irreversible" ability loss, partic
ularly among young children. 5 This is shown in Figure 2, where low levels
of nutrition lead to drastic relative losses in ability, while levels not
so far above the "norm" n* cause essentially no marginal ability increases.
Early ability losses are essentially irreversible insofar as our hypothesis
about the declining impact with age of environmental variables on ability
is correct.
- 3 -

a(t) or l3(t)
('
"
.-------------
'-------~ ~ ______ _I1-------i1r-------1t-------+----5 10 15 20 Age
Figure 1 Impact of environmental variables on change in abiJity as a function of age.
Change in ability
Figure 2
I I
/ --Nutritional input n
Impact of nutrition on ability change.
- 4 -

! r
"
Most of the human capital literature assumes a constraint set like
(2) - (4), and in addition maintains the behavioral hypothesis that the
individual and his guardians jointly maximize his discounted lifetime earnings,
i.e. the functional
T
(Sa) J e-rt[(l-s) Y(S,A) - cnJdt o
In this formulation, r is the rate of discount in the perfect capital market
which the individual is assumed to face, (l-s)Y is the part of his potential
earnings not foregone via time spent in school (we assume his perceived direct
costs of schooling are negligible), c is the cost-per-unit of the nutrition
input, and T is the age at which the individual expects to die. Since
people also derive satisfaction from being schooled (particularly if their
"ability" as measured by their educators' tests is high), we also consider
the variant maximand,
(5b) T
J e-rt[U(S,A) + (1-s) Y(S,A) - cnJdt o
where o2U/~S ~A < O. That is, an increment in schooling reduces the mar-
ginal satisfaction resulting from an increment in ability. (Presumably the
opposite is true for income: o2Y/~A ElS > 0 .)
To describe in intuitive terms the solution to this problem, we observe
that at any age t , the return to the individual from having a small amount
of additional schooling is just
T
(6) Ps(t) = J e-r(T-t)[O-s)Ys + Us]dT t
i.e. the discounted marginal non-foregone income and satisfaction resulting
from additional education. (The subscripts on Y, U, and q indicate partial
differentiation.) Similarly, the individual will value a small increment in
- 5 -

ability according to the rule
PA (t) = f e-rCT-t)[O-s)YA + VA + PssqA ]dT
t
which takes into account the direct effect of more ability on income and
satisfaction, as well as the future value of its effect on the current
quality of the individual's education. Both PA and Ps will normally
decrease with time, as a shorter remaining lifetime reduces the expected
benefits from one's accumulated schooling and ability.
The marginal cost of obtaining more schooling at age t is just
Y(S(t), A(t)), i.e. the income the individual would have to forego while
being schooled. The benefits are the discounted income and satisfaction
which result from having more schooling, Psq(A), and more classroom-
created ability, PA a(t )hs . Therefore the individual will increase his
time devoted to schooling until
(Sa) s<l
If equality of benefits and costs of schooling is not attained with s<l
(which is likely in the early years of life), then this condition is modified
to
(Sb)
i.e. devoting more than a full working day to schooling would be desirable
for a child's future welfare, if only his time allowed. Moreover, since
a, P~ and Ps decline with age while Y increases, then6
Rule 1: The optimal time pattern of schooling will be an initial
Ehase of full time education, followed by continuing education at
a declining rate (normally) throughout one's lifetime.
- 6 -

Since the immediate cost of more nutrition is just c, then the rule
for deciding how much to spend on that input is
Rule 2: Nutrition input is increased until its marginal product
in creating long-term income and satisfaction through ability
increases just equals its cost.
This rule means that it may be perfectly "optimal" in economic terms
for parents to allow their children to become malnourished during infancy,
even though this can lead to ability los s which cannot be made !:!E later
because of the decreased impact on ability change of environmental factors
with increasing age. All that is required for this is a relatively high
value of c/PA S(t) , which can lead to an ability-reducing tangency with
the h-function, as shown in Figure 2. In terms of the model, this is less
likely to occur at any early age than a late one, since both PA and p
decline with time. Nonetheless, with high enough nutrition costs, rational
parents might still disinvest in their child's future by not feeding him
adequately, even in our make-believe world of perfect capital markets and
certainty about the deleterious effects of early deprivation.? We think
that this is an excellent argument for government intervention, even though
no apparent "distortion" exists.
Suppose that the government does intervene, with (quite possibly) costly
programs to avoid infant deprivation. If it counts the individual's benefits
as its own, then increasing the child's nutritional intake at age twill
bring a long run return of
(10 ) !3(t) h n lm IT
t
- 7 -

where 6n is the additional amount of nutritional input p~ovidpd by th0
government, 6A = \3h n 6n is the n~sultant ability incn.'Lls(', and 1'" ilnd
hn take values from the individual's optimizing program, without govern-
ment help. Naturally, given the time shapes of PA and \3,
Rule 3: Government help in the form of programs increasing
nutrition will be more productive for the individual the
earlier in life they are undertaken, under our assumptions
regarding the impact of nutrition on ability change.
The government help will naturally lead the individual to modify his
human capital accumulation program to some extent. In particular, he will
arrive at the age t* at which he would have ceased full-time schooling \vith
somewhat higher stocks of ability and schooling and (although this is a second
order effect) values of PA and Ps which will have changed slightly to
take into account his greater stocks. s The effects of these changes on the
amount of schooling he desires just after t* can be calculated by totally
differentiating (8a) and (9) and solving for ds, the change in the amount
of time the individual desires to devote to schooling. The analytical ex-
pression (dropping a and \3 for convenience) is
The term outside the brackets will be negative as long as the function h
shows decreasing returns. This means that
ds dS < 0
ds dA ambiguous
ds > 0 dPs
- 8 -
ds 0 > dPA

I'
The impact of the government's intervention will be in the direction
of reducing the individual's time allocated to schooling at age t* (and
effectively reducing the school-leaving age) through its effects on Sand
Ps • The effect of the positive change in ability is ambiguous: school
leaving age will tend to decrease because of the increased opportunity cost
of higher income from higher ability (this is also why ds/dS < 0), and tend
to increase because of the effect of increased ability on reducing satis
faction with the existing level of schooling (dPA has an ambiguous sign)
and on the marginal productivity of school time in creating quality-weighted
schooling (PSqA > 0) .
Rule 4: The effect of the government's increasing a child's
nutritional intake at an early age on the age at which he
ceases full-time schooling is ambiguous, due to the trade
off between foregone earnings and additional benefits from
additional schooling.
Since we implicitly assume that the government bears all direct schooling
cost, the effect of its nutrition programs on the length of the child's schooling
should obviously enter into its social benefit-cost calculus. The theory can
not tell us the magnitude and direction of this effect. We discuss it em
pirically in the following section. 9
3. Empirical Tests for Chile
Strictly speaking, the foregoing dynamic theory should be tested dynam
ically, with a carefully followed, statistically controlled group of mal
nourished children. Several of the longitudinal studies necessary for this
type of analysis are underway, but if we wish to make estimates now of the
- 9 -

\~
effects on adult earnings of improved infant nutrition we must specify a
more static model, and try to infer its parameters from a variety of
sources. This is the approach adopted here.
We begin our empirical specification by noting that the theory of
ability change in equation (4) implies an equation of the following form
for preschool ability Ao ,
(12) Ao = a1 + b1 (w/w) + c1x1
where (w/~) is an average over infancy of the child's weight w relative
to his "normal" weight-for-age w, and xl is a collection of "background"
variables such as parental schooling and ability, the family's socioeconomic
status, etc. The relative weight variable is an index of malnutrition, the
significance of which is discussed below.
Similarly, the idea that ability does change over time leads us to an
equation of the form
(13 )
for ability at some mature age, At • Besides depending on preschoQl ability
(Ao) , At also depends on accumulated schooling (S), and another package
of background variables (x2 ).
Besides the effect of schooling on increasing ability, there is also
the reverse possibility that more ability leads to more schooling. We saw
in equation (11) that it is by no means theoretically certain that this
effect exists, given the trade-off between foregone earnings and the increased
personal satisfaction from more schooling. Nonetheless, we can test for it
with an equation like
(14)
- 10 -

,-
This states that the amount of schooling an individual chooses depends on
his initial ability and background variables (which would be sufficient to
determine his choice if he were actually following a maximizing plan, as
supposed above).
Finally, we expect an equation of the form
(15)
to hold for the individual's postschool earnings. We describe our specific
functional form below.
Our strategy in estimating these relationships is to use a sample of
malnourished children (and well-nourished controls) to estimate (12), and
a sample of adult Chileans to estimate (15). We use other people's results
in conjunction with our own to "estimate" equations (13) and (14), bridging
infancy and adulthood.
We discuss the details of all this in what follows.
A. Effects of Early Malnutrition on Adult Intelligence
We begin by noting that in principle, equation (12) should be of distri
buted lag form, since a child's ability at age three or four will depend on his
history of malnutrition, and not on the average of his weight relative to the
norm over some period, but our data did not permit this kind of estimation.
Also, relative weight is not a completely satisfactory physical index of
malnutrition, but in our sample it gave ability predictions similar to those
from more scattered data on height and cranial circumference, the other com
monly used measures of child development. 10
To estimate equation (12) for a group of Chilean children, we used data
gathered, and very kindly provided us, by Doctors Kardonsky, Undurraga,
- 11 -

Alvarado, Seguir, and Manterola [9J. As we will see, statistical analysis
of this sample indicates not only that severely malnourished children have
lower measured IQ's than well-nourished controls (the usual finding) but
also that even within the handicapped group there is negative correlation
between malnutrition and IQ. This intragroup relationship is very im-
portant, because it gives evidence for the malnutrition-IQ relationship
independent of controls, whose selection is extremely difficult in this
type of study.
The thirty-three malnourished children came from a very low income
neighborhood in Santiago. They all experienced grade three protein-
calorie malnutrition in their first year of life, were then hospitalized,
and followed in a longitudinal study (with monthly weight measurement).
They received adequate nutrition and medical care after their initial
hospitalization. The distribution of their birth weight was normal, and
they were apparently free of birth abnormalities and disease other than
malnutrition.
Eleven "normal" children from the same neighborhood were selected as
controls. However, we were able to trace the exact weight history for only
seven of them. Between ages three and three and one-half all of these
children were given a Terman-Merril Intelligence Test. Data on the mothers'
IQ (Wechsler Test) and years of schooling are available for the normal
children but only for twenty-eight of the malnourished children. Four
sample groups can therefore be distinguished according to the availability
of data:
Group I
Group II
group of malnourished children
total sample (malnourished +
normal children)
- 12 -

Group III (n=28 )
Group IV (n=35 )
malnourished children with
family background data
total number of children with
family background data
Table 1 summarizes the means and standard deviations of the main
variables used. The control group appears to be normal according to weight
and IQ; however, mothers' IQ and schooling are almost the same for both
groups.
Table 2 shows the results of regressing the children's Terman-Merril
scores on different weight variables. These are aggregated over various
time periods, since multiple regressions with lagged quarterly weight
data gave unstable and insignificant coefficients. However, in most of
these regressions the coefficient corresponding to weight in the third
semester (half year) of life was stable and Significant, as shown in re
gressions 1 and 2 of Table 2. (The S1 are average weight relative to the
norm in the i-th semester.) When average relative weight for the first
eighteen (W1S ) or thirty (W30 ) months of life was used as the explanatory
variable, similar results were obtained. All coefficients were insensitive
to changes in the sample used.
The fact that the weight coefficients have magnitudes ranging between
0.50 and 0.65 means that a gain of ten percentage points in the corresponding
relative weight variable would generate an increase in IQ of five to 6.5
points. The stability of these coefficients across samples suggests that
this impact may be similar for all levels of relative weight loss, although
this should be investigated more thoroughly.
If heredity has a role in explaining children's IQ scores, mothers'
IQ could be used as a proxy for the ability endowment at birth. It also
- 13 -
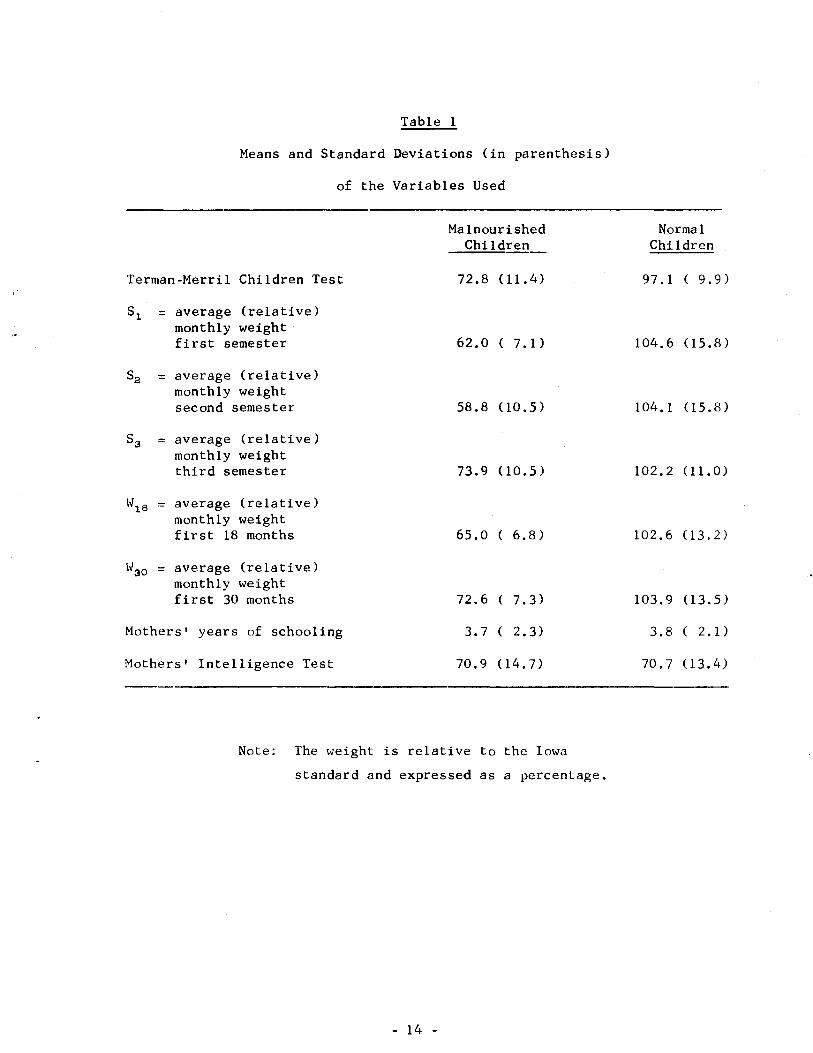
Table 1
Means and Standard Deviations (in parenthesis)
of the Variables Used
Terman-Merril Children Test
Sl = average (relative) monthly weight first semester
S2 = average (relative) monthly weight second semester
S3 = average (relative) monthly weight third semester
W18 = average (relative) monthly weight first 18 months
Wao = average (relative) monthly weight first 30 months
Mothers' years of schooling
Mothers' Intelligence Test
Malnourished Children
72.8 (1l.4)
62.0 ( 7.1)
58.8 00.5)
73.9 00.5)
65.0 ( 6.8)
72.6 7.3)
3.7 ( 2.3)
70.9 04.7>
Note: The weight is relative to the Iowa
standard and expressed as a percentage.
- 14 -
Normal Children
97.1 ( 9.9)
104. 6 (15. 8 )
104.1 (15.8)
102.2 (11.0)
102.6 03.2)
103.9 (13.5)
3.8 ( 2.1)
70.7 03.4)

Table 2
Dependent Variable - Terman-Merril Children's Test
Group I n-33 Group II n-40 Number Independent Halnourished
Regressions Variables Children Pool
1
2
4
5
-;
Intercept
51
52
S.
Intercept
53
Intercept
W16
Intercept
W30
Intercept
53
SI
Inlercept
W16
SI
lnt(,l'cl'pl
\~.?O
Sl
41. 32 ( 1. 99)
- 0.14 (-0.56)
0.05 ( 0.23)
0.51 2.45}
RZ = 0.25
33.36 ( 2.63)
0.53 ( 3.l4)
RZ =0.24
35.11 1. 91 }
0.58 2.06)
RZ = 0.12
25.35 1.34 }
0.65 2.53}
RZ =0.17
---.------_._--------.----
28.79 ( 2.75)
- 0.02 (-0.14)
0.14 ( 0.76)
0.51 2.37>
RZ = 0.48
25.13 2.76}
0.66 5.81)
RZ = 0.47
37.43 ( 4.78)
0.55 ( 5.19)
RZ = 0.41
26.13 2.61)
0.65 5.1S}
RZ = 0.41
Group III n=28 Malnourished
Children
43. 65 ( 1. 75)
Group IV n=35
Pool
28.92 ( 2.38)
- 0.14 (-0.5l) - 0.03 (-0.18)
0.06 0.23} 0.14 0.71}
0.46 1.65} 0.49 1.73)
R2 = 0.17
35.18 2.l8}
0.50 2.26}
RZ = 0.16
42.13
0.56
1. 92}
1.33}
32.98 ( 1.43)
0.54 ( 1. 69)
RZ = 0.10
9.33 0.45)
0.49 2.32)
0.46 1. 94)
R2 = 0.27
1.03 0.(3)
0.59 1. 83)
0.56 2.24)
RZ =O.22
RZ = 0.48
23.83 2.44)
0.67 5.50)
RZ = 0.47
36.53 4.47>
0.55 5.03)
RZ = 0.43
25.94 2.47>
0.65 4.90)
RZ = 0.42
~---------------------
-6.13 (-0.22)
0.64 2.14 )
0.56 2.27)
R2 0.25
Nolf': Figures in pElJ"l'nthl'5CS reprCSl!nt the t l"<ltio
- 15 -

could be used, together with mothers' years of schooling, as a proxy for
family environment affecting mental growth. However, we found these two
variables to be insignificant in the explanation of IQ. What did turn out
to be significant was a composite socioeconomic index (SI) provided to us
by Dr. Kardonsky and her collaborators from the Institute of Psychology,
University of Chile. 11 The index may be a better proxy for the long-run
overall environment than one of its components, family income.
Regressions (5) - (7) show that relative weight and the index explain
between 22% and 27% of the variance in children's IQ. Since the coefficient
of weight is not sensitive to the introduction of SI, we conclude that the
impact of nutrition on IQ is relatively independent of easily measured
socioeconomic factors.
B. Increments in Early IQ Versus Later IQ and Schooling
As mentioned above, to "estimate" equations (13) and (14) linking our
malnourished children and present day Chilean adults, we have to rely on
hypothetical bridges between these two groups. As a start toward building
these, we asked psychologists to provide us with an adult IQ test able to
measure "as closely as possible" the same kind of capabilities that the
Children's Terman-Merril Test was measuring at age three and one-half.
They decided that a particular subset of the Wechsler-Bellevue Test for
adults would be appropriate. 12
Groups of thirty-one employed construction workers and sixty unemployed
workers were given the Wechsler-Bellevue Test, on the premise that con
struction work and temporary unemployment might well be representative future
occupations for lower class Chilean children even those not severely
handicapped by infant malnutrition. 13 Table 3 summarizes the information
- 16 -

we obtained for the two groups. It can be seen that there are some dif
ferences between them; however, as far as we could tell members of both
groups grew up in similar environments. Parents' years of schooling are
almost the same for the two groups, as are rough indices of income of
their childhood families (age at which they began working, number of
siblings) .
The data summarized in Table 3 would permit us to estimate equations
(13) and (14) if we knew the covariances of the relevant variables with
some measure of the workers' childhood ability. Furthermore, we could use
the regression results to infer future intelligence levels of the malnourished
children, if we felt that the workers in some sense represent the probable
future of the children.
In an illustrative way, we will make this inference in the next section,
since we lack any other means of forecasting the children's future develop
ment. But to do so, we have to "estimate" (13) and (14) on the basis of
covariance information not contained in the workers' sample. Fortunately,
the problem of relating youthful and adult IQ scores has long concerned
psychologists, who have obtained fairly consistent results from a variety
of samples. (See again Bloom [3J.) An important example is the Berkeley
growth study, which analyzed intelligence test performance of sixty-one
children from high income homes from birth to eighteen years [lJ. For
these children, intelligence measured at age two had a correlation of 0.41
with intelligence measured at age seventeen. By age four, the correlation
with the measurement at age seventeen increased to 0.71, and by age eleven,
to 0.92.
In the spirit of sensitivity analysis, let us assume that the correlation
- 17 -

Table 3
Means and Standard Deviations (in parentheses) of Workers' Data
Construction Unemployed Workers (n=31 ) Workers (n=60)
1. (1) Age 31.9 ( 2.6) 28.2 5.4)
(2 ) Years of schooling 4.6 ( 2.4) 5.2 ( 1. 0)
(3) Mothers' years of schooling 2.8 ( 2.6) 3.0 2.2)
(4 ) Fathers' years of schooling (n=20) 3.7 (n=40) 3.8
(5 ) Number of siblings 5.4 5.1
(6) Fraction of those who spend their childhood in the rural sector .52 .57
(7) Age they began earning any income 13.7 ( 2.7) 13.6 ( 2.4)
(8 ) Months of unemployment between jobs 1.1 ( 1.0) 2.3 ( 2.1)
(9 ) Monthly earnings last job (Chi lean Escudos of 1970 ) 1320 ( 440) 819 ( 378)
(10) Standardized IQ test 87.3 (14.9) 77 .6 (17.8)
- 18 -

between the workers' adult and juvenile IQ (at about age four) was either
0.75 (close to Bayley's estimate) or 0.5. We also assume that the youth-
ful distribution had the same mean and variance as the adult distribution.
For schooling, we note that the simple correlation rS,Ao between years
completed and early ability will be given by
rs A = Q s A r A AO + other terms • 0 f-i. t t'
where Q is the standardized regression coefficient of schooling on f-iS. A t
adult IQ. In the univariate case, I3s.At
will just equal r S • At so
we can approximate r S• Ao by the product (r S • At ) (rAt • Ao ) Together
with the means, variances and covariances of schooling and IQ in the
workers' sample, this gives us enough information to "estimate" (13) and
(14). The results appear in Table 4. Although it is impossible to attach
statistical significance to the regression coefficients, they do indicate
that a ten-point increase in the workers' early IQ might have led to
later-life IQ increments ranging between five and seven points and schooling
increments of a month or two.
These figures, of course, refer to the hypothetical childhoods of the
workers. But we are going to use them to infer something about the hypo-
thetical adult earning potential of the malnourished children, had they
not been so malnourished. Before conjuring this next castle into the air,
it is perhaps worthwhile to note what Chilean psychologists thought about
the future development of the thirty-three malnourished children. Ac-
cording to them, the absolute level of retardation of many of the children
requires only one remedy -- special schooling. In ordinary schools, their
condition would only deteriorate further. Hence raising the mean IQ of
- 19 -

Dependent Variable
s
= 0.50
s
r At' A 0 = 0.75
rAt,AO = 0.50
Table 4
Regressions for Adult Ability and Schooling of the
Ninety-one Chilean Workers (t-ratios in parentheses)
Coefficient w.r.t. Schooling (S) Early Ability (Ao) Intercept
0.6256 (0.94) 0.7419 00.45) 17.823 0.5660
0.0196 ( 1.78) 3.434 0.0126
1.0632 0.23) 0.4915 ( 5.34) 35.969 0.26T
0.0080 ( 0.73) 4.372 0.0056
Total Effects of a Ten-point Increase of Ao on
S At
0.196 7.54
0.080 5.00
- 20 -

the group from around seventy to over eighty (the mean IQ of the workers)
would enable the more severely handicapped children to acquire some schooling
and enter the labor force, even if half their incremental IQ was lost by
adulthood (as the more pessimistic hypothesis above would indicate). This
is a benefit we do not consider in the following analysis of the effects
of IQ on earnings.
C. Determinants of Earnings in the Sample of Workers
Recall from Footnote 2 that most empirical results (for the United States
at least) show that schooling (S) is more important than ability (At)
in determining earnings (Y) in a relationship like (15) -- in the sense
of adding to R2 or even in size of standardized coefficients. Moreover,
in studies of Chile where ability was not used as an explanatory variable,
additional schooling has been shown to raise earnings substantially [14J.
In light of this evidence, it is surprising that Table 3 shows that
the construction workers had both higher earnings and a higher mean IQ than
the unemployed workers, without much difference in schooling. One is
tempted to attribute the earnings difference to IQ. 14 To check out this
possibility, we ran several regressions (in logarithmic form) on the two
samples, pooled and separated. Table 5 gives the most interesting results.
As can be seen, the estimated elasticities of earnings with respect
to age and IQ are significant and stable, and the values of 2 R are
respectable for this kind of study. The results suggest that a ten per
cent change in IQ, as measured by our test, is associated with a six or
seven percent increase in earnings. Parents' and workers' years of
schooling were not significant in these regressions; this may be ex
plained by both the low level and low variance in the workers' schooling
variable. 1S
- 21 -

Regression Number
1
2
3
Table 5
Regressions from Workers' Data
Dependent Variable = Log Earnings
Independent Construction Unemployed Variable
Intercept
Log Age
Intercept
Log IQ
Intercept
Log Age
Log IQ
Workers Workers
4.12 (4.82) 3.08 (3.55)
0.87 (3.52) 1.06 (4.06)
R2 = 0.30 R2 = 0.22
3.23 (2.28 ) 2.82 (2.78)
0.87 (2.75) 0.87 (3.74)
R2 = 0.21 R2 = 0.19
1.68 0.25 ) 1.36 0.26)
0.74 (3.08 ) 0.79 (2.92)
0.65 (2.26) 0.60 (2.52)
R2 = 0.41 R <3 = 0.30
Note: Figures in parentheses show the
t ratio of the coefficient.
- 22 -
Pool
2.65 (3.86 )
1. 23 (6.03)
R2 = 0.29
1.92 (2.16)
1.11 (5.49)
R2 = 0.25
0.34 (0.38 )
0.92 (4.48)
0.76 (3.83 )
2 R = 0.39
4. Benefits of Improving Infant Nutrition in Chile
The next task is to integrate the empirical results to say something
about the effects of early malnutrition on future earnings. In principle,
improving early nutrition can increase adult earnings in several ways. To
trace these we begin by noting that Equation (12) suggests that improved
nutrition increases early ability,
dAo = (aAo/i}n)dn
which has impacts both on schooling (Equation (14»,
and directly and indirectly on later ability (Equation (13»,
Hence the total effect of early nutrition on earnings is given by
dY = {~Y r~At + ~At oS J + oY dS 1 oAo dn ~At ~Ao S aAa oS OA1 i;\n
using (15). In our data, all these effects except the nutrition-early
ability-adult ability-earnings linkage were small, so we ignore them. In
other studies, however, they could prove to be important.
To evaluate this ability-mediated linkage, we begin by recalling that
the mean IQ of the malnourished children would probably deteriorate without
special schooling (which they are not likely to receive). Hence, we are
being conservative in taking their current mean IQ as a base figure, and
analyzing "what would have happened" if they had received adequate nourish-
ment. The regression results of Table 2 indicate that if their initial
weight deficit of 25 to 35 percent had not occurred, their early IQ would
have been higher by about 0.6 times the deficit, with a mean somewhere
- 23 -

between 90 and 95 instead of 72.8. Notice that this figure is still lower
than the mean of 97.1 of the control children.
However, the results of the hypothetical regressions of Table 4 indicate
that this higher IQ level could not be expected to perSist, schooling and
other environmental factors being similar to those which affected the
construction workers. To account for this, we have assumed that the adult
IQ of the children would not have been somewhat over 90, but instead the
mean value for the employed construction workers, 87.3.
Figure 3 shows the annual earnings profile of individuals with IQs
equal to 72 and 87 evaluated with the three earnings equations of Table 5,
where E1 , E2 and Ea are the earnings equations of the construction
workers, unemployed workers and the pool of them, respectively. They in-
elude employer's contribution to the social security system, part of the
marginal productivity of labor, which amounts to 30% of the net wage. If
the children were to enter the labor force at age fifteen and the relevant
discount rate is 10%, the present value of gains in gross earnings at age
two would be 16, 17
Earnings Chilean Escudos United States Eguation of 1970 Dollars
El 6080 405
E2 3842 256
E3 5396 360
If we think that these gains in earnings could be generated by a supple-
mentary nutrition program during the first two years of life, the above figures
would be estimates of the program's shadow price. Even highly discounted, the
gains are about one-half of a worker's income (compare Table 3). Moreover,
- 24 -

Figure 3 Age-earnings Profiles as a Function of lQ
Annual gross E1 (lQ=87) earni.ngs [<> 1970
2300
2000
17000
14000
/'
110tlll./ ./
/'
/ /' ...
./ " ./
'" /' ./ ...
/'
soon
------_ .. _------------- ----15 20 25 30
- 25 -
35 40
E1 UQ= 72)
'" E3 UQ=87) /
/' E3 UQ=72)
Ea UQ=87)

if 25,000 children are malnourished each year in Chile (a not improbable
figure) and each one were to gain 4000 Escudos in discounted earnings,
the total yearly return would be 100 million Escudos. If this stream of
benefits is treated as an annuity, its present value is one billion Escudos,
or more than one percent of GDP. Even if our estimates are off by a factor
of two or more, this is a very large absolute return to a single program.
5. Additional Benefits and an Estimate of Costs
We note that we are underestimating benefits of alleviating infant
malnutrition because
(i) We omit the increase of schooling which would result from higher
initial ability, and the effect of schooling on earnings. These effects
were not important in our particular sample of construction workers, but
other evidence indicates that they would be elsewhere.
(ii) There is evidence indicating that infectious disease is less severe
and less frequent in well nourished individuals [12J. Malnutrition both
adversely affects the defense mechanisms of the individual (leading to
higher incidence of disease) and favors secondary infections (lengthening
the convalescence period). To the extent that medical resources are used
to combat disease induced by malnutrition, savings in these resources should
be attributed to nutrition programs. ~ fortiori, the same is true with
respect to resources lost through premature death.
(iii) Since programs to aid the malnourished, particularly infants,
involve an equalization of the income distribution as well as productivity
increases, there is implicit an equity improvement which we do not consider
here. Depending on one's tolerance for extreme poverty, this benefit may
- 26 -

be substantial.
On the cost side, we note that in calculations reported elsewhere [ISJ,
we found that giving enough milk to an infant during his first two years
to avoid severe malnutrition would yield a rate of return of twenty percent
or more, just counting the benefits calculated above. Direct milk costs
are not all that one must expend in a nutrition program <although we did
probably overestimate their amount) but they are a major component. And
twenty percent is a handsome rate of return for a program whose first benefits
are perceived 15 years after the initial investment.
6. Final Comments
If infant nutrition has an effect on the individual's future economic
productivity, it represents one of the ways in which human capital formation
affects the income distribution at least within limits imposed by race,
class and other strictures. However, infant nutrition has characteristics
which sharply differentiate it from other types of investment in human
capital, i.e. formal schooling, on the job training, etc.
First, infant malnutrition can hardly be compensated by later invest
ment in human capital. On the job training is a much better substitute
for a deficit in years of schooling than a deficit in preschool IQ.
Second, investments in human capital made later in life can, as a
policy matter, be encouraged by improvements in capital markets (e.g. loans
for high school or college education). This is not true for earlier invest
ments in human capital, which are mainly determined by the family's income
level. The most practical remedy for infant malnutrition is a redistribution
- 27 -

of income toward the infant and his family; the cost nf not undertaking
this redistribution now is massive disinvestment in early human capital
formation, and perhaps greatly increased distributional problems with a
low income, low productivity segment of the population in the future.
- 28 -

*
FOOTNOTES
This is a report on an investigation begun while the authors were respec-tively with the Institute of Economics, Catholic University of Chile, and a joint research project of the Center for International Studies, MIT and the Chilean National Planning Office (ODEPLAN). Financial support in Chile was in part provided by the Ford Foundation. Work was continued at the Development Research Group, Harvard University (with support from A.I.D. Contract No. CSD 1543 and National Science Foundation Contract No. GS-l914), and at the University of Minnesota (with support from an A.I.D. Grant to the University of Minnesota Economic Development Center). We are indebted to Sam Bowles, John Hause and Mrs. Vera Kardonsky for valuable comments, and to Dr. Oscar Undurraga and Mrs. Kardonsky for letting us use the data from their study [9J.
IOn the impacts of the so-called world food problem on the nutritional status of developing countries, see Frisch [4J and [5J, and the President's Science Advisory Committee [llJ. Many developing countries on the average have lower per capita consumption of animal protein than the usual norms. Poor people in developing countries often have protein intake far below adequate levels, at least according to existing case studies summarized by Woodruff [18J. Since adequate protein (along with vitamin A and, of course, caloric energy) appears to be necessary for full development of infants, these global findings in general substantiate our hypothesis that a large share of the world's young children are malnourished.
2The relative importance of these two factors varies greatly even in different studies in the United States, and almost nothing is known of their differential impact on earnings in developing countries. (Absolutely nothing is known of the impact of psychological characteristics such as initiative, temperament, etc. on earnings, and yet these may be very important explanatory variables which also are strongly affected by early malnourishment.) For the record, we note the United States-based empirical studies usually show schooling to be a more important determinant of earnings than ability. This is less apparent for groups at the extreme low end of the earnings spectrum [6J and the high end of the education spectrum [7J. In our results for Chile, ability is much more important than a modicum to schooling in explaining earnings of construction workers. See Section 3.
3"Nutrition" is, of course, a vector-valued quantity. Nutritionists point variously to protein, calories, and vitamin A as important limitational factors in the diets of Third World children. We ignore this, as we soon are to ignore the other environmental deprivations which assail children along with lack of food. As pointed out repeatedly in [13J, all these things are "synergistic" (which an economist would translate as complementary) in leading to ability loss. All this is lumped into our variable n. Keep in mind that it really is a rather long vector.
- 29 -

4Nutrition also directly influences current schooling performance of children and earnings of adults. To keep to our main interest -- the impact of early nutritional improvements on later accumulation of ability and schooling -- we leave these possibly very important effects out of the model.
5There is a huge literature on this hypothesis, and some feel that it is yet to be established, particularly as regards irreversibility. A good survey of the evidence is contained in the proceedings of an MIT 1967 conference [13J, and the reader can draw his own conclusions about the acceptability of our "reasonable ll hypothesis from there.
60f course, Ben-Porath already derived this rule in [2J, for a model with only one kind of accumulated human capital.
7 Lest the reader think we exaggerate in stressing that food costs to the
8
family are an important determinant of how well children in developing countries are fed, we cite -- almost at random -- a study made in a lower class district of Cali, Colombia [IOJ. Median per capita income per month of the people studied was 124 pesos, or about seven United States dollars. To feed a five-year old Cali child an adequate diet according to FAO standard~ (including animal protein) would cost the same 124 pesos per month. Since rent, clothing, fuel, etc. are also costly, it is clear enough that deciding whether or not to provide adequate food for an infant (who is, by the way, less able to protest inadequate feeding than older family members) would be a serious economic decision in a family at this level of income. And Cali is a relatively prosperous city within Colombia; Colombia, a relatively prosperous country.
The changes in the shadow prices PA and Ps are not likely to be empirically significant, at least judging from numerical solutions to similar models [16J. Analytically, it is extremely difficult to say anything about their magnitudes, although Ps should fall and PA may rise or fall depending on the relative importance of a change in ability in adding to earnings and reducing utility for a given increment of schooling.
9In fact, American evidence shows that the impact of higher ability on schooling is positive (see Hause [7J for discussion of these findings). As (11) shows, this would not be consistent with traditional human capital models, which have the individual maximizing only discounted income, as in (Sa). The satisfaction-from-schooling and quality-corrected schooling additions modify the theory to save the phenomenon. At our present level of phenomenological groping, this is a perfectly reasonable intervention.
10 . The use of we1ght-for-age w as a normalizing factor in (12) corresponds to usual diagnostic practice, i.~. a child malnourished in the third (worst) degree reaches sixty percent or less of normal weight. tie used the "Iowa"
- 30 -

weight norms [8J which describe well the development of well nourished Chilean children, but the significance of our regression results would not be altered by use of other norms.
lIThe index is a weighted average of indices of the following ten characteristics of the children's homes: type of housing, toilet facilities, bathing facilities, cooking facilities, location of cooking facilities, ownership or rental arrangement of the house, elimination facilities, water source, lighting system, per capita income. For more details on the construction of Sl, see Selowsky [15J.
l2The subtests used were general comprehension, similarities, picture completion, picture arrangement, object assembly and block design.
l3We wish to thank Mrs. Marilu Figueroa and Mrs. M. Eugenia Pulido for their assistance in obtaining and processing the sample data.
l4The construction workers had higher scores on all subtests of the WechslerBellevue, not just the aggregate 1Q measure. We also used subtest scores as explanatory variables in the regression equations of Table 5, with similar results. See [15J.
l5We note in passing that someone in the United States with about five years
16
of schooling (the mean for the workers) is considered a functional illiterate. Perhaps this judgment would be unduly harsh for Chile, but there is still reason to expect that at very low levels of formal schooling, "native intelligence" (in the sense of, for example, being able to learn to read fairly well on one1s own) might be a more important determinant of earnings than in highly educated rich countries.
We have used an exchange rate of E015 per dollar for 1970. See Taylor and Bacha [17J.
17By not adjusting the earnings profiles by the differential probability of being unemployed through time we are understating the benefits of a higher 1Q.
- 31 -

REFERENCES
[1] Bayley, N., "Consistency and Variability in the Growth of Intelligence from Birth tf) Eighteen Years," Journal of Genetic Psychology, 1949, 45, pp. 165-96.
[2J Ben-Porath, Y., "The Production of Human Capital and the Life-Cycle of Earnings," Journal of Political Economy, August, 1967,75, pp. 352-65.
[3J Bloom, B., Stability and Change in Human Characteristics, New York, John Wiley and Sons, Inc., 1964.
[4J Frisch, R., "World Food Supplies" in World, War and Hunger, Hearings before the Co~mittee on Agriculture, House of Representatives, Serial W, Part I, Washington, 1966, pp. 41-51.
[5J Frisch, R., "First Things Last -- Food Supplies and Population Growth," Harvard Center for Population Studies, Mimeo, 1966.
[6J Hansen, W. 1., B. Weisbrod and W. J. Scanlon, "Schooling and Earnings of Low Achievers," American Economic Review, June, 1970, 60, pp. 409-18.
[7J Hause, J., "The Earnings Profile, Ability, and Schooling -- A Study of the Gains from Brains and Training," University of Minnesota, Mimeo, 1971.
[8 J Jackson, R., and H. Kelly, "Growth Charts for Use in Pediatric Practice," Journal of Pediatrics, pp. 27-215, 1945.
[9J Kardonsky, V., O. Undurraga, T. Sequir, L. Alvarado and A. Manterola, "Efecto de la Desnutricion en el Desarrolo Intelectual Global," Dpto PSicologia U. de Chile, Unidad de Nutricion Hospital Roberto del Rio, Mimeo, Santiago, 1970.
[lOJ McKay, H. E., A. C. McKay, and L. Sinisterra, "Interaction of Environmental Factors Influencing the Relationship Between Mental Test Performance and Nutritional Status," Council for Intersocietal Studies, Northwestern University, Mimeo, 1969.
[11 J President I s Science Advisory Committee, "The War ld Food Problem," Report of the Panel on the World Food Supply, Vol. I, II, III, The White House, 1967.
[12J Scrimshaw, N., "Nutrition and Infection" in Brock, J., Recent Advances in Human Nutrition, London, 1961.
[13J and J. Gordon (eds.), Malnutrition, Learning and Behavior, Proceedings of an International Conference cosponsored by the Nutrition Foundation and Massachusetts Institute of Technology, March 1967, Cambridge, MIT Press, 1968.
- 32 -

[14J
[15 J
[16 J
Selowsky, M., "Education and Economic Growth: Comparisons," unpublished Ph. D. dissertation, Chicago, 1967.
_______ , "An Attempt to Estimate Rates of in Infant Nutrition Programs," paper presented Conference on Nutrition, National Development, Massachusetts Institute of Technology, 1971.
Some International University of
Return to Investment to the International and Planning,
Taylor, Growth: Harvard
L., "Calculation of Shadow Prices from Models of Optimal The Case of Chile," Economic Development Report No. 193,
University, 1971.
[17J and E. Bacha, "Growth and Trade Distortions in Chile, and Their Implications in Calculating the Shadow Price of Foreign Exchange," Economic Development Report No. 184, Harvard University, 1971.
[18J Woodruff, C. W., "An Analysis of the I.C.N.N.D. Data on Physical Growth of the Pre-school Child" in Preschool Malnutrition, National Academy of Sciences-National Research Council, Washingtcn, D. C., 1966.
- 33 -