the economics of uranium supply and demand · the economics of uranium supply and demand ... on...
TRANSCRIPT
Nuclear fuel cycle
The economics of uranium supplyand demandby Ph. Darmayan*
The uranium market is still a young one whose "laws"have yet to become entirely clear. This tends to disorientobservers and decision-makers who are anxious topredict its development. It has a number of characteristicswhich are sharply differentiated from those of otherminerals, including other energy commodities.
First, the applications of uranium are very restricted,being limited for all practical purposes to militarytechnology and to civil nuclear power. Between 1942and 1974, the world's military requirements accountedfor over 200 000 tonnes of uranium, or nearly 50% ofcumulative world output during that period. Suchrequirements no longer play a major role, and theproduction of electricity is now for all practical purposesthe sole determinant of the economics of the uraniummarket. Only a very few other metals have such limitedapplications they include barium (used almost entirelyas baryta in the drilling of oil wells), gallium (in themanufacture of diodes and superconductors), andtitanium (in aircraft).
The second characteristic to be noted is that there areno direct substitutes for uranium. For a completednuclear power plant uranium cannot be replaced by anyother fuel. This near impossibility of substitution -other than by slow and expensive modifications to thepower generation system — could well be unique for ametal. Even barium, gallium, and titanium can be
* Mr Darmayan is an economist with Uranium Pechiney UgineKuhlmann, and is convener of a Uranium Institute working partyon supply and demand economics He gratefully acknowledgesthe help of his Institute colleagues in the preparation of this article.
replaced by other metals if their price becomes excessive.Most titanium parts, for example, can be manufacturedif necessary from aluminium or special steels.
Thirdly, uranium also has unusual economiccharacteristics when compared to other energy-producingraw materials. Processing of the mineral accounts for avery large proportion - around 88% - of the cost of thefinal fuel assemblies put into nuclear reactors, comparedwith 42% and 33% respectively for coal- and oil-burningpower plants. But the absolute levels of nuclear fuelcosts are low which, despite high front-end costs (mainlyfor the enrichment plant and the costs of the powerstation itself), makes for predictability in the overalleconomics of an electricity generating station. Onepractical effect of these low fuel costs is that the uraniumneeded to supply a station during its operating life ofup to 30 years can be considered as committed, almostindependently of changes in the cost of natural uranium.
Fourthly, in terms of transportation and storage costsuranium has advantages over all other energy sources,including in particular oil and coal (see Table 1). This easeof storage, coupled with the need felt by operators ofnuclear stations for long-term security of fuel supply,explains the large size of the currently existing stockpilesowned by the world's utilities (93 000 tonnes of U at theend of 1979).
Finally, the nuclear industry is one with unusuallylong lead-times. For both uranium miners and electricalutilities, it can take ten or more years between a decisionto proceed with a project, and the point where a newmine or nuclear generating plant is brought into operation.
Table 1. Annual fuel requirements of a 1000 MWe power plant [1]
Fuel quantity
Fuel storage
Fuel cost(French Francs, approx.)
Transport
Coal-burning
2.2 X 10⁶
tonnes coal-equiv
40ha(400 X 100m)
450 million
22 bulk carriersof 100 000dwt — oneevery 16 days
Oil-burning
1 5X 10s
tonnes oil-equiv.
25ha(50 tanks at 30 000m3)
600 million
1500 barges of1000 tonnes -four every day
PWR nuclear
150 tonnesnatural uranium
<50m2
(66 containers of3 tonnes)
60 million
2 railwagonsor seven roadvehicles
IAEA BULLETIN, VOL. 23, No.2
Nuclear fuel cycle
Table 2. Forecasts of installed electrical capacity (GWe) for WOCA [2]
DOE(low)
1980
NAC
1980
UraniumInst.(low)
1980
NUKEM DOE Uranium INFCE(high) Inst (high) (low)
1980 1980 1980 1979
NUEXCO
1980
NAC INFCEutility (high)based1980 1979
1985
1990
1995
209
292
388
208
306
395
227
335
356
227
345
—
242
360
493
227
350
494
245
373
550
264
328
—
264
375
—
274
462
770
Because of such long lead-times the upper limit forinstalled nuclear capacity, as well as enrichment plantcapacity, is, for all practical purposes, already decideduntil the late 1980s. And, for a very similar reason,the maximum levels of uranium production capacitywhich will be available by then are also known with a highdegree of certainty.
For all these reasons, the uranium market is stronglydependent on forecasts of nuclear electricity production,and on the market outlook for the main componentsof the nuclear fuel cycle, particularly enrichment.These linkages do not, however, entirely shield the uraniummarket from having to face uncertainties concerning thesupply and demand balance in the 1980s and beyond.The substantial reductions in power plant programmessince 1976, over-capacity in the enrichment market, andlengthening delays in bringing new nuclear facilities intooperation, plus the flexibility conferred by the ease ofuranium storage, all warrant careful and continuinganalysis of the uranium supply and demand equation.
The Uranium Institute, which was set up in 1975, isan international industrial association whose membershipincludes representatives of both uranium producers andelectrical utilities. Over 50 major organizations from14 countries take part in its work. One of the Institute'smost important aims is to make use of the expertiseavailable within its membership to contribute to a betterunderstanding of the economics of the uranium market.This task has been approached mainly through the workof a Supply and Demand Committee, which has been inexistence since 1978. Its task is to analyse the uraniumsupply and demand outlook, and to publish reportselucidating the factors governing the market. In addition,each year, in September, the Uranium Institute organizesa symposium where the economics of the uraniummarket are considered in detail by numerous organizations-producers, consumers, consultants, and governmentagencies.
The Institute's Supply and Demand Committee iscurrently updating its forecasts, and later this year willissue a further report. Meanwhile it is possible to foreseethe likely trends with a fair degree of clarity by drawing onsome of the features of the uranium market which havebeen detailed in papers presented at past Institutesymposia.
Flexibilities in demand
The Uranium Institute's September 1980 forecast ofthe build-up of nuclear capacity over the period to 1995is summarized in Table 2. According to these estimates*,which take account of all the reactors currently moperation, under construction or on firm order (as ofSeptember 1980), nuclear capacity in 1985 will be227 GWe and 335 GWe in 1990. If all the reactorsplanned (in September 1980) are added to these figures,the estimates would become 350 GWe and 494 GWe for1990 and 1995 respectively.
These forecasts take account of the status of eachindividual reactor under construction and of the situationwith respect to the development of nuclear powerprevailing in each country. Outside the United States,the Institute forecast assumes that construction lead-timeswill not exceed six years. Only about 20 stations, all ofthem still in the early stages of construction, are believedto be in difficulty and not available for commercialoperation for a further 8 to 10 years. For the UnitedStates, a longer lead-time of ten years has been assumed;it is still too early to assess the future impact on lead-times of the recent signs of a more favourable attitude tonuclear power.
Apart from nuclear capacity projections, the mainfactors which influence uranium demand are the tailsassays used at enrichment plants, and the possibility ofrecycling uranium and plutonium in PWR and FBRreactors after the reprocessing of spent fuel. Currentenrichment techniques allow the tails assay to vary from0.15% to 0.30%. Other methods, still at the experimentalstage, might allow this to be reduced to as little as 0.10%or even 0.05%. Table 3 gives an indication of the extentto which uranium consumption might be reduced byvarying the tails assay, with respect to a point of referencedefined by a product concentration of 3.25% U-235, atails assay of 0.20%, and no fuel recycling.
However, the flexibilities which theoretically exist inthe demand pattern are not always available in practiceto the utilities, since enrichment companies only allowtheir customers to choose tails assays between 0.20% and
* The corresponding estimates made by the International FuelCycle Evaluation form the subject of Mr Bennett's article onpage 8 of this bulletin
IAEA BULLETIN, VOL. 23, No.2
Nuclear fuel cycle
Table 3. Possible reduction in uranium requirements followingfrom certain changes in the fuel cycle [1]
Process change
tails assay cut to0.15%0.10%0.05%
reprocessing/recycling ofuraniumuranium/plutomum
fast breeder reactor in full use'
U supply reduction (%)
7313.418.6
19.030.0
99.0 approx
In the case of recycling these savings are only realized several yearslater Above reductions are relative to a standard case oftails 0 25%, product stream 3 25% U 2 3 S , no recycling
0.30%, and that provided 15 months to 4 years priornotice is given. The choice is strongly dependent on theprevailing price of natural uranium and of separative work(i.e. principally the enncher's electricity costs). Dependingupon the tails assay chosen, demand can vary by as muchas 20%, a factor of great importance in the overall balanceof supply and demand.
Flexibilities in uranium supply
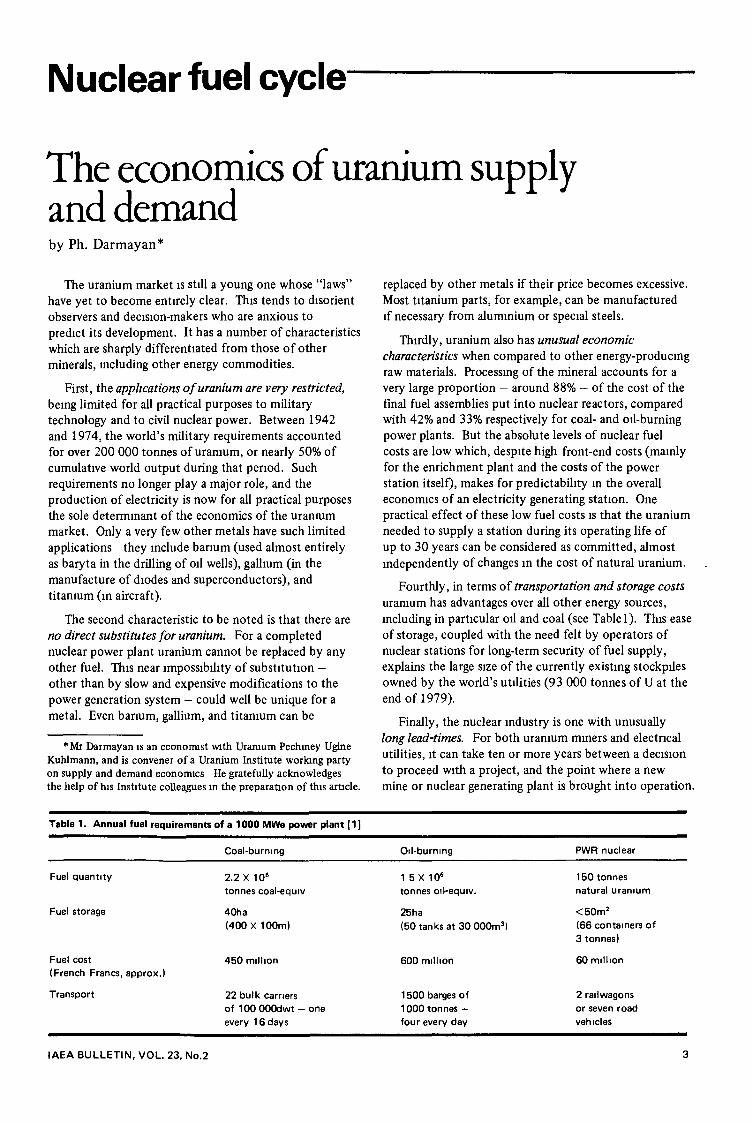
Until 1979, the question of whether the miningindustry would be able to find enough uranium to avoida shortage was a source of considerable concern toconsumers, but 1980 saw a great change. It will probablybe remembered as a year in which the spot pnce declineddramatically, mining projects were delayed or cancelled,and mills closed or operated at partial capacity only.These changes, were, of course, a direct consequence of thecontinuing delays in nuclear programmes. The net resulthas been an increase in the uncertainties surroundingfuture uranium production levels. The structure of supplycapability for the period 1980 to 1995, viewed fromtoday's perspective, is given in Figure 1.
The supply capability of currently operating millsamounts to some 40 000 tonnes per annum, half of which
Figure 1. Forecast of annual uranium production for selectedyears between 1980 and 1990 [2].
80 -
o 4 0 -
20 -
\... . I Mills in operation in 1980
X///A Mills under construction in 1980
£:"""jl Mills under evaluation in 1980
82
49
1980 1982 1985 1990
Table 4. Concentration of uranium in relatively few deposits [3]
Number ofdeposits
9176048
Number ofdeposits
92686
134
Cumulative
Reserves(1000 tons)
982 01336 31811 01985 3
%of total
49 567 391 2
100.0
is accounted for by the United States. In 1985 uraniumsupply, as forecast by the Institute, could rise to about60 000 tonnes if no existing mills were closed or run atreduced capacity. Of this total production, 65% wouldcome from currently operating mills, and 24% fromprojects under construction, only 10% would come frommills which are currently at the evaluation stage.
By 1990 many more projects could be brought intoproduction. A potential total of at least 82 000 tonnescould be produced by that date. In this case 45% of thesupply would come from existing mills, 17% from millsunder construction, and the remaining 38% from projectscurrently under evaluation. It must, however, beremembered that it has yet to be shown that many of theseprojects are technically and economically feasible.
The structure of this uranium supply is highlyconcentrated. Tables 4 and 5 show that 17 depositsaccount for 67% of the reserves (i.e. reasonably assureddeposits economically workable at a forward cost of lessthan US $30/lb U3O8) and that four countries own81 % of these reserves. This concentration, which is rather
Table 5. Summary of uranium deposits by country (short tonsU3O8) [3]
Country
ReservesNumber of Reserves per depositdeposits (1000 tons) (1000 tons)
Algeria
Australia
Brazil
Central AfricanRepublic
Canada
France
Gabon
Greenland
Niger
Namibia
USA
Germany,Fed Rep of
Total
1
14
2
1
45
3
5
1
6
2
52
2
134
3 4 0
491 7
4 0
1 0 5
527 3
156 2
46 5
0 1
273 5
125 0
3154
1 1
1985 3
3 4 0
35 1
2 0
1 0 5
11 7
52 1
9 3
0 1
45 6
62 5
6.0
0 5
148
IAEA BULLETIN, VOL. 23, No.2
Nuclear fuel cycle"
E3
tonn
es u
rai
1
100-
8 0 -
6 0 -
4 0 -
2 0 -
Q
1977
_ ! _
2
-3.-3 1
3 2
3 3
3 ^
i
Demand derived from reactor needs
Demand derived from enrichment contracts
Annual production
Production from operating mills
Production from mills in operationand under construction
Production from all projected mills
/
^ " ^ 3 1
1 11980 1985 1990
Committed anduncommittedreactorstails 0 20% 1980-85tails 0 25% 1985-90
Committedreactorstails 0.20%
l1995
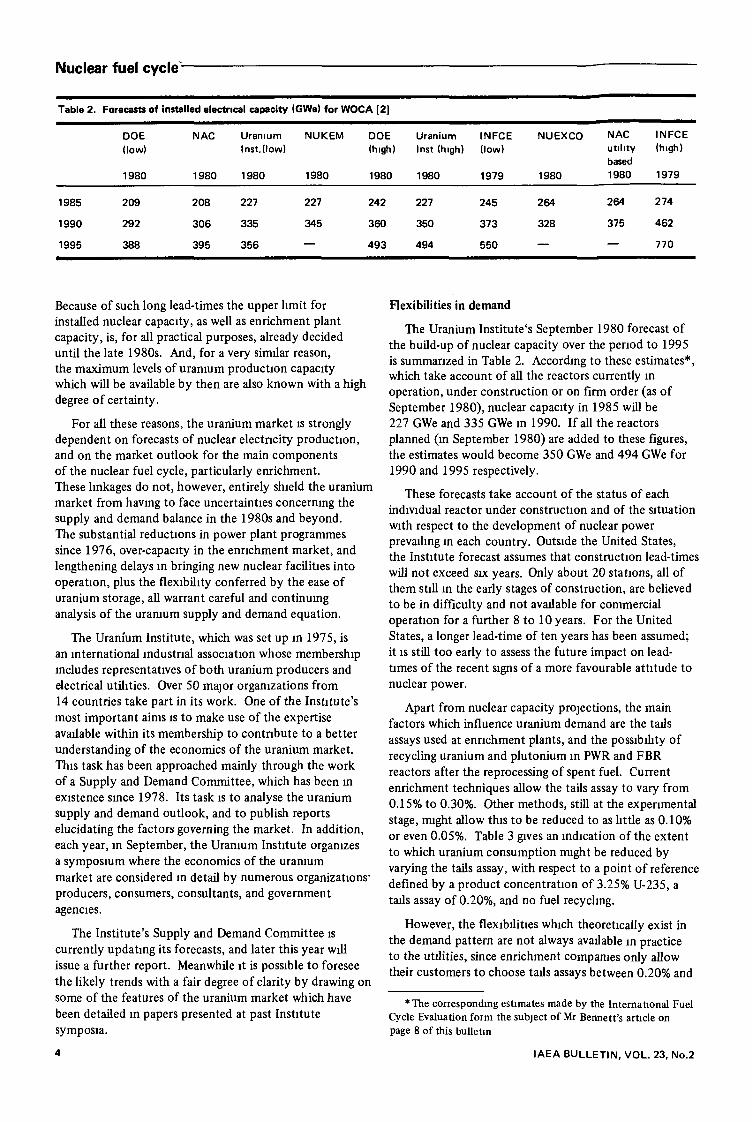
Figure 2. Uranium supply and demand estimates [2]. (Annual,1980-95, 1000 tonnes uranium.)
surprising in view of the fact that uranium is widelydistributed in the earth's crust, constitutes one of themajor possible sources of supply disruption faced by theuranium market.
Supply and demand balance
Figure 2 compares uranium consumption and supplycapability as derived from the Institute's estimates givenabove. Up to 1985 it is clear that, in spite of severalenrichment contract cancellations, the demand resultingfrom enrichment contracts will remain higher than thatderived from reactor needs. But it can also be seen that,from 1980 to 1985, uranium production from millscurrently in operation and under construction will m allprobability exceed uranium demand, however it is derived.
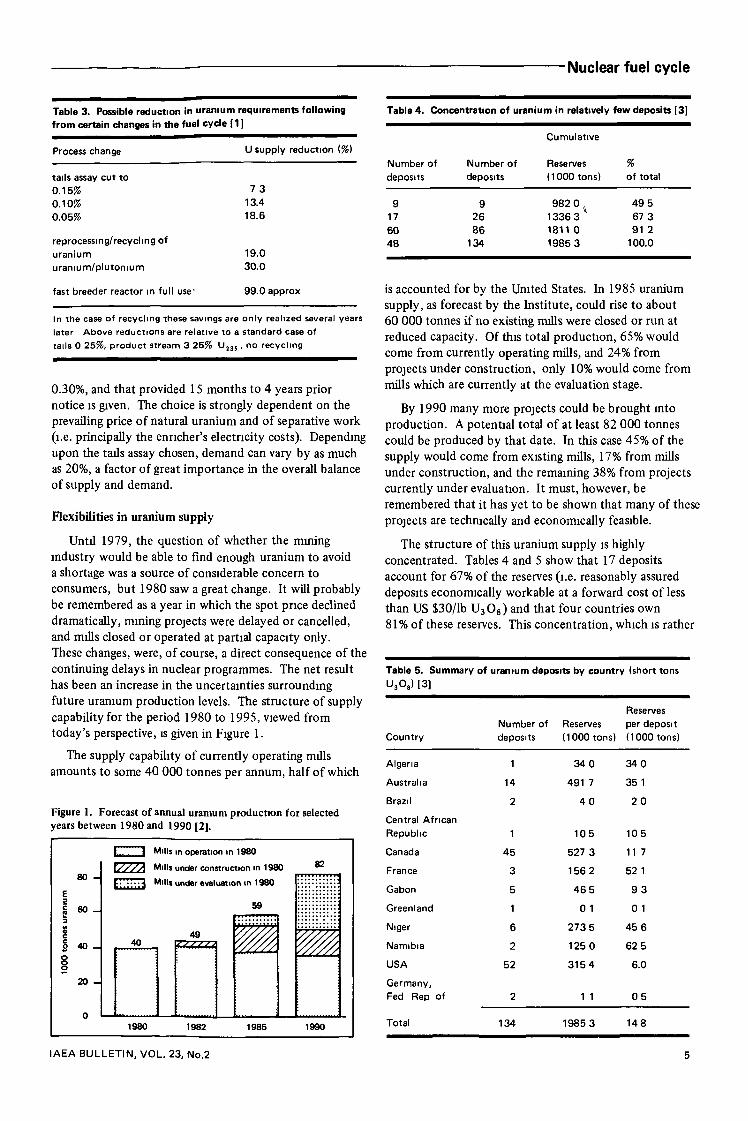
Figure 3. Trends in average delivered grades of uranium mined,1970-79 [4]. (Index numbers 1970= 100, annual averages.)US figures refer to the head-grade of mill-feed before allowing forchanges in recovery rates, whereas the Canadian figures are afterallowing for change in recovery rates.
130 -
120-
110 _
100-
9 0 -
8 0 -
7 0 "
6 0 -
"sv
i 1 l1970 71 72
N .
i i73 74 75
' ^Canada
" ^ V ^South Africa *v
i l l '76 77 78 79
After 1990, the balance of supply and demand willvery much depend on current nuclear policies. Figure 2also shows the upper and lower limits of reactorrequirements based on the Institute's nuclear estimatesand tails assay flexibilities. So far as supply is concerned,decisions to build new nulls are likely to be verystrongly influenced by decisions regarding the reactivationof nuclear programmes.
Uranium price analysis
Attempts are often made to study the uraniummarket without trying to analyse the influence of pricetrends on the supply and demand balance. It has alreadybeen seen that demand is relatively insensitive tochanges in price, so much so that the concept of break-even cost has very little meaning for the production ofenergy from uranium. This cost would presumably relateto the price which a producer of electricity would haveto pay for his uranium in order to arrive at the same costfor nuclear generated electricity as for the next least-expensive means of generating electricity (usually coal).In practice, of course — owing to the long lead-timesrequired for the construction of nuclear plants - such aconcept is more useful in assessing the economicadvantages of nuclear power against coal than in helpingthe industry and the market to balance uranium supplyand demand.
As far as supply is concerned, a distinction must bemade between potential producers and existing producers.The latter have only a limited capability of respondingto changes in the economic environment. The mainparameters that can be subjected to managementdecisions are: mine cut-off grades, null utilization, anduranium recovery efficiency. None of these offer greatflexibility, and if used for too long a period could evenhave adverse consequences on future production.Nevertheless, it is significant that in the past there hasbeen a general tendency for average grades to rise duringa recession, and to fall during periods of economicrecovery.
The Canadian curve of Figure 3 is a good example ofthe way in which the market price has an influence on thegrades of ore processed. The Elliot Lake mines exploitedhigh-grade ore during the recession of the early 1970s.Subsequently the prospect of improved margins andrising demand encouraged mine expansion and thedevelopment of lower-grade ores. Except for the start-upof the relatively rich Rabbit Lake deposit in late 1975,this downward trend in average Canadian recoveredgrades continued until 1979.
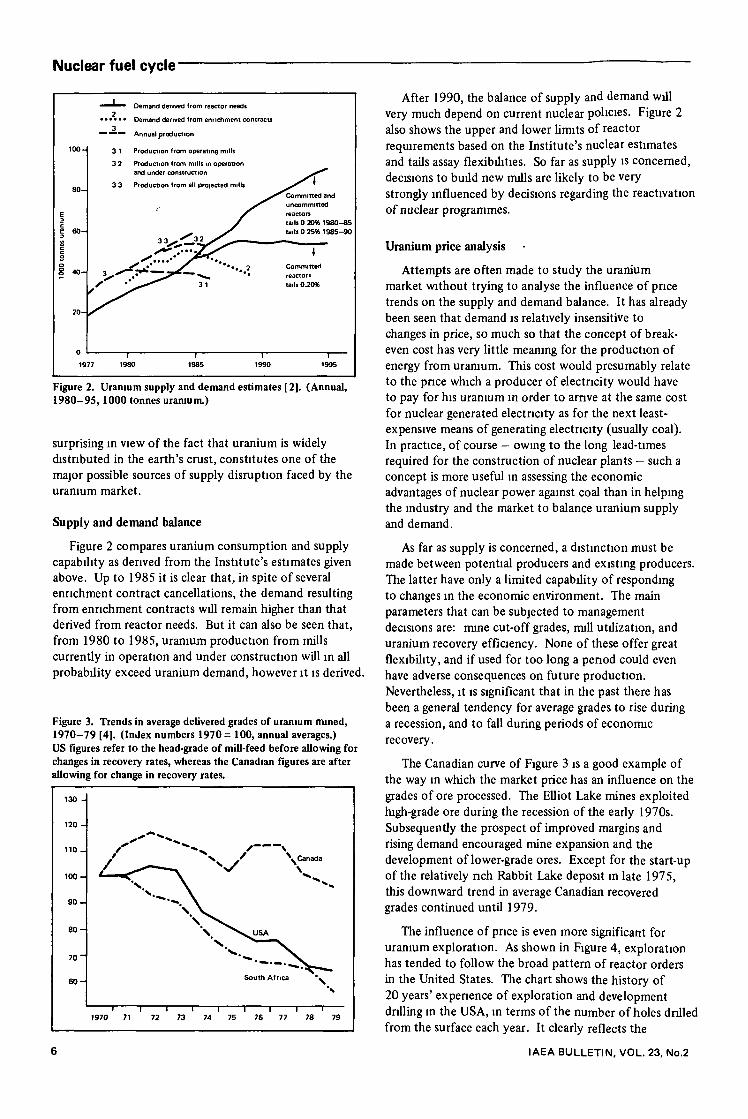
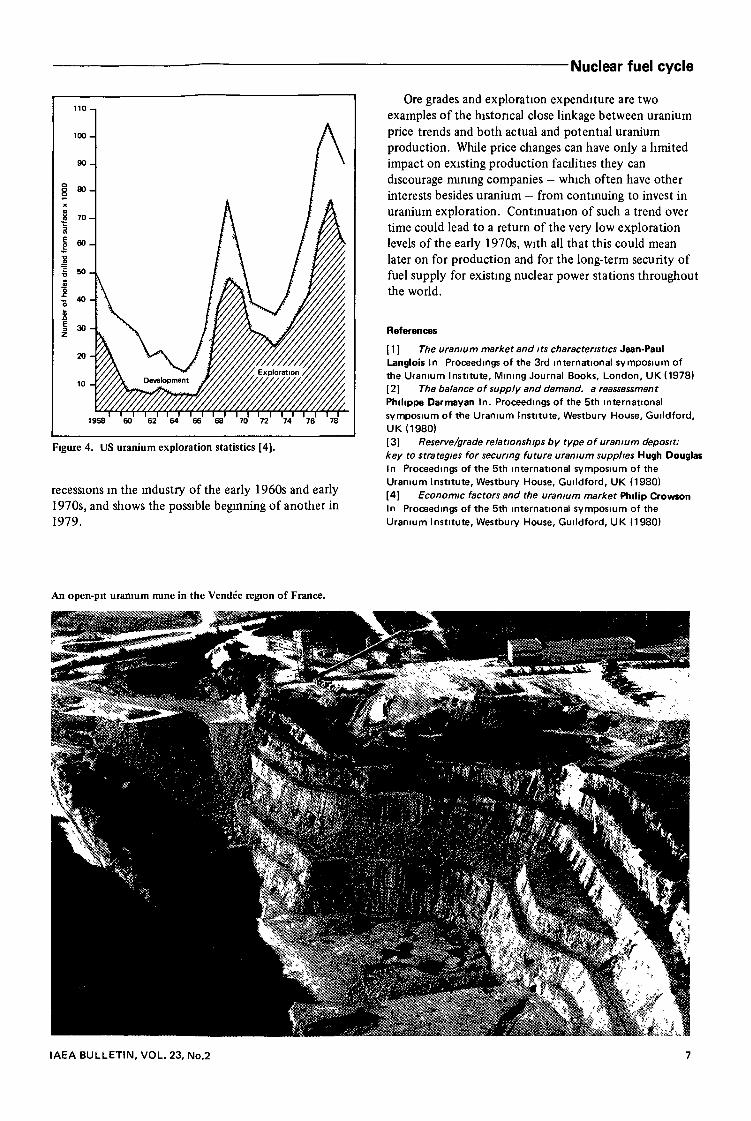
The influence of pnce is even more significant foruranium exploration. As shown in Figure 4, explorationhas tended to follow the broad pattern of reactor ordersin the United States. The chart shows the history of20 years' experience of exploration and developmentdrilling in the USA, in terms of the number of holes drilledfrom the surface each year. It clearly reflects the
IAEA BULLETIN, VOL. 23, No.2
-Nuclear fuel cycle
100-
Figure 4. US uranium exploration statistics [4].
recessions in the industry of the early 1960s and early1970s, and shows the possible beginning of another in1979.
Ore grades and exploration expenditure are twoexamples of the histoncal close linkage between uraniumprice trends and both actual and potential uraniumproduction. While price changes can have only a limitedimpact on existing production facilities they candiscourage mining companies — which often have otherinterests besides uranium - from continuing to invest inuranium exploration. Continuation of such a trend overtime could lead to a return of the very low explorationlevels of the early 1970s, with all that this could meanlater on for production and for the long-term security offuel supply for existing nuclear power stations throughoutthe world.
References
[ 1 ] The uranium market and its characteristics Jean-PaulLanglois In Proceedings of the 3rd international symposium ofthe Uranium Institute, Mining Journal Books, London, UK (1978)[ 2] The balance of supply and demand, a reassessmen tPhilippe Darmayan In. Proceedings of the 5th internationalsymposium of the Uranium Institute, Westbury House, Guildford,UK (1980)[3] Reserve/grade relationships by type of uranium deposit:key to strategies for securing future uranium supplies Hugh DouglasIn Proceedings of the 5th international symposium of theUranium Institute, Westbury House, Guildford, UK (1980)[4] Economic factors and the uranium market Philip CrowsonIn Proceedings of the 5th international symposium of theUranium Institute, Westbury House, Guildford, UK (1980)
An open-pit uranium mine in the Vendee region of France.
IAEA BULLETIN, VOL. 23, No.2