the economy of mauritius a basic econonmic report
TRANSCRIPT

Report No. 1 509-MAS FIL COPYThe Economy of MauritiusA Basic Econonmic ReportAnnex III-The Manufac:turing Sector
February 22, 1978
Country Programs Department IIEastern Africa Region
FOR OFFICIAL USE ONLY
Document of the World Bank
This document has a restricted distribution and may be used by recipientsonly in the performance of their official duties. Its contents may nototherwise be disclosed without World Bank authorization.
Pub
lic D
iscl
osur
e A
utho
rized
Pub
lic D
iscl
osur
e A
utho
rized
Pub
lic D
iscl
osur
e A
utho
rized
Pub
lic D
iscl
osur
e A
utho
rized
Pub
lic D
iscl
osur
e A
utho
rized
Pub
lic D
iscl
osur
e A
utho
rized
Pub
lic D
iscl
osur
e A
utho
rized
Pub
lic D
iscl
osur
e A
utho
rized
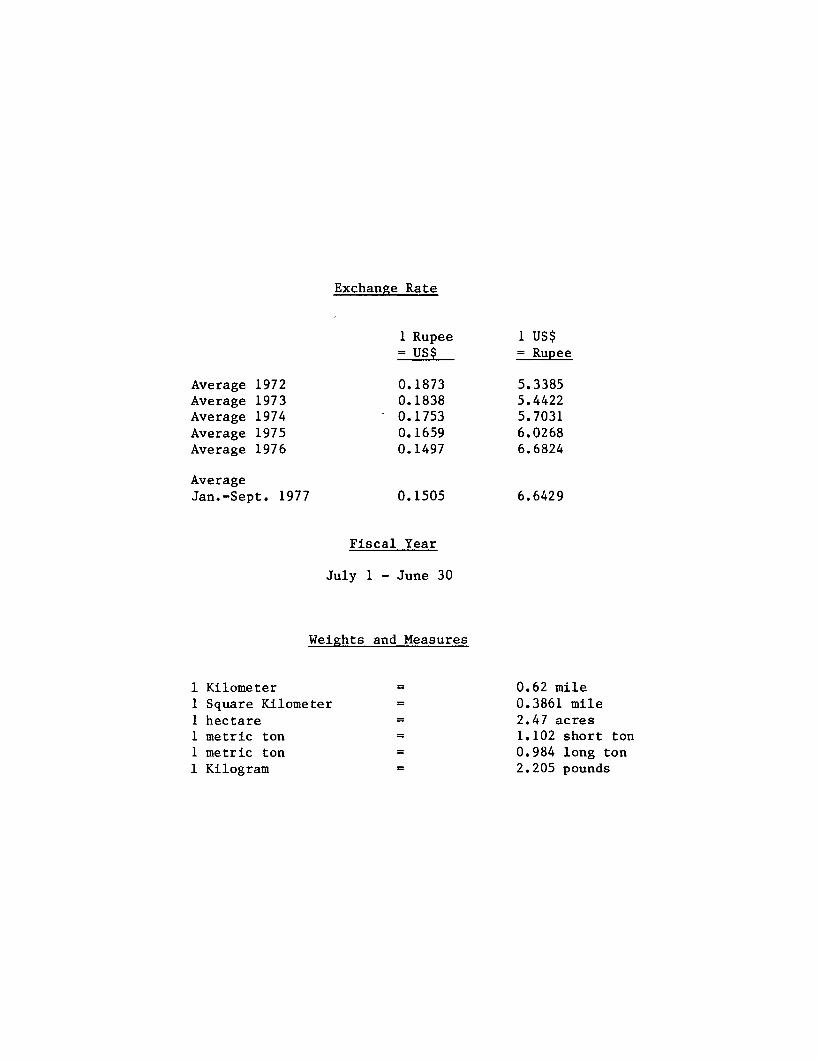
Exchange Rate
1 Rupee 1 US$= US$ = Rupee
Average 1972 0.1873 5.3385Average 1973 0.1838 5.4422Average 1974 0.1753 5.7031Average 1975 0.1659 6.0268Average 1976 0.1497 6.6824
AverageJan.-Sept. 1977 0.1505 6.6429
Fiscal Year
July 1 - June 30
Weights and Measures
1 Kilometer 0.62 mile1 Square Kilometer 0.3861 mile1 hectare 2.47 acresI metric ton 1.102 short ton1 metric ton 0.984 long ton1 Kilogram 2.205 pounds
FOR OFFICIAL USE ONLY
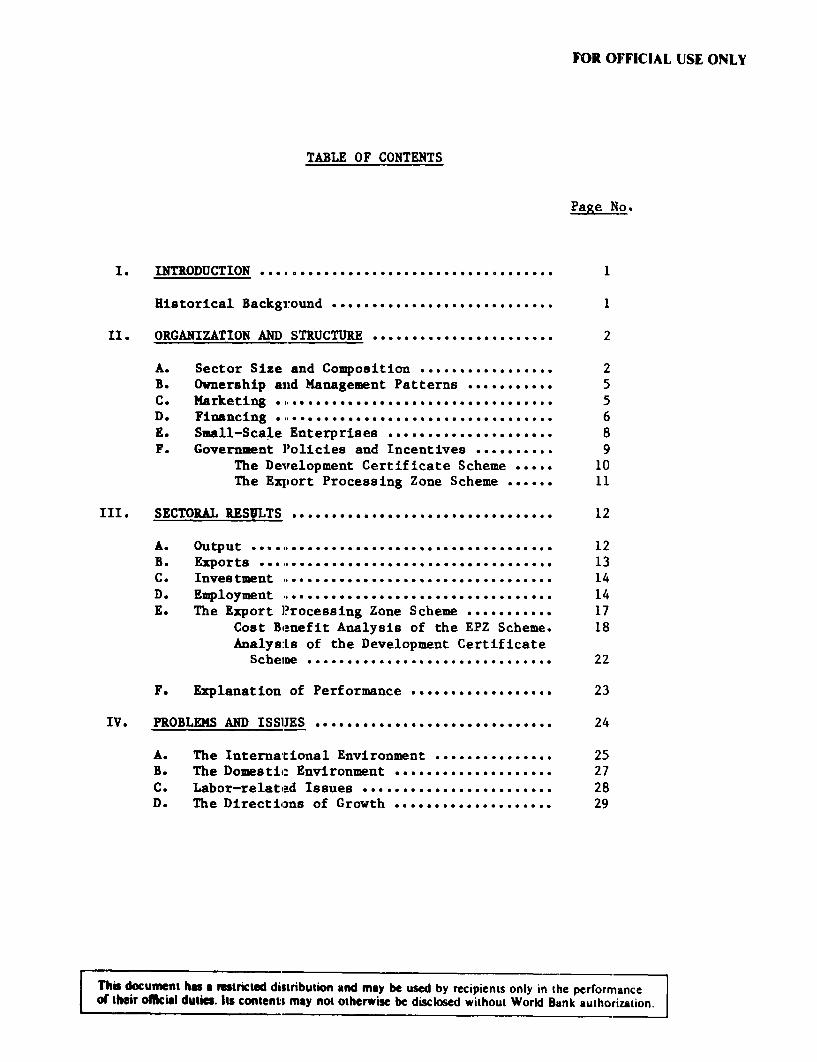
TABLE OF CONTENTS
Page No.
I. INTRODUCTION ..................................... t........... 1
Historical Background ..................... ... 1
II. ORGANIZATION AND STRUCTURE ....................... 2
A. Sector Size and Composition ................. 2B. Ownership ant Management Patterns .......... ... 5Co Marketing . ........................... *............... 5D. Financing ..i................................. 6E. Small-Scale Enterprises ............... *...... 8F. Government Policies and Incentives .......... 9
The Devrelopment Certificate Scheme ..... 10The Export Processing Zone Scheme ...... 11
III. SECTORAL RESYLTS .......... . . . ................................ . 12
A. Output ........ ................. ................ 12B. Exports o. ,. *. .o o. .* * *. . ...... o.... , 13C. Investmtent ,.......................... .................. 14D. Employrment ................. .......................... 14E. The Export ]?rocessing Zone Scheme .... O ..... 17
Cost Benefit Analysis of the EPZ Scheme. 18AnalysLs of the Development Certificate
Schemne ............................ ... 22
F. Explanation of Performance .. ................ 23
IV. PROBLEMS AND ISSIJES .............................. 24
A. The Internaltional Environment .............. . 25B. The Domesti: Environment ... ....... 27C. Labor-related Issues ... ................... 28D. The Directions of Growth ............ ........ 29
This document hs a rsricted distribution and may be used by recipients only in the performanceof their official duties. 1I content; may not otherwise be disclosed without World Bank authorization.
-2-
Page No.
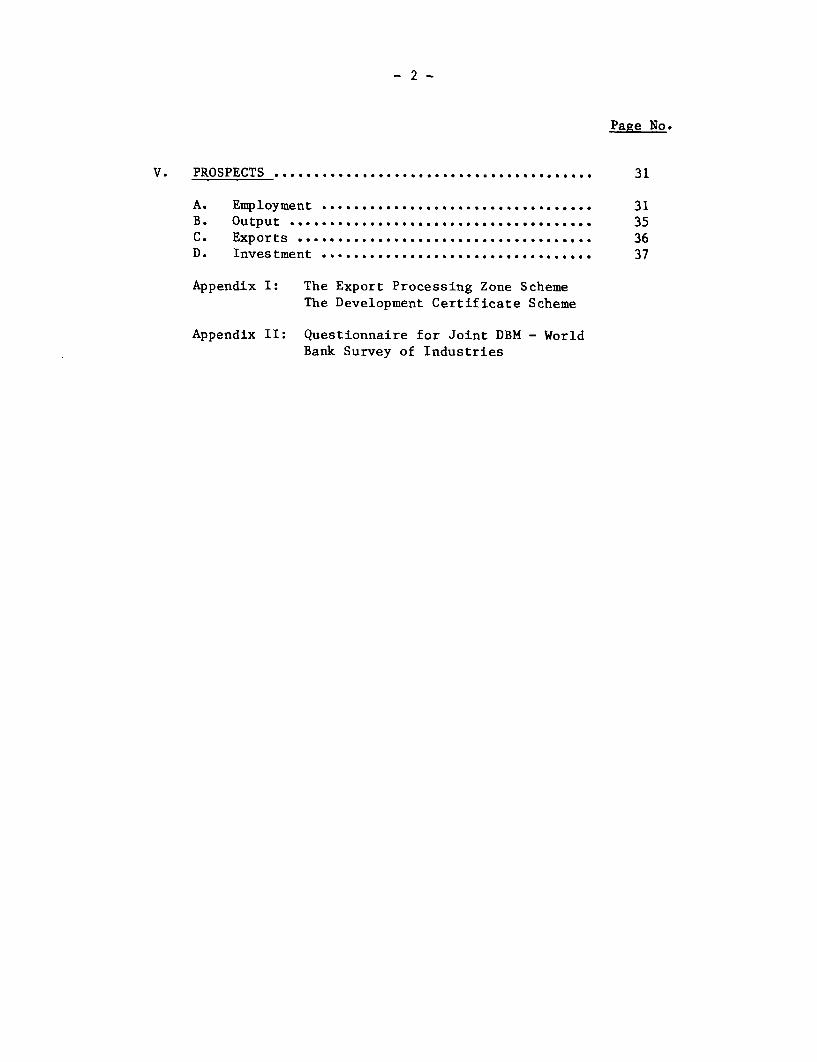
V. PROSPECTS ................................ * *.... 31
A. Employment .................................. 31B. Output ................... .......................... 35C. Exports * *........................... ......... 36D. Investment .. ................................ 37
Appendix I: The Export Processing Zone SchemeThe Development Certificate Scheme
Appendix II: Questionnaire for Joint DBM - WorldBank Survey of Industries
Annex IIIPage 1
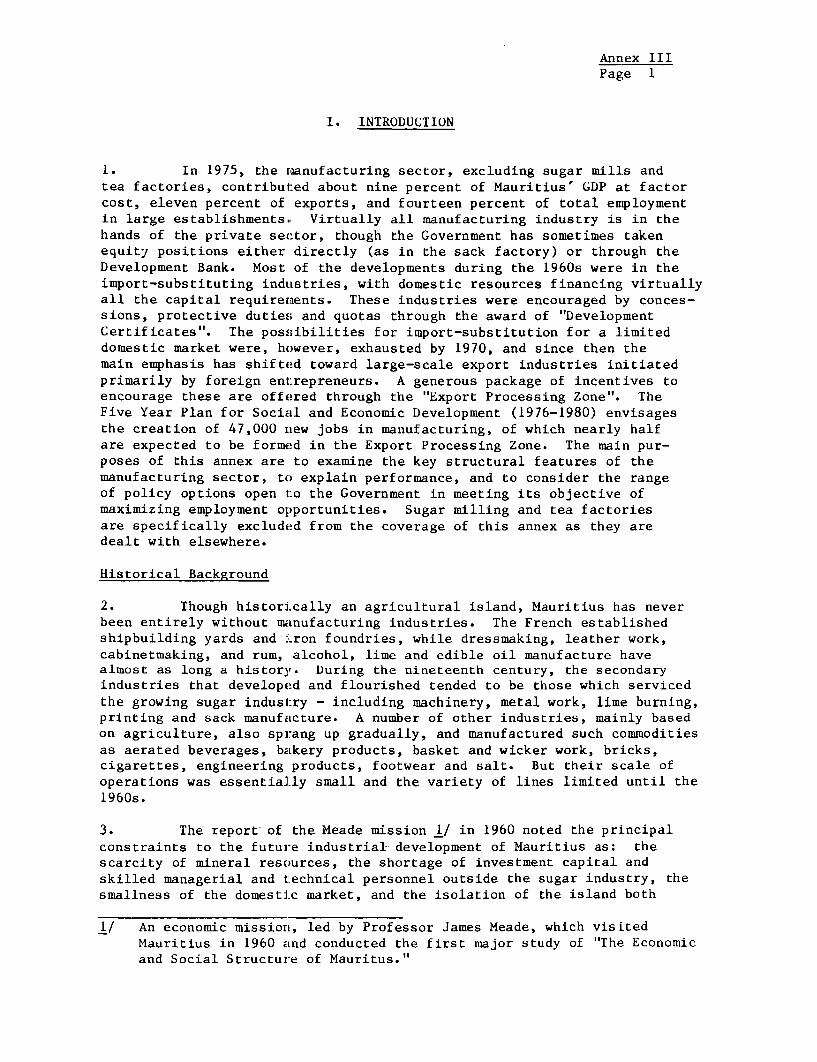
I. INTRODUCTION
1. In 1975, the raanufacturing sector, excluding sugar mills andtea factories, contributed about nine percent of Mauritius' GDP at factorcost, eleven percent of exports, and fourteen percent of total enmploymentin large establishments.. Virtually all manufacturing industry is in thehands of the private sector, though the Government has sometimes takenequity positions either directly (as in the sack factory) or through theDevelopment Bank. Most of the developments during the 1960s were in theimport-substituting industries, with domestic resources financing virtuallyall the capital requireraents. These industries were encouraged by conces-sions, protective duties and quotas through the award of "DevelopmentCertificates". The possibilities for import-substitution for a limiteddomestic market were, however, exhausted by 1970, and since then themain emphasis has shifted toward large-scale export industries initiatedprimarily by foreign ent:repreneurs. A generous package of incentives toencourage these are offered through the "Export Processing Zone". TheFive Year Plan for Social and Economic Development (1976-1980) envisagesthe creation of 47,000 new jobs in manufacturing, of which nearly halfare expected to be formed in the Export Processing Zone. The main pur-poses of this annex are to examine the key structural features of themanufacturing sector, to explain performance, and to consider the rangeof policy options open t:o the Government in meeting its objective ofmaximizing employment opportunities. Sugar milling and tea factoriesare specifically excluded from the coverage of this annex as they aredealt with elsewhere.
Historical Background
2. Though historically an agricultural island, Mauritius has neverbeen entirely without manufacturing industries. The French establishedshipbuilding yards and iron foundries, while dressmaking, leather work,cabinetmaking, and rum, alcohol, lime and edible oil manufacture havealmost as long a history. During the nineteenth century, the secondaryindustries that developed and flourished tended to be those which servicedthe growing sugar indust:ry - including machinery, metal work, lime burning,printing and sack manufacture. A number of other industries, mainly basedon agriculture, also sprang up gradually, and manufactured such commoditiesas aerated beverages, bakery products, basket and wicker work, bricks,cigarettes, engineering products, footwear and salt. But their scale ofoperations was essentially small and the variety of lines limited until the1960s.
3. The report of the Meade mission 1/ in 1960 noted the principalconstraints to the future industrial-development of Mauritius as: thescarcity of mineral resources, the shortage of investment capital andskilled managerial and technical personnel outside the sugar industry, thesmallness of the domestic market, and the isolation of the island both
1/ An economic mission, led by Professor James Meade, which visitedMauritius in 1960 and conducted the first major study of "The Economicand Social Structure of Mauritus."

Annex IIIPage 2
from overseas sources of raw materials and potential foreign markets. Fol-lowing this report and in the face of the need to provide employment forthe rapidly expanding population, the Government in 1963 declared a policyof encouraging new industries and of taking such measures as were necessaryto create a favorable climate for their establishment and growth. TheDevelopment Bank was established in 1964 to provide long-term, loans forinvestment, the Income Tax Ordinance was amended to give more favorableinitial allowances and tax holdings, and the Customs Tariff was remodelledto furnish complete or partial duty exemptions on machinery and materialsneeded in local industries. Substantial parts of public investment in theGovernment's development programs in the 1960s were allocated to thebuilding up of infrastructure, including roads, water supplies electricitygeneration and transport facilities. Despite all these incentives andfacilities, however, the manufacturing sector (like the rest of theMauritian economy) displayed hardly any growth in real terms through theperiod till 1970. While value added in the sector at current pricesexpanded, on an average, by about 5.5 percent annually, prices rose atalmost the same pace, so that real output in manufacturing virtuallystagnated over the period.
4. In sharp contrast to this, the five years from 1970 to 1975witnessed a remarkable spurt in the manufacturing sector, with the annualgrowth rate averaging 17.1 percent in value added at constant prices, 16percent in employment and over 100 percent in the value of exports. As aresult the sector's share in total GDP at factor cost rose from 8 to 13percent in real terms, its share in total employment in large establishmentsdoubled, and its share in the value of total exports doubled. However, thelabor market in Mauritius is still characterized by a relatively high degreeof unemployment and underemployment, especially among recent school leavers.The Government views the industrial sector as the critical element in meetingits employment targets for the future. In the past, a large proportion ofthe jobs created in manufacturing were filled by women workers (generallypaid less than their male counterparts), which has led to the concernthat job creation was failing to benefit sufficiently the hard core ofunemployed men most in need of work. These and other problems are dis-cussed in more detail later. Part II below contains a description ofthe organization and structure of the manufacturing sector in Mauritius,Part III analyzes its performance over the last five years, while Part IVand V discuss the prospects for continued growth in the light of theproblems and issues that are likely to arise in the future.
II. ORGANIZATION AND STRUCTURE
A. Sector Size and Composition
5. The manufacturing sector (excluding sugar milling and tea pro-cessing) contributed about nine percent of total GDP at factor cost andprovided employment to almost 37,000 workers in 1975. More than 399 large
Annex IIIPage 3
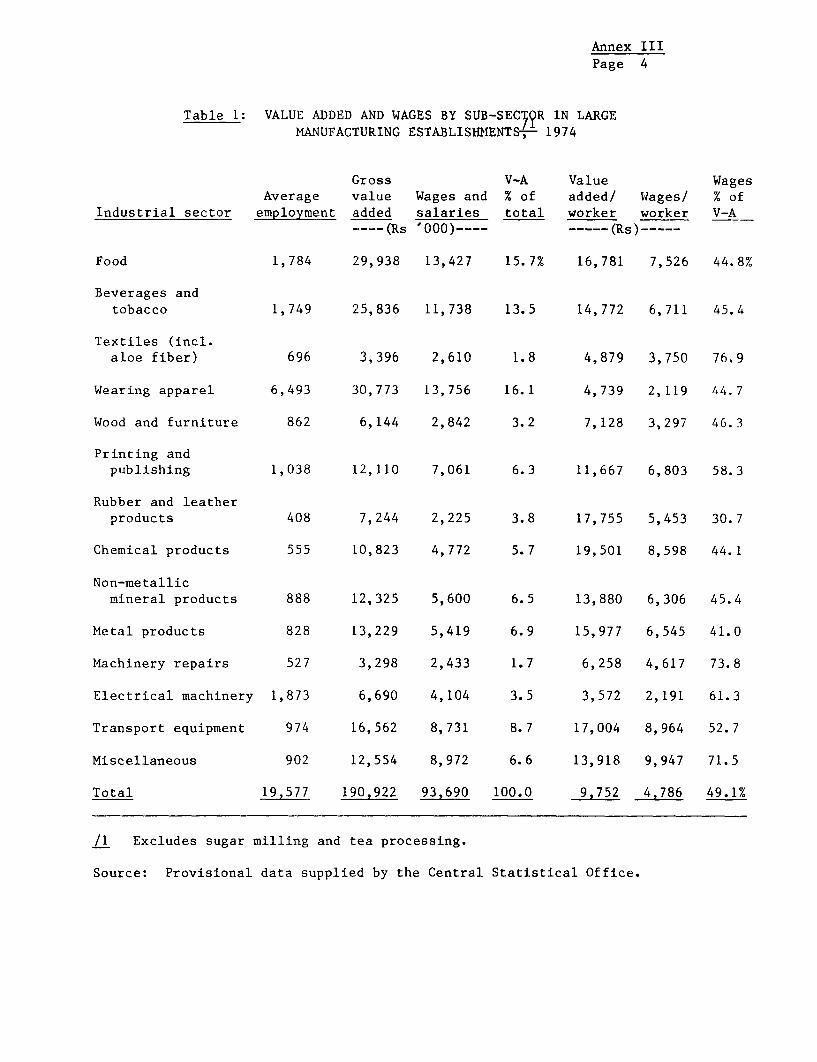
establishments (employing 10 or more workers) are responsible for over 90percent of gross value acLded and 60 percent of total employment in the sector.Table I shows that withirt the group of large establishments, wearing apparel,food processing, beverages and tobacco are the major activities, togetheraccounting for nearly ha]f of total employment and value added. Consumer goodsindustries as a whole provide nearly two thirds of total employment and 60percent of value added in large industrial establishments. Value added perworker is about Rs 10,000 on average but varies widely among industries,with chemicals, leather products and food processing being almost twice theaverage, and textiles, wearing apparel and electronic components standingrelatively low on the list. For intermediate and capital goods industries asa whole, value added per worker is about 25 percent higher than it is forconsumer goods, which may be at least partly the consequence of greateraverage capital intensity in the former. Wages and salaries generally consti-tute about half of total value added in industry. Wages in Mauritius are setby a combination of collective bargaining, arbitration by the National Remunera-tion Board, and politicaL pressures. They are most often a function of age,sex, skill, length of service and type of work performed. Female industrialworkers are generally for the same kinds of work, and paid less than men arelargely concentrated in garment manufacture and the assembly of electroniccomponents.
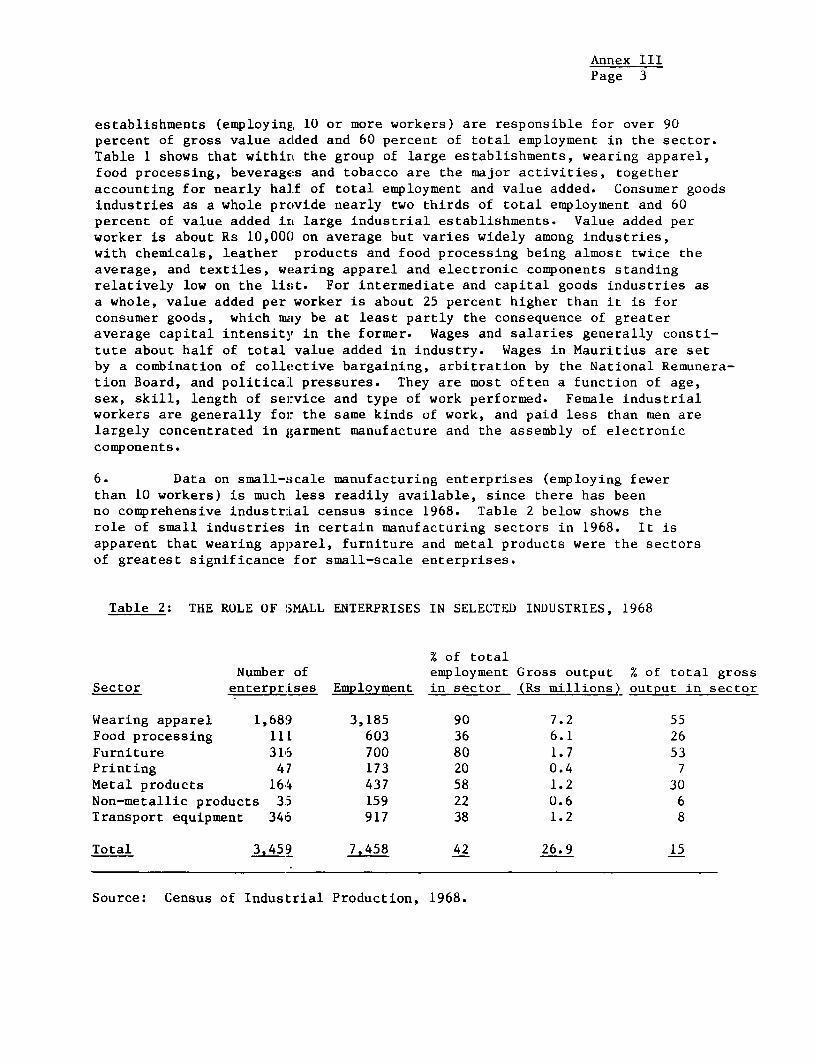
6. Data on small-scale manufacturing enterprises (employing fewerthan 10 workers) is much less readily available, since there has beenno comprehensive industr:Lal census since 1968. Table 2 below shows therole of small industries in certain manufacturing sectors in 1968. It isapparent that wearing apparel, furniture and metal products were the sectorsof greatest significance for small-scale enterprises.
Table 2: THE ROLE OF SMALL ENTERPRISES IN SELECTED INDUSTRIES, 1968
% of totalNumber of employment Gross output % of total gross
Sector enterprLses Employment in sector (Rs millions) output in sector
Wearing apparel 1,689 3,185 90 7.2 55Food processing 111 603 36 6.1 26Furniture 3115 700 80 1.7 53Printing 47 173 20 0.4 7Metal products 164 437 58 1.2 30Non-metallic products 3.5 159 22 0.6 6Transport equipment 3415 917 38 1.2 8
Total 3.459 7,458 42 26.9 15
Source: Census of Industrial Production, 1968.
Annex IIIPage 4
Table 1: VALUE ADDED AND WAGES BY SUB-SECT?R IN LARGEMANUFACTURING ESTABLISHIENTS-,-- 1974
Gross V-A Value WagesAverage value Wages and % of added/ Wages/ % of
Industrial sector employment added salaries total worker worker V-A---- (Rs '000)-- -… ---- (Rs)-----
Food 1,784 29,938 13,427 15.7% 16,781 7,526 44.8%
Beverages andtobacco 1,749 25,836 11,738 13.5 14,772 6,711 45.4
Textiles (incl.aloe fiber) 696 3,396 2,610 1.8 4,879 3,750 76.9
Wearing apparel 6,493 30,773 13,756 16.1 4,739 2,119 44.7
Wood and furniture 862 6,144 2,842 3.2 7,128 3,297 46.3
Printing andpublishing 1,038 12,110 7,061 6.3 11,667 6,803 58.3
Rubber and leatherproducts 408 7,244 2,225 3.8 17,755 5,453 30.7
Chemical products 555 10,823 4,772 5.7 19,501 8,598 44.1
Non-metallicmineral products 888 12,325 5,600 6.5 13,880 6,306 45.4
Metal products 828 13,229 5,419 6.9 15,977 6,545 41.0
Machinery repairs 527 3,298 2,433 1.7 6,258 4,617 73.8
Electrical machinery 1,873 6,690 4,104 3.5 3,572 2,191 61.3
Transport equipment 974 16,562 8,731 8.7 17,004 8,964 52.7
Miscellaneous 902 12,554 8,972 6.6 13,918 9,947 71.5
Total 19,577 190,922 93,690 100.0 9,752 4,786 49.1%
/1 Excludes sugar milling and tea processing.
Source: Provisional data supplied by the Central Statistical Office.

Annex IIIPage 5
B. Ownership and Management Patterns
7. The ownership of industrial enterprises in Mauritius is pre-dominantly in private hands, with the Government having made direct invest-ments in only a few companies, such as the sack factory and a livestockfeed factory. The Development Bank (see para. 14 below) will generally onlycome in with equity part:icipation where other local enterpreneurial interestis lacking or where the size or nature of the investment otherwise justifiesit. In general, the Government's role has been confined to that of providingadequate infrastructure and the institutional framework within which privateentrepreneurs can operat:e.
8. Enterprises under the Development Certificate scheme (see para. 23below) and other firms producing primarily for the domestic market are almostentirely Mauritian-owned. On the other hand, about 70 to 80 percent of theshareholding in most Export Enterprises (see para. 25 below) is held byforeign investors. In I:he past, these have come mainly from France and HongKong, with significant :investments also from India, South Africa, West Germanyand other countries. Foreign private investment is actively sought after andencouraged by the Government through such incentives as easily availableresidence permits for expatriate staff, free repatriation of profits, andguarantees against nationalization. As regards local equity ownership, thisis fairly well-dispersed for the small-scale enterprises employing fewer thanten workers and with an investment smaller than Rs 15,000. On the other hand,local ownership and management of the larger manufacturing enterprises islargely concentrated in the hands of a few powerful groups, all of which alsohave substantial interests in the sugar industry or in trading activities.This relatively small but active group of entrepreneurs continues to providemost of the resources and the major thrust for further industrial, developmentwithin Mauritius.
C. Marketing
9. With a residenit population of just over 850,000 in 1974, localdemand for most products has often been too small to guarantee the effectiveutilization of substantial fixed investment. For indigenous manufacturers,this fact has sometimes been accentuated by the preference of consumers forimported goods, based onl real or imagined differences in quality. In the caseof producers of intermediate and semi-processed products, their inability tomaintain consistently high quality standards and to meet delivery scheduleshas hindered linkups or subcontracting on any substantial scale with largemanufacturers of finished goods. These factors contributed toward thephenomenon of relatively small units with unutilized capacity which, untilrecently, were found all over the island.
10. In view of the smallness of the domestic market and the general lackof local raw materials Eor industry, development of the manufacturing sector,especially since 1970, has naturally been in the direction of processing
Annex IIIPage 6
imported materials into finished goods for export. The major export marketsfor manufactured goods are France, West Germany and other EEC countries, theLinited States, Hong Kong, Japan and Reunion Island. As an Associate Member ofthe EEC, Mauritian exports enjoy preferential access under the 1974 LomeConvention (which superseded the earlier Yaounde Convention), in the form ofduty-free entry for manufactured goods "originating" in the island. Theconditions of origin vary from product to product, but in general the valueadded in Mauritius has to represent at least 50 percent of the value ofthe finished product. Access to the EEC market has been a major inducementto foreign entrepreneurs, expecially those from Hong Kong and India, toset up plants in the Mauritian Export Processing Zone.
11. Despite the growth in manufacturing for export, however, over 90percent of the industrial output in Mauritius is still sold domestically.Available statistics on the organization of local marketing and distributionchannels arc generally sketchy and unreliable. Most import trade in manu-factured goods is handled by a few large firms together with scores of smalltraders and shopkeepers. This proliferation of channels and outlets resultsat least partly from the fact that there is no requirement for routing goodsthrough licensed clearing houses, and anyone is free to-import directly fromoverseas. This, in actuality, is what most firms do in meeting their machineryand raw materials needs. Similarly, local output is often marketed directlythrough the myriads of small retail shops. Export marketing is also handleddirectly by the manufacturing enterprises themselves, most of whom are offshootsof foreign firms with established contacts and forward selling commitments inthe EEC, Far East and other regions.
12. Most local entrepreneurs face the twin problems of domestic competi-tion from "backyard producers" with inferior products and low overheads,and their own inability to meet the exacting standards of price, quality,delivery and service in foreign markets. Barring a few noteworthy exceptions,there is generally little appreciation of modern marketing techniques and ofthe need to constantly improve and develop new products to meet changingmarket needs. Duplication of effort and wasted investment sometimes resultbecause of lack of coordination among local enterprises. Since most commercialand industrial interests are used to "thinking small", and few entrepreneursare large enough to engage by themselves in successful export promotion,no really viable export marketing board or other institutional arrangementhas been feasible as, say, in the sugar industry. The development of special-ized export houses, enjoying economies of scale in marketing and after-salesservices, could be of help in the overseas expansion of some local firmswhich lack the requisite marketing know-how, organization and experience.
D. Financing
13. Mauritius has a fairly well-developed commercial banking sector,with nine commercial banks. These banks extend both working capital and
Annex IIIPage 7
term loans (usually up i:o 7 years) to industry, and occasionally even parti-cipate in limited equity subscriptions or longer-term consortium lending withthe Development Bank. The prime bank rate varies from 7 to 8.5 percent (de-pending on the type of Loan), with the maximum permissible interest rates forcommercial banks being '3 percent on secured loans over Rs 6,000 and 36 percenton unsecured loans. A few insurance companies also play an active part infinancing the requiremenats of industries, mainly through subscriptions totheir share capital. There is as yet no regular stock market though one isgradually being established, and it is possible to underwrite share capitaland also arrange for sale of shares through a number of stock brokers and afew investment companies.
14. The Development Bank of Mauritius, which was established in 1964as a Government-owned statutory corporation, continues to be the onlysignificant institutional source of long-term finance. Between March 1964and June 30, 1975, the Development Bank approved 207 loans and 16 equityinvestments for a total of nearly Rs 122 million to medium and large-scaleindustrial projects. Total disbursements by the Development Bank in theindustrial sector up to June 30, 1975 totaled Rs 54 million, of which nearly30 percent was in fiscal 1975 and financed about 10 percent of total industrialinvestment in that year. The outstanding loan portfolio consisted mainly oftextiles (45 percent), hotels (17 percent), and food, fish and livestockprocessing (11 percent), and covered more than half of all companies withExport Enterprise or Development Certificates. In July 1975, the DevelopmentBank raised its lending rate from 9.5 to 10 percent to cover higher costs ofborrowing and administration. Loans are generally repayable over 10 yearsincluding a two-year initial grace period.
15. The relatively easy access to credit by the larger manufacturingenterprises contrasts sharply with the real financing difficulties faced bysmall-scale industries (see below). Working capital problems for theseenterprises continue to be severe, despite some limited assistance fromthe commercial banks, particularly the State Commercial Bank, whichwas established in June 1973 to help such neglected sectors. The Develop-ment Bank also operates a fairly successful scheme for long-term loans tosmall-scale industry, under which loans of up to Rs 15,000 are advanced to anyone enterprise at an interest rate of 2.5 percent and repayable over 10 years.The Government reimburses the Development Bank for the costs of administeringthe scheme and assumes the risk of defaults by sub-borrowers. Between fiscalyears 1972 and 1975, 742 loans to small-scale firms totaling Rs 5.1 millionwere approved by the Development Bank, and were fairly evenly distributedamong food processing, light engineering, garment-making, furniture and otherindustries. Since 1974i, the Development Bank has been trying to make itsassistance more effect:ive through reduced processing times and more flexiblesecurity requirements. For the majority of small enterprises, however, thesingle most common sources of funds are still either friends and relatives, orthe "curb market," which charges interest rates up to 10 percent per month.

Annex III
Page 8
E. Small-Scale Enterprises
16. Small-scale enterprises in Mauritus have generally been definedas manufacturing establishments with fewer than ten employ-ees, althoughthey are currently being redefined as those employing no more than twenty-five workers and with a capital investment bel'ow Rs 100,000. Most of theseare really "cottage industries" or small traditional enterprises, withconsiderable differences in organization and method of operation from amodern small-scale industry. Tailors and furniture makers are the mostcommon small enterpreneurs in Mauritius. They generally operate out of asmall rented shed with old and simple machinery, employing a few youngapprentices or family members of the owner, who is generally himself thechief craftsman working along with his employees. There is a notable lack ofmodern management skills, and hardly any use of production and cost controlsin these units. The traditional enterprise sells almost entirely to thedomestic consumer market, with less than 5 percent of all enterprises makingany sales to retailers or other industries. There is hardly any active promotionor advertising, and most firms generally wait for the customer himself to cometo t-hem. Their main source of competition is not from the emerging modernindustries, which produce for a higher price and quality market, but from eachother. This role of small-scale industries in supplying low-cost commoditiesis of special importance in the rural areas, where their comparative priceadvantage is enlarged by lower costs of distribution. However, some smallenterprises have also specialized in producing fairly high-priced productsfor the upper-income levels.
17. More 'modern' small enterprises have developed from cottageindustries in shoemaking, baked goods, mechanical workshops and plasticsover the last 5 to 10 years. Others have more recently sprung up in suchsectors as chemicals, steel, food processing, printing and furniture-makingto exploit the advantages of the Development Certificate' or Export Enter-prise Certificate schemes. Their problems and needs are more similar tolarger enterprises, since they are mostly run by more established entrepre-neurs, who have the benefits of industrialization incentives and relativelyeasy access to financial sources.
18. Despite the Government's declared desi re to create a better inte-grated industrial structure, there are still very few linkages between thesmall traditional and the larger new industries in Mauritius. There isample scope for small enterprises to develop as ancillary activities tothe modern sector in such fields as mechanical workshops, furniture-makingand printing. However, several barriers remain to be overcome, includingthe gap between the quality of products and services supplied, on the onehand, and the demands of modern industries, on the other. The legal andinstitutional structure also hampers rather than helps small enterprises --
f or example, industries in the Export Procesing Zone cannot provide smallsub-contractors with duty-free materials, while the Development Certifi-cate scheme also favors only the larger import-substitu.tion industries withduty concessions.

Annex IIIPage 9
19. The recent growth in employment and purchasing power of thepopulation in other sectors has created a situation of excess demand forproducts of some small enterprises (especially furniture and garments).However, bottlenecks on the production side continue to be severe. Theowners of small enterprises complain of lack of space for expansion ofproduction facilities and shortage of workers (both skilled and unskilled),who are attracted by better working conditions in the modern sector. Theowners generally suffer from lack of formal business training, and havefew contacts with modern industries or training institutions, which couldupgrade their technical. and managerial skills. Temporary shortages of rawmaterials and component:s (mostly imported) are endemic. Finally, loans tosmall enterprises for both working capital and long-term investment aregenerally considered by banks as having too high costs and risks, so thatmost entrepreneurs are limited to their own personal financial resources.The Development Bank has made creditable progress in providing finance tosmall-scale enterprises, but it has necessarily been constrained in supply-ing them with the technical advice and assistance that they need just as much,if not more. The three-man Small Industries Unit in the Ministry of Commerceand Industry, which is responsible for technical assistance and projectpreparation, seems to have had a relatively small impact so far., Recently, theIndian Government has concluded an agreement to provide assistance to small-scale enterprises in Mauritius, possibly including the establishment ofan industrial estate and training facilities.
F. Government Policies and Incentives
20. The philosophy underlying the Government's policies so far hasbeen to allow private enterprise fairly complete freedom regarding ownershipand control, though a minimum local participation of about 30 percent is nowrequired of export enterprises. The Government's role in the industrializationprocess is seen as a two-fold one. First, it has attempted to create thenecessary climate in which private initiative can be attracted and can flourish,by providing generous incentives and assistance in the start-up and operationof enterprises. Second, it has tried to ensure a degree of equity in thewhole process by imposing domestic price and wage guidelines, so that thebenefits of growth can be partly shared with consumers and wage-earners.This, at least, has been the theory behind the Government's policies.
21. There appears to be some scope for improving the efficiency of theadministrative procedures. According to representatives of industry, theprocedures in getting an enterprise -off the ground are complex and timeconsuming. Many agencies have to be contacted and the time for clearance runsfrom six to nine months. This is in contrast with the highly concentratedand rapid procedures :in Hong Kong.

Annex IIIPage 10
22. The package of incentives granted by the Government to investorsin Mauritius is one of the most generous in the world (Appendix I). Apartfrom the fiscal advantages offered under the Development Certificate andExport Enterprise schemes (see below), investors are provided liberal fi-nancing through the Development Bank. The Bank has also set up industrialestates with all the necessary infrastructure, generally divided into plotswith standard factory buildings. Investors are thus saved some of the ini-tial capital, time and effort needed to secure authorization from a varietyof authorities for land and utilities. Two major schemes near Port Louis,at Plaine Lauzun and Coromandel, have been completed and partly occupied,while plans are afoot to develop some land at Beau Vallon, followed by Vacoas-Phoenix (both south-east of Port Louis) for the same purpose.
The Development Certificate Scheme
23. Between 1964 and 1970, the Government's main means of stimulatingindustrial development consisted of granting "Development Certificates"to those entrepreneurs who seemed best able to carry out projects in a selec-ted group of import-substitution industries considered to be of importance tothe island's economy. Development Certificates are still issued and entitlecompanies to many benefits, the most important of which are import dutyexemption or rebates on materials and equipment, a five-to-eight year companytax holiday (depending on depreciation allowances taken), exemption fromincome tax on dividends, free repartriation facilities. Companies may qualifyfor long-term loans from the Development Bank for up to 50 percent of capitalemployed. Enterprises in certain activities undertake, in exchange, tomaintain prices at agreed levels, and cannot increase them without governmentapproval (a 15 percent annual return on paid-in capital is generally consideredappropriate by Government in approving price increases).
24. In the beginning, new Development Certificate companies facedconsiderable consumer resistance to locally-produced goods, as well ascompetition from traditional importers, who tried to drive them out of themarket through dumping and other tactics. Nevertheless, by the end of1975, Certificates had been issued to about 100 companies, of which morethan 80 had gone into production employing a total of approximately 5,500workers. About 80 percent of these were male. Applications from 97 otherenterprises had been approved or were still under consideration, with atotal potential employment of 4,400. The enterprises established under thescheme cover a wide range of industries, including food and drinks, vegetableoils and fats, chemical products, iron and steel goods, garments, furniture,plastic goods, etc. As of March 1976, food processing and related industriesaccounted for nearly one third of total employment by Development Certificatecompanies, paints and other chemical-related industries for another 16 percent,shipping (including repairs) for 13 percent, metal products 10 percent andgarments 8 percent. The limited size of the local market resulted in

Annex IIIPage 11
generally low rates of plant utilization (60 to 75 percent of single-shiftcapacity in most cases) until the early 1970s, while the small size of manyunits did not allow them the economies of scale necessary to compete in exportmarkets.
The Export Processing Zone Scheme
25. With opportunities for import-substitution more or less exhausted inthe 1960s, a worldwide study of industry by a Government-sponsored mobile teamled to the idea of offering an attractive package of incentives to overseasmanufacturing firms with well-established markets, in order to lure them intotransferring part or all of their manufacturing activities to Mauritius.Under the Export Processing Zone Act of December 1970, an enterprise settingup a bonded factory to sell its entire output outside Mauritius is granted aten-to-twenty year company tax holiday on retained earnings, tax-free dividendsin the first five years, and duty-free import of machinery and raw materials.Other benefits offered include: free repatriation of profits and capital,liberal work permits for specialist expatriate staff, export financing atpreferential rates, supply of power and water at subsidized rates, and,initially, relaxation from provisions of certain labor laws. The Governmenthas defined the types of industries it considers desirable as those with highvalue added and low weight-high value inputs and products. Priority is givento industries which are highly labor-intensive or create substantial indirectemployment opportunities, and which introduce new technology and marketingknow-how. In practice, the approval of new industries has not always systemati-cally taken these factors into account and has sometimes also been dictated byother considerations, for example, the shortage of water for industrial use inthe Coromandel area.
26. By the end of 1975, a total of 66 enterprises were operating underthe Export Processing Zone Scheme, with an employment of 11,400, of whichover 85 percent were female. Twenty-four other companies had been grantedcertificates and about 90 more applications were under consideration, witha further employment potential of nearly 20,000. Textiles and garments,electronic components, footwear and toys have been the most importantindustries established. The predominance of textiles and electroniccomponents follows the pattern of industrialization in other countries,such as Hong Kong, Singapore, South Korea and Taiwan, which have offeredexport processing incentives. While most of the investment has come fromoverseas, the Government (through the Development Bank) has encouragedcooperation between est:ablished foreign manufacturers and local entrepre-neurs who lack the know-how and the export marketing organization. Aminimum of 30 percent Jocal participation is now encouraged in all newenterprises.
Annex IIIPage 12
III. SECTORAL RESULTS
A. Output
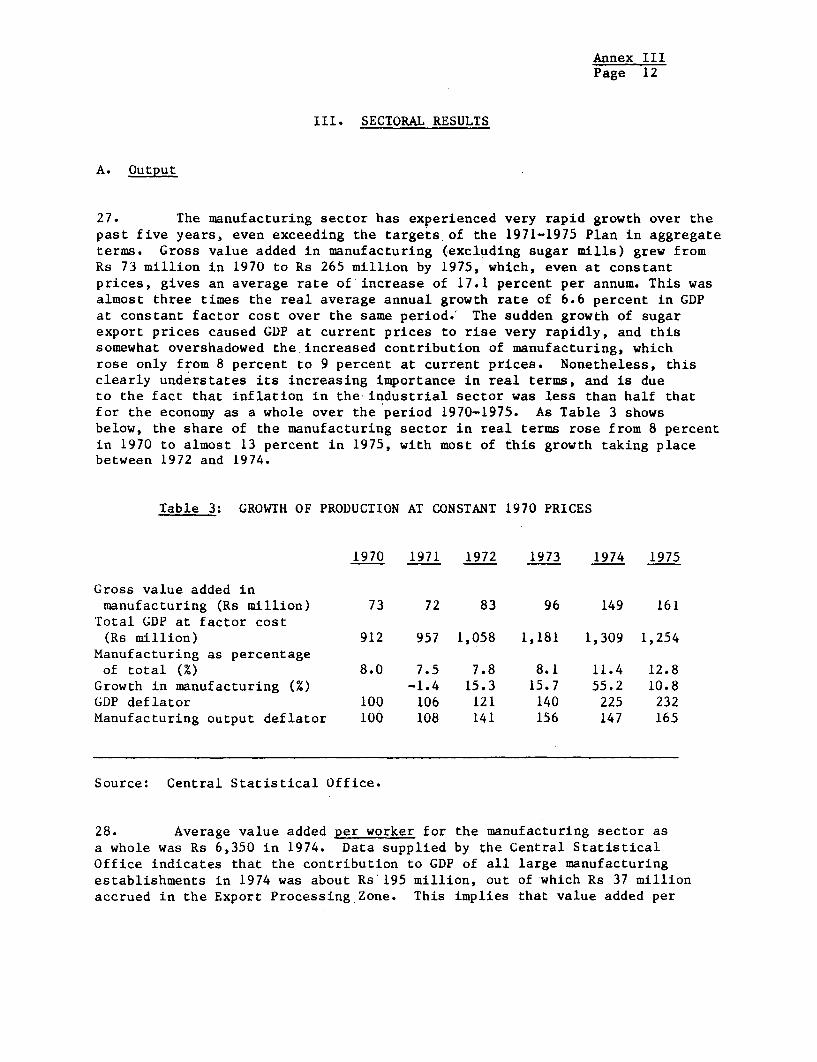
27. The manufacturing sector has experienced very rapid growth over thepast five years, even exceeding the targets, of the 1971-1975 Plan in aggregateterms. Gross value added in manufacturing (excluding sugar mills) grew fromRs 73 million in 1970 to Rs 265 million by 1975, which, even at constantprices, gives an average rate of increase of 17.1 percent per annum. This wasalmost three times the real average annual growth rate of 6.6 percent in GDPat constant factor cost over the same period. The sudden growth of sugarexport prices caused GDP at current prices to rise very rapidly, and thissomewhat overshadowed the increased contribution of manufacturing, whichrose only from 8 percent to 9 percent at current prices. Nonetheless, thisclearly understates its increasing importance in real terms, and is dueto the fact that inflation in the industrial sector was less than half thatfor the economy as a whole over the period 1970-1975. As Table 3 showsbelow, the share of the manufacturing sector in real terms rose from 8 percentin 1970 to almost 13 percent in 1975, with most of this growth taking placebetween 1972 and 1974.
Table 3: GROWTH OF PRODUCTION AT CONSTANT 1970 PRICES
1970 1971 1972 1973 1974 1975
Gross value added inmanufacturing (Rs million) 73 72 83 96 149 161
Total GDP at factor cost(Rs million) 912 957 1,058 1,181 1,309 1,254
Manufacturing as percentageof total (%) 8.0 7.5 7.8 8.1 11.4 12.8
Growth in manufacturing (%) -1.4 15.3 15.7 55.2 10.8GDP deflator 100 106 121 140 225 232Manufacturing output deflator 100 108 141 156 147 165
Source: Central Statistical Office.
28. Average value added per worker for the manufacturing sector asa whole was Rs 6,350 in 1974. Data supplied by the Central StatisticalOffice indicates that the contribution to GDP of all large manufacturingestablishments in 1974 was about Rs' 195 million, out of which Rs 37 millionaccrued in the Export Processing Zone. This implies that value added per

Annex IIIPage 13
worker was about Rs 4,500 in Export Processing Zone enterprises, as com-pared with an average of Rs 13,700 in other large establishments. Moreover,the ..otal contribution to GDP of small-scale enterprises works out toRs 21 million, with a value-added per worker of Rs 1,500 (as comparedto Rs 9,750 for large establishments as a whole).
B. Exports
29. Concurrently with the expansion in manufacturing output since 1970,there was also a major increase in the value of total manufactured exportsbetween 1970 and 1975. The average growth rate in value of manufacturedexports over this period was 103 percent a year, with most significantincreases in clothing and electronic components, in line with the direction ofinvestment in the Export Processing Zone. As a result, the share of manufac-turing in total domestic exports (excluding re-exports) from Mauritius rosemore than sevenfold from 1.6 percent to 11.6 percent:
Table 4: EXPORTS OF MANUFACTURED GOODS AT CURRENT PRICES(FOB value, in millions of Rupees)
1970 1971 1972 1973 1974 1975
Processed diamonds and stones 1.0 2.4 5.3 19.7 22.5 9.3Electronic components ifor - - - 5.3 48.6 62.1machines
Clothing 0.2 1.7 6.1 20.6 60.8 118.2Other 4.7 7.1 7.4 7.4 11.1 13.2
Total manufacturing 5.9 11.2 18.8 53.0 143.0 202.8
Annual growth inmanufactured exports (%) 89.8 67.9 181.9 169.8 41.8
Total domestic exports 375.1 355.7 566.1 737.7 1,771.0 1,818.0Manufacturing as percentageof total (%) 1.6 3.1 3.3 7.2 8.1 11.6
Source: Annual Reports, Customs and Excise Department.
30. Most of the growth in exports occurred in 1973 and 1974, when someof the earliest units set up in the Export Processing Zone were coming intofull production and demand in the industrialized countries was booming. How-ever, due to a variety of short-run factors (discussed in para. 56 below), themomentum of growth slowed down noticeably in 1975.

Annex IIIPage 14
C. Investment
31. The substantial increase in manufacturing output over the period1970-1975 was made possible by even more dramatic growth in total investmentin this sector. In constant 1970 prices, gross fixed capital formation inall manufacturing activities increased at a 53 percent average annual ratefrom Rs 16 million in 1970 to Rs 88 million in 1974. Since real investmentin the economy as a whole increased at just over 25 percent per annum onaverage, the share of manufacturing in total gross fixed capital formationgrew from 11 percent to nearly 25 percent. This is indicated in Table 5below:
Table 5: GROSS FIXED CAPITAL FORMATION IN CONSTANT 1970 PRICES(in millions of Rupees)
1970 1971 1972 1973 1974
Manufacturing 16 24 30 48 88Total 145 172 194 303 359Manufacturing as percentageof total (%) 11.0 14.0 15.5 15.8 24.5
Annual growth inmanufacturing (%) 50.0 25.0 60.0 83.3
Source: Central Statistical Office.
32. Owing to inadequate data, it is not entirely possible to separateout sugar milling from investment in other manufacturing activities. However,statistics supplied by the Mauritius Sugar Producers Association indicatethat, for miller planters alone, 35 percent of total investment of sugarearnings between 1972 and 1974 was in non-sugar activities, and 70 percentof this again was in non-trade investments. When this is combined withother investments by foreign and domestic entrepreneurs, the total magnitudesin non-sugar manufacturing appear to have been substantial.
D. Employment
33. Corresponding to the creditable performance in terms of grossoutput and capital formation in manufacturing, there was a similar increasein this sector's share of total employment provided. Between 1970 and 1975,employment in large manufacturing establishments (employing 10 or morepersons) grew at an average rate of 22 percent per annum, as comparedto a 6 percent average growth rate for all sectors combined (see Table 6 below).As in the case of manufacturing output, most of this growth in employment tookplace between 1972 and 1974, with a distinct deceleration in 1975 due to a

Annex IIIPage 15
number of short-run factors which will be discussed later. The average in-crease in all manufacturing employment (large- and small-scale) between 1970and 1975 turns out to have been around 16 percent per annum. This figure, whencompared with the real aanual growth rate in manufacturing output of 17.1 per-cent, yields a statistic of 0.94, which is most impressive and inclicates thatthe drive toward labor-intensive industries has been quite successful on thewhole.
Table 6: EMPLOYMENT IN LARGE ESTABLISHMENTS IN THE MANUFACTURtNG SECTOR
Year Employment in Manufacturing as(as of Sept.) Total employment manufacturing percentage of
total (%)
1970 129,570 8,336 6.41971 141,714 9,775 6.91972 147,521 11,576 7.81973 157',787 15,722 10.01974 167,328 20,673 12.41975 173,791 22,483 12.9
Source: Bi-Annual Digest of Statistics.
34. Some idea of the directions of growth within the manufacturingsector itself can be obitained from analysis of available data on employmentin large establishments by various sub-sectors. Electrical machinery (includ-ing components), wearing apparel, furniture and food have been the highestgrowth sectors, while the increase in employment has been much slower inprinting and publishing and textile manufacture. It is significant to notethat employment in consumer goods industries as a whole increased at anaverage annual rate of 26.6 percent, and more than tripled over the period1970-1975. In contrast to this, employment in intermediate and capital goodsindustries grew on an average at only 14.8 percent per annum, and approximatelydoubled over the same period. As a result, the share of consumer goodsindustries increased from about 56 percent to 68 percent of all manufacturingemployment.
35. Although accurate data on employment growth in small-scale enter-prises is lacking, estimates have been made in a recent study by Mr. Lindahland others, based on a 1972 Housing Census which surveyed the use to whichbuildings were being put. These sources indicate that small industriesbenefited from the growth of the economy in general during 1968-1974, withemployment growing at more than 10 percent a year and almost doubling overthe period. However, various sub-sectors have had different growth ratessince 1968; furniture-making and manufacture of footwear and other wearingapparel, for example, have grown almost three times as fast as food processing(bakeries, dairies, etc.).

Annex IIIPage 16
Table 7: EMPLOYMENT BY SUB-SECTOR IN LARGE MANUFACTURING ESTABLISHMENTS
(as of September)
Industrial Group 1970 1971 1972 1973 1974 1975 Average annualgrowth rate (X)
. . _______________ (1970-75)
Food 767 1,070 1,254 1,571 1,881 1,955 20.6
Beverages andtobacco 1,272 1,354 1,499 1,557 1,787 1,995 9.4
Textile manufac-ture (incl. aloefiber) 737 860 698 646 829 922 6.2
Wearing apparel 730 1,449 2,634 4,472 7,079 8,004 61.4
Wood and furniture 299 389 571 835 913 904 24.8
Printing andpublishing 702 784 784 962 1,064 986 7.0
Rubber andleather products 158 188 205 409 385 341 16.6
Chemical products 347 437 482 487 604 790 17.9
Non-metallicmineral products 619 603 638 846 910 980 9.6
Metal products 358 506 588 827 785 795 17.3
Machinery repairs 566 552 599 517 600 647 2.7
Electricalmachinery 149 151 161 837 2,023 1,731 63.3
Transportequipment 1,317 626 752 938 964 977 -6.2
Miscellaneous 315 806 711 818 900 1,386 34.5
Total 8,336 9,775 11.576 15,722 20,673 22.483 21.9
Source: Bi-Annual Digest of Statistics.

Annex IIIPage 17
E. The Export Processing Zone Scheme
36. Whereas most industrial development in the 1960s was in import-substituting activities, the orientation of investments changed rapidly inthe early 1970s toward export products under the Export Processing ZoneScheme. Out of about L3,000 new jobs created in large manufacturing esta-blishments over the five years to 1975, more than 11,000 were in ExportProcessing enterprises. Table 8 below shows the spectacular growth inthese enterprises over the period.
Talble 8: GROWTH IN EPZ INDUSTRIES
Year No. of enterprises Total employment Proportion of(as of Dec.) female workers (D
1971 9 644 671972 19 2,588 851973 32 5,721 871974 45 8,969 881975 66 11,401 85
Source: Ministry of Commerce and Industry.
37. By March 1976, total employment in export enterprises had grown toabout 12,600, accounting for over half of all employment in large manufactur-ing establishments. FLowever, about 85 percent of these workers are women,who provide a relativEly cheaper source of labor (with a lower minimum wage)for the more dexterouEs tasks in garments, electronics assembly and similarindustries, which are still the major generators of employment in theExport Processing Zone. This imbalance in the sex distribution of workersis undesirable both in terms of both increased vulnerability and the existingbacklog of unemployed male workers.
Table 9: EMPLOYMENIT BY INDUSTRIAL GROUP IN THE EXPORT PROCESSING ZONE(December. 1975)
Percentage share inIndustrial group No. of enterprises Employment total employment (%)
Food 5 62 0.5Electronics 4 1,524 13.4Textiles 31 8,434 74.0Others 26 1,381 12.1
Total 66 11,401 100.0
Source: Ministry of Commerce and Industry.
Annex IIIPage 18
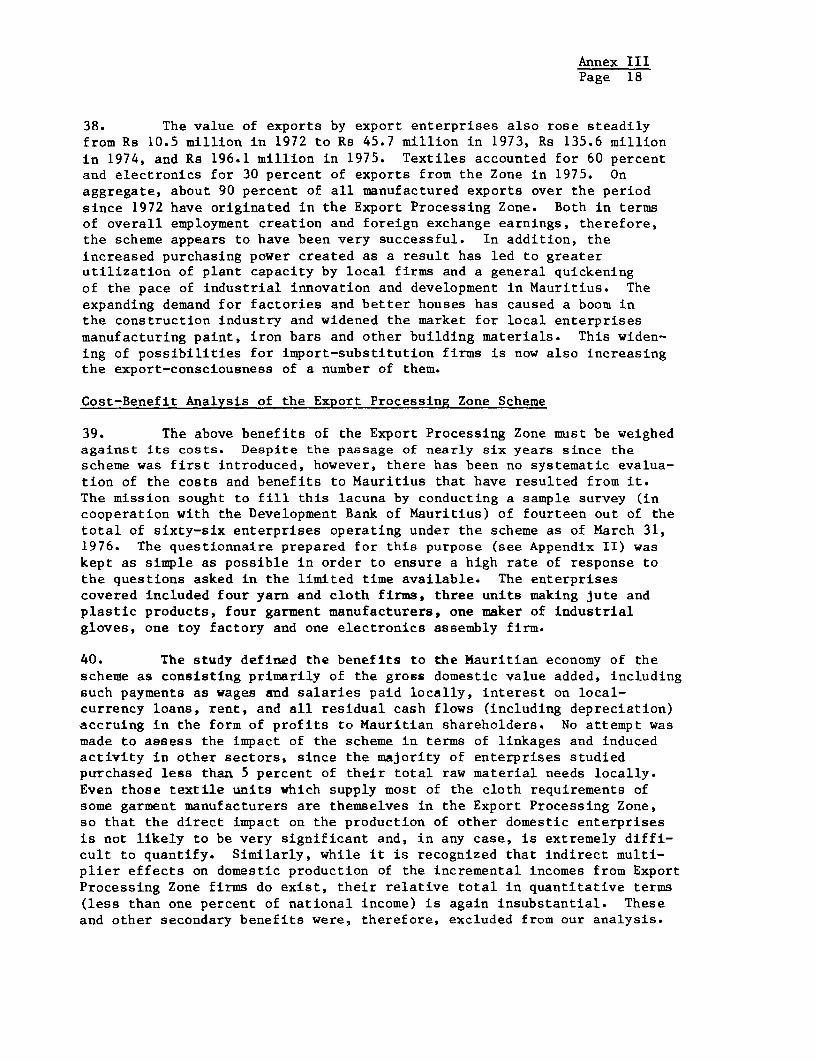
38. The value of exports by export enterprises also rose steadilyfrom Rs 10.5 million in 1972 to Rs 45.7 million in 1973, Rs 135.6 millionin 1974, and Rs 196.1 million in 1975. Textiles accounted for 60 percentand electronics for 30 percent of exports from the Zone in 1975. Onaggregate, about 90 percent of all manufactured exports over the periodsince 1972 have originated in the Export Processing Zone. Both in termsof overall employment creation and foreign exchange earnings, therefore,the scheme appears to have been very successful. In addition, theincreased purchasing power created as a result has led to greaterutilization of plant capacity by local firms and a general quickeningof the pace of industrial innovation and development in Mauritius. Theexpanding demand for factories and better houses has caused a boom inthe construction industry and widened the market for local enterprisesmanufacturing paint, iron bars and other building materials. This widen-ing of possibilities for import-substitution firms is now also increasingthe export-consciousness of a number of them.
Cost-Benefit Analysis of the Export Processing Zone Scheme
39. The above benefits of the Export Processing Zone must be weighedagainst its costs. Despite the passage of nearly six years since thescheme was first introduced, however, there has been no systematic evalua-tion of the costs and benefits to Mauritius that have resulted from it.The mission sought to fill this lacuna by conducting a sample survey (incooperation with the Development Bank of Mauritius) of fourteen out of thetotal of sixty-six enterprises operating under the scheme as of March 31,1976. The questionnaire prepared for this purpose (see Appendix II) waskept as simple as possible in order to ensure a high rate of response tothe questions asked in the limited time available. The enterprisescovered included four yarn and cloth firms, three units making jute andplastic products, four garment manufacturers, one maker of industrialgloves, one toy factory and one electronics assembly firm.
40. The study defined the benefits to the Mauritian economy of thescheme as consisting primarily of the gross domestic value added, includingsuch payments as wages and salaries paid locally, interest on local-currency loans, rent, and all residual cash flows (including depreciation),accruing in the form of profits to Mauritian shareholders. No attempt wasmade to assess the impact of the scheme in terms of linkages and inducedactivity in other sectors, since the majority of enterprises studiedpurchased less than 5 percent of their total raw material needs locally.Even those textile units vhich supply most of the cloth requirements ofsome garment manufacturers are themselves in the Export Processing Zone,so that the direct impact on the production of other domestic enterprisesis not likely to be very significant and, in any case, is extremely diffi-cult to quantify. Similarly, while it is recognized that indirect multi-plier effects on domestic production of the incremental incomes from ExportProcessing Zone firms do exist, their relative total in quantitative terms(less than one percent of national income) is again insubstantial. Theseand other secondary benefits were, therefore, excluded from our analysis.
Annex IIIPage 19
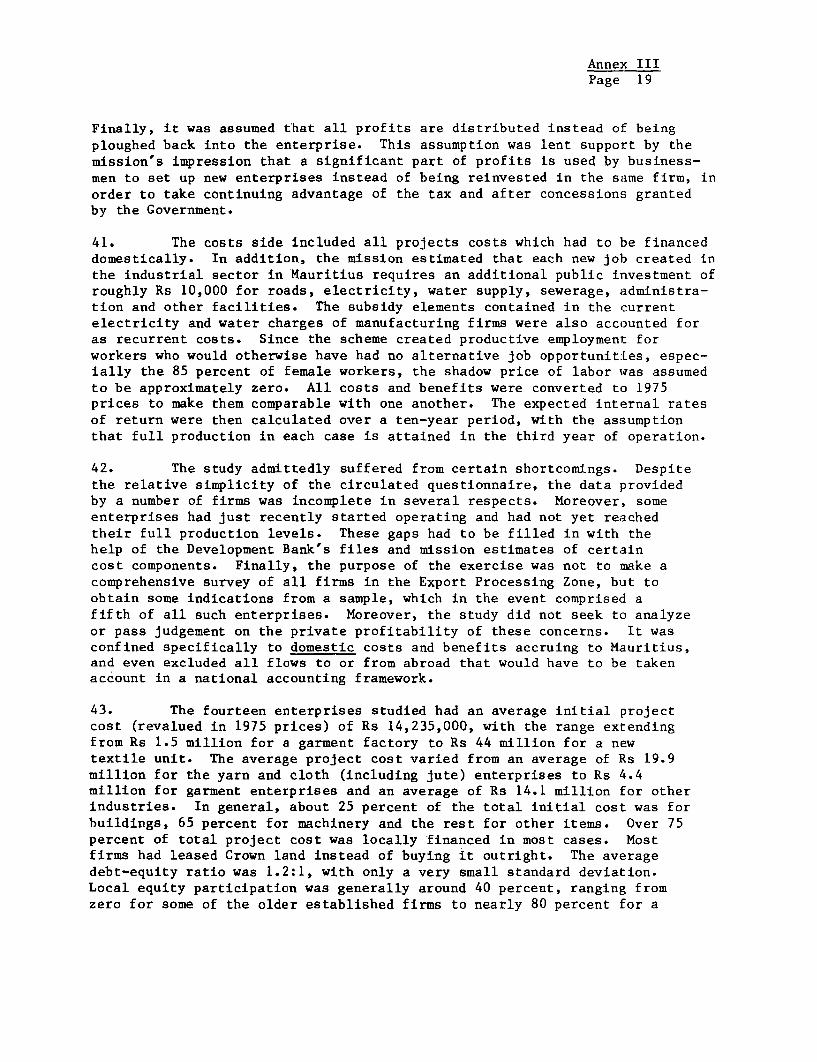
Finally, it was assumed t'hat all profits are distributed instead of beingploughed back into the enterprise. This assumption was lent support by themission's impression that a significant part of profits is used by business-men to set up new enterprises instead of being reinvested in the same firm, inorder to take continuing advantage of the tax and after concessions grantedby the Government.
41. The costs side included all projects costs which had to be financeddomestically. In addition, the mission estimated that each new job created inthe industrial sector in 'Mauritius requires an additional public investment ofroughly Rs 10,000 for roads, electricity, water supply, sewerage, administra-tion and other facilities. The subsidy elements contained in the currentelectricity and water charges of manufacturing firms were also accounted foras recurrent costs. Since the scheme created productive employment forworkers who would otherwise have had no alternative job opportunities, espec-ially the 85 percent of female workers, the shadow price of labor was assumedto be approximately zero. All costs and benefits were converted to 1975prices to make them comparable with one another. The expected internal ratesof return were then calculated over a ten-year period, with the assumptionthat full production in each case is attained in the third year of operation.
42. The study admittedly suffered from certain shortcomings. Despitethe relative simplicity of the circulated questionnaire, the data providedby a number of firms was incomplete in several respects. Moreover, someenterprises had just recently started operating and had not yet reachedtheir full production levels. These gaps had to be filled in with thehelp of the Development Bank's files and mission estimates of certaincost components. Finally, the purpose of the exercise was not to make acomprehensive survey of all firms in the Export Processing Zone, but toobtain some indications from a sample, which in the event comprised afifth of all such enterprises. Moreover, the study did not seek to analyzeor pass judgement on the private profitability of these concerns. It wasconfined specifically to domestic costs and benefits accruing to Mauritius,and even excluded all flows to or from abroad that would have to be takenaccount in a national accounting framework.
43. The fourteen enterprises studied had an average initial projectcost (revalued in 1975 prices) of Rs 14,235,000, with the range extendingfrom Rs 1.5 million for a garment factory to Rs 44 million for a newtextile unit. The average project cost varied from an average of Rs 19.9million for the yarn and cloth (including jute) enterprises to Rs 4.4million for garment enterprises and an average of Rs 14.1 million for otherindustries. In general, about 25 percent of the total initial cost was forbuildings, 65 percent for machinery and the rest for other items. Over 75percent of total project cost was locally financed in most cases. Mostfirms had leased Crown land instead of buying it outright. The averagedebt-equity ratio was 1.2:1, with only a very small standard deviation.Local equity participation was generally around 40 percent, ranging fromzero for some of the older established firms to nearly 80 percent for a

Annex IIIPage 20
recently set-up garment factory. This is clearly consistent with theGovernment's declared policy of encouraging a minimum of 30 percent localequity participation in all new enterprises in the Zone.
44. The average full-production employment of firms in the surveywas 385 workers (500 for garments), thus giving an average project costper job of about Rs 37,000. The latter again varied from Rs 86,400 foryarn and cloth (including jute) to Rs 9,000 for the average garmentfactory. Wages paid to Mauritian workers (including supervisors) cameout to be roughly Rs 290 a month. The average gross domestic valueadded per worker at full production was Rs 6,500, which was 17 percentof the total value of production, and varied from Rs 12,100 for yarnand cloth (including jute) to Rs 4,300 for garments and Rs 3,700 forelectronics assembly. On average, 53 percent of this value added was inthe form of wages and salaries, 15 percent in profits, 14 percent eachin interest and depreciation, and 4 percent in lease payments for land.The average annual subsidy per worker for electricity and water at fullproduction was Rs 413, ranging from Rs 1,250 for yarn and cloth toRs 55 for garments and Rs 35 for toys. In aggregate, the fourteenenterprises in the sample represented about 33 percent of the totalfull production employment and 40 percent of gross domestic valueadded of all Export Processing Zone firms on MIarch 31, 1976.
45. The calculation of the internal rates of return from the domesticcosts and benefits of export enterprises yields some very interesting results.The rates of return in the four yarn and cloth manufacturers show wide varia-tions between + 7.5 percent and - 8.7 percent. The group of three unitsmaking jute and plastic products have a rate of return of 11 percent, whilethe combined return on all seven textile firms (including jute) is 4.2 per-cent. Two out of these seven actually yield a negative return to theMauritian economy, while the net gain from the rest is marginal at best.Two other points on this group of textile firms are noteworthy here. Firstly,the rate of return to Mauritius as calculated above is, in each case, lessthan half the return that had originally been projected and claimed for theenterprise at its time of inception. Secondly, there is a direct positivecorrelation between the rates of return and the labor intensities of textilemanufacturing firms - that is, the lower the project cost per worker employed,the higher, in general, is the return to the Mauritian economy. This resultis not entirely surprising and it has policy implications which will bediscussed later.
46. As for the four garments manufacturers, their rates of return varybetween + 6.6 percent and + 27.5 percent, with an average return of 16.7 per-cent. Within the group, again, there is a positive correlation between therate of return and labor intensity in the different enterprises. And, ofcourse, the garments group itself is almost ten times as labor-intensive asthe yarn and textiles group of industries. In general, therefore, the garment-making enterprises have been of direct positive benefit to the Mauritianeconomy in terms of value added. This conclusion of the survey is an en-couraging one in terms of the usefulness of the Export Processing Zone as awhole, since 26 out of the 66 enterprises operating under the scheme are
Annex IIIPage 21
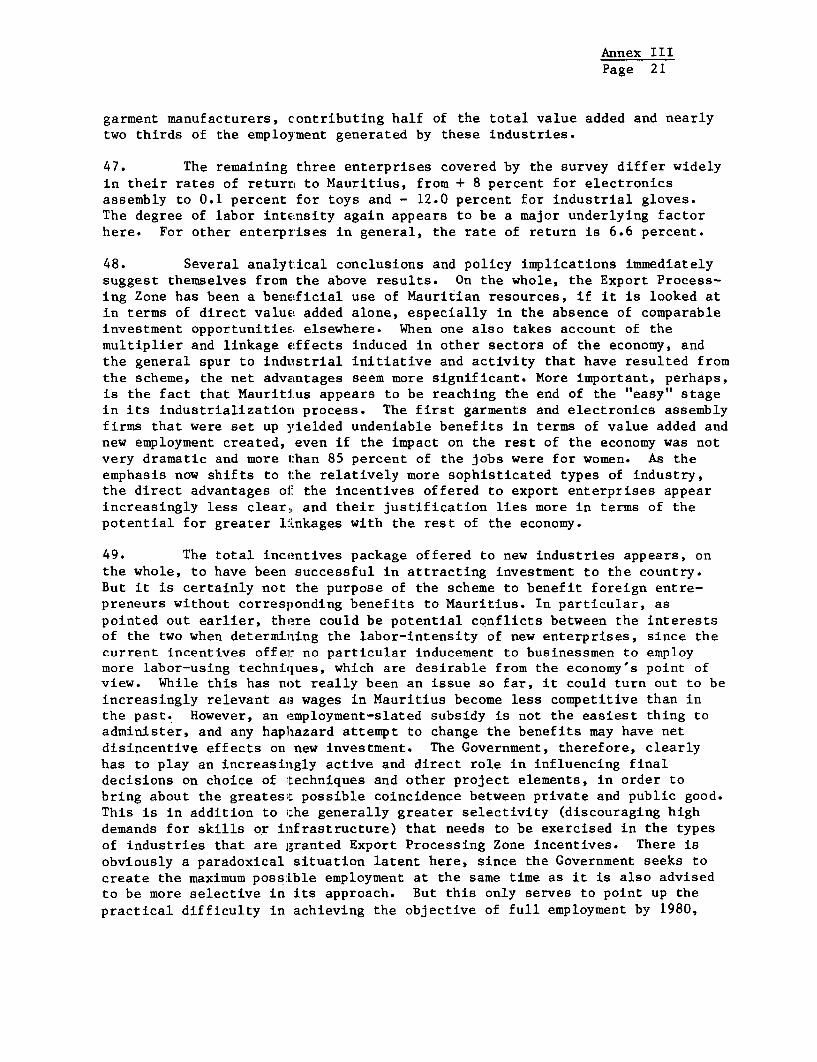
garment manufacturers, contributing half of the total value added and nearlytwo thirds of the employment generated by these industries.
47. The remaining three enterprises covered by the survey differ widelyin their rates of returr, to Mauritius, from + 8 percent for electronicsassembly to 0.1 percent for toys and - 12.0 percent for industrial gloves.The degree of labor intensity again appears to be a major underlying factorhere. For other enterprises in general, the rate of return is 6.6 percent.
48. Several analyt:ical conclusions and policy implications immediatelysuggest themselves from the above results. On the whole, the Export Process-ing Zone has been a beneficial use of Mauritian resources, if it is looked atin terms of direct value added alone, especially in the absence of comparableinvestment opportunities elsewhere. When one also takes account of themultiplier and linkage effects induced in other sectors of the economy, andthe general spur to industrial initiative and activity that have resulted fromthe scheme, the net advantages seem more significant. More important, perhaps,is the fact that Mauritius appears to be reaching the end of the "easy" stagein its industrialization process. The first garments and electronics assemblyfirms that were set up yielded undeniable benefits in terms of value added andnew employment created, even if the impact on the rest of the economy was notvery dramatic and more 1:han 85 percent of the jobs were for women. As theemphasis now shifts to t:he relatively more sophisticated types of industry,the direct advantages ol the incentives offered to export enterprises appearincreasingly less clear, and their justification lies more in terms of thepotential for greater lilnkages with the rest of the economy.
49. The total incentives package offered to new industries appears, onthe whole, to have been successful in attracting investment to the country.But it is certainly not the purpose of the scheme to benefit foreign entre-preneurs without corresponding benefits to Mauritius. In particular, aspointed out earlier, there could be potential conflicts between the interestsof the two when determining the labor-intensity of new enterprises, since thecurrent incentives offer no particular inducement to businessmen to employmore labor-using techniqlues, which are desirable from the economy's point ofview. While this has not really been an issue so far, it could turn out to beincreasingly relevant as wages in Mauritius become less competitive than inthe past. However, an employment-slated subsidy is not the easiest thing toadminister, and any haphazard attempt to change the benefits may have netdisincentive effects on new investment. The Government, therefore, clearlyhas to play an increasingly active and direct role in influencing finaldecisions on choice of itechniques and other project elements, in order tobring about the greatesit possible coincidence between private and public good.This is in addition to :he generally greater selectivity (discouraging highdemands for skills or infrastructure) that needs to be exercised in the typesof industries that are granted Export Processing Zone incentives. There isobviously a paradoxical situation latent here, since the Government seeks tocreate the maximum possLble employment at the same time as it is also advisedto be more selective in its approach. But this only serves to point up thepractical difficulty in achieving the objective of full employment by 1980,
Annex IIIPage 22
especially in the light of emerging constraints in infrastructure and trainedmanpower.
Analysis of the Development Certificate Scheme
50. A similar evaluation to the one for EPZ incentives was performed forthe Development Certificate scheme. The survey covered thirteen out of abouta hundred enterprises operating under the scheme as of March 31, 1976. Onegarment factory, four food-related enterprises, a hotel, a fertilizer plant,three manufacturers of paper products and three of soap, detergents and toi-letries were included in the analysis. Questionnaires were also sent to twometal-related industries but lack of meaningful and complete data precludedtheir inclusion in the final evaluation. The costs and benefits from enter-prises under the Development Certificate scheme were defined in exactly thesame way as for the evaluation of Export Processing Zone enterprises.
51. Twelve of the enterprises studied had an average initial projectcost (revalued in 1975 prices) of Rs 9,242,000, varying from Rs 15.6 mil-lion for food-related enterprises to Rs 6 million for paper products. Thefertilizer Plant was put up at a cost of Rs 106,156,000. Except for somefirms established before the start of the Export Processing Zone, theoverwhelming majority of Development Certificate enterprises were almost100 percent locally-financed. The debt-equity ratio showed considerablevariation among industries, ranging between 2:1 and 0.8:1. The averageemployment in the firms surveyed was 108 workers, thus giving an averageproject cost per job (in 1975 prices) of almost Rs 86,000, with a rangefrom Rs 231,000 for a detergent factory to Rs 47,000 for a stationerymanufacturer. Wages paid to Mauritian workers (including supervisors andtechnicians) came to roughly Rs 480 per month. The average gross domesticvalue added per worker was Rs 21,800 for all units except the fertilizerplant, for which the corresponding figure was Rs 106,500. About half thegross value added accrued in the form of profits, 25 percent as deprecia-tion, and the remainder as wages and interest.
52. In comparison with export enterprises, the average project costwas about 35 percent smaller in Development Certificate firms generally,while employment per firm was almost one fourth that in the Export Process-ing Zone. As a result, both the project cost and value added per workerwere about three times as high in Development Certificate enterprises asin the Export Processing Zone. Wages, interestingly enough, were almosttwo thirds higher on an average in Development Certificate firms than inexport enterprises, this being a direct result of the greater proportion ofwomen employed in the latter. Yet it is interesting to note that a signifi-cantly higher percentage of value added accrues as profits than as wages inDevelopment Certificate enterprises.
53. The internal rates of return calculated from domestic costs andbenefits turn out to be greater on average for Development Certificate enter-prises than for the Export Processing Zone. With a high gross domestic valueadded, the rates of return vary between + 7.7 percent and + 30.3 percent.
Annex IIIPage 23
Among industrial groups, there is some variation over a range from 11.6 per-cent for food-related firms to 19.3 percent for paper products. Within eachindustrial group, there again seems to be a definite positive correlationbetween the rate of return and the degree of labor intensity of the project.This conclusion lends further support to our earlier recommendation for amore active government role in the project formulation process. Moreover, thegenerally high return to the Mauritian economy from Development Certificatecompanies suggests that, even though opportunities in import-substitution mayhave been virtually exhausted, there could be significant potential gains fromencouraging existing Development Certificate enterprises to expand productionand markets overseas. This idea will be explored again later.
F. Explanation of Performance
54. Several overall factors have been responsible for the remarkableperformance of the manufacturing sector, and, in particular, of the ExportProcessing Zone Scheme, over the past five years.
(i) Supply-side factors: The most important factor on the supplyside has been the extremely liberal package of fiscal andother incentives granted under the Export Processing Zone Act.Tax-free dividends are a strong inducement to invest for localbusinessmen, and even though the tax advantages in themselvesmay not have been sufficient to attract foreign entrepreneurs,especially from countries with which Mauritius does not havedouble taxation agreements, they do serve as a powerful andobvious symbol of the Government's attitude of strong supportfor foreign private investment. In addition, ready financingwas generally available from the Development Bank and Localcommercial banks for all projects which offered reasonableprospects of an acceptable rate of return and some employmentgeneration. Finally, the low wages demanded by Mauritianlabor in the early 1970s, coupled with a generally highliteracy level and a productivity comparable to such countriesas India and Pakistan, were additional positive inducementsto foreign investors.
(ii) Demand-side factors: The single most important factorattracting investor interest in the Export Processing Zonewas, and still remains, the free access to the EuropeanEconomic Community granted to manufactured exports "originat-ing" from Mauritius, first under the Yaounde Convention andsubsequently, since 1975, under the Lome Convention. Mauritiuswas in a better position than other African, Caribbean andPacific countries to take advantage of the agreement with theEuropean Community, given the relative development of itsentrepreneurial class and its easily trainable labor force.It also had close cultural ties with countries like Hong Kong

Annex IIIPage 24
and India, from which most foreign entrepreneurs came. Many ofthese already had established contacts in the West European marketbut were reaching the limits of the European Economic Communityquotas assigned to their own countries for textiles and otherproducts. The period from 1971 to early 1974 also being one ofgenerally expanding economies and buoyant demand, particularlyin industrialized countries, Mauritius offered a useful launchingplace for exports to these growing markets. Domestic demand withinMauritius appears to have been a less important factor in themanufacturing boom, both because of the general prohibition againstExport Processing Zone enterprises selling more than a minor part oftheir production domestically, and because the effects of greatlyincreased sugar earnings did not begin to make themselves felt until1974.
(iii) Institutional factors: Institutional factors appear to have beenthe least significant element in the industrialization process ofMauritius in the early 1970s. It is true that some institutions,such as the Development Bank, have been strengthened, and thatentrepreneurs have been provided all administrative help in[getting established with a minimum of red tape. However, insti-tutions for overseas promotion of the Export Processing Zone and forthe development of new types of industries have been either entirelylacking, or weak and ineffectual. The success of the Zone inexpanding the manufacturing sector so far seems to have resultedmore from a favorable combination of supply and demand factors,within the conducive environment provided by Mauritius, than fromanything else. This is not to belittle the importance of a stableadministration, and official encouragement and support for privateinvestment generally, but simply points out the vital need forbuilding up the institutional base if the momentum of industrialdevelopment is to be sustained over the next few years.
IV. PROBLEMS AND ISSUES
55. The continuation of past growth trends in the manufacturing sectorlies at the core of the Government's strategy of achieving full employmentover the next few years. Many of the factors mentioned above will continueto operate in Mauritius' favor, especially the availability of relativelylow-cost and trainable labor, associate membership of the European EconomicCommunity, and the small size of the island's economy, which makes it lesslikely that its success would provoke demands for quota restrictions in othercountries. However, several issues have arisen as a result of policies anddirections of growth followed in the past, and the resolution of these wouldfurther facilitate future industrial development. In addition, a number offactors latent in both the domestic economy and the international environmenthold the potential of developing into major problems for Mauritius over the
Annex IIIPage 25
next several years. A full perception of these problems is, therefore,essential so that timely and appropriate policies can be formulated to dealwith them.
56. Perhaps the Elost immediately disturbing factor is that the rate ofgrowth in the manufacturing sector actually slowed down in 1975, thus breakingthe upward trend estab]ished between 1972 and 1974. It is likely, though,that this reining in of a previously galloping sector was the cumulative resultof several short-run factors, rather than of any fundamental change with long-term implications. The recession in industrial countries, and the consequentshrinkage in Mauritius' export markets, caused a decline in both new invest-ment from abroad and expansion of existing enterprises. The cyclone Gervaisecaused some damage to factory buildings and equipment and considerable disrup-tion in infrastructural facilities, such as water mains, electricity andtelephone lines. Finally, there was a sudden and substantial rise in reallabor costs because of wage awards granted with retrospective effect from ayear earlier, and production was disrupted by stoppages and go-slow tacticsby workers in the port and transport industries. As a result of all thesefactors, businessmen's confidence was somewhat shaken, so that the pipeline ofnew projects and investors' inquiries dried up completely towards the end of1975. Since the beginning of 1976, however, investor interest has picked upagain considerably, which suggests that the recession of 1975 was a transitoryrather than permanent phenomenon. Nevertheless, several longer-term factorsdo give major cause for concern that growth over the next five years may notbe quite as smooth or easy as in the past.
A. The International Environment
57. Demand in industrial economies began picking up again in 1976,following the slackening in 1974 and 1975. The World Bank's projections ofeconomic growth in OECD countries suggest that they will probably expand byabout 5 percent annually, on average, in the late 1970s. However, thesecountries have now also grown much more wary about inflation through un-controlled expansions in demand, and many of them are still working themselvesout of their recent balance of payments difficulties, thus making tradeprospects for Mauritius less bright than they would appear otherwise.
58. The uncertain trade outlook becomes even more critical for exportersfrom Mauritius when it is combined with the problems of securing reliable andfrequent external transport services, which are essential for any countrywishing to develop as an exporting center. Mauritius has the distinct disad-vantage of being situated a long distance away from its main export marketsand from the major transcontinental shipping and airline routes. Thus, airfreight costs to Paris are nearly four times as much as from, say, Tunis,while shipments by sea to Europe take two months on average (as compared witha few days to cross the Mediterranean). Twice as many enterprises in Mauritius

Annex IIIPage 26
import by sea as by air, while the proportion is reversed for exports. It isunusual in international trade for items like cheaper textile products andfurniture to be airfreighted on any significant scale, but this is often donein Mauritius and reflects the inadequacy of existing port facilities at PortLouis and the infrequent shipping services, which are a function of the smallvolume of total exports from Mauritius (other than sugar products). Certainconcessionary sea freight rates from Mauritius to Europe and other places havebeen negotiated, which are competitive with those from the Far East, but airtransportation is still frequently necessary to meet delivery dates. TheGovernment should continue its efforts to mitigate the locational disadvantageof Mauritius by negotiating for lower freight rates with airline and shippingcompanies, and by improving the efficiency of domestic port and airportfacilities.
59. The importance of the above factor becomes even more obvious inthe face of the growing challenge from geographically better-placed countriesoffering equally attractive incentives to foreign investors as Mauritius does.The Maghreb countries are already in the process of establishing closer linkswith the European Economic Community, with similar preferential treatment fortheir manufactured exports as those accorded to the African, Caribbean andPacific countries under the Lome Convention. The emergence of "free zones"in these and other relatively developed African economies is likely to posea much more significant competitive threat to Mauritius in luring foreigncapital and entrepreneurship than countries such as Singapore and Taiwan didin the past. This factor is important not only because it calls into questionthe relative attractiveness of Mauritius as an industrial center, but alsosince it implies a serious constraint on the Government's fexibility informulating its development policies. Any adverse change in the incentivespackage offered to exporters, for instance, even if it is compensated for byother benefits, could very easily be interpreted as a reflection of a generalstiffening in the Government's attitude toward foreign investors. Since apredictably favorable policy framework is one of Mauritius' major inducementsto new investment, this would argue strongly against any needless tamperingwith the incentives and facilities offered to entrepreneurs, and for a gener-ally cautious approach by the Government in making any alterations in itsestablished policies.
60. There is also a clear need for better publicity by the Governmentto increase overseas investors' awareness of the advantages Mauritius offersas an exporting center. In the past, promotion has been the responsibilityof Trade Attaches, with the Ministry of Commerce and Industry occasionally par-ticipating in trade fairs abroad. In France, the SOPROGI firm of consultantshas been doing useful work for Mauritius in this respect under bilateraltechnical assistance provided by the French Government. However, the overallpromotional effort by Mauritius so far has been small, and there is clearlyscope for a much more vigorous program in the light of the increasing competi-tion likely to be faced over the next few years. It would be useful to openan official promotion office in Europe, which could also assist Mauritianentrepreneurs in conducting market surveys and research. The Development Bank,

tannex IIIPage 27
with its knowledge of local opportunities and experience with foreign inves-tors, can also be usefully involved in promotion overseas. Concurrently withthe increased emphasis on promotion and market research, the Government wouldbe well-advised to support the establishment of quality standards acceptablein export markets. This would become particularly relevant with the entry oflocal firms in the expcort arena. The proposed UNDP-financed IndustrialServices Center should play a very useful role in this field.
B. The Domestic Environment
61. Several constraints are also beginning to emerge within theMauritian economy itself. The marked growth in domestic demand in theyears 1973 through 1975 was primarily a result of the windfall increasein sugar earnings, due to the rise in world sugar prices over this period.This experience is unlikely to repeat itself in the next five years and,consequently, the expansion of domestic demand in the immediate future willbe much less pronounced than in the recent past.
62. In addition to the slower growth of the economy in general, somevery real physical constraints are already beginning to affect the pace ofnew investment in manufacturing. The capacity of the construction industry,in terms of both materials and skilled workers, has been severely strainedin recent years, as windfall sugar earnings led to a boom in res:Ldentialhousing, which competed directly with the construction of factory buildingsand resulted in substantial and unprecedented increases in start-up costsof new projects. This problem may be expected to ease gradually with therise in bulk cement imports made possible by the expansion in cement packingcapacity, and with the establishment of more training facilities for skilledworkers and technicians. Nevertheless, it is likely to remain somewhat of abottleneck for the next few years at least.
63. Another problem for new industries is the dispersal of the workfQrce over a wide area, which, combined with an inadequate and over-stretchedpublic transportation system, has severely aggravated the problems of laborabsenteeism and high turnover. Two-hour long waiting lines of commuters forbuses are not an uncommon sight these days in Mauritius. It is clearlyimperative that the Government should urgently address itself to the presentmalaise in a transportation system. In addition, there should be an increasingorientation in government policies toward a more decentralized industriallocation strategy, base,i on the idea of taking jobs to the people, instead ofvice versa. This can be done both by continuing the present policy of settingup industrial estates near population centers away from the Port Louis area,and also by encouraging the spread of industries to rural areas, especiallynear sugar estates where the infrastructure and labor are readily available.
64. The importance of providing fully serviced industrial sites, throughestates or otherwise, is becoming particularly acute with the emerging physical
Annex IIIPage 28
constraints in infrastructure facilities, such as water supply, which maylimit future growth, at least over the next couple of years. The Governmenthas been debating for some time now whether to create a new Industrial EstatesAgency or to continue to administer the program through a strengthened unitwithin the Development Bank. This question needs to be resolved quickly, sothat responsibility can be definitely assigned to one body for the propercoordination of works at all levels and the provision of infrastructure aheadof demand. Related to this institutional issue is the Government's declaredintention in the Plan to create an Industrial Administrative Center as thesingle contact point between the administration and new industrialists, whonow have to deal with several local bodies and agencies. Such a Center couldbe even more useful if it also developed as a point of exchange and soundingboard for ideas between businessmen and the Government. It is hoped, therefore,that it would not suffer the fate of a similar proposal in the 1971-1975Development Plan, which never matured.
C. Labor-related Issues
65. Industrial wages in Mauritius have virtually doubled over the pasttwo years, without an equivalent increase in productivity.l/ Wages in Mauritiusare now about 15 percent higher than in India and Pakistan but still only onethird of wages in Hong Kong. The productivity of labor is estimated in arecent Bank supervision report by Mr. Currat to be comparable to the formertwo countries but only 25 to 30 percent lower than in Hong Kong. The futuretrend of development in labor relations is very much of a question mark,the resolution of which will depend on political and social, as well aseconomic, factors. As full employment is approached toward the early 1980s,labor is likely to become an increasingly volatile and unpredictable elementin the economy. Moreover, as more technologically sophisticated industriesare set up, the shortage of skilled craftsmen and technicians, already abottleneck in some areas, may begin to assume critical proportions. At pre-sent, vocational training is provided in several institituions, such as theIndustrial Trade Training Center at Bean Bassin, but the numbers trained sofar have not kept pace with the demand from new industries. There is need forsetting up new training facilities and for more effective coordination of thetraining programs conducted by the four Ministries (Education, Labor, Employ-ment and External Affairs) among whom the responsibility for vocational train-ing is currently split.
66. The idea is often advanced that the Mauritian labor force is well-educated, easily-trained and adaptable to new techniques. While this may besubstantially true, there are, in fact, few industries in Maurities (otherthan some microjewel enterprises and artisan shops) which demand a high de-gree of manual or manipulative skill. What may be more important are themanagement skills and labor discipline needed to maintain a high degree ofproductivity comparable to other countries. Low wages can continue to attract
1/ Procedures for wage determination are discussed in Chapter IV of Annex IV.

Annex TTIPage 29
overseas investors only if they are accompanied by high productivity. Whilemore facilities for technical training would definitely help, the problem willperhaps be ultimately resolved only by the growing familiarity of labor withthe nature and demand oE industrial work overtime, and by better motivationand control of the work force. The onus rests on the Government to facilitatethese changes and to brLng about greater stability and mutual understanding inlabor-management relations.
67. In the past, another problem from the perspective of the Mauritianeconomy has been the overwhelmingly large proportion of female labor in totalemployment created in the Export Processing Zone. Several causes underliethis phenomenon, includLng generally lower wage rates for female workers ofsimilar grade and skill, and their allegedly higher productivity in moredexterous types of work. The effect of this has been to by-pass the problemof unemployment and underemployment among male unskilled workers. While thiscan be expected to be partly alleviated as the pattern of new industrieschanges towards those requiring heavier types of work and evening shifts, theGovernment also needs to be more assertive in making the proportion of maleemployment a major criterion in future project approvals. However, the ideasometimes put forward of' a wage subsidy for male workers would be practicallyunworkable and open to abuse, besides being expensive, since Export ProcessingZone industrialists do not pay any taxes that could be increased to financethe subsidy. More to the point, perhaps, would be a gradual reduction in thecurrent wage differentials between male and female workers in industry.
D. The Directions of Growth
68. The Government: has as its long-term goal the development ofMauritius into a new industrial and exporting center, using low wages andliberal tax policies as the main incentives. Few industries completelysatisfy the requirements and problems of the Mauritian environment, andthere are some that should not be encouraged at this stage of its development,notably those that are highly skill- or capital-intensive, make heavy demandson public utilities, or require materials that are difficult to transport orhandle. In this context, the whole question of the appropriateness of theincentives package offered to new investors becomes relevant. It is clearthat the incentives currently offer no particular inducement to entrepreneursto use labor-intensive techniques of production (other than generally lowwages in the past) or tc employ a high proportion of males, both of whichwould be highly desirable from the perspective of the Mauritian economy.However, as pointed out earlier, any employment-related subsidy would be verydifficult to administer, while unnecessary changes in the incentives ingeneral could very well be misconstrued as having a net adverse effect by newinvestors.
69. Nevertheless, the Government is in the unique position, at thethe Development Bank, of being able to exercise moral suasion in [nfluencingbusinessmen to choose production techniques that are more desirabLe from a

Annex IIIPage 30
social point of view. Such a power, if judiciously used, can be even moreeffective than any specific change in incentives. At the same time, however,the incentives package that is currently offered does need to be made lessrigid, in order to create the right climate for major expansion in industryover the next few years. The Government should particularly consider givingincentives to local industries to launch export programs, perhaps also sub-sidizing the costs of approved export market surveys or collective adver-tising overseas by groups of entrepreneurs. The rules for Export ProcessingZone enterprises could also be relaxed by allowing them to sell domesticallywhenever the market is served only by imports. In addition, the Governmentshould continue its efforts to negotiate double taxation agreements with morecountries so that foreign businessmen can get the full benefit of tax conces-sions, and ways must be found of compensating them wherever such agreementsdo not exist.
70. The clear advantages to Mauritius of encouraging highly labor-inten-sive industries have already been mentioned above. In view of this fact, itis unfortunate that, except for some limited programs organized by the Develop-ment Bank and the Ministry of Commerce and Industry, small-scale industrieshave received little attention or been discriminated against in Mauritianplanning efforts and policies so far. Both in terms of investment per jobrequired and impact on the relatively poor segments of the population, small-scale enterprises offer significant untapped potential. Through a vigorouseffort to impart technical training and set quality standards, these enter-prises can be helped to integrate with the larger and more modern sector byregular sub-contracting in such industries as toys, wooden products, footwear,electrical appliances, sporting goods, and so on. To achieve this, the Gov-ernment would have to consider setting up a separate Small Industries Develop-ment Corporation, or at least to substantially strengthen the present SmallIndustries Unit in the Ministry of Commerce and Industry, in terms of both itsstaff and its powers relative to other divisions. The Government might alsostudy the possibility of providing subsidies to those Export Processing Zoneindustries which cooperate in establishing production and other links withsmall-scale enterprises. This would truly help the much-discussed "transferof technology" that has been a largely missing factor in the Zone so far.As a first step, some of the provisions in the present Investment Code, whichimply discrimination against smaller businessmen by not according to them theduty concessions granted to larger enterprises, would have to be substantiallymodified.
71. Not only has local ownership of industry in Mauritius been largelyconcentrated in the hands of a few large groups, but, in fact, the entireindustrialization effort so far has relied primarily on initiatives by entre-preneurs from abroad. This is clearly a sub-optimal situation, since it hashindered the institutionalization of the process of industrialization in theeconomy. The Government, in its 1976-77 Annual Budget, has proposed thesetting up of a Commercial and Investment Trust with an initial capital ofRs 5 million, subscribed to by the Development Bank, Government, the Bankof Mauritius and the State Commercial Bank. Under the present situation,some industrial groups have their own investment trusts, which operate
Annex IIIPage 31
independently of each other. However, the conservative mentality of the sugarsector as a whole has so far prevented it from making non-sugar investments onany significant scale, despite the presence of profitable opportunities. Theproposed Trust would give small savers (including sugar planters) the opportunityof equity participation in new enterprises, and would also make it easier toget together the minimum of 30 percent local participation in Export Processingfirms which is the Government's objective.
V. PROSPECTS
A. Employment
72. The Five Year Plan for Social and Economic Development (1976-80)projects an increase of 47,000 new jobs in manufacturing between 1974 and1980, as a major element. in the Government's program to achieve full employ-ment by the end of this decade. The Plan starts with the assumption thatthere were 30,000 jobs in manufacturing in 1974, though mission estimatesyield a figure closer to 34,000 as a more likely employment level in June ofthat year. This would leave a target of 43,000 new jobs to be created inmanufacturing over the Eiix years up to 1980. Given the ambitious nature ofthe full employment target, the likely constraints to industrial development,and future growth and policy prospects, it may be difficult to reach a targetof 43,000, though a figure closer to 39,000 new jobs in manufacturing overthis period does seem realistic. While the actual shortfall in jobs neededfor full employment in mranufacturing does not appear too great, the differencebetween the 39,000 likeLy jobs and the 47,000 projected by the Plan leads to amore significant gap in the expected growth in output (see para. 83 below).
73. Of the 39,000 new jobs in the manufacturing sector, about 27,000are expected to be creal:ed in the Export Processing Zone, 7,500 in other largemanufacturing establishmaents (including Development Certificate companies),and 4,500 in small-scale enterprises. These figures were derived by individ-ual analysis of each of the sub-sectors of manufacturing and projections basedon reasonable assumptions of growth. For the Export Processing Zone, detailedanalysis was first made of the enterprises already in operation by 1975, withthe assumption that new firms would reach more or less full production by thethird year on average (as in the past), and that there would be no interrup-tion in growth due to any sudden policy or environmental change. Under theseassumptions, it is projected that employment in the EPZ would expand fromabout 9,900 Jobs in June 1975 to 16,700 by June 1980 as a result solely ofexpansion of the 66 enterprises already in operation, since most of these wereset up as recently as 1974 and 1975. As for new enterprises that may reason-ably be expected to be iset up, the projects in the pipeline on December 31,1975 include 24 companies which had already been granted Export Processingcertificates but had nol: yet started operating, and 73 other companies whichhad also applied for a ,ertificate. These include 36 textile and garmentsmanufacturers, 12 elect:ronics and electrical appliance firms, and 9 foodprocessors. The proposed projects are generally more complex and use moremale labor that earlier projects in the same fields.

Annex IIIPage 32
74. An analysis of the pipeline of projects pending in March 1975 withthose in December 1975 and March 1976 led to the following conclusions, whichwere used as assumptions in the projections:
(i) applications in the pipeline turn over every two years onaverage (which corresponds to the average start-up time forprojects);
(ii) certificates are issued for about 75 percent of applicationsapproved every year;
(iii) around 90 percent of companies which are granted certificatesactually start production;
(iv) fifty percent of the employment target for each enterpriseis generally reached in the first year of production, and75 percent by the second year; full production is achievedby the third year of operation in most cases;
(v) the size of the pipellne has been growing by about 25 percentevery year.
75. It is interesting to note that over the Plan period, the projectedvolume of employment in the Export Processing Zone proved to be relativelyinsensitive to the fifth assumption about the rate of growth of the pipeline.This may seem surprising but is a natural outcome of the other four assump-tions, since the total time between application for a certificate and actualstart of production is estimated to be about two or three years on average.This means that applications for Export Enterprise certificates made in 1979and after would have hardly any impact on employment by 1980, while even thoseof 1978 would have only a marginal effect on an average. On the other hand,the projected volume of employment is extremely sensitive to the rapidity withwhich applications are processed and the time taken to achieve full produc-tion. The assumptions made here include provision for some improvement onpast performance in the former aspect, but a certain degree of conservatismin the latter is still in order, since many enterprises do not fully meettheir pre-production employment projections. It is, of course, true thatin the long run vigorous promotion and a rapid growth of the pipeline wouldhave to underlie a high growth of employment.
76. On the basis of these assumptions, the following forecasts have beenmade of likely employment levels in the Export Processing Zone until 1980.

Annex IIIPage 33
Table 10: EMPLOYMENT PROJECTIONS FORTHE EXPORT PROCESSING ZONE
Enterpcises operating New TotalYear in 1975 enterprises employment(as of June)
1975 9,900 - 9,9001976 13,200 800 14,0001977 15,700 3,300 19,0001978 16,100 8,000 24,1001979 16,400 13,200 29,6001980 16,700 18,800 35,500
Source: Mission estimates.
77. The ratio of male workers in total employment in existing ExportProcessing enterprises is expected to increase steadily from 14 percent inJune 1975 to 25 percent in June 1980. An analysis of recent applications forExport Processing certificates indicates that there is likely to be a trendamong new enterprises away from the simpler garments and electronics assemblyindustry, towards industries such as textile milling. This shifting composi-tion of production is likely to be accompanied by a desirable shift towardsmore male employment.
78. A similar analysis was done for Development Certificate projectsin the pipeline on December 31, 1975. The pipeline was assumed to grow atonly 10 percent every year, reflecting the relative exhaustion of import-substituion opportunities and the lesser emphasis to be given to DevelopmentCertificates in the future. However, projects were assumed to have a slightlyfaster rate of employment creation than in the Export Processing Zone duringthe three years to fu]l production. The following projections of totalemployment in Development Certificate companies resulted from this analysis.

Annex IIIPage 34
Table 11: EMPLOYMENT PROJECTIONS FORDEVELOPMENT CERTIFICATE COMPANIES
Enterprises operating New TotalYear in 1975 enterprises employment(as of June)
1975 5,300 - 5,3001976 5,500 500 6,0001977 5,600 1,200 6,8001978 5,700 2,100 7,8001979 5,800 3,500 9,3001980 5,900 5,300 11,200
Source: Mission estimates.
79. The ratio of male workers in total employment in DevelopmentCertificate companies is anticipated to increase from 75 percent in 1974to about 80 percent by 1980, based also on a shifting composition of thepipeline. Employment in other large-scale enterprises (without an ExportProcessing or Development Certificate), which remained more or less stagnantbetween 1970 and 1975, is projected to increase at a nominal rate of around 2percent a year from about 6,800 in 1975 to 7,800 in 1980.
80. Employment in small-scale industries (enterprises employing fewerthan 10 persons each) is estimated to have grown by more than 10 percent annuallybetween 1968 and 1974. However, growth slowed down considerably in 1975and 1976, when the level of domestic demand grew only slowly, and as demandgrowth is likely to be moderate in future, employment in small enterprisesis projected to continue at only 5 percent annually for the rest of thedecade. On this basis, employment in small-scale enterprises would grow fromabout 15,000 in 1975 to 19,000 in 1980. Over 90 percent of these workers arelikely to be male.
81. Combining the results of the above analyses for various manufac-turing subsectors, the following figures reflect the probable growth inemployment between 1975 and 1980.

Annex IIIPage 35
Table 12: EMP'LOYMENT CREATION IN THE MANUFACTURING SEC1'OR
PercentageYear Export Development Other large Total of male(as of Processing certificate estab- Small-scale manuf'ac- workers inJune) Zone companies lishments enterprises turing total (%)
1974 8,500 4,600 6,400 14,500 34,000 661975 9,900 5,300 6,800 15,000 37,000 661976 14,000 6,000 6,900 15,700 42,600 651977 19,000 6,800 7,000 16,500 49,300 621978 24,100 7,800 7,100 17,300 56,300 641979 29,600 9,300 7,200 18,100 64,200 641980 35,500 L1,200 7,300 19,000 73,000 65
Increase
1975-1980 27,000 6,600 900 4,500 39,000
Source: Mission estimates.
82. About 70 percent of employment creation in the manufacturing sectorbetween 1974 and 1980 is likely to be in the Export Processing Zone, nearly 20percent in other large establishments and over 10 percent in small-scaleenterprises. With the growing importance of the Export Processing Zone in thetotal manufacturing sect:or, the proportion of male workers may drop somewhatin early years, and thereafter is likely to increase againto around 65 percent.
B. Output
83. Average value added per worker in 1975 was approximately Rs 5,000 inexport establishments, Rs 16,000 in other large establishments and Rs 1,500 insmall-scale industries. The figure for all large establishments was Rs11,000, which compares with Rs 7,200 for the manufacturing sector as a whole.GDP and employment data indicate that average real productivity of manufacturingworkers fell by 10 percent between 1970 and 1972, rose 25 percent in 1973-1974alone, and remained more or less stagnant in 1975. The fall in overallmanufacturing productivity in the earlier years was at least partly caused bythe growing proportion of women workers (lower paid and less productive thanmen) in the Export Processing Zone. The rise in later years, on the otherhand, could have been induced by the real wage increases granted at that time,the incentive effects of which had worked themselves out by 1975.
84. Assuming a further slight decline in average productivity through1980, the employment projections made earlier lead to a total contribution toGDP by the manufacturing sector of Rs 495 million in 1980 (at 1975 prices).The corresponding figure in terms of 1974 prices is Rs 450 million, which is32 percent short of the Rs 660 million projected in the Plan. The breakdown of

Annex IIIPage 36
this output according to the type of enterprise is shown in Table 13. The under-assumption behind these projections is, of course, that the growth in outputwill not be constrained by a lack of demand, either domestically or in exportmarkets.
Table 13: GROWTH IN MANUFACTURING OUTPUT, 1974-1980(in millions of Rupees at constant 1974 prices)
Average1974 1980 annual increase
Total % Total % 1974-1980 (Z)
EPZ enterprises 37 17 160 36 27.0Other large-scale 161 73 260 58 8.3Small-scale
industries 21 10 30 6 5.0
Total sector 219 100 450 100 12.8
Source: Mission estimates (rounded).
85. Thus, the share of export enterprises in the total manufacturingoutput is likely to double over the six-year period in real terms, giventhe continuation of current trends and policies. The growth rate in theiroutput would be at least three to four times higher than in other manufactur-ing industries. On aggregate, even if the Plan assumption of a 20 percentincrease in labor productivity over the period is adopted, instead of theassumed zero increase, total manufacturing output would still be almost20 percent short of the Plan's target. In sum, real output and employmentin manufacturing are both likely to increase by 12.8 percent a year overthe period from 1974 through 1980, (equivalent to 13.8 percent annually1975-80), thus resulting in a shortfall of about 10 percent from full employ-ment and 20 to 30 percent in the output targets of the Plan. The latter,again, points to the need for more and better training facilities which couldrapidly raise the skill content and productivity of the labor force.
C. Exports
86. Following the output projections made above, and taking inflationinto account, the f.o.b. value of manufacturing exports will probably increaseby 20 to 25 percent annually through the rest of this decade. The compositionof these exports is likely to change slightly from the current patterns, withcloth and fabrics, and processed electrical components gaining in importance atthe expense of garments and other traditional items. The growth in exportsprojected here, however, assumes that new export enterprises will continue to

Annex IIIPage 37
be set up by firms with established contacts in foreign markets, and that theincrease in demand by Western economies over the rest of this decade will berobust. In any case, the Plan's projection of export growth at 40 percent ayear between 1974 and 1980 seems clearly unrealistic. Even more so is itsassumption that South Korea's performance in this sphere can be easily dupli-cated elsewhere. If demand in industrial countries grows sluggishly, whileMauritius begins to lose its competitive edge as domestic costs rise and othercountries obtain preferential access to the European Economic Community, itmay be hard even to achieve the 20 to 25 percent growth rate in value of ex-ports projected here.
D. Investment
87. No accurate statistics are available on the total investment re-quired for each new job created in Mauritius. However, some estimates canbe made by applying the results of the joint World Bank - Development Banksurvey in the field (see para. 39ff.) to all Export Processing and localenterprises. It appears that, in the past, the average project cost per jobat 1974 prices was around Rs 10,000 in the Export Processing Zone, and Rs60,000 for Development Certificate companies. The average investment insmall-scale industries has been estimated at about Rs 2,500 per job. (Thecorresponding figures at 1975 prices are Rs 13,000, Rs 75,000 and Rs 3,200).Over the next five or six years, average investment required in export enter-prises will about double to Rs 20,000 per job, due to the higher capitalintensity of integrated textile mills and other enterprises being set up. Forlocal enterprises, the investment required will stay about the same as in thepast. In addition, based on mission estimates from past results, the publicinvestment required (in infrastructure and administration) is about Rs 8,000per job in large manufacturing enterprises and Rs 5,000 per job in small-scaleindustries (both at 1974 prices). Using these estimates together with theemployment projections made earlier, the following total investment would berequired over the six years, 1974-1980.
Table 14: GROSS CAPITAL FORMATION IN INDUSTRY, 1974-1980(in millions of Rupees at constant 1974 prices)
Private sector Public sector Total
Export processing enterprises 540 220 760Other large-scale 450 60 510Small-scale industries 10 20 30
Total manufacturing 1,000 300 1,300
Source: Mission estimates.
Annex IIIPage 38
88. Thus, a total investment of Rs 1,300 million (77 percent in theprivate sector) would be required over the six-year period, 1974-1980, toproduce an increase in GDP of Rs 234 million at constant 1974 prices. Thisyields an incremental capital-output ratio of 5.6 if we include all publicand private investment, and 4.3 if we consider private investment alone.(The corresponding figures for the four-year period, 1970-1974, were 3.6and 2.6, respectively). Another implication of the total investment figure isthat, on an average, about twice as much annual investment in real terms willbe required over the next few years than was achieved in the period 1970-1974.The investment figure would be still greater if we assume that more publicinvestment in infrastructure than in the past would be required to sustain themomentum of growth in manufacturing.

Annex IIIAppendix IPage 1
The Export Processing Zone Scheme
Manufacturers in the E]?Z are known as export enterprises and benefit from thefollowing incentives, advantages and facilities:
1. Complete exemption from payment of import duty on capital goods (i.e.,machinery, equipment and spare parts).
2. Complete exemption from payment of import and excise duty on raw mate-rials, components and semi-finished goods (except spirits, tobacco andpetroleum products).
3. Corporate income tax holiday for a minimum of 10 years, and mayimum of20 years, depending on the merits of each case.
4. Exemption from payment of income tax on dividends for a period of 5years.
5. Free repatriation of capital and remittance abroad of profits and divi-dends to companies with an approved status.
6. Electric power at preferential rates.
7. Loans at preferential rates (from commercial banks) for the importationof raw materials.
8. Provision of reinforced factory buildings for use by industrialists.
9. Loans of up to 50 percent of total building cost for 10 year period.
10. Favorable labor legislation to assist export industries to meet theirexport objectives.
11. Export finance at preferential rates of interest from commercial banks.
12. Exemption from payment of crane and other harbor handling dues chargeableby Government on imported content of export products.
13. Exemption from paymnent of registration fees on land and buildings pur-chased by new industrial enterprises.
14. Leases at preferent:ial rates of land in the vicinity of certain housingestates.
15. The issue of permanent residence permits to promoters and shareholders aswarranted by the size of their interest.
16. Completion within 24 hours of Customs inspection of incoming or outgoingcommodities.
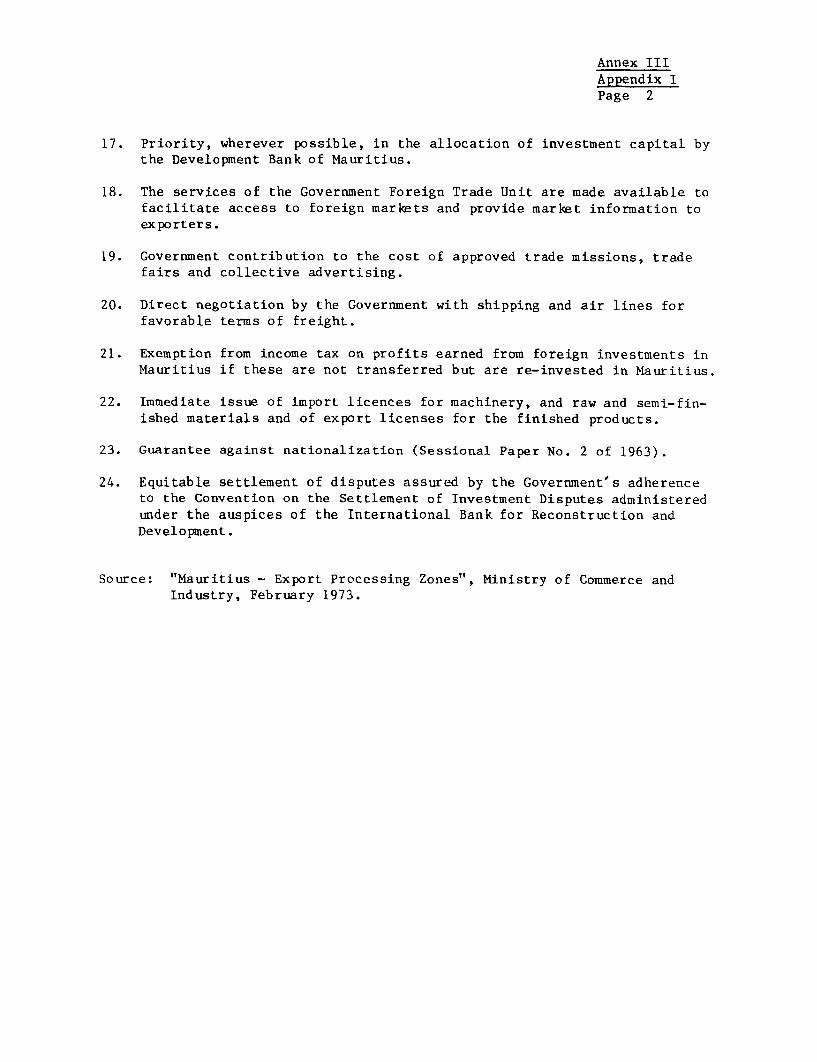
Annex IIIAppendix IPage 2
17. Priority, wherever possible, in the allocation of investment capital bythe Development Bank of Mauritius.
18. The services of the Government Foreign Trade Unit are made available tofacilitate access to foreign markets and provide market information toexporters.
19. Government contribution to the cost of approved trade missions, tradefairs and collective advertising.
20. Direct negotiation by the Government with shipping and air lines forfavorable terms of freight.
21. Exemption from income tax on profits earned from foreign investments inMauritius if these are not transferred but are re-invested in Mauritius.
22. Immediate issue of import licences for machinery, and raw and semi-fin-ished materials and of export licenses for the finished products.
23. Guarantee against nationalization (Sessional Paper No. 2 of 1963).
24. Equitable settlement of disputes assured by the Government's adherenceto the Convention on the Settlement of Investment Disputes administeredunder the auspices of the International Bank for Reconstruction andDevelopment.
Source: "Mauritius - Export Processing Zones", Ministry of Commerce andIndustry, February 1973.

Annex IIIAppendix IPage 3
The Development Certificate Scheme
Development Certificate companies benefit from the following incentives
and facilities:
1. Protective import duties for infant industries.
2. Suspension of impart duties on materials and equipment not locally
available.
3. Rebates of import duties on other raw materials and components for
specified industries.
4. Customs' drawback of import duties on materials and components subse-
quently re-exported in finished products.
5. Import quota protection of up to 80 percent of the market.
6. Initial depreciation allowance of 40 percent on plant and 20 percent
on industrial buildings.
7. Corporate income tax holidays of 5 years if the benefit of initial
depreciation allowance is utilized and 8 years with normal depreciation
allowances.
8. Exemption from payment of income tax on dividends for a period of 5
years.
9. Long-term loans at: favorable rates from the Development Bank for up to50 percent of long-term capital employed.
10. Lease of standard factory buildings at subsidized rates.
11. Free repatriation of profits.
Source: Various Goverrfment Publications.
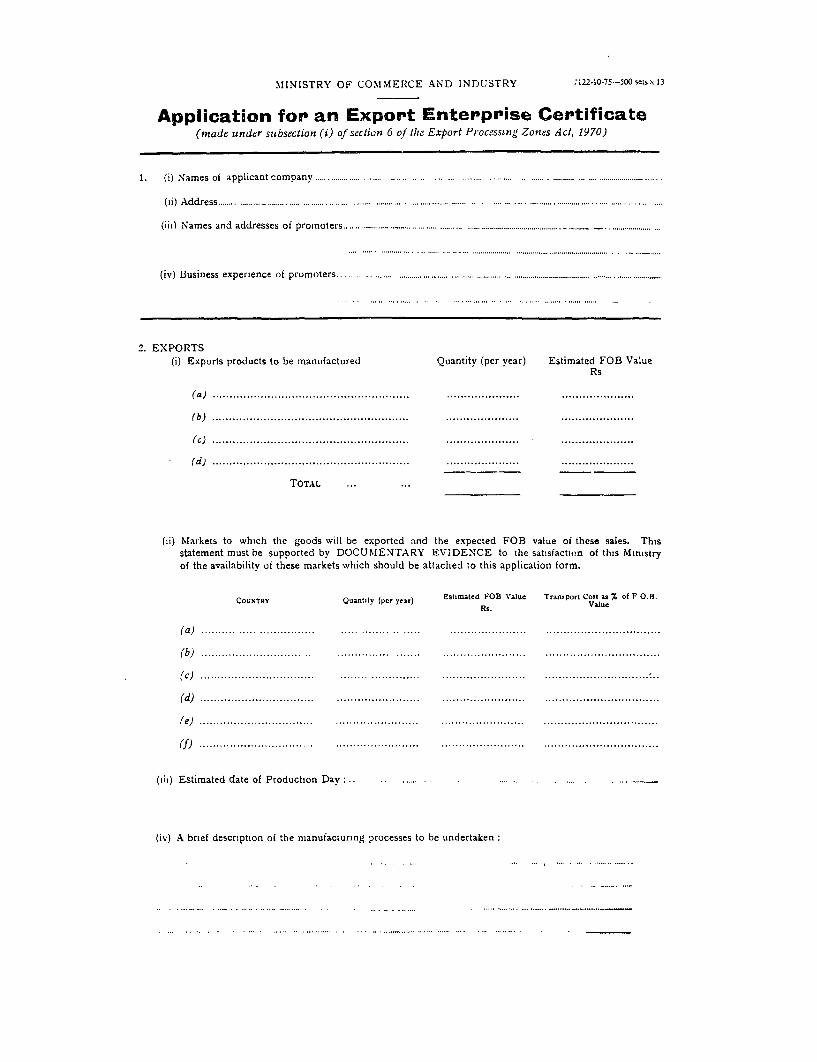
MINISTRY OF COMMERCE AND INDUSTRY 7122-1o-75-500scsx 13
Application for an Export Enterprise Certificate(made under subsection (i) of section 6 of the Export Processinga Zon7es Act, 1970)
I. (i) N am es of applicant com pany ..... ................ .. .. ..... ... ....... .... ..... ..... ........ . ............... ... .... ...................... .. .... .
00i Address ....... ....... ...... ........ ...... ... ...... ... ..... ........ ........ ... .... ..... ........ ....... .. ..... ... ... ..... ...... ............ .... ...... ..... ..... .... ....Oil) Names ond app essolrioesican.....t.... . ... .. ... . ... ................... .. ........ ......... co.any
(ih) Names and addresses of promoters ............................ .. .._
(iv) Business experienct of promoters~~~~~ ~ ~~~~~~~~~~~~~~~~~~..... ........... ... .. ..... ........ ............ ... ............ ........................ ......... ............
(iv) Biusiness experience nf promoters........................................ ..............
2. EXPORTS(i) Exports products to be manifactured Quantity (per year) Estimated FOB Value
Rs
(a ) .................................... ..................... .............. . . . .....................
(b) .................................... ..................... .............. . . . .....................
(c) ......................................................... . .............. ..................... ......................................
(d) ................................. ....................... .............. . . . .....................
TOTAL ...
(ii) Markets to which the goods will be exported and the expected FOB value of these sales. Thisstatement must be supported by DOCUNIENTARY EVIDENCE to the satisfaction of this Ministryof the availability of these markets which should be attached to this application form.
COUNTRY Quantity (per year) Esimated FOB Value Transport Cost as % of F O.B.Rs. Value
(a ) . . ........... ..... ................ ..... ........ .I ..... ........ ............ .. ..............................
(b ) ................... .............. ...... ....... ... ....... ................. ....... . .. ..............................
(c) ............................. .... . ............. .............. .......... ............ . .. ................................
(d ) ................... .............. .......... ..... ........ ........... ...... I...... .................................
(e) .................... ............ ............ ............ ............ ............ .......................... .......
(f) ............................................ ........................ ........................ ................... I..............................
(lii) Estimated date of Production Dav : ............... ......... .
(iv) A brief description of the manufacturing processes to be undertaken:
(a....................................
(b).~~~~~~~~~. .. .....................

2
3. PREMISES
(i) Where will the Industry be establi,hcd . |
6 ii Toial area of land reqiiiied and whethier freehild or leasehold ...
(iz:) Cust of land Rs
(iv) Floor sp;ce of picinises (in sq. Im.)
(v) WV,II I his he a stoicyced L tilidinig ?
(vi) Cost of buildling Rs . ...
4. I'LANT
Par ictil.m-r (,f iachi;nerv velich-s, iffice cqaiipnient, furniture and fxtures
_ ~~~~ ~MA., OAscorgD , .i i A.... . o . . . ......................................... ........ r.. .( . .
.. ..... I. ............ ....... ,.,.,,,,,,,,,,,.... , ...... ,,,,,,, .,........................... ..-.......... .... ...... .. ................ ...
... .. , , .. , .......... . ... ................. ................ ........... ..... . .. ............................. .. .... ............. ....... . .................... .. ............................. ................
-...................... .............. ..... .. ... ......I...... ......... .................. ..... _......... .................................. .. .......................... __
.. . .................................... .................. ..... . .................................. _- ..... .... . ........ : _. ....... . ...I ........... ... __
. .......................... ....... ........... .... .. . ............... ..... _._................ . .............. .. _._ ....... .. .. I....................... ..
... .. ... ....... .... ........ ... ....................... -. .... -. -_......................... . ................... .......... ..
TOTAL ... ...
;. \VORKING CAIPITAL I RS . .....
Aiiiount Icqlili: cl t,,cctlcr w1 Ii ail cxI l;plaation as .....to ww tlic esi tl rlte d ... bei .. co.il .it..d
.............................. .. ............. ..... ............ .
.. ........ ........... ......... .... ..... .. . ....
6. EMPLOYNMENT
The tnitmaiher a( perstins evpectcd It, be empipinved iii each ef Ilic following c:itegories -
I v,iar iiter 2,cars.-mer .3 ,:iis .iIterrr>dt 1.)". dI ty ro .i ,d.1y Pr,- 1-.' " .- hy
' dO 6prv_ I ljar 11:1,15 at.aua.ira,,s j M.a,r a, ,,... Ex.:airialIe Expaia:ca r .La.rlrsas
(i) MIanageriasl Staff ... I
(6i) Technical Staff
(iii) Skilled Workers .. . .
(iv) C eijicil and Ofhicc Staff ...
Iv) Uliskilled Labourers ...
To.r. s I I

3
7. FINANCIAL STRUCTrURER,.
(t) Issued Share Capital
Local . I.'
(ii) Long Trmin Loans
Sources Rs
(a) .... ....
(b) ... . ..
(mii) Shot t Term Loails
TOTAL ...
S. COStI' STlRlUCTURE (Annual basis)Lacal Pnvc'gn
Rs Rs.
(i) !-'aw Materials and components (duty paid)Quanztiy VAlue (Rs)
()..................................................... ...................... ...............
(b) . ............................... ............... .. . . . ...... ...............
(c) ........................... ....................... . ........... .. .. . .... ...............
(d) .. . . . . . . . . . . . . . . . . . . . . . . . . .. . . . . *-***.*****. -. *............. . ............... . . I. . . . .
(ii) Direct Labour ....... ............
(iil) Consutnables ......... ...... ....................
(IV) Electricity ......... ...........
(v) Water ....... ...........(1) Depreciation
(a) Bulings ...............
(b) Plant.nd NIachinery ... ...........
(c) Vehiles ............
(d) Other (e.g-. office equipm.iit etc.) ....... I ........... ...............(xi:) Interest
(a) Long t crm loansycredits .............. ..............
(b) Short term loans ...............
(v ii) Clenrcal Wages ...............
(ix) Salaries to Management and expatiiates ............... ....... ............
( (b) Rent ...............
(xi) Licence lees, royalties, professional service fees (tc, ............... ....... ....
(xii) Other ..............................
TOTAL ... ...
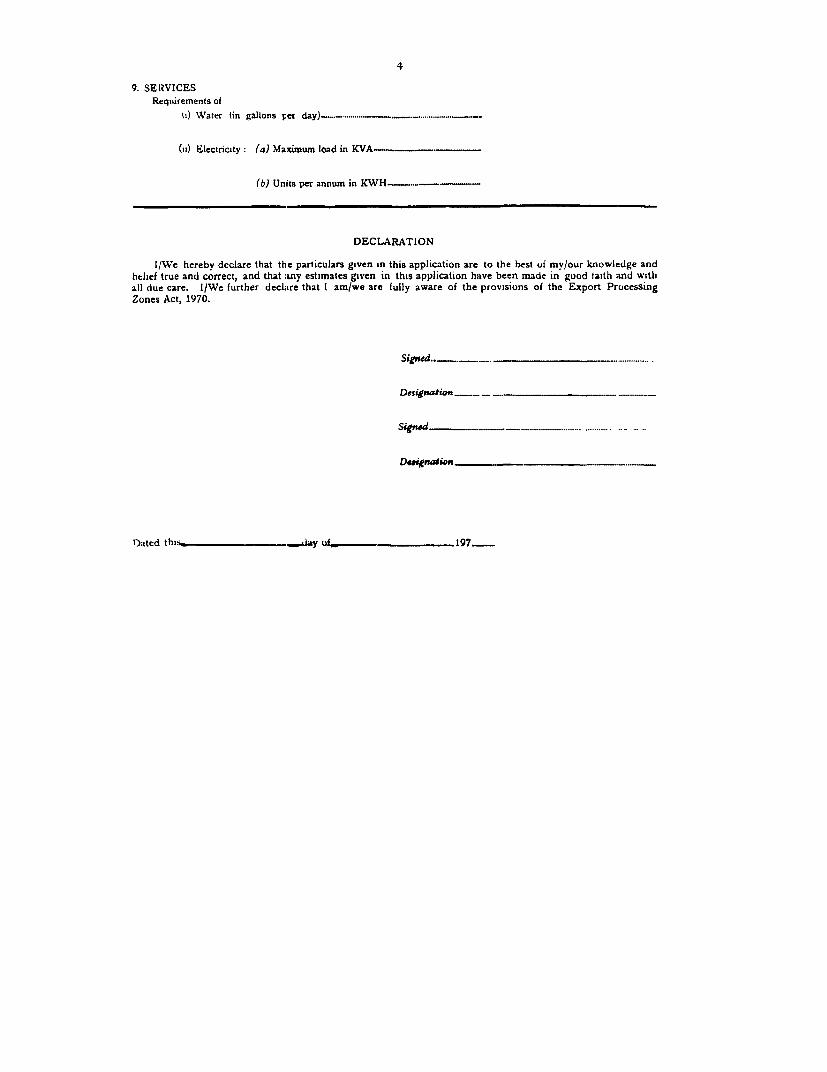
4
9. SERVICESRequiirements of
Ui) Water (in gallons pes .- --- ---_-___
(n) Electricity: (a) Maximum load in KVA-
(b) Unmts per annum in KWH-------
DECLARATION
I/We hereby declare that the particulars given in this application are to the best of mv/our knowlehdge andbelief true and correct, and that any estitnates given in this application have been made in good laith and withall due care. I/We further declare that I am/we are fully aware of the provisions of the Export ProcessingZones Act, 1970.
Signd.....___...
DeSign -i...o
Densination
Dated this _Ltiy uf- . _197_

7121.10-75-3m
INDUSTRIAL DEVELOPMENT TAX RELIEF
Application for a Development Certiflcate(made under Part VIII of the Incomc Tax Ordinance, 19S0)
1. ( i) Names of applicant .............................. ._ _ _ ._ _ _
(ti) A ddress ........ ............. ........ ...... ............ ..... ........................... ....................... ........ ......... .... ........... ..................... ... ........... ... .... ...... .........
(iiI) Names and addresses of promoters - ............... . .. . ... ...
(iv) Business experienct of promoters ..........................
2. PRODUCTIONEstimated
6) Products to be manufactured Quantity (per year) ex-factory valueRs
(a) ................................... ...................... ............ . . . . .....................
(b) .................................... ..................... ........... . . . . . . .....................
(c) ......................................................... . .............. ..................... ......................... ..........
(d) ........................................ ................. .... .............. . .....................
TOTAL ... .
(ii) Do you expect to export any of your products ... ... YEsINO
(iii) If yes, state expected ex-factory value of export sales (documentary evidenceof the availability of export markets shouild be attached to this applicationform) ... ... ... ... Rs........................
(-v) What is the project's breakeven turnover ... ... Rs........................
(v) Estimated date of Production Day ... ... ... ........................
(vi) A bnef description of the manufacturing processes to be undertaken:-
(vii) Evidence of your ability to sell your proposed level of production on the local market *hould be
attached as an annex to this application form.__ ........ ...................................... ... . ...... . . ...........

2
3. PREMISES
(i) Where will the Industry be established ?
(6) Total area of land requiired and whether freehold or leasehold
(iii) Cost of land Rs
(Iv) Floor space of prenises (in sq. m.)
(v) Will this be a storeved building ?
(vi) Cost of building
4. PLANT
Particulars of machinerv, vehicles, office equipment, furniture and fixture>
Details of AssCI OrCign Cost (RS)
........ .......................... ..... . .. .. ... ............. ...... .... . .. .... I........ ..... .. .. .. ....... ...... . ......... ....... .. ......... I......
. ..... . ................. ..................... ...... ............................. .... ...... ...................... .... ..._.........
~~~~~~~~~~~~~..... ... ...... . ............... ........... . ........ ........ . ..... .. ................ .. ......, ............. ... ..... .. . ..... ...... ............ ..........
. .... ...................................................... . .................................. _ .... ......... .................. ....... ... ...............
............ . ................ ..... ..... .... ... ....... .. .... .. ........... . ... ..... .................. .... ,.. ......... ........ ...... ...
... .. ... ................... . ... .......... ........................ ....... .. ...... ... .. . ............. ...... .......
TOTAL ... ... ... ~ ~~~ ~ ~~~ ~ ~~~ ~ ~~~ ~~~~ ~~~~ ~~~~ ~~~~ ~~~ ~~~ ~~~ ~~~~~~~~~~~~~~~~~~~~~~~~~~~~~~~~~~~~~~~~~~~~~~~~~~
5. WORKING CAPITAL RsAmount required together with an explanation as.to how the estimate has been computed
.: : ' : ' ................ ._
6. EMPLOYMENT
The number of persons expected to be employed in each of the following categones
I year after 2 years after | 3 years atierprToduction day I production day produrtion day
Category v-Nimritians Mauribaan Mauriua
t :| YtE exltriates IFex Expatriates Fe. Expairiais
(i) Managerial Staff ... ,
(ii) Technical Staff ...
(iii) Skilled Worhers .. l l
(iv) Cletical and Office Staff ...
{v) Unskilled Labourers ...
TOTALS ...
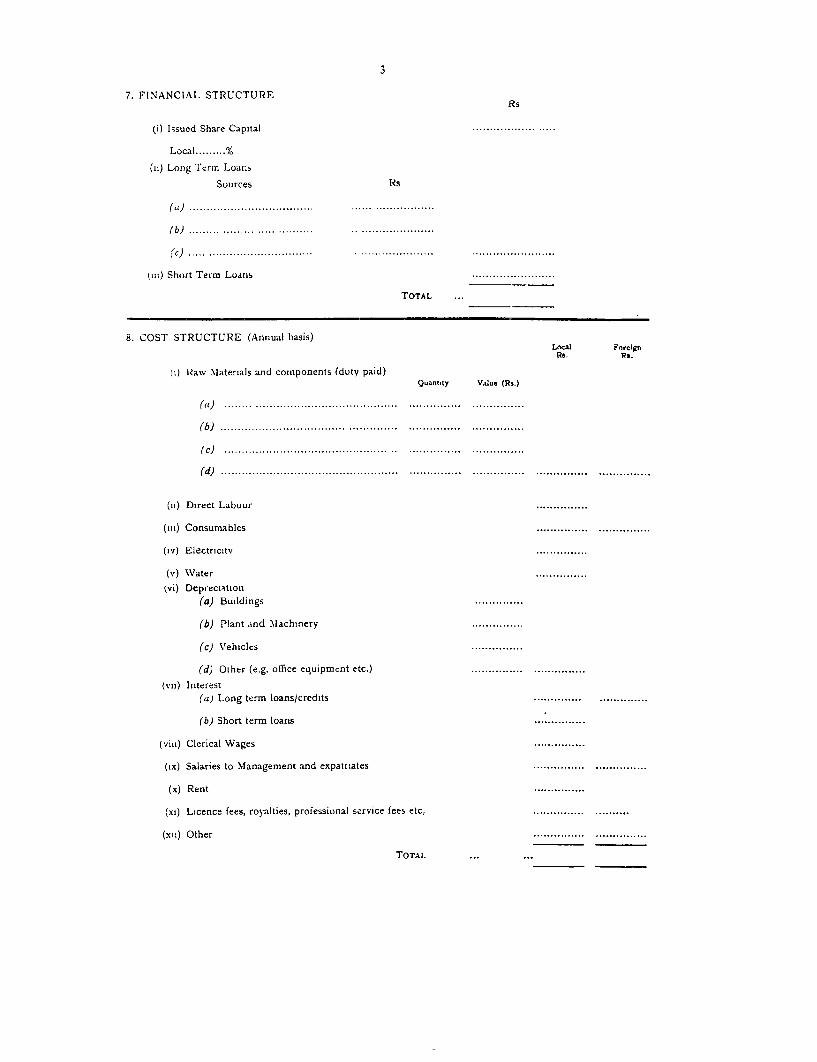
3
7. FINANCIAL STRUCTURERs
(i) Issued Share Capital .......................
Local . /.
(ii) Long'rerm Loans
Sources Rs
().................................... ...... .................
(b) ......... ........................ .......................
(c) ................................... ...................... ........................
(in) Short Term Loanis .............
TOTAL ..
8. COST STRUCTURE (Annual basis)LOCs1 Fnrcign
Rs. Rs.
(i) Rawv Materials and components (duty paid)Quanbity Value (Rs.)
( ) ........ ......................................... ............... ...............
(b) ............................... ............... ...... ...............
(c) ................................................ .. ............. .. .... ...............
(d) * ............ *..**.**..**.**..* * *.................. . .. . .. . .. . . . . . . ..************........ . . ... ... ....... ...............
(ii) Direct Labour ...............
(mi) Consumables ............... ...............
(iv) Electricitv ...............
(v) Water ...............
tvi) Depreciation(a) Buildings ..............
(b) Plant and Machinery ...............
(c) Vehicles ...............
(d) Other (e.g. office equipment etc.) ............... ...............
(vii) I nterest(a) Long term loans/credits .............. ..............
(b) Short term loans .... ...........
(viii) Clerical Wages ...............
(ix) Salaries to Management and expatiiates ............... ...............
(x) Rent ...............
(xi) Licence fees, royalties, professional service fees etc, ............... ..........
(xii) Other ..............................
TOTAL ... ...
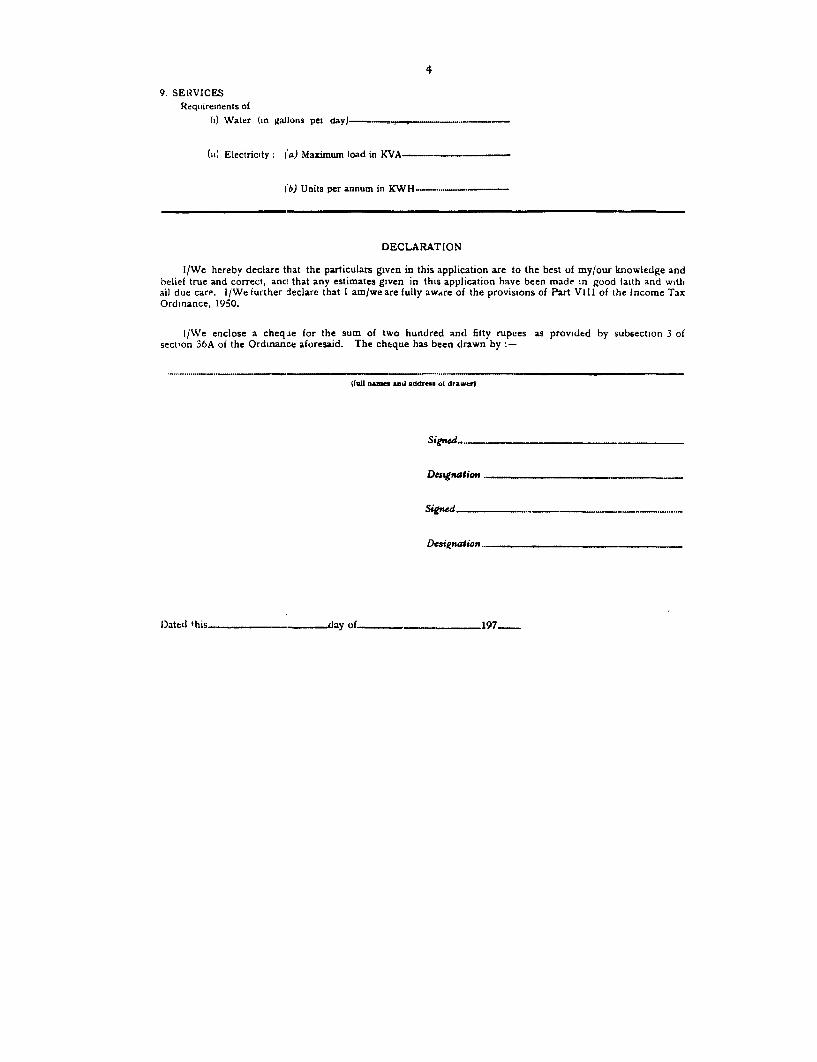
4
9. SERVICESReqiireinents of
(i) Water (in gallons pet rLay)_-_
(ii) Electricity 'ia) Maximum load in KVA -
Ib) Units per annum in KWH---.--
DECLARATION
I/We herebv declare that the particulars gtven in this application are to the best of my/our knowledge andbelief true and correct, anct that any estimates given in this application have been made in good faith and witlhail due care. I/We further declarc that I am/we are fully awAre of the provisions of Part VIII of the Income TaxOrdinance, 1950.
I/We enclose a cheque for the sum of two hundred and fitty rupees as provided by subsection 3 ofsection 36A of the Ordmance aforesaid. The cheque has been drawn by
,.............. ........... ..... _ ......._._
(lUl nines and address of drawer)
Sigis.d..
Destgnations.
Signed
Designation..
Dated this_ _ay of 197_

Annex IIIAppendix IIPage 1
Questionnaire for Joint DBM - World Bank
Survey of Industries in Mauritius
(The information supplied below will be treated in strict confidentiality andis not intended for release)
1. Name of Company ....................................................
2. Major Products .....................................................
3. Do you hold an Export Certificate .... ........ or Development Certificate?
If so, when was the Certificate issued? .............................
4. When did you start production? .....................................
5. What was the total project cost for:
Buildings ...........................
Land ..........................
Machinery ...........................
Other ....
6. What percentage of the total project cost was in foreign exchange?
7. What is the total amount of equity in the enterprise? ..............
What percentage of this is held by local shareholders? .............
8. What are the total amounts of loans contracted by the enterprise and
their repayment terms?
Total Foreign Loans ............ Average Interest .
Grace Period ............... Repayment Period .
Total Domestic Loans ..... ... Average Interest.
Grace Period ............... Repayment Period .

Annex IIIAppendix IIPage 2
9. What were your total sales (net of tax) in calendar year 1975?
.....................................
10. What were your expDrt sales in 1975? ................................
11. What were your gross profits in 1975? ..............................
12. What was the total amount of dividends paid in 1975? ...............
13. What was your total male employment on
Last Thursday of March 1975? ......................Last Thursday of September 1975? ..................
(Data as supplied to C.S.O.)
14. What was your total female employment on
Last Thursday of March 1975? ......................Last Thursday of September 1975? ..................
15. What was the total number of non-Mauritians employed by you on:
Last Thursday of March 1975? ......................Last Thursday of September 1975? ..................
16. What were your operating costs in 1975 for:
Wages and salaries (incl.overtime bonuses, etc.) ...............................
Electricity and power ..............................
Water ...............................
Rent ..............................
Materials ..............................
Interest
Other .............................
17. What percentage of your total wage bill was paid to Mauritians?
18. What percentage of your materials was purchased locally? ...........