the economy of tomorrow - how to produce socially just...
TRANSCRIPT
The Economy of Tomorrow How to produce socially just, sustainable and green dynamic
growth for a Good Society
A case study for China
Quan Heng, Wu Libo, Xu Mingqi and Yin Xingmin November 2013
Since the policy of reform and opening-up has been implemented, China’s economy experienced unprecedented success with long periods of double-digit GDP growth rates. This growth has been largely the result of low cost production, deriving from its large population and burgeoning economy. The strong and rapid economic suc-cess in China has lifted over 235 million people out of absolute poverty within three decades. China has recently become the second largest economy in the world.
The focusing on high GDP growth rates in the last decades let policy-makers ne-glected negative side-effects. The result of this development is a devastated envi-ronment. Air- and water pollution are harming people’s health and causing high eco-nomic cost. Besides large scale environmental degradation, rising socio-economic disparities due to unequal distribution of wealth inhabit strong destabilizing poten-tials and could cause threats to the achievements made in the past.
China has to move onwards to a more sustainable economic growth-model. There-fore more equal and fair distribution of wealth is needed to stimulate domestic con-sumption and reduce risks and volatilities emerging from world-market dependency as an export-led economy. The future economic growth should be driven by green economic policies and the creation of green jobs. Innovation and a comprehensive understanding of sustainability should be key factors in future policy formulations.
ECONOMY OF TOMORROW

Table of Contents
1. General macroeconomic overview ........................................................................................ 1
1.1 Past development of the key macroeconomic indicators ..................................................................... 1
1.2 Present macroeconomic problems ...................................................................................................... 7
1.3 Likely future development .................................................................................................................... 8
2. Income distribution, consumption demand and sustainable development ........................ 8
2.1 Past development of income distribution ............................................................................................. 8
2.2 Present debate about policies to change income distribution .............................................................. 12
2.3 Likely future development .................................................................................................................... 13
3. World market strategy and protection from external shocks .............................................. 14
3.1 Past integration into the world market .................................................................................................. 14
3.2 Present debate about the integration in the world market ................................................................... 18
3.3 Likely future development .................................................................................................................... 21
4. Green New Deal and ecological problems in China ............................................................. 21
4.1 Overview about ecological problems ................................................................................................... 21
4.2 Present debate to solve ecological problems ...................................................................................... 30
4.3 Strategy and coherence of industrial policies in general ..................................................................... 32
4.4 Likely future development .................................................................................................................... 35
5. General evaluation .................................................................................................................. 36
6. Literature
ECONOMY OF TOMORROW
A case study for China

1
Quan Heng et al. How to produce socially just, sustainable and
green dynamic growth for a Good Society
A case study for China
1. General macroeconomic overview 1.1 Past development of the key macroeconomic indicators The first decade of the twenty-first century was marked by the almost unprecedented suc-cess of the Chinese economy, while many developed economies experienced two reces-sions. Chinese GDP growth was maintained at a high level (Figure 1.1). Even in the serious global financial crisis of 2008–2009, only in one quarter did GDP fall to 6.6 percent while the annual growth rate was sustained at more than 8 percent thanks to the large-scale fiscal stimulus package of 4 trillion yuan (RMB) launched by the Chinese government. Although the excessive stimulation caused high inflation in the following year, the government’s mac-roeconomic policy is considered to be fairly successful by many mainstream Keynesian economists. Figure 1.1: China’s GDP growth rate (100 million RMB and %)
Source: Chinese National Bureau of Statistics.
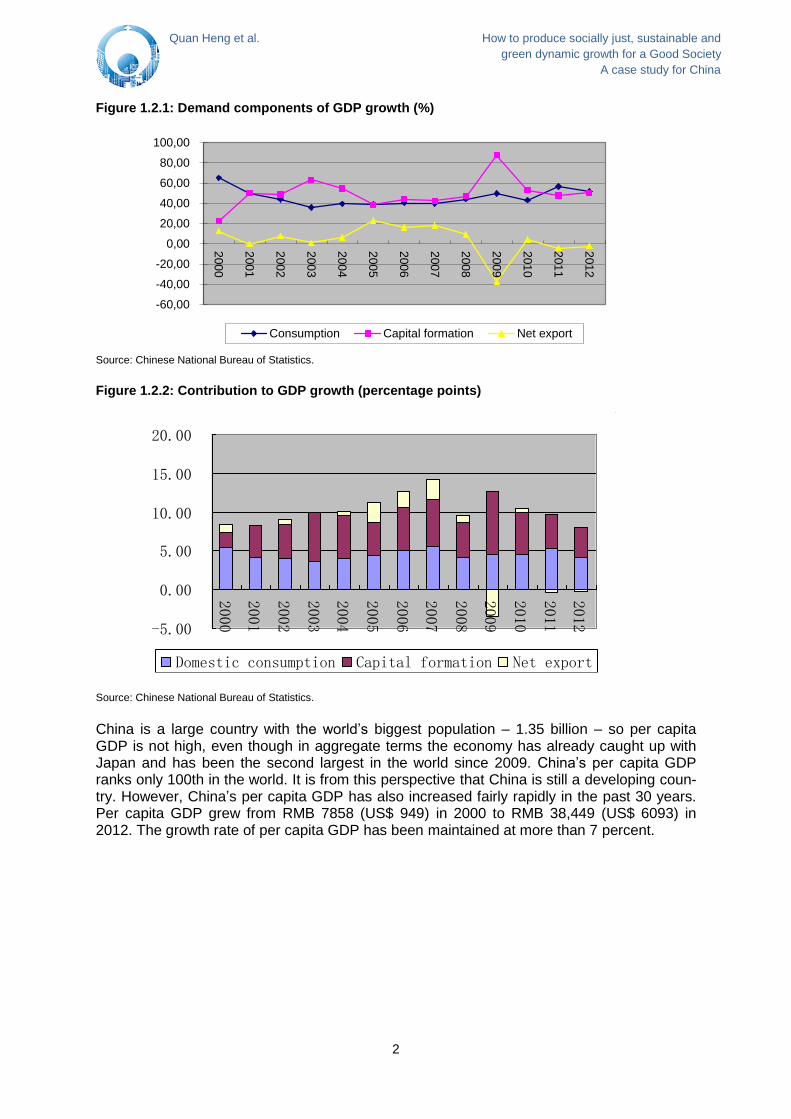
Since the reforms and opening-up of its economy, Chinese economic growth has come mainly from fixed asset investments and net exports. Domestic consumption has not been so important. This began to change recently. During the world financial crisis and recession, external demand declined and the net export component of GDP growth fell and even be-come negative in 2011 and 2012. Fixed capital formation jumped to its highest level in 2009–2010 after the Chinese government implemented a large fiscal stimulus package. However, the government became aware that this high level of fixed asset investment could not be sustained for long. Structural adjustment and a policy shift from investment to domestic con-sumption were adopted and have showed some effects (see Figure 1.2.1). The Chinese government’s Twelfth Five-Year Plan and the CPC’s Eighteenth Congress formulated guide-lines to boost domestic consumption. It is hoped that this trend will long continue. However, as China on the whole is still in a process of industrialization and urbanization, investment demand is immense and the room for investment remains considerable. The Chinese economy will remain heavily dependent on fixed capital formation and the contribu-tion of capital formation to GDP growth will continue to be high in the near future. We will see a steadily increasing share of domestic consumption in GDP, however. Hopefully, the net export contribution to GDP growth will return to its normal positive state.
0.00
100,000.00
200,000.00
300,000.00
400,000.00
500,000.00
600,000.00
2000
2001
2002
2003
2004
2005
2006
2007
2008
2009
2010
2011
2012
0.00
2.00
4.00
6.00
8.00
10.00
12.00
14.00
16.00
GDP in norminal terms (left axis)
Real GDP grwoth rate (right axis)
2
Quan Heng et al. How to produce socially just, sustainable and
green dynamic growth for a Good Society
A case study for China
Figure 1.2.1: Demand components of GDP growth (%)
Source: Chinese National Bureau of Statistics.
Figure 1.2.2: Contribution to GDP growth (percentage points)
Source: Chinese National Bureau of Statistics.
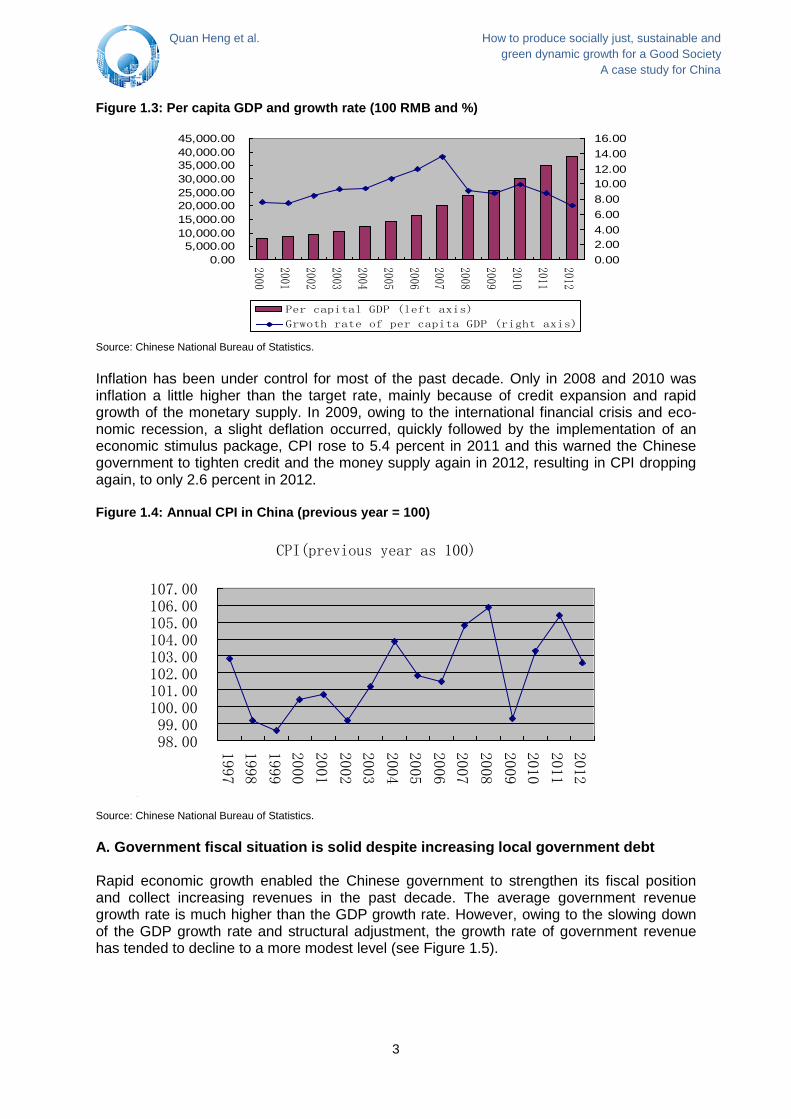
China is a large country with the world’s biggest population – 1.35 billion – so per capita GDP is not high, even though in aggregate terms the economy has already caught up with Japan and has been the second largest in the world since 2009. China’s per capita GDP ranks only 100th in the world. It is from this perspective that China is still a developing coun-try. However, China’s per capita GDP has also increased fairly rapidly in the past 30 years. Per capita GDP grew from RMB 7858 (US$ 949) in 2000 to RMB 38,449 (US$ 6093) in 2012. The growth rate of per capita GDP has been maintained at more than 7 percent.
-60,00
-40,00
-20,00
0,00
20,00
40,00
60,00
80,00
100,00
200
0
200
1
200
2
200
3
200
4
200
5
200
6
200
7
200
8
200
9
201
0
201
1
201
2
Consumption Capital formation Net export
-5.00
0.00
5.00
10.00
15.00
20.00
2000
2001
2002
2003
2004
2005
2006
2007
2008
2009
2010
2011
2012
Domestic consumption Capital formation Net export
3
Quan Heng et al. How to produce socially just, sustainable and
green dynamic growth for a Good Society
A case study for China
Figure 1.3: Per capita GDP and growth rate (100 RMB and %)
Source: Chinese National Bureau of Statistics.
Inflation has been under control for most of the past decade. Only in 2008 and 2010 was inflation a little higher than the target rate, mainly because of credit expansion and rapid growth of the monetary supply. In 2009, owing to the international financial crisis and eco-nomic recession, a slight deflation occurred, quickly followed by the implementation of an economic stimulus package, CPI rose to 5.4 percent in 2011 and this warned the Chinese government to tighten credit and the money supply again in 2012, resulting in CPI dropping again, to only 2.6 percent in 2012. Figure 1.4: Annual CPI in China (previous year = 100)
Source: Chinese National Bureau of Statistics.
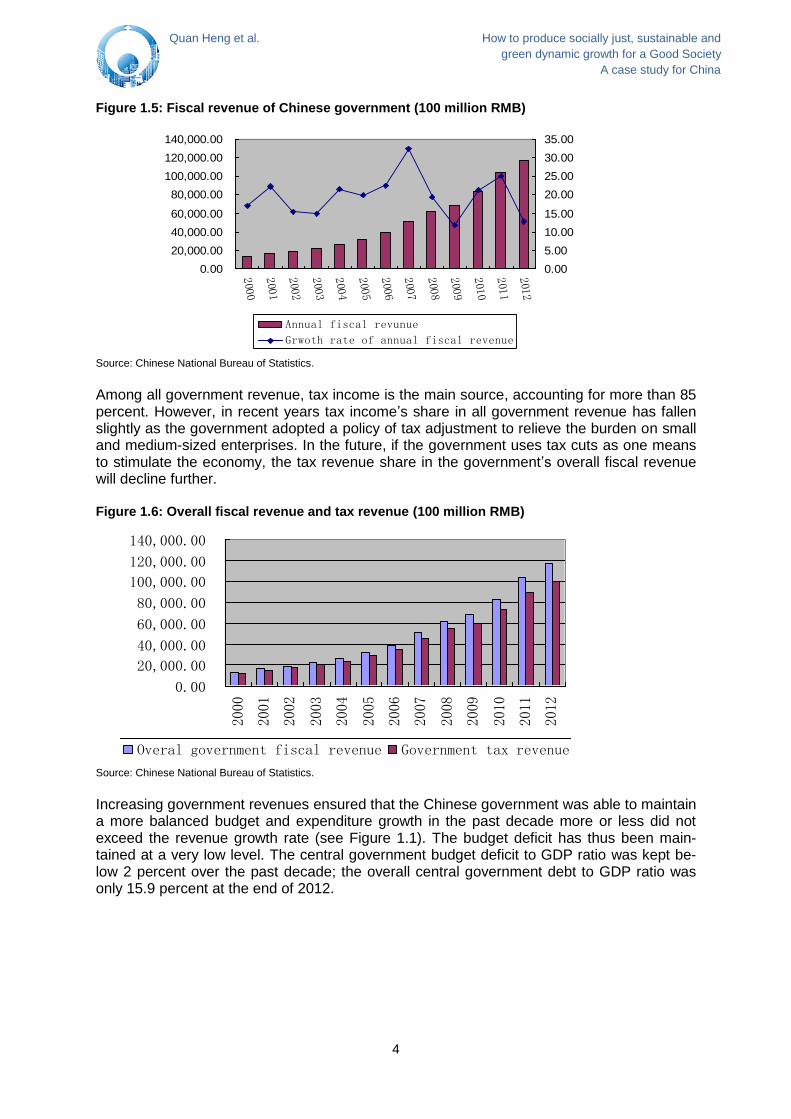
A. Government fiscal situation is solid despite increasing local government debt Rapid economic growth enabled the Chinese government to strengthen its fiscal position and collect increasing revenues in the past decade. The average government revenue growth rate is much higher than the GDP growth rate. However, owing to the slowing down of the GDP growth rate and structural adjustment, the growth rate of government revenue has tended to decline to a more modest level (see Figure 1.5).
0.00
5,000.00
10,000.00
15,000.00
20,000.00
25,000.00
30,000.00
35,000.00
40,000.00
45,000.00
2000
2001
2002
2003
2004
2005
2006
2007
2008
2009
2010
2011
2012
0.00
2.00
4.00
6.00
8.00
10.00
12.00
14.00
16.00
Per capital GDP (left axis)
Grwoth rate of per capita GDP (right axis)
CPI(previous year as 100)
98.0099.00
100.00101.00102.00103.00104.00105.00106.00107.00
1997
1998
1999
2000
2001
2002
2003
2004
2005
2006
2007
2008
2009
2010
2011
2012
4
Quan Heng et al. How to produce socially just, sustainable and
green dynamic growth for a Good Society
A case study for China
Figure 1.5: Fiscal revenue of Chinese government (100 million RMB)
Source: Chinese National Bureau of Statistics.
Among all government revenue, tax income is the main source, accounting for more than 85 percent. However, in recent years tax income’s share in all government revenue has fallen slightly as the government adopted a policy of tax adjustment to relieve the burden on small and medium-sized enterprises. In the future, if the government uses tax cuts as one means to stimulate the economy, the tax revenue share in the government’s overall fiscal revenue will decline further. Figure 1.6: Overall fiscal revenue and tax revenue (100 million RMB)
Source: Chinese National Bureau of Statistics.
Increasing government revenues ensured that the Chinese government was able to maintain a more balanced budget and expenditure growth in the past decade more or less did not exceed the revenue growth rate (see Figure 1.1). The budget deficit has thus been main-tained at a very low level. The central government budget deficit to GDP ratio was kept be-low 2 percent over the past decade; the overall central government debt to GDP ratio was only 15.9 percent at the end of 2012.
0.00
20,000.00
40,000.00
60,000.00
80,000.00
100,000.00
120,000.00
140,000.00
2000
2001
2002
2003
2004
2005
2006
2007
2008
2009
2010
2011
2012
0.00
5.00
10.00
15.00
20.00
25.00
30.00
35.00
Annual fiscal revunue
Grwoth rate of annual fiscal revenue
0.00
20,000.00
40,000.00
60,000.00
80,000.00
100,000.00
120,000.00
140,000.00
2000
2001
2002
2003
2004
2005
2006
2007
2008
2009
2010
2011
2012
Overal government fiscal revenue Government tax revenue

5
Quan Heng et al. How to produce socially just, sustainable and
green dynamic growth for a Good Society
A case study for China
Figure 1.7: Fiscal revenue and expenditure growth rate
Source: Chinese National Bureau of Statistics.
However, central government’s strong fiscal position is not reflected by local government. Local governments in China are in a less healthy fiscal condition and are running increasing debts. Although according to the current law, local governments are not allowed to borrow and issue bonds, they own many corporations that serve as local government financing and investment vehicles. In most cases, these financial vehicles’ debts are implicitly guaranteed by local governments at city and county level. Local government debts grew most rapidly in 2009 and 2010 as the central government launched its RMB 4 trillion fiscal stimulus package and encouraged local government to do the same. According to the National Audit Office, local government debts reached RMB 10.7 trillion in 2010, 26.7 percent of GDP. Therefore, central government is now taking strict measures to control debt and to try to gradually re-duce it by fiscal and financial means. Since the central government has a sound fiscal posi-tion, local government debt problems will not cause serious problems, such as default and financial market turbulence. B. Trade surplus and FDI inflows raised China’s foreign exchange reserves to a his-torical high level China has run increasing balance of international payments surpluses since 2000. Both the current account and the capital account are in surplus. This has led to a steady increase in foreign exchange reserves (see Figure 1.8 and Figure 1.9). By the end of 2012, accumulated foreign exchange reserves had reached US$ 3.3 trillion. Figure 1.8: Current account surplus has been maintained
Source: Chinese National Bureau of Statistics.
0.005.0010.0015.0020.0025.0030.0035.00
2000
2001
2002
2003
2004
2005
2006
2007
2008
2009
2010
2011
2012
Fiscal revenue growth rate
Fiscal expenditure grwoth rate
Annual current acclount surplus
0500
10001500200025003000350040004500
2000
2001
2002
2003
2004
2005
2006
2007
2008
2009
2010
2011
2012
6
Quan Heng et al. How to produce socially just, sustainable and
green dynamic growth for a Good Society
A case study for China
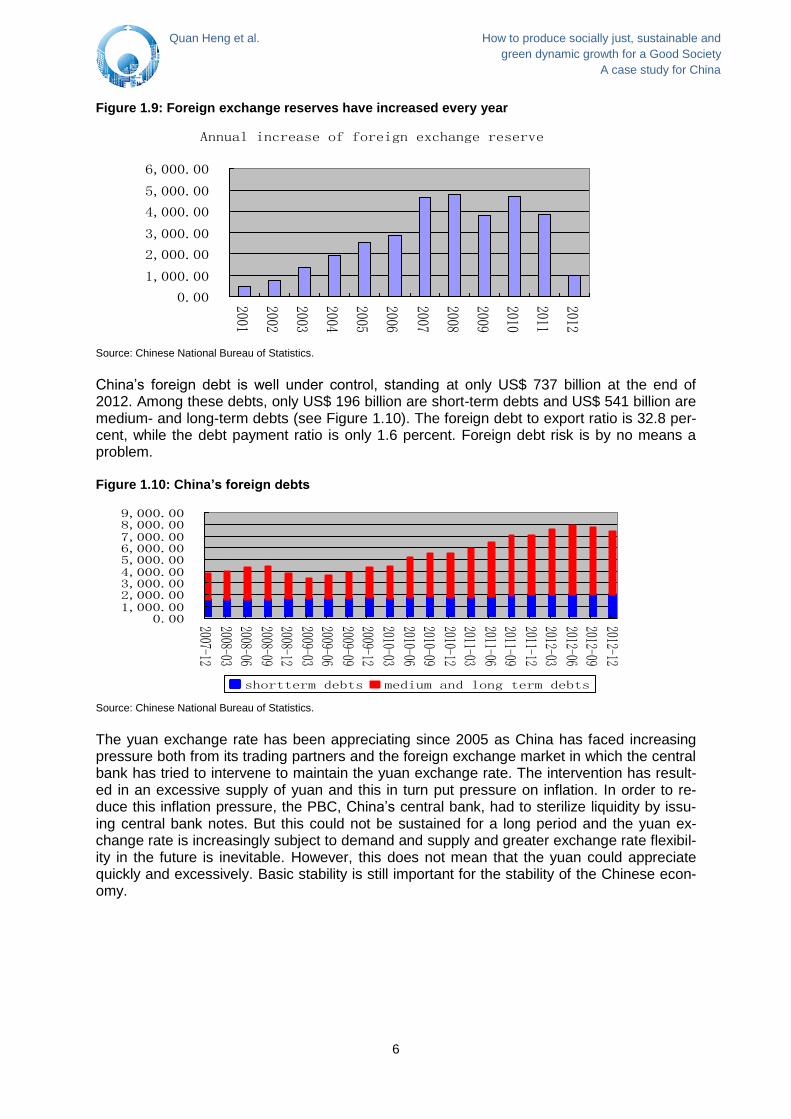
Figure 1.9: Foreign exchange reserves have increased every year
Source: Chinese National Bureau of Statistics.
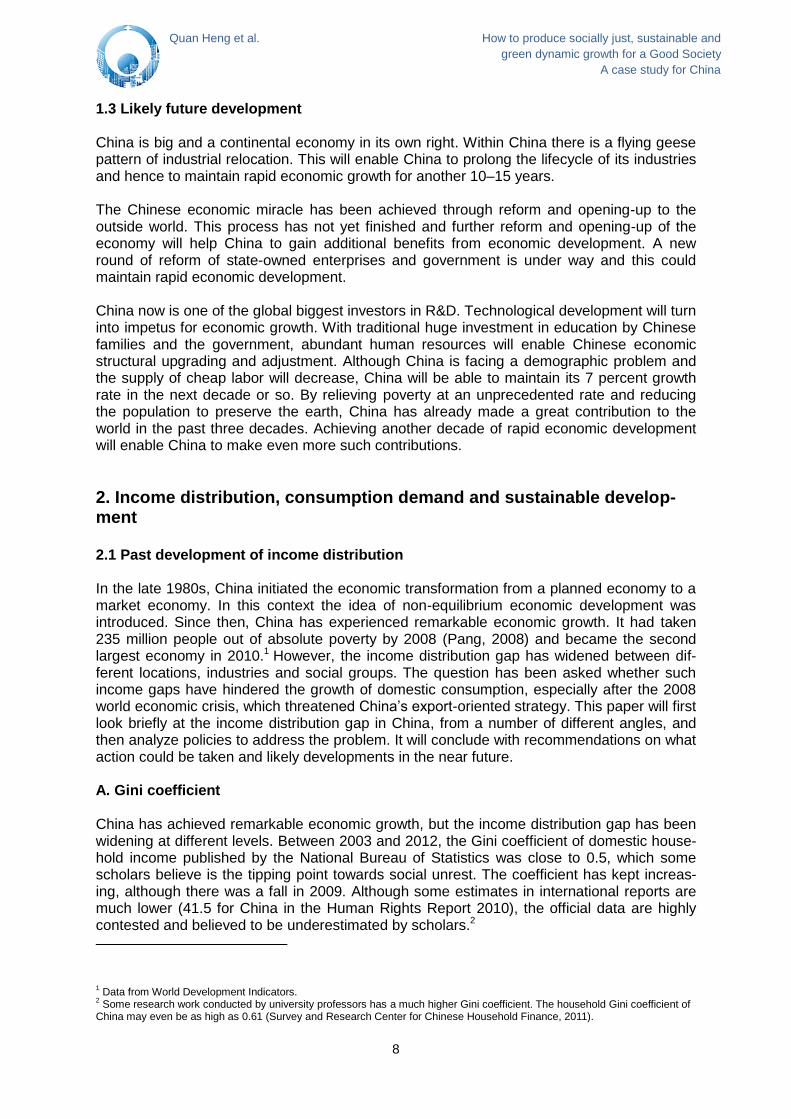
China’s foreign debt is well under control, standing at only US$ 737 billion at the end of 2012. Among these debts, only US$ 196 billion are short-term debts and US$ 541 billion are medium- and long-term debts (see Figure 1.10). The foreign debt to export ratio is 32.8 per-cent, while the debt payment ratio is only 1.6 percent. Foreign debt risk is by no means a problem. Figure 1.10: China’s foreign debts
Source: Chinese National Bureau of Statistics.
The yuan exchange rate has been appreciating since 2005 as China has faced increasing pressure both from its trading partners and the foreign exchange market in which the central bank has tried to intervene to maintain the yuan exchange rate. The intervention has result-ed in an excessive supply of yuan and this in turn put pressure on inflation. In order to re-duce this inflation pressure, the PBC, China’s central bank, had to sterilize liquidity by issu-ing central bank notes. But this could not be sustained for a long period and the yuan ex-change rate is increasingly subject to demand and supply and greater exchange rate flexibil-ity in the future is inevitable. However, this does not mean that the yuan could appreciate quickly and excessively. Basic stability is still important for the stability of the Chinese econ-omy.
Annual increase of foreign exchange reserve
0.00
1,000.00
2,000.00
3,000.00
4,000.00
5,000.00
6,000.00
2001
2002
2003
2004
2005
2006
2007
2008
2009
2010
2011
2012
0.001,000.002,000.003,000.004,000.005,000.006,000.007,000.008,000.009,000.00
2007-12
2008-032008-06
2008-092008-12
2009-032009-06
2009-092009-12
2010-03
2010-062010-09
2010-122011-03
2011-062011-09
2011-122012-03
2012-062012-09
2012-12
shortterm debts medium and long term debts

7
Quan Heng et al. How to produce socially just, sustainable and
green dynamic growth for a Good Society
A case study for China
Figure 1.11: Yuan exchange rate (RMB/US$)
Source: Chinese National Bureau of Statistics.
1.2 Present macroeconomic problems China’s macro-economy is in good shape, on the whole. However, it has some problems as the structure of the economy is increasingly facing challenges due to sluggish world demand and rising costs. The export growth rate has declined to a historically low level and has no hope of recovering to pre-recession level any time soon. Developed countries are all adjust-ing their economies and protectionism is increasing. Developing countries’ markets are growing, although at a very limited rate. The export-oriented economy is bound to be adjust-ed quickly. But it will take time to implement the reform measures and it is a painful process. On the other hand, labor cost and other costs – such as land lease fees, rent and raw mate-rial prices – are all on a rising trend. Manufacturing is becoming less competitive in China and industries are starting to relocate. If the cost reduction measures and policies are not implemented effectively and if manufacturing productivity does not rise more quickly than costs, the manufacturing boom will soon come to an end. Studies show that labor productivi-ty is rising faster than labor costs, so China is still attractive to most multinational corpora-tions. However, structural adjustment and upgrading must be made the top priority; this is the only way for China to overcome the so-called middle income trap. Figure 1.12: Wages have increased quickly in recent years
Source: Chinese National Bureau of Statistics.
RMB exchange rate to one US dollar
5.5000
6.0000
6.5000
7.0000
7.5000
8.0000
8.5000
2005-01
2005-07
2006-01
2006-07
2007-01
2007-07
2008-01
2008-07
2009-01
2009-07
2010-01
2010-07
2011-01
2011-07
2012-01
2012-07
2013-01
0
10000
20000
30000
40000
50000
2004 2005 2006 2007 2008 2009 2010 2011 2012
0
5
10
15
20
Averaged wage of an urban eployee
Annual wage grwoth rate of urban employee
8
Quan Heng et al. How to produce socially just, sustainable and
green dynamic growth for a Good Society
A case study for China
1.3 Likely future development China is big and a continental economy in its own right. Within China there is a flying geese pattern of industrial relocation. This will enable China to prolong the lifecycle of its industries and hence to maintain rapid economic growth for another 10–15 years. The Chinese economic miracle has been achieved through reform and opening-up to the outside world. This process has not yet finished and further reform and opening-up of the economy will help China to gain additional benefits from economic development. A new round of reform of state-owned enterprises and government is under way and this could maintain rapid economic development. China now is one of the global biggest investors in R&D. Technological development will turn into impetus for economic growth. With traditional huge investment in education by Chinese families and the government, abundant human resources will enable Chinese economic structural upgrading and adjustment. Although China is facing a demographic problem and the supply of cheap labor will decrease, China will be able to maintain its 7 percent growth rate in the next decade or so. By relieving poverty at an unprecedented rate and reducing the population to preserve the earth, China has already made a great contribution to the world in the past three decades. Achieving another decade of rapid economic development will enable China to make even more such contributions.
2. Income distribution, consumption demand and sustainable develop-ment
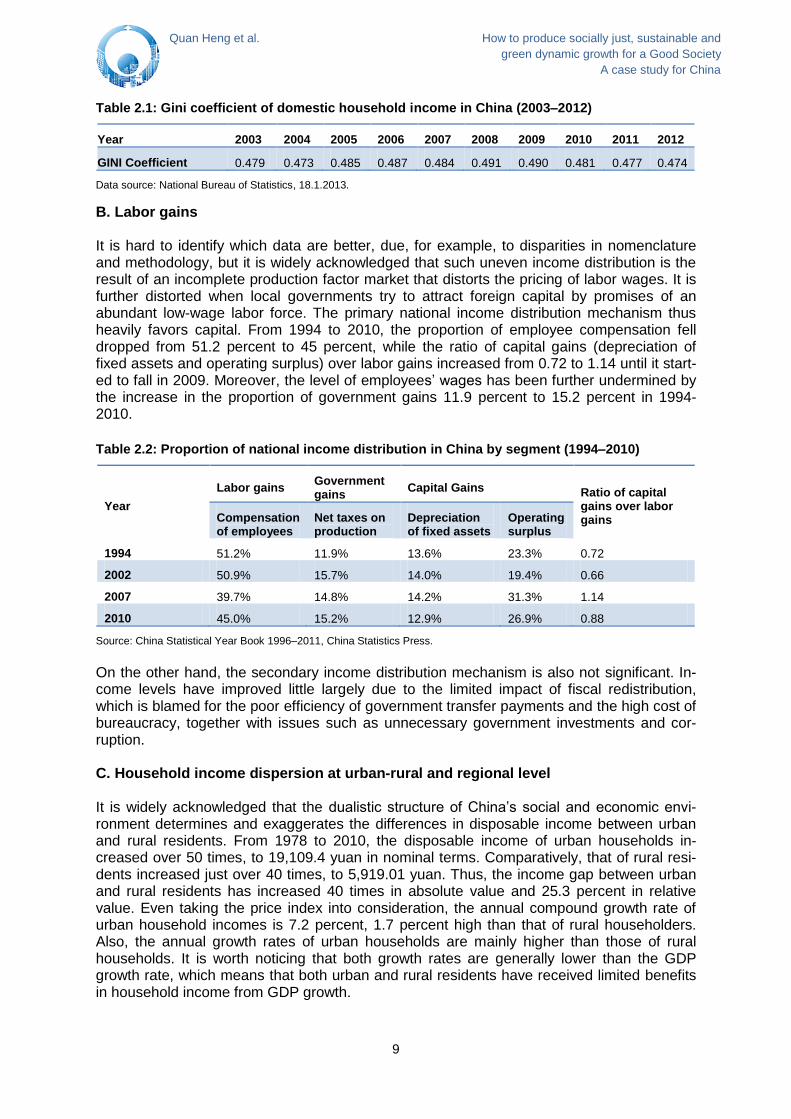
2.1 Past development of income distribution In the late 1980s, China initiated the economic transformation from a planned economy to a market economy. In this context the idea of non-equilibrium economic development was introduced. Since then, China has experienced remarkable economic growth. It had taken 235 million people out of absolute poverty by 2008 (Pang, 2008) and became the second largest economy in 2010.1 However, the income distribution gap has widened between dif-ferent locations, industries and social groups. The question has been asked whether such income gaps have hindered the growth of domestic consumption, especially after the 2008 world economic crisis, which threatened China’s export-oriented strategy. This paper will first look briefly at the income distribution gap in China, from a number of different angles, and then analyze policies to address the problem. It will conclude with recommendations on what action could be taken and likely developments in the near future. A. Gini coefficient China has achieved remarkable economic growth, but the income distribution gap has been widening at different levels. Between 2003 and 2012, the Gini coefficient of domestic house-hold income published by the National Bureau of Statistics was close to 0.5, which some scholars believe is the tipping point towards social unrest. The coefficient has kept increas-ing, although there was a fall in 2009. Although some estimates in international reports are much lower (41.5 for China in the Human Rights Report 2010), the official data are highly contested and believed to be underestimated by scholars.2
1 Data from World Development Indicators.
2 Some research work conducted by university professors has a much higher Gini coefficient. The household Gini coefficient of
China may even be as high as 0.61 (Survey and Research Center for Chinese Household Finance, 2011).
9
Quan Heng et al. How to produce socially just, sustainable and
green dynamic growth for a Good Society
A case study for China
Table 2.1: Gini coefficient of domestic household income in China (2003–2012)
Year 2003 2004 2005 2006 2007 2008 2009 2010 2011 2012
GINI Coefficient 0.479 0.473 0.485 0.487 0.484 0.491 0.490 0.481 0.477 0.474
Data source: National Bureau of Statistics, 18.1.2013.
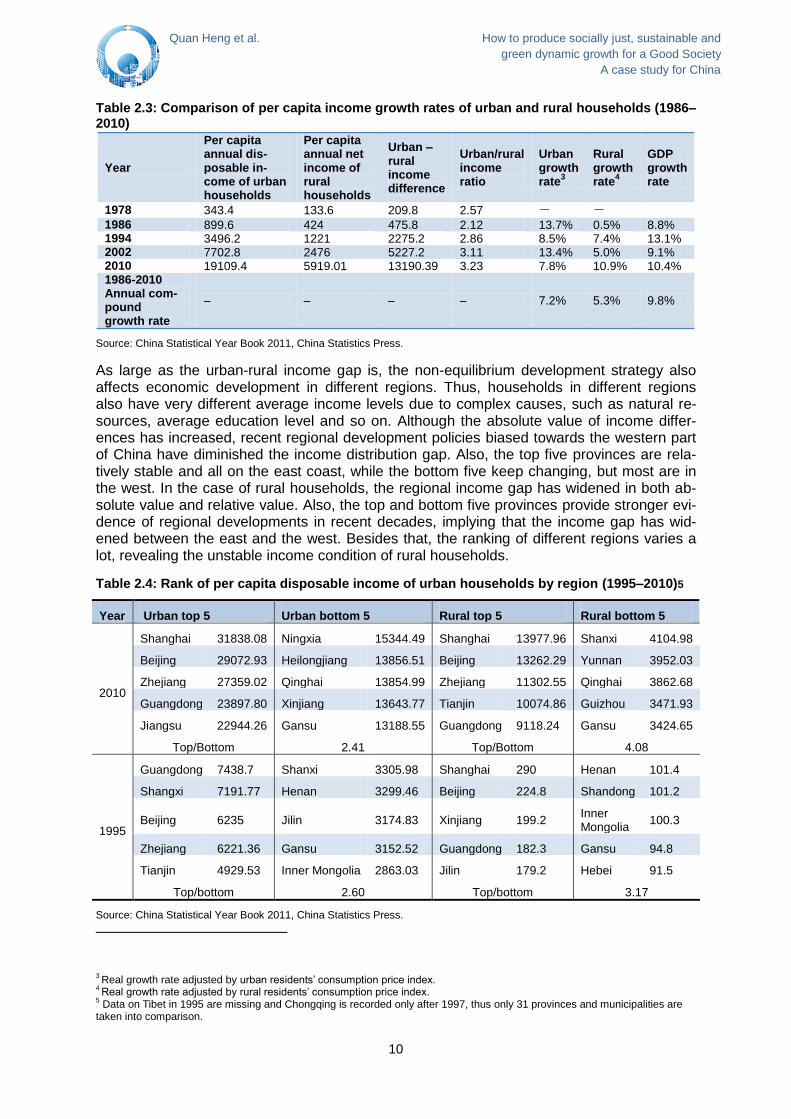
B. Labor gains It is hard to identify which data are better, due, for example, to disparities in nomenclature and methodology, but it is widely acknowledged that such uneven income distribution is the result of an incomplete production factor market that distorts the pricing of labor wages. It is further distorted when local governments try to attract foreign capital by promises of an abundant low-wage labor force. The primary national income distribution mechanism thus heavily favors capital. From 1994 to 2010, the proportion of employee compensation fell dropped from 51.2 percent to 45 percent, while the ratio of capital gains (depreciation of fixed assets and operating surplus) over labor gains increased from 0.72 to 1.14 until it start-ed to fall in 2009. Moreover, the level of employees’ wages has been further undermined by the increase in the proportion of government gains 11.9 percent to 15.2 percent in 1994-2010.
Table 2.2: Proportion of national income distribution in China by segment (1994–2010)
Year
Labor gains Government gains
Capital Gains Ratio of capital gains over labor gains Compensation
of employees Net taxes on production
Depreciation of fixed assets
Operating surplus
1994 51.2% 11.9% 13.6% 23.3% 0.72
2002 50.9% 15.7% 14.0% 19.4% 0.66
2007 39.7% 14.8% 14.2% 31.3% 1.14
2010 45.0% 15.2% 12.9% 26.9% 0.88
Source: China Statistical Year Book 1996–2011, China Statistics Press.
On the other hand, the secondary income distribution mechanism is also not significant. In-come levels have improved little largely due to the limited impact of fiscal redistribution, which is blamed for the poor efficiency of government transfer payments and the high cost of bureaucracy, together with issues such as unnecessary government investments and cor-ruption. C. Household income dispersion at urban-rural and regional level It is widely acknowledged that the dualistic structure of China’s social and economic envi-ronment determines and exaggerates the differences in disposable income between urban and rural residents. From 1978 to 2010, the disposable income of urban households in-creased over 50 times, to 19,109.4 yuan in nominal terms. Comparatively, that of rural resi-dents increased just over 40 times, to 5,919.01 yuan. Thus, the income gap between urban and rural residents has increased 40 times in absolute value and 25.3 percent in relative value. Even taking the price index into consideration, the annual compound growth rate of urban household incomes is 7.2 percent, 1.7 percent high than that of rural householders. Also, the annual growth rates of urban households are mainly higher than those of rural households. It is worth noticing that both growth rates are generally lower than the GDP growth rate, which means that both urban and rural residents have received limited benefits in household income from GDP growth.
10
Quan Heng et al. How to produce socially just, sustainable and
green dynamic growth for a Good Society
A case study for China
Table 2.3: Comparison of per capita income growth rates of urban and rural households (1986–2010)
Year
Per capita annual dis-posable in-come of urban households
Per capita annual net income of rural households
Urban – rural income difference
Urban/rural income ratio
Urban growth rate
3
Rural growth rate
4
GDP growth rate
1978 343.4 133.6 209.8 2.57 - -
1986 899.6 424 475.8 2.12 13.7% 0.5% 8.8% 1994 3496.2 1221 2275.2 2.86 8.5% 7.4% 13.1% 2002 7702.8 2476 5227.2 3.11 13.4% 5.0% 9.1% 2010 19109.4 5919.01 13190.39 3.23 7.8% 10.9% 10.4% 1986-2010 Annual com-pound growth rate
– – – – 7.2% 5.3% 9.8%
Source: China Statistical Year Book 2011, China Statistics Press.
As large as the urban-rural income gap is, the non-equilibrium development strategy also affects economic development in different regions. Thus, households in different regions also have very different average income levels due to complex causes, such as natural re-sources, average education level and so on. Although the absolute value of income differ-ences has increased, recent regional development policies biased towards the western part of China have diminished the income distribution gap. Also, the top five provinces are rela-tively stable and all on the east coast, while the bottom five keep changing, but most are in the west. In the case of rural households, the regional income gap has widened in both ab-solute value and relative value. Also, the top and bottom five provinces provide stronger evi-dence of regional developments in recent decades, implying that the income gap has wid-ened between the east and the west. Besides that, the ranking of different regions varies a lot, revealing the unstable income condition of rural households.
Table 2.4: Rank of per capita disposable income of urban households by region (1995–2010)5
Year Urban top 5 Urban bottom 5 Rural top 5 Rural bottom 5
2010
Shanghai 31838.08 Ningxia 15344.49 Shanghai 13977.96 Shanxi 4104.98
Beijing 29072.93 Heilongjiang 13856.51 Beijing 13262.29 Yunnan 3952.03
Zhejiang 27359.02 Qinghai 13854.99 Zhejiang 11302.55 Qinghai 3862.68
Guangdong 23897.80 Xinjiang 13643.77 Tianjin 10074.86 Guizhou 3471.93
Jiangsu 22944.26 Gansu 13188.55 Guangdong 9118.24 Gansu 3424.65
Top/Bottom 2.41 Top/Bottom 4.08
1995
Guangdong 7438.7 Shanxi 3305.98 Shanghai 290 Henan 101.4
Shangxi 7191.77 Henan 3299.46 Beijing 224.8 Shandong 101.2
Beijing 6235 Jilin 3174.83 Xinjiang 199.2 Inner Mongolia
100.3
Zhejiang 6221.36 Gansu 3152.52 Guangdong 182.3 Gansu 94.8
Tianjin 4929.53 Inner Mongolia 2863.03 Jilin 179.2 Hebei 91.5
Top/bottom 2.60 Top/bottom 3.17
Source: China Statistical Year Book 2011, China Statistics Press.
3 Real growth rate adjusted by urban residents’ consumption price index.
4 Real growth rate adjusted by rural residents’ consumption price index.
5 Data on Tibet in 1995 are missing and Chongqing is recorded only after 1997, thus only 31 provinces and municipalities are
taken into comparison.

11
Quan Heng et al. How to produce socially just, sustainable and
green dynamic growth for a Good Society
A case study for China
D. Stagnant ranking of sectoral wages Just as incomes vary between urban and rural groups and different regions, the income dis-tribution varies in different industries due to regional cluster effects. State capital and FDI keep flowing to the eastern part of China where profitable industries are clustered and thus leads to increasing dispersion of average wages among different sectors. From 1978 to 2010, employees in the financial sector had the highest wages, ranging from 13,478 yuan to 70,146 yuan, while the wages in primary and secondary industries, such as agriculture, for-estry and animal husbandry, are the lowest, increasing only from 5,184 yuan to 16,717 yuan. The ranking of high wage sectors and low wage sectors has remained relatively stable over the past thirty years, except for some sectors vulnerable to world energy prices. As Table 2.5 shows, the financial sector is the highest income industry (172,123 yuan), and the animal husbandry sector is the lowest (10,803 yuan), a difference of 16 times between top and bot-tom. This proves that the most labor-intensive industries are in the low wage sector in con-trast o knowledge-intensive and capital-intensive sectors. It is obvious that the monopoly industries, such as air transport, banks and telecoms, have an obvious advantage in terms of wage levels. It is noticeable that most top sectors come from tertiary industry, while most bottom ones come from primary industry with low value added.
Table 2.5: Top 5 and bottom 5 average wages of staff and workers by sector in detail (2008)
Top 10 industry Salary (Yuan) Last 10 industry Salary (yuan)
Security activities 172123 Animal husbandry 10803
Other financial activities 87670 Farming 11590
Air transport 75769 Forestry 11716
Software industry 74610 Processing of timbers, manufacture of wood, bamboo, rattan, palm, and straw products
15663
Computer services 74324 Textile manufacture 16222
Source: China Statistical Year Book 2009, China Statistics Press.
The minimum wage regulation was first laid down in 1993 by the Ministry of Labor and only applies to enterprises. The latest regulation was published by the Ministry of Labor and So-cial Security in 2003. The regulation applies to all kinds of economic units and has been modified several times. The estimate approach to minimum wages is standardized, but each province is allowed to lay down their own minimum wages, in which the top is almost twice that of the bottom.6 Also, the minimum wage still does not apply to rural residents. E. Poverty and the social security system According to World Bank data, China had removed 235 million people from absolute poverty by 2008 (Pang, 2008). However, there is no national criterion for »absolute poverty« as each province establishes its own criteria, and the dual standard for urban-rural households also undermines the measurement of poverty. Despite this, China has still had remarkable suc-cess in poverty reduction, mainly in rural areas. Rapid urbanization has increased the pro-portion of citizenship to almost 50 percent7 and thus has improved overall living standards because of the better social security system for urban households. However, there has been no strong improvement for low income households but only for high income ones, both urban and rural. The low income group has a lower annual income growth rate than that of the high
6 By 2012, the highest minimum wage was 1,500 yuan per month in Shenzhen, and the lowest was 870 yuan, in Jiangxi.
7 According to China Statistical Year Book 2011, the urban proportion of the population was 49.95 percent in 2010.
12
Quan Heng et al. How to produce socially just, sustainable and
green dynamic growth for a Good Society
A case study for China
income group. Thus, from 1995 to 2010, the urban income gap expanded from 4,278.2 yuan to 33,621.1 yuan, although it is also worth mentioning the rising trends of net income levels among rural residents as a whole over 5,000 yuan.
In addition, the social security system is still far from satisfactory. The social security system in China mainly includes pension funds, public insurance, welfare, subsidies, charities and personal savings. But the system is also split into urban and rural parts, and each province has a separate system that is not well connected with the others. There are trans-provincial obstacles and this leads to problems such as retirement pension withdrawal by migrant workers and difficulties in trans-provincial healthcare payments. However, recently, changes have been implemented to improve the social security system, including urban and rural system unification and trans-provincial information sharing. Social security reforms have emphasized both coverage and quality.
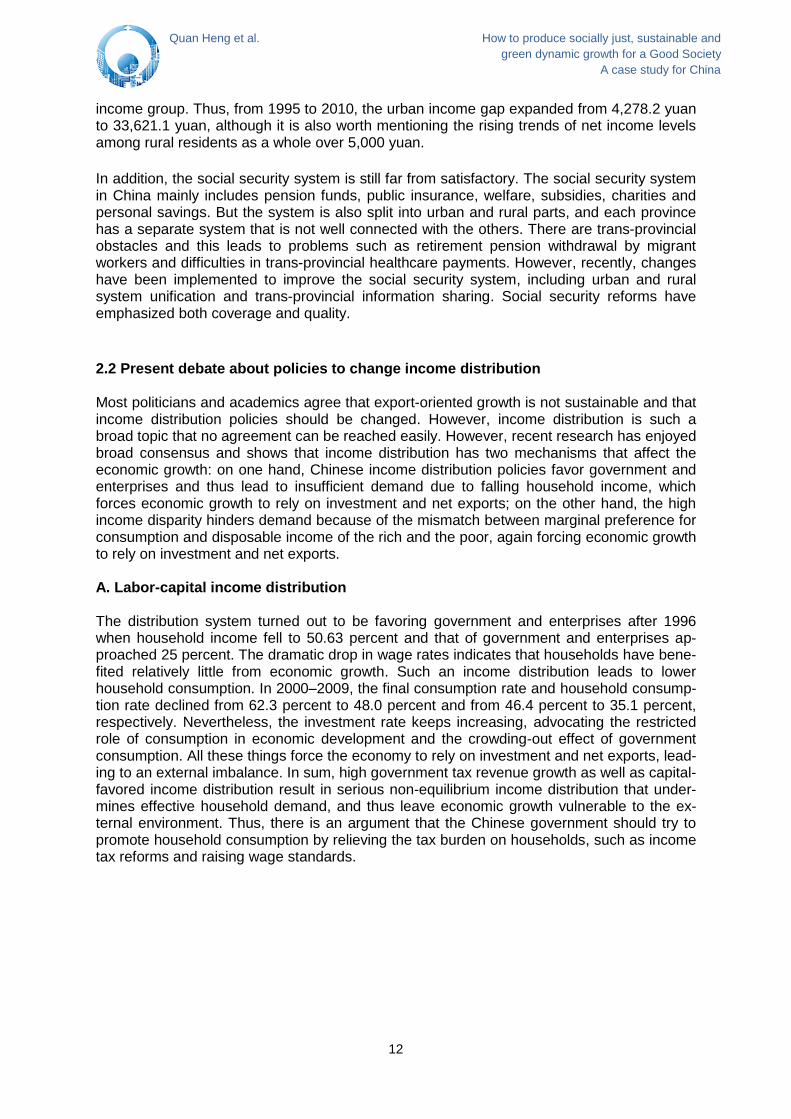
2.2 Present debate about policies to change income distribution Most politicians and academics agree that export-oriented growth is not sustainable and that income distribution policies should be changed. However, income distribution is such a broad topic that no agreement can be reached easily. However, recent research has enjoyed broad consensus and shows that income distribution has two mechanisms that affect the economic growth: on one hand, Chinese income distribution policies favor government and enterprises and thus lead to insufficient demand due to falling household income, which forces economic growth to rely on investment and net exports; on the other hand, the high income disparity hinders demand because of the mismatch between marginal preference for consumption and disposable income of the rich and the poor, again forcing economic growth to rely on investment and net exports. A. Labor-capital income distribution The distribution system turned out to be favoring government and enterprises after 1996 when household income fell to 50.63 percent and that of government and enterprises ap-proached 25 percent. The dramatic drop in wage rates indicates that households have bene-fited relatively little from economic growth. Such an income distribution leads to lower household consumption. In 2000–2009, the final consumption rate and household consump-tion rate declined from 62.3 percent to 48.0 percent and from 46.4 percent to 35.1 percent, respectively. Nevertheless, the investment rate keeps increasing, advocating the restricted role of consumption in economic development and the crowding-out effect of government consumption. All these things force the economy to rely on investment and net exports, lead-ing to an external imbalance. In sum, high government tax revenue growth as well as capital-favored income distribution result in serious non-equilibrium income distribution that under-mines effective household demand, and thus leave economic growth vulnerable to the ex-ternal environment. Thus, there is an argument that the Chinese government should try to promote household consumption by relieving the tax burden on households, such as income tax reforms and raising wage standards.
13
Quan Heng et al. How to produce socially just, sustainable and
green dynamic growth for a Good Society
A case study for China
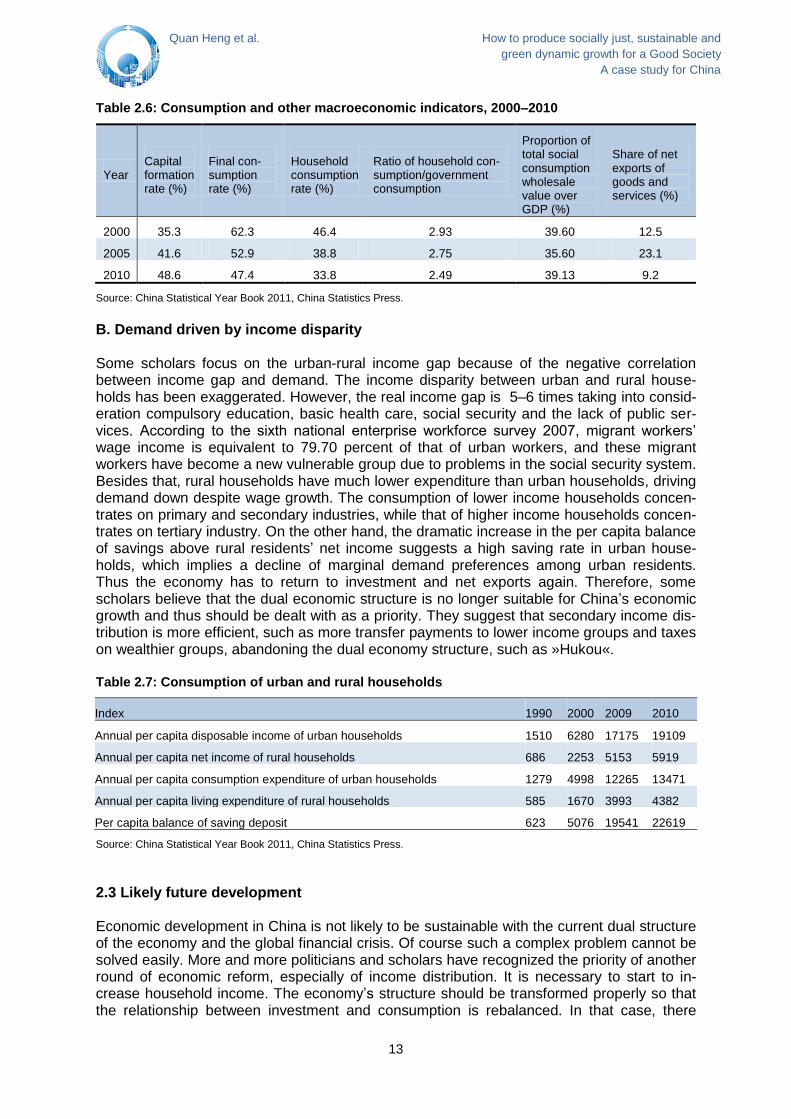
Table 2.6: Consumption and other macroeconomic indicators, 2000–2010
Year Capital formation rate (%)
Final con-sumption rate (%)
Household consumption rate (%)
Ratio of household con-sumption/government consumption
Proportion of total social consumption wholesale value over GDP (%)
Share of net exports of goods and services (%)
2000 35.3 62.3 46.4 2.93 39.60 12.5
2005 41.6 52.9 38.8 2.75 35.60 23.1
2010 48.6 47.4 33.8 2.49 39.13 9.2
Source: China Statistical Year Book 2011, China Statistics Press.
B. Demand driven by income disparity Some scholars focus on the urban-rural income gap because of the negative correlation between income gap and demand. The income disparity between urban and rural house-holds has been exaggerated. However, the real income gap is 5–6 times taking into consid-eration compulsory education, basic health care, social security and the lack of public ser-vices. According to the sixth national enterprise workforce survey 2007, migrant workers’ wage income is equivalent to 79.70 percent of that of urban workers, and these migrant workers have become a new vulnerable group due to problems in the social security system. Besides that, rural households have much lower expenditure than urban households, driving demand down despite wage growth. The consumption of lower income households concen-trates on primary and secondary industries, while that of higher income households concen-trates on tertiary industry. On the other hand, the dramatic increase in the per capita balance of savings above rural residents’ net income suggests a high saving rate in urban house-holds, which implies a decline of marginal demand preferences among urban residents. Thus the economy has to return to investment and net exports again. Therefore, some scholars believe that the dual economic structure is no longer suitable for China’s economic growth and thus should be dealt with as a priority. They suggest that secondary income dis-tribution is more efficient, such as more transfer payments to lower income groups and taxes on wealthier groups, abandoning the dual economy structure, such as »Hukou«. Table 2.7: Consumption of urban and rural households
Index 1990 2000 2009 2010
Annual per capita disposable income of urban households 1510 6280 17175 19109
Annual per capita net income of rural households 686 2253 5153 5919
Annual per capita consumption expenditure of urban households 1279 4998 12265 13471
Annual per capita living expenditure of rural households 585 1670 3993 4382
Per capita balance of saving deposit 623 5076 19541 22619
Source: China Statistical Year Book 2011, China Statistics Press.
2.3 Likely future development Economic development in China is not likely to be sustainable with the current dual structure of the economy and the global financial crisis. Of course such a complex problem cannot be solved easily. More and more politicians and scholars have recognized the priority of another round of economic reform, especially of income distribution. It is necessary to start to in-crease household income. The economy’s structure should be transformed properly so that the relationship between investment and consumption is rebalanced. In that case, there
14
Quan Heng et al. How to produce socially just, sustainable and
green dynamic growth for a Good Society
A case study for China
should be effective political involvement to guide society towards harmony in income distri-bution. The aim would be to shape current income distribution to establish institutional safe-guard. Therefore, as most scholars have suggested, the Chinese government should probably in-crease public education expenditure to narrow the human capital gap and push forward the experiment of personal financial accounts so that individual income levels can be monitored. Then, the fiscal system should be improved and better use made of income redistribution, which would improve social protection and set up a real social security network. Also, the government should facilitate rural economic development and establish a long-term mecha-nism to enhance rural households’ incomes.
3. World market strategy and protection from external shocks 3.1 Past integration into the world market Since Deng Xiaoping’s »opening-up« got under way and reforms began to be implemented in 1978, China’s progressive foreign trade and investment policies have achieved much. As a consequence of these reforms China’s exports soared from US$9.75 billion in 1978 to US$1201 billion in 2009, when China became the world’s largest exporter, proceeding to US$2050 billion in 2012. China now accounts for 11 percent of world exports. For more than two decades, foreign direct investment (FDI) inflows to China have increased dramatically, from US$3.48 billion in 1990 to US$40.72 billion in 2000, leaping to US$116.01 billion in 2011 and US$111.72 billion in 2012. These flows are by far the largest of any developing country and have remained remarkably stable and robust in recent years. China’s GDP rep-resents 12 percent of the world economy. The success story of China’s integration into the world market has been widely appraised and discussed. A. Trade balance China’s growth as a trading nation and manufacturing powerhouse has reached the point at which developments there have a global impact. It has enjoyed high average export growth rates of 12.5 percent, which have grown much more rapidly than GDP, for the past 30 years. Prior to 1978, China’s trade/GDP ratio never significantly exceeded 5 percent. Apart from the launching of the »Reform and Opening-up« policy in November 1978, another institutional change of trade policy reform began with China’s formal joining of the World Trade Organi-zation (WTO), on December 11, 2001. WTO accession marked a watershed in the evolution of China’s trade policy and its share of world merchandise exports has nearly tripled, rising from 3.93 to 11 percent between 2001 and 2012. The data in Table 3.1 clearly suggest that China’s export success has so far been underpinned largely by its comparative advantage in the global market. Exports seem to be a major growth driver in China, with a ratio to GDP of around 25 percent in the past decade. Total imports to China in 2011 were worth US$1744 billion, which means an average annual increase of more than 20 percent since 2002. An economy’s openness to imports is the most important dimension of its overall openness to trade, since it indicates both an openness to competition and access to the lowest-cost sup-pliers. China’s imports as a share of GDP have climbed strongly, reaching 28 percent in 2007 and falling to 21 percent of GDP in 2012. This is due to rising living standards in China which allow Chinese people to import goods from international markets. China’s exports increased by 31 percent in 2010 and 20 percent in 2011, while its imports rose much more quickly, at an astonishing 38.8 percent and 24.9 percent, respectively. Both rising exports and rising imports boosted the economy in the face of global economic reces-sion, promoting production and employment.

15
Quan Heng et al. How to produce socially just, sustainable and
green dynamic growth for a Good Society
A case study for China
Figure 3.1: Growth of exports and imports in China
Sources: China Statistical Yearbook, 2012, p. 234; http://www.mofcom.gov.cn
The trade account showed a surplus of 1.70 percent of GDP in 2001 and 1.67 percent in 2004, but it rose significantly in 2007 to 7.62 percent, which resulted in a political debate on trade policy and exchange rate policy between China and the United States. China’s mer-chandise trade surplus for 2010 totaled US$183 billion, roughly 7 percent less than the US$196 billion it recorded in 2009, and 39 percent less than the nearly US$300 billion sur-plus in 2007. Obviously, in the previous four years, the trade account surplus in relation to GDP decreased dramatically, standing at 2.10 percent of GDP in 2012. Table 3.1: China’s trade performance, selected years (US$ billion)
Year Trade/GDP Total trade Exports Imports Balance Surplus/GDP
1978 9.74 20.64 9.75 10.89 –1.14 –0.54
1992 33.87 165.53 84.94 80.59 4.35 0.87
2001 38.47 509.65 266.10 243.55 22.55 1.70
2002 42.70 620.77 325.60 295.17 30.43 2.09
2008 57.29 2563.26 1430.79 1132.57 298.12 6.65
2009 44.19 2207.54 1201.61 1005.92 195.69 3.93
2010 50.25 2974.00 1577.75 1396.24 181.51 3.07
2011 49.99 3641.86 1898.38 1743.48 154.90 2.13
2012 43.80 3866.76 2049.83 1817.83 231.00 2.10
Sources: China Statistical Yearbook, 2012, p.234; http://www.mofcom.gov.cn
China has enjoyed a surplus in both its current account and its capital and financial account since 1994. It uses the twin surpluses to accumulate reserves. Total reserves reached US$3.2 trillion in 2011, roughly 38 percent of estimated GDP. China recorded a trade sur-plus of US$231 billion in 2012. Export growth has continued to be a major component sup-porting its rapid economic growth. B. Structure of exports and imports Merchandise accounts for nearly all exports in comparison to services and almost all mer-chandise exports are produced in the manufacturing sector. China’s export basket seems to be moving up-market into higher value goods. A simple analysis using data on the category composition of exports and imports may shed some light on Chinese trends. The composition of exports has been changing rapidly, away from cloth-
0
500
1000
1500
2000
2500
Exports Imports
US$ billion

16
Quan Heng et al. How to produce socially just, sustainable and
green dynamic growth for a Good Society
A case study for China
ing, footwear, other light manufactures and fuel, which dominated its exports in the 1980s and early 1990s, toward office machinery, telecommunications and industrial supplies in the late 1990s and automated data processing equipment, consumer electronics and automo-biles in recent years. According to statistical data (Table 3.2), the exports of primary goods decreased dramatically from 25.6 percent in 1990 to 5.30 percent in 2011, while manufactur-ing goods increased from 74.41 percent to 94.70 percent. In relative terms, machinery and electronic goods have been the major winners and have come to dominate exports, rising from 9 percent in 1990 to 35.66 percent in 2001 and to 47.50 percent in 2011, while miscel-laneous goods have experienced a big decline, falling from 32.74 percent to 24.20 percent between 2001 and 2011. Among major exporters, foreign invested enterprises (FIE) have been the motor of China’s export expansion. From a small base, FIEs gradually became important players in China’s export growth. FIEs have inexorably increased their share of total exports every year, starting from only 1 percent in 1985 and reaching 48 percent in 2000. Since then, FIEs increased their share to 55 percent in 2010 and – a slight fall – 54 percent in 2011. Table 3.2: Composition of exports, selected years (unit: %)
Year 1990 2001 2011
Percentage 100.00 100.00 100.00
Primary goods 25.59 9.90 5.30
Manufactured goods 74.41 90.10 94.70
Chemicals 6.01 5.02 6.05
Light industries and related goods 20.25 16.47 16.83
Machinery, electronic and transportation goods 9.00 35.66 47.50
Miscellaneous 20.43 32.74 24.20
Non-classified 18.72 0.22 0.12
Sources: China Statistical Yearbook, various issues.
Along with the growth of China’s exports there has been rapid growth of imports of sophisti-cated products, which has the effect of technology diffusion, thereby improving industrial capacity. In particular, the import of machinery and electronics increased from 36.74 percent in 1990 to 43.94 percent in 2001. However, the import share of machinery and electronics has declined rapidly, from 43.94 percent to 36.17 percent between 2001 and 2011. Another notable feature is the rapidly rising share of primary goods, from 18.78 percent to 34.66 per-cent of total imports. It is generally assumed that China will continue to increase its imports of primary goods, particularly mineral fuels. C. Trade diversification As an emerging large economy, China has global trading interests, particularly in neighbor-ing countries. Figure 3.2 illustrates China’s export diversification. Asia has been the major destination of China’s exports, but gradually declined from 52.96 percent to 47.36 percent between 2001 and 2011; it also declined as a source of China’s imports, from 60.42 percent to 57.59 percent. Europe took 21.79 percent and the United States 18.44 percent of China’s exports in 2011. Together, three regions accounted for 87.59 percent of its exports and 82.34 percent of its imports.

17
Quan Heng et al. How to produce socially just, sustainable and
green dynamic growth for a Good Society
A case study for China
Figure 3.2: Diversification of China’s exports in 2011
Source: China Statistical Yearbook, 2012, pp. 242–245.
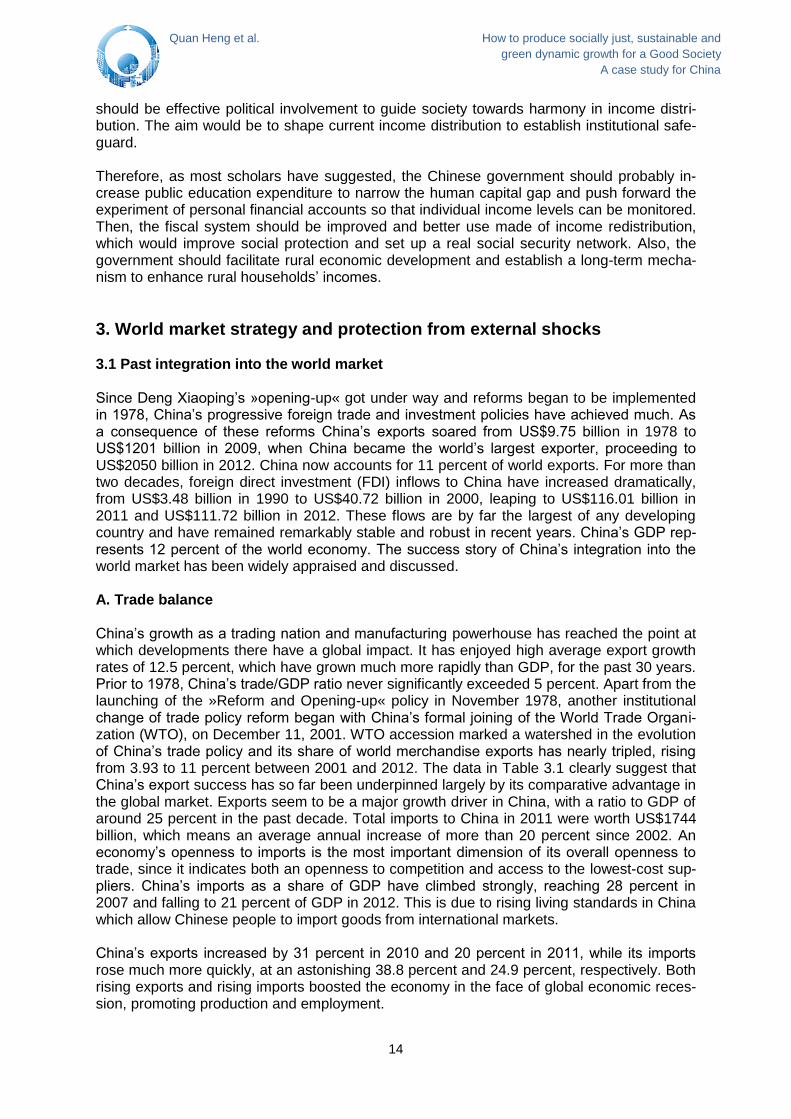
According to the new policy initiated by the Ministry of Commerce, strengthening trade rela-tions with Africa and Latin America has been encouraged. It is worth noting that China’s ex-ports to Africa and Latin America have experienced a gradual increase, rising from 2.26 per-cent to 3.85 percent and 3.10 percent to 6.41 percent, respectively, while its imports have also increased, from 3.10 percent to 6.41 percent for Africa and from 2.75 percent to 6.86 percent for Latin America. D. FDI and ODI In today’s global economy, trade and investment are increasingly closely linked. In China, too, trade growth has been driven by foreign direct investment. China decided to accept for-eign investment in 1978 and broke sharply with socialist orthodoxy in 1979. Subsequently, incoming FDI grew steadily through the 1980s. Beginning in 1992–1993, FDI-friendly policies were put in place, the stream of incoming FDI turned into a flood and annual inflows were around US$45 billion between 1996 and 2001. These flows have been remarkably stable despite fluctuations during the Asian financial crisis. In the meantime, trending steadily up-ward, FDI inflows stood at US$92 billion in 2008 and declined slightly to US$90 billion in 2009 due to the global recession. However, FDI inflows rose to US$106 billion in 2010 and US$116 billion in 2011, respectively, which shows that China’s FDI inflows have recovered fully. Two special and distinctive characteristics have marked investment over the past decade. First, foreign direct investment, from which China has gained access to global capital, ac-counted for 96.39 percent of total investment in the period 2002–2011. Second, a large pro-portion of Chinese FDI inflows has gradually been diversified away from manufacturing. Until 2005, manufacturing accounted for around 70 percent of actually utilized foreign direct in-vestment. Since then, the share of FDI inflows to manufacturing has declined rapidly, falling from 70 percent in 2005 to 45 percent in 2011. One notable feature is illustrated in Table 3.3. Three service sectors that accounted for a large proportion of FDI inflows (38 percent) in 2011 stand out: real estate (23.17 percent), wholesale and retail (7.26 percent) and leasing and business services (7.22 percent), compared to a lower level of 19 percent in 2001. Chi-na’s accession to the WTO involves commitments to dramatically lower barriers for services to foreign investors. This impact is evident in the investment numbers.
47,36
21,79
18,44
3,85 6,41 2,15
Asia
Europe
North America
Africa
Latin america
Others
18
Quan Heng et al. How to produce socially just, sustainable and
green dynamic growth for a Good Society
A case study for China
Table 3.3: Foreign direct investment actually utilized by sector, selected years
2001 2011
US$ billion % US$ billion %
Total 46.88 100.00 116.01 100.00
Manufacturing 30.91 65.93 52.10 44.91
Wholesale and retail 1.17 2.50 8.42 7.26
Financial intermediation 0.04 0.09 1.91 1.65
Real estate 5.14 10.96 26.88 23.17
Leasing and business services 2.60 5.55 8.38 7.22
Sub-total 39.86 85.03 97.69 84.21
Others 7.02 14.97 18.32 15.79
Sources: China’s Statistical Yearbook, 2002, p. 634; 2012, p. 258.
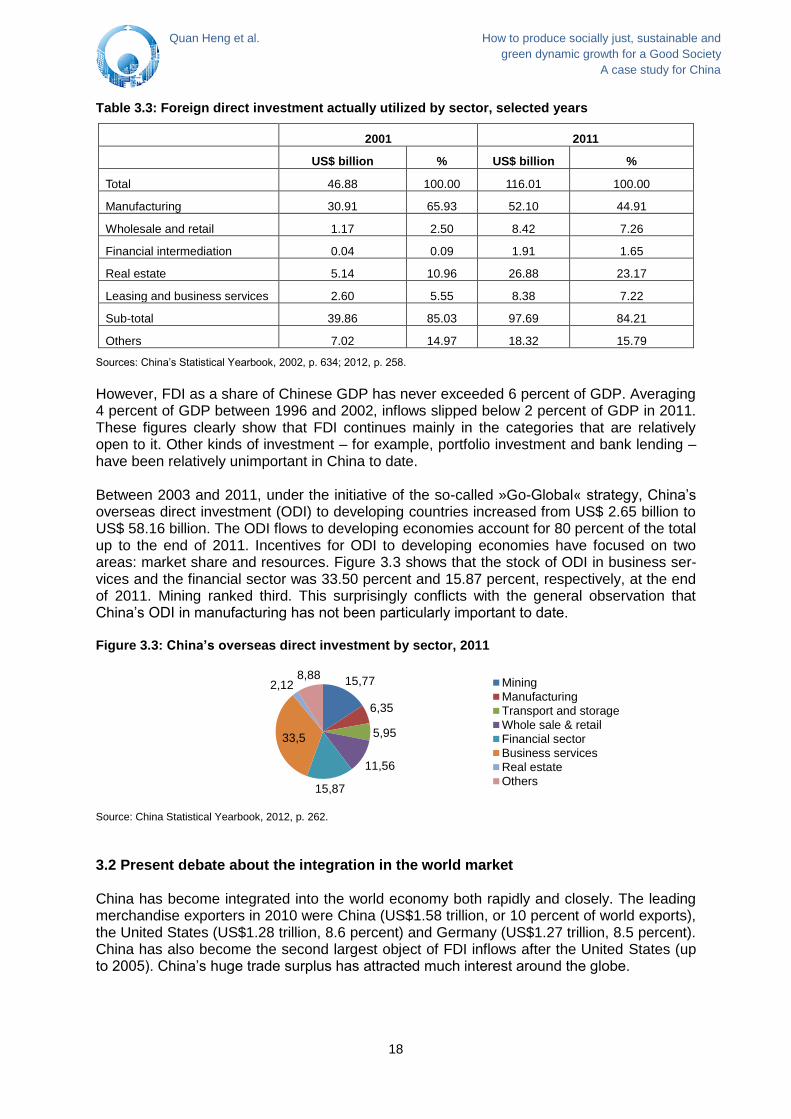
However, FDI as a share of Chinese GDP has never exceeded 6 percent of GDP. Averaging 4 percent of GDP between 1996 and 2002, inflows slipped below 2 percent of GDP in 2011. These figures clearly show that FDI continues mainly in the categories that are relatively open to it. Other kinds of investment – for example, portfolio investment and bank lending – have been relatively unimportant in China to date. Between 2003 and 2011, under the initiative of the so-called »Go-Global« strategy, China’s overseas direct investment (ODI) to developing countries increased from US$ 2.65 billion to US$ 58.16 billion. The ODI flows to developing economies account for 80 percent of the total up to the end of 2011. Incentives for ODI to developing economies have focused on two areas: market share and resources. Figure 3.3 shows that the stock of ODI in business ser-vices and the financial sector was 33.50 percent and 15.87 percent, respectively, at the end of 2011. Mining ranked third. This surprisingly conflicts with the general observation that China’s ODI in manufacturing has not been particularly important to date. Figure 3.3: China’s overseas direct investment by sector, 2011
Source: China Statistical Yearbook, 2012, p. 262.
3.2 Present debate about the integration in the world market China has become integrated into the world economy both rapidly and closely. The leading merchandise exporters in 2010 were China (US$1.58 trillion, or 10 percent of world exports), the United States (US$1.28 trillion, 8.6 percent) and Germany (US$1.27 trillion, 8.5 percent). China has also become the second largest object of FDI inflows after the United States (up to 2005). China’s huge trade surplus has attracted much interest around the globe.
15,77
6,35
5,95
11,56
15,87
33,5
2,12 8,88
Mining
Manufacturing
Transport and storage
Whole sale & retail
Financial sector
Business services
Real estate
Others

19
Quan Heng et al. How to produce socially just, sustainable and
green dynamic growth for a Good Society
A case study for China
A. Trade of sophisticated products Over time Chinese exports have exhibited increasing sophistication relative to countries with similar aggregate endowments. Now China has emerged as a major producer and exporter of machinery and electronic products. Does China’s rapidly growing trade roughly conform with its comparative advantage, allowing firms to move up the technology ladder much more rapidly than would occur in a market economy with factor endowments similar to China? The principle of comparative advantage dictates that trade patterns are determined by how relative costs of production within a country differ from those in the rest of the world. Accord-ing to the neoclassical model, the basis for trade arises not because of inherent technologi-cal differences in labor productivity for different commodities between different countries but because countries are endowed with different factor supplies. China with its cheap labor has a relative cost and price advantage over countries with relatively expensive labor in com-modities that make abundant use of labor. Surprisingly, however, China’s exports do not consist only of low-technology products, but also – increasingly – of intermediate-technology and even high-technology exports. This has given rise to a heated debate on its established trade policy. Some economists argue that most of China’s electronic and information tech-nology products should not be considered high tech, because it imports most of their high-value-added components. China, in short, does not in any real sense manufacture these goods, but assembles them from imported parts and components. Thus, China’s exports of electronics and machinery have generally been in the low value-added category with the labor intensive portion of the production process being conducted in China (Athukorala 2009). This leads these economists to the view that, even though China became the largest exporter in the decade to 2012, it is unlikely to export advanced technology products much for years to come. Besides, most exports of technology products are assembled not by Chi-nese-owned firms but by foreign invested firms that are using China as an export platform (Branstetter and Lardy 2008). However, this view has been challenged by many observers. Although a few studies mentioned the role of technology in China’s export dynamics in the late 1990s, the contribution of sophisticated exports to economic growth was not widely rec-ognized until recent publications such as »What’s so special about China’s exports?« (Ro-drik 2006). One major argument concerning China’s export of sophisticated products can be summed up as follows: Once investors in a country »discover« a number of higher productiv-ity products that can be exported, this set off a powerful demonstration effect. Other inves-tors are drawn in, and as the sector and its suppliers expand, resources get pulled from low-productivity activities into higher productivity ones. This kind of growth driven by differential productivity across sectors and structural change lies at the root of China’s export perfor-mance (Rodrik 2006). Therefore, the case of China indicates that the export of sophisticated products is not a special privilege of developed economies. Globally, the measure of export power is manufacturing industry. China was the largest pro-ducer of manufacturing goods in terms of value-added in 2012. Most studies reveal that Chi-na’s comparative advantage has been in its rapid development from unskilled labor to semi-skilled and skilled labor, supported by compulsory nine-year schooling (introduced in 1993) and the development of higher education since 1999. The arrow of history points in the di-rection of human capital formation and innovation. Here, China has a clear and substantial advantage. B. Yuan exchange rates On January 1, 1994, a »managed float« was established for the Chinese currency, the yuan (RMB). Following the Asian financial crisis of 1997–1998, policymakers in China decided to hold the line and not allow the currency to be depreciated. The managed float gradually be-

20
Quan Heng et al. How to produce socially just, sustainable and
green dynamic growth for a Good Society
A case study for China
came a de facto fixed exchange rate vis-à-vis the US dollar. In July 2005, the People’s Bank of China announced a new managed floating exchange rate system that entailed an initial 2.1 percent appreciation of the currency to a new parity of 8.11 to the US dollar. This is seen as a move to a more fully free-market floating of the yuan. During the onset of the global financial crisis, the yuan was unofficially re-pegged to the US dollar. It was again de-pegged from the dollar in June in 2010. The yuan has appreciated against the dollar by 9 percent since June 2010. The value of the yuan is now at the forefront of discussions in world economic circles. The yuan has a managed floating rate with reference to a basket of currencies. The US Con-gress and some American economists have argued repeatedly that, under current economic conditions, the value of the yuan should appreciate from 5 to 30 percent against the US dol-lar. However, Chinese Premier Wen stated that drastic appreciation of the Chinese yuan from 20 to 40 percent would cause disastrous bankruptcies and job losses for millions of people. Some scholars provide evidence that the real trade volume and real investment vol-ume in China are significant factors of FDI inflows to China. In addition, there is no evidence indicating that the yuan exchange rate is a determinant of FDI inflows to China (Jin Hongfe et al. 2012). Other Chinese economists insist that Chinese policy will gradually shift to yuan appreciation in order to reduce the trade surplus and domestic inflation. Given these realities, yuan revaluation will be an endless debate if only partial adjustments are undertaken and an imperfectly flexible exchange rate regime is adopted because the Chinese economy tends to gain in competitiveness over time due to rapid progress in labor productivity (Dai Meixing 2011). Various initiatives are under way that will better coordinate China’s currency rate policy with domestic financial reform measures. C. Accumulation and diversification of reserves China has accumulated large foreign exchange reserves since 2002. It needs foreign ex-change (FX) reserves to protect itself in the event of a financial crisis, but with a portfolio of near US$3.2 trillion, it is difficult to imagine a scenario in which the FX reserves would be drawn down to a low level. However, a numerical simulation shows that the theoretical opti-mal ratio of reserve/GDP is 28.9 percent in the sample. So the optimal ratio of reserves/GDP is 30–40 percent for China (Yang Yi and Tao Yongcheng 2011). Even in the strong expecta-tion of currency appreciation, the current account surplus has been US$283.3 billion a year for the six years since the currency appreciation, while the capital account surplus has aver-aged US$117.0 billion annually. Therefore, China’s double surplus in international transac-tions has not changed (Li Yi, Xiao Jiwu, Cui Jiangjun 2012). Taking risks into consideration, China’s FX reserves will gradually be diversified. Investment in US and European govern-ment debt has been one path and investment in global resources and technology sectors in developed countries could be another. D. Yuan internationalization The capital account was not convertible at the end of 2012. A flexible exchange rate would adjust to long-term changes in supply and demand on foreign exchange markets to stabilize the currency. However, many Chinese economists have expressed ideas about a gradualist liberalization of the capital account through domestic financial reform. Furthermore, the issue of yuan internationalization has increasingly become the focus of academic attention. Most economists favor yuan internationalization, while some are against it or remain skeptical. For instance, the use of the yuan on international markets has been very limited in terms of scope and scale and it is far from becoming an international currency in the real sense (Gao Haihong and Yu Yongding 2010).
21
Quan Heng et al. How to produce socially just, sustainable and
green dynamic growth for a Good Society
A case study for China
3.3 Likely future development China’s economy has slowed down in 2012, as reflected in export growth. However, the slowdown is policy-guided and recovered from the fourth quarter of 2012. There are many positive factors in China’s integration in the world economy, such as better education and technical know-how filtering through the workforce. In many ways, the fundamentals of Chi-na’s economy still look good. All this is »easy growth« during the economy’s catch-up phase; even GDP per capita in China rapidly increased from US$950 in 2000 to US$6,200 in 2012, which is equivalent to one-eighth of the high-income countries and still relatively lower than the global average figure of US$9069 in 2010. Based on this economic situation, we look to the future and map out our thinking on how China’s integration into the world economy and external policy will evolve over 2013–2015. Just as one can expect a continuing growth trend, our base scenario is that there is a chance that China will make continued progress on the upgrading of the value-chain in man-ufacturing exports. While we believe global concerns about a slow growth rate for China’s exports are overdone, we see potential for long-term growth of both exports and imports. The export growth rate will be above 10 percent in the coming three years, as commonly estimated. As a result, China’s external trade will enter a new wave of growth. If this hap-pens, total imports should be more than US$2.5 trillion by the end of 2015, increasing 40 percent within three years. Furthermore, we expect that FDI will remain strong. New signs of a double-digit growth strategy will allow for further bullishness in relation to domestic de-mand, anticipated by FDI. What are the prospects of yuan internationalization? China will continue to move gradually on yuan appreciation without a major shock to export sectors. It is time for China to push yuan internationalization and reform the exchange rate regime from a managed and basket-based floating to a free-market floating system. Concerning the future of capital account convertibility, it is likely to remain a long-term goal of China instead of a short-term step, de-spite the huge accumulation of reserves. Chinese policymakers initially displayed a preference for direct investment, primarily be-cause it brought technology as well as capital. As a result, foreign borrowing has been a small part of overall capital inflows. At the end of 2011, China’s total foreign debt was a manageable US$695.0 billion (21 percent of total FX and 9.3 percent of GDP). Of the total debt, US$500 billion was short-term borrowing and US$195 billion was borrowed from gov-ernments or international organizations. The message is clear: China should quickly pay its foreign debt and stop any more foreign borrowing from overseas agencies. The future chal-lenge for China will be how quickly and reasonably it can cease to be a debtor and become a global creditor. The second meeting of the eighteenth Central Politburo, held on 4 December, provided a preview of the central government’s economic policy stance for 2013 and after. The focus is on maintaining the continuity and stability of economic policy in 2013 amidst positive factors and challenges, and on adjusting policy properly and in a timely manner. The outlook ap-pears to be no clear change to the export-oriented policy of recent decades.
4. Green New Deal and ecological problems in China 4.1 Overview about ecological problems In the course of its economic transformation China has become not only the manufacturing center of Asia, but also an energy consumption center of the world. At the same time, China

22
Quan Heng et al. How to produce socially just, sustainable and
green dynamic growth for a Good Society
A case study for China
has experienced a period of ecological problems, including declining air quality, character-ized in particular by large amounts of greenhouse gas emissions, water pollution, land des-ertification and deforestation and unreasonable development of oil fields and mines. With the development of its economy, China’s ecological problems have gradually come to the world’s attention Air quality: The worsening air quality is becoming one of the major concerns of China’s en-vironment development. Previously, the discussion was concentrated more on the green-house gas (GHG) emission problem. However, concerns have broadened, bringing smoke, particulate matters (PM) and other pollutants into the discussion. Air quality is usually evaluated using the air pollution index (API), based on the concentration levels of several pollutants. Figure 4.1 shows the air quality in major cities in China from the perspective of selected pollutants, such as PM, sulphur dioxide and nitrogen dioxide. The purple line indicates the proportion of days in a year when air quality is equal to or above grade II, which is the non-pollution level. More than half of the major cities cannot achieve the 90 percent annual non-pollution quality level. The worst is just over 60 percent. Other data suggest that over a quarter of Chinese cities suffer from air pollution in terms of their API levels. Figure 4.1: Ambient air quality in major cities (2010)
Source: China Environmental Statistical Yearbook 2011.
Figure 4.2: Distribution of urban air quality levels
Source: China Environmental Statistical Yearbook 2011.
0,0
10,0
20,0
30,0
40,0
50,0
60,0
70,0
80,0
90,0
100,0
0,000
0,020
0,040
0,060
0,080
0,100
0,120
0,140
0,160
0,180
Particulate Matters
Sulphur Dioxide
Nitrogen Dioxide
Proportion of Days of Air Quality Equal to or above Grade II in the Whole Year (%)
23
Quan Heng et al. How to produce socially just, sustainable and
green dynamic growth for a Good Society
A case study for China
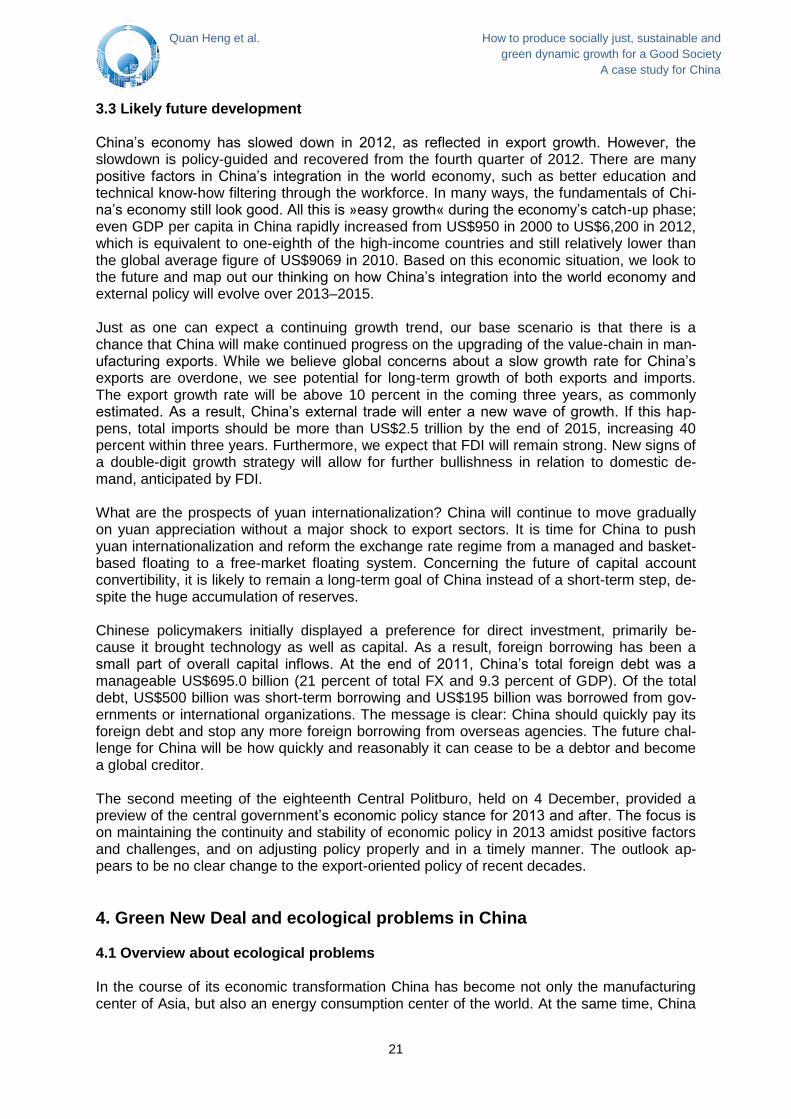
From the perspective of information disclosure, China also lags behind compared to other countries around the world. According to research by the Institute of Public and Environmen-tal Affairs (IPE), the air quality transparency index (AQTI) is used to test information disclo-sure about air quality in 20 Chinese cities, as well as 10 cities outside mainland China. The results are shown in Table 4.1. The average levels of AQTI computed for cities within and outside the Chinese mainland are characterized by a huge gap, ranging from 22.7 to 73.7. We should emphasize that air quality disclosure is the first step in the process of enhancing air quality in China. Only by evaluating the current situation can we locate the problems and then take measures to deal with them. Table 4.1: AQTI for selected cities (2010)
Note: VOC: Volatile Organic Compound. Source: Public and Environmental Affairs (IPE).
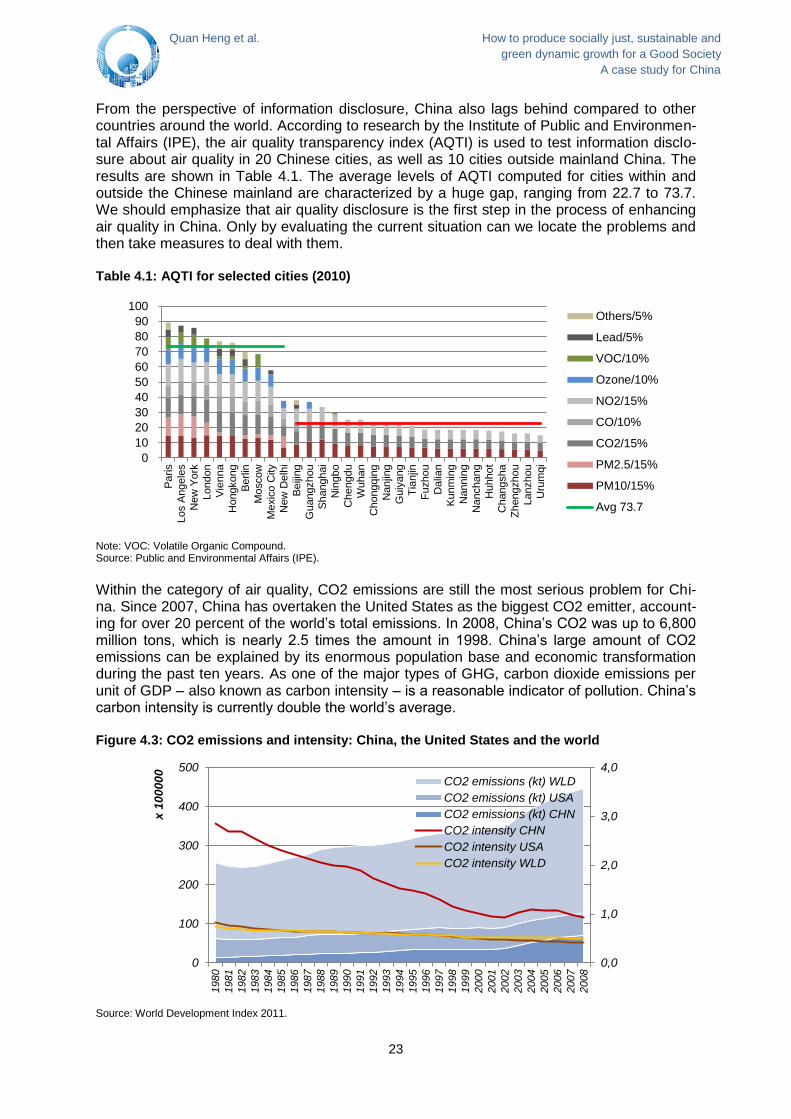
Within the category of air quality, CO2 emissions are still the most serious problem for Chi-na. Since 2007, China has overtaken the United States as the biggest CO2 emitter, account-ing for over 20 percent of the world’s total emissions. In 2008, China’s CO2 was up to 6,800 million tons, which is nearly 2.5 times the amount in 1998. China’s large amount of CO2 emissions can be explained by its enormous population base and economic transformation during the past ten years. As one of the major types of GHG, carbon dioxide emissions per unit of GDP – also known as carbon intensity – is a reasonable indicator of pollution. China’s carbon intensity is currently double the world’s average. Figure 4.3: CO2 emissions and intensity: China, the United States and the world
Source: World Development Index 2011.
0
10
20
30
40
50
60
70
80
90
100
Pa
ris
Los A
ngele
s
New
York
London
Vie
nn
a
Hongkong
Be
rlin
Mo
scow
Me
xic
o C
ity
New
Delh
i
Be
ijing
Guangzhou
Sh
anghai
Nin
gbo
Chengd
u
Wuhan
Chongq
ing
Nanjin
g
Guiy
ang
Tia
njin
Fu
zhou
Dalia
n
Ku
nm
ing
Nannin
g
Nanchang
Huhhot
Changsha
Zh
engzho
u
Lanzhou
Uru
mq
i
Others/5%
Lead/5%
VOC/10%
Ozone/10%
NO2/15%
CO/10%
CO2/15%
PM2.5/15%
PM10/15%
Avg 73.7
0,0
1,0
2,0
3,0
4,0
0
100
200
300
400
500
1980
1981
1982
1983
1984
1985
1986
1987
1988
1989
1990
1991
1992
1993
1994
1995
1996
1997
1998
1999
2000
2001
2002
2003
2004
2005
2006
2007
2008
x 1
00
00
0
CO2 emissions (kt) WLD
CO2 emissions (kt) USA
CO2 emissions (kt) CHN
CO2 intensity CHN
CO2 intensity USA
CO2 intensity WLD
24
Quan Heng et al. How to produce socially just, sustainable and
green dynamic growth for a Good Society
A case study for China
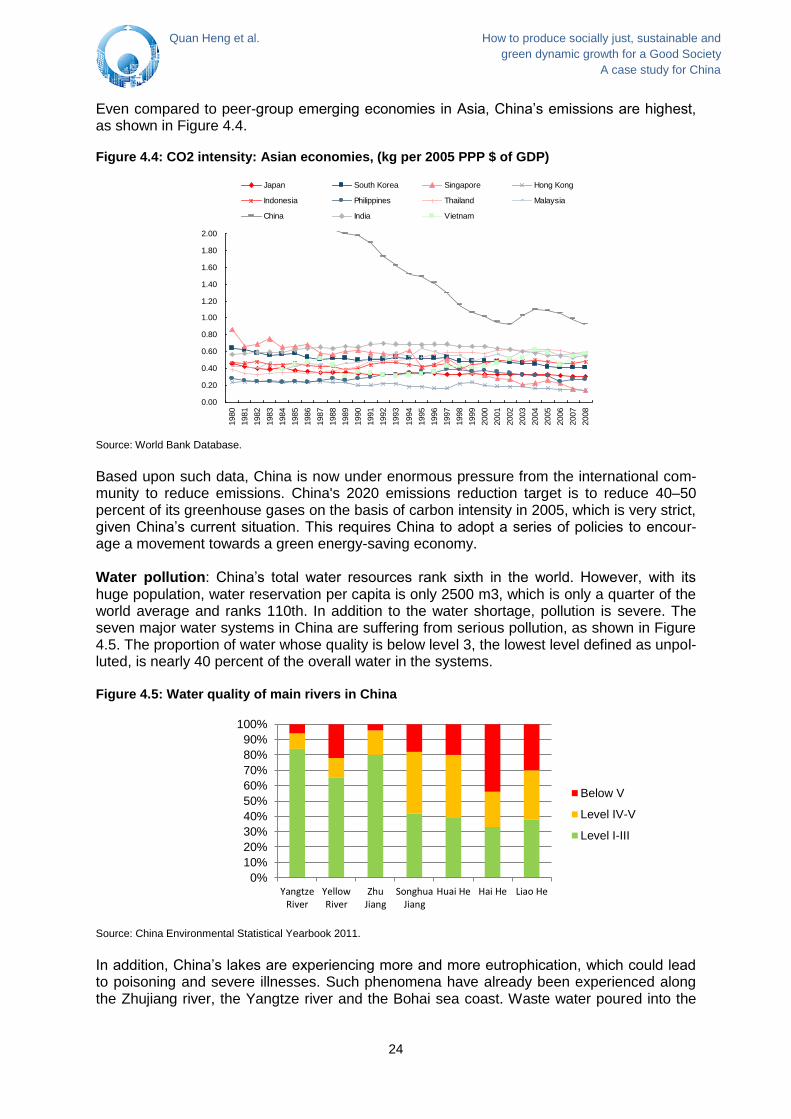
Even compared to peer-group emerging economies in Asia, China’s emissions are highest, as shown in Figure 4.4. Figure 4.4: CO2 intensity: Asian economies, (kg per 2005 PPP $ of GDP)
Source: World Bank Database.
Based upon such data, China is now under enormous pressure from the international com-munity to reduce emissions. China's 2020 emissions reduction target is to reduce 40–50 percent of its greenhouse gases on the basis of carbon intensity in 2005, which is very strict, given China’s current situation. This requires China to adopt a series of policies to encour-age a movement towards a green energy-saving economy. Water pollution: China’s total water resources rank sixth in the world. However, with its huge population, water reservation per capita is only 2500 m3, which is only a quarter of the world average and ranks 110th. In addition to the water shortage, pollution is severe. The seven major water systems in China are suffering from serious pollution, as shown in Figure 4.5. The proportion of water whose quality is below level 3, the lowest level defined as unpol-luted, is nearly 40 percent of the overall water in the systems. Figure 4.5: Water quality of main rivers in China
Source: China Environmental Statistical Yearbook 2011.
In addition, China’s lakes are experiencing more and more eutrophication, which could lead to poisoning and severe illnesses. Such phenomena have already been experienced along the Zhujiang river, the Yangtze river and the Bohai sea coast. Waste water poured into the
0.00
0.20
0.40
0.60
0.80
1.00
1.20
1.40
1.60
1.80
2.001980
1981
1982
1983
1984
1985
1986
1987
1988
1989
1990
1991
1992
1993
1994
1995
1996
1997
1998
1999
2000
2001
2002
2003
2004
2005
2006
2007
2008
Japan South Korea Singapore Hong Kong
Indonesia Philippines Thailand Malaysia
China India Vietnam
0%
10%
20%
30%
40%
50%
60%
70%
80%
90%
100%
YangtzeRiver
YellowRiver
ZhuJiang
SonghuaJiang
Huai He Hai He Liao He
Below V
Level IV-V
Level I-III
25
Quan Heng et al. How to produce socially just, sustainable and
green dynamic growth for a Good Society
A case study for China
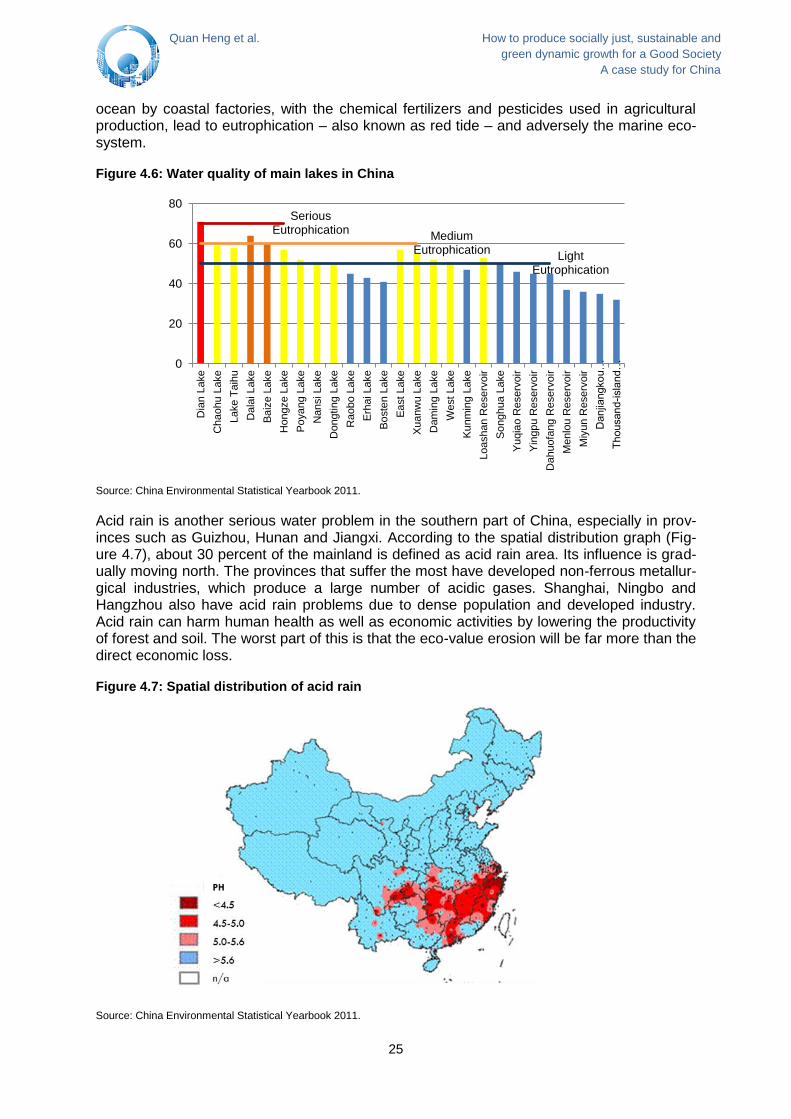
ocean by coastal factories, with the chemical fertilizers and pesticides used in agricultural production, lead to eutrophication – also known as red tide – and adversely the marine eco-system. Figure 4.6: Water quality of main lakes in China
Source: China Environmental Statistical Yearbook 2011.
Acid rain is another serious water problem in the southern part of China, especially in prov-inces such as Guizhou, Hunan and Jiangxi. According to the spatial distribution graph (Fig-ure 4.7), about 30 percent of the mainland is defined as acid rain area. Its influence is grad-ually moving north. The provinces that suffer the most have developed non-ferrous metallur-gical industries, which produce a large number of acidic gases. Shanghai, Ningbo and Hangzhou also have acid rain problems due to dense population and developed industry. Acid rain can harm human health as well as economic activities by lowering the productivity of forest and soil. The worst part of this is that the eco-value erosion will be far more than the direct economic loss. Figure 4.7: Spatial distribution of acid rain
Source: China Environmental Statistical Yearbook 2011.
Serious Eutrophication
Medium Eutrophication
Light Eutrophication
0
20
40
60
80D
ian L
ake
Chaohu
Lake
Lake T
aih
u
Dala
i L
ake
Ba
ize L
ake
Hongze L
ake
Po
yang L
ake
Nansi Lake
Dongtin
g L
ake
Raobo L
ake
Erh
ai Lake
Bo
ste
n L
ake
Ea
st Lake
Xu
anw
u L
ake
Dam
ing L
ake
West L
ake
Ku
nm
ing L
ake
Loashan R
eserv
oir
So
nghua L
ake
Yu
qia
o R
eserv
oir
Yin
gp
u R
eserv
oir
Dahuofa
ng R
eserv
oir
Me
nlo
u R
eserv
oir
Miy
un R
eserv
oir
Danjia
ngko
u…
Th
ousand
-isla
nd…
26
Quan Heng et al. How to produce socially just, sustainable and
green dynamic growth for a Good Society
A case study for China
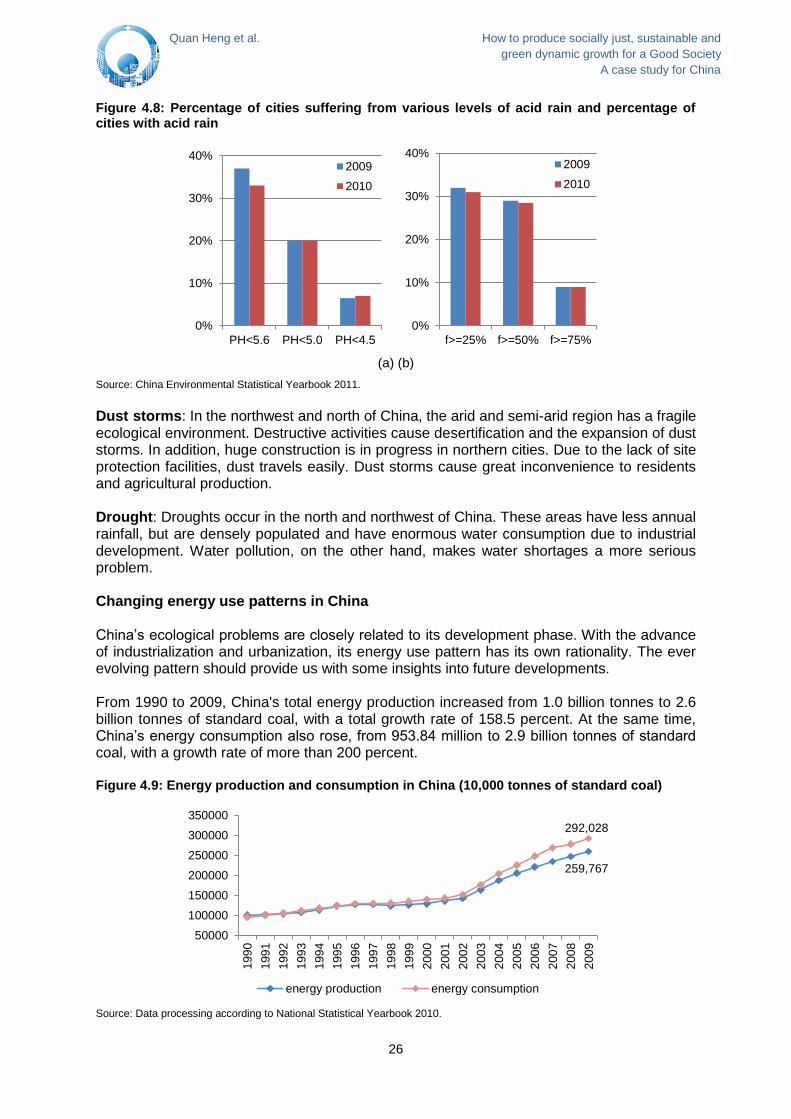
Figure 4.8: Percentage of cities suffering from various levels of acid rain and percentage of cities with acid rain
(a) (b)
Source: China Environmental Statistical Yearbook 2011.
Dust storms: In the northwest and north of China, the arid and semi-arid region has a fragile ecological environment. Destructive activities cause desertification and the expansion of dust storms. In addition, huge construction is in progress in northern cities. Due to the lack of site protection facilities, dust travels easily. Dust storms cause great inconvenience to residents and agricultural production. Drought: Droughts occur in the north and northwest of China. These areas have less annual rainfall, but are densely populated and have enormous water consumption due to industrial development. Water pollution, on the other hand, makes water shortages a more serious problem. Changing energy use patterns in China China’s ecological problems are closely related to its development phase. With the advance of industrialization and urbanization, its energy use pattern has its own rationality. The ever evolving pattern should provide us with some insights into future developments. From 1990 to 2009, China's total energy production increased from 1.0 billion tonnes to 2.6 billion tonnes of standard coal, with a total growth rate of 158.5 percent. At the same time, China’s energy consumption also rose, from 953.84 million to 2.9 billion tonnes of standard coal, with a growth rate of more than 200 percent. Figure 4.9: Energy production and consumption in China (10,000 tonnes of standard coal)
Source: Data processing according to National Statistical Yearbook 2010.
0%
10%
20%
30%
40%
PH<5.6 PH<5.0 PH<4.5
2009
2010
0%
10%
20%
30%
40%
f>=25% f>=50% f>=75%
2009
2010
259,767
292,028
50000
100000
150000
200000
250000
300000
350000
199
0
199
1
199
2
199
3
199
4
199
5
199
6
199
7
199
8
199
9
200
0
200
1
200
2
200
3
200
4
200
5
200
6
200
7
200
8
200
9
energy production energy consumption

27
Quan Heng et al. How to produce socially just, sustainable and
green dynamic growth for a Good Society
A case study for China
Meanwhile, energy use per capita has been growing rapidly, as well. The annual growth rates of the four major energy types peaked around 2003 at about 15 percent. Although growth slowed down a little subsequently, it remains at 5 percent. Also, on the supply side, the energy supply trend closely corresponds to GDP per capita development. Figure 4.10: Energy use per capita and corresponding growth rate in China
Source: China Energy Statistical Yearbook 2011, CEIC Database.
Figure 4.11: Total energy supply and relationship with per capita GDP (1953–2009)
Source: China Energy Statistical Yearbook 2011, CEIC Database.
In Figure 4.11, it is clear that, from 1990 to 2009, despite three contractions, China’s energy production-consumption gap was widening gradually. Figure 4.12 shows a sharply decreas-ing level of oil self-sufficiency, indicating that more than half of oil consumption has had to be met with imports in recent years. Such trends raise considerable concerns about energy safety and price risks.
-0,05
3E-16
0,05
0,1
0,15
0,2
0,25
0,3
-500
0
500
1000
1500
2000
2500
3000
annual growth rate of coal use per capita annual growth rate of total energy per capita
annual growth rate of electricity use per capita annual growth rate of oil use per capita
Total Energy (kgtce) Coal (kg)
Oil (kg) Electricity (kW•h)
0
0,5
1
1,5
2
2,5
3
0
2000
4000
6000
8000
10000
Hydro-power,Nuclear Power,Wind Power
Natural Gas
Crude Oil
Coal
GDP per capita
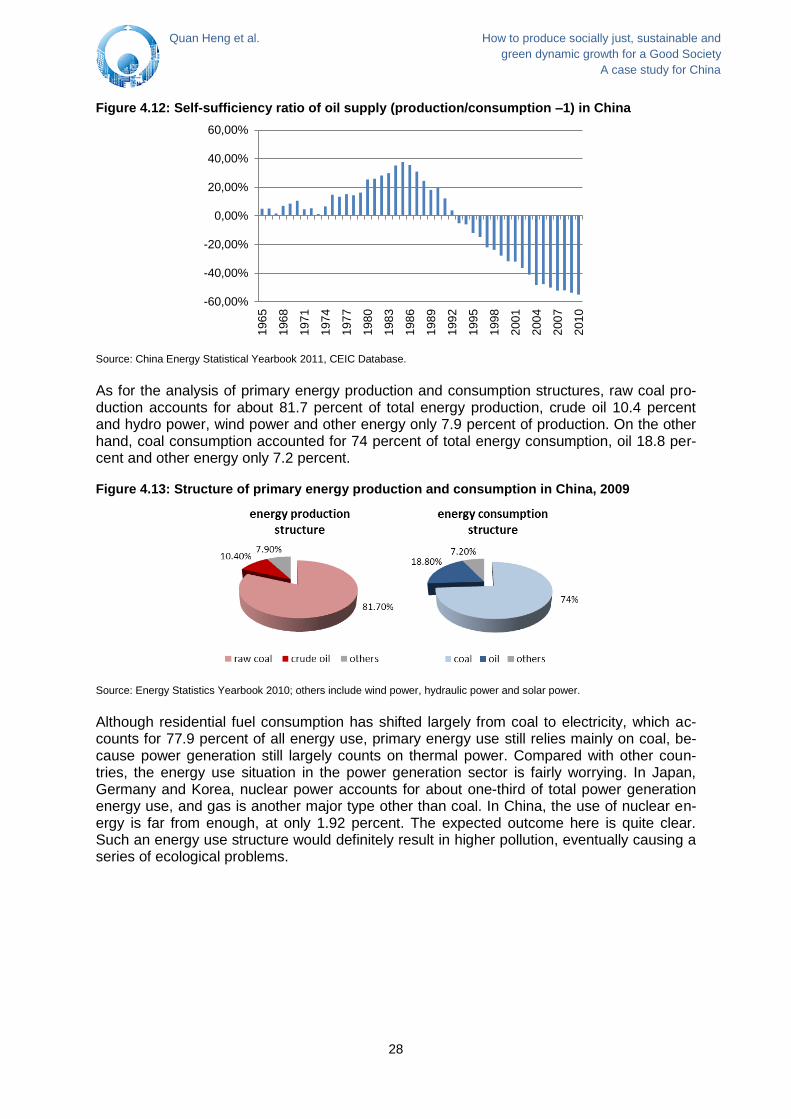
28
Quan Heng et al. How to produce socially just, sustainable and
green dynamic growth for a Good Society
A case study for China
Figure 4.12: Self-sufficiency ratio of oil supply (production/consumption –1) in China
Source: China Energy Statistical Yearbook 2011, CEIC Database.
As for the analysis of primary energy production and consumption structures, raw coal pro-duction accounts for about 81.7 percent of total energy production, crude oil 10.4 percent and hydro power, wind power and other energy only 7.9 percent of production. On the other hand, coal consumption accounted for 74 percent of total energy consumption, oil 18.8 per-cent and other energy only 7.2 percent. Figure 4.13: Structure of primary energy production and consumption in China, 2009
Source: Energy Statistics Yearbook 2010; others include wind power, hydraulic power and solar power.
Although residential fuel consumption has shifted largely from coal to electricity, which ac-counts for 77.9 percent of all energy use, primary energy use still relies mainly on coal, be-cause power generation still largely counts on thermal power. Compared with other coun-tries, the energy use situation in the power generation sector is fairly worrying. In Japan, Germany and Korea, nuclear power accounts for about one-third of total power generation energy use, and gas is another major type other than coal. In China, the use of nuclear en-ergy is far from enough, at only 1.92 percent. The expected outcome here is quite clear. Such an energy use structure would definitely result in higher pollution, eventually causing a series of ecological problems.
-60,00%
-40,00%
-20,00%
0,00%
20,00%
40,00%
60,00%
196
5
196
8
197
1
197
4
197
7
198
0
198
3
198
6
198
9
199
2
199
5
199
8
200
1
200
4
200
7
201
0

29
Quan Heng et al. How to produce socially just, sustainable and
green dynamic growth for a Good Society
A case study for China
Figure 4.14: Residential fuel consumption structure, 1980–2009
Source: China Energy Statistical Yearbook 2011, CEIC Database.
Figure 4.15: Fuel sources for power generation
Source: CEIC Database.
From the perspective of its energy production structure, China has an abundance of raw coal, making coal-fired power an important source of power and leading to a large amount of greenhouse gas emissions. From the perspective of energy consumption, China is still showing the highest energy use per GDP, which definitely needs to change: for example, comprehensive improvement and regulation of energy-intensive industries. Figure 4.16: Energy use of Asian economies, (kg of oil equivalent) per $1,000 GDP (constant 2005 PPP)
Source: World Bank Database.
0
100
200
300
400
500
600
700
800
19
80
19
81
19
82
19
83
19
84
19
85
19
86
19
87
19
88
19
89
19
90
19
91
19
92
19
93
19
94
19
95
19
96
19
97
19
98
19
99
20
00
20
01
20
02
20
03
20
04
20
05
20
06
20
07
20
08
Japan South Korea Singapore Hong Kong
Indonesia Philippines Thailand Malaysia
China India Vietnam
Coal (kg)
90,2%
Electricity
(kW•h) 8,2%
LPG (kg)
0,3%
Natural Gas (cu.m) 0,2%
Gas (cu.m) 1,1%
1980
33,3%
57,1%
3,4% 1,3%
5,0% 2000
煤(Coal
); 81,33
油(Oil); 1,46
气(Gas); 4,51
核(Nuclear); 1,92
水力(Hydr
o); 14,55
China(%)
煤(Coal)
; 48,03
油(Oil); 1,52
气(Gas); 12,09
核(Nucle
ar); 26,98
水力(Hydr
o); 3,17
Germany(%)
14,5%
77,6%
2,4%
2,8% 2,6%
2009
75,4%
21,7%
0,7%
0,8% 1,3%
1990
煤(Coal)
; 38,01
油(Oil); 5,91
气(Gas); 18,06
核(Nuclear); 36,98
水力(Hydr
o); 0,86
Korea(%)
煤(Coal
); 26,03
油(Oil); 10,58
气(Gas); 24,1
核(Nuclear); 27,76
水力(Hydr
o); 8,01
Japan(%)

30
Quan Heng et al. How to produce socially just, sustainable and
green dynamic growth for a Good Society
A case study for China
In addition to the structural problems, energy intensity is high with relatively low efficiency. Although China’s primary energy consumption is less than that of the United States, its unit GDP energy consumption exceeds other countries. Pressures of a widening demand-supply gap and environment conservation call for more efficient energy use in China, which requires technological advances and policy guidance. Figure 4.17: Energy intensity and efficiency
Source: China Energy Statistical Yearbook 2011, CEIC database.
4.2 Present debate to solve ecological problems A green economy is the inevitable and ultimate goal of China’s environment protection activi-ties. With the advance of globalization, developed countries are moving more and more in-dustries to developing countries such as China. Such a movement has brought economic growth, but has also resulted in severe environmental issues. The only choice is green and low-carbon development. Pollution management and emission reduction Realization of a green economy first needs to face up to the current ecological problems. Methods of solving environmental problems include remedial action, terminal management, pollution process control, energy recovery operations, repeated use action, recycling and pre-emptive problems. At present, China’s ecological problems, such as greenhouse gas emissions, acid rain, red tides, dust storms, drought and so on are associated mainly with the development pattern of industry. In the present situation, ways to solve ecological problems can be divided into two. One is the current management problem, including strengthening the pollution standards and su-pervision, and taking measures on enterprises producing a lot of pollution. The second is pollution source control. The current method in China is to implement energy conservation and emission reduction policies. The policies for energy conservation and emission reduction of major Asian countries and regions focus on government implementation of guiding or mandatory policy; energy-saving by enterprises is not paid much attention. China should also think about this. Only when en-terprise energy conservation actions are independent and effective can energy saving be
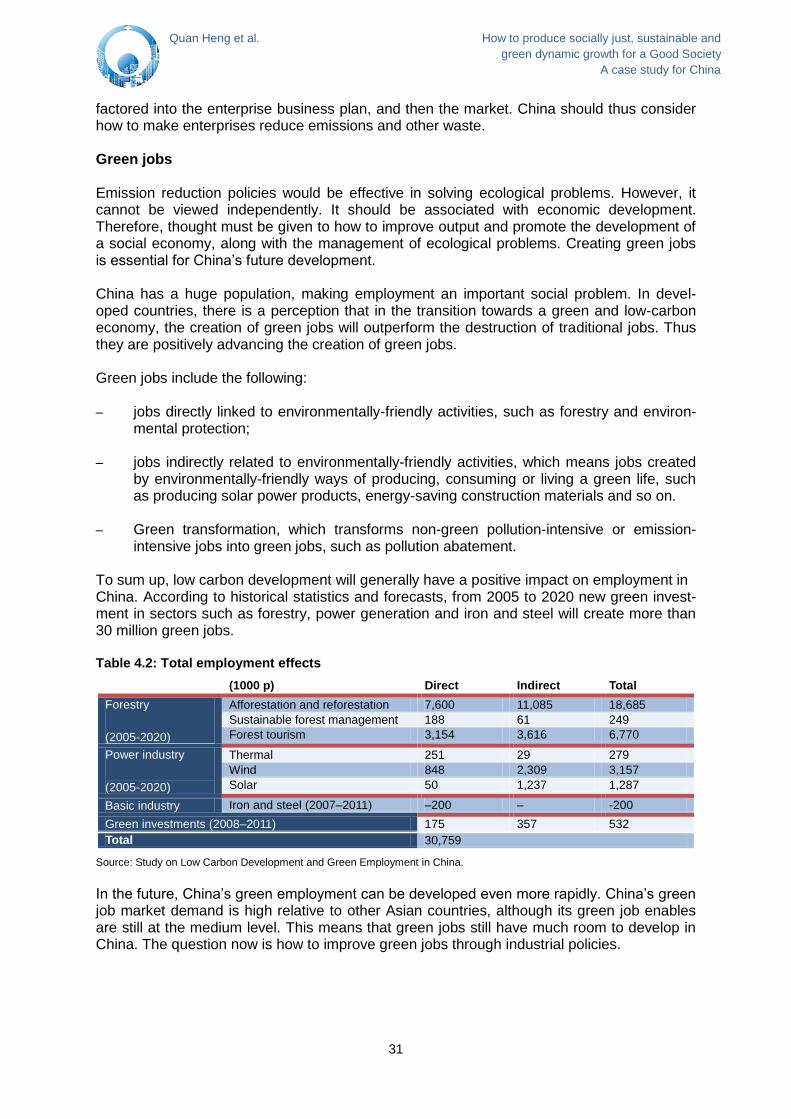
31
Quan Heng et al. How to produce socially just, sustainable and
green dynamic growth for a Good Society
A case study for China
factored into the enterprise business plan, and then the market. China should thus consider how to make enterprises reduce emissions and other waste. Green jobs Emission reduction policies would be effective in solving ecological problems. However, it cannot be viewed independently. It should be associated with economic development. Therefore, thought must be given to how to improve output and promote the development of a social economy, along with the management of ecological problems. Creating green jobs is essential for China’s future development. China has a huge population, making employment an important social problem. In devel-oped countries, there is a perception that in the transition towards a green and low-carbon economy, the creation of green jobs will outperform the destruction of traditional jobs. Thus they are positively advancing the creation of green jobs. Green jobs include the following: – jobs directly linked to environmentally-friendly activities, such as forestry and environ-
mental protection; – jobs indirectly related to environmentally-friendly activities, which means jobs created
by environmentally-friendly ways of producing, consuming or living a green life, such as producing solar power products, energy-saving construction materials and so on.
– Green transformation, which transforms non-green pollution-intensive or emission-
intensive jobs into green jobs, such as pollution abatement. To sum up, low carbon development will generally have a positive impact on employment in China. According to historical statistics and forecasts, from 2005 to 2020 new green invest-ment in sectors such as forestry, power generation and iron and steel will create more than 30 million green jobs. Table 4.2: Total employment effects
(1000 p) Direct Indirect Total
Forestry
(2005-2020)
Afforestation and reforestation 7,600 11,085 18,685
Sustainable forest management 188 61 249
Forest tourism 3,154 3,616 6,770
Power industry
(2005-2020)
Thermal 251 29 279
Wind 848 2,309 3,157
Solar 50 1,237 1,287
Basic industry Iron and steel (2007–2011) –200 – -200
Green investments (2008–2011) 175 357 532
Total 30,759
Source: Study on Low Carbon Development and Green Employment in China.
In the future, China’s green employment can be developed even more rapidly. China’s green job market demand is high relative to other Asian countries, although its green job enables are still at the medium level. This means that green jobs still have much room to develop in China. The question now is how to improve green jobs through industrial policies.
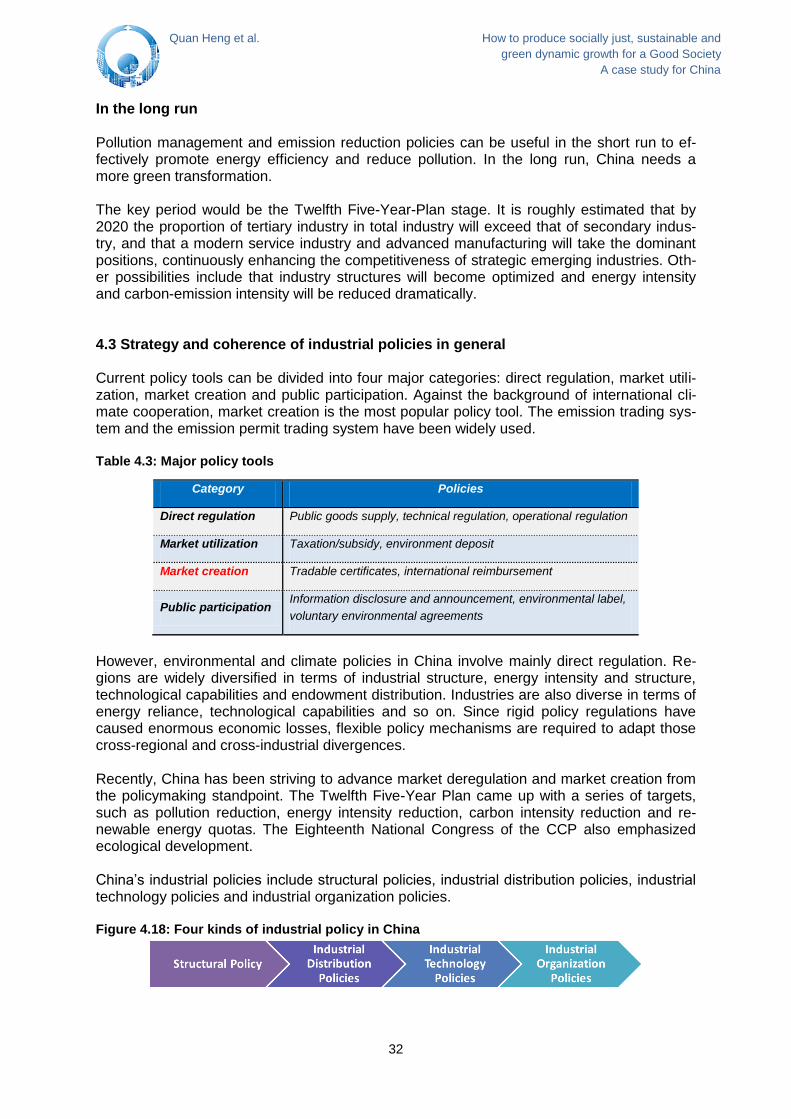
32
Quan Heng et al. How to produce socially just, sustainable and
green dynamic growth for a Good Society
A case study for China
In the long run Pollution management and emission reduction policies can be useful in the short run to ef-fectively promote energy efficiency and reduce pollution. In the long run, China needs a more green transformation. The key period would be the Twelfth Five-Year-Plan stage. It is roughly estimated that by 2020 the proportion of tertiary industry in total industry will exceed that of secondary indus-try, and that a modern service industry and advanced manufacturing will take the dominant positions, continuously enhancing the competitiveness of strategic emerging industries. Oth-er possibilities include that industry structures will become optimized and energy intensity and carbon-emission intensity will be reduced dramatically. 4.3 Strategy and coherence of industrial policies in general Current policy tools can be divided into four major categories: direct regulation, market utili-zation, market creation and public participation. Against the background of international cli-mate cooperation, market creation is the most popular policy tool. The emission trading sys-tem and the emission permit trading system have been widely used. Table 4.3: Major policy tools
Category Policies
Direct regulation Public goods supply, technical regulation, operational regulation
Market utilization Taxation/subsidy, environment deposit
Market creation Tradable certificates, international reimbursement
Public participation Information disclosure and announcement, environmental label,
voluntary environmental agreements
However, environmental and climate policies in China involve mainly direct regulation. Re-gions are widely diversified in terms of industrial structure, energy intensity and structure, technological capabilities and endowment distribution. Industries are also diverse in terms of energy reliance, technological capabilities and so on. Since rigid policy regulations have caused enormous economic losses, flexible policy mechanisms are required to adapt those cross-regional and cross-industrial divergences. Recently, China has been striving to advance market deregulation and market creation from the policymaking standpoint. The Twelfth Five-Year Plan came up with a series of targets, such as pollution reduction, energy intensity reduction, carbon intensity reduction and re-newable energy quotas. The Eighteenth National Congress of the CCP also emphasized ecological development. China’s industrial policies include structural policies, industrial distribution policies, industrial technology policies and industrial organization policies. Figure 4.18: Four kinds of industrial policy in China
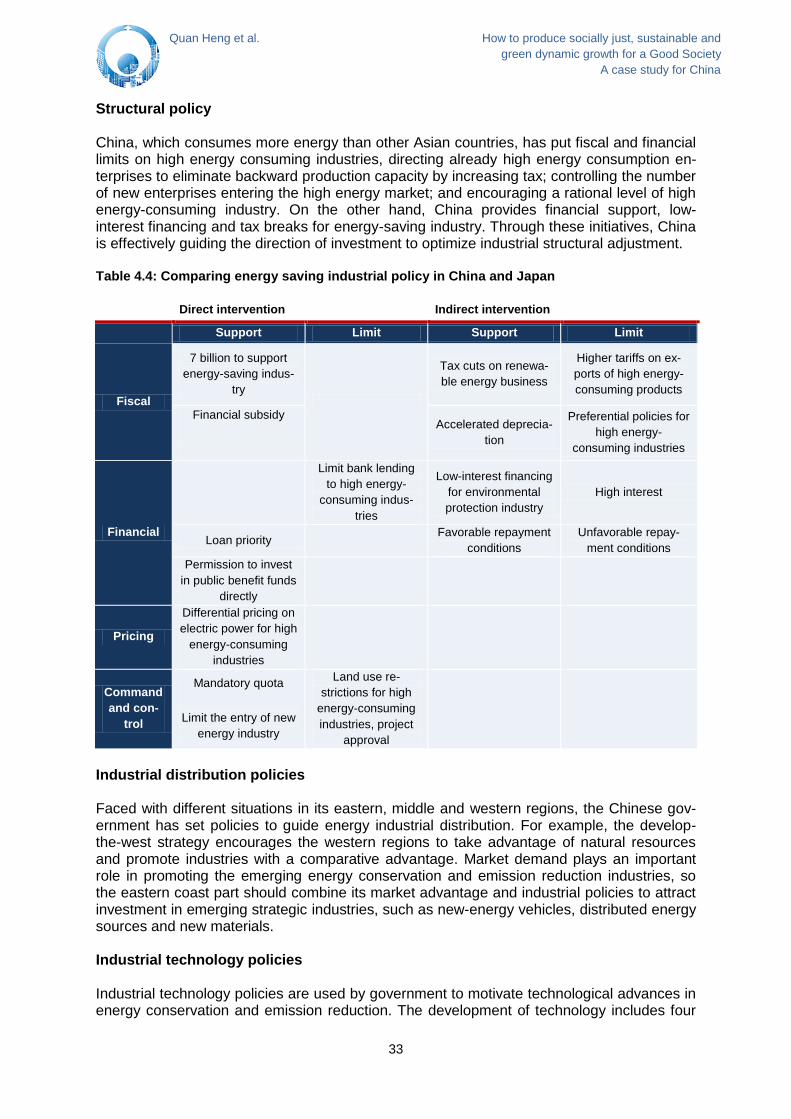
33
Quan Heng et al. How to produce socially just, sustainable and
green dynamic growth for a Good Society
A case study for China
Structural policy China, which consumes more energy than other Asian countries, has put fiscal and financial limits on high energy consuming industries, directing already high energy consumption en-terprises to eliminate backward production capacity by increasing tax; controlling the number of new enterprises entering the high energy market; and encouraging a rational level of high energy-consuming industry. On the other hand, China provides financial support, low-interest financing and tax breaks for energy-saving industry. Through these initiatives, China is effectively guiding the direction of investment to optimize industrial structural adjustment. Table 4.4: Comparing energy saving industrial policy in China and Japan
Direct intervention Indirect intervention
Support Limit Support Limit
Fiscal
7 billion to support
energy-saving indus-
try
Tax cuts on renewa-
ble energy business
Higher tariffs on ex-
ports of high energy-
consuming products
Financial subsidy
Accelerated deprecia-
tion
Preferential policies for
high energy-
consuming industries
Financial
Limit bank lending
to high energy-
consuming indus-
tries
Low-interest financing
for environmental
protection industry
High interest
Loan priority
Favorable repayment
conditions
Unfavorable repay-
ment conditions
Permission to invest
in public benefit funds
directly
Pricing
Differential pricing on
electric power for high
energy-consuming
industries
Command
and con-
trol
Mandatory quota
Limit the entry of new
energy industry
Land use re-
strictions for high
energy-consuming
industries, project
approval
Industrial distribution policies Faced with different situations in its eastern, middle and western regions, the Chinese gov-ernment has set policies to guide energy industrial distribution. For example, the develop-the-west strategy encourages the western regions to take advantage of natural resources and promote industries with a comparative advantage. Market demand plays an important role in promoting the emerging energy conservation and emission reduction industries, so the eastern coast part should combine its market advantage and industrial policies to attract investment in emerging strategic industries, such as new-energy vehicles, distributed energy sources and new materials. Industrial technology policies Industrial technology policies are used by government to motivate technological advances in energy conservation and emission reduction. The development of technology includes four
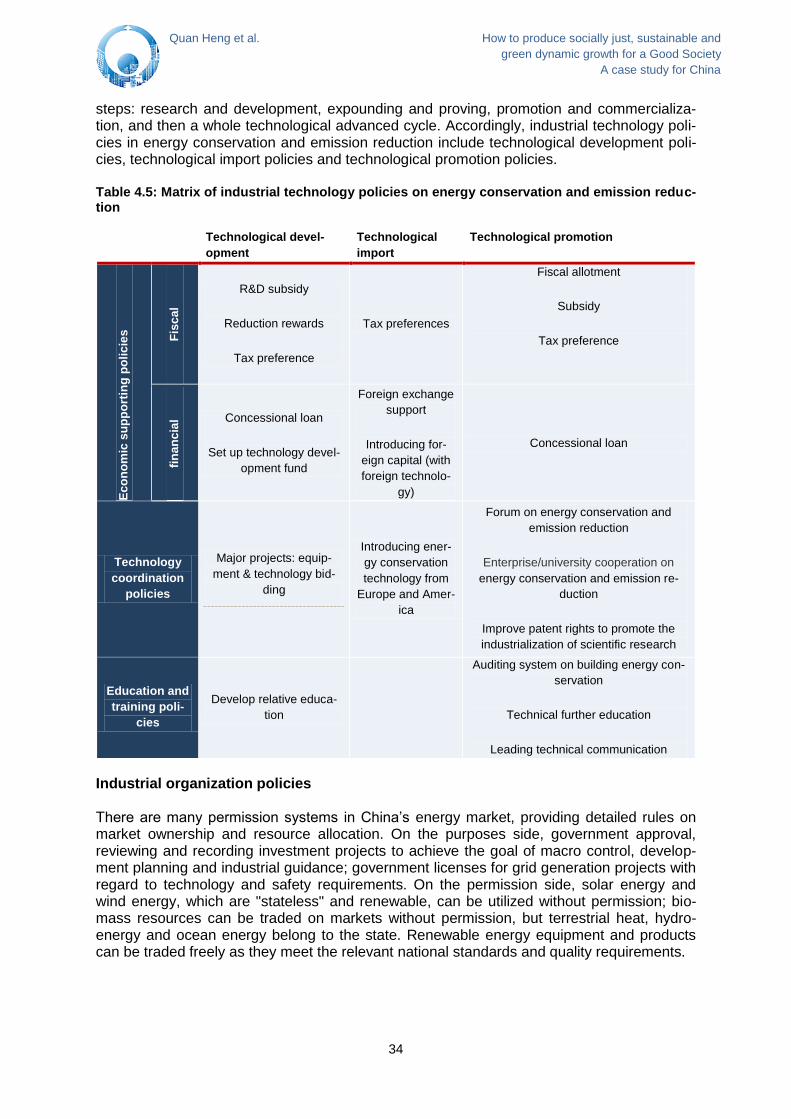
34
Quan Heng et al. How to produce socially just, sustainable and
green dynamic growth for a Good Society
A case study for China
steps: research and development, expounding and proving, promotion and commercializa-tion, and then a whole technological advanced cycle. Accordingly, industrial technology poli-cies in energy conservation and emission reduction include technological development poli-cies, technological import policies and technological promotion policies. Table 4.5: Matrix of industrial technology policies on energy conservation and emission reduc-tion
Technological devel-
opment
Technological
import
Technological promotion
Ec
on
om
ic s
up
po
rtin
g p
oli
cie
s
Fis
ca
l
R&D subsidy
Reduction rewards
Tax preference
Tax preferences
Fiscal allotment
Subsidy
Tax preference
fin
an
cia
l Concessional loan
Set up technology devel-
opment fund
Foreign exchange
support
Introducing for-
eign capital (with
foreign technolo-
gy)
Concessional loan
Technology
coordination
policies
Major projects: equip-
ment & technology bid-
ding
Introducing ener-
gy conservation
technology from
Europe and Amer-
ica
Forum on energy conservation and
emission reduction
Enterprise/university cooperation on
energy conservation and emission re-
duction
Improve patent rights to promote the
industrialization of scientific research
Education and
training poli-
cies
Develop relative educa-
tion
Auditing system on building energy con-
servation
Technical further education
Leading technical communication
Industrial organization policies There are many permission systems in China’s energy market, providing detailed rules on market ownership and resource allocation. On the purposes side, government approval, reviewing and recording investment projects to achieve the goal of macro control, develop-ment planning and industrial guidance; government licenses for grid generation projects with regard to technology and safety requirements. On the permission side, solar energy and wind energy, which are "stateless" and renewable, can be utilized without permission; bio-mass resources can be traded on markets without permission, but terrestrial heat, hydro-energy and ocean energy belong to the state. Renewable energy equipment and products can be traded freely as they meet the relevant national standards and quality requirements.

35
Quan Heng et al. How to produce socially just, sustainable and
green dynamic growth for a Good Society
A case study for China
Economic growth influenced by industrial policies According to the curve of energy consumption per capita of Asian countries, China’s energy consumption is much higher than that of other Asian countries. Based on energy conserva-tion and emission reduction in high energy-intensity industries, China could achieve a great improvement from an industry-dominant economy to a tertiary industry economy by imple-menting policies of industrial structure, distribution, technology and organization, leading to a healthier environment. Through the process of converting an industry-dominant economy into a tertiary industry dominated economy, China could achieve the goal of slowing down the growth of energy consumption and transferring the major source of pollution from the industrial sector to the residential and commercial sectors, and finally reduce total pollution. Figure 4.19 shows that, by implementing industrial policies, the development of China’s high energy-intensity industries has slowed down, while the proportion of energy-intensity indus-tries in the whole industrial sector has decreased. At the same time, China is vigorously promoting the new-energy industry. With the help of fiscal and financial support, China is now going through a transformation of its energy industrial structure and reducing the nega-tive effect on the environment. Figure 4.19: High energy-intensity industries in China
Source: National Statistics Yearbook 2010.
4.4 Likely future development China will inevitably develop into a low-carbon economy, although the process could be fairly difficult. In the next ten to twenty years, China must break out of the middle-income trap, realize an economic transformation and control energy consumption and emissions per capi-ta. In the end, we hope to see China as a green, modernized country. In the future, China’s green policies can be developed as follows: – Cooperate to strengthen energy conservation and emission reduction. Integrate the
energy conservation service industry, set up energy conservation standards, make in-centive policies clearer and implement energy saving policies, offering financial subsi-dies to encourage to engage in energy-saving reconstruction. Strengthen the govern-ment demonstration effect.
– Boost employment by developing the green economy. The development of green in-
dustry is the basis for enlarging green employment. Since sustainable development has been one of the national strategies of China’s future growth, green industry will surely have a bright prospect, leading to more and more green jobs.
0
50000
100000
150000
2000 2001 2002 2003 2005 2006 2007 2008 2009
The added value of gas-guzzling industry GDP created by industrial sector
36
Quan Heng et al. How to produce socially just, sustainable and
green dynamic growth for a Good Society
A case study for China
– Perfect the social security system to support green industrial development and strengthen labor protection to achieve large-scale green employment. China’s current social security system is imperfect. Even a basic employment system requires a corre-sponding social security system, let alone one with a considerable proportion of green jobs or in the process of transition. China will need to do much more for labor protec-tion as soon as possible.
5. General evaluation Since the implementation of reform and opening-up policies 35 years ago China has experi-enced growth that is unprecedented by any other nation. This growth has been largely the result of low cost production, deriving from its large population and burgeoning economy. China has recently become the second largest economy in the world. However, wealth has not been distributed at an adequate level among China’s 1.35 billion inhabitants, instead gaps in income have widened. In the 2012, the Gini Coefficient stood at 0.474 which some scholars believe could lead to social unrest. Strong R&D investment and investments in ed-ucation will provide long term abilities in the expected technological future, where workers will require higher salaries and better standards of living. The demands for better goods and services from within may position China to move toward a more stable economy. This movement will take time and will certainly be a difficult process, but as labor productivity is rising faster than labor costs China is still attractive to multinational corporations and few problems have yet arisen. Intelligent efforts and innovation must be made a top priority in order for China to avoid the “middle income trap” that is a likely problem in the future.
The government has greatly benefitted from China’s fiscal growth, at a rate higher than the GDP, but with the slowing of the global economy it has seen a slight decline, to what is now a more modest level. The decline in government income has also derived from adjustments in tax policy to relieve the burden on small and middle class enterprises. With more than 85 percent of the central government’s income coming from taxes, the economic gains in the past decade have helped the government maintain balanced budgets and expenditure growth. Local governments, however, generate much of their resources from ownership in corporations and land sales. In 2009, local government debt rose very quickly due to their huge contribution to the stimulus package during the global financial crisis. The real amount of local government debts are one of the unknown risks in China’s economy. Policy changes are awaited to be put in place to reduce this debt.
In the global economy, foreign exchange reserves stood at a historically high level reaching 3.3 trillion USD at the end of 2012. Its foreign debt to export ratio being 32.8 percent leaves little foreign debt risk. Internally, reform of SOEs and government is expected soon with hopes of further economic growth on a sustainable level. In spite of demographic issues China should be able to maintain its 7 percent growth rate over the next decade.
Albeit China’s strong economy, wealth distribution requires affective short and long term policy changes to reduce the large gap between urban and rural residence. This is a sector of much debate, further research into true income disparity from reliable sources is neces-sary to create a more realistic picture of wealth distribution between rural and urban resi-dence and in different regions and industries. Though China is responsible for lifting 235 million people out of absolute poverty, it still leaves many millions behind. Social welfare does not reach all people in China, as it applies only to those living in urban areas. Welfare is administered under regional governments and therefore leaves vast imbalances from province to province. Economic researchers agree that the transition of China’s economy will be improved if income gaps are decreased and if government and large enterprises are less favored in monetary policy and subsidies. To this day, income rates of urban and rural households have both remained consistently lower than GDP growth. Alternatively, econo-
37
Quan Heng et al. How to produce socially just, sustainable and
green dynamic growth for a Good Society
A case study for China
mists suggest that secondary income distribution, including more transfer payments to lower income groups and higher taxes on the wealthy will be an advancement over dual economic structures like the Hukou system. Progressive changes in personal banking, nationwide ed-ucation, healthcare, income redistribution, social protection, a real social security network and a long term mechanism to enhance rural household income will help China move away from its unsustainable export economy
As an exporter, China finds itself between arguments as to whether or not it is a high-tech producer. China exports many high-tech products each year but usually acts as an assem-bler of such technologies. Because of this China has often been viewed as a low-technology producer. Even so, the increase in worldwide demand for high-tech products came at a good time for China. World trade, global high-tech parts suppliers and shipping have met in China because of its low wages and steady labor rise from unskilled, to semiskilled and finally skilled. A climb that has been supported by nine-year-schools and the promotion of higher education institutions. As a producer, this climb in skills is arguably China’s bigger compara-tive advantage over other export countries.
The currency of China, the Yuan, has a managed floating rate with reference to multiple cur-rencies. Against the US Dollar, United States economists argue that the Yuan should appre-ciate by 5 to 30 percent, but this, the Chinese government argues, may come at the risk of heavy job loss and bankruptcies for millions of people. Some Chinese economists predict that the Yuan will one day be allowed to appreciate in order to reduce trade surplus and do-mestic inflation. Partial adjustments and an imperfectly flexible exchange rate regime have led to gains in Chinese competitiveness due to its rapid progress in labor productivity. Whether or not the Yuan should be an international currency is still under debate. Right now, the scope of its use internationally is very small and it is most likely far from becoming an international currency.
Looking at China’s global financial positioning, Chinese policy makers initially displayed a preference for direct investment into China, primarily because it brought technology as well as capital. Recently, China has made big shifts in its international presence, usually for the gain of resources such as minerals and oil. At the end of 2011, China’s total foreign debt was a manageable USD 695 billion (9.3 percent of GDP). Of that, USD 500 billion was short-term borrowing and USD 195 billion was borrowed from governments or international organ-izations. It would be best for China to quickly pay its debts and move toward being a creditor nation, not a debtor.
The pollution problems in China are well known and often discussed with little to debate. As the world grows and China continues to produce and develop, the only clear policies to adopt are “green” and low-carbon structures and processes. It is estimated that from 2005 to 2020, green jobs such as forestry, power generation, and iron and steel will create more than 30 million new jobs. In the short term, pollution management and emission reduction policies are important to promote better use of resources and to reduce pollution. In the long term, it is hoped that industry structures will naturally optimize, thus reducing energy use and Carbon emissions. Even so, sound policy upgrades would help guarantee this change. The option to switch from an industry-dominant economy to a tertiary economy, by implementing policies on industrial structures, distribution channels, technologies and organizations, is a course of action that must take place. The environment in China requires intense evaluation, research, policy changes, promotion and support from the government, government think tank and social organizations to create a more efficient, healthy and stable future.

38
Quan Heng et al. How to produce socially just, sustainable and
green dynamic growth for a Good Society
A case study for China
Quan Heng et al. How to produce socially just, sustainable and
green dynamic growth for a Good Society
A case study for China
6. Literature Alesina, A. and Rodrik, D. (1994, 5), Distributive politics and economic growth. Quarterly Jour-
nal of Economics, pp. 465-90.
Athukorala, Prema-chandra (2009), »The rise of China and East Asian export performance: is the crowding-out fear warranted?« The World Economy, Vol. 32, No. 2, pp. 234-266.
Bai, Z. and Qian, Z. (2009, 4), Analysis of influential factors and causal factors of China’s capital income proportions: research based on provincial panel data. Journal of Tsinghua University, Philosophy and Social Sciences Edition, pp. 137-147.
Bertola, G. (1993, 12), Factor shares and savings in endogenous growth. American Economic Review, pp. 1184-98.
Branstetter, Lee and Nicholas Lardy (2008), »China’s embrace of globalization,« in Loren Brandt and Thomas G. Rawski (eds), China’s Great Economic Transformation, Cambridge University Press, pp. 660-664.
Cellini, R. (2007, 7), Migration and welfare: a very simple model. Journal of International Devel-opment, pp. 885-894.
China Statistical Bureau, China Statistical Yearbook, various issues.
Clarke, R. H. (1995, 4), International labour-cum-capital migration: theory, welfare implications and evidence. Working Paper.
Dai, Meixing (2011), »Motivations and strategies for a real revaluation of the yuan,« Munich Personal RePEc archive, April 21.
Deininger, K. and Squire, L. (1998, 2), New ways of looking at old issues: inequality and growth. Journal of Development Economics, pp. 259-287.
Ezcurra, R., Pascual, P. and Rapún, M. (2007, 4), The spatial distribution of income inequality in the European Union. Environment and Planning A, pp. 869-890.
Forbes, K. J. (2000, 9), A reassessment of the relationship between inequality and growth. The American Economic Review, pp. 869-887.
Gao Haihong and Yu Yongding (2010), »The concept and precondition of RMB’s internationali-zation«, International Economic Review, Vol. 85, pp. 46-64.
He, Gang (2012), »Was Renminbi significantly undervalued?« Studies of International Finance, No. 2, pp. 4-15.
Jin, Hongfe et al. (2012), »The effect of international financial crisis on China’s FDI inflows,« Studies of International Finance, No. 12, pp. 55-67.
Lee, Branstetter and Nicholas Lardy (2008), »China’s embrace of globalization,« in Loren Brandt and Thomas G. Rawski (eds), China’s Great Economic Transformation, Cambridge University Press, pp. 660-664.
Li, H. and Zou, H. (1998, 2 3), Income inequality is not harmful for growth: theory and evidence. Review of Development Economics, pp. 318-334.
Li Yi, Xiao Jiwu and Cui Jiangjun (2012), »May the RMB appreciation promote China’s BOP equilibrium – analysis based on FAVAR model,« Studies of International Finance, No. 3, pp. 30-39.
Quan Heng et al. How to produce socially just, sustainable and
green dynamic growth for a Good Society
A case study for China
Pang, G. (2008, 11 4), China's 30-year Reform and Openness Reduces Absolute Poverty for 235 Million. Retrieved 11 24, 2012, from People's Daily. Online: http://politics.people.com.cn/GB/1026/8282588.html
Persson, T. and Tabellini, G. (1994, 6), Is inequality harmful for growth? American Economic Review, pp. 600-621.
Perugini, C. and Martino, G. (2008, 9). Income inequality within European regions: determinants and effects on growth. Review of Income and Wealth, pp. 373-406.
Quan, H. (no date) Chapter 3 of Empirical Study on China Urban–Rural Income Structure and Disparity. Shanghai.
Rodrik, Dani (2006), »What’s so special about China’s exports?«, National Bureau of Economic Research Working Paper, No. 11947.
Sukiassyan, G. (2007, 3), Inequality and growth: What do the transition economy data say? Journal of Comparative Economics, pp. 35-56.
Survey and Research Center for China Household Finance. (2011), China Household Finance Survey. Chengdu: Southwestern University of Finance and Economics.
Yang, Yi and Tao Yongcheng (2011), »Research on optimal demand for China’s international reserves: a numerical simulation based on a framework of utility maximization from 1994 to 2009,« Studies of International Finance, No. 6, pp. 4-13.
Ying, L. (2009, 12 31), Mechanism for analysis of the impact of income disparity expansion on China's inadequate household consumption. China Collective Economy, pp. 27-28.
Yu, X. and Xiao, Y. (2009, 8), Current situation, problems, causes and solution of China’s in-come distribution. Economic Perspectives.
Quan Heng et al. How to produce socially just, sustainable and
green dynamic growth for a Good Society
A case study for China
About the authors: Prof. Dr. Quan Heng is Deputy Director of the Insitute of Economics at the Shanghai Academy of Social Sciences (SASS). Prof. Wu Libo is Executive Director of the Center for Energy Economics and Strategies Studies at Fudan University, Shanghai. Prof Dr. Xu Minqi is Deputy Director of the Insitute of World Economy at the Shanghai Acade-
my of Social Sciences (SASS).
Prof. Yin Xingmin is Deputy Director of the China Center for Economic Studies (CCES), and
Member of the Academic Committee of the School of Economics and CEES, Fudan University,
Shanghai.
General evaluation by: Alexander Rosenplänter Program Manager Friedrich-Ebert-Stiftung Shanghai Office Responsible: Catrina Schläger Resident Director Friedrich-Ebert-Stiftung Shanghai Office 7A Da An Plaza East Tower 829 Yan An Zhong Lu 200040 Shanghai, PR CHINA Tel.: 0086-21-62472529/2870 The FES Asia Economy of Tomorrow series can be found at http://www.fes-asia.org/pages/shaping-the-economy-of-tomorrow-in-a-sustainable-way/publications.php Follow us on facebook: https://www.facebook.com/TheEconomyOfTomorrow