the education pipeline in the united states 1970– · pdf filethe education pipeline in...
TRANSCRIPT

Walt Haney George Madaus Lisa Abrams Anne Wheelock Jing Miao Ileana Gruia
January 2004
The Education Pipeline in the United States 1970–2000
Lynch School of Education
BOSTON COLLEGE

The Education Pipeline in the United States, 1970-2000*
Walt Haney, George Madaus, Lisa Abrams, Anne Wheelock,
Jing Miao, and Ilena Gruia,
January 2004
Education Pipeline Project,
National Board on Educational Testing and Public Policy
Center for the Study of Testing, Evaluation, and Educational Policy
Lynch School of Education
Boston College
Chestnut Hill, MA 02467
*The research reported here was supported with a generous grant from the FordFoundation. For such support we are extremely grateful, but note that the viewsexpressed here are not necessarily those of anyone other than the authors.

Contents
I Introduction 1
II Data and methods 3
III Kindergarten Attendance More Universal 6
IV Attrition Between Grades 9 and 10 Increasing 10
V Bulge in Grade 9 Enrollments 14
VI Falling Graduation Rates 19
Mortality 25
Migration 26
Private School Enrollments 31
Home schooling 32
Grade 9 to Graduation Rates 34
The Education Pipeline 1970 vs. 2000 41
VII Causes and Consequences 44
Kindergarten attendance 45
Grade 1 flunk rate 45
Transition from elementary to high school 48
Constriction of high school pipeline 49
VIII Conclusion 56
References 63
Appendix 67

1
The Education Pipeline in the United States, 1970-2000
I Introduction
Close to 100 years ago, in a book titled Laggards in our schools: A study of
retardation and elimination in city school systems, Leonard Ayres wrote:
No standard which may be applied to a school system as a measure ofaccomplishment is more significant than that which tells us what proportion of thepupils who enter the first grade succeed in reaching the final grade. (Ayres, 1909,p. 8)
Nearly a century later, rates of student progress through elementary and secondary
school have continued to be recognized as indicators of the quality of educational
systems. In the Goals 2000 Act of 1994, the U.S. Congress and President Bill Clinton
established as a national education goal that the United States should aspire to a high
school graduation rate of 90%. In 2002, in the No Child Left Behind (NCLB) law, the
Congress and President George Bush set out as a criterion for evaluating secondary
education, “graduation rates for public secondary school students (defined as the
percentage of students who graduate from secondary school with a regular diploma in the
standard number of years)” [Sec 1111(b)(2)(D)(i)].
In this report we present results of analyses of data on grade enrollment and
graduation over the last several decades both nationally and for all 50 states. The main
reasons for these analyses are that state-reported dropout statistics are often unreliable

Education Pipeline, p. 2.
and most states do not regularly report grade retention data, that is data on the rates at
which students are held back to repeat grades. Hence, the only way to study long-term
rates of student progress through elementary-secondary educational systems is to
examine data on grade enrollment and graduates over time. This project grew out of a
study of education reform in Texas in which it was found that analyzing enrollment and
graduation statistics could show what was really happening when reliable statistics on
dropouts were unavailable (Haney, 2000).
These analyses allow us to show how graduation rates, both nationally and for the
states, have been changing in recent decades. More generally, these analyses allow us to
examine the education pipeline in the United States to identify key transition points
through which students progress, or fail to progress, from kindergarten through the grades
to high school graduation. Before presenting results of analyses, we explain sources of
data used and the manner in which enrollment and graduation data have been analyzed.

Education Pipeline, p. 3.
II Data and Methods
The data used in the analyses presented in this report are numbers of students
enrolled in public schools by grade for each academic year and the numbers of students
graduating each academic year. These data are available from the Digest of Education
Statistics (DES), a report issued by the National Center for Education Statistics (NCES)
since 1962 and the Common Core of Data (CCD), a federal repository of education
statistics available on-line at http://nces.ed.gov/ccd/.1
To examine patterns of student progress through the education pipeline, we have
conducted cohort progression analyses. These analyses are used to address questions
such as the following: If there were 1000 students enrolled in grade 9 in 1990-91, how
many progressed to grade 10 in 1991-92? We have examined such year-to-year “grade-
to-grade” rates of progress for thirteen transition points, from kindergarten through grade
12 and to graduation. We analyzed such year-to-year transitions nationally from 1968-69
to 2000-01, and for all 50 states from 1984-85 through 2000-2001. Additionally we
examined rates of progress over more than one year, for example, by addressing the
question of how many students enrolled in grade 9 in 1990-91 graduated in 1993-94.
This is, of course, exactly the sort of high school graduation rate calculation rate
suggested by the requirements of the 2002 NCLB law. Indeed, we will report such
graduation rates, both nationally and for the 50 states. Nonetheless, as we explain, this
simple and most obvious way of calculating high school graduation rate is not without its
1 The appendix to this report describes discrepancies we have identified between the DES and CCD
sources and explains how we make available to anyone interested the source data used in the analyses
reported here.

Education Pipeline, p. 4.
weaknesses, so we also present results from alternative measures of high school
graduation rates.
Before proceeding to present results, let us provide an example to make clear the
approach we use more generally. Table 1 shows the enrollments for public schools in the
United States for kindergarten through grade 12 for 1968-69 through 1972-73. The
bottom half of Table 1 shows enrollments for grades 1 through 12 for 1969-70 through
1972-73 in terms of the percent increases or decreases as compared with enrollments in
the previous grade the previous year. For example, in 1969-70 there were 3.86 million
enrolled in grade 1 or 53% more than the 2.53 million enrolled in kindergarten in 1968-
69.
We have conducted such cohort progression analyses for the U.S. and for all 50
states. Altogether, there were far in excess of 10,000 such calculations. As explained in
the appendix, our source data and results of such calculations (both nationally and for all
50 states) are available in the data files released with this report. Subsequent portions of
the report present four major findings from these analyses, relating to: 1) kindergarten
attendance becoming much more universal; 2) an increasing attrition of students between
grades 9 and 10, 3) an increasing bulge of students in grade 9; and, 4) declines in high
school graduation rates, especially in the last decade, and especially in some states. The
report ends with a discussion of causes and consequences of changes in the education
pipeline in the United States over the last three decades.

Education Pipeline, p. 5.
Table 1:U.S Public School Enrollment, Kindergarten to Grade 12, 1968-69 to 1972-73 (in 1000s).
Grade/Year 68-69 69-70 70-71 71-72 72-73
K 2526 2601 2559 2483 2487
1st grade 3923 3858 3814 3570 3352
2nd grade 3765 3714 3654 3587 3383
3rd grade 3694 3721 3662 3612 3533
4th grade 3629 3660 3676 3623 3554
5th grade 3570 3619 3634 3662 3597
6th grade 3556 3565 3599 3622 3639
7th grade 3552 3665 3662 3710 3713
8th grade 3420 3515 3601 3635 3649
9th grade 3508 3567 3652 3781 3779
10th grade 3310 3408 3457 3571 3648
11th grade 2987 3051 3127 3200 3247
12th grade 2655 2733 2774 2862 2871
Percent increase or decrease from previous grade the previous year
68-69 69-70 70-71 71-72 72-73
1st grade 52.7% 46.6% 39.5% 35.0%
2nd grade -5.3% -5.3% -6.0% -5.2%
3rd grade -1.2% -1.4% -1.1% -1.5%
4th grade -0.9% -1.2% -1.1% -1.6%
5th grade -0.3% -0.7% -0.4% -0.7%
6th grade -0.1% -0.6% -0.3% -0.6%
7th grade 3.1% 2.7% 3.1% 2.5%
8th grade -1.0% -1.7% -0.7% -1.6%
9th grade 4.3% 3.9% 5.0% 4.0%
10th grade -2.9% -3.1% -2.2% -3.5%
11th grade -7.8% -8.2% -7.4% -9.1%
12th grade -8.5% -9.1% -8.5% -10.3%

Education Pipeline, p. 6.
III Kindergarten Attendance More Universal
One striking finding from our cohort progression analyses is that the gap between
enrollment in grade 1 one year and in kindergarten the previous year has fallen sharply
over the last 30 years, most notably during the 1970s. Figure 1 shows, for example, the
striking downward trend in the percent more students enrolled in grade 1 than in
kindergarten the previous year. Nationally, around 1970 there were 40-50% more
students enrolled in first grade than in kindergarten the previous year. This percentage
fell sharply during the 1970s and after a slight upturn in the early 1980s, has continued to
fall gradually since the mid-1980s. Since the early 1990s grade 1 enrollment has been
only 6-7% more than kindergarten enrollments the previous year. This suggests that
about 94% of children nationally are entering school in kindergarten. For example, if
among every 100 school-aged children, 94 started kindergarten in 2000 and 6 did not
start school until grade 1 in 2001, the percent increase in grade 1 enrollment in 2001
compared with the kindergarten enrollment in 2000 would be 6.4% (100-94=6 and 6/94 =
6.4%)). This simple example does not, of course, take migration into account. We
postpone discussion of migration (and other factors that might affect apparent rates of
cohort progress) until part VI where we summarize results of graduation rate calculations,
because immigration from abroad, and domestic migration across states, potentially has
much greater impact on cohort progression analyses when results are calculated across
more than one year.
The decrease in the gap between grade 1 and kindergarten enrollments the
previous year is surely a reflection of the fact that nationally kindergarten attendance has
become much more universal over the last three decades (also, it should be noted that

Education Pipeline, p. 7.
grade1 enrollments in a particular year are influenced somewhat by numbers of students
flunked to repeat grade 1 from the previous year, as discussed in part VII below). The
pattern suggests that nationally by the 1990s around 90% of students start school in
kindergarten rather than in grade 1. This finding is confirmed by sample surveys of U.S
households showing that the rate at which 5-year-olds nationwide were enrolled in
preprimary education programs rose from 60.6% in 1965 to 86.5% in 1970 and 88.8% in
1990.2
2 National Center for Education Statistics, Digest of Education Statistics 2002 (NCES 2003-060). Table 43,
p. 59. It is worth noting that enrollment in full-day programs as contrasted with half-day programs has
increased more slowly, from 12.3%, 29.4%, 42.0% and 59.1% of all 5-year-olds enrolled in 1970, 1980,
1990 and 2000 respectively.

Education Pipeline, p. 8.
Figure 1: National Public School Enrollment in Grade1 as Percent Increase AboveKindergarten Enrollment the Previous Year
Analyses at the state level indicate there were relatively few states in which grade
1 enrollments in 2000-01 were more than 10% greater than kindergarten enrollments in
1999-2000. Results of analyses comparing grade 1 enrollments in one year with
kindergarten enrollments the previous year show that over the last 15 years five states
have made dramatic progress in boosting rates of kindergarten attendance, namely
Mississippi, Oregon, Vermont, South Carolina, and Texas. The state with the worst
record in the nation in terms of providing universal access to kindergarten is New
Hampshire. In fall 1999, for example, New Hampshire had a kindergarten enrollment of
9,048, but a grade 1 enrollment in fall 2000 of 16,337. 3 This meant that there were 82%
more in grade 1 in 2000-01 than in kindergarten in 1999-2000. This implies that only
3 National Center for Education Statistics, Digest of Education Statistics 2002 (NCES 2003-060). Table 38,
p. 52. No other state had as large a gap, percentage-wise, between kindergarten and grade 1 enrollments.
0%
10%
20%
30%
40%
50%
60%

Education Pipeline, p. 9.
about 55% of young children in New Hampshire attend kindergarten (100-55=45 and
45/55 = 0.82).

Education Pipeline, p. 10.
IV Attrition Between Grades 9 and 10 Increasing
A second major finding from our cohort progression analyses is that the rate at
which students disappear between grades 9 and 10 has tripled over the last 30 years.
Figure 2 shows the percent fewer students enrolled in grade 10 nationally than in grade 9
the previous year. As shown, during the first half of the1970s there were less than 4%
fewer students enrolled in grade 10 than in grade 9 the previous year. Attrition between
grades 9 and 10 started increasing in the late 1970s and accelerated from the mid-1980s
onward. By the turn of the century there were nearly 12% fewer students enrolled in
grade 10 than in grade 9 the previous year. To provide some sense of the numbers of
students being lost between grades 9 and 10, in 1998-99, there were 3.86 million students
enrolled in grade 9 in public schools in the U.S., but in 1999-2000, there were 3.42
million enrolled in grade 10. The difference, 440,000 students, means that 11.4% of
ninth graders in 1998-99 did not show up as enrolled in grade 10 in 1999-2000. In short,
by the end of the century the grade 9 to 10 transition was clearly the largest leak in the
education pipeline. This was not the case 30 years ago. As the data in Table 1 indicate,
three decades ago far more students were lost between grades 11 and 12 than between 9
and 10. In subsequent sections of this report we discuss what happened to these missing
students, but first we summarize results of state-level analyses of student attrition
between grades 9 and 10.

Education Pipeline, p. 11.
Figure 2: National Public School Enrollment, Percent Fewer Students in Grade 10 than inGrade 9 the Previous Year
Analyses of enrollment data at the state level reveals that there has long been
substantial variation in rates of student attrition between grades 9 and 10. Between 1984-
85 and 1985-86, when the rate of attrition between grade 9 and 10 nationally stood at a
little less than 5%, six states had attrition rates of 10% or worse (Georgia 16.5%; Texas
14.9%, Louisiana 13.2%; South Carolina 11.5%; Kentucky 11.2% and Virginia 10.0%),
but ten states showed grades 9 to 10 attrition rates of less than 2% (California, Minnesota,
Nebraska, Nevada, Utah, Kansas, Wyoming, South Dakota, Hawaii, and Wisconsin).
By the end of the century, however, the list of states with attrition rates between
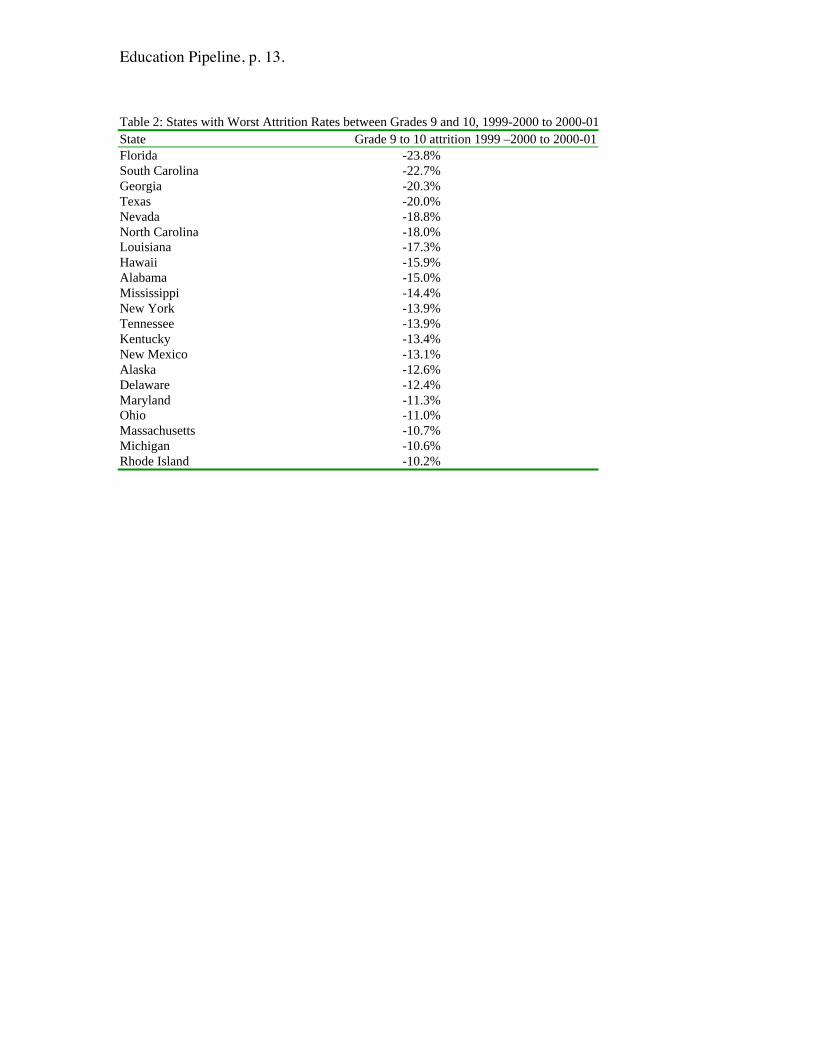
grades 9 and 10 of more than 10% had more than tripled. Table 2 lists the 21 states with
the worst rates of grade 9 to 10 attrition between 1999-2000 and 2000-01. Since the
number of states with grade 9 to 10 attrition rates of more than 10% had more than tripled
between the mid-1980s and the end of the century, it is hardly surprising that the grade 9
to 10 attrition rate nationally had more than doubled during the same interval, from less
-14%
-12%
-10%
-8%
-6%
-4%
-2%
0%

Education Pipeline, p. 12.
than 5% to more than 11%. What is striking about the list of states shown in Table 2 is
that it includes not just southern states (the only ones with such attrition rates of more
than 10% in the mid-1980s), but also northern and Midwestern states such as New York,
Massachusetts, Rhode Island, Ohio and Michigan.
Education Pipeline, p. 13.
Table 2: States with Worst Attrition Rates between Grades 9 and 10, 1999-2000 to 2000-01
State Grade 9 to 10 attrition 1999 –2000 to 2000-01
Florida -23.8%
South Carolina -22.7%
Georgia -20.3%
Texas -20.0%
Nevada -18.8%
North Carolina -18.0%Louisiana -17.3%
Hawaii -15.9%
Alabama -15.0%
Mississippi -14.4%
New York -13.9%
Tennessee -13.9%
Kentucky -13.4%
New Mexico -13.1%
Alaska -12.6%
Delaware -12.4%
Maryland -11.3%Ohio -11.0%
Massachusetts -10.7%
Michigan -10.6%
Rhode Island -10.2%

Education Pipeline, p. 14.
V Bulge in Grade 9 Enrollments
A third key finding from our analyses of enrollment data is that there has been a
sharp increase in the “bulge” of students enrolled in grade 9 in the last 30 years. As a
simple way of showing the increasingly critical role of grade 9 in the education pipeline,
we start with a simple graph. Figure 3 depicts the numbers of students in U.S. public
schools nationwide enrolled by grade in each of two academic years; namely, 1968-69
and 1999-2000. Note that this figure provides a cross-sectional view of grade
enrollments in these two years rather than results of cohort progression analyses. In
1968-69 and 1999-2000, there were similar numbers of students enrolled in grades 1-12
overall, about 42 million across the span of grades 1-12. From Figure 3 we see that there
were between 2.5 and 4 million enrolled in each of the twelve grades in both 1968 -69
and 1999-2000. In general there were slight declines in both years in the numbers
enrolled in grades 1 through 7, and with sharper declines in grades 9 through 12.
Strikingly discrepant from this overall pattern is the grade 9 enrollment for 1999-2000
which is 440 thousand more than grade 8 enrollment in the same year, and 520 thousand
more than grade 10 enrollment. This simple graph reflects how grade 9 has become an
increasingly important valve in the education pipeline, as enrollments are “bulging up” in
grade 9 and, as discussed in the previous section, attrition of students between grades 9
and 10 is increasing.

Education Pipeline, p. 15.
Figure 3: Number of students (in 1000’s) enrolled in U.S. public schools, by grade, 1968-69 and 1999-2000
Source: National Center for Education Statistics, Digest of Education Statistics 1981 (Washington, DC:
National Center for Education Statistics) Table 30, p.40; Digest of Education Statistics 2001
(Washington, DC: National Center for Education Statistics), Table 40, p. 56.
Figure 4 shows another view of how enrollments have been bulging up in grade 9.
As this figure shows, during the 1970s there were only 4-6% more students enrolled in
grade 9 than in grade 8 the previous year. However, beginning in the mid-1980s, this
percentage began to climb sharply so that by the end of the century, in public schools
nationally there were about 13% more students enrolled in grade 9 than in grade 8 the
previous year. This means that in the last 30 years, the bulge of students in grade 9 has
more than tripled, from around 4% to 13%.
0
500
1000
1500
2000
2500
3000
3500
4000
4500
1st 2nd 3rd 4th 5th 6th 7th 8th 9th 10th 11th 12th
AY 1968-69
AY 1999-2000

Education Pipeline, p. 16.
Figure 4: Percent More Students Enrolled in Grade 9 than in Grade 8 the Previous Year, U.S. Public
Schools, 1969-70 to 2000-01.
This combination, of increasing attrition of students between grades 9 and 10, and
increasingly more students enrolled in grade 9 relative to grade 8, is surely a reflection of
the fact that more students nationally were being flunked to repeat grade 9. This pattern
bodes ill for future graduation rates because research suggests that flunking students to
repeat a grade is not a sound educational strategy (Shepard & Smith, 1989). Indeed,
recent evidence from Texas and other states indicates, that 70-80% of students who are
flunked to repeat grade 9 will not persist in school to high school graduation (Haney
2001). In the next section we present direct evidence on what has been happening to
graduation rates, both nationally and among the states, but first we pause to summarize
evidence from state-level analyses of the grade 9 “bulge.”
Analyses of state-level enrollment data from 1984-85 to 2000-01 indicate that the
grade 9 bulge, like attrition between grades 9 and 10, has long varied across the states.
0%
2%
4%
6%
8%
10%
12%
14%

Education Pipeline, p. 17.
As of 1985-86, one state, New York, had 20% more students enrolled in grade 9 than in
grade 8 the previous year, and seven states (CA, DE, FL GA, HI, MI and WI) had a grade
9 bulge of 10-13%. In contrast, in 1985-86, twenty-two states had grade 9 bulges of less
than 5%.
By the end of the century, however, this pattern had changed dramatically. By
2000-01 more than half the states had 10% or more students enrolled in grade 9 than in
grade 8 the previous year and seven states had grade 9 bulges of 20% or more. Table 3
lists the 26 states with the largest grade 9 “bulges” as of 2000-01.
Table 3: States with Largest Bulges in Grade 9 Enrollments 2000-01 Relative to Grade 8
Enrollment 2000-01
State Percent More Students in Grade 9 in 2000-01 than in Grade 8 in
1999-2000
Florida 32%
South Carolina 24%
Nevada 24%New York 21%
Hawaii 21%
Kentucky 20%
Texas 20%
Georgia 19%
Delaware 19%
North Carolina 16%
Virginia 16%
Wisconsin 15%
New Mexico 14%
Maryland 14%Washington 13%
California 13%
Colorado 12%
Ohio 11%
Pennsylvania 11%
Illinois 11%
Rhode Island 11%
Connecticut 10%
Tennessee 10%
Massachusetts 10%
Michigan 10%
Alaska 10%
In contrast, by the end of the century just eight states (MI, SD, MT, ND, UT, WY,
AR, and ME) had a grade 9 bulge of less than 5%. This sharp reversal – the number of

Education Pipeline, p. 18.
states with grade 9 bulges of more than 10% more than doubled, and the number of states
with bulges of less than 5% fell from twenty-two to eight – is a clear sign that far more
states are flunking far more students to repeat grade 9 by the end of the century than had
been true in the mid-1980s.

Education Pipeline, p. 19.
VI Falling Graduation Rates
The combination of findings presented in the last two sections should make our
fourth finding come as no surprise: high school graduation rates have been falling in the
United States in recent years. To illustrate this unfortunate development, we begin as
usual with a summary of national results, followed by a recap of state-level results.
As mentioned previously, the most obvious way to calculate high school
graduation rates is simply to divide the number of high school graduates by the numbers
of students enrolled in grade nine three and a half years earlier. However, as shown in
the last section of this report, as more students are being flunked to repeat grade 9, such
simple calculations, will be affected not just by changes in the numerator (the numbers of
graduates), but also by changes in the denominator (the increasing bulge of students
enrolled in grade 9). In an effort to disentangle changes in graduation rates from the
increasing bulge in grade 9 enrollments, in this section we start by focusing on rates of
graduation from grade 8 to graduation four years later. Later we compare our results with
a number of other methods of calculating high school graduation results.
Figure 5 shows what has been happening at the national level to high school
graduation rates defined in terms of grade 8 to graduation four years later. As shown,
graduation rates climbed slightly in the early 1980s and dipped slightly during the late
1980s. Since the early 1990s, however, the grade 8 to graduation rates have fallen quite
steadily, from 78.4% in 1991-92 to 74.4% in 2000-01. In other words, since a high
school graduation rate of 90% was set out as a national education goal in the early 1990s,
actual graduation rates have been going in exactly the wrong direction, falling from a
little more than 78% in the early 1990s to less than 75% in 2000-01. A decline in

Education Pipeline, p. 20.
graduation rate from 78.41% in 1990-91 to 74.40% in 2000-01 may not seem like a huge
drop, but three facts help to put the 4.01% decline in graduation rate in perspective. First,
since there were 3.4 million students enrolled in grade 8 in 1996-97, a graduation rate of
74.4% means that 871,000 of these students did not graduate in 2000-2001. Second, if
the graduation rate for the class of 1992 had merely persisted another decade, 135,000
more students would have graduated in 2000-01. Third, if the national education goal of
a 90% graduation rate by the year 2000 had been achieved, an additional 531,000
students would have graduated with their class in 2000-01 “in the standard number of
years.” In the concluding section of this report we discuss the implications of this loss of
100s of thousands of students from school prior to graduation. But first, we drop down
from the national level, to examine graduation rates at the level of the 50 states.
Figure 5: National High School Graduation Rate, No. of Graduates Divided by Grade 8 Enrollment Four
Years Earlier, 1979-80 to 2000-01
60%
65%
70%
75%
80%
85%
90%
95%
100%

Education Pipeline, p. 21.
Graduation rate results for the 50 states, from 1988-89 through 2000-01 are
shown in Table 4. There are many numbers in this table, so let us summarize here in
words. Only two of the fifty states – New Jersey and Wisconsin – appear to have
achieved the national education goal of a graduation of 90% as of the turn of the century.
As of 2000-01, just fifteen states (WI, NJ, IA, MN, ND, UT, PN, NE, MD, VA, MT, CT,
MA, VT and ID) had graduation rates of 80% or more. On the other end of the
graduation spectrum, there were thirteen states with graduation rates of 70% or less (DE,
NM, ME, OR, NC, LA, GA, AZ, AL, FL, TN, SC and MS). As of 1990-91, only five
states (LA, MS, SC, AL and FL) had graduation rates of 70% or less. So in the last
decade the number of states with graduation rates of 70% or less has more then doubled
(from five to thirteen). The states with the largest declines in graduation rates since
1988-89 – all with declines of 5% or more – were HI, ME, AZ, DE, TN, NM, SC, AL
SD, IN, NY, NC, MN, FL and IL. Figure 6 shows a graph of how graduation rates have
declined in the ten largest of these states (each with a total public school enrollment of
more than half a million) over the 1988-89 to 2000-01 interval.

Education Pipeline, p. 22.
Table 4: State High School Graduation Rates, Grade 8 to Graduation Four Years Later, 1988-89 to 2000-01
88-89 89-90 90-91 91-92 92-93 93-94 94-95 95-96 96-97 97-98 98-99 99-00 00-01
Data Source 2,16 3,17 4,18 5,19 6,20 7,21 8,22 9,23 10,24 11,23 12,25 13,26 14,26
Alabama 72% 69% 68% 68% 65% 63% 64% 62% 61% 63% 61% 63% 65%
Alaska 68% 69% 75% 76% 77% 76% 72% 71% 70% 71% 72% 69% 71%
Arizona 75% 76% 82% 78% 81% 75% 68% 64% 69% 68% 65% 68% 65%
Arkansas 76% 76% 75% 76% 77% 75% 72% 73% 70% 74% 74% 74% 73%
California 75% 77% 77% 79% 78% 76% 73% 73% 74% 74% 77% 78% 78%
Colorado 79% 79% 78% 81% 81% 80% 79% 77% 76% 75% 75% 76% 75%
Connecticut 81% 81% 85% 85% 85% 85% 82% 80% 80% 80% 79% 85% 80%
Delaware 79% 76% 76% 79% 80% 75% 72% 75% 74% 78% 76% 71% 70%
Florida 68% 68% 69% 73% 70% 69% 67% 66% 67% 66% 66% 65% 63%
Georgia 69% 71% 72% 71% 70% 68% 66% 64% 64% 60% 60% 63% 68%
Hawaii 90% 96% 85% 84% 83% 84% 83% 83% 76% 73% 71% 76% 73%
Idaho 77% 78% 80% 82% 82% 82% 82% 82% 82% 81% 80% 80% 80%
Illinois 83% 83% 84% 85% 85% 83% 82% 82% 82% 83% 83% 84% 78%
Indiana 80% 80% 81% 81% 80% 78% 77% 76% 76% 75% 76% 73% 73%
Iowa 89% 90% 89% 92% 92% 91% 90% 89% 89% 89% 88% 88% 87%
Kansas 83% 84% 84% 83% 84% 84% 82% 81% 80% 78% 78% 79% 79%
Kentucky 72% 74% 76% 76% 79% 83% 78% 75% 74% 73% 73% 74% 74%
Louisiana 68% 64% 61% 59% 64% 65% 67% 65% 65% 66% 65% 67% 68%
Maine 84% 88% 86% 86% 81% 75% 73% 74% 76% 73% 71% 71% 70%
Maryland 81% 81% 82% 85% 84% 84% 83% 83% 81% 81% 81% 81% 84%
Massachusetts 79% 85% 82% 85% 83% 83% 81% 81% 81% 81% 80% 81% 80%
Michigan 79% 79% 78% 79% 78% 78% 77% 76% 78% 79% 80% 76% 79%
Minnesota 91% 94% 94% 93% 93% 92% 91% 89% 81% 87% 88% 87% 86%
Mississippi 60% 66% 64% 65% 65% 65% 63% 61% 61% 62% 61% 61% 61%
Missouri 79% 80% 80% 80% 80% 80% 80% 79% 78% 78% 80% 79% 78%
Montana 84% 82% 84% 85% 87% 88% 88% 86% 85% 83% 83% 82% 81%
Nebraska 87% 87% 87% 89% 89% 89% 89% 87% 87% 87% 89% 88% 84%
Nevada 73% 79% 80% 74% 73% 72% 69% 68% 76% 73% 74% 73% 72%
New Hampshire 79% 80% 81% 82% 83% 82% 80% 78% 77% 77% 75% 76% 77%
New Jersey 85% 86% 88% 89% 91% 91% 90% 90% 90% 82% 83% 91% 90%
New Mexico 78% 75% 77% 76% 76% 75% 73% 73% 72% 66% 68% 70% 70%
New York 78% 79% 77% 78% 77% 77% 74% 74% 76% 74% 73% 73% 72%
North Carolina 74% 73% 73% 74% 73% 73% 72% 70% 69% 69% 70% 71% 69%
North Dakota 87% 87% 87% 88% 86% 88% 88% 90% 88% 88% 87% 87% 85%
Ohio 82% 81% 81% 80% 83% 84% 83% 78% 78% 79% 78% 78% 79%
Oklahoma 76% 79% 77% 78% 78% 78% 79% 77% 76% 76% 78% 77% 75%
Oregon 72% 74% 74% 76% 76% 75% 76% 70% 70% 70% 70% 72% 70%
Pennsylvania 85% 86% 86% 88% 88% 88% 87% 87% 86% 85% 85% 84% 84%
Rhode Island 77% 76% 78% 82% 81% 79% 79% 76% 77% 76% 76% 77% 78%
South Carolina 70% 64% 68% 65% 67% 67% 64% 64% 62% 62% 62% 62% 62%
South Dakota 84% 84% 84% 85% 88% 91% 88% 87% 88% 80% 75% 80% 78%
Tennessee 71% 71% 72% 74% 73% 69% 71% 71% 66% 62% 62% 62% 63%
Texas 70% 72% 74% 69% 68% 69% 69% 68% 70% 72% 72% 75% 75%
Utah 82% 79% 78% 81% 81% 81% 80% 79% 84% 83% 84% 85% 84%
Vermont 76% 85% 77% 78% 77% 80% 86% 83% 86% 86% 83% 83% 80%
Virginia 79% 79% 80% 80% 81% 80% 79% 78% 79% 80% 80% 81% 82%
Washington 79% 82% 78% 82% 81% 83% 80% 79% 77% 76% 76% 77% 76%
West Virginia 76% 77% 77% 77% 79% 79% 77% 79% 79% 79% 79% 77% 76%
Wisconsin 93% 96% 94% 94% 95% 93% 92% 91% 91% 89% 89% 89% 90%
Wyoming 76% 76% 79% 84% 86% 86% 80% 78% 79% 78% 77% 78% 73%

Education Pipeline, p. 23.
Figure 6: Large States with Declines of 5% or More in High School Graduation Rates, 1988-89 to 2000-01
In contrast to the states just mentioned, there were sixteen states whose graduation
rates either stayed level or increased over the same interval (NJ, TX, VT, AK, KY, VA,
MD, ID, CA, UT, RI, MA, MS, LA, MI and WV). Figure 7 shows how rates have
changed in the largest of these states (again, ones with total public school enrollment of
more than half a million as of fall 2000) over the 1988-89 to 2000-01 interval.
50%
55%
60%
65%
70%
75%
80%
85%
90%
95%
100%
88-
89
89-
90
90-
91
91-
92
92-
93
93-
94
94-
95
95-
96
96-
97
97-
98
98-
99
99-
00
00-
01
New York
Florida
Illinois
North Carolina
Indiana
Tennessee
Arizona
Minnesota
Alabama
South Carolina

Education Pipeline, p. 24.
Figure 7: Large States with No Declines in High School Graduation Rates, 1988-89 to 2000-01
In sum, at the state level, decrease in graduation rates are more apparent than
increases between 1988-89 and 2000-01. Over this interval there were just five states
that consistently showed graduation rates of 85% or better (WI, NJ, IA, MN, and ND).
On the other end of the graduation rate spectrum, by 2000-01 there were nine states with
graduation rates of less than 70% (NC, LA, GA, AZ, AL, FL, TN, SC and MS). Among
these states, Arizona posted the largest decline in graduation rate, falling from 75% in
1988-89 to 65% in 2000-01. The other states showing large declines in graduation rate
over the same interval were Tennessee (71% to 63%), Alabama (72% to 65%), South
Carolina (70% to 62%) and Florida (68% to 63%).
Why have high school graduation rates been falling, in effect going opposite of
the direction suggested in the Goals 2000 legislation in 1994? This is a question we
address in the next section of this report. Before proceeding to that discussion we pause
50%
55%
60%
65%
70%
75%
80%
85%
90%
95%
88-
89
89-
90
90-
91
91-
92
92-
93
93-
94
94-
95
95-
96
96-
97
97-
98
98-
99
99-
00
00-
01
California
Texas
Michigan
New Jersey
Virginia
Massachusetts
Maryland
Louisiana
Kentucky

Education Pipeline, p. 25.
here to discuss possible weaknesses in our graduation rate calculations based on numbers
of graduates divided by grade 8 enrollment four years earlier.
Cohort progression analyses of the sort discussed so far do not take into account
four ways students may disappear from their cohorts or classes other than being held back
in grade or dropping out of school. First, they may die. Second, they may move out of
the state or country. Third, they may move out of public schools into non-public schools.
Fourth, they may be withdrawn from public schools to be schooled at home via what has
come to be called “home-schooling.” In subsequent portions of this section we discuss
each of these possibilities.
Mortality. At least in theory, one possible cause for students disappearing from
one grade one year and the next grade the next year is that they may die. However,
statistics on mortality rates indicate that death of young people could have only a very
small impact on results of cohort progression analyses. Death rates in the U.S. have been
falling for some decades. As of 2000 the rate of death for the general population was 873
per 100,000, or 0.87%. For school age populations, however, death rates are much, much
lower: For those aged 5-9 years in 2000, it was 16 per 100,000; for those aged 10-14
years, 21 per 100,000 and those aged 15-19, 68 per 100,000. Since the mortality rates for
the school aged population are so low – all less than one tenth of one percent – outright
death, even over a four year period is clearly not a major source of leaks in the education
pipeline. Moreover, given that death rates for school-aged children in the U.S. have
dropped substantially over the last 20 years, this decreasing death rate for young people

Education Pipeline, p. 26.
would, if anything, have been decreasing the leakage from the education pipeline over
this interval.4
Migration. A second possible influence on results of cohort progression analyses
is migration. For example, instead of progressing from grade 9 to grade 10, or on to
graduation, young people might leave the U.S. (or in the case of state-level analyses,
move from one state to another). Regarding this possibility we are fortunate to have a
special tabulation by the U.S. Census Bureau Census 2000 results showing patterns of
gross and net migration by age of the U.S. population by region and state. Since results
for the total U.S. are simpler to explain, we start with the U.S. as a whole before dealing
with migration at the state level.
Table 5 shows Census 2000 results for the total population of the U.S. aged 5
years and older. Specifically, the table shows the population by age span and whether
individuals were immigrants from abroad within the previous five years. As shown, the
total population 5 years and older in 2000 was 262 million. Of these, 7.5 million, or
2.9%, were immigrants from abroad within the previous five years. Immigration rates
clearly vary substantially by age, with the highest rates evident for the young adult age
ranges of 20 to 24 years and 25 to 29 years (both more than 6%). For the elementary-
secondary school age ranges of 5 to 9, 10 to 14, and 15 to 20 years, immigrants as
percentages of the age group population were 2.8%, 2.5% and 3.9%, respectively. The
latter we suspect is slightly higher because it includes 18- and 19-year-olds, many of
whom were taking up residence in the U.S. to attend college.
4 This discussion is based on National Vital Statistics Reports Volume 50, No. 15, September 16, 2002
Death: Final Report for 2000. Available at: http://www.cdc.gov/nchs/products/pubs/pubd/nvsr/50/50-
16.htm#currentpro

Education Pipeline, p. 27.
Table 5: U.S. Population 5 years and older, by age group and immigrants status within previous 5
years
Geographic Area Population 5years and over
Immigrants fromAbroad
Immigrantsas % of Age
Group
.
U.S. Total
262,375,152
7,495,846 2.86%
.5 to 9 years 20,608,282 569,242 2.76%
.10 to 14 years 20,618,199 514,990 2.50%
.15 to 19 years 19,911,052 784,080 3.94%
.20 to 24 years 19,025,980 1,214,932 6.39%
.25 to 29 years 19,212,244 1,213,628 6.32%
.30 to 34 years 20,365,113 905,299 4.45%
.35 to 39 years 23,083,337 700,685 3.04%
.40 to 44 years 22,822,134 499,774 2.19%
.45 to 49 years 20,181,127 337,732 1.67%
.50 to 54 years 17,397,482 231,635 1.33%
.55 to 59 years 13,383,251 154,925 1.16%
.60 to 64 years 10,787,979 124,796 1.16%
.65 to 69 years 9,569,199 89,483 0.94%
.70 to 74 years 8,931,950 63,233 0.71%
.75 to 79 years 7,385,783 39,762 0.54%
.80 to 84 years 4,931,479 25,289 0.51%
.85 years and over 4,160,561 26,361 0.63%
Source: U. S. Census Bureau, Census 2000 PHC-T-23. Migration by Sex and Age for the Population 5
Years and Over for the United States, Regions, States, and Puerto Rico: 2000, special tabulation.
Internet release date: August 6, 2003 (http://www.census.gov/population/cen2000/phc-t23/tab03.xls)
So let us assume that the 2.5% rate is a reasonable estimate for immigration in the
elementary-secondary school-aged population between 1995 and 2000. Presuming that
the immigration for the age group was spread out evenly over the 1995-2000 period, this
would imply an annual net immigration of 0.5% for elementary-secondary school-aged
children during the last half of the 1990s. What this implies is that immigration from
abroad would have been contributing to increases, rather than leakage in the education
pipeline over this interval.
To illustrate, let us consider the high school class of 2001. When this cohort was
in grade 8 in the fall of the 1996-97 school year, it numbered 3.403 million. When this
class graduated in 2000-01, graduates numbered only 2.532 million, for a graduation rate

Education Pipeline, p. 28.
(from grade 8 to graduation four and a half-years later) of 74.4%. Yet if the annual rate
of immigration of high school aged young people into the U.S. over this period was 0.5%
per year, this implies that the cohort ought to have increased in size by at least 2% over
the interval. Even if only half of these immigrant children entered public high schools
and proceeded to graduation, this would have increased the graduation rate over the
interval by 1% or more. This suggests that the real “immigration-adjusted” graduation
rate for children in grade 8 in 1996-97 may have fallen by the end of the millennium not
just to 74.4% but to something like 73%.
Dealing with migration in analyses at the level of the states is slightly more
complex, because here we must deal not just with international, but also domestic
migration, that is with migration across states. Again, we are fortunate to have a special
tabulation by the U.S. Census Bureau of results of the Census 2000 showing patterns of
gross and net migration by age both from abroad and across the states. These data are
quite voluminous, but following the logic outlined above regarding foreign migration for
school-age people, let us examine patterns of migration for individuals aged 10 to 14 as
of Census 2000.
Table 6 shows the numbers of children aged 10-14 as of April 2000, by state, plus
the number who were immigrants to the state either domestically (that is from within the
U.S. from another state) or from abroad within the five years preceding the April 2000
Census. The table also shows the 5-year rate in percent of total migration (that is, the net
domestic and foreign migration of 10 to 14 year olds into each state).
As shown in Table 6, for most states there was a small positive net in-migration of
children aged 10 to 14 between 1995 and 2000. However there were seven states that
Education Pipeline, p. 29.
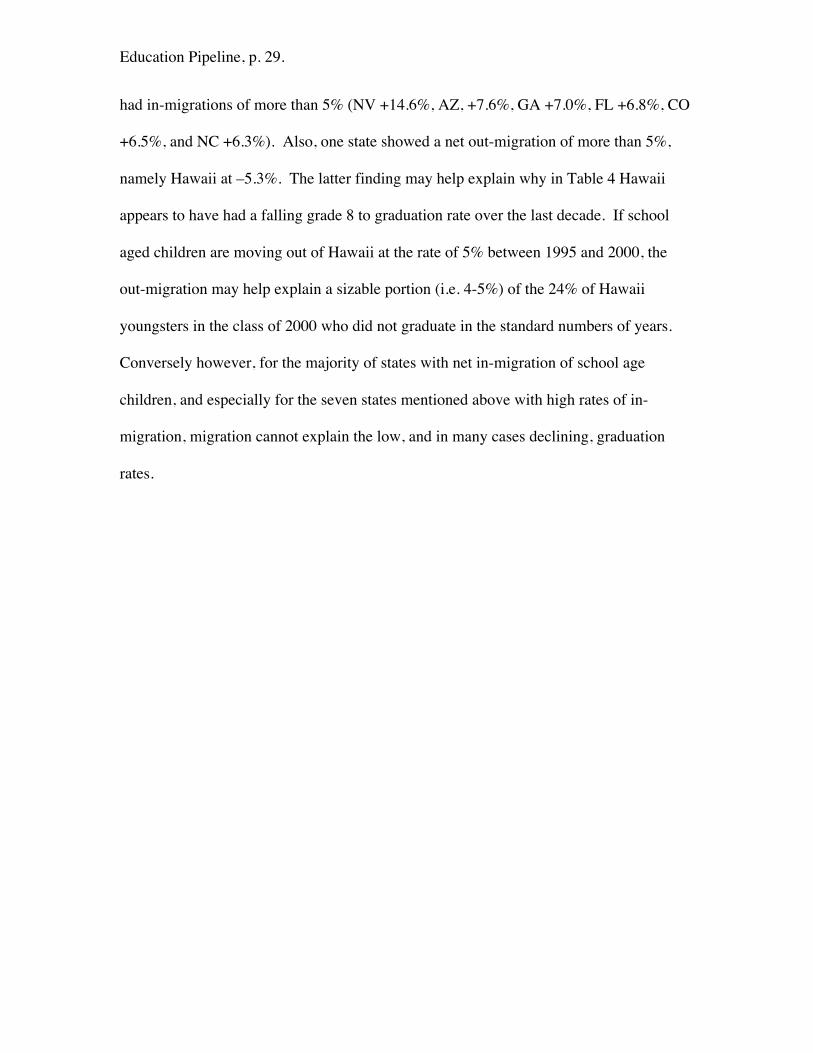
had in-migrations of more than 5% (NV +14.6%, AZ, +7.6%, GA +7.0%, FL +6.8%, CO
+6.5%, and NC +6.3%). Also, one state showed a net out-migration of more than 5%,
namely Hawaii at –5.3%. The latter finding may help explain why in Table 4 Hawaii
appears to have had a falling grade 8 to graduation rate over the last decade. If school
aged children are moving out of Hawaii at the rate of 5% between 1995 and 2000, the
out-migration may help explain a sizable portion (i.e. 4-5%) of the 24% of Hawaii
youngsters in the class of 2000 who did not graduate in the standard numbers of years.
Conversely however, for the majority of states with net in-migration of school age
children, and especially for the seven states mentioned above with high rates of in-
migration, migration cannot explain the low, and in many cases declining, graduation
rates.

Education Pipeline, p. 30.
Table 6: Census 2000 Population Aged 10 to 14, by States and Immigration Status
State Population 10 to
14 years
5-Year Net
Domesticmigration
5-Year
ForeignMigration
Total
Migration(%)
Alabama 321,569 3,792 3,092 2.1%
Alaska 56,962 -2,599 1,219 -2.4%
Arizona 378,451 15,774 12,968 7.6%
Arkansas 192,450 5,419 2,212 4.0%
California 2,593,337 -85,497 92,896 0.3%
Colorado 311,835 10,942 9,243 6.5%
Connecticut 244,079 -1,640 8,387 2.8%
Delaware 55,703 673 1,056 3.1%
Florida 1,060,724 23,871 48,434 6.8%
Georgia 612,358 27,758 15,401 7.0%
Hawaii 83,316 -7,628 3,221 -5.3%
Idaho 104,807 4,146 1,487 5.4%
Illinois 906,678 -25,049 22,573 -0.3%
Indiana 444,320 7,054 4,014 2.5%
Iowa 210,825 1,378 2,627 1.9%
Kansas 203,606 43 3,406 1.7%
Kentucky 280,178 2,928 2,937 2.1%
Louisiana 351,072 -6,282 3,093 -0.9%
Maine 92,776 1,036 560 1.7%
Maryland 395,472 -174 11,643 2.9%
Massachusetts 431,562 -3,831 14,019 2.4%
Michigan 747,157 -93 10,843 1.4%
Minnesota 375,047 5,286 5,820 3.0%
Mississippi 219,488 2,310 1,349 1.7%
Missouri 413,358 6,779 4,807 2.8%
Montana 69,455 497 493 1.4%
Nebraska 128,215 492 2,010 2.0%
Nevada 139,656 14,904 5,466 14.6%
New Hampshire 93,080 3,295 1,219 4.8%
New Jersey 592,401 -8,291 21,862 2.3%
New Mexico 149,462 -4,013 3,479 -0.4%
New York 1,336,043 -62,955 49,471 -1.0%
North Carolina 556,658 22,617 12,462 6.3%
North Dakota 47,602 -1,892 570 -2.8%
Ohio 831,032 -2,964 8,181 0.6%
Oklahoma 253,488 2,895 3,309 2.4%
Oregon 241,529 5,114 5,248 4.3%
Pennsylvania 867,276 -1,528 11,416 1.1%
Rhode Island 71,811 -71 1,835 2.5%
South Carolina 293,460 8,558 3,540 4.1%
South Dakota 59,883 307 761 1.8%
Tennessee 397,496 12,410 4,911 4.4%
Texas 1,642,973 12,717 53,430 4.0%
Utah 192,204 2,244 4,291 3.4%
Vermont 44,829 526 463 2.2%
Virginia 499,166 5,662 14,607 4.1%
Washington 435,598 3,140 13,278 3.8%
West Virginia 115,042 225 451 0.6%
Wisconsin 403,421 5,705 3,550 2.3%
Wyoming 38,847 -351 304 -0.1%

Education Pipeline, p. 31.
Private School Enrollments. A third possible cause of increasing leakage from
the public education pipeline (specifically sharp increases in attrition between grade 9
and 10, and falling graduation rates) is that some students might be leaving public
schools to enroll in private schools. By private schools we refer to all non-public schools
including Catholic schools, other religious schools and nonsectarian private schools. In
1999, for example there were about 8000 Catholic schools, 13,000 other religious
schools, and 6,000 nonsectarian schools in the United States.5
One way of examining whether flows through the public school pipeline have
been affected by patterns of enrollment in non-public schools is to look at enrollments in
public versus private schools in grade 9 through 12 over the last three decades. Figure 8
shows a graph of total enrollments in grades 9-12 in all schools, public schools and
private schools from 1970 to 2000. As may be seen, total enrollments in grades 9-12
have ebbed and flowed somewhat over the last three decades – from close to 15 million
in 1970, ebbing to about 12.5 million in 1990 and increasing back up to almost 15 million
in 2000. Enrollments in grades 9-12 in public schools have very closely paralleled these
totals. This is hardly surprising since over the last three decades 90-92% of all students
in grades 9-12 have been enrolled in public as opposed to private schools. In contrast,
enrollments in private schools have been remarkably stable over the last 30 years, varying
only between 1.15 and 1.40 million. As a percentage of total enrollments in grades 9-12,
private school enrollments were at a high of just over 10% in the early 1980s, but since
then have declined to just under 9% in the late 1990s. This means that leakage from the
5 NCES, Digest of Education Statistics 2002, Table 59, p. 71.

Education Pipeline, p. 32.
public education pipeline clearly has not been caused by sharp increases in private school
enrollments.
Figure 8: Enrollments (in 1000s) in Grades 9– 12, All, Public and Private Schools, 1970-2000
Source: National Center for Education Statistics (2003). Digest of Education Statistics 2002 (Washington,DC: National Center for Education Statistics). Table 56, p. 69.
Home schooling. A fourth and final possible way in which students may leave
the public school pipeline is that they leave public schools for home schooling, that is,
children being schooled at home instead of in either public or private schools.
Unfortunately statistics on the home schooling phenomenon are very hard to find.
Rudner (1999) estimates that in 1998 there were between 700,000 and 1.2 million
students enrolled in home schools. More recently a home schooling advocacy
organization, the Home School Legal Defense Association has reported that the annual
rate of growth in numbers of students being schooled at home in the last decade has been
7% to 15%. The same source estimates that as of the 2001-02 school year there were
0
2000
4000
6000
8000
10000
12000
14000
16000
18000
All Schools
Public Schools
Private schools

Education Pipeline, p. 33.
between 1.7 and 2.2 million children in the U.S. being schooled at home.6 Independent
analysts, however, indicate that these estimates are somewhat inflated. Citing national
survey data, Henke, Kaufman, & Broughman (2000) report that the number of home-
schooled children in the U.S. was estimated at 345,000 in 1994 and 636,000 in1996.
Bielick, Chandler and Broughman (2001) report that in spring 1999 an estimated 850,000
students nationwide were being homeschooled. They noted however that about 20% of
homeschoolers were enrolled in public or private schools part-time. More recently,
Bauman (2002) of the U.S. Census Bureau reports that the number of home schooled
children was well under 1 million in 1999 and the growth rate of from 1996 to 1999 was
unlikely to have exceeded 15 percent per year. Both Bauman (2002) and Bielick,
Chandler and Broughman (2001) report data indicating that the number of homeschooled
children is relatively evenly divided across the school age years of 6 to 17 years.
Thus, overall it seems clear that less than 3% of children nationwide are being
homeschooled (1 million divided by 42 million enrolled in public schools = 2.4%).
There is some evidence that homeschooling has been increasing over the last decade so as
a liberal estimate let us suppose that homeschooling had been increasing by 150,000 per
year during the late 1990s. Assuming that this number was evenly distributed across the
13 grade levels of kindergarten through grade 12. This would imply an outflow from the
public school system of only about 11.5 thousand per year per grade 150,000/13 =
11,538). Between 1999-2000 and 2000-01, attrition between grades 9 and 10 was 448
thousand. This indicates that increases in home schooling – even given the most liberal
estimates – could account for only a very tiny share of the attrition between grades 9 and
10 (11,500/448,000 = 2.6%).
6 http://www.hslda.org/research/faq.asp#1, accessed November 14, 2003.

Education Pipeline, p. 34.
In sum, it is clear that high school graduation rates from public schools have been
falling, rates of attrition between grades 9 and 10 increasing, and the grade 9 bulge (that
is, the number of students flunked to repeat grade 9) increasing over the last two decades.
In this section we have reviewed evidence on possible alternative explanations of these
trends, namely mortality, migration, private school enrollments, and home schooling.
Overall, none of these possibilities can explain the broad trends in public school
enrollments and graduates previously recounted.
Grade 9 to Graduation Rates. To examine the combined effects of the three
trends previously described – namely increasing attrition between grades 9 and 10,
increasing bulge in grade 9 enrollments, and the falling rate of graduation – let us return
to examine evidence on the most obvious manner of calculating high school graduation
rates, namely the numbers of graduates divided by the numbers enrolled in grade 9 three
and a half years earlier. Figure 9 shows the national pattern of results in high school
graduation defined in this way. To be clear, we note that this manner of calculating high
school graduation rates confounds, or in other words, shows the combination of the broad
trends previously identified, specifically falling graduation rates, increasing rates by
which students are flunked to repeat grade 9 and increased attrition between grades 9 and
10.

Education Pipeline, p. 35.
Figure 9: National High School Graduation Rate, No. of Graduates Divided by Grade 9 Enrollment Threeand a Half Years Earlier, 1971-72 to 2000-01
What Figure 9 shows is that high school graduation rates, defined in this manner,
have fallen dramatically in the last thirty years, from about 77% in 1971-72 to only 67%
in the late 1990s. This means that only two out of three young people in the late 1990s
were progressing normally from grade 9 to high school graduation.
Table 7 shows high school graduation rates defined in this manner for the fifty
states have fallen in 44 of the 50 states over this interval. Graduation rates have fallen
most sharply, over 10 percent, in this 13-year interval in eight states – HI, SD, AL, SC,
NM, TN, MS, and IN.
50%
55%
60%
65%
70%
75%
80%
85%
90%

Education Pipeline, p. 36.
Table 7: State High School Graduation Rates, Grade 9 to Graduation Three and a Half Years Later, 1987-
88 to 2000-01
1987-88
1988-89
1989-90
1990-91
1991-92
1992-93
1993-94
1994-95
1995-96
1996-97
1997-98
1998-99
1999-00
2000-01
Alabama 74% 68% 65% 66% 66% 62% 60% 60% 58% 57% 60% 56% 59% 60%
Alaska 70% 64% 68% 72% 74% 73% 71% 68% 65% 64% 65% 66% 62% 64%Arizona 67% 69% 73% 72% 73% 72% 69% 63% 58% 62% 61% 60% 59% 59%Arkansas 79% 78% 77% 77% 78% 78% 76% 73% 75% 70% 73% 73% 74% 73%California 69% 67% 68% 68% 69% 68% 66% 64% 65% 66% 67% 68% 69% 69%Colorado 76% 76% 74% 74% 75% 75% 75% 73% 72% 72% 71% 70% 70% 69%Connecticut 82% 83% 75% 79% 80% 81% 79% 75% 74% 74% 73% 72% 77% 73%Delaware 70% 72% 68% 68% 70% 70% 66% 65% 66% 67% 68% 64% 61% 61%Florida 63% 61% 61% 61% 65% 61% 59% 59% 58% 58% 57% 56% 55% 52%
Georgia 63% 62% 63% 64% 64% 62% 59% 57% 55% 55% 51% 50% 52% 57%Hawaii 82% 82% 87% 76% 78% 75% 76% 75% 75% 63% 62% 60% 64% 61%Idaho 77% 78% 79% 80% 81% 82% 80% 80% 80% 79% 78% 78% 77% 78%Illinois 78% 78% 77% 78% 79% 78% 77% 75% 76% 77% 77% 75% 71% 71%Indiana 78% 76% 75% 74% 76% 75% 71% 70% 70% 70% 71% 71% 68% 68%Iowa 87% 86% 88% 86% 88% 88% 87% 85% 85% 85% 84% 83% 83% 83%Kansas 83% 82% 82% 81% 81% 80% 79% 77% 76% 74% 73% 75% 74% 75%Kentucky 69% 67% 69% 70% 70% 73% 75% 70% 68% 68% 67% 65% 66% 64%
Louisiana 61% 58% 58% 55% 54% 57% 56% 58% 55% 53% 55% 55% 59% 60%Maine 78% 77% 78% 79% 81% 74% 72% 72% 72% 72% 79% 75% 77% 72%Maryland 76% 74% 73% 73% 76% 76% 75% 74% 74% 71% 71% 72% 73% 75%Mass. 74% 75% 80% 77% 79% 78% 78% 76% 76% 76% 76% 75% 75% 74%Michigan 73% 71% 70% 70% 71% 70% 70% 69% 70% 71% 72% 73% 65% 75%Minnesota 90% 89% 90% 90% 89% 89% 88% 87% 85% 77% 84% 85% 84% 82%Mississippi 68% 60% 64% 62% 62% 64% 62% 60% 57% 56% 56% 56% 56% 57%Missouri 75% 73% 73% 73% 73% 73% 73% 73% 71% 71% 72% 72% 73% 72%Montana 85% 85% 83% 85% 85% 87% 84% 86% 83% 81% 80% 78% 78% 77%
Nebraska 86% 86% 86% 86% 87% 87% 85% 84% 83% 82% 85% 86% 84% 78%Nevada 73% 72% 77% 77% 71% 70% 67% 65% 65% 73% 70% 71% 69% 69%NH 81% 74% 74% 76% 78% 78% 78% 75% 75% 75% 74% 73% 74% 75%New Jersey 80% 80% 80% 82% 84% 86% 85% 84% 83% 86% 78% 80% 85% 86%NM 73% 71% 68% 69% 68% 68% 67% 64% 63% 58% 58% 59% 60% 61%New York 66% 65% 65% 64% 67% 65% 64% 62% 61% 63% 61% 59% 59% 58%N. Carolina 68% 69% 68% 68% 69% 68% 66% 66% 62% 61% 61% 60% 59% 59%N. Dakota 88% 88% 88% 87% 87% 86% 88% 87% 89% 87% 85% 84% 84% 84%
Ohio 76% 76% 74% 72% 72% 75% 75% 75% 70% 71% 73% 70% 70% 70%Oklahoma 74% 74% 78% 75% 76% 76% 76% 75% 73% 72% 72% 73% 73% 73%Oregon 72% 71% 72% 72% 73% 73% 73% 69% 67% 67% 67% 67% 67% 66%Penn. 81% 79% 79% 79% 82% 81% 79% 77% 76% 76% 75% 75% 75% 76%RI 72% 72% 69% 72% 77% 75% 73% 73% 71% 71% 70% 69% 70% 70%S. Carolina 65% 65% 59% 61% 58% 59% 57% 55% 54% 52% 52% 52% 51% 51%S. Dakota 87% 86% 86% 84% 85% 89% 91% 87% 87% 82% 76% 72% 74% 72%Tennessee 69% 69% 68% 68% 69% 67% 63% 64% 63% 58% 55% 55% 55% 57%
Texas 65% 64% 64% 66% 61% 59% 60% 60% 58% 59% 61% 61% 62% 62%Utah 81% 82% 79% 79% 81% 81% 80% 79% 78% 83% 82% 83% 84% 83%Vermont 81% 81% 92% 81% 82% 82% 85% 89% 90% 82% 81% 80% 79% 75%Virginia 75% 75% 74% 74% 74% 74% 72% 72% 76% 75% 74% 74% 74% 75%Washington 78% 76% 77% 73% 76% 76% 77% 73% 72% 71% 71% 71% 71% 69%W. Virginia 77% 77% 77% 78% 77% 78% 78% 75% 76% 75% 75% 76% 75% 73%Wisconsin 83% 82% 84% 82% 82% 84% 82% 82% 80% 80% 79% 78% 78% 79%Wyoming 78% 76% 79% 82% 84% 87% 84% 78% 78% 78% 77% 77% 75% 73%

Education Pipeline, p. 37.
Another way of interpreting these results is simply to look at the distribution of
rates in the late 1980s and at the turn of the century. In 1987-88, not a single state had a
graduation rate of less than 60% and fifteen had graduation rates of 80%or more. By
2000-01, ten states had graduation rates of 60% or less – SC, FL, TN, MS, GA, NY, NC
AZ, AL and LA. Two of these states had suffered such large declines in graduation rates,
defined in this way, as to be approaching only 50% – SC with 51%, and FL with 52%.
This means that in these states only about 1 out of 2 students were progressing normally
from grade 9 to graduation three and a half years later in the late 1990s.
In contrast, in 2000-01, there were just five states with graduation rates of 80% or
greater – MN, IA, UT, ND and NJ. This means that between 1987-88 and 2000-01, the
list of states with grade 9 to graduation rates of 80% or more had fallen by two-thirds,
from fifteen to a mere five. By the end of the century, there was just one state – New
Jersey – that was even with five percentage points of the national education goal of a
90% graduation rate.
In the next sections of this report we discuss causes and consequences of these
precipitously falling graduation rates. But first, before moving to that discussion, we
pause here to show that our simple and direct methods of calculating state high school
graduation rates correspond closely with more complex methods of calculating such
statistics.
Since the enactment of the No Child Left Behind (NCLB) law in 2002, with its
requirement for evaluating public schools in terms of “graduation rates for public
secondary school students (defined as the percentage of students who graduate from
secondary school with a regular diploma in the standard number of years),” there have

Education Pipeline, p. 38.
been a number of reports issued on different ways of calculating graduations rates
(Greene & Forster, 2003; Swanson & Chaplin, 2003; Warren 2003). We do not attempt
here to discuss all the different ways in which high school graduation rates may be
calculated (and the pros and cons of different approaches). Rather we simply show that
our simple and direct approach to doing so correspond very well to results derived from a
more complex and theoretically complete method.
Specifically we refer to the work of John Robert Warren of the University of
Minnesota (2003). In a paper discussing the pros and cons of different ways of
calculating graduation rates, Warren proposed a new measure of graduation rate, one that
uses CCD enrollment data but that also uses Census 2000 data to adjust for migration
patterns, and data from Current Population Surveys to adjust for retention in grade
between grades 9 and 12. Warren could apply his technique on data only from 1992 to
2000 because the data on which he sought to adjust for migration and grade retention
were not available prior to 1992. His adjusted state-level high school graduation rate
produces “estimates of the percentage of incoming public school 9th graders in a
particular state and in a particular year who obtain a regular public high school diploma
within four or five years of first starting 9th grade” (p. 16).
How well do Warren’s adjusted graduation rates compare with the simple grade 9
to graduation three and a half years later rates? (Warren calculated these grade 9 to
graduation rates for all the states rates from 1992 to 2000, as did we, except we also
calculated then for the longer 1988 to 2001 period of years.) Warren found that his
adjusted graduation rates did not vary dramatically from results using simple grade 9 to
graduation rates. “New Jersey had the highest public high school graduation rate in 2000
using either measure, while South Carolina had the lowest” (p. 17). Warren found that
among 51 state units (Warren included Washington D.C. as a state unit), graduation rates

Education Pipeline, p. 39.
went up or down by less than 5% when changing from the simple to the adjusted
graduation rate. The state for which the year 2000 adjusted graduation rate varied most
from the simple graduation rate was Nevada because it “experienced extraordinarily high
rates of in-migration by high school students in the 1990s” (p. 18). Thus, the simple
graduation rate of 68.8% for Nevada in 2000 fell to 53.6% once in-migration was taken
into account. Conversely, Washington D.C. had unusually high rates of out-migration of
high school aged youth during the 1990s. So the simple grade 9 to graduation rate for the
District of Columbia in 2000 of 54.4% rises to 70.8% once Warren adjusted for out-
migration.
But with few exceptions like these, the simple grade 9 to graduation rate provides
a good approximation to the more complex adjusted rate calculated by Warren. Figure 9
shows a scatter plot of how rankings of the states on the simple or unadjusted graduation
rate for 2000 compare with Warren’s adjusted graduation rates. Though not reported by
Warren, the correlation between the 2000 simple graduation rates and his adjust rate is
0.903. And when the two outlying cases of District of Columbia and Nevada are
excluded, the correlation rises to 0.960. This indicates that the simplest and most
straightforward way of calculating high school graduation rates – as the numbers of
graduates divided by the numbers enrolled in grade 9 three and a half years earlier – is,
under most circumstances, a very good proxy for more complex calculations like those of
Warren which seek to adjust for migration and retention in grade. And in any case, the
sort of data Warren uses to adjust for these factors are simply not available back into
the1980s. So the simpler grade 8 to graduation and grade 9 to graduation approaches
afford straightforward and consistent ways of examining changes in the education
pipeline of the U.S. for the last three decades.

Education Pipeline, p. 40.
Figure 9: State Rankings on High School Graduation Rates, 2000, Unadjusted Grade 9 to graduation Ratevs. Warren’s Adjusted rate.
Source: Warren (2003), Figure 4.

Education Pipeline, p. 41.
The Education Pipeline 1970 vs. 2000. Before going on in the next sections to
discuss some of the causes and consequences of changes in the education pipeline in the
U.S. in recent decades, let us pause to examine in more detail what has happened to the
education pipeline in the U.S. in the past three decades years.
Table 8 shows public school enrollments by grade in the U.S. for two four-year
intervals 1968-69 to 1971-72 and 1997-98 to 2000-01. The bottom half of Table 8 shows
cohort progression rates, that is the percent more or less students in one grade in one year
compared with those in the previous grade the previous year.
Table 8:U.S Public School Enrollment, Kindergarten to Grade 12, 1968-69 to 1971-72 and 1997-98 to
2000-01 (in 1000s).
Grade/Year 68-69 69-70 70-71 71-72 97-98 98-99 99-00 2000-01
K 2526 2601 2559 2483 3503 3443 3397 3382
1st grade 3923 3858 3814 3570 3755 3727 3684 3635
2nd grade 3765 3714 3654 3587 3689 3681 3655 3633
3rd grade 3694 3721 3662 3612 3597 3696 3690 36734th grade 3629 3660 3676 3623 3507 3592 3686 3708
5th grade 3570 3619 3634 3662 3458 3520 3604 3703
6th grade 3556 3565 3599 3622 3492 3497 3564 3658
7th grade 3552 3665 3662 3710 3520 3530 3541 3624
8th grade 3420 3515 3601 3635 3415 3480 3497 3532
9th grade 3508 3567 3652 3781 3819 3856 3935 3958
10th grade 3310 3408 3457 3571 3376 3382 3415 3487
11th grade 2987 3051 3127 3200 2972 3021 3034 3080
12th grade 2655 2733 2774 2862 2673 2722 2782 2799
Percent increase or decrease from previous grade the previous year68-69 69-70 70-71 71-72 97-98 98-99 99-00 2000-01
1st grade 52.7% 46.6% 39.5% 6.4% 7.0% 7.0%
2nd grade -5.3% -5.3% -6.0% -2.0% -1.9% -1.4%
3rd grade -1.2% -1.4% -1.1% 0.2% 0.2% 0.5%
4th grade -0.9% -1.2% -1.1% -0.1% -0.3% 0.5%
5th grade -0.3% -0.7% -0.4% 0.4% 0.3% 0.5%
6th grade -0.1% -0.6% -0.3% 1.1% 1.3% 1.5%
7th grade 3.1% 2.7% 3.1% 1.1% 1.3% 1.7%
8th grade -1.0% -1.7% -0.7% -1.1% -0.9% -0.3%
9th grade 4.3% 3.9% 5.0% 12.9% 13.1% 13.2%
10th grade -2.9% -3.1% -2.2% -11.4% -11.4% -11.4%
11th grade -7.8% -8.2% -7.4% -10.5% -10.3% -9.8%
12th grade -8.5% -9.1% -8.5% -8.4% -7.9% -7.7%

Education Pipeline, p. 42.
There is a number of striking contrasts in cohort progression rates across the last
three decades. Perhaps most striking is the change in progression between kindergarten
and grade 1. Around 1970 there were 40-50% more children enrolled in grade 1 than in
kindergarten the previous year. By around 2000 this number had fallen to 6-7%. This
change, as discussed in part III of this report, is due to the fact that in the last three
decades kindergarten attendance has become more universal in the U.S.
A second notable change, not previously discussed is the grade 1 to 2 progression
rate. Around 1970 there was 5-6% fewer students in grade 2 than in grade 1 the previous
year. By the end of the millennium this number had fallen to 1-2%. We surmise that
thirty years ago, before kindergarten attendance had become near universal, more
children were held back to repeat grade 1. By around 2000, when the vast majority of
students started school in kindergarten rather than grade 1, a larger proportion of students
were prepared to succeed in grade 1 and did not have to be held back to repeat the grade.
A second notable difference in the education pipeline over the last thirty years is
the grade 6 to 7 progression rate. Around 1970 there were 3% more students in grade7
than in grade 6 the previous year. Around 2000 this number had fallen to less than 2%.
In the next section of this report, we discuss the possibility that that this change may be
related to changes in the organization of schooling over the last three decades.
Compared with grade 6 to 7 transition rates, those from 8 to 9 and 9 to 10 have
changed much more sharply over the last three decades. Around 1970 there was 4-5%
more students in grade 9 than in grade 8 the previous year. Thirty years later this number
had more than doubled to about 13%. Correspondingly, around 1970 there were only
about 3% fewer students in grade 10 than in grade 9 the previous year. By 2000, as
discussed in part IV of this report, attrition between grades 9 and 10 had mushroomed to
about 11%. In the next part of this report we discuss possible cause and consequences of
this change. Before doing so, we stop to point out that, as shown in Table 8, that
although attrition between grades 9 and 10 has tripled over the last three decades, attrition

Education Pipeline, p. 43.
in the upper grades of high school has not diminished. Around 1970 attrition between
grades 10 and 11 was in the range of 7.4% to 8.2% and between grades 11 and 12, 8.5%
to 9.1%. By around 2000, corresponding rates were 9.8%to 10.5%. This means that the
large increase in attrition between grades 9 and 10 has not been accompanied by a
diminution in attrition rates across the higher high school grades.
To get a sense of the cumulative impact of attrition between grades 9 and 10, 10
and 11, and 11 and 12, we may simply add up the bottom three attrition rates for the years
shown in Table 8. Doing so yields the following cumulative attrition across the last three
grades of high school: 1969-70 –19.2%, 1970-71 –20.4% 1971-72 –18.1%, 1998-99, -
30.4%, 1999-2000 –29.6% and 2000-01. –28.9%. It should be noted that these
cumulative attrition rates are not based on cohort analyses but are simply the sums of
grade to grade attrition for adjacent grades shown in Table 8 for the particular school
years listed in that table 8. (Grade-to-grade attrition rates are available in the data file
released with this report for all years in the range of 1968-69 for total U.S. public school
enrollments and for the 50 states from 1984-85 to 2000-01.) Nonetheless, these results
indicate that attrition rates of students across the high school grades have increased
sharply over the last from around 20% to about 30%.

Education Pipeline, p. 44.
VII Causes and Consequences
What has been causing these changes in the education pipeline in the U.S. over
the last 30 years and what are their likely consequences?
As to causes the following questions occur. Why did kindergarten attendance
increase so sharply in the 1970s? Why were fewer students being flunked to repeat grade
1 in 2000 than in 1970? Why has attrition between grades 9 and 10 increased in the 1980s
and 1990s? Why have high school graduation rates from grade 8 to graduation four
years later decreased in the 1990s, from 78% in 1991-92 to 74% in 200-01? Why have
graduation rates defined in terms of grade 9 enrollments to graduation three years later
fallen from about 77% in 1971-72 to only 67% in the late 1990s?
Before presenting a discussion of these questions we offer a disclaimer.
Politicians, researchers, and ordinary citizens often try to make judgments about whether
a certain change (such as a piece of federal legislation, or an increase in atmospheric
carbon dioxide) caused a particular development (such as an economic boom or global
warming). But as with the two examples just offered, it is often difficult to make cause
and effect inferences about complex systems, be they social or physical, with absolute
certainty. Indeed, there is no way to prove cause and effect regarding historical matters
with absolute certainty. Thus, we readily acknowledge that some of what we suggest in
this section about probable causes and consequences of changes in the education pipeline
of the U.S. over the last three decades is somewhat conjectural. Nonetheless, we argue,
as did Leonard Ayres a century ago, that rates of student progress through elementary and
secondary school are one of the best measures of the health of an educational system.
While the news from our analysis of the education pipeline is not altogether bleak,

Education Pipeline, p. 45.
evidence suggests that constrictions in the secondary school pipeline are likely leading to
unfortunate negative consequences not just for young people but for society as a whole.
Kindergarten attendance. As shown in part III of this report, only about 60% of
5-year-olds attended kindergarten during the 1960s. Kindergarten attendance grew
rapidly during the 1970s, and after varying slightly in the early 1980s, has continued to
climb since the mid-1980s. Both results of our cohort progression analyses and
independent survey evidence indicate that by the 1990s kindergarten attendance rates
were 90% or more. A number of broad social developments have been associated with
the increasing tendency for children to begin school in kindergarten rather than first
grade. One is the women’s rights movement and the dramatic increase over the last thirty
years in women’s labor force participation rate, increasing from 43% in 1970 to 60% in
2000 (Wright, 2002, p. 333). A more direct cause likely was the increasing recognition
of the importance of early childhood education. Recall, for example, that the Head Start
program of preschool education for disadvantaged students was begun in 1965 as part of
President Lyndon Johnson’s War on Poverty. These were surely some of the distal
causes of the increasing tendency for children to start school in kindergarten rather then
first grade, but a more proximate cause in some places, surely were changes in
compulsory school attendance laws. In 1965 not a single state had compulsory school
attendance laws requiring school attendance for children as young as age five. By 1997,
seven states had instituted laws requiring school attendance of 5-year-olds.7
Grade 1 flunk rate. As noted in the previous section, around 1970 there were 5-
6% fewer students in grade 2 than in grade 1 the previous year, but by 2000 this number
7 On this point compare Table 30, p. 27 of the Digest of Education Statistics 1970 Edition (NCES, 1970)
with Table 150, p. 171 of the Digest of Education Statistics 2003 (NCES, 2003).

Education Pipeline, p. 46.
had fallen sharply to 1-2%. These findings of fewer students in grade 2 than in grade 1
the previous year are a reflection of rates at which students have been “flunked” or
retained to repeat grade 1. It seems clear then that the rates at which children are being
flunked to repeat grade 1 have fallen sharply in the last 30 years. Certainly this
interpretation is consistent with trends in retention rates for the relatively few states for
which grade retention data are available from the 1970s and 1990s.8
Why have grade 1 flunk rates been declining over the last three decades? One is
that as more children start school in kindergarten rather than first grade a larger
proportion, given their kindergarten experience, are prepared to succeed in first grade.
Time trend data show modest support for this proposition. Figure 10 shows the
percent increase or decrease in grade 1 and 2 enrollment relative from 1969-70 to 2000-
01 to kindergarten and grade 1 enrollments the previous year. As may be seen, as the top
line dropped during the 1970s, reflecting increases in kindergarten attendance, the bottom
line inched up, reflecting a diminution in grade 1 flunk rates. When the top line went up
in the early 1980s the bottom dipped slightly. And from around 1985 onward as the top
line declines, indicating the trend for universal kindergarten, the bottom line,
representing grade1 flunk rates goes up toward zero (or to be more specific, from more
than –5% to less than - 2%).
8 For a study on high stakes testing, a committee of the National Research Council contacted all state
education agencies in the U.S. seeking data on grade retention, but only 22 provided data on retention at
any grade level. And even for states which did provide data, coverage across grades and years was

Education Pipeline, p. 47.
Figure 10: Percent increase or decrease in grade 1 and 2 enrollment, 1969-70 relative to enrollment inprevious grade the previous year..
-20%
-10%
0%
10%
20%
30%
40%
50%
60%
Grade 1
Grade 2
The other apparent cause for the decrease in rates at which student were flunked
to repeat grade 1 was the by the mid- 1970s, evidence became available questioning the
educational value of flunking to students to repeat grades. In 1975, for example, Jackson
published an influential study in the Review of Educational Research in which he
concluded that “educators who retain pupils in a grade do so without valid research
evidence to indicate that such treatment will provide greater benefits to students with
academic or adjustment difficulties than will promotion to the next grade” (Jackson,
1975, p. 627, italics in original). Apparently in part because of such findings, some states
began to institute policies discouraging schools from flunking students to repeat grades.
extremely spotty. But of the thirteen states proving time trend data on grade 1 retention, all showed a
decline between the late 1970s or early 1960s and the late 1990s (Heubert & Hauser, 1999, pp. 138-147)

Education Pipeline, p. 48.
Indeed according to the 1999 National Research Council report mentioned earlier, “Iowa
and, until recently, California have taken strong positions against grade retention, based
on research or on the reported success of alternative intervention” (Heubert & Hauser,
1999, p. 116).
Transition from elementary to high school. Another relatively minor change in
the education pipeline in the U.S. over the last 30 years concerns the transition from
elementary to secondary school. As previously reported, around 1970 there were 3%
more students in grade 7 than in grade 6 the previous year, but by around 2000 this
number had fallen to less than 2%. This is indicative, we think, that the rates at which
students are flunked to repeat grade 7 has decreased over the last 30 years. This trend
may be due to research evidence and policies, just mentioned, discouraging schools from
flunking students to repeat grades. But we would also like to suggest that it may also be
associated with a major structural change in the way in which schools are organized to
promote students’ transition from elementary to high school. The organization form
through which almost all students move from elementary to high school is the junior high
school or the middle school. But over the last three decades, the relative prevalence of
these two types of transition schools has changed dramatically. In 1970-71 there were
3.7 times as many junior high schools as middle schools, but by 2000-01 the proportion
had nearly reversed, with 3.5 time as many middle schools as junior high schools.9
Middle schools tend to be organized more like elementary schools, while junior high
schools tend to be organized more like high schools. Thus is seems possible that the
move from the junior high school to middle school model of transition from elementary
to high school has proceeded, the transition from grade 6 to 7 has become easier for
students and fewer students are now flunked to repeat grade 7. In suggesting this
9 In 1970-71 there were2,080 middle schools and 7,750 junior high schools. In 2000-01, there were11,696
middle schools and 3,318 junior high schools. NCES, Digest of Education Statistics 2002, Table 93, p. 119.

Education Pipeline, p. 49.
possibility, we readily acknowledge that this is merely a possibility because the
organizational change from three times as many junior high schools as middle schools in
1970, to the reverse in 2000 has been far more dramatic than the minor change grade 6 to
7 transition rates.
Constriction of the high school pipeline. Far more dramatic than changes in the
education pipeline just discussed has been evidence of what might be called constriction
in the high school pipeline. By this we refer to the changes discussed in parts IV, V and
VI above, namely increasing rates of attrition between grades 9 and 10, an increasing
bulge of students in grade 9 and falling graduation rates. What has been causing such
constriction in the high school pipeline?
As stated previously, proving cause and effect regarding historical developments
is no easy matter, but what seems clear is that constriction in the education pipeline has
been associated with three waves of education reform over the last three decades, namely
minimum competency testing, academic standards movement and high stakes testing.
As shown in Figure 4 above, attrition between grades 9 and 10 was low and
relatively stable at around 3% during the first half of the 1970s. However during the late
1970s attrition between grades 9 and 10 increased to around 5%. This coincided with the
rise of the so-called minimum competency testing movement (Haney & Madaus, 1978).
By the late 1980s, studies showed that there was a relationship between state
implementation of minimum competency testing and dropout rates (Kreitzer, Madaus &
Haney, 1989). In a study of effects of grade retention, Shepard & Smith observed that
“the percentages of overage students [that is, student older than the modal age for
particular grades] began to climb . . . in the late 1970s in response to the minimum
competency testing movement” (Shepard & Smith, 1989, p. 6).

Education Pipeline, p. 50.
As shown in Figure 4, attrition between grades 9 and 10 was relatively stable in
the early 1980s, but began a steady increase, from less than 5% in 1983-84 to 8% in
1988-89. This happened following publication in 1983 of one of the last century’s most
publicized education reform reports, A Nation at Risk. In this report, the National
Commission on Excellence in Education ominously warned, in a much quoted phrase,
that “the educational foundations of our society are presently being eroded by a rising
tide of mediocrity that threatens our very future as a Nation and a people” (p. 5). To
remedy what it saw as declining academic standards (caused in part by what it saw as
low-level minimum competency tests having the perverse effect of minimum
expectations becoming maximum expectations), the Commission called for increased
academic course requirements in high school and for the use of standardized tests at
“major transition points from one level of schooling to another” (p. 8).
In a follow-up study to A Nation at Risk, entitled Meeting the Challenge, the staff
of the Commission surveyed the 50 states and the District of Columbia on their recent
efforts to improve education. Though acknowledging that many reform initiatives were
under way prior to the release of A Nation at Risk, the follow-up report recounted that
among the reform efforts nationwide, “action has been taken or proposals made” with
regard to “student evaluation/testing” by 35 states, and with regard to “graduation
requirements” by 44 states (p.6). Thus it seems clear that what might be called the
academic standards movement of the 1980s was a likely cause of the constriction in the
high school pipeline during this period.
Referring again to Figure 4, it is apparent that the third period of increase in
attrition between grades 9 and 10 started about 1990 and lasted until the end of the
Education Pipeline, p. 51.
decade. During this period attrition between grades 9 and 10 increased nationally almost
50% from about 8% to nearly 12%. During the same interval, the grade 9 to graduation
rate fell from about 71% (already down from about 77% in 71-72) to only 67% (see
Figure 9). This further constriction in the high school pipeline has been associated with
the rise of so-called standards based reform and high stakes testing. Others such as
Shepard (2002) have lumped the education reform movement of the 1990s in with that
following the 1983 Nation at Risk report (in what she calls the excellence movement).
Nonetheless, we think what happened in the 1990s was fundamentally different than what
was going on earlier for one key reason, namely that in the 1990s test results started
being used to make decisions not just about students but also about schools.
There is no way in a short report such as this that we can describe all that has
happened in terms of standards-based education reform in the U.S. over the last decade.
Hence, let us simply describe what is meant by this term and what we see as wrong with
this reform movement. Standards-based reform refers to a process by which states have
been encouraged to develop grade level academic “standards,” then to develop tests
based on those standards, and finally to use results of those tests to make decisions about
bother students and schools based on test results. For example, it is often advocated that
decisions about whether to promote students from one grade to the next or to award them
high school diplomas should be made based on results of such standards based tests.
Similarly, it if often recommended that ratings of schools be based on such test results
(indeed, such ratings of schools are now mandated in the NCLB law).
Though the idea of such a reform strategy is seductively simply, there are a
number of things wrong with it. First, even brief reflection ought to make clear that the
Education Pipeline, p. 52.
aims of public education in the U.S. extend far beyond merely academic learning (much
less merely raising scores on a small number of tests of academic subjects).
Second, to base high school graduation decisions on standardized test results in
isolation, irrespective of other evidence about student performance in high school, is
contrary to recognized professional standards regarding appropriate use of test results.
(See for example the statement of American Educational Research Association,
http://www.aera.net/about/policy/stakes.htm). A simple way of communicating this point
is to note how college admissions test results are used. There is not a single college
anywhere in the nation that accepts all applicants who score above a particular point on
the SAT (say a combined score of 1000) and rejects all applicants who score below that
point. Instead colleges make admissions decisions flexibly using test scores, grades and
other information rather than making decisions mechanically based on test scores alone.
It is worth adding also that decades of research on college admissions testing show that it
is far more sound (more valid and with smaller adverse impact on minorities and females)
to use test scores in this way (in what might be called a sliding scale approach so that
students with high grades may be considered with lower test scores, but students with low
grades need higher test scores to be considered for admission).
Third, documentation of widespread errors in test scoring, scaling, and reporting
in the testing industry should make clear how unwise it is to make important decisions
mechanically based on test scores in isolation (Henriques & Steinberg, May 20, 2001;
Steinberg & Henriques, May 21, 2001, Rhoades & Madaus, 2003). Indeed, in Minnesota,
one large testing company was forced into a $10 million settlement after it was shown
that hundreds of students had been wrongfully denied high school diplomas.

Education Pipeline, p. 53.
Fourth, recent research has demonstrated conclusively that “low-tech” tests like
those being used in all the states (that is, paper-and-pencil tests in which students answer
multiple-choice questions or write answers on paper long hand) seriously underestimate
the skills of students used to writing with computers (Haney & Russell, 2000; Russell &
Plati, 2001). A number of states are beginning to experiment with ways of administering
tests via computer, but it will be a long time before 21st century testing (e.g. allowing use
of keyboards rather than just long-hand composition, and rapid feedback of results)
becomes available in most schools. And in any case, the aims of education in our society
extend way beyond what can be measured via computer, much less via paper and pencil.
Finally, however, it is clear that when the same fallible technology (and all
bureaucratic accountability systems and high stakes testing systems are such fallible
technologies, Madaus, 1990), is used to make decisions about children and social
institutions, the latter will always be in a better position to protect their interests than the
former. For example, when schools are under intense pressure to increase test score
averages, and are not given the resources or tools for doing so in an educationally sound
manner, the easiest way to make test pass rates (or score averages) appear to increase in
the grade at which high stakes tests are administered is to exclude “low achieving”
students from being tested. One way to exclude them, at least temporarily, is to flunk
them to repeat the grade before the grade tested. Another is to push students out of
school altogether.
There is ample historical evidence of this phenomenon. In the payment by results
era of school accountability in the Britain the latter part of the 19th century, when grants
to schools were based on examination results, weaker pupils were often kept back or told

Education Pipeline, p. 54.
to stay away from school on the exam date (Rapple, 1994). And when Ireland used a
primary school leaving exam during the mid-20th century and schools’ reputations were
strongly influenced by student pass rates, teachers would flunk students at higher rates in
the grades before the high stakes exam grade (Madaus & Greaney, 1985).
So as the stakes of test results for schools in the U.S. increased during the 1990s,
it is not surprising, though regrettable, that such practices of student exclusion have
reappeared, but often in ways so that excluded students are not counted as dropouts. , As
dismaying as it may be to believe, there is now evidence of such practices from three
different states (Texas, Alabama and New York).
In Texas, it is now clear that some school officials have been actively pushing
students out of school, but using contrivances so that such students are not officially be
counted as drop outs (see Bainbridge, April 16, 2003, for example, or the sad story of
Crystal Gonzalez, Associated Press, September 10, 2003, or even more recently, the
expose of fraud in reporting on dropouts in the Houston Public schools broadcast on 60
Minutes II January 6, 2004).10
From Alabama comes the troubling story of Steve Orel and the “Birmingham
500.” Orel was a teacher in an adult education program in Birmingham, Alabama, in the
spring of 2000 when he discovered that many “low-achieving” students (that is, students
who had scored low on the Stanford Achievement Test, 9th Edition or SAT-9) had been
had been administratively dismissed from the Birmingham Public Schools, ostensibly
because of “lack of interest.” Upon investigation, Orel learned that a total of 522
students had been pushed out of school in this manner in an effort to make school test
10 A transcript of the 60 Minutes II broadcast “Texas miracle” is available at
http://www.cbsnews.com/sections/60II/main3475.shtml. Last retrieved January 11, 2004.

Education Pipeline, p. 55.
results look better. Six Birmingham high schools had been placed on “academic alert
status,” and were thereby threatened with takeover by the state if SAT-9 score averages
did not improve (Orel, 2003). Because of his efforts to bring the “push-out” policy to
public attention and to end it, Orel was fired from his public school teaching job, but with
support from a local charity went on to help organize an adult education program for the
students pushed out of Birmingham public high schools.
And from New York, a recent report from Advocates for Children (Gotbaum,
2002) documents the fact that tens of thousands of students are being “discharged” from
New York city high schools, but in ways so that they are not counted as dropouts.
According to the report, “school officials are encouraging students to leave regular high
school programs even though they are of school age or have a right to receive appropriate
literacy, support, and educational services through the public school system” (Gotbaum,
2002, p. 2). In 2001, according to Gotbaum, thirty-one New York City high schools
“discharged” more students than they graduated. The number of students discharged was
more than triple the number officially counted as dropouts. The real number of dropouts
may be masked, according to the report, by counting discharged students as transferring
to GED preparation program students. In such cases students were not counted as
dropouts.
Education Pipeline, p. 56.
VIII Conclusion
Our analysis of the enrollment data concerning the U.S. public school pipeline
over the last 30 years has been based on a simple proposition. It is that in the absence of
reliable data on dropouts and rates of student retention in grade (the latter is not available
at all for most states over the last 30 years), one reasonable way of studying what has
been happening to flows of students through public schools in the U.S. over the last three
decades is to analyze annual enrollments by grade, both for public schools nationally and
for public schools in all fifty states. Most of our analyses focused on the simple question
of how student enrollment in one grade in one year compares with enrollment in the
previous grade the previous year. When considering high school graduation rates we also
examined numbers of regular high school graduates in particular years compared with
numbers enrolled in grade 9 three and a half years previously and with numbers enrolled
in grade 8 four and a half years previously. Such cohort progression rates, especially
when considered over longer periods of time, may be affected not just by rates at which
students are promoted or not promoted from grade to grade but also by other factors.
Hence in part VI we digressed to discuss how mortality, migration, private school
enrollments and homeschooling might affect cohort progression rates. In sum, what we
found was that these factors do not affect rates much at the national level, but that
migration may affect rates somewhat for a few states.
Before summarizing and discussing our substantive findings, we pause to address
an alternative to the sorts of cohort progression analyses presented here that has
sometimes been advanced as necessary before accurate state graduation rates can be
calculated. It has sometimes been argued that states will not be able to calculate accurate

Education Pipeline, p. 57.
graduation rates until they develop longitudinal data bases that track individual students
over their entire K-12 educational careers – or at least grade 8 through 12. We have
substantial experience with such longitudinal databases, collectively going back more
than half a century. Repeatedly we have seen that even with ample funding and vast
computer power, it is extremely difficult for even trained researchers, backed up with
numerous field workers, to track large numbers of children over periods of more than
four or five years. Thus, with no disparagement toward the staffs of state education
agencies intended, we seriously doubt that anytime in the foreseeable future will all 50
state education agencies have the capacity to track children through their grade 8 to 12
educational careers (and certainly not for at least for five years, since many SEAs do not
now have even the rudiments of such longitudinal tracking systems in place). And for
anyone who doubts this judgement, consider this. In Table 6 above we showed that net
migration of the school aged population (both domestic and foreign) for the 50 states over
just a five year period (as judged from results of Census 2000) ranged from a low of
–5.3% for Hawaii to a high of +14.6% for Nevada. This means that at least for some
states, even if every state did have a fully functioning system for tracking all current
grade 8 and grade 9 students right now, we would not be able to get high school
graduation rates four or five years hence accurate within plus or minus 5 to 10% unless
we had an integrated tracking system across all 50 states. Putting aside the matter of
desirability, the prospects for such a national system for tracking all children across the
50 states and the 90,000 public and 27,000 private schools (not to mention home schools
and death) seem extremely remote. Hence the argument that states will not be able to
calculate accurate graduation rates until they have in place longitudinal databases for

Education Pipeline, p. 58.
tracking students across their high school careers rates seems to us a real red herring (or
maybe even a scarlet mackerel).
The main substantive findings from our analyses of state and national grade
enrollment and graduation data over the last 30 years are four. The somewhat old, good
news, recounted in part II, is that kindergarten attendance in the U.S. increased rapidly
over the last three decades, from only around 60% in 1965 to about 90% by 2000.
Analyses of state level enrollment data indicate that five states have made dramatic
progress in boosting rates of kindergarten attendance over the last 15 years, namely
Mississippi, Oregon, Vermont, South Carolina, and Texas. The state with the lowest rate
of kindergarten attendance is New Hampshire, which as late as the end of the century still
had less than 60% of children starting school in kindergarten. In discussing causes and
consequences of changes in the education pipeline in part VII we found further good
news in that historically the increases in percentages of students starting school in
kindergarten is associated with decreases in students being flunked to repeat grade 1
(though, as noted the latter may also be due to other factors.)
The other three major findings from our analyses may be summarized, in contrast
to the first finding, as less old, and far less good: Over the last 30 years the public high
school education pipeline in the U.S. has been constricted in three respects. As recounted
in part IV of this report, the rate at which students disappear between grade 10 one year
and grade 9 the previous year has tripled over the last 30 years from less than 4% to
nearly12%. States with the worst attrition between grade 9 in 1999-00 and grade 10 in
2000-01 (as listed in Table 2) are Florida, South Carolina, Georgia, Texas, Nevada, North
Carolina, Louisiana, Hawaii (perhaps in part due to out-migration of school age children),
Education Pipeline, p. 59.
Alabama, Mississippi, New York, and Tennessee – all with attrition rates of about 14%
or more.
Further evidence of constriction in the high school pipeline is that there has been
an increasing bulge of students in grade 9, as recounted in part V of this report.
Nationally, during the 1970s there were only about 4% more students in grade 9, than in
grade 8 the previous year. However by the late 1990s there were more than 12% more
students nationally in grade 9 than in grade 8 the previous year. Bulges in grade 9
enrollments in 2000-01, as compared with grade 8 enrollments the previous year were
particularly severe in Florida (32%), South Carolina (24%), Nevada (24%, though in this
instance, this finding may be partially due to in-migration of school age children), New
York (21%), Hawaii (21%), Kentucky (20% and Texas (20%). Other states with grade 9
bulges as of 2000-01 of between 10% and 19% are listed in Table 3.
This combination of an increasing bulge of students in grade 9 relative to grade 8
the previous year is clear evidence that there has been a sharp increase nationally over the
last 20 years in the percentage of students who are being flunked to repeat grade 9. Since
being flunked to repeat a grade is a strong predictor of students dropping out of school
prior to graduation, it is hence not surprising that, as discussed in part VI, high school
graduation rates have been falling nationally, especially in the last 10 years or so. As of
2000-01, the national graduation rate stood at about 75% if calculated on the basis of
numbers of graduates compared with enrollments in grade 8 four and a half years earlier,
and at only about 67% if calculated on the basis of numbers of graduates compared with
enrollments in grade 9 three and a half years earlier. Either result is, of course,
appallingly short of the national education goal of a graduation rate of 90%.

Education Pipeline, p. 60.
In part VII of the report we discussed some of the apparent causes and
consequences of these changes in the education pipeline in the U.S. over the last 30 years.
Regarding the constriction in the high school pipeline, we noted that increases in attrition
between grades 9 and 10 have been associated with the minimum competency testing
movement in the 1970s, the academic standards movement in the 1980s, and so-called
standards-based reform and high stakes testing in the 1990s. In the closing portions of
part VII we summarized our reservations about high stakes testing.
In closing, we should acknowledge that in recent years there has been
considerable debate about the merits of high stakes testing. We do not try to review that
debate here (though our position on the matter should by now be clear). Rather what we
wish to emphasize is that whatever has been causing the constriction in the high school
pipeline – the increasing rate at which students are being flunked to repeat grade 9 and
the falling rate at which students are graduating from high school – this development
should be viewed as a real national emergency. When students are squeezed out of the
high school pipeline and do not even graduate from high school, this has dire
consequences not just for these young people but for society as a whole. The reason we
say this is that recent research shows that there is an increasingly strong link between
people’s failing to graduate from high school and their ending up in prison.
A recent report from the Bureau of Justice Statistics reports, for example,. “About
41% of inmates in the nation’s State and Federal prisons and local jails in 1997 and 31%
of probationers had not completed high school or its equivalent. In comparison, 18% of
the general population age 18 or older had not finished the 12th grade” (Harlow, 2003, p.
1). In other words, failure to graduate from high school (or its equivalent) appears to

Education Pipeline, p. 61.
double the likelihood of being imprisoned. Moreover, if we discount high school
equivalency degree recipients11 and consider only those who actually graduate from high
school, 68% of state prison inmates (and 59% federal and 62% of local prisoners) did not
graduate from high school (Harlow, 2003, p. 1). This suggests that failure to graduate
from high school is associated with a tripling of likelihood of being imprisoned.
Moreover, less educated inmates are more likely than the more educated to be recidivists
(Harlow, 2003, p. 10).
Pettit and Western (2002) have recently studied the likelihood of imprisonment by
race, cohort of birth, and educational background using life table techniques. This has
allowed them to estimate cumulative risks of imprisonment among black and white men
from teenage years through their early thirties. Among other things they concluded:
Incarceration rates and cumulative risks of incarceration are, on average, 6 to 8times higher for young black men compared to young whites. Levels ofimprisonment for young high school dropouts are 2 to 4 times higher than forthose who have completed high school. The likelihood of going to prison isextremely high for young black male high school dropouts. Around 60 percent ofthose born 1965–69 had served time in prison by their early thirties.. . .
These findings help sharpen the claim that shifts in criminal justice policy havedisproportionately burdened low-education minority men. There is strongevidence that the penal system is a ubiquitous presence in the lives of low-skillblack men. Still, the relative risk of black imprisonment did not significantlychange. Large black-white disparities that characterized the penal system in the1970s persisted, but did not increase in the 1990s. Instead, risks of imprisonmentare becoming more sharply drawn along the lines of education, rather than race.(Pettit & Western, 2002, p. 23)
In short, failure to graduate from high school dramatically increases the odds that
young people, especially black males, will end up in prison at least once and even more
11 Haney (2001) discusses recent evidence indicating that in terms of employment opportunities, recipients
of GED high school “equivalency” diplomas are more like high school drop outs than like high school
graduates.

Education Pipeline, p. 62.
than once. Hence in closing we simply observe that it is far less costly to keep young
people in schools than in prisons – and not incidentally, much better for them.

Education Pipeline, p. 63.
References
Ayres, Lenoard P. (1909). Laggards in our schools: A study of retardation and
elimination in city school systems NY: Charities Publication Committee.
Associated Press, September 10, 2003. Are Texas schools nudging out low performingstudents?http://www.khou.com/news/local/education/stories/khou030905_mh_dropouts.77b521f2.html. Retrieved September 16, 2003.
Bainbridge, W. L. (2003) Texas model for school achievement doesn't hold up.Columbus Dispatch. April 16, 2003.
Balfanz, R. & Letgers, N. (2001). How many central city high schools have a severdropout problem, where are they located and who attends them? Paper presented atthe “Dropout Research: Accurate Counts and Positive Interventions” ConferenceSponsored by Achieve and the Harvard Civil Rights Project, January 13, 2001,Cambridge MA.
Bielick, Stacey, Kathryn Chandler and Stephen P. Broughman. 2001. Homeschooling inthe United States: 1999. (NCES 2001-033) Washington, DC: National Center forEducation Statistics.
Bauman, K. J. (2002, May 16). Home schooling in the United States: Trends andCharacteristics. Education Policy Analysis Archives, 10(26). Retrieved November12, 2003 from http://epaa.asu.edu/epaa/v10n26.html.
Gotbaum, B. (2002, November 21). Pushing out at-risk students: An analysis of highschool discharge figures. (Report by the Public Advocate for the City of New Yorkand Advocates for Children). New York: Advocates for Children.(http://www.advocatesforchildren.org/ Accessed April 5, 2003).
Greene, J. P. & Forster, G. (2003, September 17). Public high school graduation andcollege readiness rates in the United States. (Working paper No. 3). New York,New York: The Manhattan Institute. (http://www.manhattan-institute.org/ewp_03_embargoed.pdf, accessed 9/15/2003)
Haney, W. (2000).The myth of the Texas miracle in education. Education Policy Analysis
Archives Volume 8 Number 41, August 19, 2000. Published on the WWW at:http://epaa.asu.edu/epaa/v8n41/. (A printed version of this monograph isdistributed by the Harvard Education Publishing group.)

Education Pipeline, p. 64.
Haney, W. (2001). Revisiting the Myth of the Texas Miracle in Education: Lessons aboutDropout Research and Dropout Prevention. paper prepared for the “DropoutResearch: Accurate Counts and Positive Interventions” Conference Sponsored byAchieve and the Harvard Civil Rights Project, January 13, 2001, Cambridge MA.(Available at:http://www.civilrightsproject.harvard.edu/research/dropouts/call_dropoutpapers.php
Haney, W. & Madaus, G. (1978). Making sense of the minimum competency testingmovement. Harvard Educational Review, 48:4, 462-484.
Harlow, C. W. (2003, January, revised 4/15/03). Education and correctionalpopulations. Bureau of Justice Statistics Special report. Washington, D.C.: U.SDepartment of Justice Statistics, Office of Justice Programs.
Hartocallis, A. (June 30, 2001). Math test needed for high school graduation hadconfusing errors, State officials say. New York Times, p. B2.
Henke, R. Kaufman, P. & Broughman. (2000). Issues related to estimating the home-schooled population in the United States with household survey data. . (NCES2000-311) Washington, DC: National Center for Education Statistics.
Henriques, D. & Steinberg, J. (May 20, 2001). Right answer, wrong score: Test flawstake toll, New York Times, p. 1. Available athttp://www.nytimes.com/2001/05/20/business/20EXAM.html.
Heubert, J. & Hauser, R. (Eds.) (1999). High Stakes: Testing for Tracking, Promotion,and Graduation. A Report of the National Research Council, Washington, D.C.:National Academy Press.
Home School Legal Defense Association. http://www.hslda.org/research/faq.asp#1,accessed November 14, 2003.
Jackson, G. (1975). The research evidence on the effects of grade retention. Review of
Educational Research, 45-4, 613-635.
Kreitzer, A., Madaus, G., & Haney, W. (1989). Competency testing and dropouts. InWeis, L. & Petrie, H. (Eds). Dropouts from school: Issues, dilemmas and solutions.(Albany, NY: State university of New York Press), pp. 129-152
Madaus, G (1990) Testing as a social technology. Boisi Lecture in Education and PublicPolicy, December 6, 1990. Chestnut Hill, MA: Boston College.
Madaus, G. and Greaney, V. (1985). The Irish experience in competency testing.American Journal of Education, 93:2, 268-294.
National Commission on Excellence in Education. (1983a). A nation at risk. Washington,DC: U.S. Government Printing Office.

Education Pipeline, p. 65.
National Commission on Excellence in Education. (1983b). Meeting the Challenge:Recent efforts to improve education across the nation. Washington, DC: U.S.Government Printing Office.
Orel, Steve (2003). Left behind in Birmingham: 522 pushed out students. In Lent, R. C.and Pipkin, G. Silent no more: Voices of courage in American schools.(Portsmouth, NH: Heinemann) pp. 1-14.
Pettit, B. & Western, B. (2002). Inequality in lifetime risks of imprisonment. RetrievedJanuary 28, 2003, from http://www.princeton.edu/~wstern
Rapple, B. (1994). Payment by results: An example of assessment in elementaryeducation from nineteenth century Britain. Education Policy Analysis Archives, 2:1
http://epaa.asu.edu/epaa/v2n1, Retrieved September 21, 2003.
Rhoades, K., & Madaus, G. (2003, May). Errors in standardized tests: A systemic
problem. (Report of the National Board on Educational Testing and Public Policy.)Chestnut Hill, MA: Boston College Center for the Study of Testing,http://www.bc.edu/research/nbetpp/reports.html#monographs
Rudner, L. (1999). Scholastic Achievement and Demographic Characteristics of HomeSchool Students in 1998. Education Policy Analysis Archives, 10(26). RetrievedNovember 12, 2003 from http://epaa.asu.edu/epaa/v10n26.html.
Russell, M. & Haney (2000). Bridging the gap between technology and testing.Education Policy Analysis Archives Volume 8 Number 41, March 28, 2000.Available on the WWW at: http://epaa.asu.edu/epaa/v8n41/
Russell, M. & Plati, T. (2001). Effects of Computer Versus Paper Administration of aState-Mandated Writing Assessment. Teachers College Record On-line. Availableat http://www.tcrecord.org/Content.asp?ContentID=10709.
Shepard, L. (2002). The contest between large-scale accountability testing andassessment in the service of learning. Paper prepared for the Spencer Foundation’s30th Anniversary Conference, “traditions of Scholarship in Education,” Chicago,January 24-25, 2002.
Shepard, L. A. & Smith, M.L. (1989). Flunking grades: Research ad policies on
retention. New York: Falmer Press.
Swanson, Christopher B. and Duncan Chaplin. 2003. "Counting High School Graduateswhen Graduates Count: Measuring Graduation Rates under the High Stakes ofNCLB." (February 25, 2003 Version) Washington, D.C.: Education PolicyCenter, The Urban Institute.
Warren, J. R. (2003, August). State-level high school graduation rates in the 1990s:Concepts, measures and trends. Paper prepared for presentation at the annualmeetings of the American Sociological Association, Atlanta, August 2003.

Education Pipeline, p. 66.
Wheelock, A., Bebell, D., & Haney W. (2000). What can student drawings tell us abouthigh-stakes testing in Massachusetts (November 2000). TCRecord.org (TeachersCollege Record On-line). http://www.tcrecord.org/Content.asp?ContentID=10634
Wright, J (Ed.) (2002). The New York Times Almanac. New York: Penguin.

Education Pipeline, p. 67.
Appendix
As described in part II of this report, the grade level enrollment data used were
from the Digest of Education Statistics (DES), a yearly report issued by the National
Center on Education Statistics, and the Common Core of Data (CCD), a federal
repository of education statistics available on-line at http://nces.ed.gov/ccd. The annual
publication of the Digest of Education Statistics dates back to 1962 and is considered the
“gold standard” for statistical information about American education from pre-
kindergarten through graduate school. For example, the Digest of Education Statistics
2002 reports enrollment data for the 1998,1999 and 2000 academic years and provides
enrollment estimates for 2001 (US DOE, 2003, p.51). Considering the time-lag in the
years for which data are available in the DES relative to the publication date, use of data
available electronically from the CCD is becoming more common.
The Common Core of Data is a comprehensive database that includes information
on schools, school districts, students, staff and expenditures for public elementary and
secondary education in the United States. The CCD State Non-fiscal Public
Elementary/Secondary Education Survey Data file has been compiled annually from
1986 to the present; and included data for the 2001-02 academic year. This CCD file
contains membership counts by grade and counts of high school completers, which is also
disaggregated by race/ethnicity and is available for most states beginning with the 1992
data files. It is possible to use CCD and DES in combination to obtain the most recent
statistical information; however, this requires that the data from these two sources are
comparable.

Education Pipeline, p. 68.
During the course of the data collection process and rteview, and thanks in part to
a suggestion from Rob Warren at the University of Minnesota, we realized that there
were discrepancies between the state grade level enrollment data reported in the DES and
in the CCD. We compared grade level enrollment data from more recently published
DES sources with CCD data contained in the State Non-fiscal Public
Elementary/Secondary Education Survey Data files for the years 1986-2000. Of the
approximate 10,000 comparisons there were seven discrepancies, most of which were
small – differences of 1%. However, there was one discrepancy in excess of a 10 %
difference between the DES and CCD sources. This large discrepancy was found for the
reported graduates in CA for the 1996-97 academic year. Table 1 presents the
discrepancies we found between the DES and CCD sources.
Table 1. Discrepancies in Enrollment and Numbers of Graduates Reported by the Digestof Education Statistics and the Common Core of Data, 1986-2000
State AcademicYear
Data CCDData
CCDYear (fileversion)
DESData
DES year, table
CA 1996-97 Graduates 311,818 1997(v.1b)
269,071 2000, T102
IN 1992-93 Graduates 56,982 1993(v.1b)
57,559 1997, T100
NY 1997-98 Graduates 139,529 1998(v. 1b)
138,531 2001, T104
PA 1987-88 Grade 12enrollment
130,812 1987(v.1b)
130,830 1990, T39
TX 1992-93 Graduates 162,270 1993(v.1b)
160,546 1997, T100
VT 1992-93 Graduates 5,697 1993(v.1b)
5,215 1997, T100
WY 1992-93 Graduates 5,953 1993(v.1b)
6,174 1997, T100
The discrepancies presented in Table 1 were brought to the attention of several
individuals at the National Center for Education Statistics (NCES). Personal

Education Pipeline, p. 69.
communications indicated small differences might possibly be attributed to rounding
error while the larger discrepancies may be the result of updated information that
appeared in the DES but had not yet been updated in the CCD files. Where differences
between the two data sources were found, we decided to use the figure reported in the
Digest of Education Statistics. This decision rule is similar to guidelines employed by
staff at NCES (personnel communication with Lee Hoffman, October 3, 2003). We
describe these differences to document our data as thoroughly as possible and to alert
those who rely on these sources of these minor discrepancies. We note that the
differences between the DES and CCD sources are few and small; and do not affect
broad trends across the national and state enrollment patterns for 1968-69 to 2000-01 and
1984-85 to 2000-01 respectively.
In addition to documenting data sources for graduates and grade level enrollment
we also note a change in definition or reporting classification implemented by the
Common Core of Data project. As illustrated in the previous table most of the differences
between the DES and CCD data involved the number of reported graduates. Since the
inception of the CCD in 1986, there has been a change in the reporting strategy with
regard to high school completers. Up to CCD 1996, four categories of high school
completers were reported in the CCD state non-fiscal data files12: regular high school
diploma completers (REGDIP), other diploma recipients (OTHDIP)13, high school
equivalency recipients (EQUIV) and other high school completers (OTHCOM).
12 This is based on state excel files downloaded from http://www.nces.ed.gov/ccd/stnfis.asp, the layout of
the text (.txt) files are slightly different.13 For survey year 1986, the second category is OTHPRG, which refers to completers of other programs
such as GED's adult evening school, etc. (layout file for 1986-87 st861b.dat retrieved from
http://www.nces.ed.gov/ccd/data/txt/stNfis86lay.txt)

Education Pipeline, p. 70.
According to the documentation for the state non-fiscal survey for school year 1996-97
(NCES, n/d), the definitions for the four categories are as follows:
• A Regular Diploma Recipient is a graduate of regular day school who received a
high school diploma during the previous school year or subsequent summer
school; the diploma is based upon completion of high school requirements
through traditional means.
• An Other Diploma Recipient is a student who received a diploma through other
than a regular school program during the previous school year or subsequent
summer.
• An Other High School Completer is a student who has received a certificate of
attendance or other certificate of completion in lieu of a diploma during the
previous school year and subsequent summer school.
• A High School Equivalency Recipient is an individual age 19 years or younger
who received a high school equivalency certificate during the previous school
year or subsequent summer.
Since CCD 1997, “other diploma” recipients are no longer reported separately, but are
combined with “regular diploma” recipients as one category14 (NCES, n/d). Therefore
state non-fiscal files include three categories of high school completers for the survey
years 1997 to 2001.
High school graduate/completer counts are reported in the Local Education
Agency (School District) Universe Survey Data for the survey years 1987 to 2001. For
the survey years 1987 to 1990, four categories of high school completers were reported
14 The State Nonfiscal files continue to label this new category as REGDIP although TOTDPL (used in
district files) seems to be more appropriate.
Education Pipeline, p. 71.
(REGDIP, OTHDIP, EQUIV, and OTHCOM). Starting for the survey years 1991, the
EQUIV variable is no longer reported, although it is still collected in the state Nonfiscal
survey (NCES, n/d). Since CCD 1998, only the total diploma recipients (TOTDPL) and
total other high school completers (TOTOHC) have been reported. Total diploma
recipients include “both regular and other diploma recipients, comparable to adding
REGDIP and OTHDIP from previous year’s agency file” (CCD Local Agency Record
Layout files 1998-99).
High school graduate/completer counts are not reported by the CCD at national
level (namely the 50 states plus the District of Columbia), but are available from the
Digest of Education Statistics (DES) back to school year 1968-69. The DES counts
include “graduates of regular day school programs, but exclude graduates of other
programs and persons receiving high school equivalency certificates” (US DOE, 2003, p.
128). Since the comparison of DES and CCD data at state level only identified a small
number of discrepancies for 1986-87 to 2000-01, it is reasonable to speculate that the
number of graduates reported in DES experienced the same change as in the CCD state
Nonfiscal survey. In other words, only regular diploma recipients are reported as
graduates in DES before the class of 1997, while both regular diploma and other diploma
recipients are counted as graduates in DES since the class of 1997.
Finally, we note that with this report, we also release all of the source data used
in the study reported here. The data are contained in two Microsoft Excel files titled
“State Enrollment 84-00” and “US Enrollment 68-00.” Internal to each file is
documentation on data sources. Both files are available through the following URL:
http://www.bc.edu/research/nbetpp/

Education Pipeline, p. 72.
References
National Center for Education Statistics (n.d.). Documentation for the State NonfiscalSurvey of Public Elementary and Secondary Education: School Year 1996-97(Revised).Retrieved December 2, 2003 fromhttp://www.nces.ed.gov/ccd/pdf/stNfis96genr.pdf.
United States Department of Education, National Center for Education Statistics (2003).Digest of Education Statistics 2002 (NCES 2003-060). Washington, DC: Author.