the effect of a guided enquiry based learning …
TRANSCRIPT

THE EFFECT OF A GUIDED ENQUIRY BASED LEARNING APPROACH ON MECHANICAL ENGINEERING STUDENTS’
UNDERSTANDING OF THERMODYNAMICS
by
CHRISTOFFEL LOUW
A thesis submitted in fulfilment of the requirements for the degree of
DOCTOR OF EDUCATION (D.Ed) (In Technology Education)
at
WALTER SISULU UNIVERSITY
SUPERVISOR: PROFESSOR K. J. MAMMEN
MAY 2012

ii
ABSTRACT
Personal experiences of almost 17 years as an academic in engineering education in South Africa indicate that with the current teaching methods which are in use, course outcomes as required by the South African Qualification Authority (SAQA) are not achieved in learning Thermodynamics 2 (MTHE 2). The purpose of this research was to investigate alternative methods of teaching and learning MTHE 2 which would assist to improve the students’ academic performance. The population for this research was students registered for National Diploma Mechanical Engineering and the accessible population was 40 students registered for MTHE 2 from Walter Sisulu University, Chiselhurst campus. Out of these 40 students, 20 voluntarily agreed to be the sample. The theoretical framework for this study was social constructivism. Social constructivism states that learning is an active process and the process of knowledge construction occurs in a socio-cultural context where the student and environment actively interact. The student involves himself/herself and does neither remain nor be allowed to remain just as a passive observer. This was an action research where students were exposed to Guided Enquiry Based Learning (GEBL) in groups. From a social constructivists approach to learning, GEBL was used to engage students in social groups during the teaching-learning process with specific focus on selected academic discipline. All ethical considerations applicable to a study of the present nature were adhered to and in addition, signed informed consent forms were obtained from participants prior to the study. Students were given an introduction to the concepts and principles as per the pre-set syllabus for MTHE 2 and this was followed by problem solving sessions in which they were divided into four groups of five students each. The students were given a guided enquiry- and work-based example with an additional list of questions on each module of the syllabus. They had to select the most relevant questions from the list to analyse and develop a solution for each problem. The lecturers’ role was that of a facilitator who assisted each group with problems which the group encountered. This approach engaged students more actively in the learning process and placed more responsibility on them for their own progress in learning. This process also created an atmosphere for interaction with peers and assisted them to develop interpersonal and group communication skills. Key performance indicators were developed to measure the extent to which these outcomes were achieved. The researcher made use of an instrument structured in terms of Likert-type scale in order to objectively assess the extent of achievement. Data collected from the pilot study done in 2009 indicated that GEBL improved the students’ understanding of course content and problem analysis. Quantitative data were collected by means of standard assessment i.e. semester tests, an oral test, final examination and a KPI instrument. The KPIs were formulated to measure the extent to which the outcomes for MTHE 2 had been achieved. Qualitative data were collected through 30-minute interviews, using an open-ended interview schedule, with each member of the sample. The interviews were done by a person who qualified both as an ‘insider and outsider’ in order to minimize the risk of bias and to maintain rigour in the research. In order to qualify as an ‘insider and outsider’, one ought to be as an insider: (a) from the same ethnic group, (b) qualified in Mechanical

iii
Engineering with Thermodynamics as a major course, (c) had no power disposition e.g. a former student or a laboratory assistant (excluding staff members within the mechanical engineering department) and as an outsider, one who was not part of the GEBL process. The quantitative scores from the assessments were analysed with Predictive Analysis Software (PASW) to determine the extent to which interventions had assisted student performance. The qualitative data from the interviews were analysed with N-Vivo to reveal the impact of GEBL on student learning and understanding of MTHE 2. The results indicated that with GEBL, the students’ overall scores improved from the first assessment score of 46% written on half of the first module to the final assessment score of 55% written on all seven modules. Students could handle larger volumes of work and still obtain a higher percentage. GEBL assisted students’ in recalling factual MTHE 2 concepts, understanding of MTHE 2 concepts, principles and applications. GEBL also enhanced students’ ability to communicate procedures and processes related to MTHE 2. KPIs formulated to measure the extent to which the outcomes were met in terms of student achievement indicated a 57% achievement thereof. The KPIs developed gave a percentage achievement of the specified outcomes for MTHE 2 with GEBL. Theses KPIs can be used in future to measure the effectiveness of different teaching and learning methods in terms of achieving the outcomes. It is therefore recommended that GEBL be introduced into other engineering courses also to assist students in understanding course content and in achieving the course outcomes.

iv
DECLARATION
I, Christoffel Louw declare that the thesis entitled ‘The Effect of a Guided Enquiry Based
Learning Approach on Mechanical Engineering Students’ Understanding of
Thermodynamics’ is my own work. All sources and resources I have used or quoted
have been indicated and acknowledged by means of complete references.
___________________
(Christoffel Louw)
_________________________
PROFESSOR K. J. MAMMEN
SUPERVISOR

v
PLAGIARISM DECLARATION
1. I am aware that plagiarism is defined at Walter Sisulu University (WSU) as the
inclusion of another’s or others’ ideas, writings, works, discoveries and inventions
from any source in an assignment or research output without the due, correct
and appropriate acknowledgement to the author(s) or source(s) in breach of the
values, conventions, ethics and norms of the different professional, academic and
research disciplines and includes unacknowledged copying from intra- and
internet and peers/fellow students.
2. I have duly and appropriately acknowledged all references and conformed to
avoid plagiarism as defined by WSU.
3. I have made use of the citation and referencing style stipulated by my
lecturer/supervisor.
4. This submitted work is my own.
5. I did not and will not allow anyone to copy my work and present it as
his/hers own.
6. I am committed to uphold academic and professional integrity in the
academic/research activity.
7. I am aware of the consequences of engaging in plagiarism.
_______________ _____________ Signature Date
vi
ACKNOWLEDGEMENTS
I would like to take this opportunity to acknowledge and thank the following people
who helped me throughout my Doctoral Studies:
My supervisor, Prof K. J. Mammen, for his continuous support, for showing
confidence in my abilities, for his guidance, advice and encouragement throughout
this study,
The Management of Walter Sisulu University (WSU) for allowing me to conduct this
research,
The WSU Research Development office for the research grants,
The WSU Faculty of Education for general academic support,
The WSU Faculty of Engineering for allowing me to conduct the research within the
Mechanical Engineering Department,
All my colleagues for their encouragement, assistance and support throughout this
study,
Messrs D. Bessinger and S. Mqayi for conducting the interviews,
Mr I. Saunderson for his assistance with data analysis,
The Thermodynamics 2 students who participated in the research for showing
commitment, dedication and willingness to achieve success and for not withdrawing
from the study before it was completed,
Friends and colleagues for their moral support,
My wife and sons for their patience, understanding and support,
To everyone who helped me in one way or the other to complete this study.

vii
ACRONYMS
ABET : American Board for Engineering and Technology
BEST : Board of European Students of Technology
CBL : Case Based Learning
CHE : Council on Higher Education
EC2000 : Engineering Criteria 2000
ECSA : Engineering Council of South Africa
GEBL : Guided Enquiry Based Learning
EBL : Enquiry Based Learning
NDME : National Diploma Mechanical Engineering
PBL : Problem Based Learning
SAQA : South African Qualifications Authority
PASW : Predictive Analysis Software
MTHE 2 : Thermodynamics 2
UCL – Belgium : Universite Catholique de Louvain Belgium
WSU : Walter Sisulu University

viii
CONTENTS
ABSTRACT ................................................................................................................ ii
PLAGIARISM DECLARATION ...................................................................................... v
ACKNOWLEDGEMENTS ............................................................................................. vi
ACRONYMS............................................................................................................. vii
CONTENTS ............................................................................................................ viii
LIST OF TABLES .................................................................................................... xiv
LIST OF FIGURES ................................................................................................. xviii
CHAPTER 1 ............................................................................................................... 1
INTRODUCTION ....................................................................................................... 1
1.1 General Statement of the Problem .................................................................... 1
1.2 Background at WSU and global trends .............................................................. 3
1.2.1 NDME at WSU .............................................................................................. 3
1.2.1.1 NDME is listed as a Registered Qualification by SAQA ................................... 4
1.2.1.2 Accreditation by the Engineering Council of South Africa (ECSA) ................... 5
1.2.2 Weaknesses of the NDME at WSU .................................................................. 6
1.2.3 Teaching and Learning at WSU ...................................................................... 6
1.2.4 Global Responses to Traditional Engineering Teaching .................................... 7
1.2.5 Global Trends in Engineering Education ....................................................... 10
1.3 Aim ............................................................................................................... 13
1.4 Rationale and Problem Statement ................................................................... 13
1.5 Theoretical Framework ................................................................................... 15
1.6. Research Questions ....................................................................................... 19

ix
1.7 Objectives ..................................................................................................... 20
1.8 Significance of the Study ................................................................................ 20
1.9 Methodology.................................................................................................. 21
1.9.1 Research Subjects ...................................................................................... 21
1.9.2 Instrument and Data Collection ................................................................... 22
1.10 Limitations and Delimitations of the Study .................................................... 22
1.11 Definitions of Terms .................................................................................... 23
1.12 Organisation of the Thesis ........................................................................... 26
1.13 Summary ................................................................................................... 27
CHAPTER 2 ............................................................................................................. 29
LITERATURE REVIEW .............................................................................................. 29
2.1 Social Constructivism in Education .................................................................. 29
2.2 Active Learning .............................................................................................. 30
2.2.1 Enquiry Based Learning (EBL) and Guided Enquiry Based Learning (GEBL) .... 35
2.3 Inductive and Deductive Teaching and Learning and Learning Styles ................ 38
2.3.1 Inductive and Deductive Teaching and Learning ........................................... 38
2.3.2 A Spectrum of Learning Styles ..................................................................... 40
2.4 Effective Teaching ......................................................................................... 41
2.5 Significant Learning ....................................................................................... 43
2.6 Deep and Surface Learning ............................................................................ 45
2.6.1 Deep Learning ............................................................................................ 45
2.6.2 Surface Learning ......................................................................................... 47
2.7 Kolb’s Learning Cycle ..................................................................................... 48
2.8 Bloom’s Taxonomy (Cognitive Domain) ........................................................... 52
x
2.9 Outcomes and Key Performance Indicators ..................................................... 53
2.9.1 Outcomes ................................................................................................... 53
2.9.1.1 ECSA’s View on Outcomes ........................................................................ 54
2.9.1.2 SAQA’s View on Outcomes ....................................................................... 55
2.9.1.3 Exit Level Outcomes of National Diploma Mechanical Engineering at WSU ... 58
2.9.2 Key Performance Indicators ......................................................................... 58
2.10 Summary ................................................................................................... 61
CHAPTER 3 ............................................................................................................. 64
METHODOLOGY ...................................................................................................... 64
3.1 Action Research ............................................................................................. 64
3.1.1 Participatory Action Research ...................................................................... 65
3.2 Modes of Enquiry ........................................................................................... 67
3.2.1 Qualitative mode of enquiry ........................................................................ 67
3.2.2 Quantitative mode of enquiry ...................................................................... 68
3.3 Population and Sample ................................................................................... 69
3.3.1 Population .................................................................................................. 69
3.3.2 Sample....................................................................................................... 69
3.4 Ethical Considerations .................................................................................... 69
3.5 Instrumentation ............................................................................................. 70
3.5.1 Instrument Construction.............................................................................. 70
3.5.1.1 Formative Assessments ............................................................................ 71
3.5.1.2 Oral Assessment ...................................................................................... 72
3.5.1.3 Summative Assessment ............................................................................ 73
3.5.1.4 Structured Questionnaire.......................................................................... 73

xi
3.5.1.5 Key Performance Indicators ...................................................................... 73
3.5.1.6 Open-ended Interviews ............................................................................ 74
3.6 Pilot Study ..................................................................................................... 74
3.7 Instrument Reliability and Validity ................................................................... 75
3.7.1 Reliability ................................................................................................... 75
3.7.2 Trustworthiness (Qualitative Rigour) ............................................................ 75
3.7.3 Validity ....................................................................................................... 77
3.7.4 Triangulation .............................................................................................. 78
3.8 Insider Outsider Position to Interviews ............................................................ 79
3.9 Intervention Process ...................................................................................... 81
3.10 KPIs for this Study ...................................................................................... 85
3.11 Procedures ................................................................................................. 87
3.12 Data Analysis and Interpretation .................................................................. 88
3.13 Summary ................................................................................................... 89
CHAPTER 4 ............................................................................................................. 90
DATA ANALYSIS AND INTERPRETATION .................................................................. 90
4.1 Demographics of the Study ............................................................................ 90
4.2 Qualitative Data Analysis, Interpretation and Discussion ................................... 91
4.2.1 Addressing the First and Second Research Question ..................................... 92
4.2.2 Addressing the Third Research Question .................................................... 111
4.2.3 Summary of Qualitative Data ..................................................................... 119
4.3 Quantitative Data Analysis, Interpretation and Discussion .............................. 119
4.3.1 Addressing the First and Second Research Question ................................... 120
4.3.2 Addressing the Third Research Question .................................................... 165

xii
4.3.3 Structured Questionnaire ........................................................................... 178
4.3.4 Summary of Quantitative Data from Formative and Summative Assessments 196
4.3.5 Addressing the Fourth Research Question .................................................. 198
4.3.6 Summary of Data from KPIs for Tests 1, 1b, 2, 3, and Final Examination ..... 229
4.3.7 Summary of Data from KPIs for Oral Tests 1 and 2 ..................................... 240
4.4 Summary of Highest Scored Data ................................................................. 241
4.4.1 Theory Questions from Written Assessments .............................................. 241
4.4.2 Structured Questionnaire (see Appendix 1)................................................. 242
4.4.3 Interviews (see Appendices 2 & 13): .......................................................... 242
4.4.4 Oral Test 1 (see Appendix 7) ..................................................................... 243
4.4.5 Interviews (see Appendices 2 & 13): .......................................................... 244
4.4.6 Calculation Questions from Written Assessments ........................................ 245
4.4.7 Structured Questionnaire (see Appendix 1)................................................. 246
4.4.8 Interviews (see Appendices 2 & 13): .......................................................... 247
4.5 Summary .................................................................................................... 248
CHAPTER 5 ........................................................................................................... 250
DISCUSSION OF FINDINGS, CONCLUSION AND RECOMMENDATIONS ..................... 250
5.1 GEBLs Impact on Student Performance ......................................................... 251
5.1.1 High Scores - Written Theory Assessments ................................................. 251
5.1.2 High Scores - Written Calculation Assessments ........................................... 253
5.1.2.1 Factual Knowledge ................................................................................. 255
5.1.2.2 Conceptual Knowledge ........................................................................... 256
5.1.3 High Scores - Oral Assessments ................................................................. 257
5.2 KPI Achievement with GEBL ......................................................................... 258
xiii
5.3 Conclusion ................................................................................................... 260
5.4 Recommendations ....................................................................................... 262
5.5 Proposed Louw’s Model for Thermodynamics 2 .............................................. 264
5.6 General Model ............................................................................................. 265
5.7 Proposed Louw’s General Model for Engineering Courses ............................... 267
ACKNOWLEDGEMENTS .......................................................................................... 268
REFERENCES ........................................................................................................ 269
APPENDICES......................................................................................................... 285
Appendix 1 – Structured Questionnaire testing students experience with GEBL ......... 285
Appendix 2 – Qualitative interviews with students participating in GEBL ................... 286
Appendix 3 – Formative assessment 1 (semester test 1) ......................................... 292
Appendix 4 – Formative assessment 1b (semester test 1b) ...................................... 296
Appendix 5 – Formative assessment 2 (semester test 2) ......................................... 301
Appendix 6 – Formative assessment 3 (semester test 3) ......................................... 305
Appendix 7 – Formative assessment (oral test) ....................................................... 312
Appendix 8 – Summative assessment (final examination) ........................................ 318
Appendix 9 – KPIs for measuring achievement in outcomes with formative assessments
1, 2 and 3 ............................................................................................................ 325
Appendix 10 – KPIs for measuring achievement of outcomes of oral test 1 ............... 330
Appendix 11 – KPIs for measuring achievement of outcomes of final examination ..... 333
Appendix 12 – Louw’s Guided Enquiry Based Learning Guide for assisting students’
learning ................................................................................................................ 337
Appendix 13 – Student responses to interviews ...................................................... 440
Appendix 14 – Electronic Thesis & Dissertations (ETD) and Plagiarism Requirements 445

xiv
LIST OF TABLES
Table 2.1: Features of Common Inductive Instructional Methods (Prince & Felder,
2006, p.125) ........................................................................................................... 34
Table 2.2: Kolb’s Learning Cycle and Engineering Education Activities ...................... 50
Table 2.3: Movement through Kolb’s Learning Cycle with Teaching and Learning
Activities................................................................................................................. 51
Table 4.1: Demographic data ................................................................................ 90
Table 4.2: Quantitative Statistics on the Students’ Overall Performance in Written
Assessments ......................................................................................................... 121
Table 4.3: Quantitative Statistics on Theory Questions in Test 1 ............................ 122
Table 4.4: Quantitative Statistics from Analytical Questions in Test 1 ..................... 125
Table 4.5: Quantitative Statistics on Overall Performance in Test 1 ........................ 128
Table 4.6: Quantitative Statistics on Theory Questions in Test 1b .......................... 130
Table 4.7: Quantitative Statistics on Analytical Questions in Test 1b ...................... 133
Table 4.8: Quantitative Statistics on Overall Performance in Test 1b ...................... 136
Table 4.9: Quantitative Statistics on Theory Questions in Test 2 ............................ 139
Table 4.10: Quantitative Statistics on Analytical Questions in Test 2 ........................ 142
Table 4.11: Quantitative Statistics on Overall Performance in Test 2 ....................... 145
Table 4.12: Quantitative Statistics on Theory Questions in Test 3 ........................... 148
Table 4.13: Quantitative Statistics on Analytical Questions in Test 3 ........................ 151
Table 4.14: Quantitative Statistics on Overall Performance in Test 3 ....................... 154
Table 4.15: Quantitative Statistics from Theory Question in Final Examination ......... 156

xv
Table 4.16: Quantitative Statistics from Analytical Question in Final Examination ..... 160
Table 4.17: Quantitative Statistics from Overall Performance in Final Examination ... 163
Table 4.18: Quantitative Statistics on Reliability for Tests 1, 1b, 2, 3 and Final
Examination .... ..................................................................................................... 165
Table 4.19: Quantitative Statistics from Oral Test 1 ................................................ 166
Table 4.20: Quantitative Statistics from Oral Test 2 ................................................ 171
Table 4.21: Quantitative Statistics from Overall Performance in Oral Tests 1 and 2 .. 176
Table 4.22: Quantitative Statistics from Question 1 in Structured Questionnaire ....... 178
Table 4.23: Quantitative Statistics from Question 2 in Structured Questionnaire ....... 180
Table 4.24: Quantitative Statistics from Question 3 in Structured Questionnaire ....... 182
Table 4.25: Quantitative Statistics from Question 4 in Structured Questionnaire ....... 184
Table 4.26: Quantitative Statistics from Question 5 in Structured Questionnaire ....... 186
Table 4.27: Quantitative Statistics from Question 6 in Structured Questionnaire ....... 188
Table 4.28: Quantitative Statistics from Question 7 in Structured Questionnaire ....... 190
Table 4.29: Quantitative Statistics from Question 8 in Structured Questionnaire ....... 192
Table 4.30: Quantitative Statistics from Question 9 in Structured Questionnaire ....... 194
Table 4.31: Quantitative Statistics from KPI Analysis Measurements in Test 1 .......... 199
Table 4.32: Quantitative Statistics from KPI Analytical Measurements in Test 1 ....... 201
Table 4.33: Quantitative Statistics from KPI Performance Measurements in Test 1 ... 203
Table 4.34: Quantitative Statistics from KPI Analysis Measurements in Test 1b ........ 205
Table 4.35: Quantitative Statistics from KPI Analytical Measurements in Test 1b ...... 207
Table 4.36: Quantitative Statistics from KPI Overall Performance Measurements in Test

xvi
1b...... ................................... .............................................................................. 209
Table 4.37: Quantitative Statistics from KPI Analysis Measurement in Test 2 ........... 211
Table 4.38: Quantitative Statistics from KPI Analytical Measurements in Test 2 ....... 213
Table 4.39: Quantitative Statistics from KPI Overall Performance Measurements in Test
2.......................................................................................................................... 215
Table 4.40: Quantitative Statistics from KPI Analysis Measurements in Test 3 .......... 217
Table 4.41: Quantitative Statistics from KPI Analytical Measurements in Test 3 ....... 219
Table 4.42: Quantitative Statistics from KPI Overall Performance Measurements in Test
3................. ......................................................................................................... 221
Table 4.43: Quantitative Statistics from KPI Analysis Measurements in the Final
Examination .......................... ............................................................................... 223
Table 4.44: Quantitative Statistics from KPI Analytical Measurements in the Final
Examination ................................. ........................................................................ 225
Table 4.45: Quantitative Statistics from KPI Overall Performance Measurements in the
Final Examination .................................................................................................. 227
Table 4.46: Summary of results from KPI Measurements of Tests 1, 1b, 2, 3 and Final
Examination ........................................ ................................................................. 229
Table 4.47: Quantitative Statistics from KPI Explanation Measurements in Oral Tests 1
and 2………………………… ........................................................................................ 231
Table 4.48: Quantitative Statistics from KPI Understanding Measurements in Oral Tests
1 and 2........ ........................................................................................................ 233
Table 4.49: Quantitative Statistics from KPI Discussion Measurements in Oral Tests 1
xvii
and 2............ ....................................................................................................... 235
Table 4.50: Quantitative Statistics from KPI Overall Performance Measurements in Oral
Tests 1 and 2........................................................................................................ 237
Table 4.51: Summary of results from KPI Measurements in Oral Tests 1 and 2 ........ 239
Table 4.52: Quantitative Statistics for reliability from KPI Measurements in Oral Tests 1
and 2………………. .................................................................................................. 239

xviii
LIST OF FIGURES
Figure 1.1: Modified Zone of Proximal Development (R.G. Tharp & R. Gallimore's, 1988,
p.35)…………… ........................................................................................................ 16
Figure 2.1: Movement through Kolb’s Learning Cycle which can be enhanced by Active
Learning……… ......................................................................................................... 49
Figure 3.1: GEBL intervention flow process .............................................................. 83
Figure 4.1: Theory Question 1.3 in Test 1 reflecting a low level of Conceptual
Knowledge….. ....................................................................................................... 123
Figure 4.2: Theory Question 2.1 in Test 1 reflecting a high level of Conceptual
Knowledge….. ....................................................................................................... 124
Figure 4.3: Analytical Question 1.2 in Test 1 reflecting a low level of Factual and
Conceptual Knowledge .......................................................................................... 126
Figure 4.4: Analytical Question 1.3 in Test 1 reflecting a high level of Factual
Knowledge…… ...................................................................................................... 127
Figure 4.5: Overall Performance in Test 1 with a combined Factual and Conceptual
Knowledge achievement of 46.2% ......................................................................... 129
Figure 4.6: Theory Question 1.2 in Test 1b reflecting a high level of Conceptual
Knowledge….. ....................................................................................................... 131

xix
Figure 4.7: Theory Question 1.4 in Test 1b reflecting a low level of Conceptual
Knowledge…… ...................................................................................................... 132
Figure 4.8: Analytical Question 1.3 in Test 1b reflecting a high level of Factual and
Conceptual Knowledge .......................................................................................... 134
Figure 4.9: Analytical Question 1.4 in Test 1b reflecting a low level of Factual and
Conceptual Knowledge .......................................................................................... 135
Figure 4.10: Overall Performance in Test 1 with a combined Factual and Conceptual
Knowledge achievement of 46.2% ......................................................................... 137
Figure 4.11: Theory Question in Test 2 reflecting a low level of Conceptual
Knowledge……. ..................................................................................................... 140
Figure 4.12: Theory Question 2.3 in Test 2 reflecting a high level of Conceptual
Knowledge…….. .................................................................................................... 141
Figure 4.13: Analytical Question in Test 2 reflecting a low level of Factual and
Conceptual Knowledge .......................................................................................... 143
Figure 4.14: Analytical Question 2.4 in Test 2 reflecting a high level of Factual
Knowledge……. ..................................................................................................... 144
Figure 4.15: Overall Performance in Test 2 reflecting a combined Factual and
Conceptual Knowledge of 42.2% ........................................................................... 146
Figure 4.16: Theory Question 4.1 in Test 3 reflecting a high level of Conceptual
Knowledge….. ....................................................................................................... 149

xx
Figure 4.17: Theory Question 4.5 in Test 3 reflecting a low level of Conceptual
Knowledge…… ...................................................................................................... 150
Figure 4.18: Analytical Question 1.4 in Test 3 reflecting a low level of Factual and
Conceptual Knowledge .......................................................................................... 152
Figure 4.19: Analytical Question 3.3 in Test 3 reflecting a high level of Factual
Knowledge……. ..................................................................................................... 153
Figure 4.20: Overall Performance in Test 3 reflecting a combined Factual and
Conceptual Knowledge 43.74%.............................................................................. 155
Figure 4.21: Theory Question 7 in the Final Examination reflecting a high level of
Conceptual Knowledge .......................................................................................... 157
Figure 4.22: Theory Question 9 from the Final Examination reflecting a low level of
Conceptual Knowledge .......................................................................................... 158
Figure 4.23: Analytical Question 4 in the Final Examination reflecting a low level of
Factual and Conceptual Knowledge ........................................................................ 161
Figure 4.24: Analytical Question 5 in the Final Examination reflecting a high level of
Factual and Conceptual Knowledge ........................................................................ 162
Figure 4.25: Overall Performance in the Final Examination reflecting a combined
Factual and Conceptual Knowledge achievement of 51.16% .................................... 164
Figure 4.26: Question 7 in Oral Test 1 reflecting a high level of Conceptual
Knowledge…… ...................................................................................................... 167

xxi
Figure 4.27: Question 11 in Oral Test 1 reflecting a high level of Conceptual
Knowledge……. ..................................................................................................... 168
Figure 4.28: Question 34 in Oral Test 1 reflecting a low level of Conceptual
Knowledge…… ...................................................................................................... 169
Figure 4.29: Question 3 in Oral Test 2 reflecting a high level of Conceptual
Knowledge……… ................................................................................................... 172
Figure 4.30: Question 13 in Oral Test 2 reflecting a low level of Conceptual
Knowledge……. ..................................................................................................... 173
Figure 4.31: Question 37 in Oral Test 2 reflecting a low level of Conceptual
Knowledge………. .................................................................................................. 174
Figure 4.32: Question 44 in Oral Test 2 reflecting a low level of Conceptual
Knowledge………. .................................................................................................. 175
Figure 4.33: Overall Performance in Oral Tests 1 and 2 reflecting a Conceptual
Knowledge level 58.47% ....................................................................................... 177
Figure 4.34: Question 1 from the Structured Questionnaire reflecting 67% of students
‘strongly agree’ ..................................................................................................... 179
Figure 4.35: Question 2 from the Structured Questionnaire reflecting 73% of students
‘strongly agree’ ..................................................................................................... 181
Figure 4.36: Question 3 from the Structured Questionnaire reflecting 33% of students
‘strongly agree’ and 27% ‘agree’ ............................................................................ 183

xxii
Figure 4.37: Question 4 from the Structured Questionnaire reflecting 67% of the
students ‘strongly agree’ ....................................................................................... 185
Figure 4.38: Question 5 from the Structured Questionnaire reflecting 27% of the
students ‘strongly agree’ and 67% ‘agree’ .............................................................. 187
Figure 4.39: Question 6 from the Structured Questionnaire reflecting 60% of the
students ‘strongly agree’ ....................................................................................... 189
Figure 4.40: Question 7 from the Structured Questionnaire reflecting 27% of the
students ‘strongly agree and 60% ‘agree’ ............................................................... 191
Figure 4.41: Question 8 from the Structured Questionnaire reflecting 40% of the
students ‘strongly agree’ and 47% ‘agree’ .............................................................. 193
Figure 4.42: Question 9 from the Structured Questionnaire reflecting 60% of the
students ‘strongly agree’ and 33% ‘agree’ .............................................................. 195
Figure 4.43: Students Analytical Performance with an increased workload and with
GEBL introduced after Second Assessment ............................................................. 197
Figure 4.45: Students Analysis Performance with an increased workload and with GEBL
introduced after Second Assessment ...................................................................... 198
Figure 4.46: Analysis Measurements with KPIs in Test 1 ......................................... 200
Figure 4.47: Analytical Measurements with KPIs in Test 1 ...................................... 202
Figure 4.48: Overall Performance Measurements with KPIs in Test 1 ....................... 204
Figure 4.49: Analysis Measurements with KPIs in Test 1b ....................................... 206

xxiii
Figure 4.50: Analytical Measurements with KPIs in Test 1b ..................................... 208
Figure 4.51: Overall Performance Measurements with KPIs in Test 1b ..................... 210
Figure 4.52: Analysis Measurements with KPIs in Test 2 ......................................... 212
Figure 4.53: Analytical Measurements with KPIs in Test 2 ...................................... 214
Figure 4.54: Overall Performance Measurements with KPIs in Test 2 ....................... 216
Figure 4.55: Analysis Measurements with KPIs in Test 3 ......................................... 218
Figure 4.56: Analytical Measurements with KPIs in Test 3 ...................................... 220
Figure 4.57: Overall Performance Measurements with KPIs in Test 3 ....................... 222
Figure 4.58: Analysis Measurements with KPIs in the Final Examination .................. 224
Figure 4.59: Analytical Measurements with KPIs in the Final Examination ................ 226
Figure 4.60: Overall Performance Measurements with KPIs in the Final Examination.228
Figure 4.61: Overall KPI Achievement with an increased workload, with GEBL being
introduced after the Second Assessment ................................................................ 230
Figure 4.62: Explanation Measurements with KPIs in Oral Tests 1 and 2 ................. 232
Figure 4.63: Understanding Measurements with KPIs in Oral Tests 1 and 2 ............. 234
Figure 4.64: Discussion Measurements with KPIs in Oral Tests 1 and 2 ................... 236
Figure 4.65: Overall Performance Measurements with KPIs in Oral Tests 1 and 2 ..... 238

1
CHAPTER 1
INTRODUCTION
This chapter gives a background to this study and explains the current situation of
mechanical engineering education at Walter Sisulu University (WSU).
1.1 General Statement of the Problem
Personal experiences of almost 17 years as an academic in engineering education in
South Africa (SA) indicates that with the current teaching methods, course outcomes as
required by the South African Qualification Authority (SAQA) are not achieved in
learning Thermodynamics 2 (MTHE 2). Reports from various employers indicated that
students lack important skills required in the engineering field. The purpose of this
research was to investigate alternative methods of teaching and learning MTHE 2 which
might assist learning and improve academic performance.
The challenges contributing to engineering students’ poor performance are not unique
to SA. For example, the observations depicting experiences from India, the United
States of America and Ireland vividly indicate the challenges which engineering
education faces globally. The Indian Express newspaper reported that a large number
of engineering students from all 60 colleges across one of the states in India have failed
their examinations as declared on 27th February 2009 (Indian express.com, 2009, p.1).

2
This newspaper further reported that “250 candidates of a college who appeared for the
semester examination, 209 have failed in a paper” (Indian express.com, 2009, p.1).
Worldwide, institutions are investigating alternative methods of teaching engineering
students in order to improve their performance. According to Nicklow, Kowalchuk,
Gupta, Tezcan and Mathias (2009, p.1), an innovative programme was developed to “...
improve the overall graduation rate of engineering students from 37% to 67% over a
five-year period at the College of Engineering, Southern Illinois University, Carbondale,
(SIUC)”. Tully and Clarke (2008, p.3) state that “... graduation rates are often less than
40%” in the Dublin Institute of Technology (DIT) in Ireland.
The University of Massachusetts, Dartmouth, developed a completely new first year
programme to improve first year engineering education (Pendergrass, Kowalczyk,
Dowd, Laoulache, Nelles, Golen & Fowler, 1999, p.13c2-9). A research conducted on
Active Learning in Transportation Engineering and submitted to the Worcester
Polytechnic Institute indicated that active learning did have a positive impact on student
performance as measured by exam scores (Weir, 2004, p.2).
In SA the situation is not dissimilar and research has continuously been done to address
the challenges. In the Council on Higher Education’s (CHE, 2007, pp.25-26) annual
report it was stated that only 32% of first time entering students at ‘Traditional
Universities’ complete their engineering B-degree in four years and only 5% of first time
entering students at ‘Comprehensive Universities’ complete their engineering Diploma in

3
three years. Many of the engineering students are therefore not performing expected
and various factors might be contributing to this such as students’ attitudes towards
their studies and their background knowledge in the particular course as well as clashes
between lecturers’ teaching styles and students’ learning styles. This study investigated
teaching and learning factors and possible alternative innovations to address some of
the challenges.
1.2 Background at WSU and global trends
This section gives an overview of the National Diploma Mechanical Engineering (NDME)
at WSU in terms of its structure, accreditation, weaknesses, method of offering as well
as global responses to traditional teaching in engineering and global trends in
engineering education.
1.2.1 NDME at WSU
This study was carried out at WSU which is a public university in the Eastern Cape of
SA. The NDME offered at WSU is a three year full-time programme. Level one of the
diploma consists of two semester programmes (S1 and S2) each consisting of six
courses. Level two of the diploma is a semester programme (S3) consisting of six
courses and a six months Mechanical Engineering Practice 1 (MEEP 1). The final year of
the diploma is a semester programme (S4) consisting of six course and a six month
Mechanical Engineering Practice 2 (MEEP 2). The total number of courses required for

4
the theory part of the diploma is 24. Each course has a credit value of 0.083. Each of
MEEP 1 and MEEP 2 carry a credit value of 0.5 which gives a total credit of ‘3’ for the
diploma (WSU Faculty Prospectus, 2010, pp.119-120).
1.2.1.1 NDME is listed as a Registered Qualification by SAQA
NDME offered by WSU is listed by SAQA as a registered qualification. According to
SAQA (2009, p.1):
SAQA must develop and implement policy and criteria, after consultation
with the Quality Councils (QCs) for the development, registration and
publication of qualifications and part-qualifications, which must include the
following requirements:
- The relevant sub-framework must be identified on any document
relating to the registration and publication of a qualification or part-
qualification;
- Each sub-framework must have a distinct nomenclature for its
qualification types which is appropriate to the relevant sub-framework
and consistent with international practice.
SAQA must register a qualification or part-qualification recommended by a
QC if it meets the relevant criteria;
SAQA must develop policy and criteria, after consultation with the QCs, for
assessment, recognition of prior learning and credit accumulation and

5
transfer.
1.2.1.2 Accreditation by the Engineering Council of South Africa (ECSA)
The Engineering Council of South Africa (ECSA) is a professional statutory body that
visits tertiary institutions on a four year cycle to inspect the credibility of the
engineering programmes. The NDME at WSU is fully accredited by ECSA.
Recognition of National Diploma Programmes Accredited by ECSA via Dublin Accord
(2010, p.1) states:
This type of programme is a three-year programme, including two years of
academic study and one year of experiential training.
Engineering programmes listed in document E-20-PN have been accredited by
ECSA and are recognised as meeting the initial academic requirements for
registration as a Professional Engineering Technologist in South Africa.
Signatories are advised that accreditation of National Diploma programmes by
ECSA is subject to an appropriate choice of subjects by the student in each case.
On the E-20-PN document ND Accreditation List, Revision 1.1, 1 June 2010, p.6 of ECSA
(2009), the NDME at WSU is listed as accredited from 1996 when the first visit took

6
place. During every visit thereafter the NDME at WSU received full accreditation. The
next visit will take place in 2014.
1.2.2 Weaknesses of the NDME at WSU
Students’ pass rates in NDME at WSU in general are very low as revealed by the data
captured by Higher Education Management Information System (HEMIS, 2009).
According to the Integrated Tertiary Software (ITS) records, WSU, 2000-2009 the
average pass rate in MTHE 2 over the past 17 years is below 40%. Recorded pass rates
from 2006-2009 are as follow: semester two 2006-16%, 2007-20% and 2009-9%.
Records of feedback from various employers over the years also indicated that
graduates from WSU lack certain skills such as communication and group work crucial
for an engineering career.
1.2.3 Teaching and Learning at WSU
The fact that most of the mechanical engineering lecturers are more of professional
engineers than educators/academics and have not been exposed to or formally trained
in educational practices results in teaching and learning methods which do not cater for
a diverse group of students (WSU Faculty Prospectus, 2010, pp.14-18). Traditional
lecturing involves the lecturer presenting the course to the students verbally and the
students listen and take notes. Traditional lecturing is still considered as the most
effective method of sharing factual information with large groups. This method gives

7
the students guidance on what to concentrate on and can be sometimes inspirational
also. The student however needs to have good listening, reading, writing and speaking
skills to ensure that the learning process is effective (Holford & Moore, 1994, p.1). Good
note-taking skills are also crucial. According to Bales (1996, p.1) students remember
only five percent of what they have been taught during a traditional lecture.
Employers expect engineering graduates and diplomates to deliver immediately in terms
of high level of technical comprehension and application, technical communication and
presentation and professional behaviour. Employers mainly offer only specialised-skills
courses (e.g. a software simulation programme for a specific application) to them. As
such, the new graduates need to be prepared to deal with these expectations. For the
students, the only back-up is knowledge and the skills acquired at the university.
1.2.4 Global Responses to Traditional Engineering Teaching
Universities should not only teach students to “memorise knowledge”, but also focus on
developing their complex thinking and reasoning skills (Fink, 2003, p.2). According to
Kabir, Khan and Mahmud (2008, p.15), “... to successfully deal with the challenges of
the 21st century, engineers must possess three tools: knowledge, skills and attitude”.
Traditional teaching and learning approaches do not address these three tools with the
result that they are not developed by the time a student graduates. In September 2000,
Universite Catholique de Louvain Belgium (UCL-Belgium) introduced a new approach
which was more active and student-centred into their engineering curriculum, which

8
modified the traditional lecturer-centred teaching. This decision was inspired by, among
others, the high drop-out rates, low student motivation and shallow mastery of course
material, low retention rate, little demonstration of higher-order skills, not enough
initiative and autonomy (Aquirre, Jacmot, Milgrom, Raucent, Soucisse & Vander Borght,
2001, p.29). With reference to the traditional teaching and learning approaches Alters
and Nelson (2002, p.1893) state that “Problems with such instruction become evident
when student retention and understanding of even the most fundamental concepts in
the course is shockingly limited, as reflected in the low levels of scientific literacy even
among college graduates...”
Chang, Stern, Sondergaard and Hadgraft (2009, p.2) state that “Internationally, as
engineering schools grapple with how best to prepare effective engineers in the twenty-
first century, we are seeing a move away from transmission models of learning and
teaching, towards more constructivist models”. Chang et al. (2009, p.2) also explain
that “... the social dimensions of learning suggest that formal class time with academic
staff is not the only opportunity for engineering students to learn”. With regard to the
new challenges which the tertiary education faces in the 21st century, Salmi (2001,
p.106) states that “There are three major, intertwined new challenges which bear
heavily on the role and functions of higher education: (i) economic globalization; (ii) the
increasing importance of knowledge as a driver of growth, and (iii) the information and
communication revolution”. Quality control in higher education in Africa aims to address
a new range of competences also which graduates must acquire. These are

9
adaptability, team work, communication skills and lifelong learning. Countries which
want to address these competences must be willing to make changes in their content
and pedagogy (Materu, 2007, p.7). In SA, the traditional method of learning and
teaching the chemical engineering degree at University of Cape Town was changed and
it was accredited as an outcomes-based degree by the Engineering Council of South
Africa (ECSA) in 2001. Report from the research done by Martin, Maytham, Case and
Fraser (2005, p.179) on the preparedness of graduates following this outcomes-based
degree state that:
The study confirms the importance of technical skills as a basis of engineering
practice, as well as the need for communication, team-work and interpersonal
skills in the workplace. It also points to the complex interactions between these
different skills, specifically that the non-technical skills area built on a technical
basis, and therefore that a lack of confidence in the technical arena would
hamper abilities in these other areas.
As shown above, researchers indicate that more universities are considering active
learning methods in their quest to find a solution to the crisis. From those who have
introduced these new methods, favourable results have been experienced (Prince,
2004; Junglas, 2006). This study which was carried out at WSU would add value to
other national and international institutions.

10
1.2.5 Global Trends in Engineering Education
In the outcomes of the 1998 Global Congress on Engineering Education at Cracow
(Poland), it was stated that “... the integration of lectures with laboratory experiences
and project work was identified as an ideal scenario” (Jones, 1998, p.1). This author
further states that the “... one basic set of skills that must be developed in engineering
students is critical thinking and problem solving” (Jones, 1998, p.2). The Ministry of
Education in New-Zealand, called for a research culture that will have a research-based
approach (Spronken-Smith, Angelo, Matthews, O’Steen & Robertson, 2007, p.1).
“Critical instructional objectives for the 21st century engineering students include
problem-solving, design, communication, teamwork, self-assessment, ethics, lifelong
learning” (Criteria for Accrediting Engineering Programmes 2006-2007 cited in Huet,
Mourtos, Costa, Pacheco & Tavares, 2007, p.2).
With regard to the effectiveness of traditional teaching methods versus alternative
teaching techniques, Rugarcia, Felder, Woods and Stice (2000, p.10) state:
In the traditional approach to teaching, the professor lectures and assigns
readings and well-defined convergent single-discipline problems, and the
students listen, take notes, and solve problems individually. Alternative
pedagogical techniques have repeatedly been shown to be more effective and
much more likely to achieve the objectives.

11
Gibson (2002, p.470) states that there is “... a steady movement away from traditional,
formal teaching and examination methods across Western Europe towards a more
informal, PBL environment, which demands a variety of appropriate assessment
mechanisms”. Universities in America changed their Engineering Education approach to
fall in line with the Engineering Criteria 2000 (EC2000) approved by the Accreditation
Board for Engineering and Technology (ABET) in 1996. This required engineering
programme evaluation to move its emphasis from curricular specifications to student
learning outcomes and accountability. Course offering was changed to less lecturing
and textbook problem solving to more active learning approaches, for example, group
work, design projects, case studies, and application exercises. Lattuca, Terenzini,
Volkwein and Peterson (2006, pp.5-13) further emphasise:
The most frequent and influential programmatic changes were an increase in
emphasis on foundational knowledge and project skills in program curricula, less
reliance on traditional pedagogies, an increase in active and collaborative
pedagogies, and an increase in programmatic emphasis on assessment for
improvement.
ABET has changed the accreditation criteria and has placed more emphasis on the
project-based learning approach and also self-directed learning which will enhance life-
long learning. For students to be successful engineers in the 21st century they must be
well equipped. The ability to solve problems from a system-level perspective, to

12
communicate effectively, to be technically versatile, to be able to function in an ethnic
diverse team and to demonstrate social responsibility are some of the important skills
these engineers must poses (Savage, Chen & Vanasupa, 2007, p.2). These authors
further state that:
... undergraduate engineering educational curricula are facing a number of
challenges including a rapid growth in what is perceived by the technical
community to be a necessary foundation of knowledge, the realization that our
workforce must be able to operate in a diverse global society and the recognition
that the implementation of technology can have an enormous impact on the
sustainability of our global resources (Savage et al., 2007, p.2).
At the Durban University of Technology in SA, a study was conducted on an alternative
presentation of a chemical engineering design module. In this regard Ramsuroop (2011,
p.174) states that “... the chemical engineering design module in the national diploma
has focused on developmental projects associated with sustainability, which emphasise
hands-on learning”. This author explains that:
The primary objective was to adopt active learning methods that would: improve
students‘ physical interpretation and understanding of real engineering systems,
expose students to the notion that chemical engineering can provide solutions to
many of the challenges facing our society, develop the engineering hand skills

13
(especially since very few students engage in any DIY activities), improve
motivational levels in students, provide a platform for students to show creativity
and innovation, and giving students a sense of ownership of their learning.
It is in line with the above innovative attempts, this research was designed to see the
effect of GEBL on MTHE 2.
1.3 Aim
To assess the effect of GEBL approach, on Mechanical Engineering students’
understanding of MTHE 2.
1.4 Rationale and Problem Statement
In Higher Education Institutions (HEI’s) the achievement of course outcomes is the goal
of the institution and the reason for their being. Learning and teaching methods in
these institutions play a crucial role in the fulfilment of these goals.
Traditional teaching methods do not address individual needs in a diverse group and
this serves as a detriment to the learner (Felder & Silverman, 1988, p.674). According
to Gibson (2002, p.470), “a constructivist view of learning and a consequent move
away from the traditional chalk and talk teaching methods will benefit the student (and
society) through a recognition and development of his/her multiple intelligences”.

14
Gibson (2002, p.470) continues to state, “… that traditional teaching methods are
ineffective and, in any case, neither encourage nor measure student understanding
even when teachers think otherwise”. Most classes in engineering are auditory,
deductive and intuitive. However, many engineering students are visual learners (they
prefer to see diagrams, pictures, equipment and processes), and inductive and
sequential learners and these render an immediate mismatch between teaching and
learning styles (Kapadia, 2008, p.2). Different backgrounds and childhoods deliver
learners with different reference frameworks. The gaps and shortcomings among the
learners within the same group must be bridged by applying multiple teaching methods.
Engineers are required to do much more than just recalling formulas, substituting
values and finding answers. In their daily operations, they must be able to
communicate fluently, explain problems or situations clearly and analyse complex
problems, to name a few. These are skills that universities should aim to develop during
a student’s career so that the graduate is prepared for the industry. In order to achieve
this, a combination of teaching and learning methods which accommodate different
learning styles are necessary.
Over the past 17 years, the present researcher has observed a worrying trend with
decreasing throughput rates of the WSU NDME students as reflected in HEMIS, 2009.
The methods that are used to lecture to the students do not address the students’
needs and often new course materials are presented in a manner that make it

15
impossible for students to understand and follow. In Mechanical Engineering, the aim is
to produce graduates with problem solving skills, who can express themselves in
technical conversations and who can present themselves professionally as outlined in
the outcomes of the WSU NDME in chapter 2 pp.53-54. Achievement of these
characteristics was the inspiration to engage in a process of finding alternative methods
of presenting courses to them to check if the shortcomings of the current practices
could be addressed.
The problem is that the NDME students have difficulties in performing academically well
in the course. The study is focused on the effect of GEBL approach on students’
understanding of MTHE 2.
1.5 Theoretical Framework
The theoretical framework is based on active learning which subsumes cognitive
theories such as social constructivism and enquiry-based learning (EBL) theories.
Vygotsky was a social constructivist who believed that learners used the input of others
as they formulate their constructions and not relied solely on themselves. In Vygotskian
theory:
Learning is a social and collaborative activity;
Learners utilize the input of others;
These “others” include more importantly ‘significant others’ such as peers,

16
parents, friends;
Sources of information, such as the internet, books, videos and movies
also contribute to learning;
The teacher is the facilitator (Martin, 2009, p.214).
Figure 1.1: Modified Zone of Proximal Development (R.G. Tharp & R. Gallimore's, 1988, p.35)
Tharp and Gallimore (1988, p.35) draw from social constructivism to explain proximal
development. The zone of proximal development (ZPD) is defined as “the distance
between the actual development level as determined by independent problem solving
and the level of potential development as determined through problem solving under or
in collaboration with more capable peers” (Lipscomb, Swanson & West, 2004 cited in
Hardjito, 2010, p.131). Hardjito further states that “In the view of ZPD, the role of
teachers is to provide assistance or support to students with tasks that are just beyond
students’ current capability. When students’ gradually develop their mastery, teachers

17
start the process of ‘fading’, or gradual removal of the temporary support” (Lipscomb et
al., 2004 cited in Hardjito, 2010, p.131).
Reagan and Osborn (2002, p.60), explain that in social constructivism, which is the
alternative to radical constructivism, “... the process of knowledge construction
inevitably takes place in a socio-cultural context, and that therefore knowledge is in fact
socially constructed”. Fraser and Tobin (1997, p.8) explain that in social constructivism,
“... learning is not viewed as transfer of knowledge but the learner actively
constructing, or even creating, his or her knowledge on the basis of the knowledge
already held”. Active teaching and learning methods are based on social constructivism
as appose to behaviourism. Behaviourism is a more teacher-centred approach, where
student performance directly depends upon teacher performance. According to Jones
and Brader-Araje (2002, p.1) behaviourism “... placed the responsibility for learning
directly on the shoulders of teachers”. Yaman (2005, p.25) explains further:
... people may react to the same information in very different ways while
learning. Importantly, constructivism sees learning as an internal process of
interpretation, rather than a process of knowledge transmission. In this point, we
should distinguish constructivism from behaviourism. In behaviourism, learning is
seen as the conditioning of human behaviour through habit formation. It implies
the dominance of the teacher, with learners characterized as essentially passive,
which constructivism strongly disagrees.

18
De Graaf, Saunders-Smits and Nieweg (2005, p.38) state that “... students bring to
their learning understandings (and misunderstandings), skills and propensities to
behave in certain ways, and that they build upon them or modify them in learning
situations; construct new understandings, skills and behaviours”. Adams, Kaczmarczyk,
Picton and Demian (2007, p.2) explain in the context of Bloom’s taxonomy, “... the
higher level cognitive skills of analysis, synthesis and evaluation are relevant to our
ability to effectively solve problems. The effective development of these skills, however,
requires mediation”. According to Ma (2009, p.164) in active learning, “... high levels of
social interaction and collaboration contributed to the establishment of a community of
learning, nurturing a space for fostering higher order thinking through co-creation of
knowledge processes”. Pundak, Herscovitz, Shacham and Wiser-Biton (2009, p.226)
state that “... one of the major goals of science and technology education today is to
promote students' active learning as a way to improve students' conceptual
understanding and thinking skills”.
The core ingredients of an EBL approach that some researchers are in agreement with
are: learning is stimulated by enquiry, i.e. driven by questions or problems; learning is
based on a process of seeking knowledge and new understanding; a learning-centred
approach to teaching in which the role of the teacher is to act as a facilitator; a move to
self-directed learning with students taking increasing responsibility for their learning and
the development of skills in self-reflection; an active approach to learning (Spronken-
Smith, et al., 2007, p.2). Geer and Rudge (2004, p.3) state:

19
... knowledge is fluid, not static; therefore, instructional practices reiterating
knowledge as static should not be promulgated as sole efficacious pedagogy,
because such instructional practices serve to tacitly inform future generations of
ill-conceived notions regarding science and knowledge of the world within the
disciplines it encompasses.
Social constructivism and its impacts on student learning therefore are adopted as the
main theoretical framework for this study.
1.6. Research Questions
1.6.1 What would be the effect of a guided enquiry-based learning (GEBL) approach
on mechanical engineering students’ factual recall of MTHE 2 concepts?
1.6.2 What would be the effect of a guided enquiry-based learning (GEBL) approach
on mechanical engineering students’ conceptual understanding of MTHE 2
concepts, principles and applications?
1.6.3 What would be the effect of a guided enquiry-based learning (GEBL) approach
on mechanical engineering students’ ability to communicate procedures and
processes related to MTHE 2?
1.6.4 To what extent would the formulation and use of key performance indicators
(KPIs) be an effective tool for ascertaining students’ attainment of desired
educational outcomes in MTHE 2?

20
1.7 Objectives
1.7.1 To investigate the effect of a guided enquiry-based learning (GEBL) approach on
mechanical engineering students’:
1.7.1.1 ability to recall factual information related to the topic: thermodynamics;
1.7.1.2 conceptual understanding of thermodynamics concepts, principles and
applications;
1.7.1.3 ability to communicate procedures, processes and applications related to
thermodynamics.
1.7.2 To apply the principle of key performance indicators (KPIs) as a tool for
ascertaining students’ attainment of intended educational outcomes in
thermodynamics.
1.8 Significance of the Study
The students can benefit from an investigation into improved teaching methods.
Students can be better prepared for their future careers which will result in more
productive engineers and technicians entering the industry. Most of these students have
a disadvantaged background and are therefore battling even more with the rapidly
developing technology. A different approach to address these shortcomings if more
effective and efficient than the present more traditional methods will definitely lay a
sound foundation and build a proper framework for future reference as suggested by
Strangman and Hall (2004, p.1).

21
Students in other engineering courses at WSU and students from other Institutions can
benefit from the findings of this study. Being able to come up with a solution to the
problem or to improve student performance and delivering a graduate more ready for
employment by industry will definitely be welcomed by all.
1.9 Methodology
This study was a Participatory Action Research (PAR) with the researcher (change
agent) being part of this study through his academic responsibility for MTHE 2. The
purpose of this study was to assess the effect of GEBL approach on Mechanical
Engineering students’ understanding of MTHE 2. The intervention was then reviewed
and evaluated to improve the manner in which MTHE 2 was presented to students. The
focus was to empower students and measure students’ performance not just in terms of
academic scores but also in the development of multiple skills necessary for an
engineering career. The achievement of outcomes in MTHE 2 was also measured to
determine the extent to which this intervention assisted in achieving these outcomes.
1.9.1 Research Subjects
It was made up of 20 students registered for MTHE 2 at WSU Chiselhurst campus in
East London out of a population of 40. The sample consisted of fulltime students who
voluntarily agreed to participate in the GEBL.

22
1.9.2 Instrument and Data Collection
Both quantitative and qualitative data were collected. The semester tests, oral test, final
examination and structured questionnaire were used to gather the quantitative data.
The interviews were used to gather the qualitative data.
The instruments were three formative assessments, an oral test, summative
assessment, KPIs, a structured questionnaire and interviews. The three formative
assessments and the summative assessment were designed to test not only analytical
abilities but also the students’ understanding, interpretation and analysis of questions.
The oral test was designed to determine the students’ knowledge on certain aspects of
MTHE 2 course content. Key performance indicators were developed to measure the
extent to which the course outcomes were achieved. These indicators were designed to
measure the selected outcomes which were relevant to this course. The structured
questionnaires were used to measure the students’ rating of various aspects of the
intervention. This was designed to gather quantitative responses from the students
regarding their experience with GEBL. Finally, students were also interviewed to gather
qualitative data on their experiences and opinions on this alternative presentation of
MTHE 2.
1.10 Limitations and Delimitations of the Study
1.10.1 The students’ social and economic backgrounds were not considered, although

23
they were recognized that these factors may have an influence on their academic
performance.
1.10.2 These students had all passed the pre-requisite for this course and were starting
their second semester. Secondary schools attended were therefore not
considered.
1.10.3 The study did not consider factors such as lighting, ventilation, indoor air quality
and acoustics.
1.10.4 The students’ commitment during the semester could influence the study and
everything possible was done to ensure that they stayed committed.
1.10.5 The student’s attitude could influence the study and everything possible was
done to ensure that all subjects in the sample had a focused and positive
attitude.
1.10.6 In order to avoid the research bias, interviews were done by a person who
qualified both as an insider and an outsider as explained in this document. This is
a delimitation.
1.10.7 The venue suitable and available for group sessions could only accommodate 20
students.
1.11 Definitions of Terms
A number of terms are defined to assist the reader in understanding the specific context
and meaning in which they appear and are used in this document.
24
Active Learning – “... an instructional method which engages students in the learning
process. In short, active learning requires students to do meaningful learning activities
and think about what they are doing” (Prince, 2004, p.223).
Guided Enquiry Based Learning – “... refers to an array of classroom practices that
promote student learning through guided and, increasingly independent investigation of
complex questions and problems. Rather than teaching the results of others'
investigations, which students learn passively, instructors assist students in mastering
and learning through the process of active investigation itself” (Lee, 2004, p.9).
Enquiry – “... generally refers to a process of asking questions, generating and pursuing
strategies to investigate those questions by generating data, analyzing and interpreting
those data, drawing conclusions from them, communicating those conclusions, applying
conclusions back to the original question, and perhaps following up on new questions
that arise” (Krajcik et al., 1998; NRC, 1996; White & Frederiksen, 1998 cited in
Sandoval, 2005, p.635).
Inductive Learning – “... effective instruction must set up experiences that induce
students to construct knowledge for themselves, when necessary adjusting or rejecting
their prior beliefs and misconceptions in light of the evidence provided by the
experiences” (Prince & Felder, 2006, p.126).

25
Outcomes – “Anticipated or achieved results of programs or the accomplishment of
institutional objectives, as demonstrated by a wide range of indicators such as student
knowledge, cognitive skills, and attitudes” (Vlasceanu, Grunberg & Parlea 2007, p.63).
Key Performance Indicators (KPIs) – “A range of statistical parameters representing a
measure of the extent to which a higher education institution or a program is
performing in a certain quality dimension” (Vlasceanu et al., 2007, p.60).
Traditional Teaching and Learning – “Traditional instruction in engineering and science
frequently treats new courses and new topics within courses as self-contained bodies of
knowledge, presenting theories and formulas with minimal grounding in students’ prior
knowledge and little or no grounding in their experience” (Prince & Felder, 2006,
p.125).
University of Technology – Former Technikons in South Africa, now being renamed
Universities of Technology, are higher education institutions that provide and promote,
in co-operation with the private and public sectors, quality career and technology
education and research for the developmental needs of a transforming South Africa and
the changing world. As institutions of technological higher education, their tertiary
educational programmes cover a variety of specialised occupations and careers in the
applied engineering; biological, chemical and physical sciences; and applied commercial
sciences; humanities, arts and teacher education (Committee of Technikon Principals

26
(CTP), 2001, p.1).
1.12 Organisation of the Thesis
Chapter 1
In this chapter a background to the study was given, highlighting the problems that
engineering education experiences globally and the reasons for this research. The
problem statement, objectives of the study, theoretical framework, research question
and sub-questions, significance of the proposed study, limitations and delimitations and
rationale were presented and explained. A list with definitions of pertinent terms used,
were listed.
Chapter 2
In this chapter the literature related to this study is cited. The terms effective teaching
and significant learning are also discussed. The reason for selecting GEBL is also
explained. A definition of outcomes and the particular outcomes for NDME as specified
by SAQA is discussed and from these outcomes certain outcomes are selected which
applies to MTHE 2.
Chapter 3
In this chapter the methodology is discussed. The modes of enquiry are explained as
well as the population and sample. A detailed explanation and discussion of how the
intervention was introduced is given as well as a detailed description of how the
instruments were used to assess the students. Specific KPIs which were developed to

27
address the achievement of the selected outcomes for MTHE 2 are given.
Chapter 4
In this chapter the data collection, data analysis, interpretation and discussions are
given. The findings from the data and its meaning to engineering education are also
elaborated on. The evidence gathered from this data is discussed in detail and
arguments are made, based on this data. Lessons learned from the research and the
impact it had on Thermodynamics 2 education at WSU are also discussed.
Chapter 5
In this chapter conclusions are drawn from the results of the study. The effect that
GEBL had on student learning in terms of test and examination scores as well as the
development of multiple skills such as communication, team work, the improvement of
technical vocabulary and responsibility developed towards their own studies will be
highlighted. Recommendations based on these findings are made for future
consideration and implementation within the Mechanical Engineering Department of
WSU. A model is proposed for MTHE 2 and a general model is proposed for other
mechanical engineering courses.
1.13 Summary
In the introduction and background to this study, a need for this investigation was
established. The aims and objectives were stipulated which indicated that a more

28
effective method of teaching and learning engineering students needed to be developed
and the impact of these methods on student learning would be evaluated. The problem
statement highlighted the shortcoming of current teaching and learning practices at
WSU. The epistemological approach to acquiring knowledge will be active learning and
social constructivism. It was indicated under the research questions that the effect of
GEBL approach on mechanical engineering students’ ability to recall factual and
conceptual knowledge and communicate procedures and processes in MTHE 2 will be
investigated. The significance of this study was to ultimately develop an effective
teaching and learning method to benefit the students.
The research was PAR with group sessions to deal with course content and the
instruments were formative assessments, an oral test, a summative assessment, a
structured questionnaire and an interview. Both qualitative data and quantitative data
were collected and studied. Certain limitations and delimitations were listed which could
have impacted on the study. A brief rationale was given to indicate to the reader what
inspired the researcher to undertake this study. Definitions of important terms used in
this study were also given to clarify the use of these terms and their meaning in the
context of this study. The organisation of this study was given to briefly indicate to the
reader the various chapters and the information each one deals with.

29
CHAPTER 2
LITERATURE REVIEW
This chapter reviews pertinent literature for this study to address the themes suggested
by research objectives. In addressing the themes of the first three objectives, the focus
will be on social constructivism, inductive/deductive teaching and learning and research
where active learning, EBL and GEBL in engineering were used and the findings from
such reports. Kolb’s Learning Cycle, Bloom’s Taxonomy (Cognitive Domain), effective
teaching and significant learning will also be discussed as well as the meaning of deep
and surface learning and how it assists student development. In addressing the fourth
theme, SAQA and ECSA’s views on outcomes will be presented and KPIs to measure
these outcomes will be discussed. This review will seek to indicate how the research
objectives can be addressed by different teaching and learning styles and how different
approaches and strategies can influence learning experiences.
2.1 Social Constructivism in Education
Social constructivism has many applications in education. This section will look at
research done with social constructivism as the underpinning theory and its impact on
teaching and learning in engineering education. On social constructivism, Hyslop-
Margison and Strobel (2008, p.84) state, “Through language acquisition and guided

30
instruction, then, Vygotsky’s model of social constructivism leads students toward
educational objectives designed to provide them with certain crucial forms of social and
cultural knowledge”.
Social constructivism is widely used in engineering education by researchers (Nicol &
Boyle, 2003; Ferreira & Mueller, 2004; Michaelides, Eleftheriou & Muller, 2004; Brodie &
Gibbings, 2007) as the epistemology of how knowledge is acquired. A study done on
students in an Engineering Mechanics course, used activities called Active Learning
Products (ALPs) to engage the students in a more active learning process. These ALPs
were situated within social constructivism and results indicated that it improved student
learning and that the students needed more learning activity in courses (Linsey, Talley,
White & Jensen, 2009, pp.18-19). According to Kitto (2010, p.S3G-6) in a research
done in Material Engineering course, “... the improved outcomes were all based on the
basic principles of social and cognitive constructivism”. Kitto further explains that “...
collaboration improves outcomes, especially in higher order thinking skills, on term-long
research papers”. Constructivism in general and social constructivism in particular argue
for learning processes which include individual learning, active participation by the
learner and collaborative learning as suggested by Reagan and Osborn (2002, p.59).
2.2 Active Learning
Active learning is learning with understanding. It is enhanced by learning through
activity. This means that the students are using more senses and that there is

31
interaction between them and the information in the form of discussions, exchanging of
ideas and sharing of views. According to Prince (2004, p.223) the definition of active
learning is, “... any instructional method which engages students in the learning
process. In short, active learning requires students to do meaningful learning activities
and think about what they are doing”.
Felder and Brent (2003, p.282) suggested that active learning may increase the
performance percentage, and simultaneously work well even in large groups despite the
difficulty to get most of the students actively involved in the process. The advantage of
social learning too kicks in. Furthermore, as Felder and Brent (2003, p.282) emphasise,
a self study session even for a few minutes during the lecturing session, may inspire
students on the topic under discussion and motivate and stimulate student
participation.
Although active learning is rather a fairly new method of teaching and learning process,
this move away from the traditional ‘chalk and talk’ and lecturer-centred approach, has
already proven to be more fruitful. The more the students are actively involved with the
learning process, the more they will want to experience, find out, discover, learn,
realise and understand the concepts. Above all, many engineering principles which are
usually difficult to comprehend become easier to handle. The Board of European
Students of Technology (BEST), (2006, p.6) corroborates the above view.

32
Prince (2004, p.229), based on his study on active teaching methods, states that “...
this study has found support for all forms of active learning examined”. Prince (2004,
p.229) continues, “... students will remember more content if brief activities are brought
into the lecture”. In Introductory Thermodynamics, where Computer-based Instruction
(CBI) was used as an intervention, Anderson, Taraban and Sharma (2005, p.1168)
state, “We believe that a current challenge in engineering education is to develop active
learning exercises that are simple, relate to the learner's experience level, and that can
be incorporated into and synchronized with other teaching pedagogies”. In a study at
Purdue University College of Technology, United States of America (USA), it was
claimed that the data collected from an active learning experience in Mechanical
Engineering Technology course “... clearly showed evidence of increased learning with
the active learning elements” (Fuehne, 2007, p.6).
In Australia, Junglas (2006, p.175) introduced active learning into a Thermodynamics
class and found that “... students gained a better understanding of thermodynamic
processes and achieved higher scores in the final examinations”. In Saudi Arabia a
study done with active learning tools in a Thermo-Fluid course created the opportunity
for, “... discussion boards that allow for student interaction among themselves... it has
elements of critical thinking, discussions and deliberation of various course elements...
This helped actually to motivate the students to further explore various aspects of
thermo-fluid problems”. This view was also supported by (Zubair & Antar, 2004, p.4).
According to De Weck, Young and Adams (2003, p.11), with regard to an active

33
learning approach at the Massachusetts Institute of Technology, USA, “Presenting
problems in such an active learning format enabled us to address secondary learning
objectives such as technical communications, system modelling and qualitative
estimation”.
In the Mechanical Engineering Department of North-West University (NWU), Pair
Problem Solving (PPS) was used as a co-operative learning strategy to enhance the
conventional teaching method which was used to offer Thermodynamics. During
interviews, students indicated that PPS improved their understanding of
Thermodynamics (van Niekerk, Mentz & Smit, 2011, p.178). At the Witwatersrand
University (WITS), an alternative teaching approach was introduced and this was
according to Woollacott (2011, p.322):
... an innovative, active-learning methodology termed mediated-interaction-
groups or MIGs for the enhancement of learning by means of students
articulating their ideas and thinking in an interactive learning environment
which is strongly mediated by a knowledgeable facilitator.
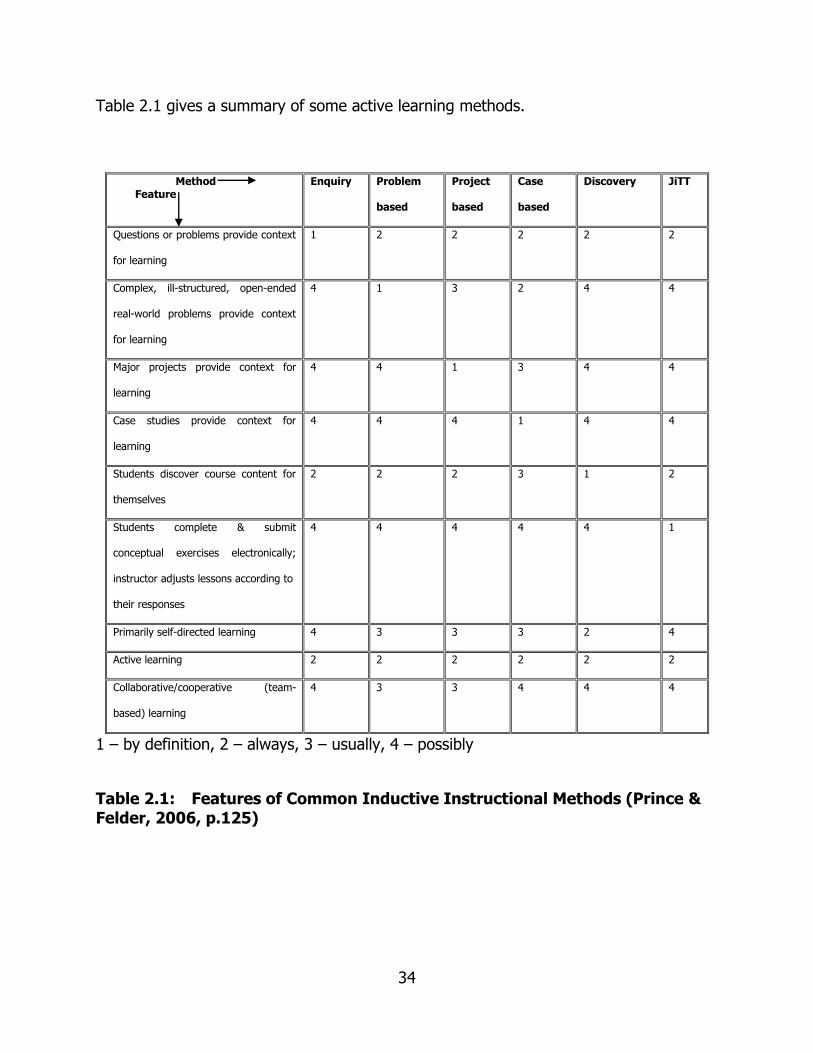
34
Table 2.1 gives a summary of some active learning methods.
Method Feature
Enquiry Problem
based
Project
based
Case
based
Discovery JiTT
Questions or problems provide context
for learning
1 2 2 2 2 2
Complex, ill-structured, open-ended
real-world problems provide context
for learning
4 1 3 2 4 4
Major projects provide context for
learning
4 4 1 3 4 4
Case studies provide context for
learning
4 4 4 1 4 4
Students discover course content for
themselves
2 2 2 3 1 2
Students complete & submit
conceptual exercises electronically;
instructor adjusts lessons according to
their responses
4 4 4 4 4 1
Primarily self-directed learning 4 3 3 3 2 4
Active learning 2 2 2 2 2 2
Collaborative/cooperative (team-
based) learning
4 3 3 4 4 4
1 – by definition, 2 – always, 3 – usually, 4 – possibly
Table 2.1: Features of Common Inductive Instructional Methods (Prince & Felder, 2006, p.125)

35
2.2.1 Enquiry Based Learning (EBL) and Guided Enquiry Based Learning
(GEBL)
EBL is also referred to as research-based teaching, inductive learning and teaching or
discovery learning. There is some agreement with regard to what will form the core
ingredients of an EBL approach and the main factors are:
EBL stimulates the learning process;
Students experience learning through their actions of investigating, discovery and
understanding;
EBL shifts the emphasis to the student with the lecturer merely facilitating the
process;
EBL puts the responsibility on the student who must take charge of his/her own
learning;
EBL is active involvement in learning on the students’ behalf making it definitely a
more active process (Spronken-Smith, et al., 2007, p.2).
Prince and Felder (2006, p.124) explain that the, “... support for the use of EBL comes
from the strong theoretical underpinning of the approach including constructivism,
cognitive research on motivating learners, intellectual development and approaches to
learning”.
36
Lee (2004, p.1) states that EBL also promotes:
... the ability to formulate good questions, identify and collect appropriate
evidence, present results systematically, analyse and interpret results, formulate
conclusions and evaluate the worth and importance of those conclusions. It may
also involve the ability to identify problems, examine problems, generate possible
solutions, and select the best solution with appropriate justification.
There is however a negative attitude towards EBL approach which is driven by the
perception that it requires more work. However, lecturers can also benefit from EBL
through the enhanced active involvement and interaction with students and
incorporating theoretical lectures with research engagement, still some lecturers may
find a paradigm shift very difficult (Spronken-Smith, et al., 2007, p.4). In a study done
with EBL in a Engineering Mechanics course, Miller–Young (2007, p.9) states that “...
this project incorporated all the principles for supporting critical thinking, and stimulated
student interest in the course as well as engineering in general”. Hanson (2006, p.3)
states in an Instructors’ Guide to Guided-Oriented Process Enquiry Learning (POGEL)
that “To support this research-based learning environment, POGEL uses learning teams,
guided enquiry activities to develop understanding, questions to promote critical and
analytical thinking, problem solving, reporting, meta-cognition, and individual
responsibility”.

37
Prince and Felder (2006, p.134) state that “... enquiry learning is the simplest of the
inductive approaches and might be the best one for inexperienced or previously
traditional instructors to begin with”. Edwards and Recktenwald (2008, p.8) explain that
“... guided enquiry learning provides a rich environment for enhancing the learning
experience”. Edwards and Recktenwald (2008, p.8) continues to state, that the GEBL
experiences were, “... giving them more exposure to the topics than they would
otherwise get from a traditional lecture format”.
Charelvoix, Strey and Mills (2009, p.25) explain that:
... the multi-media, coupled with the guided enquiry activity worksheets,
provided students with a tangible way to engage the material as well as provided
a break from the typical college-course format. Students were given the valuable
opportunity to work on activities and discuss them with their peers, broadening
their understanding by engaging in a dialogue that required them to explore
other students’ interpretations of the situation. The in-class learning activities
were also an opportunity for students to directly interact with the professor and
teaching assistants.
Research done in a science class based on GEBL found that students understood
concepts explained to them better. There was also sufficient evidence that the
classroom discussions and the science notebooks used as part of the GEBL approach
38
assisted students in achieving a deeper understanding of course content and also
developed complex reasoning abilities (Klentschy & Thompson, 2008, p.7). GEBL has
been used widely by researchers as an alternative pedagogy to offer courses in
engineering education in an attempt to make teaching more effective and to improve
student learning (Thompson, Alford, Liao, Johnson & Matthews, 2005; Donath, Spray,
Thompson, Alford, Craig & Matthews, 2005; Richards & Schnittka, 2007; Taraban,
Anderson, De Finis, Brown, Weigold & Sharma, 2007).
2.3 Inductive and Deductive Teaching and Learning and Learning Styles
The following section deals with inductive and deductive teaching and learning and the
different learning styles.
2.3.1 Inductive and Deductive Teaching and Learning
Inductive teaching presents a student with a problem which must be solved and as the
student works through the problem he/she will learn the principles, rules, procedures
and theories related to the problem. In deductive teaching and learning, the student is
first supplied with principles and theories and is later introduced to their application.
The method of Inductive teaching and learning places more emphasis on the student. It
involves the student in the learning process through asking questions, investigating
problems, discussions in groups and conducting research. Prince and Felder (2006,
p.125) corroborate this view. An inductive teaching and learning approach is being used

39
more and more as an alternative to traditional deductive teaching by researchers
(Hesketh, Farrell & Slater, 2002; Kitto, 2009; McKenna, Yalvac & Light, 2009; Felder &
Brent, 2010) in engineering education to enhance teaching practices, improve student
learning and to develop multiple skills. Elshorgaby and Schonwetter (2002, p.297) state
that “The most prevalent form of teaching is still the traditional lecture, or deductive
instruction ... this format of instruction is the least effective in promoting learning”.
In engineering education, where a heat and mass transfer course was presented to
students in an inductive manner, Farrell and Hesketh (2000, p.3) state, “We have found
that this inductive approach to heat and mass transfer has naturally created
opportunities for active learning via laboratory experiments and in-class discussions of
experimental observations, thus contributing further to students’ understanding and
retention of new material...” Bardet and Ragusa (2009, p.2) explain that “Inductive
teaching refers to pedagogical approaches that include active engagement by students
in collaborative problem solving rather than disengaging lecturing, which is the
traditional pedagogical approach of engineering education”.
The School of Mechanical and Nuclear Engineering at the NWU in SA changed their
conventional didactic approach to a group project-based inductive learning approach
which resulted in positive feedback with regard to stimulation of interest, increased
ability to do research, enhancing professional engineering competencies in terms of
report writing and audiovisual presentation and debating skills (Serfontein & Fick, 2011,

40
p.183).
2.3.2 A Spectrum of Learning Styles
Previous studies have also shown that learning styles play a very important role in how
information is presented by a lecturer and how that information is perceived by the
learner. Many researchers (Goldfinch, Carew & McCarthy, 2008; Kapadia, 2008;
Lamancusa, Zayas, Soyster, Morell & Jorgensen, 2008; Naher, Brabazon & Looney,
2008; O’Dwyer, 2008) have investigated the importance of teaching and learning styles
on engineering students’ academic performance. They have found that learning styles
and the teaching styles have a direct influence on students’ learning. Reid (2005, p.21)
states that “... learning styles can therefore be a vehicle for ensuring that the
individuality of all learners is paramount, particularly in an inclusive educational
environment”.
In a study conducted at the Dublin Institute of Technology on learning styles of first
year mechanical and electrical students, O’Dwyer (2009, p.5) concludes, “... it is
desirable to create an overall learning environment across all subjects to appeal to as
wide a range of learning styles as possible”. If lecturers (teachers) know about the
different learning styles and where their own learning style fits in the spectrum of
learning styles, it will help them to recognise and accommodate students with different
learning styles. It will help in the way they present a lecture to cater for various
learning styles. It will also improve student learning when information is presented to
41
them in a manner that falls in line with their learning styles (Davis, 1993, p.189).
Felder, Woods, Stice & Rugarcia (2000, p.33) state that:
Most intuitive professors and even many of the sensing professors teach in an
intuitor-oriented manner, emphasizing theories, mathematical models and
abstract prose to students who respond best to concrete examples, well-
established problem-solving procedures... This mismatch has several
unfortunate consequences for the sensing learners.
2.4 Effective Teaching
Alternative non-traditional methods of course presentations are being considered by
researchers to improve the effectiveness of presentations which, in turn, can promote
student learning and the development of skills in various engineering courses (Ditcher,
2001; Qualters, Sheahan, Mason, Navick & Dixon, 2008; Su, 2008; Felder et al., 2010).
Effective teaching and learning can be achieved by focusing on the following points
during preparation and presentation of a lecture, as presented by Carbone, Conway and
Farr (2004, p.3):
Strategic preparation, Tactical Preparation, Mental Preparation, Delivery,
Enthusiasm, Relationship with the class, Demonstrating and encouraging
competency, Clarity, Humour, Jargon, Understanding the students’ context,
Linking, Metaphors, Teaching inductively and Interaction.

42
Killen (2006, p.3) lists in his book the effective teaching strategies which indicate that
high quality learning has occurred:
students are able to apply their knowledge to solve problems;
students are able to communicate their knowledge to others;
students are able to perceive relationships between their existing knowledge and
the new thing they are learning;
students retain newly acquired knowledge for a long time;
students are able to discover or create new knowledge for themselves;
students want to learn more.
To teach higher order thinking in a classroom as part of effective teaching strategies,
students must be made aware of how to focus at all times in lectures. The lecturer must
therefore instruct the class in a way that will encourage the students to think more
effectively. Active teaching and learning methods engage students more directly and
effectively in their learning process and will assist the lecturer in presenting material to
the students in a manner which will be more effective than the traditional teaching
(Orlich, Harder, Callahan, Trevisan & Brown, 2010, p.288).
Students must make use of the correct learning strategies to achieve effective learning.
Learning strategies can involve any activity which the students use to achieve a learning
goal e.g.; cognitive, meta-cognitive, motivational and affective. Cognitive strategies can

43
be rehearsal, elaboration and organisation. Rehearsal helps the student’s attention and
the ability to encode information. Elaboration helps the student to improve his/her long-
term memory and to make a connection between existing (old) and new information.
The student uses what he/she already knows to understand the new information.
Organisation helps the student to select appropriate information and to make a
connection between the parts of the information (De La Harpe & Radloff, 2007, pp.2-3).
2.5 Significant Learning
In this section Fink’s (2003) taxonomy of significant learning will be discussed as well as
the requirements for learning to be regarded as being significant is explained. There is
a clear connection between the active teaching and learning process and the different
areas of development which defines significant learning. Fink in his ‘taxonomy of
significant learning’ defined various aspects of personal development which will result in
significant learning taking place to a more or lesser degree.
‘What is significant learning?’ - It is a learning process that consists of one or more of
the following six kinds of learning:
Foundational knowledge: this is basic knowledge that the students have about
a specific topic or area, which will in turn assist them in their learning of further
aspects of that particular topic or area. More complex learning will therefore be
enhanced by the prior knowledge;
44
Application learning: here the student must be able to learn how to think for
example critically and practically from a safety point of view. Application goes
hand-in-hand with the development of skills such as communication;
Integration: here the student is able to make a connection between what has
been taught in class and the practical application or significance of it in
engineering. The student can relate the theory to practical applications and will
therefore realise the value of what has been taught;
The Human dimension of learning: the student realises how he/she is learning.
The student can also come to realise how other students interpret or understand
a problem or how they approach a problem;
Caring: the student changes his/her ‘attitude’ about something and start caring
more for something e.g., if a student understands a particular course he/she will
spend more time on it;
Learning how to learn: the student learns something about the process of
learning. For example, the student learns how to analyse a problem by following
a certain process, or the student learns how to analyse a problem through an
enquiry process Fink (2003, pp.4-6).
Fink (2003, pp.7-8) further states that “... the more that these kinds of learning occur,
the more significant the learning experience is. In fact, the most significant kind of
learning experience is one in which students achieve all six kinds of significant
learning”.
45
2.6 Deep and Surface Learning
In research done in engineering education Ditcher (2001, p.25) explains that:
Two main categories of learning have been identified: a deep approach and a
surface approach. In a deep approach of learning, the student is looking for
underlying meaning and structure and taking a holistic view. In contrast, a
surface approach focuses on discrete pieces of knowledge, without attempting to
integrate them.
According to Mazumder (2010, pp.1-2):
... An important characteristic of successful students is that they are capable of
assessing and regulating their own learning behaviour. They strive for deep
understanding and assess how well they know the material in addition to what
they learned. They demonstrate higher levels of confidence in their knowledge
that can only be achieved by deep learning, rather than the surface learning by
some of their peer students.
2.6.1 Deep Learning
Researchers in engineering education make use of various interventions in an attempt
to achieve deep learning in their course offers. This will result in the development of

46
multiple skills necessary for the profession (Qualters, 2008; Felder, 2010; Litzinger,
Lattuca & Hadgraft, 2011).
In China, an electrochemistry course was offered using a more student-centred
approach. Ying (2003, p.44) suggests that “... we need to change our teaching
approach from a teacher-centred model to a more student-centred one in order to
encourage our students to adopt a deep level approach to their learning, and to
encourage them to master a competence in problem solving”. Fowler (2004, p.72)
states in her dissertation that “The results of the data regarding retention and the
approach to learning indicated a very strong trend toward higher retention for students
with a deeper approach to learning and lower retention for students with a surface
approach to learning”.
Case and Marshall (2009, p.11) explain in her study on deep and surface learning that
“The deep approach is defined by a search for understanding, using whatever
strategy...” While comparing the achievement of learning outcomes, Case and Marshall
(2009, p.13) state, “Students who were identified as using a deep approach were also
seen to have qualitatively superior learning outcomes, as well as greater recall of facts”.
In summary Cope (2003, p.415) states, “Only deep learning approaches have been
associated with the development of deep levels of understanding”. Lublin (2003, p.3)
explains that “Students who take a deep approach have the intention of understanding,
engaging with, operating in and valuing the subject...” Robbins and Ardebili (2006, p.6)
suggest that “Engineering students need effective problem-solving abilities and these

47
come by deep conceptual understanding of the fundamental physical understanding”.
In the USA, Rose, Kumar, Aleven, Robinson and Wu (2006, p.8) found that “... the
student has the potential to gain a deeper understanding of the design space and
underlying thermodynamics principles...” using an active learning approach by creating
a simulation based exploratory learning environment.
2.6.2 Surface Learning
Surface learning does not link new knowledge to prior knowledge and it replaces one
set of knowledge with another without actually understanding it (Hay, 2007, p.50).
According to Floyd, Harrington and Santiago (2009, p.187):
... a surface learning strategy is a survival technique – the student is simply
trying to pass the course with minimal effort. Since engagement has no
relationship to a surface learning strategy, whereas perceived course value does,
the importance of course value in getting the unmotivated student to expend
effort to go beyond surface learning is an important finding of this study.
Lublin (2003, p.4) suggests that:
Students who take a surface approach tend not to have the primary intention of
becoming interested in and of understanding the subject, but rather their

48
motivation tends to be that of jumping through the necessary hoops in order to
acquire the mark, or the grade, or the qualification.
Maier, Barnett, Warren and Brunner (1998, p.23) explain that “Surface learning, as the
name suggests, applies to learning where the student takes on board ideas from the
teacher, but does not ‘translate’ or adapt those ideas in any way”. McKenna et al.
(2009, p.19) state that “Students with surface learning approaches are more likely to
have negative attitudes toward learning”. According to Armarego (2007, p.4),
... Those with a surface orientation tend to take an approach characterised as
instrumental, reproductive and minimalist, relying on rote memorisation and
mechanical formula substitution, making little or no effort to understand the
material being taught.
2.7 Kolb’s Learning Cycle
According to Nilson (2010, p.231) Kolb’s learning cycle, “... portrays the process of
meaningful learning as a series of events that integrates the functions of feeling,
perceiving, thinking and acting”.

49
Concrete Experience
CE - (Feeling) Active Experimentation Reflective Observation AE - (Doing) RO - (Watching)
Abstract Conceptualization AC - (Thinking)
Figure 2.1: Movement through Kolb’s Learning Cycle which can be enhanced by Active Learning
According to Kuri (2000, p.5) Kolb’s learning cycle as illustrated in figure 2.1, “...
increases the students' motivation with learning styles that are not assisted by the
lecturing”. Kuri (2000, p.5) continues to say that:
... the model here described supplies that opportunity, because besides helping
the students become independent, it stimulates the reasoning, the development
of the necessary abilities for the resolution of problems and the communication
to each apprenticeship of the cycle. The problem solving promotes the
development of analysis abilities, synthesis and evaluation, abilities which are not
encouraged by lecturing, but that are clearly necessary in the engineering
teaching.
What if? Why?
Accommodators Divergers
(Do and feel) (Feel and watch)
How? What?
Convergrers Assimilators
(Think and do) (Watch and think)

50
Kolb’s Learning Cycle Engineering Education Process/Activity
Concrete Experience
Having an experience
(Demonstration of boiler plant operation)
Reflective Observation
Reflecting on the experience
(Comments, feedback, discussions)
Abstract Conceptualization
Learning from the experience
(Boiler plant theory, literature, diagrams)
Active Experimentation
Apply what has been learnt
(New approach to addressing plant problems)
Table 2.2: Kolb’s Learning Cycle and Engineering Education Activities
Table 2.2 illustrates the movement through Kolb’s learning cycle in engineering
education.

51
Movement through Kolb’s Learning
Cycle
Teaching and learning process/activity
Concrete Experience - Reflective Observation
(Why do I need to know this?)
Demonstration
Introduction and explanation
Reflective Observation - Abstract
Conceptualization
(What do I need to solve this?)
Lectures
Learning concepts, principles and theories
Abstract Conceptualization - Active
Experimentation
(How can I solve this?)
Doing
Experimenting with concepts
Practicing problem solving
Active Experimentation - Concrete Experience
(What if I use this approach?)
Using
Applying what have been learned to new
problems
Table 2.3: Movement through Kolb’s Learning Cycle with Teaching and Learning Activities
Kolb’s learning cycle is widely used as pedagogy for teaching students engineering in
courses. Researchers in engineering education (Ogot & Okudan 2006; Kapranos, 2007;
Aziz & Chassapis, 2008; Altuger, Tumkor & Chassapis, 2009; Stappenbelt, 2010) use
the movement through Kolb’s cycle to plan and structure course presentation to
students. Elshorbagy and Schonwetter (2002, p.297) suggested that if engineering
students can be taught in a manner which promotes the movement through Kolb’s
learning circle, “... students can retain this knowledge for longer periods of time and
apply it to different cases and in different situations. This is ideal for the training future

52
engineers”.
2.8 Bloom’s Taxonomy (Cognitive Domain)
Bloom’s taxonomy on how we learn presents different hierarchical levels of learning,
starting from low at the bottom to high at the top. The lower level has to occur before
the next higher one can be achieved and progressively the learner will work his/her way
through the different levels from ‘knowledge’ > ‘comprehension’ > ‘application’ >
‘analysis’ > ‘synthesis’ > ‘evaluation’. Rutkowski, Moscinska and Jantos (2010, p.2)
listed the six levels in Bloom’s cognitive domain with equivalent key words as follows:
1. Knowledge: define, list, name, order, recognize, relate, recall, repeat,
2. Comprehension: classify, discuss, explain, identify, indicate, report, review, select,
3. Application: apply, choose, demonstrate, sketch, solve, use, write,
4. Analysis: analyze, calculate, compare, contrast, discriminate, examine, experiment,
5. Synthesis: assemble, construct, create, design, develop, formulate, prepare,
propose, write,
6. Evaluation: assess, attach, choose, compare, predict, rate, select, evaluate.
Many researchers use Bloom’s taxonomy in engineering research to improve, gauge and
evaluate course offerings to students (Terry & Harp, 1993; Reeves, Courter, Nickels,
Noyce, Pearce, Schaefer, Wickramasinghe & Lyle, 1998; Prince & Hoyt, 2002;
Elshorbagy & Schonwetter, 2002; Hopson, Simms & Knezek, 2002; Żywno, 2003; Boles,

53
Beck & Hargreaves, 2005; Uziak, Oladiran & Moalosi, 2010). The various levels in
Bloom’s cognitive domain of educational activities are seen to be important for the
development of critical thinking skills and the enhancement of learning outcomes in
engineering education. This view is corroborated by Boles et al. (2005, p.3). With
regard to the cognitive objectives of Bloom’s taxonomy, Irish (1999, p.84) states that
“Ideally, engineers need to function at all levels”. The effectiveness and impact of
interventions in mechanical engineering education are also used in conjunction with
Bloom’s taxonomy. Researchers make extensive use of the lower and higher order
thinking skills in the cognitive domain to determine the success of their intervention in
terms of student learning and achievement (Kaw, Besterfield & Eison, 2005; Craig,
Joines, Miller, C., Miller, T., Raubenheimer, Rouskas, Silverberg & Wiebe, 2008; Castles,
Lohani & Kachroo, 2009; Kaw & Garapati, 2010).
2.9 Outcomes and Key Performance Indicators
2.9.1 Outcomes
‘Outcomes’ are described by Vlasceanu, Grunberg and Parlea (2007, p.63) as
“Anticipated or achieved results of programs or the accomplishment of institutional
objectives, as demonstrated by a wide range of indicators such as student knowledge,
cognitive skills, and attitudes”. Vlasceanu et al. (2007, p.63) further state that
“Outcomes are direct results of the instructional program, planned in terms of learner
growth in all areas”. The term ‘student learning outcomes’ was defined by Vlasceanu, et
54
al. (2007, p.64) as, “Statements of what a learner is expected to know, understand, and
be able to demonstrate after completion of a process of learning as well as the specific
intellectual and practical skills gained and demonstrated by the successful completion of
a unit, course, or program”.
2.9.1.1 ECSA’s View on Outcomes
Hanrahan (2007, p.51) explains from an ECSA point of view the outcomes which must
be achieved in engineering education:
The Stage 2 outcomes that demonstrate that a person has the competence to fulfil the
purpose fall into five groups as indicated below:
Knowledge-based engineering problem solving, including the analysis and
identification of problems, synthesis of solutions and the use of
fundamental, specialist and contextual knowledge;
Management of engineering activities, focussing on people, resources,
finances, processes, teamwork, leadership and communication;
Recognising and addressing the effects of engineering activities; meeting
legal and regulatory requirements; protecting the health and safety of
persons in the course of engineering activities; and conducting
engineering activities ethically;

55
Exercising sound judgement in the course of engineering activities and
being responsible for making decisions;
The ability to undertake professional development activities sufficient to
maintain and extend competence.
2.9.1.2 SAQA’s View on Outcomes
The SAQA document on National Diploma Mechanical Engineering (SAQA, Registered
Qualifications, 2010) states the following exit level outcomes:
Apply mechanical engineering principles to diagnose and solve
engineering problems;
Demonstrate mechanical engineering knowledge and skills in one or more
specialised areas;
Engage in mechanical engineering design work individually and as part of
a team;
Communicate effectively in a technological environment;
Apply management principles in an engineering environment.
The SAQA document (SAQA, Registered Qualifications, 2010) states the following under
critical level outcomes:
Identify and solve problems in which responses show that responsible

56
decisions, using critical and creative thinking, have been made;
Collect, organize, analyse and critically evaluate information;
Work effectively with others as a member of a team, group, organization
or community;
Organize and manage oneself and one’s activities responsibly and
effectively;
Communicate effectively, using visual, mathematical and/or language
skills in oral or written presentation;
Develop entrepreneurial and career opportunities;
Use science and technology effectively and critically, showing
responsibility towards the environment and health of others;
Demonstrate an understanding of the world as a set of related systems by
recognizing that problem-solving in the field of explosives does not exist in
isolation;
Participate as responsible citizens in the life of local, national and global
communities;
Be culturally sensitive across a range of social contexts.
From the above list of outcomes, the following outcomes apply to MTHE 2 and at this
level students are not required to demonstrate their ability in the remaining exit level
outcomes.
57
Exit level outcomes:
Apply mechanical engineering principles to diagnose and solve engineering
problems;
Demonstrate mechanical engineering knowledge and skills in one or more
specialised areas;
Engage in mechanical engineering design work individually and as part of a
team;
Communicate effectively in a technological environment.
Critical cross-field outcomes (SAQA, Registered Qualifications, 2010):
Identify and solve problems in which responses show that responsible decisions,
using critical and creative thinking, have been made;
Collect, organize, analyse and critically evaluate information;
Work effectively with others as a member of a team, group, organization or
community;
Organize and manage oneself and one’s activities responsibly and effectively;
Communicate effectively, using visual, mathematical and/or language skills in
oral or written presentation.

58
2.9.1.3 Exit Level Outcomes of National Diploma Mechanical Engineering
at WSU
The programs’ exit level outcomes are aimed at providing graduates with the following
attributes, skills, and competencies:
Ability to apply Mechanical Engineering principles to systematically
diagnose and solve defined Mechanical Engineering problems;
Demonstrate the application of knowledge and the requisite skills in a
Mechanical Engineering environment;
Perform procedural design of well-defined elements/components to meet
desired needs within applicable standards, codes of practice and
legislation;
Communicate technical, supervisory and general management information
effectively, both orally and in writing, using appropriate language,
structure, style and graphical support;
Acquire knowledge of self-management principles and concepts for
managing projects and/or operations within the Mechanical Engineering
environment (WSU Faculty Prospectus, 2010, pp.113-114).
2.9.2 Key Performance Indicators
‘Performance indicators’ used in higher educational institutions are defined by
59
Vlasceanu, et al. (2007, p.60) as, “A range of statistical parameters representing a
measure of the extent to which a higher education institution or a program is
performing in a certain quality dimension”. Vlasceanu et al. (2007, p.60) further explain
some examples, “… of frequently used performance indicators, covering various
institutional activities, include the number of applications per place, the entry scores of
candidates, the staff workload, the employability of graduates, research grants and
contracts, the number of articles or studies published, the staff/student ratio…”
According to Gaither, Nedwek & Neal (1994, p.1), “... the main advantage of such
performance indicator systems is their usefulness as points of reference for comparing
quality or performance against peers over time, or achievement against a desired
objective”.
A list of examples of measures being considered by the Scottish Higher Education
Institutions when developing impact and KPIs are presented by Schofield (2007, p.15):
In relation to retention: performance data collected over time on the
retention rates of students admitted through different routes and
receiving different kinds of preparatory support, thus enabling decisions to
be made about what preparation for study works best, and why;
In relation to employability: performance data collected over time on key
employability skills achieved by students on graduation, correlated with
subsequent employer satisfaction;

60
In relation to international students: performance data collected over time
on the impact of enhanced support services (including preparation for
study) for international students (by category and subject), and the
correlation with subsequent academic performance;
In relation to staff: building in questions on the impact of enhancement
activities in regular staff satisfaction surveys, thus enabling trend data to
be determined, and taking institutional action on the results.
The Australian Catholic University (ACU) summarised the purpose of their KPIs as
below:
To improve the quality of learning and teaching across all programs of the
University;
To enhance assessment and evaluation processes and outcomes;
To enhance the ACU student experience (ACU Learning and Teaching Plan
2009-2011, p.2).
In the Strategic Planning and Resourcing report of the University of Johannesburg (UJ),
KPIs are expected to measure the extent to which 10 goals (outcomes) have been
achieved. Some of the goals (outcomes) more relevant to teaching and learning are as
follows:
To promote and sustain excellence in teaching and learning by quality

61
assurance practices and actively developing and implementing innovative
teaching, learning and assessment strategies;
To establish the University of Johannesburg among the top research
universities in the country in terms of nationally and internationally
accepted research criteria;
To promote the holistic development of the student in preparation for the
world of work and responsible citizenship (UJ Strategic Planning and
Resourcing, 2007, pp.10-13).
KPI must therefore measure to what extent the desired outcomes have been achieved.
KPI can be used as a management tool to measure the institutions performance and
also on the academic side of higher education institutions, as a tool to measure the
effectiveness of teaching practices. KPIs in this research were developed based on the
selected outcomes for MTHE 2.
2.10 Summary
Social constructivism as the underpinning theory and its use in higher education was
explained. Inductive and deductive teaching and learning was discussed and their
differences were pointed out. The role that individual learning styles play in teaching
and learning approaches, were also explained. The influence of the active teaching and
learning methods, in particular EBL and GEBL on students’ development were
discussed. There was also a look at what effective teaching and learning meant and

62
how this can be achieved and measured. This was done to show the compatibility
between active teaching and learning methods and the components of effective
teaching and learning.
A description of significant learning was also given and all the components which
constitute it were addressed, together with active teaching and learning. The terms
‘deep’ and ‘surface’ learning were defined and the results and students’ aims with each
approach were explained. The importance of the movement through Kolb’s learning
cycle during a course offering to enhance student learning and to address the different
learning styles were also discussed, as well as the use of Bloom’s taxonomy for
improvement of engineering education.
SAQA and ECSA’s views on outcomes for NDME were discussed. From the SAQA listed
outcomes, those applicable to MTHE 2 were selected. The exit level outcomes listed in
WSU prospectus for NDME as well as the exit level and critical level outcomes for the
NDME as listed by SAQA were presented. The exit level outcomes listed in WSU
prospectus for NDME were presented. KPIs were formulated based on these selected
outcomes in chapter three.
The literature review has set the scene to view GEBL as an active learning approach
within the constructivist framework in general and social constructivist framework in
particular. GEBL also has all the ingredients for deep learning to occur which translates

63
into significant learning. Furthermore, the KPI’s within the context of engineering
education in general and the South African context in particular have been delineated in
this chapter.

64
CHAPTER 3
METHODOLOGY
This chapter deals with the methodology and related aspects such as the modes of
enquiry, population and sample, ethical considerations, reliability and validity, and the
methods of data analysis. The insider-outsider position to interviews will be discussed
and the selection of a specific position will be given with reasons.
3.1 Action Research
Bryman (1989, p.149) states that “Action research can reasonably be conceptualized as
a research design which entails a particular framework within which the relationship
between the researcher and the subject takes place”. In this particular study the
relationship was between the researcher as the lecturer and the students taking MTHE
2.
Reason and Bradbury (2008, p.4) define action research as:
... a participatory process concerned with developing practical knowing in the
pursuit of worthwhile human purposes. It seeks to bring together action and

65
reflection, theory and practice, in participation with others, in the pursuit of
practical solutions to issues of pressing concern to people, and more
generally the flourishing of individual persons and their communities.
Avison, Lau, Myers, and Nielsen (1999, pp.95-96) state that action research can be
categorised in four different types:
• Action research focusing on change and reflection;
• Action science trying to resolve conflicts between espoused and applied theories;
• Participatory action research emphasizing participant collaboration;
• Action learning for programmed instruction and experiential learning.
This study used the third type which was suitable to test the impact of the intervention
and to reflect on, and to take the necessary remedial action. It was also found suitable
to make changes for future teaching and learning approaches.
3.1.1 Participatory Action Research
This study was Participatory Action Research (PAR) with the researcher (change agent)
being part of this study through his academic responsibility for MTHE 2. The purpose of
this study was to develop an intervention and to implement that particular intervention.
The intervention that was chosen as a departure point was GEBL. The intervention was
then reviewed and evaluated to improve the manner in which each module of MTHE 2

66
was presented to students. The focus was to empower students, measure students’
performance not just in terms of academic scores but also in the development of
multiple skills necessary in an engineering career. The achievement of outcomes in
MTHE 2 was also measured to determine the extent to which this intervention assisted
in achieving these outcomes. Huizer (1997, p.2) states that “Participatory action
research mostly had as a purpose to find a solution to problems and conflicts”.
The aims of PAR are explained by Reason (1980, p.336) as follows:
... One aim is to produce knowledge and action directly useful to a group of
people through research, through adult-education, and through socio-political
action. The second aim is to empower people at a second and deeper level
through the process of constructing and using their own knowledge: they "see
through" the ways in which the establishment monopolizes the production and
use of knowledge for the benefit of its members.
The students were given feedback at the end of each assessment to highlight problem
areas and to make them aware of the areas in which they needed to spend more time
on. They were also encouraged to use what they have learnt from group members (e.g.
different approaches to problem solving) and to apply it during individual sessions. This
approach gave immediate feedback and allowed for sufficient time for corrective action.
67
3.2 Modes of Enquiry
This study made use of both qualitative and quantitative modes of enquiry to measure
the correlations between the quantitative data collected through assessments and
qualitative data collected with interviews. This also determined whether the data were
in support of each other and whether it was consistent. A discussion of qualitative and
quantitative modes of enquiry will be given to highlight the type of data that were
collected by means of the various instruments.
3.2.1 Qualitative mode of enquiry
According to Creswell (2003, p.179), “… qualitative enquiry employs different
knowledge claims, strategies of enquiry, and methods of data collection and analysis”.
Qualitative research involves people, their opinion, perceptions and experiences of a
particular event. There is no fixed method which can be used for all studies and
whatever the method used by one researcher may be accepted, partly accepted or
completely changed by another. To make sense of the data collected during a study
using the process of analysis may be the only thing that qualitative researchers are in
agreement with (Tesch, 1990, p.4). The 20 students who took part in this research
were interviewed individually to gather qualitative data regarding their experiences
during the intervention.
Kirk and Miller (1986, p.9) defined qualitative research as, “... a particular tradition in

68
social science that fundamentally depends on watching people in their own territory and
interacting with them in their own language, on their own terms”. Interviews were done
with the students at the end of the semester, to find out from them what their views
were regarding GEBL and how it impacted on their learning and skills development.
3.2.2 Quantitative mode of enquiry
Quantitative enquiry is in the form of numbers as opposed to qualitative enquiry which
is in the form of words (Punch, 2005, p.3). According to Burns and Grove (2004, p.21):
... Quantitative research is formal, objective, systematic process in which
numerical data are used to obtain information about the world. This research
method is used to describe variables, examine relationships among variables and
determine cause-and-effect interactions between variables.
Formative assessments, an oral test, a summative assessment and KPIs were used to
gather quantitative data from the students. These quantitative data were then analysed
to determine to what extent the intervention negatively or positively affected the
students’ performance in terms of assessment scores and to what extent the outcomes
for the course were achieved.

69
3.3 Population and Sample
The population and sample of this research study are discussed below. The process
followed to select the sample is also explained.
3.3.1 Population
The population for this study were all the students enrolled for NDME in SA. The
accessible population were 40 students who enrolled for the NDME at WSU Chiselhurst
site.
3.3.2 Sample
Marshall and Rossman (2006, p.64) state that a “... sample selection should be planned
around practical issues, such as the researcher’s comfort level, ability to fit into some
role during participant observation, and access to a range of subgroups and activities”.
The sample drawn from this population was 20 students who voluntarily agreed to take
part in this study.
3.4 Ethical Considerations
With regard to ethics in qualitative research, the research should avoid harming
participants, which includes not invading their privacy and also not deceiving them
about the research aims (Flick, 2006, p.46). The participants in this research were

70
properly informed about the purpose of the research, the methods of instructions which
they would be subjected to and the need for the voluntary participation of individuals.
With regard to ethics when performing a survey the following three important points as
suggested by Druckman (2005, p.160) were considered:
The survey should do no harm;
The information must be kept confidential;
The survey should not waste but rather respect the time of the respondents which
they set aside for someone else’s research.
All data gathered from participants for this study were treated with the strictest
confidence. WSU Mechanical Engineering classes are predominantly homogenous. The
interventions were aimed at benefiting all students.
3.5 Instrumentation
The instruments used to gather data are now discussed.
3.5.1 Instrument Construction
The instruments will be discussed in the following sequence: firstly the formative
assessments (written and oral), secondly the summative (written) assessments, thirdly
the structured questionnaire, fourthly the KPIs and a finally the open-ended interviews.

71
3.5.1.1 Formative Assessments
Three formative assessments (see Appendices 3-6) were done on six of the seven
modules in the syllabus (written tests: the duration of tests 1 and 1b were 90 minutes,
test 2 was 90 minutes and test 3 was 2 hours). These tests were designed to test the
students’ ability to interpret a problem, analyse it and develop a solution following a
certain number of steps. The students were also required to explain their understanding
of certain aspects of the syllabus and in some questions the students had to give a brief
explanation of what they understood. They also had to discuss the significance of
answers to certain questions from safety and engineering point of views. This was done
in order to determine the students’ conceptual knowledge of the course and the
application thereof. So the focus was not just on their ability to perform analytical
procedures.
Most of the questions required students to explain their understanding of what they
were to calculate before actually performing the calculation. The reason for presenting
the questions in this manner was to find out whether students actually knew what they
were doing. The aim was to teach them not just to do something without knowing the
reason or its significance. This also tested their conceptual knowledge regarding a
specific section of the work. Here the student could not obtain any mark if he/she could
not explain what was expected. These tests were allocated an ‘analysis’ score as well as
an ‘analytical’ score. The analysis scores depended on the students’ ability to recall
facts, to explain certain concepts and to give an accurate description of the processes

72
and procedures. The analysis scores were also influenced by the accuracy of
accompanying diagrams. The analytical scores were determined by the students’ ability
to analyse a problem accurately and to indicate step-by-step the process which was
followed to solve it. Structuring the questions in this way, the researcher was able to
determine whether the student understood the question and from that, whether the
student was able to identify the appropriate process or processes and then, by means
of a diagram whether the student could demonstrate what the particular process or
processes would be.
3.5.1.2 Oral Assessment
An oral test (see Appendix 7) was on the entire syllabus and the duration of each oral
test was 40 minutes. The oral test was constructed to determine the students’
understanding of certain concepts, theories and principles. They were also tested on
the functions of certain components and plants in Thermodynamics and their
application in engineering. Through the oral assessments, the understanding of
concepts by each student, his/her overall conceptual knowledge and problem areas
could be identified. The student was placed in the hot seat and could only rely on
his/her knowledge in the particular area under discussion. Although the oral tests were
very time-consuming, much was learnt from individual interaction through this method.
Joughin (2003, p.14) emphasised that literature on oral assessment is in agreement
that knowledge and understanding, applied problem solving ability, personal
competency and personal qualities can be tested with oral assessment.

73
3.5.1.3 Summative Assessment
A summative assessment (see Appendix 8) was written on the entire syllabus and the
examination duration was 3 hours. The examination followed the same structure as the
formative assessments which allowed for the testing of factual and conceptual
knowledge (analysis of questions, synthesising of data, evaluation of processes) on the
entire syllabus and the ability to perform analytical procedures.
3.5.1.4 Structured Questionnaire
A structured questionnaire (see Appendix 1) was given to the students and its duration
was 30 minutes. The questionnaire was designed to determine the students’ experience
of the GEBL approach to MTHE 2. The students could indicate what they had enjoyed
and what they found of value in terms of their learning and understanding of the
course. They also had the opportunity to indicate which aspects of the intervention they
found less helpful and where changes could be made to improve the process as well as
their rating of certain aspects of it.
3.5.1.5 Key Performance Indicators
KPIs (see Appendices 9-11) were designed to test the extent to which the outcomes
specified for this course had been achieved and to identify the poor performances in
certain areas. The course presentations in those areas were then revisited and decisions
were then made to alter the method of presentation in an attempt to make the learning

74
process more effective. This served as a gauge of how effective the teaching and
learning method of the course was.
3.5.1.6 Open-ended Interviews
Interviews (see Appendix 13) with duration of 20-30 minutes for each interview were
designed to gather qualitative data from the students’ experiences and on how they
experienced the process, what worked for them and why, and what did not work for
them and reasons for them. The interviews were also useful to find out which skills the
students acquired from the process and how they applied those skills in new situations.
3.6 Pilot Study
A pilot study which was done in 2009 with the MTHE 2 group of students to establish
the need for the study. These students were exposed to the GEBL intervention for one
semester. The GEBL intervention process was the same as the one described in this
research, however no data were recorded during this intervention to determine its
impact on students’ ability to recall factual knowledge or to demonstrate conceptual
understanding of MTHE 2 concepts, processes and procedures. Only a structured
questionnaire was given to them to find out what their opinions were regarding GEBL.
From the data collected there were positive responses regarding the need for such an
intervention where students could more actively get involved in the learning process
(e.g. group sessions) to assist them in understanding engineering courses better.

75
3.7 Instrument Reliability and Validity
This section will first describe issues around validity and reliability for quantitative data.
The trustworthiness of the qualitative data will be discussed and the measures taken to
ensure the trustworthiness.
3.7.1 Reliability
According to Carmines and Zeller (1979, p.12), “... tendency toward consistency found
in repeated measurements of the same phenomenon is referred to as reliability”. “The
reliability of an instrument is the degree to which that instrument produces the
equivalent results for repeated trials” (Bless, Higson-Smith & Kagee, 2006, p.150).
A reliability test was done of the instruments used in this study as a measure of internal
consistency. Cronbach’s Alpha is a statistical test to determine the reliability of the
instruments used in a research study (Cronbach, 1951, pp.297-334). For written
assessments the value was = 0.88 while it was 0.80 for the KPIs.
3.7.2 Trustworthiness (Qualitative Rigour)
Trustworthiness of qualitative studies refers to the extent to which the credibility,
transferability, dependability and confirmability of the research can be ensured (Lincoln
& Guba, 1985, p.301). Activities increasing the probability that credible finding will be
produced are prolonged engagement, persistent observation and triangulation (Lincoln
76
& Guba, 1985, p.301). In so far as addressing the credibility of this study, the
researcher was personally involved with the sample twice a week for 120 minute over a
period of 13 weeks. During these contact sessions constant observations and
interactions took place to guide and assist the groups during problem solving sessions
on each module of the syllabus. The quantitative assessments were all supported with
detailed memoranda, indicating the mark allocation clearly which would ensure
consistency with regard to scores. Quantitative and qualitative data were compared to
look for similarities and differences to ensure a high degree of credibility.
According to Ary et al. (2008, p.501), in addressing the transferability, “The researcher
must strive to provide accurate, detailed, and complete descriptions of the context and
participants to assist the reader in determining transferability”. The sample from the
accessible population was 20 students registered for NMDE MTHE 2 at WSU,
Chiselhurst. In section 3.9 of this chapter the researcher gave a detailed description of
how the intervention was carried out and how the researcher was involved in the study.
Dependability was addressed by the construction of an interview schedule with clear
statements as well as follow-up statements/questions done by a person who served as
an insider-outsider (this is explained in section 3.8). Participants were given the
opportunity to withdraw at any time and were taking part purely out of their own free
will. Data transcriptions were also made available to participants to check the accuracy
of what they have said. To address confirmability an in-depth methodological
description of the research process and data collection procedure were given.

77
Confirmability can be achieved by “... in-depth methodological description to allow
integrity of research results to be scrutinised” (Shenton, 2004, p.73).
3.7.3 Validity
With reference to validity, Carmines and Zeller (1979, p.17) state that “... validity, then,
is evidenced by the degree that a particular indicator measures what it is supposed to
measure rather than reflecting some other phenomenon”. On the issue of validity Cano
(2000, p.4) states that it, “... measures what you said you would be measuring or
explaining. It therefore deals with the appropriateness of the method to the research
question”. Ary, Jacobs, Razavieh and Sorensen (2008, p.225) explain that “... validity
was defined as the extent to which an instrument measured what it claimed to
measure”.
The researcher has taken the necessary steps with the development of the instruments
to ensure their validity. Assessment criteria and mark allocations were clearly indicated
to ensure that the instruments measured what they claimed to.
There are also other terms associated with validity such as content or face validity,
internal validity and construct validity. As stated by Mohammadi (2008, p.343),
“Content validity, also called 'face validity', has to do with items seeming to measure
what they claim to”. Instruments were designed to collect data on the entire MTHE 2
syllabus.

78
According to Merriam (1995, p.53), “Internal validity asks the question: how congruent
are one’s finding with reality?” Roe and Just (2009, p.3) define internal validity, “... as
the ability of a researcher to argue that observed correlations are causal”. The sample
for the purpose of this study constituted students whom voluntarily agreed to take part.
The sample also represented 50% of the accessible population. This research was
action research with only one group of students undergoing GEBL.
According to Thiѐtart (2001, p.198) construct validity is a measure of, “... whether the
variables used to measure the phenomenon being studied are a good representation of
it”. Detailed memorandums with mark allocations were developed for each formative
and summative assessment. The questionnaire had a Likert-type scale with five
different ratings.
Before the questionnaire was handed out to the students it was given to a professor in
the field who analysed its suitability in terms of the research questions. Feedback from
the professor was positive in terms of the suitability of the questionnaire and for
ensuring its validity.
3.7.4 Triangulation
Triangulation was made use of used integrate and corroborate the qualitative data from
the interviews and the quantitative data from the questionnaires and assessments.
“Triangulation can, under certain assumptions, be argued to unite research

79
contributions in such a way as to transcend the use of specific methods in a disciplinary
sense” (Downward & Mearman, 2006, p.2). Both the formative and summative
assessments were used during the triangulation process. “... it is important for
engineering education classroom researchers to consider other sources for
triangulation, such as scores on specific assignments or test questions, concept
inventories or focus groups that complement the principal measurement procedure, and
retention or passing rates in subsequent courses” (Borrego, Douglas & Amelink, 2009,
p.62).
3.8 Insider Outsider Position to Interviews
To avoid the research bias, the insider/outsider position for interviewing the students
was decided upon. If interviews were conducted by the researcher (MTHE 2 lecturer)
there would have been an authority disposition. This could have led to students giving
answers out of fear of being judged. During the semester, a certain relationship
developed between the researcher and the students which might have affected their
responses. They might have felt that the researcher wanted to hear certain favourable
answers (whether true or false), or that the researcher would have liked to hear
positive responses with regard to the intervention, which might have led to specific
questions and follow-up questions being formulated to achieve this goal.
The insider position – a disadvantage of the research being conducted by someone who
qualifies as an insider is that he/she does not maintain enough distance and objectivity

80
necessary for research validity (Brannick & Coghlan, 2007, p.60). An advantage when
conducting interviews is that the, “... insider status may enhance the quality and
effectiveness of qualitative interviews” (Hodkinson, 2005, p.138). This however did not
apply in this context, because the interviewer was not part of the research and
therefore had no reason not to be objective in his/her behaviour.
The interviews were conducted by a part time laboratory assistant (former student)
who was busy with his B.Tech in Mechanical Engineering but had already passed
Thermodynamics 4. The interviewer was therefore well equipped in terms of
understanding MTHE 2 content. This also created a more relaxed atmosphere for the
students being interviewed by a former student and someone from the same ethnic
group. In this context the interviewer was an insider and this relationship allowed the
interviewees to behave naturally and relaxed and highly disposed to give honest
responses. Another contribution to the insider stance was that there was also no major
difference in authority.
The outsider position – allowed for interviews to be conducted without preconceptions
or any vested interest (Ritchie, Zwi, Blignault, Bunde-Birouste & Silove, 2009, p.108).
According to Tinker and Armstrong (2008, p.58), “... outsider status could potentially
limit a researcher’s understanding of the material but it can also improve data analysis
by allowing him or her to maintain a sense of critical distance from the topic of
investigation”. Training was therefore done to prepare the interviewer for conducting

81
interviews and how to pose follow-up questions. Not being part of the MTHE2 group
who underwent the intervention allowed the interviewer to ask questions without
predicting what the responses could be. The interviewer’s interpretation of the
responses was from a neutral position and follow-up questions were guided by the type
of response from a particular question. In this context the interviewer was an outsider.
This finally resulted in interviews being conducted by someone who qualified as an
insider as well as an outsider giving more validity to the data collected.
3.9 Intervention Process
A detailed explanation of the intervention process is given below:
Lecturing was done on the first module, to introduce basic concepts and to explain the
outcomes at the end of the module to the students. An example was done by the
lecturer by writing the information given in the problem on the board and then solving
it the way he understood it and with the method most obvious to him. Most students
were completely lost during this exercise. The students were then given a problem/s to
solve on their own and the lecturer was available to assist those experiencing difficulty.
The first formative assessment (see Appendices 3 & 4) was done on module one and
the results were analysed. KPIs (see Appendices 9-11) were developed to measure the
achievement of the course outcomes on the first module (these KPIs are discussed
later). Lecturing was done on the rest of the modules with GEBL being used in problem
solving exercises. An introduction to the new course material was done to ensure that

82
the students could connect with what was about to be discussed. The introduction
normally took between 30-45 minutes of the 120 minute session. This enabled the
students to follow the explanations and discussions without being lost. By laying this
foundation, the students could then build further on it by reading reference material,
and discussing it with peers. The students were also given a booklet (see Appendix 12)
with an enquiry-based learning worked-out example on each module of the syllabus. In
this example, a problem was given and certain unknowns had to be calculated. The
procedure was then to analyse the problem by asking questions on and about the
problem. Answers to these questions would then make the process more
understandable or would lead to other questions. Following-up on all the new questions
would eventually give answers to all the unknown information in the problem. This
would result in the student understanding the problem, as well as what is required to
be determined and the steps to follow to find a solution. The GEBL flow process is
presented below:

83
Figure 3.1: GEBL intervention flow process
The purpose of the worked-out examples was not only to demonstrate the enquiry-
based approach of problem solving to the students, but also for each student who
worked through these examples to learn more about a specific topic and to show and
assist him/her to develop the ability to pose well-formulated questions and follow-up
1. Lecturer introduced basic
concepts, principles and
theories in MTHE 2
Students listened and took
notes
3. Lecturer presented groups with a
new problem to solve using GEBL
approach
Students were given a few minutes
to formulate three to five most
relevant questions in their groups
2. Lecturer did an example with the
class applying GEBL principles
Students took part in formulating
questions to analyse the problem
5. Students worked in groups and
analysed the problem with
questions and follow-up questions
Lecturer acted as a facilitator and
moved between the groups to give
assistance
4. Lecturer received feedback
from all the groups on the
questions they had formulated
and gave assistance to those
groups with difficulties
6. Lecturer compared different
approaches to a solution and
rectified misunderstandings

84
questions. These questions were goal directed and were formulated to take the student
through the analysis process as fast and effectively as possible.
A second formative assessment was done (see Appendix 5). The results were analysed
and problem areas were identified. Corrective action was taken to address these
problems. Because these modules were so vastly different, each module required a
unique approach in terms of question selection. Continuous assistance had to be given
to the students in their attempt to identify, select and formulate questions for problems
in each of the modules. KPIs were used again to measure the extent to which the
outcomes had been achieved. A third formative assessment was done (see Appendix 6).
The results were analysed and problem areas were identified. Corrective action was
taken to address these problems. KPIs were used to test the achievement of the
outcomes. Finally an oral assessment (see Appendix 7) was done on the entire syllabus.
The purposes of the oral assessment were to hear from the students on their
understanding and explanations of various MTHE 2 processes and procedures, to find
out whether they actually knew what they were doing when they performed certain
calculations and what the engineering significance of the item/factor was. This detail
was not always clear from written assessments. KPIs formulated to test the
achievement of certain abilities as required by the various outcomes were applied to the
oral tests performances. A summative assessment (see Appendix 8) was written on the
entire syllabus. KPIs were used to determine the overall achievement of the course
outcomes with the final examination. At the end of the course, a structured

85
questionnaire (see Appendix 1) was handed-out to gather quantitative data from group.
3.10 KPIs for this Study
Based on the outcomes and KPIs referred to in chapter two, the following KPIs were
formulated by the researcher based on the selected outcomes listed below:
1. Students’ ability to apply MTHE 2 principles to analyse and solve problems
accurately:
KPI ‘1’ measured the extent to which the student could recall information (facts,
theories, formulas), the student’s skill to analyse a problem and develop a solution
using his/her subject (factual and conceptual) knowledge.
2. Students’ ability to explain/discuss the operation of a system, components or
parts of a Thermodynamics system, component function in the overall plant
which it forms part of and treatment and maintenance procedures of specific
components:
KPI ‘2’ measured the extent to which the student understood the course content
(conceptual knowledge), how Thermodynamic systems operated, what the function of
each component in a plant was, which factors affected the plant operation, how and
why treatment is done and what the result would have been if the treatment was not

86
done effectively.
3. Students’ ability to perform technical discussions on MTHE 2 topics, to
communicate fluently and explain and demonstrate concepts effectively in MTHE
2:
KPI ‘3’ measured the extent to which can the student carried out discussions on course
related topics, the extent to which the student communicated fluently with his/her
peers and whether a student could do a demonstration or perform and explain a
specific concept or theory.
4. Students’ ability to analyse a complex problem and produce a solution, taking
into account crucial factors in a systematic approach towards the solution:
KPI ‘4’ measured the extent to which the student could analyse complex problems
where certain factors were crucial and without which an optimum solution could not be
achieved. Here, the student also needed to demonstrate his/her ability to develop the
solution systematically.
The three formative assessments and the final summative assessment were designed to
test the student’s ability to analyse a problem, explain the information given and what
needed to be determined, reflect the process on a detailed diagram and to decide on an

87
approach to find the solution. KPI numbers ‘1’ and ‘4’ were used to measure the extent
to which the outcomes for these activities had been achieved. The final oral test was
designed to test the student’s ability to interpret a question, explain his/her
understanding of the problem; explain how systems, components and engineering
processes function and their purposes; and discuss the effects and influences on output
and performance when certain variables were altered. KPI numbers ‘2’ and ‘3’ were
used to measure the extent to which the outcomes for these activities were met.
The KPIs used a scale of 1 to 5 with full and half mark allocation as indicated in
Appendices 9-11. It is also important that the reader examines these KPIs in
conjunction with relevant outcomes for clarity and relevance.
3.11 Procedures
For the quantitative data collection assessment, duration varied from 30 minutes for the
structured questionnaire to 3 hours for the summative assessment. For qualitative data
the interviews took approximately 30 minute per interview. KPIs were then used to
evaluate the scores for each category (theoretical: content knowledge, explanation
understanding and discussions; and analytical: knowledge to recall formulas, substitute
values and calculate answers) to determine the overall achievement of the course
outcomes. The structured questionnaire made use of a Likert-type scale with five
different ratings. The total student responses per rating were then determined and
expressed as a percentage of the total number of students. The students’ score in the

88
formative and summative assessments were also expressed as a percentage of the total
for that particular component (i.e. ability to analyse, ability to analytically solve and
overall). The students’ interview responses were then compared to the quantitative
scores to determine whether what has been stated by the student actually occurred.
Individual as well as overall comparisons were made.
3.12 Data Analysis and Interpretation
Data were collected over a period of six months from the research sample as follows:
Formative assessments (three written tests) – quantitative data
Oral test on entire syllabus – quantitative data
Summative assessment (written examination) – quantitative data
KPIs – quantitative data
Questionnaires – quantitative data
Interviews – qualitative data
Predictive Analysis Software (PASW) programme was used to evaluate the quantitative
data collected during this research and N-Vivo was used for the qualitative data. A
statistician was also consulted for assistance in the accurate interpretation of data.
The data were analysed to find out to what extent the research questions had been
answered. This analysis also provided information which was used to test reliability and

89
validity of this study.
3.13 Summary
Action research created the scenario for the researcher to get involved with the
intervention process and to be part of the development process, constantly giving
assistance and support during the group sessions but also allowing the students’ to
drive their own learning processes. This design allowed for rigorous testing of students’
conceptual understanding and problems solving abilities. The instruments for this study
were the semester tests and final examination with the addition of an oral test,
structured questionnaire, KPIs and interviews. KPIs based on the outcomes for MTHE 2
were formulated. All data gathered from these instruments were quantitative and only
the data collected from the interviews were qualitative. Both types of data were used to
ensure reliability of the study.

90
CHAPTER 4
DATA ANALYSIS AND INTERPRETATION
This chapter presents the analysed data and the interpretation thereof. The
demographics of the study will first be presented, then the qualitative data, followed by
quantitative data on formative and summative assessments, quantitative data from KPIs
and finally a summary of the data presented.
4.1 Demographics of the Study
The sample (n = 20) consisted of:
Frequency Gender Age
1 Female 18
1 Male 19
5 Male 20
1 Female 20
3 Female 21
2 Male 21
3 Male 22
1 Female 22
1 Male 23
1 Female 24
1 Male 26
Table 4.1: Demographic data
The sample comprised 13 males and seven females. While 19 were Xhosa speaking one
was English speaking. Students’ age ranged between 18 and 26 years (M = 21.1 years,
SD = 1.78)

91
4.2 Qualitative Data Analysis, Interpretation and Discussion
This section focuses on the qualitative data gathered during the interviews (see
Appendices 2 & 13). These interviews were done with students to find out more about
what they had learnt during the intervention and to determine what they found useful
in GEBL and whether it did assist them in their learning.
From the Interview Questions:
Students’ responses (see Appendix 13) are included (verbatim) to indicate to the reader
what their opinion and experience was with regard to GEBL and their responses to the
interview questions (see Appendix 2).
The interview questions were categorised under the following headings with emerging
themes listed under each:
Group sessions
Enquiry Based Learning (EBL)
Communication
Active learning
Notes
Problem analysis
Understanding

92
Teaching atmosphere
4.2.1 Addressing the First and Second Research Question
With reference to the first and second research questions ‘What would be the effect of
a guided enquiry-based learning (GEBL) approach on mechanical engineering students’
factual recall of MTHE 2 concepts?’ and ‘What would be the effect of a guided enquiry-
based learning (GEBL) approach on mechanical engineering students’ conceptual
understanding of MTHE 2 concepts, principles and applications?’, the following themes
emerged and the students’ responses are given under each theme beginning with the
researcher’s summary which is followed by quotes from selected students to illustrate at
least one example of response.
The following themes emerged from the heading, ‘group sessions’ and ‘active learning’:
4.2.1.1 Group sessions helped understanding of other courses
Many students found the group sessions helpful and effective in learning new work to
such an extent that they then adopted the same approach in other courses too. During
group sessions, students exchanged views and discussions took place at a level that
most students could understand and follow. Understanding the work enabled them to
solve problems in groups and also on their own. The gap between students’ reference
frameworks is much smaller than between the lecturer’s reference framework and that
of the students. The gap between students’ and lecturers’ reference frameworks can

93
lead to departure points of new work being introduced to the students that may be
above their level of understanding and as a result students can get lost from the word
go. In this regard, student A’s sentiments epitomize the students’ views when he said:
“Yo! Very much so! Hence I am saying that even in the other courses I am also
using it and it is really working for me. Last semester I did the same approach
and it is still working, you see”.
4.2.1.2 Group sessions encouraged preparation and participation
Once a section of work was covered in class, the students were given homework to do
to prepare for the following lecture. Most students indicated that they did their
homework so that they could participate and explain to their peers how they had
tackled a specific problem. They also stated that if they came unprepared they would
be left behind by the others.
GEBL differs from the traditional approach in the sense that more is expected from the
students attending classes. During the group sessions students had to deliver, produce
evidence of what they did, how they approached certain questions or how and why
their approach differed from those of others. Students indicated that with other
courses, not much was really expected from them from one session to another. So
whether did his/her homework and prepared for the next class was entirely up to the

94
student-nothing was there to encourage them other than just the normal talk and
chalk. In this regard, student B’s sentiments epitomize the students’ views when he
said:
“Because I know that I have to work at home, I have to do problems then I can
explain when with the groupmates, so I have to explain what I understand and
they will gain something from me”.
In this regard, student C’s sentiments epitomize the students’ views when he said:
“Unlike the method that we are using in other courses, you can’t actually go to
the class if you didn’t prepare because there is nothing much expected from you,
all you do is just staying in the class and listening to the lecturer”.
In this regard, student D’s sentiments epitomize the students’ views when he said:
“... so I have to come prepared so that I can’t be left behind so that I can work
together’.
The fact that they actually understood the work inspired students to work harder and to
learn more about the course – this gave them a sense of belonging and motivated them
to do more than just taking notes which was normally the case in other courses. In this

95
regard, student E’s sentiments epitomize the students’ views when she said:
“Ja it actually involves you as a student, you know you want to do this thing
cause you understand it and you want to learn now. It gives you that positive
drive – now I want to study I want to learn not just sit in the classroom and
taking notes...”
Active participation is the main reason for the group sessions. This forced the students
to concentrate and apply their minds to what was being discussed. Sitting in a class did
not necessarily mean that the student was concentrating on what is being presented by
the lecturer. Being part of a discussion, they had to concentrate, which made these
sessions much more effective. In this regard, student I’s sentiments epitomize the
students’ views when she said:
“... because group working is all about all the students participating...”
In this regard, student C’s sentiments epitomize the students’ views when he said:
“... because you’re going to be in group sessions and you’re going to have to
discuss and not just listening to your group members”.

96
4.2.1.3 Group sessions allowed for explanations in mother tongue
Students who were not fluent in English also had the opportunity to explain and
participate in their mother tongue during the group sessions. These students were
therefore not excluded from the discussions which would have been the case in the
traditional teaching method where most of the time a discussion would take place
between the lecturer and the entire class. In this regard, student A’s sentiments
epitomize the students’ views when he said:
“So now as we were working in groups, it was well effective such that we were
well able to explain everything and maybe in Xhosa now to explain to one
another how this is, how the processes are going and then it was well
understood...”
4.2.1.4 Individual problem areas
When students did their preparation for the lecture that followed the previous one, they
would pick up the part of the work with which they struggled. During the session that
followed they asked for assistance from their peers or the lecturer. These problem
areas were then addressed and rectified upon and those students were not left behind
as the course progressed. In traditional teaching, students did not have this opportunity
and in many instances were left behind and eventually dropped out of the course. In

97
this regard, student C’s sentiments epitomize the students’ views when he said:
“Yes of course, because if you didn’t come to the session prepared, you wouldn’t
really know which area you need help on and which one you’re fine in...”
4.2.1.5 Students used group session experience
When students did their homework they used their group session experience and
approaches to solve new problems. The questions that they asked, served as a ‘guide’
on how to analyse problems. There was no fixed rule, but they had to systematically
work through a set of questions which they had formulated in order for them to
understand the process/processes in the problem, what information is supplied with and
how they could use that information in developing a solution to the problem. In this
regard, student C’s sentiments epitomize the students’ views when he said:
“Ja it helped me a lot because in group sessions before we actually tackle the
problem we would have a list of certain questions that we ask to ourselves.
Questions like what information is given and how do I use information, what’s
the problem, where do I start in solving the problem. Those questions helped us
a lot in groups and we would use those questions even when you’re alone, the
same method we used in the group”.

98
The following themes emerged from the heading ‘understanding’:
4.2.1.6 EBL encouraged understanding
Students said that they had developed the skills to read a problem and then interpret
and analyse it correctly. The fact that they discussed and listened to each others’ views
made them aware of different approaches to the same problem and that the problem
could be approached from different angles. This interaction resulted in the development
of their ability to read a problem and ask questions like: what is given? What must be
determined? What the process or processes are involved? The answers to these and
other questions were then developed in order to systematically find a solution to the
problem.
In contrast with the norm, students found it easier to actually understand certain
theories, principles and concepts. They said that GEBL assisted them in understanding
the work better than before which then also helped them in their discussions and
analysis tasks. Students stated that they really understood the work this time to such
an extent that they could explain it to others. In this regard, student C’s sentiments
epitomize the students’ views when he said:

99
“... when you understand the subject it becomes easy to pass it... this method
gives us that ability to understand it and not just guessing or memorizing it, but
to actually understand it”.
In this regard, student A’s sentiments epitomize the students’ views when he said:
“So now that way of, the traditional way of teaching it is just them giving us
information and you just don’t understand, you’re just completely lost...”
4.2.1.7 Traditional method allowed for little peer support
Students indicated that with the other courses (traditional teaching method) there was
no opportunity for group interaction and that these interactions actually assisted them
in understanding new work by sharing ideas and explaining to one another. In this
regard, student F’s sentiments epitomize the students’ views when he said:
“... if it can be introduced in other courses, because you will find that in other
courses the lecturer stand in front of the class, he teaches and then he goes
out...”

100
4.2.1.8 EBL developed the ability to manipulate information to solve
problems
Responses from students indicated that they were now in a position to manipulate
information supplied in questions. They were also able to look at different approaches
to solve problems, because they actually understood the work they were dealing with.
It was no more a case of using any formula that came to mind, but using the
information supplied and their understanding of the problem (process/processes) to
develop a specific approach for a solution to the problem. In this regard, student A’s
sentiments epitomize the students’ views when he said:
“Now I am in a position of even if they change the question around I will be well
able to use my own information you see I am in a position to analyse the
question and getting to manipulate whatever it is that I have”.
The following themes emerged from the heading ‘enquiry-based learning’:
4.2.1.9 EBL linked theory and practice
Students expressed their satisfaction with the EBL method. EBL did not just assist them
in understanding course content but it also helped them to put the theory taught in
class in perspective with its application and the relevance in industry. Being able to link

101
what has been taught in class to a practical application made understanding of certain
concepts or processes also easier and more effective than was the case in the past. In
this regard, student A’s sentiments epitomize the students’ views when he said:
“... not just knowing what you calculate but what is it in the engineering field
what significance does it have...”
Student’s expressed their opinion on the atmosphere created by GEBL as compared to
the traditional teaching and learning method. In this regard, student A’s sentiments
epitomize the students’ views when he said:
“... the teachers as well, they should also create that atmosphere for us to be
free to ask questions, because at times it can be very tense in class...”
In this regard, student H’s sentiments epitomize the students’ views when she said:
“... sometimes I find that I don’t understand and I don’t want to ask the lecturer
can you please explain to me but if I ask in my group session and the lecturer
comes to the group session and then I ask him privately because I am a shy
person”.

102
4.2.1.10 EBL was a more effective way of learning
Responses from the interview questions indicated that students found EBL more
effective and that according to them they learned more with this method than the
traditional one. At the end of a session they understood the work better than from the
traditional approach and could analyse and solve problems more effectively than in
other courses. In this regard, student A’s sentiments epitomize the students’ views
when he said:
“Yes, all I can say it is a fact that this has really been very, very effective for me
and I believe even for the other rest of the students that we are telling”.
4.2.1.11 EBL required active engagement
During group sessions every student got the opportunity to express themselves and to
share their views. This resulted in all students being actively engaged in the learning
process during these sessions. Lecturing time was reduced to allow for more time to be
spent on problem solving. This resulted in students being passive for a fraction of the
time when the lecturer was introducing a new concept. Once again students indicated
that active involvement improved learning and understanding. In this regard, student
I’s sentiments epitomize the students’ views when she said:

103
“... because group working is all about all the students participating...”
The following themes emerged from the heading ‘notes’:
4.2.1.12 Search for information
In the notes there were additional questions on each section of the syllabus. This
guided the students through a process of reading the questions and studying the
answers. Being stimulated by these questions students engaged themselves in a
research process to find out more about the topic under discussion – eventually this
leads to an expansion of the overall knowledge on the topic. In this regard, student J’s
sentiments epitomize the students’ views when he said:
“In the booklet we are given extra questions to be asked at the end of each
module, so basically those questions kind of push you in researching more of the
module itself”.
4.2.1.13 Notes contained relevant information which assisted in
understanding
According to the students the manner in which the course material was presented in
the booklet (questions on theory, principles and procedures) made the content easier
for them to understand. They stated that the booklet explained the course material in
104
such a way that they could actually follow and understand it. Students also mentioned
that some of the text books were written in advanced English and that they found it
difficult to follow discussions. Being able to follow the course and understanding what
they are doing made them feel good about themselves and gave them a more positive
feeling towards MTHE 2. In this regard, student J’s sentiments epitomize the students’
views when he said:
“... the questions in the booklet also were very relevant to the main question
asked to understand the work not just to memorise the formulas”.
In this regard, student A’s sentiments epitomize the students’ views when he said:
“First of all they help you to understand the topic that you are dealing with, it
gets you to understand it much better, it elaborates everything you see. It is like
it enhances your knowledge and it makes you understand problems much
easier... Yes, it just gets you to understand that particular subject much easier –
like it just expands everything to you - you get to know everything...”
4.2.1.14 Notes had questions to assist in understanding problems and
theory
When a new section was introduced, the students had to work through the example as
well as the additional questions in the notes to gain a better understanding of the work.

105
The worked out examples in the notes showed the students how to go about analysing
a problem, how to find out what information was given and how this information could
be used to find a solution to the problem. There was a list of questions in the notes
which the students could use or alter to suit their particular situation. Working with
these questions also developed the students’ skills to formulate relevant and
appropriate questions to address specific issues. These questions were then used to
analyse problems and to get to understand problems before attempts were made to
solve them. In this regard, student K’s sentiments epitomize the students’ views when
he said:
“It shows how to approach a problem and then it gives you a certain question
that you must ask in order to understand and approaching the question”.
In this regard, student F’s sentiments epitomize the students’ views when he said:
“Yes this booklet we have with questions and answers you read through the
theory and you read the questions and answers so that at the end of the day you
end up being aware of what you are being taught in class, what is it that the
lecturer told us about not just calculate, calculate, calculate as we are used to
doing in other subjects”.

106
In this regard, student I’s sentiments epitomize the students’ views when she said:
“... this booklet with additional questions helped me because it helped me to
analyse the questions very easily because of the explanation it had”.
In this regard, student A’s sentiments epitomize the students’ views when he said:
“First of all they help you to understand the topic that you are dealing with, it
gets you to understand it much better, it elaborates everything you see”.
4.2.1.15 Notes guided students in question formulation
The workout examples in the booklet helped the students to learn how to approach a
problem with enquiry based method. Then they applied this systematic approach when
they did the exercise questions and that helped them in their analysis and
understanding of new problems. In this regard, student L’s sentiments epitomize the
students’ views when he said:
“Yes they helped me because if you are solving a problem I learned a skill that
you should ask questions, based on that question so that you can get each and
every information that you were given...”

107
In this regard, student J’s sentiments epitomize the students’ views when he said:
“... it makes it easy and work, we had a textbook which had questions and how
to draw the diagrams and how to ask questions and what you should consider
doing first...”
4.2.1.16 Notes stimulated interest
The GEBL notes were aimed at making a connection between theory and practice to
improve understanding. The examples were presented in such a manner that the
students could understand the practical relevance and importance of what was being
taught. This also stimulated student interest which resulted in students’ spending more
time on that which they found interesting and enjoyed. In this regard, student F’s
sentiments epitomize the students’ views when he said:
“In that book, that the lecturer gave us, they offer explanation of even about
boilers, I want to learn about boilers, then I got interested to work with boilers
when I finish my course, even now he gave us a project to do about boilers”.

108
The following themes emerged from the heading ‘problem analysis’:
4.2.1.17 Sequences to problem solving
When the students were given new problems to solve, the process was that they had to
write down individually some question which they felt could help them in analysing the
problem. These questions were then discussed in the group and later in the class in
general to compare the similarity of questions formulated between the groups. This was
basically the approach during all the sessions and that gave the students a certain
departure point when they faced a new problem. They then worked systematically
through the questions and once all the questions were answered they would be in a
position to develop the solution to the problem. In this regard, student C’s sentiments
epitomize the students’ views when he said:
“We were encouraged to write down a certain sequence of each question and
how to answer the question and we were given time before each problem to
evaluate how we were going to actually answer the question, not just looking at
the question and trying to answer that specific question, cause you have to find
a number of things before you answer the actual question that’s asked... before
we actually tackle the problem we would have a list of certain questions that we
ask to ourselves”.

109
In this regard, student J’s sentiments epitomize the students’ views when he said:
“... to know which step you should move to and how you should approach the
question. In a way it gives us a start in approaching the questions...”
4.2.1.18 Students used certain sequences when working individually
At the end of the module, students had to become capable of solving problems without
relying on their peers. This approach to problem solving where they had to pose a
number of questions to which they had to find answers were then also used very
effectively by individual students when they did their home work. In this regard,
student E’s sentiments epitomize the students’ views when she said:
“... when you are at your own, doing homework or something you know how to
tackle a question, how to start from the beginning – you know how to solve
problems step by step...”
In this regard, student H’s sentiments epitomize the students’ views when she said:
“... when we solve problems as a group session, there’s a rule then, and then
when I solve the problem on my own I use the same thing...”

110
4.2.1.19 Peers’ problem solving approaches
Sharing problem solving approaches with peers in the group made students aware that
there could be more than one approach to solving a problem and that they should
always bear in mind possibilities of different approaches. Being aware that a problem
could be analysed and solved from different angles enabled students to consider the
given information in the problem first, before they started to plan a specific approach.
In this regard, student K’s sentiments epitomize the students’ views when he said:
“I enjoyed working with other students and to see how other students are
approaching the sum... you learn a lot of skills in approaching the sum because
you are dealing with different people with different styles of approaching the
sum...”
In this regard, student I’s sentiments epitomize the students’ views when she said:
“... in groups you know you get more information because all of us we come up
with different types of information...”
111
The following themes emerged from the heading ‘understanding’:
4.2.1.20 Explored alternative problem solving approaches when
understanding
Students stated that they have realised if they understood a section of the work
properly and they had to solve a problem under that particular section, they could use
their knowledge to consider different methods of solving the problem. Manipulating
given information and formulas gave them the freedom to solve problems in more than
one way. In this regard, student K’s sentiments epitomize the students’ views when he
said:
“... so if you do understand you know how to approach a problem in other
ways... so you have the ability to analyse the question and explore others ways
how to approach this problem”.
4.2.2 Addressing the Third Research Question
In addressing the third research question ‘What would be the effect of a guided
enquiry-based learning (GEBL) approach on mechanical engineering students’ ability to
communicate procedures and processes related to MTHE 2?’ the following themes
emerged from the heading ‘communication’:

112
4.2.2.1 Group sessions assisted communication with strangers
During discussions in their groups students were given the opportunity to speak in
English, expressing their views and understandings. They also had to listen to their
peers’ explanations and understandings. This was an opportunity to improve their
English proficiency as they were part of the discussion and they were exposed to how
others expressed themselves as well as new terms and new words that were used.
During group sessions the students were rotated which also exposed the students to an
exercise where they had to communicate with strangers. In this regard, student C’s
sentiments epitomize the students’ views when he said:
“In the group we had to first raise your suggestion in approaching the problem...
first had to like explain how do you understand the problem and you can
establish where you can start in trying to solve the problem and we would do
that in talking, so that helps us then in communication skills”.
4.2.2.2 Peers could explain to one another
Students had their own ideas when it came to problem solving and these ideas they
shared with each other. In the case of different approaches or interpretations to a
problem they debated their differences and had to convince their peers that their
approach is the correct one based on facts. This placed further pressure on the

113
students to come prepared to class and to have their facts ready during these
discussions. These discussions could not be convincing if students only memorised the
work, but they really had to understand it to be able to present a convincing argument.
In this regard, student C’s sentiments epitomize the students’ views when he said:
“Everyone in the group would come with their own ideas... You know in
discussions you would go through in groups, debates and we are challenging
each other in the groups someone gets to be disagreeing with you in the group
and you will have to try to convince and explain to him exactly how you really
view this...”
In this regard, student N’s sentiments epitomize the students’ views when she said:
“... we communicate about the question and if someone does not understand the
question you explain so that he/she can understand the question”.
4.2.2.3 EBL developed multiple skills
Students indicated that they not only learned content but were also developed in other
areas. They were encouraged to participate in group discussions with strangers which in
turn gave them confidence to express themselves in front of other people. This is an
important skill in the engineering field and if the students’ communication skills can be

114
developed to its full potential it will only be to their benefit. In this regard, student L’s
sentiments epitomize the students’ views when he said:
“I think in this method you gain a lot of skill other than solving the problem, first
you get a chance to communicate and be motivated to be not shy in class
because you have to solve problems with other people in the class... I think this
method we used in Thermodynamics is better, because you don’t just gain a
chance to solve the problem, but you can gain other skills other than solving
problems like talking in front of the people because in Thermo you have to share
the information with the group members”.
4.2.2.4 Thermodynamic terms
With regard to communication, students indicated that when participating in group
discussions they learned to use Thermodynamic terms which resulted in them becoming
more familiar with these terms which in turn helped them in understanding the course
content and problems better and this they would not have done when working alone.
Talking about various Thermodynamic aspects in group discussions, they had to say out
the terms loud, and this helped them in improving their pronunciation of these terms. It
also gave them more confidence in discussing Thermodynamic related concepts,
because now they were able to use the terminology correctly. In this regard, student
M’s sentiments epitomize the students’ views when he said:

115
“In Thermodynamics there are a number of terms and well just terms you need
to know that you don’t really pick up if you do work without talking about the
work. So the fact that you were talking about the work helped you to understand
these terms and in turn helped you understand more Thermodynamics”.
4.2.2.5 Explained problems to peers
When students explained problems to their peers and communicated in the group
sessions, they felt that communication skills improved and their language proficiency
actually improved. They indicated that they learned new words and that their ability to
express themselves improved. This would not have been the case with the traditional
teaching method. In this regard, student K’s sentiments epitomize the students’ views
when he said:
“It helped develop our communication skills because you get to speak out,
explaining what is happening about the sum...”
4.2.2.6 Shared views with others
Communicating with their class mates during the problem solving sessions, created the
opportunity to share their views which helped them in their understanding and
strategies to analyse and solve problems. These group sessions developed multiple
skills of students i.e. problem solving skills, communications skills and confidence to

116
express themselves in front of strangers. In this regard, student K’s sentiments
epitomize the students’ views when he said:
“... you can share your views with other people...”
In this regard, student F’s sentiments epitomize the students’ views when he said:
“When you are working in a group you gain something and you give something
to the others, you get some ideas how to tackle the problem...”
4.2.2.7 Group sessions improved communication
For all students except one, English was not the mother tongue. All these students
indicated that taking part in group session discussions helped them develop their
communication skills. They felt more confident in expressing themselves in technical
discussions. In an engineering occupation one must be able to communicate fluently,
be able to express oneself in technical areas, and be able to explain and demonstrate
certain processes effectively. In this regard, student B’s sentiments epitomize the
students’ views when he said:

117
“Because I have to talk to others and they must talk to me too. When doing this
on my own I don’t communicate with someone so when I am with them I can
communicate”.
In this regard, student H’s sentiments epitomize the students’ views when she said:
“Because as we share that information, so when we speak we know how to
speak with another and it helped me a lot because now I know that I can explain
that to another person and then we can share”.
The following themes emerged from the heading ‘teaching atmosphere’:
4.2.2.8 Group sessions allowed students to speak freely
In the traditional teaching method, the lecturer posed a question to the class or to an
individual who would simply respond ‘I don’t know.’ This made it difficult for the
lecturer to determine whether the student understood the work but was just shy or
whether he/she really did not understand the work. With the group sessions they could
speak freely to their peers and ask questions if they did not understand something.
Those with more confidence would then call the lecturer for further help if needed. In
this regard, student J’s sentiments epitomize the students’ views when he said:

118
“Yes, discussing in the groups – firstly it is not like answering your lecturer so
basically you can speak freely confidently...”
In this regard, student A’s sentiments epitomize the students’ views when he said:
“I think the lecturer was able to make the environment free. He made the
environment so free that you were so more able to ask questions anyhow and at
anytime...”
4.2.2.9 Feeling relaxed during problem solving
Comparing the classroom atmosphere between the traditional lecturing method and
GEBL method, students stated that they felt much more relaxed and free to participate,
ask questions to peers and the lecturer and to give their views to their peers. The
learning environment created with the GEBL approach was more student-friendly and
students could concentrate on learning and gaining knowledge. In this regard, student
A’s sentiments epitomize the students’ views when he said:
“You just don’t have that platform, you are not free at all, you are afraid of the
other students, you are afraid, but this way, I am more free you see. I think the
lecturer was able to make the environment free. He made the environment so
free that you were so more able to ask questions anyhow and at any time...”

119
In this regard, student J’s sentiments epitomize the students’ views when he said:
“... now you are feeling relaxed and analyse what is in front of you...”
4.2.3 Summary of Qualitative Data
From the qualitative data presented in section 4.2.1 and 4.2.2 and their subsections,
there is indication that students found that GEBL assisted them in learning factual
knowledge and understanding concepts, processes and procedures. Their problem
solving skills were also developed following the GEBL approach to analyse problems.
Their ability to communicate and to use MTHE 2 terms in groups was developed during
the group sessions.
4.3 Quantitative Data Analysis, Interpretation and Discussion
This section deals with quantitative data recorded with the relevant instruments
developed for this study. The mean is the sum of the values divided by the number of
values. The skewness is a measure of the asymmetry of the probability distribution of a
real-valued random variable. When the skewness value is negative the Bell-curve will lie
more to the right and the bulk of the values will lie to the right of the mean. The curve
will also have a longer tail on the left side caused by low number extreme cases. A
positive skew indicates that the tail on the right side is longer than the left side and the

120
bulk of the values lie to the left of the mean. A zero value for skewness indicates that
the values are relatively evenly distributed on both sides of the mean. The curve will
have a symmetrical shape around the mean. Low values will be those below 40% and
high values those above 60%.
4.3.1 Addressing the First and Second Research Question
With reference to the first research question ‘What would be the effect of a guided
enquiry-based learning (GEBL) approach on mechanical engineering students’ factual
recall of MTHE 2 concepts?’ and the second research question: ‘What would be the
effect of a guided enquiry-based learning (GEBL) approach on mechanical engineering
students’ conceptual understanding of MTHE 2 concepts, principles and applications?’,
the following section gives a breakdown of the quantitative data presented.
In this section an overview of the descriptive statistics is given to show commonalities
and differences which occurred during the assessments. With regard to the tests and
final examination, all the lowest scored questions and all the highest scored questions
are presented and discussed. The overall performance of each test is highlighted and
discussed. Possible causes for poor the performance in certain questions are discussed.
Following this, suggestions to rectify the poorly performed section are made and
possible approaches to achieve this are explained.

121
Overall descriptive statistics
Statistics
T1 T1B T2 T3 FINALEXAM
N Valid 20 20 20 20 20
Missing 0 0 0 0 0
/Mean 46.2000 46.2000 42.4000 41.5505 48.6005
Standard. Error of Mean 3.52331 3.62782 1.77319 4.27973 4.76109
Median 45.5000 47.0000 43.5000 46.0000 55.5000
Mode 46.00a 45.00a 47.00 46.00a 58.00
Standard. Deviation 15.75670 16.22409 7.92996 19.13954 21.29224
Variance 248.274 263.221 62.884 366.322 453.359
Skewness .168 -.582 -.614 -.338 -.791
Standard. Error of Skewness .512 .512 .512 .512 .512
Kurtosis -1.111 .704 .243 .034 .316
Standard. Error of Kurtosis .992 .992 .992 .992 .992
Range 52.00 65.00 30.00 77.99 84.99
Minimum 20.00 8.00 25.00 .01 .01
Maximum 72.00 73.00 55.00 78.00 85.00
Sum 924.00 924.00 848.00 831.01 972.01
a. Multiple modes exist. The smallest value is shown
Table 4.2: Quantitative Statistics on the Students’ Overall Performance in Written Assessments
Test 2 had the lowest median (the middle value of all the results) of 43.5 with the final
examination showing the highest median of 55.5. The skewness of the histograms
shifted progressively from Test 1 to the Final Examination more to the right resulting in
a higher number of student concentration in the higher percentages. The exception
here was Test 3 which had a skewness of -0.338 which indicated a low number of
extreme cases below the mean (the average of all the results). This can be attributed to
the intervention improving student learning and knowledge retention as time
progressed even with larger volumes of work and increased degrees of difficulty.

122
Traditional teaching and learning methods were used to present the first module which
was covered in Test 1 and Test 1b. Low and high overall scores will be discussed and
possible cause and reasons for these low and high overall scores will be explained:
Data from Test 1 Theory Questions:
Statistics
T1.1 T1.2 T1.3 T1.4 T2.1 T2.2
N Valid 20 20 20 20 20 20
Missing 0 0 0 0 0 0
Mean 51.500 20.000 7.500 46.250 63.350 35.000
Standard. Error of Mean 5.5930 6.6886 3.1933 8.9360 3.6240 6.3867
Median 43.000 .000 .000 50.000 73.000 50.000
-Mode 43.0 .0 .0 .0 73.0 50.0
Standard. Deviation 25.0126 29.9122 14.2810 39.9630 16.2068 28.5620
Variance 625.632 894.737 203.947 1597.039 262.661 815.789
Skewness .370 1.041 1.845 .185 -1.523 .038
Standard. Error of Skewness .512 .512 .512 .512 .512 .512
Kurtosis .312 -.655 2.861 -1.524 1.950 -.395
Standard. Error of Kurtosis .992 .992 .992 .992 .992 .992
Range 100.0 75.0 50.0 100.0 64.0 100.0
Minimum .0 .0 .0 .0 18.0 .0
Maximum 100.0 75.0 50.0 100.0 82.0 100.0
Sum 1030.0 400.0 150.0 925.0 1267.0 700.0
Table 4.3: Quantitative Statistics on Theory Questions in Test 1

123
Figure 4.1: Theory Question 1.3 in Test 1 reflecting a low level of Conceptual Knowledge
In this question students had to explain their understanding of the gas constant. Many
of the students answered the question by giving a formula in terms of specific heat
capacities. This was mainly an interpretation error of what they had to do although
clear instructions were given to them prior to the commencement of the test. It can
also be mentioned that the relationships between gas constant and specific heat
capacities given by the students were in general correct although this was not asked.
The majority of the students interpreted the questions incorrectly and the mode (the
result most often recorded) was 0%. Question 1.3 had the lowest mean of 7.5 and the

124
highest positive skewness of 1.845. The low number extreme outliers (above or below
the mean) pushed the standard deviation up to 14.281.
Figure 4.2: Theory Question 2.1 in Test 1 reflecting a high level of Conceptual Knowledge
This question required the students to analyse the problem, explain which processes
were involved, which variables remained constant and which ones changed. They then
had to draw the pressure-volume diagram of the complete process. Most of the
students were able to analyse the problem correctly. They were also able to indicate
which variables remained constant and which ones changed and could reflect the
processes correctly on a pressure-volume diagram. Their conceptual knowledge in this
section of the work was of a high standard which enabled them to give the correct

125
response. Question 2.1 had the highest mean of 63.35 and highest negative skewness
of -1.523. The low number extreme cases pushed the standard deviation up to 16.207.
However, the central tendency (median) was 73% and the score that was recorded
most often (mode) was also 73%.
Data from Test 1 Analytical Questions:
Statistics
C1.2 C1.3 C2.2
N Valid 20 20 20
Missing 0 0 0
Mean 32.450 62.500 55.400
Standard. Error of Mean 6.5476 10.1793 7.8464
Median 25.000 100.000 50.000
Mode .0 100.0 100.0
Standard. Deviation 29.2817 45.5233 35.0900
Variance 857.418 2072.368 1231.305
Skewness .207 -.552 .108
Standard. Error of Skewness .512 .512 .512
Kurtosis -1.470 -1.632 -1.435
Standard. Error of Kurtosis .992 .992 .992
Range 75.0 100.0 94.0
Minimum .0 .0 6.0
Maximum 75.0 100.0 100.0
Sum 649.0 1250.0 1108.0
Table 4.4: Quantitative Statistics from Analytical Questions in Test 1
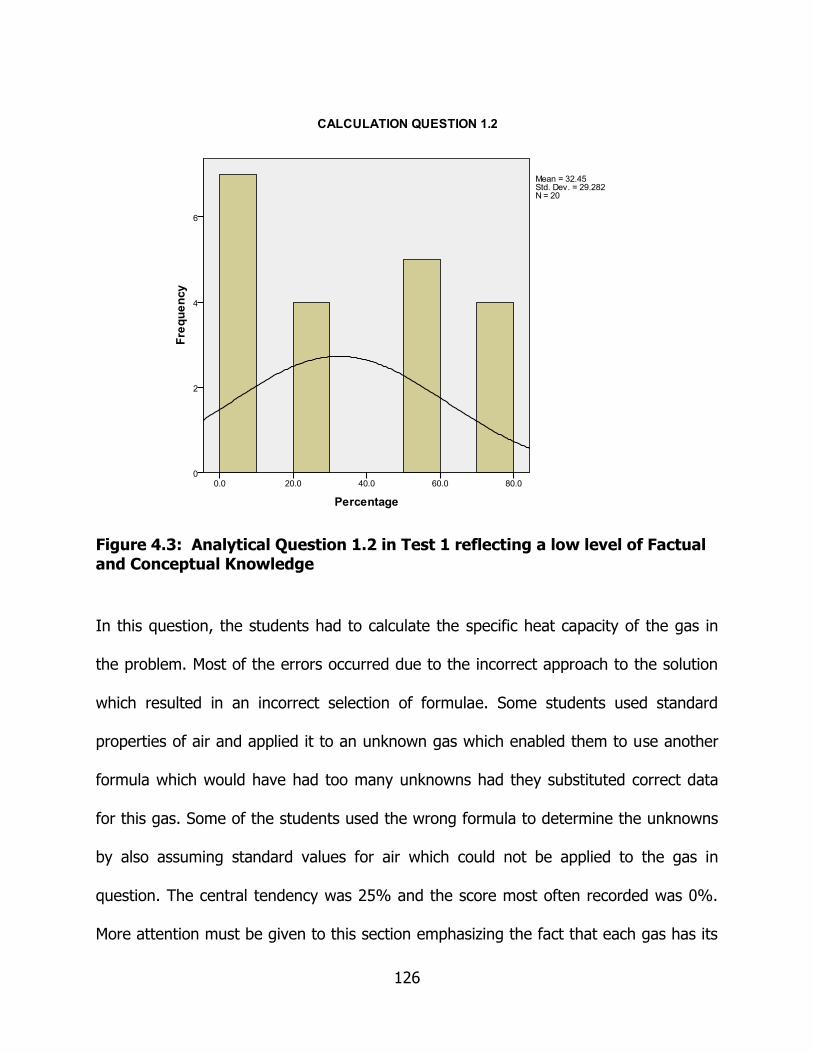
126
Figure 4.3: Analytical Question 1.2 in Test 1 reflecting a low level of Factual and Conceptual Knowledge
In this question, the students had to calculate the specific heat capacity of the gas in
the problem. Most of the errors occurred due to the incorrect approach to the solution
which resulted in an incorrect selection of formulae. Some students used standard
properties of air and applied it to an unknown gas which enabled them to use another
formula which would have had too many unknowns had they substituted correct data
for this gas. Some of the students used the wrong formula to determine the unknowns
by also assuming standard values for air which could not be applied to the gas in
question. The central tendency was 25% and the score most often recorded was 0%.
More attention must be given to this section emphasizing the fact that each gas has its

127
own unique properties and that these properties cannot be mixed up. Question 1.2 had
the lowest mean of 32.45, the lowest standard deviation of 29.2817 and the second
lowest skewness of 0.207.
Figure 4.4: Analytical Question 1.3 in Test 1 reflecting a high level of Factual Knowledge
In this question most students understood what needed to be determined and they
selected the correct formula to determine the answer. Here, the students were required
to tap into their memory and retrieve the correct formula taking into account the
information supplied in the problem and the variables available. The central tendency as
well as the score recorded most frequently was 100%. The data indicated that the
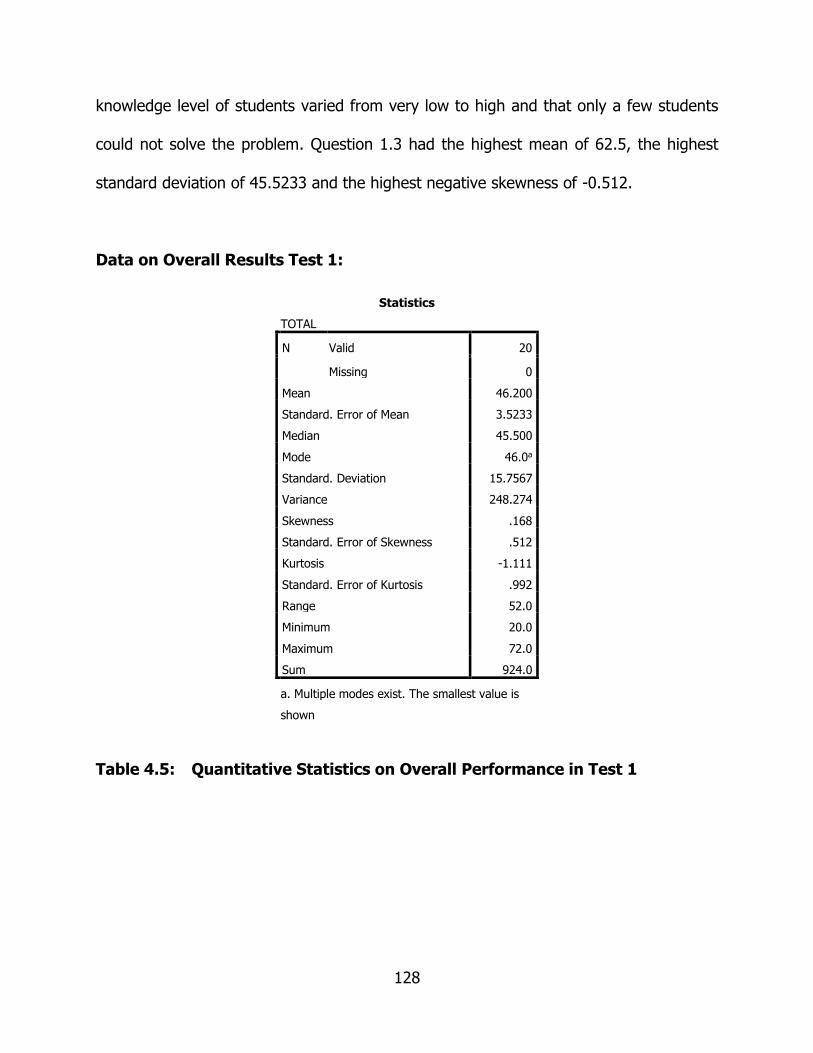
128
knowledge level of students varied from very low to high and that only a few students
could not solve the problem. Question 1.3 had the highest mean of 62.5, the highest
standard deviation of 45.5233 and the highest negative skewness of -0.512.
Data on Overall Results Test 1:
Statistics
TOTAL
N Valid 20
Missing 0
Mean 46.200
Standard. Error of Mean 3.5233
Median 45.500
Mode 46.0a
Standard. Deviation 15.7567
Variance 248.274
Skewness .168
Standard. Error of Skewness .512
Kurtosis -1.111
Standard. Error of Kurtosis .992
Range 52.0
Minimum 20.0
Maximum 72.0
Sum 924.0
a. Multiple modes exist. The smallest value is
shown
Table 4.5: Quantitative Statistics on Overall Performance in Test 1
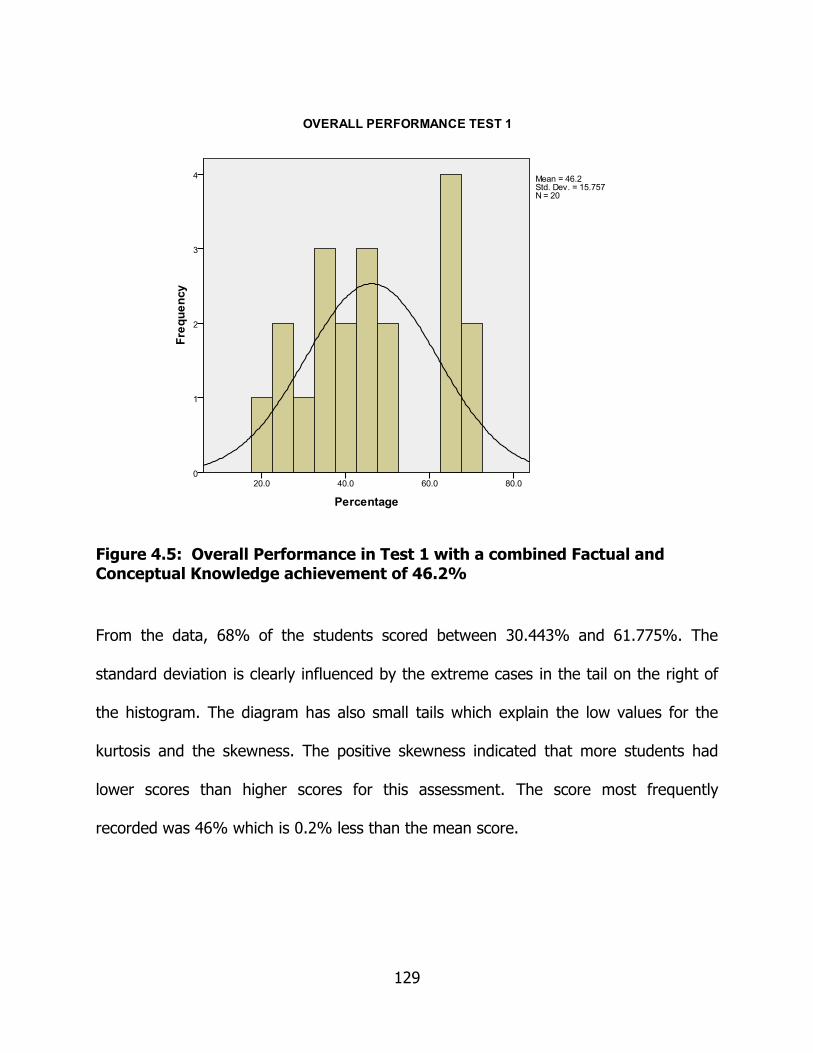
129
Figure 4.5: Overall Performance in Test 1 with a combined Factual and Conceptual Knowledge achievement of 46.2%
From the data, 68% of the students scored between 30.443% and 61.775%. The
standard deviation is clearly influenced by the extreme cases in the tail on the right of
the histogram. The diagram has also small tails which explain the low values for the
kurtosis and the skewness. The positive skewness indicated that more students had
lower scores than higher scores for this assessment. The score most frequently
recorded was 46% which is 0.2% less than the mean score.

130
Data from Test 1b Theory Questions:
Statistics
T1.1 T1.2 T1.3 T1.4 T2.1 T2.2 T2.3
N Valid 20 20 20 20 20 20 20
Missing 0 0 0 0 0 0 0
Mean 47.700 94.350 27.500 2.000 44.700 6.000 16.500
Standard. Error of Mean 6.5386 2.9888 4.4054 2.0000 4.8678 2.5547 3.6473
Median 50.000 100.000 25.000 .000 40.000 .000 20.000
Mode 25.0 100.0 25.0 .0 33.0 .0 .0a
Standard. Deviation 29.2415 13.3664 19.7017 8.9443 21.7694 11.4248 16.3111
Variance 855.063 178.661 388.158 80.000 473.905 130.526 266.053
Skewness -.117 -3.307 -.186 4.472 1.217 1.845 .552
Standard. Error of Skewness .512 .512 .512 .512 .512 .512 .512
Kurtosis -1.278 12.275 -1.308 20.000 .649 2.861 -.714
Standard. Error of Kurtosis .992 .992 .992 .992 .992 .992 .992
Range 88.0 57.0 50.0 40.0 73.0 40.0 50.0
Minimum .0 43.0 .0 .0 20.0 .0 .0
Maximum 88.0 100.0 50.0 40.0 93.0 40.0 50.0
Sum 954.0 1887.0 550.0 40.0 894.0 120.0 330.0
a. Multiple modes exist. The smallest value is shown
Table 4.6: Quantitative Statistics on Theory Questions in Test 1b

131
Figure 4.6: Theory Question 1.2 in Test 1b reflecting a high level of Conceptual Knowledge
In this question the students were required to draw a pressure-volume diagram of the
complete process. To be able to do this a correct understanding of the various
processes involved was necessary as well as the ability to reflect the data on this
diagram correctly. Most students were able to answer this question correctly with only
certain individuals giving incorrect responses. Question 1.2 had the highest mean of
94.35, the third lowest standard deviation of 13.3664 and the highest negative
skewness of -3.307.

132
Figure 4.7: Theory Question 1.4 in Test 1b reflecting a low level of Conceptual Knowledge
This question consisted of three processes with process one followed by process two
and process two followed by process three. The question required from the students to
use their conceptual knowledge of the processes in question to determine the
relationship between two points. This would enable them to explain the process
between the two points and how the heat flow in this process would be determined.
However, to be able to give a correct response, a correct interpretation of the first two
processes had to be made. From the data it became clear that very few of them had
the correct understanding of what the process was and therefore could not give the

133
correct answer. The class as a whole scored low marks thus causing the skewness
leaning toward the left in the lower percentages. A possible cause could be the
students’ inability to use the pressure-volume diagram as a support to determine the
type of process involved in this question. More detailed exercises on this particular type
of approach could assist in handling similar problems. Question 1.4 had the lowest
mean of 2.0, the lowest standard deviation of 8.9443 and the highest positive skewness
of 4.472.
Data from Test 1b Analytical Questions:
Statistics
C1.3 C1.4 C2.2 C2.3
N Valid 20 20 20 20
Missing 0 0 0 0
Mean 76.550 .000 70.000 46.400
Standard. Error of Mean 7.4549 .0000 5.3311 7.4690
Median 92.000 .000 80.000 43.000
Mode 100.0 .0 80.0 43.0
Standard. Deviation 33.3395 .0000 23.8416 33.4025
Variance 1111.524 .000 568.421 1115.726
Skewness -1.438 -1.553 .148
Standard. Error of Skewness .512 .512 .512 .512
Kurtosis .819 2.766 -.929
Standard. Error of Kurtosis .992 .992 .992 .992
Range 100.0 .0 100.0 100.0
Minimum .0 .0 .0 .0
Maximum 100.0 .0 100.0 100.0
Sum 1531.0 .0 1400.0 928.0
Table 4.7: Quantitative Statistics on Analytical Questions in Test 1b

134
Figure 4.8: Analytical Question 1.3 in Test 1b reflecting a high level of Factual and Conceptual Knowledge
This question required the students to calculate the total heat flow for the complete
process. To be able to answer this question correctly, the students had to understand
what was meant by the term total heat flow and then they had to recall the correct
formula. Most of the students understood what total heat flow was and recalled the
correct formula. Question 1.3 had the highest mean of 76.55, the second highest
standard deviation of 33.3395 and the second highest skewness of -1.438.
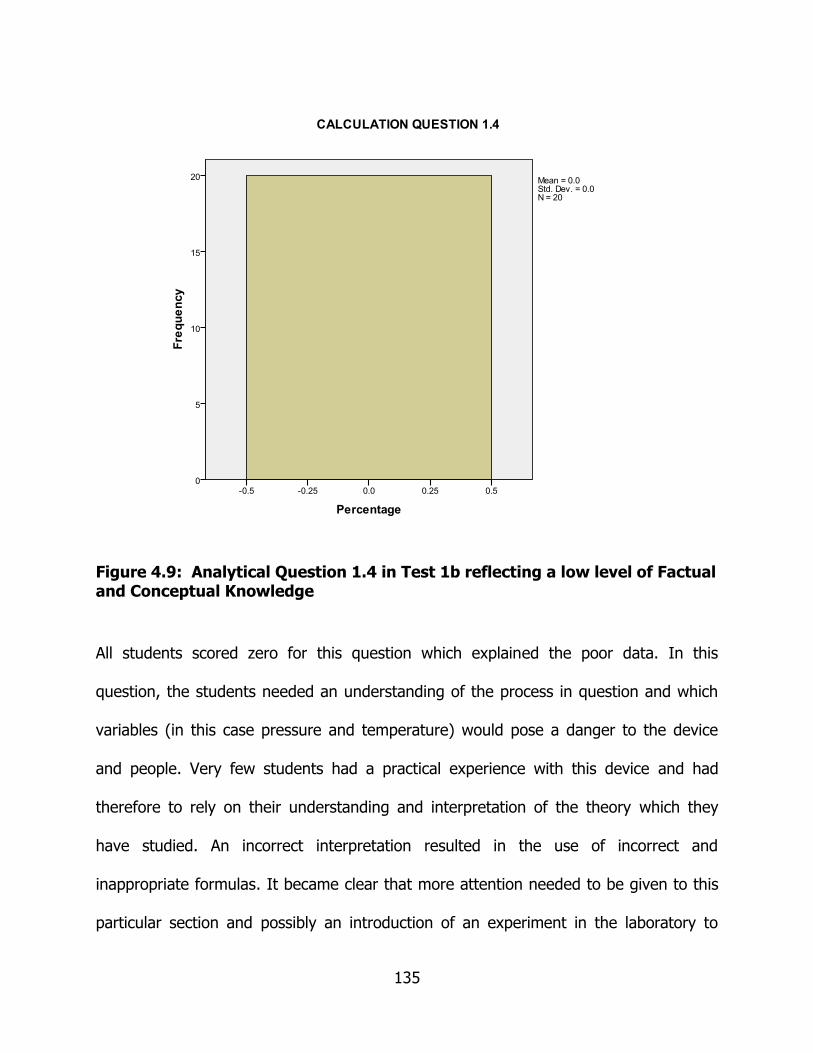
135
Figure 4.9: Analytical Question 1.4 in Test 1b reflecting a low level of Factual and Conceptual Knowledge
All students scored zero for this question which explained the poor data. In this
question, the students needed an understanding of the process in question and which
variables (in this case pressure and temperature) would pose a danger to the device
and people. Very few students had a practical experience with this device and had
therefore to rely on their understanding and interpretation of the theory which they
have studied. An incorrect interpretation resulted in the use of incorrect and
inappropriate formulas. It became clear that more attention needed to be given to this
particular section and possibly an introduction of an experiment in the laboratory to
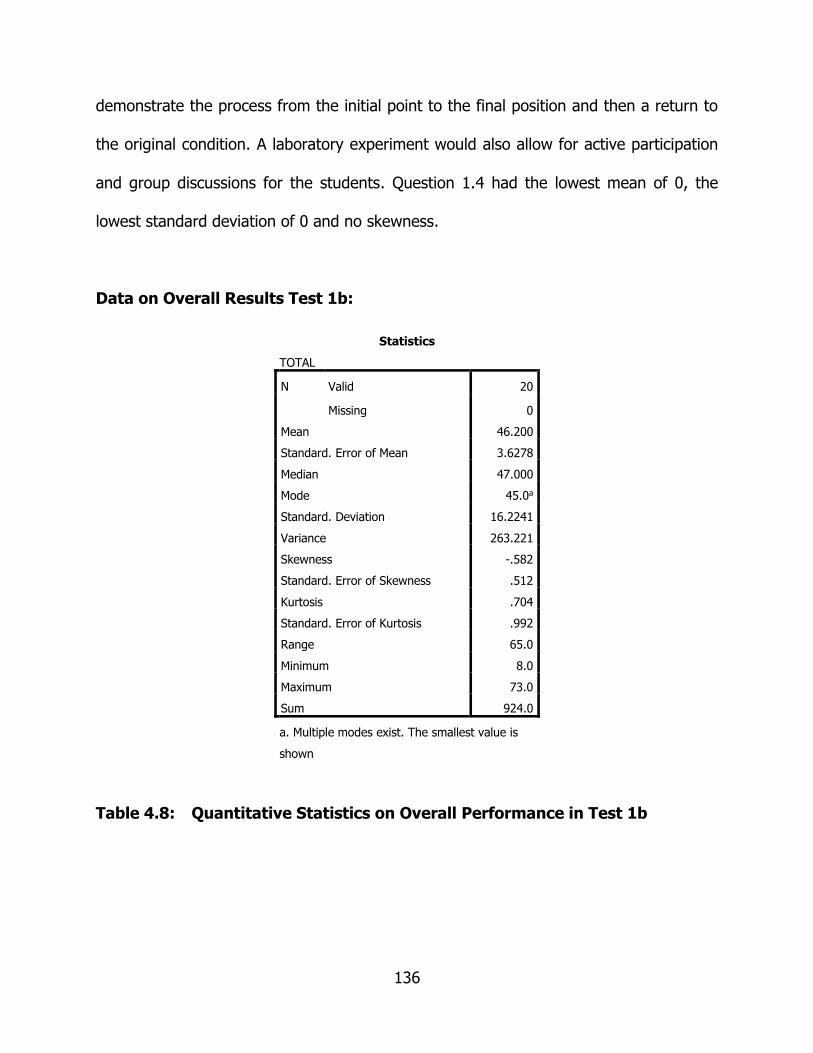
136
demonstrate the process from the initial point to the final position and then a return to
the original condition. A laboratory experiment would also allow for active participation
and group discussions for the students. Question 1.4 had the lowest mean of 0, the
lowest standard deviation of 0 and no skewness.
Data on Overall Results Test 1b:
Statistics
TOTAL
N Valid 20
Missing 0
Mean 46.200
Standard. Error of Mean 3.6278
Median 47.000
Mode 45.0a
Standard. Deviation 16.2241
Variance 263.221
Skewness -.582
Standard. Error of Skewness .512
Kurtosis .704
Standard. Error of Kurtosis .992
Range 65.0
Minimum 8.0
Maximum 73.0
Sum 924.0
a. Multiple modes exist. The smallest value is
shown
Table 4.8: Quantitative Statistics on Overall Performance in Test 1b

137
Figure 4.10: Overall Performance in Test 1 with a combined Factual and Conceptual Knowledge achievement of 46.2%
The standard deviation indicated that 68% of the students scored between 29.976%
and 62.424%. In this case the standard deviation was influenced by the lower extreme
cases as indicated by the tail on the left. The central tendency in this case was 47%
which was not affected by these low number extreme cases. The low value for the
skewness and kurtosis was as a result of the small tails. The negative skewness
indicated that more students scored higher values than lower values. The most frequent
score obtained by the students was 45%, very close to the mean of 46.2%. In this

138
question the majority of the students scored above 40% with only certain individuals
who scored between 0% and 20%.
GEBL was introduced and used for the remainder of the syllabus (modules 2-7). Low
and high scores will be discussed and possible reasons for the performance will be
given as well as possible solution to prevent poor performances in future. It is
important to draw the readers’ attention again to the fact that Test 2 was written on
four times more work (2 complete modules) than Test 1 and 1b (0.5 module each). The
degree of difficulty also increased progressively throughout the modules.

139
Data from Test 2 Theory Questions:
Statistics
T1.1 T1.2 T1.3 T1.4 T1.5 T1.6 T2.1 T2.2 T2.3
N Valid 20 20 20 20 20 20 20 20 20
Missing
0 0 0 0 0 0 0 0 0
Mean 20.000 42.600 52.500 60.000 20.000 18.350 5.000 28.350 77.000 Standard. Error of Mean
3.8899 7.2134 8.4876 11.2390
5.4290 6.1748 5.0000 7.3854 5.8535
Median 25.000 58.500 50.000 100.000
10.000 .000 .000 16.500 80.000
Mode 25.0 67.0 50.0 100.0 .0 .0 .0 .0 100.0 Standard. Deviation
17.3963
32.2595
37.9577
50.2625
24.2791
27.6144
22.3607
33.0283
26.1775
Variance
302.632
1040.674
1440.789
2526.316
589.474
762.555
500.000
1090.871
685.263
Skewness
1.333 -.405 -.086 -.442 .981 1.082 4.472 .696 -1.103
Standard. Error of Skewness
.512 .512 .512 .512 .512 .512 .512 .512 .512
Kurtosis 4.442 -1.647 -1.154 -2.018 .186 -.555 20.000 -.870 .380 Standard. Error of Kurtosis
.992 .992 .992 .992 .992 .992 .992 .992 .992
Range 75.0 83.0 100.0 100.0 80.0 67.0 100.0 100.0 80.0 Minimum
.0 .0 .0 .0 .0 .0 .0 .0 20.0
Maximum
75.0 83.0 100.0 100.0 80.0 67.0 100.0 100.0 100.0
Sum 400.0 852.0 1050.0 1200.0 400.0 367.0 100.0 567.0 1540.0
Table 4.9: Quantitative Statistics on Theory Questions in Test 2

140
Figure 4.11: Theory Question in Test 2 reflecting a low level of Conceptual Knowledge
The question required from the students to explain the type of process in the question
bearing in mind all the information given. All students except one gave an incorrect
response. The majority of these responses were explaining the process which they had
to follow in answering the sub-questions posed, but did not answer sub-question in this
particular case. A possible cause of this could be the misinterpretation of the question.
In an attempt to illuminate this misunderstanding, in future the question must be
reworded so that it became clear regarding what was expected from the students.
Question 2.1 had the lowest mean of 5 and the highest positive skewness of 4.472.

141
Figure 4.12: Theory Question 2.3 in Test 2 reflecting a high level of Conceptual Knowledge
In this question the students had to explain all the calculations which they had to
perform before they could do a volumetric analysis. The majority of the students gave
the correct answer showing that the group’s conceptual knowledge of this section of the
work was satisfactorily and that they used this to formulate their answers. Question 2.3
had the highest mean of 77 and the highest negative skewness of -1.103.

142
Data from Test 2 Analytical Questions:
Statistics
C1.3 C1.4 C2.4 C2.5
N Valid 20 20 20 20
Missing 0 0 0 0
Mean 30.000 5.000 84.150 31.450
Standard. Error of Mean 9.8675 3.4412 4.9843 3.6088
Median .000 .000 91.000 27.000
Mode .0 .0 100.0 46.0
Standard. Deviation 44.1290 15.3897 22.2906 16.1391
Variance 1947.368 236.842 496.871 260.471
Skewness .939 2.888 -1.994 .397
Standard. Error of Skewness .512 .512 .512 .512
Kurtosis -1.046 7.037 3.839 -.690
Standard. Error of Kurtosis .992 .992 .992 .992
Range 100.0 50.0 82.0 59.0
Minimum .0 .0 18.0 8.0
Maximum 100.0 50.0 100.0 67.0
Sum 600.0 100.0 1683.0 629.0
Table 4.10: Quantitative Statistics on Analytical Questions in Test 2

143
Figure 4.13: Analytical Question in Test 2 reflecting a low level of Factual and Conceptual Knowledge
This question required the students to calculate the temperature at exit from the
compressor. Here, the students had to understand the process in and through the
compressor as well as the given information and how the given information could be
used to determine the temperature at exit. Except for two students, everybody gave the
wrong answer. Most of the students did not realise that the working fluid was air and
that standard properties could be used (not supplied in the question). Without these
properties, the question could not have been answered because the relevant formulae
would render too many unknowns. Possible means of overcoming this inability on the

144
student’s side would be to emphasise to the students the use of a systematic approach
in developing a solution, with the first step being to identify the working fluid. Question
1.4 had the lowest mean of 5.0 and the highest positive skewness of 2.888.
Figure 4.14: Analytical Question 2.4 in Test 2 reflecting a high level of Factual Knowledge
This question required the students to perform the calculations which they had listed in
Question 2.3. Question 2.3 was a theory question and the students had a very high
score for it which obviously resulted in the high score for Question 2.4. Here, the
students demonstrated their ability to physically perform the calculations which they
explained in the previous question. Question 2.4 had highest mean of 84.15 and the

145
highest negative skewness of -1.994. The small number of outliers between 0% and
20% pushed the standard deviation up to 22.291.
Data on Overall Results Test 2:
Statistics
TOTAL
N Valid 20
Missing 0
Mean 42.400
Standard. Error of Mean 1.7732
Median 43.500
Mode 47.0
Standard. Deviation 7.9300
Variance 62.884
Skewness -.614
Standard. Error of Skewness .512
Kurtosis .243
Standard. Error of Kurtosis .992
Range 30.0
Minimum 25.0
Maximum 55.0
Sum 848.0
Table 4.11: Quantitative Statistics on Overall Performance in Test 2
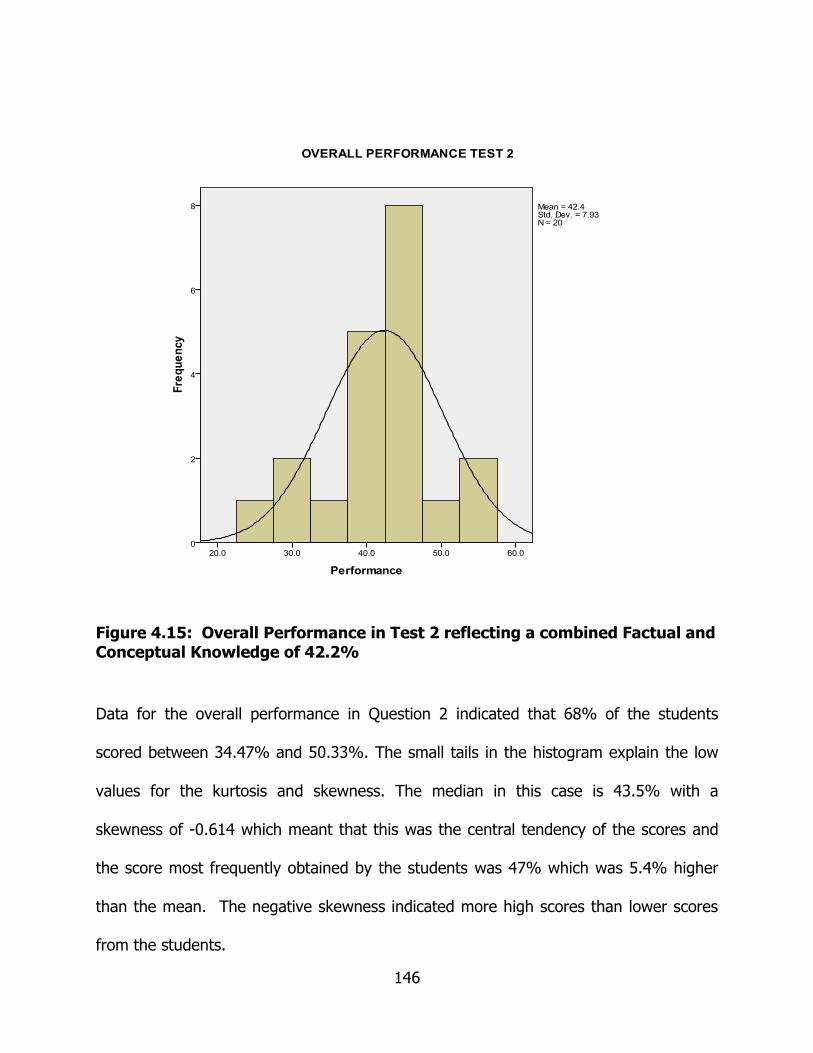
146
Figure 4.15: Overall Performance in Test 2 reflecting a combined Factual and Conceptual Knowledge of 42.2%
Data for the overall performance in Question 2 indicated that 68% of the students
scored between 34.47% and 50.33%. The small tails in the histogram explain the low
values for the kurtosis and skewness. The median in this case is 43.5% with a
skewness of -0.614 which meant that this was the central tendency of the scores and
the score most frequently obtained by the students was 47% which was 5.4% higher
than the mean. The negative skewness indicated more high scores than lower scores
from the students.

147
The performance in Test 3 must be observed bearing in mind the fact that this test was
written on 3 modules of work which had six times more content than Test 1 and 1b and
also one module more than Test 2. The modules were still progressively becoming more
difficult and complex.

148
Data Test 3 Theory Questions:
Statistics
T1.1 T1.2 T1.3 T1.4 T1.5 T2.1
T2.2.
1
T2.2.
2 T2.3 T3.1 T3.2 T3.3 T4.1 T4.2 T4.3 T4.4 T4.5
N Vali
d
19 19 19 19 19 19 19 19 19 19 19 19 19 19 19 19 19
Miss
ing
0 0 0 0 0 0 0 0 0 0 0 0 0 0 0 0 0
Mean 67.1
05
35.26
3
60.5
26
13.1
58
31.5
79
22.6
32
43.42
1
39.47
4
57.89
5
22.0
53
55.47
4
28.0
53
73.05
3
62.15
8
32.89
5
28.94
7
7.89
5
Stand
ard.
Error
of
Mean
6.90
70
8.284
7
6.70
92
5.18
95
6.85
11
5.28
94
7.845
9
7.481
9
10.99
12
7.23
11
7.301
5
6.40
43
8.668
2
8.340
8
8.122
9
7.709
8
3.84
87
Media
n
50.0
00
40.00
0
75.0
00
.000 25.0
00
20.0
00
50.00
0
50.00
0
100.0
00
.000 63.00
0
33.0
00
100.0
00
83.00
0
25.00
0
25.00
0
.000
Mode 50.0 .0 75.0 .0 .0a .0 .0a 50.0 100.0 .0 63.0 .0 100.0 83.0a .0 .0 .0
Stand
ard.
Deviat
ion
30.1
070
36.11
22
29.2
449
22.6
207
29.8
632
23.0
560
34.19
93
32.61
28
47.90
95
31.5
198
31.82
66
27.9
155
37.78
37
36.35
67
35.40
70
33.60
63
16.7
760
Varian
ce
906.
433
1304.
094
855.
263
511.
696
891.
813
531.
579
1169.
591
1063.
596
2295.
322
993.
497
1012.
930
779.
275
1427.
608
1321.
807
1253.
655
1129.
386
281.
433
Skewn
ess
-
.379
.470 -
.719
1.17
0
.524 .826 .096 .227 -.346 1.30
9
-.410 .341 -
1.142
-.623 .682 .908 1.99
8
Stand
ard.
Error
of
Skewn
ess
.524 .524 .524 .524 .524 .524 .524 .524 .524 .524 .524 .524 .524 .524 .524 .524 .524
Kurtos
is
-
.521
-
1.116
.257 -
.718
-
.329
-
.098
-
1.156
-.613 -
1.952
.526 -.403 -
1.46
9
-.066 -.988 -.780 -.015 2.81
1
Stand
ard.
Error
of
Kurtos
is
1.01
4
1.014 1.01
4
1.01
4
1.01
4
1.01
4
1.014 1.014 1.014 1.01
4
1.014 1.01
4
1.014 1.014 1.014 1.014 1.01
4
Range 100.
0
100.0 100.
0
50.0 100.
0
70.0 100.0 100.0 100.0 100.
0
100.0 67.0 100.0 100.0 100.0 100.0 50.0
Minim
um
.0 .0 .0 .0 .0 .0 .0 .0 .0 .0 .0 .0 .0 .0 .0 .0 .0
Maxim
um
100.
0
100.0 100.
0
50.0 100.
0
70.0 100.0 100.0 100.0 100.
0
100.0 67.0 100.0 100.0 100.0 100.0 50.0
Sum 127
5.0
670.0 115
0.0
250.
0
600.
0
430.
0
825.0 750.0 1100.
0
419.
0
1054.
0
533.
0
1388.
0
1181.
0
625.0 550.0 150.
0
a. Multiple modes exist. The smallest value is shown
Table 4.12: Quantitative Statistics on Theory Questions in Test 3

149
Figure 4.16: Theory Question 4.1 in Test 3 reflecting a high level of Conceptual Knowledge
This question required the students to draw a flow diagram of the Rankine cycle. Here,
the students had to use their conceptual knowledge of the operation of the Rankine
cycle and all the components it consisted of as well as the relationship between the
various components within the plant. The standard deviation was increased by the
outliers and the highest concentration of scores was in the upper limits. The majority of
the students had a good understanding of this section and could give a correct
response. The central tendency for this question and the score most frequently

150
recorded was 100%. Question 4.1 had the highest mean of 73.05 and the highest
negative skewness of -1.142.
Figure 4.17: Theory Question 4.5 in Test 3 reflecting a low level of Conceptual Knowledge
This question required the students to explain their understanding of the brake thermal
efficiency of the Rankine cycle and what exactly it measured. From the data it was clear
that not many students had a proper understanding of what the brake thermal
efficiency was or what it was used for. A possible strategy to rectify this would be to
spend more time on this particular section during problem solving sessions and to
present students with more problems which incorporate the brake thermal efficiency.
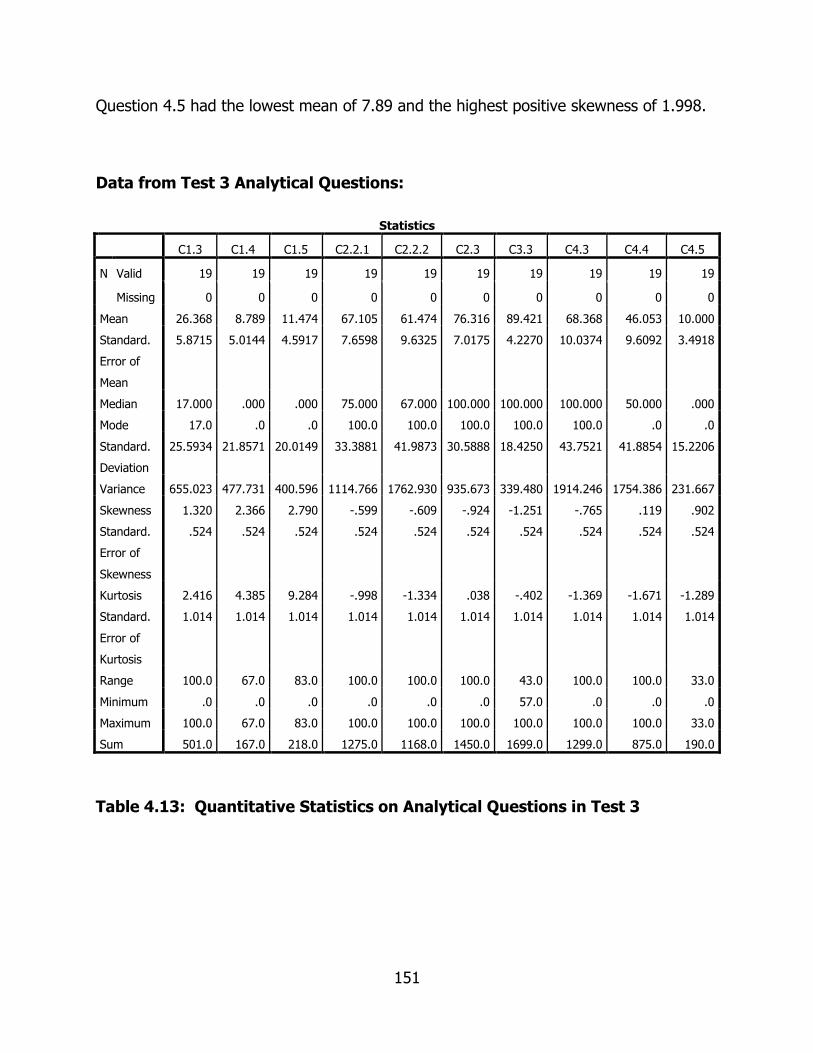
151
Question 4.5 had the lowest mean of 7.89 and the highest positive skewness of 1.998.
Data from Test 3 Analytical Questions:
Statistics
C1.3 C1.4 C1.5 C2.2.1 C2.2.2 C2.3 C3.3 C4.3 C4.4 C4.5
N Valid 19 19 19 19 19 19 19 19 19 19
Missing 0 0 0 0 0 0 0 0 0 0
Mean 26.368 8.789 11.474 67.105 61.474 76.316 89.421 68.368 46.053 10.000
Standard.
Error of
Mean
5.8715 5.0144 4.5917 7.6598 9.6325 7.0175 4.2270 10.0374 9.6092 3.4918
Median 17.000 .000 .000 75.000 67.000 100.000 100.000 100.000 50.000 .000
Mode 17.0 .0 .0 100.0 100.0 100.0 100.0 100.0 .0 .0
Standard.
Deviation
25.5934 21.8571 20.0149 33.3881 41.9873 30.5888 18.4250 43.7521 41.8854 15.2206
Variance 655.023 477.731 400.596 1114.766 1762.930 935.673 339.480 1914.246 1754.386 231.667
Skewness 1.320 2.366 2.790 -.599 -.609 -.924 -1.251 -.765 .119 .902
Standard.
Error of
Skewness
.524 .524 .524 .524 .524 .524 .524 .524 .524 .524
Kurtosis 2.416 4.385 9.284 -.998 -1.334 .038 -.402 -1.369 -1.671 -1.289
Standard.
Error of
Kurtosis
1.014 1.014 1.014 1.014 1.014 1.014 1.014 1.014 1.014 1.014
Range 100.0 67.0 83.0 100.0 100.0 100.0 43.0 100.0 100.0 33.0
Minimum .0 .0 .0 .0 .0 .0 57.0 .0 .0 .0
Maximum 100.0 67.0 83.0 100.0 100.0 100.0 100.0 100.0 100.0 33.0
Sum 501.0 167.0 218.0 1275.0 1168.0 1450.0 1699.0 1299.0 875.0 190.0
Table 4.13: Quantitative Statistics on Analytical Questions in Test 3
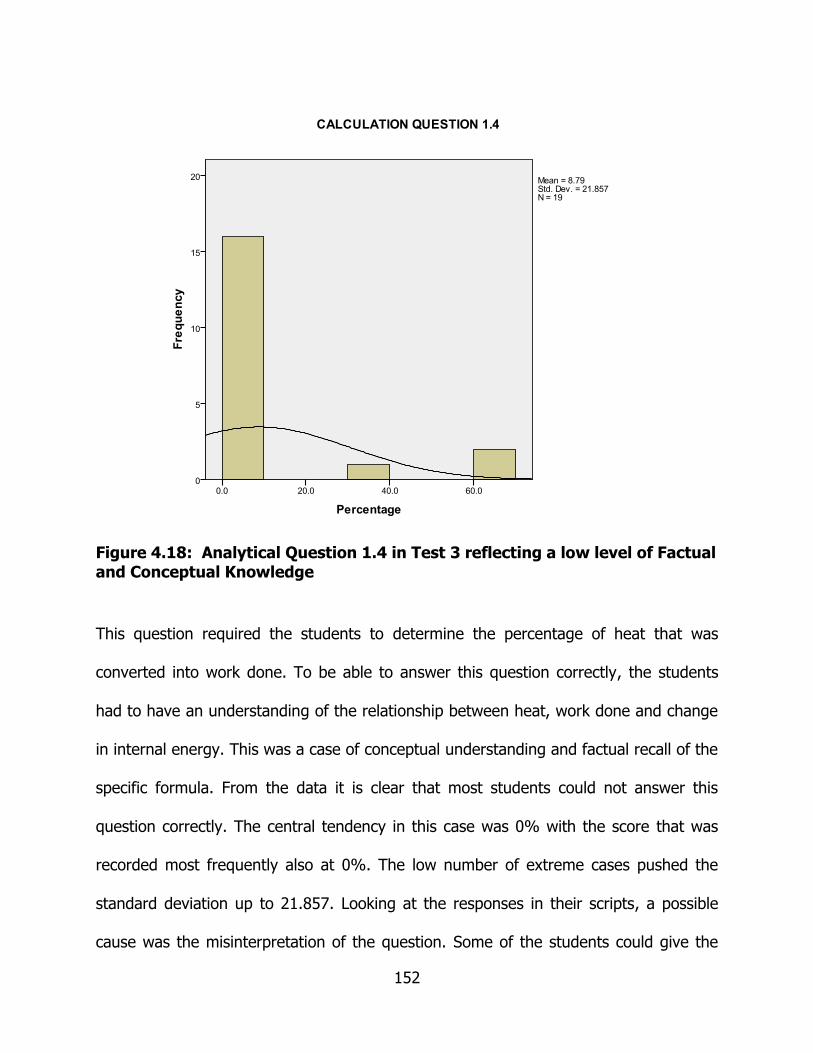
152
Figure 4.18: Analytical Question 1.4 in Test 3 reflecting a low level of Factual and Conceptual Knowledge
This question required the students to determine the percentage of heat that was
converted into work done. To be able to answer this question correctly, the students
had to have an understanding of the relationship between heat, work done and change
in internal energy. This was a case of conceptual understanding and factual recall of the
specific formula. From the data it is clear that most students could not answer this
question correctly. The central tendency in this case was 0% with the score that was
recorded most frequently also at 0%. The low number of extreme cases pushed the
standard deviation up to 21.857. Looking at the responses in their scripts, a possible
cause was the misinterpretation of the question. Some of the students could give the
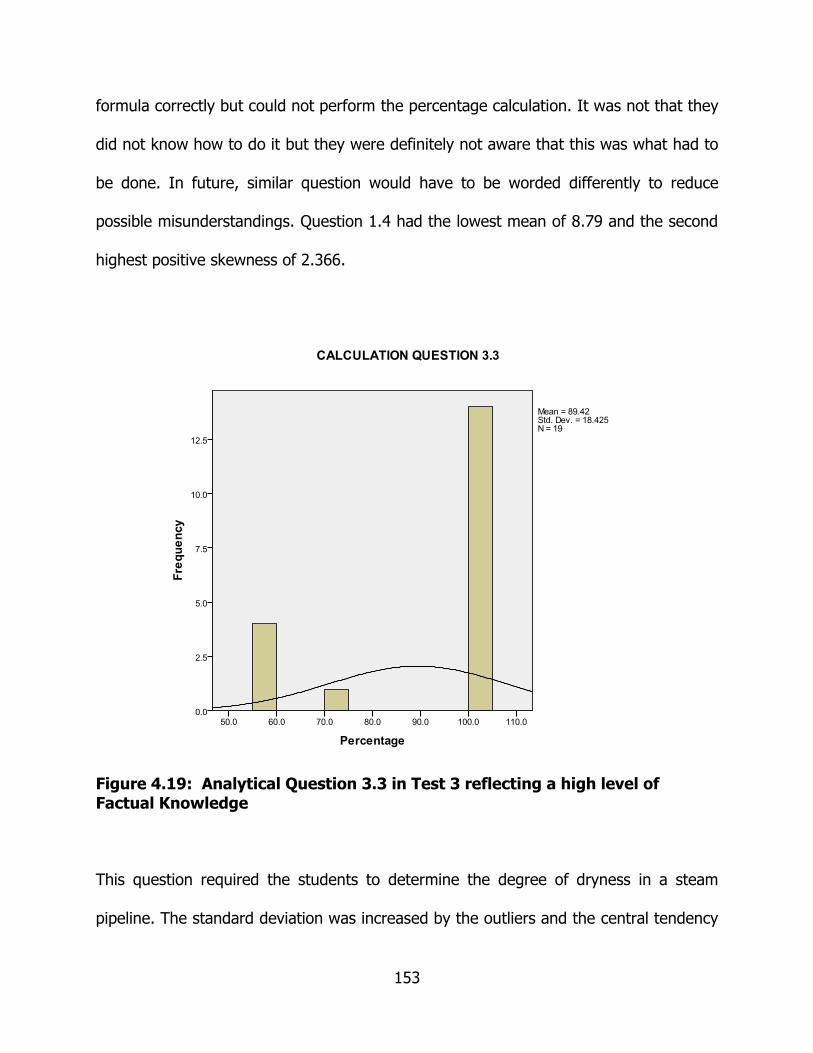
153
formula correctly but could not perform the percentage calculation. It was not that they
did not know how to do it but they were definitely not aware that this was what had to
be done. In future, similar question would have to be worded differently to reduce
possible misunderstandings. Question 1.4 had the lowest mean of 8.79 and the second
highest positive skewness of 2.366.
Figure 4.19: Analytical Question 3.3 in Test 3 reflecting a high level of Factual Knowledge
This question required the students to determine the degree of dryness in a steam
pipeline. The standard deviation was increased by the outliers and the central tendency
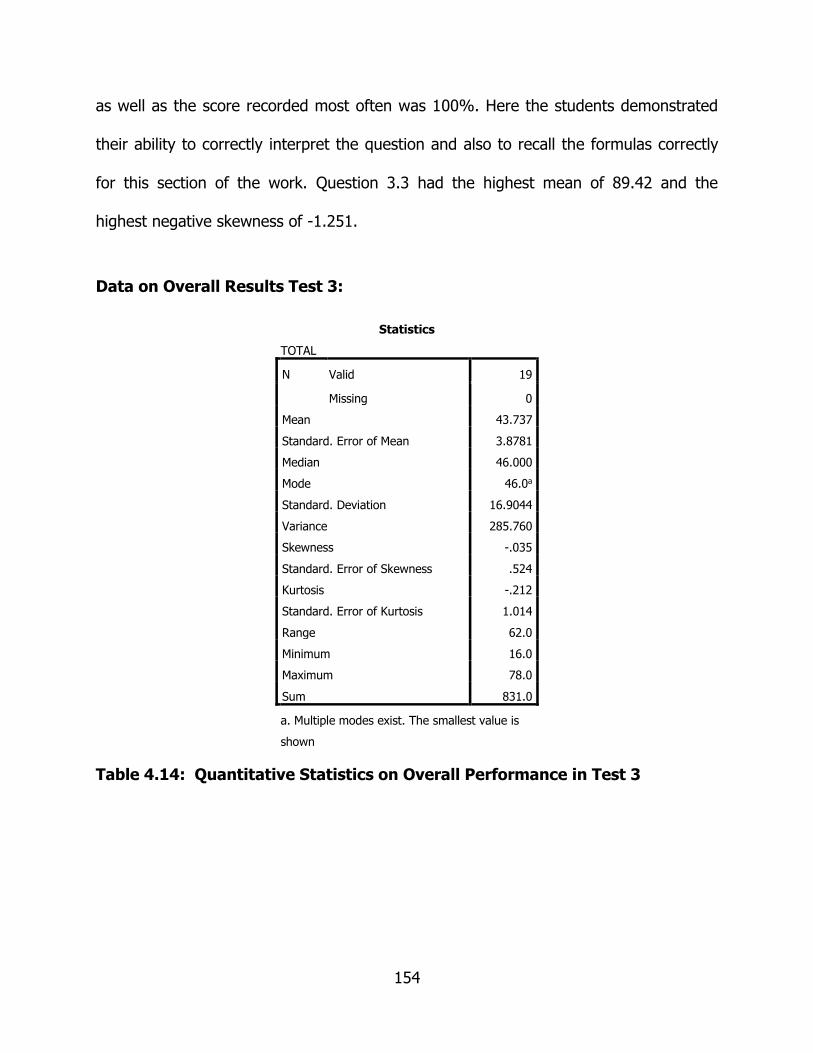
154
as well as the score recorded most often was 100%. Here the students demonstrated
their ability to correctly interpret the question and also to recall the formulas correctly
for this section of the work. Question 3.3 had the highest mean of 89.42 and the
highest negative skewness of -1.251.
Data on Overall Results Test 3:
Statistics
TOTAL
N Valid 19
Missing 0
Mean 43.737
Standard. Error of Mean 3.8781
Median 46.000
Mode 46.0a
Standard. Deviation 16.9044
Variance 285.760
Skewness -.035
Standard. Error of Skewness .524
Kurtosis -.212
Standard. Error of Kurtosis 1.014
Range 62.0
Minimum 16.0
Maximum 78.0
Sum 831.0
a. Multiple modes exist. The smallest value is
shown
Table 4.14: Quantitative Statistics on Overall Performance in Test 3

155
Figure 4.20: Overall Performance in Test 3 reflecting a combined Factual and Conceptual Knowledge 43.74%
The data indicated that 68% of the students scored between 26.836% and 60.644%.
The small number of outliers pushed the standard deviation up to 16.904, however the
central tendency for the scores was 46% regardless of a small number of high values
that were recorded between 50% and 60%. The small tails gave low values for
skewness. The small negative skewness of -0.35 indicated that only a few more
students obtained higher scores than those whom obtained lower scores.

156
Data from Final Examination Theory Questions:
Statistics
T1 T2 T3 T4 T5 T6 T7 T8 T9
N Valid 15 15 15 15 15 15 15 15 15
Missing 0 0 0 0 0 0 0 0 0
Mean 32.493 42.133 50.000 56.733 57.333 32.800 65.133 34.667 6.667
Standard. Error of
Mean
7.9737 9.1879 11.9523 5.1533 8.0750 8.5106 7.3672 6.8914 2.9547
Median 30.000 33.000 50.000 67.000 60.000 33.000 72.000 40.000 .000
Mode .1a .0a .0a 67.0 30.0a .0 72.0 .0a .0
Standard. Deviation 30.8820 35.5846 46.2910 19.9588 31.2745 32.9614 28.5329 26.6905 11.4434
Variance 953.699 1266.267 2142.857 398.352 978.095 1086.457 814.124 712.381 130.952
Skewness .503 .514 .000 .233 -.184 .495 -1.196 -.061 1.176
Standard. Error of
Skewness
.580 .580 .580 .580 .580 .580 .580 .580 .580
Kurtosis -1.045 -.597 -1.974 -.181 -1.046 -1.053 .892 -1.226 -.734
Standard. Error of
Kurtosis
1.121 1.121 1.121 1.121 1.121 1.121 1.121 1.121 1.121
Range 90.0 100.0 100.0 67.0 100.0 92.0 100.0 80.0 25.0
Minimum .0 .0 .0 33.0 .0 .0 .0 .0 .0
Maximum 90.0 100.0 100.0 100.0 100.0 92.0 100.0 80.0 25.0
Sum 487.4 632.0 750.0 851.0 860.0 492.0 977.0 520.0 100.0
a. Multiple modes exist. The smallest value is shown
Table 4.15: Quantitative Statistics from Theory Question in Final Examination
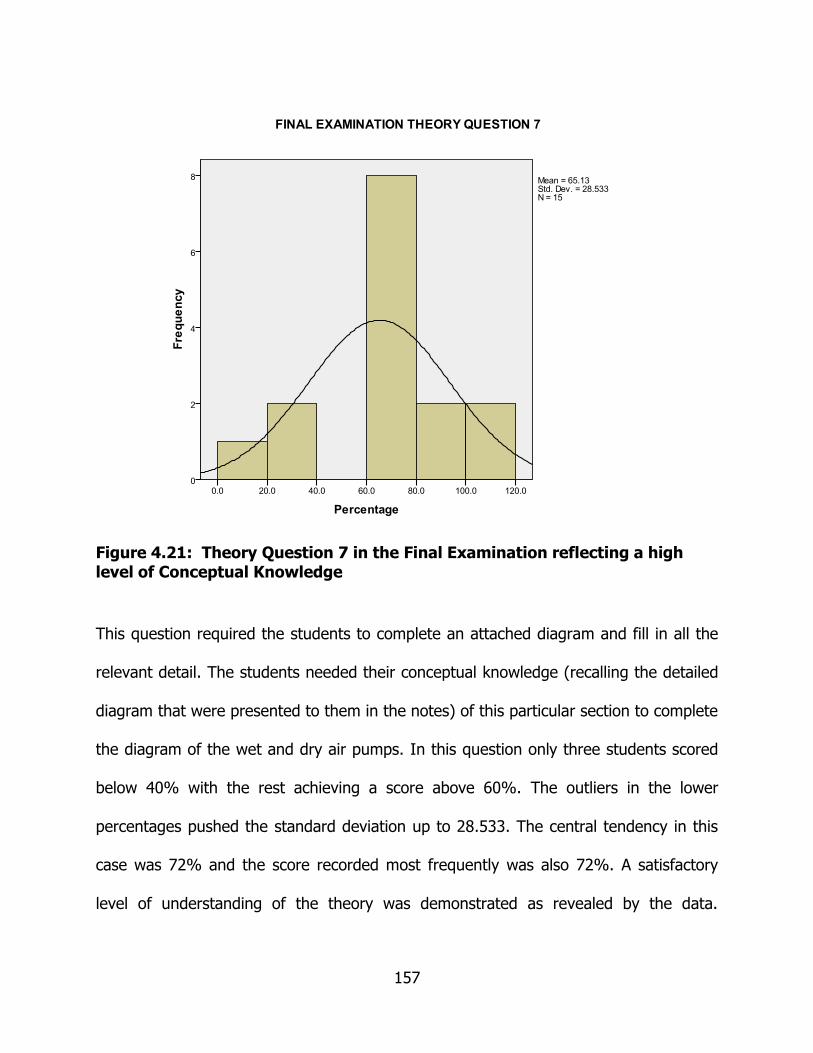
157
Figure 4.21: Theory Question 7 in the Final Examination reflecting a high level of Conceptual Knowledge
This question required the students to complete an attached diagram and fill in all the
relevant detail. The students needed their conceptual knowledge (recalling the detailed
diagram that were presented to them in the notes) of this particular section to complete
the diagram of the wet and dry air pumps. In this question only three students scored
below 40% with the rest achieving a score above 60%. The outliers in the lower
percentages pushed the standard deviation up to 28.533. The central tendency in this
case was 72% and the score recorded most frequently was also 72%. A satisfactory
level of understanding of the theory was demonstrated as revealed by the data.
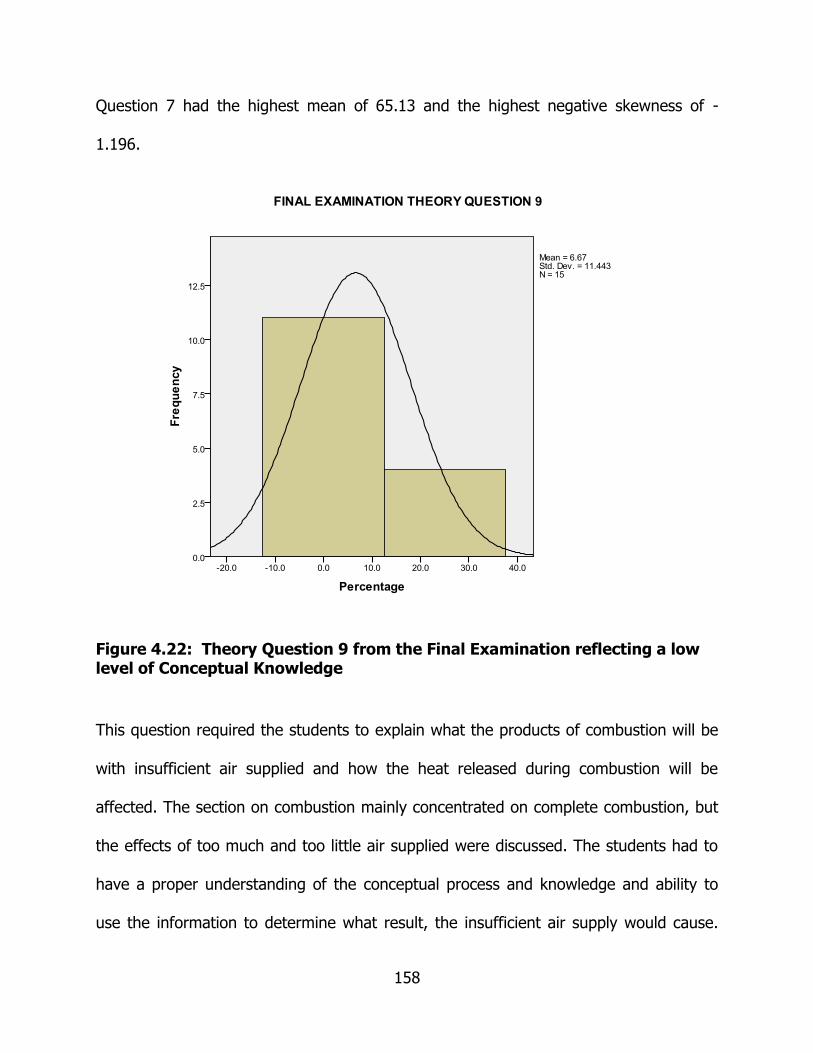
158
Question 7 had the highest mean of 65.13 and the highest negative skewness of -
1.196.
Figure 4.22: Theory Question 9 from the Final Examination reflecting a low level of Conceptual Knowledge
This question required the students to explain what the products of combustion will be
with insufficient air supplied and how the heat released during combustion will be
affected. The section on combustion mainly concentrated on complete combustion, but
the effects of too much and too little air supplied were discussed. The students had to
have a proper understanding of the conceptual process and knowledge and ability to
use the information to determine what result, the insufficient air supply would cause.

159
Only four students had an idea, although vague, regarding what was required from
them. In future, more time must be spent on discussing non-standard conditions which
was not normal or ideal so that the students could develop the ability to think outside of
the box, manipulating the knowledge which they had with respect to the ideal
conditions. This can be assisted through big group or small group discussions or even a
group assignment. Question 9 had the lowest mean of 6.67 and the highest positive
skewness of 1.176.

160
Data from Final Examination Analytical Questions:
Statistics
C1 C2 C3 C4 C5 C6 C7 C8 C9 C10 C11 C12 C13 C14 C15 C16
N Vali
d
15 15 15 15 15 15 15 15 15 15 15 15 15 15 15 15
Miss
ing
0 0 0 0 0 0 0 0 0 0 0 0 0 0 0 0
Mean 42.00
0
52.00
0
22.66
7
3.33
3
89.2
67
74.46
7
6.66
7
83.3
33
66.66
7
80.00
0
31.0
00
15.53
3
44.6
67
53.33
3
79.40
0
65.66
7
Standa
rd.
Error
of
Mean
11.43
10
8.462
8
9.127
0
3.33
33
4.54
03
9.608
5
6.66
67
7.96
82
8.333
3
9.511
9
7.61
76
9.120
8
7.85
99
13.33
33
8.175
9
8.658
4
Media
n
50.00
0
60.00
0
.000 .000 100.
000
100.0
00
.000 100.
000
50.00
0
100.0
00
33.0
00
.000 50.0
00
100.0
00
100.0
00
70.00
0
Mode .0 40.0a .0 .0 100.
0
100.0 .0 100.
0
50.0a 100.0 33.0 .0 50.0a 100.0 100.0 100.0
Standa
rd.
Deviati
on
44.27
19
32.77
63
35.34
86
12.9
099
17.5
844
37.21
34
25.8
199
30.8
607
32.27
49
36.83
94
29.5
030
35.32
48
30.4
412
51.63
98
31.66
52
33.53
39
Varian
ce
1960.
000
1074.
286
1249.
524
166.
667
309.
210
1384.
838
666.
667
952.
381
1041.
667
1357.
143
870.
429
1247.
838
926.
667
2666.
667
1002.
686
1124.
524
Skewn
ess
.302 -.148 1.380 3.87
3
-
1.71
1
-
1.220
3.87
3
-
1.79
2
-.426 -
1.632
.876 2.179 .327 -.149 -
1.486
-.590
Standa
rd.
Error
of
Skewn
ess
.580 .580 .580 .580 .580 .580 .580 .580 .580 .580 .580 .580 .580 .580 .580 .580
Kurtosi
s
-
1.791
-.984 .443 15.0
00
1.88
1
.164 15.0
00
2.62
5
-.666 1.320 .675 3.471 -
.091
-
2.308
1.422 -.742
Standa
rd.
Error
of
Kurtosi
s
1.121 1.121 1.121 1.12
1
1.12
1
1.121 1.12
1
1.12
1
1.121 1.121 1.12
1
1.121 1.12
1
1.121 1.121 1.121
Range 100.0 100.0 100.0 50.0 50.0 100.0 100.
0
100.
0
100.0 100.0 100.
0
100.0 100.
0
100.0 100.0 100.0
Minim
um
.0 .0 .0 .0 50.0 .0 .0 .0 .0 .0 .0 .0 .0 .0 .0 .0
Maxim
um
100.0 100.0 100.0 50.0 100.
0
100.0 100.
0
100.
0
100.0 100.0 100.
0
100.0 100.
0
100.0 100.0 100.0
Sum 630.0 780.0 340.0 50.0 1339
.0
1117.
0
100.
0
1250
.0
1000.
0
1200.
0
465.
0
233.0 670.
0
800.0 1191.
0
985.0
a. Multiple modes exist. The smallest value is shown
Table 4.16: Quantitative Statistics from Analytical Question in Final Examination
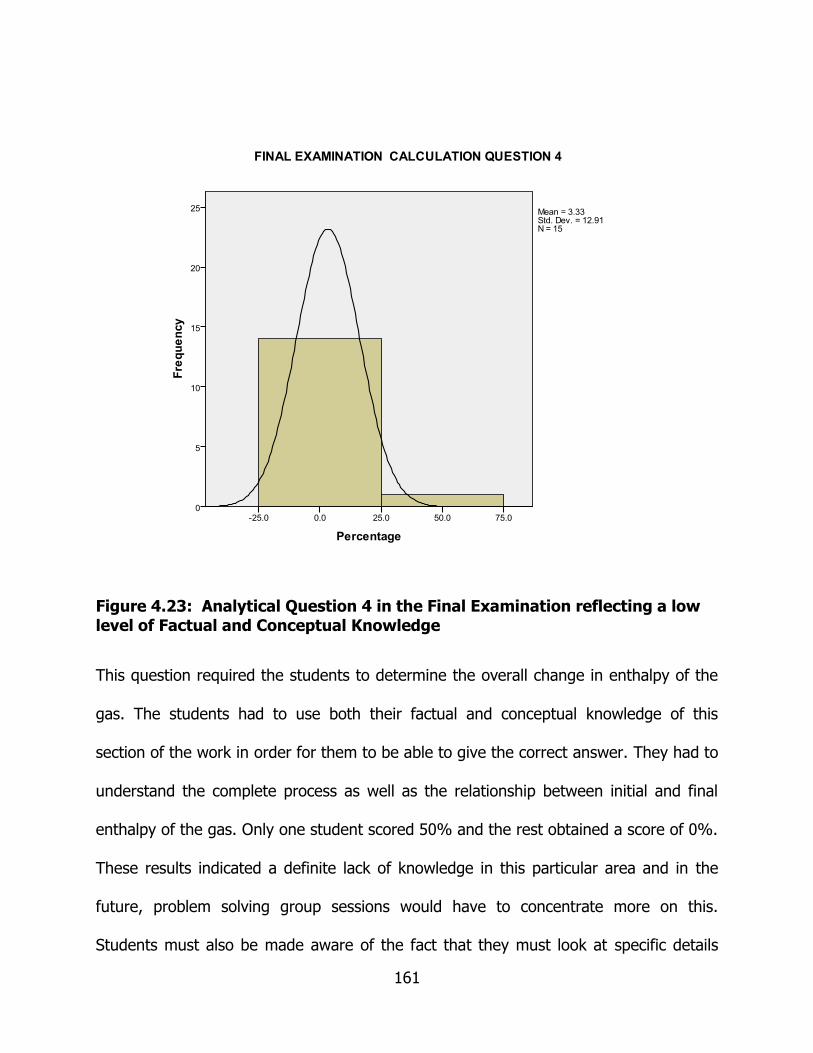
161
Figure 4.23: Analytical Question 4 in the Final Examination reflecting a low level of Factual and Conceptual Knowledge
This question required the students to determine the overall change in enthalpy of the
gas. The students had to use both their factual and conceptual knowledge of this
section of the work in order for them to be able to give the correct answer. They had to
understand the complete process as well as the relationship between initial and final
enthalpy of the gas. Only one student scored 50% and the rest obtained a score of 0%.
These results indicated a definite lack of knowledge in this particular area and in the
future, problem solving group sessions would have to concentrate more on this.
Students must also be made aware of the fact that they must look at specific details
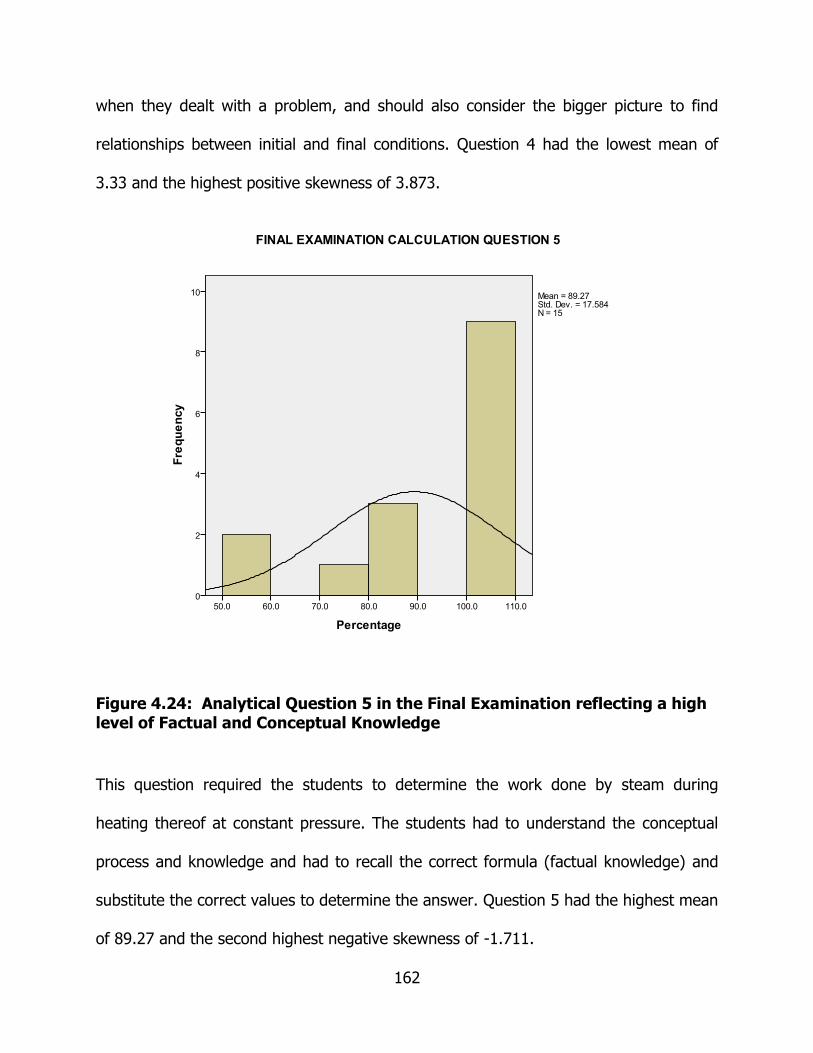
162
when they dealt with a problem, and should also consider the bigger picture to find
relationships between initial and final conditions. Question 4 had the lowest mean of
3.33 and the highest positive skewness of 3.873.
Figure 4.24: Analytical Question 5 in the Final Examination reflecting a high level of Factual and Conceptual Knowledge
This question required the students to determine the work done by steam during
heating thereof at constant pressure. The students had to understand the conceptual
process and knowledge and had to recall the correct formula (factual knowledge) and
substitute the correct values to determine the answer. Question 5 had the highest mean
of 89.27 and the second highest negative skewness of -1.711.

163
Data from Final Examination Overall Results:
Statistics
TOTAL
N Valid 19
Missing 0
Mean 51.158
Standard. Error of Mean 4.2332
Median 56.000
Mode 58.0
Standard. Deviation 18.4519
Variance 340.474
Skewness -.625
Standard. Error of Skewness .524
Kurtosis .309
Standard. Error of Kurtosis 1.014
Range 74.0
Minimum 11.0
Maximum 85.0
Sum 972.0
Table 4.17: Quantitative Statistics from Overall Performance in Final Examination

164
Figure 4.25: Overall Performance in the Final Examination reflecting a combined Factual and Conceptual Knowledge achievement of 51.16%
From the data 68% of the students scored between 32.706% and 69.91%. The central
tendency in the scores was 56% although a small number of extreme high values were
recorded in the vicinity of the median. The score most often recorded was 58% as
indicated on the histogram, which was 7.16% higher than the mean. Low skewness
resulted in an almost normal curve. The negative skewness also indicated that a larger
number of high scores than lower scores were obtained.

165
Reliability statistics on Tests 1, 1B, 2, 3 and Final Examination:
Reliability Statistics
Cronbach's
Alpha
Cronbach's
Alpha Based on
Standardized
Items N of Items
.879 .936 10
Table 4.18: Quantitative Statistics on Reliability for Tests 1, 1b, 2, 3 and Final Examination
The Cronbach’s Alpha test for internal consistency of the instruments gave a score of
= 0.88 for the written assessments. The Cronbach’s Alpha reliability coefficient ranges
from 0 to 1. The closer the value of alpha is to 1.0 the greater the internal consistency
of the instruments.
4.3.2 Addressing the Third Research Question
In this study, the third research question ‘What would be the effect of a guided enquiry-
based learning (GEBL) approach on mechanical engineering students’ ability to
communicate procedures and processes related to MTHE 2?’ the following section
presents data from oral tests:

166
Data from Oral Test 1:
Statistics
T1 T4 T7 T11 T22 T26 T31 T33 T34 T39 T41 T42 T43
N Valid 7 7 7 7 7 7 7 7 7 7 7 7 7
Missin
g
0 0 0 0 0 0 0 0 0 0 0 0 0
Mean 85.714 42.85
7
91.42
9
91.42
9
67.857 38.000 71.429 7.143 .000 57.000 28.571 57.143 32.143
Standard
. Error of
Mean
14.285
7
9.607
6
5.947
6
4.040
6
16.104
5
13.494
3
14.869
0
7.142
9
.000
0
14.494
7
14.869
0
20.203
1
13.041
0
Median 100.00
0
33.00
0
100.0
00
100.0
00
100.00
0
33.000 100.00
0
.000 .000 50.000 .000 100.00
0
25.000
Mode 100.0 33.0a 100.0 100.0 100.0 33.0 100.0 .0 .0 33.0a .0 100.0 .0
Standard
.
Deviatio
n
37.796
4
25.41
93
15.73
59
10.69
04
42.608
4
35.702
5
39.339
8
18.89
82
.000
0
38.349
3
39.339
8
53.452
2
34.503
3
Variance 1428.5
71
646.1
43
247.6
19
114.2
86
1815.4
76
1274.6
67
1547.6
19
357.1
43
.000 1470.6
67
1547.6
19
2857.1
43
1190.4
76
Skewnes
s
-2.646 -.559 -1.760 -.374 -.796 .782 -1.115 2.646
-.151 1.115 -.374 .359
Standard
. Error of
Skewnes
s
.794 .794 .794 .794 .794 .794 .794 .794 .794 .794 .794 .794 .794
Kurtosis 7.000 -.458 2.361 -2.800 -1.301 .246 .273 7.000 -1.405 .273 -2.800 -2.090
Standard
. Error of
Kurtosis
1.587 1.587 1.587 1.587 1.587 1.587 1.587 1.587 1.58
7
1.587 1.587 1.587 1.587
Range 100.0 67.0 40.0 20.0 100.0 100.0 100.0 50.0 .0 100.0 100.0 100.0 75.0
Minimum .0 .0 60.0 80.0 .0 .0 .0 .0 .0 .0 .0 .0 .0
Maximu
m
100.0 67.0 100.0 100.0 100.0 100.0 100.0 50.0 .0 100.0 100.0 100.0 75.0
Sum 600.0 300.0 640.0 640.0 475.0 266.0 500.0 50.0 .0 399.0 200.0 400.0 225.0
a. Multiple modes exist. The smallest value is shown
Table 4.19: Quantitative Statistics from Oral Test 1

167
Figure 4.26: Question 7 in Oral Test 1 reflecting a high level of Conceptual Knowledge
In this question, the students had to explain to the examiner which components
constituted the steady flow energy equation. The scores varied between 60% and
100% with the majority of the students getting 100% for the question which resulted in
the mode being 100%. One student obtained 60% and one 80% which resulted in the
standard deviation being pushed up by these outliers. Question 7 had the highest mean
of 91.43 and the second highest negative skewness of -1.760.

168
Figure 4.27: Question 11 in Oral Test 1 reflecting a high level of Conceptual Knowledge
In this question, the students had to explain which products would appear in the table
for the mass analysis of a specific fuel. The histogram showed closeness to a normal
curve with the mode and the median being 100. Most students could express
themselves clearly and could list the products of combustion correctly. The scores
varied between 80% and 100%. Question 11 together with question 7 had the highest
mean of 91.43 and a low negative skewness of -0.374.

169
Figure 4.28: Question 34 in Oral Test 1 reflecting a low level of Conceptual Knowledge
In this question, the students had to explain how the water treatment of an electrode
boiler differed from that of a normal coal fired boiler. On this particular section of the
work, the students were given a project with certain questions to which they had to find
answers. One of these questions was to investigate the difference between coal fired
and electrode boilers with regard to their construction, operation and water treatment.
Here the students hat to tap into their memory and retrieve the information which they
had found during their project. Not a single student could answer this question correctly
as revealed by the data. A possible cause to the problem could be that students did not

170
regard the contents of their project to be included in assessments and once they have
submitted it, they forget about it. To overcome this, feedback sessions can be
introduced on completed projects as part of a group activity and in this way discussing
their findings and making them aware of the importance and relevance of project work
to enrich the content knowledge in the course work modules. Question 34 had the
lowest mean of 0, and a skewness of 0.

171
Data from Oral Test 2:
Statistics
T2 T3 T5 T8 T9 T10 T13 T21 T25 T30 T37 T38 T40 T44 T46
N Valid 8 8 8 8 8 8 8 8 8 8 8 8 8 8 8
Missi
ng
0 0 0 0 0 0 0 0 0 0 0 0 0 0 0
Mean 31.25
0
100.0
00
93.75
0
83.25
0
86.25
0
56.25
0
12.50
0
65.12
5
37.50
0
71.87
5
12.50
0
83.25
0
50.00
0
12.50
0
50.12
5
Standa
rd.
Error
of
Mean
13.15
26
.0000 6.250
0
9.480
7
12.38
34
17.51
91
9.449
1
8.463
0
13.23
28
11.01
69
12.50
00
4.410
8
12.50
00
12.50
00
12.32
95
Median 25.00
0
100.0
00
100.0
00
100.0
00
100.0
00
75.00
0
.000 75.00
0
25.00
0
75.00
0
.000 83.00
0
50.00
0
.000 50.00
0
Mode .0 100.0 100.0 100.0 100.0 100.0 .0 75.0 .0a 100.0 .0 83.0 50.0 .0 50.0
Standa
rd.
Deviati
on
37.20
12
.0000 17.67
77
26.81
55
35.02
55
49.55
16
26.72
61
23.93
70
37.42
80
31.16
06
35.35
53
12.47
57
35.35
53
35.35
53
34.87
30
Varianc
e
1383.
929
.000 312.5
00
719.0
71
1226.
786
2455.
357
714.2
86
572.9
82
1400.
857
970.9
82
1250.
000
155.6
43
1250.
000
1250.
000
1216.
125
Skewn
ess
.824
-
2.828
-
1.384
-2.775 -.312 2.339 -.647 .790 -.286 2.828 .080 .404 2.828 -.574
Standa
rd.
Error
of
Skewn
ess
.752 .752 .752 .752 .752 .752 .752 .752 .752 .752 .752 .752 .752 .752 .752
Kurtosi
s
-.152
8.000 .399 7.756 -2.358 5.469 .753 -.728 -
1.984
8.000 -.698 -.614 8.000 -.930
Standa
rd.
Error
of
Kurtosi
s
1.481 1.481 1.481 1.481 1.481 1.481 1.481 1.481 1.481 1.481 1.481 1.481 1.481 1.481 1.481
Range 100.0 .0 50.0 67.0 100.0 100.0 75.0 79.0 100.0 75.0 100.0 33.0 100.0 100.0 88.0
Minimu
m
.0 100.0 50.0 33.0 .0 .0 .0 21.0 .0 25.0 .0 67.0 .0 .0 .0
Maxim
um
100.0 100.0 100.0 100.0 100.0 100.0 75.0 100.0 100.0 100.0 100.0 100.0 100.0 100.0 88.0
Sum 250.0 800.0 750.0 666.0 690.0 450.0 100.0 521.0 300.0 575.0 100.0 666.0 400.0 100.0 401.0
a. Multiple modes exist. The smallest value is shown
Table 4.20: Quantitative Statistics from Oral Test 2

172
Figure 4.29: Question 3 in Oral Test 2 reflecting a high level of Conceptual Knowledge
In this question, the students had to define the term ‘reversible process.’ Here, the
students had to use their conceptual knowledge of this section to explain the answer
correctly. As indicated by the data everybody had 100% for this question. Question 3
had the highest mean of 100 and a skewness of 0.

173
Figure 4.30: Question 13 in Oral Test 2 reflecting a low level of Conceptual Knowledge
In this question, the students had to explain to the examiner how the amount of vapour
would be determined in the case of a liquid and gaseous fuel when calculating the
lower calorific values of the fuels. Only one student scored 75% and another 25%, the
rest had 0%. As indicated on the histogram, most students failed this question. The
standard deviation was pushed up by the single outliers in the high percentages. To be
able to answer this question correctly, students had to use their factual and conceptual
knowledge of this section of the work. The data revealed that most students could not
do this, which showed that students had to spend more time on this section during
problem solving sessions with a variety of problems containing higher and lower
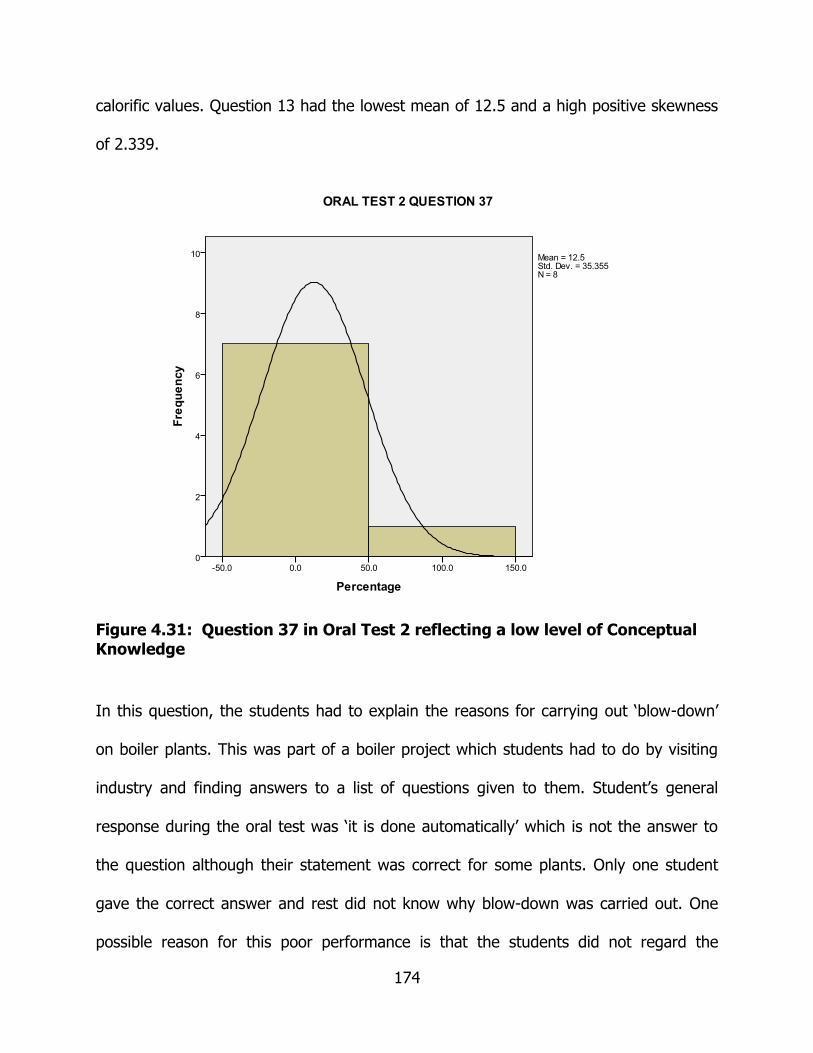
174
calorific values. Question 13 had the lowest mean of 12.5 and a high positive skewness
of 2.339.
Figure 4.31: Question 37 in Oral Test 2 reflecting a low level of Conceptual Knowledge
In this question, the students had to explain the reasons for carrying out ‘blow-down’
on boiler plants. This was part of a boiler project which students had to do by visiting
industry and finding answers to a list of questions given to them. Student’s general
response during the oral test was ‘it is done automatically’ which is not the answer to
the question although their statement was correct for some plants. Only one student
gave the correct answer and rest did not know why blow-down was carried out. One
possible reason for this poor performance is that the students did not regard the

175
content of project work as being part of the syllabus on which they would be assessed
upon. Another reason could be that project work was normally done in groups and that
some of the group members were passive and copied the work done by the others. In
future feedback on these projects must be introduced into the group sessions for
discussion. Question 37 had the lowest mean of 12.5 and the highest positive skewness
of 2.828.
Figure 4.32: Question 44 in Oral Test 2 reflecting a low level of Conceptual Knowledge
In this question, the students had to explain how air entered a surface condenser. This
question required the students to use their conceptual knowledge on this section of the
syllabus to give the correct explanation. One student could do this, which meant that all

176
the others did not understand how air entered the system, resulting in the central
tendency to be 0. This resulted in a median and mode of 0. The low number of outliers
in the higher percentages increased the standard deviation to 35.355. During the
introduction of condensers to the students, all important aspects were covered and
explained. However students should be given extra time to work on this in their groups
and more time for discussion must be allowed. Question 44 had the lowest mean of
12.5 and highest positive skewness of 2.828.
Data from Oral Tests 1 and 2 Overall Results:
Statistics
TOTAL
N Valid 15
Missing 0
Mean 58.467
Standard. Error of Mean 4.1160
Median 61.000
Mode 64.0a
Standard. Deviation 15.9413
Variance 254.124
Skewness -.830
Standard. Error of Skewness .580
Kurtosis -.241
Standard. Error of Kurtosis 1.121
Range 51.0
Minimum 26.0
Maximum 77.0
Sum 877.0
a. Multiple modes exist. The smallest value is
shown
Table 4.21: Quantitative Statistics from Overall Performance in Oral Tests 1 and 2

177
Figure 4.33: Overall Performance in Oral Tests 1 and 2 reflecting a Conceptual Knowledge level 58.47%
The attention of the reader is once again drawn to the fact that the final examination
was written on the entire syllabus (seven modules) which was covered over a period of
13 weeks. Students used the GEBL approach when preparing for the examination in
groups.

178
4.3.3 Structured Questionnaire
A questionnaire (see Appendix 1) was handed out to 15 students to determine their
opinion regarding the GEBL process which they were subjected to for one semester.
The research question/s addressed by each item will be indicated in brackets. From the
data the following findings were made:
Item 1 (RQ 3):
Statistics
Q1
N Valid 15
Missing 0
Mean 1.4667
Standard. Error of Mean .21529
Median 1.0000
Mode 1.00
Standard. Deviation .83381
Variance .695
Skewness 2.253
Standard. Error of Skewness .580
Kurtosis 5.776
Standard. Error of Kurtosis 1.121
Range 3.00
Minimum 1.00
Maximum 4.00
Sum 22.00
Table 4.22: Quantitative Statistics from Question 1 in Structured Questionnaire

179
Figure 4.34: Question 1 from the Structured Questionnaire reflecting 67% of students ‘strongly agree’
The questionnaire had a Likert-type scale of 1 to 5 with 1 = strongly agree, 2 = agree,
3 = neutral, 4 = disagree, 5 = strongly disagree. From the data 67% of the students
scored 0.636 (rounded off to 1) to 2.304 (rounded off to 2). The most common score
was indicated by the mode as ‘1’. The students therefore ‘strongly agreed’ that they
enjoyed the group sessions, 27% ‘agreed’ that they enjoyed the group sessions and 6%
‘disagreed’ that they enjoyed the group sessions. The standard deviation was influenced
by the single high score of ‘4’ (disagree). The skewness had a high positive value which
meant that the concentration of responses was in the lower scale between ‘1’ and ‘2’

180
and the high positive kurtosis (2.776 higher than the normal) indicated a peak in this
area.
Item 2 (RQ 1 & 2):
Statistics
Q2
N Valid 15
Missing 0
Mean 1.2667
Standard. Error of Mean .11819
Median 1.0000
Mode 1.00
Standard. Deviation .45774
Variance .210
Skewness 1.176
Standard. Error of Skewness .580
Kurtosis -.734
Standard. Error of Kurtosis 1.121
Range 1.00
Minimum 1.00
Maximum 2.00
Sum 19.00
Table 4.23: Quantitative Statistics from Question 2 in Structured Questionnaire

181
Figure 4.35: Question 2 from the Structured Questionnaire reflecting 73% of students ‘strongly agree’
73% ‘strongly agreed’ that the EBL helped them to analyse problems more effectively
and 27% ‘agreed’ and no other responses were recorded. The data indicated that both
the median and mode was ‘1’ (strongly agree) and that 68% of the students gave this
response. The positive skewness indicated a higher concentration of students in the
lower percentages of the scale.

182
Item 3 (RQ 1 & 2):
Statistics
Q3
N Valid 15
Missing 0
Mean 2.0667
Standard. Error of Mean .22817
Median 2.0000
Mode 3.00
Standard. Deviation .88372
Variance .781
Skewness -.142
Standard. Error of Skewness .580
Kurtosis -1.783
Standard. Error of Kurtosis 1.121
Range 2.00
Minimum 1.00
Maximum 3.00
Sum 31.00
Table 4.24: Quantitative Statistics from Question 3 in Structured Questionnaire

183
Figure 4.36: Question 3 from the Structured Questionnaire reflecting 33% of students ‘strongly agree’ and 27% ‘agree’
33% of the students ‘strongly agreed’ that when working alone, the EBL approach
helped them to analyse problems more effectively, 27% ‘agreed’ and 40% assumed a
‘neutral’ position.

184
Item 4 (RQ 1 & 2):
Statistics
Q4
N Valid 15
Missing 0
Mean 1.4000
Standard. Error of Mean .16330
Median 1.0000
Mode 1.00
Standard. Deviation .63246
Variance .400
Skewness 1.407
Standard. Error of Skewness .580
Kurtosis 1.264
Standard. Error of Kurtosis 1.121
Range 2.00
Minimum 1.00
Maximum 3.00
Sum 21.00
Table 4.25: Quantitative Statistics from Question 4 in Structured Questionnaire

185
Figure 4.37: Question 4 from the Structured Questionnaire reflecting 67% of the students ‘strongly agree’
67% of the students ‘strongly agreed’ that the EBL method helped them to understand
work better and not to just memorise it, 27% ‘agreed’ and 6% assumed a ‘neutral’
position.

186
Item 5 (RQ 1 & 2):
Statistics
Q5
N Valid 15
Missing 0
Mean 1.8000
Standard. Error of Mean .14475
Median 2.0000
Mode 2.00
Standard. Deviation .56061
Variance .314
Skewness -.112
Standard. Error of Skewness .580
Kurtosis .378
Standard. Error of Kurtosis 1.121
Range 2.00
Minimum 1.00
Maximum 3.00
Sum 27.00
Table 4.26: Quantitative Statistics from Question 5 in Structured Questionnaire

187
Figure 4.38: Question 5 from the Structured Questionnaire reflecting 27% of the students ‘strongly agree’ and 67% ‘agree’
27% of the students ‘strongly agreed’ that the EBL method helped them to develop the
ability to solve problems on their own, 67% ‘agreed’ and 6% assumed a ‘neutral’
position.

188
Item 6 (RQ 1 & 2):
Statistics
Q6
N Valid 15
Missing 0
Mean 1.5333
Standard. Error of Mean .21529
Median 1.0000
Mode 1.00
Standard. Deviation .83381
Variance .695
Skewness 2.012
Standard. Error of Skewness .580
Kurtosis 4.867
Standard. Error of Kurtosis 1.121
Range 3.00
Minimum 1.00
Maximum 4.00
Sum 23.00
Table 4.27: Quantitative Statistics from Question 6 in Structured Questionnaire

189
Figure 4.39: Question 6 from the Structured Questionnaire reflecting 60% of the students ‘strongly agree’
60% of the students ‘strongly agreed’ that the Thermodynamics booklet with questions
answer and discussions helped them to understand the work better, 33% ‘agreed’ and
6% ‘disagreed’.

190
Item 7 (RQ 1 & 2):
Statistics
Q7
N Valid 15
Missing 0
Mean 1.8667
Standard. Error of Mean .16523
Median 2.0000
Mode 2.00
Standard. Deviation .63994
Variance .410
Skewness .103
Standard. Error of Skewness .580
Kurtosis -.127
Standard. Error of Kurtosis 1.121
Range 2.00
Minimum 1.00
Maximum 3.00
Sum 28.00
Table 4.28: Quantitative Statistics from Question 7 in Structured Questionnaire

191
Figure 4.40: Question 7 from the Structured Questionnaire reflecting 27% of the students ‘strongly agree and 60% ‘agree’
27% of the students ‘strongly agreed’ that the Thermodynamics booklets’ additional
questions and answers helped them to understand and analyse new problems better,
60% ‘agreed’ and 13% assumed a ‘neutral’ position.

192
Item 8:
Statistics
Q8
N Valid 15
Missing 0
Mean 1.8000
Standard. Error of Mean .22254
Median 2.0000
Mode 2.00
Standard. Deviation .86189
Variance .743
Skewness 1.205
Standard. Error of Skewness .580
Kurtosis 1.800
Standard. Error of Kurtosis 1.121
Range 3.00
Minimum 1.00
Maximum 4.00
Sum 27.00
Table 4.29: Quantitative Statistics from Question 8 in Structured Questionnaire

193
Figure 4.41: Question 8 from the Structured Questionnaire reflecting 40% of the students ‘strongly agree’ and 47% ‘agree’
40% of the students ‘strongly agreed’ that the EBL method and help them understand
other courses better, 47% ‘agreed’, 6% assumed a ‘neutral’ position and 6%
‘disagreed’.

194
Item 9:
Statistics
Q9
N Valid 15
Missing 0
Mean 1.6000
Standard. Error of Mean .27255
Median 1.0000
Mode 1.00
Standard. Deviation 1.05560
Variance 1.114
Skewness 2.640
Standard. Error of Skewness .580
Kurtosis 8.173
Standard. Error of Kurtosis 1.121
Range 4.00
Minimum 1.00
Maximum 5.00
Sum 24.00
Table 4.30: Quantitative Statistics from Question 9 in Structured Questionnaire

195
Figure 4.42: Question 9 from the Structured Questionnaire reflecting 60% of the students ‘strongly agree’ and 33% ‘agree’
60% of the students ‘strongly agreed’ that the EBL method should also be introduced
into other course, 33% ‘agreed’ and 6% ‘strongly disagreed’. However one student who
indicated ‘strongly disagreed’ on the Likert-type scale gave an explanation contradicting
this in the open-ended questions. Comparing these responses with the interview
responses, all students were in favour of introducing this method into their other course
and a conclusion could therefore be made that the single response of ‘strongly disagree’
was due to a misinterpretation of the questionnaire question.

196
The overall impression from the responses indicated that students enjoyed working
together in groups, listening to each others’ opinions and views. They also enjoyed
sharing their opinions with their peers. An exchange of information took place during
discussions benefiting all group members. There was also a strong indication that this
approach helped them to solve problems in groups and on their own more effectively.
This could be as a result of the skill which they had developed to analyse problems
following the systematic approach illustrated in the EBL booklet. The students also
wanted this method of teaching and learning to be introduced into other courses which
meant that students found this to be a more effective method of transferring
knowledge and that also made MTHE2 which seemed to be a ‘difficult course’ to be
easier and more understandable.
4.3.4 Summary of Quantitative Data from Formative and Summative
Assessments
From the quantitative data presented above there is an indication that GEBL assisted
the students in dealing with larger more complex volumes of work. The students’
performance improved with an increased work load and more complex modules of the
syllabus. There was an improvement in their ability to factual recall of MTHE 2 concepts
as indicated in the Fig. 4.43. This answered the first research question.

197
Factional Knowledge
Line
No.
Test/
Exam
Modules Score %
1
1
0.5
50
2
1b
0.5
48
3
2
2
38
4
3
3
47
5
FE
7
51
Figure 4.43: Students Analytical Performance with an increased workload and with GEBL introduced after Second Assessment
The data also indicated an improvement of the students’ conceptual understanding of
MTHE 2 concepts, principles and applications as indicated in Fig. 4.45. This answered
the second research question. From the oral test data there was indication that GEBL
assisted students in explaining certain concepts and procedures related to MTHE 2 as
indicated in Fig. 4.45. This answered the third research question. The students’
responses gathered from the structured questionnaires were also in support of the data
recorded by the formative and summative assessments. There was an indication that
GEBL assisted them in learning and this was evident from the improvement in
assessment scores.
50 4838
47 51
0
20
40
60
1 2 3 4 5
PE
RC
EN
TA
GE
TESTS 1, 1B, 2, 3 & FINAL EXAMINATION
ANALYTICAL PERFORMANCE WITH
INCREASED WORKLOAD
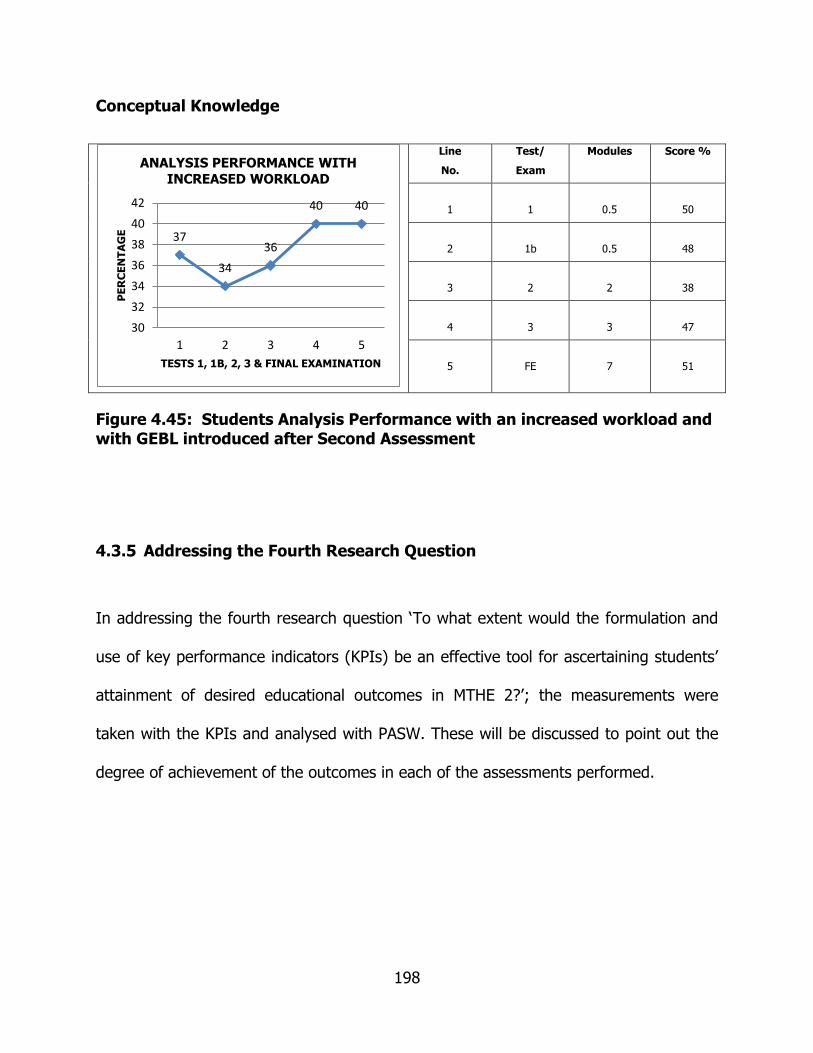
198
Conceptual Knowledge
Line
No.
Test/
Exam
Modules Score %
1
1
0.5
50
2
1b
0.5
48
3
2
2
38
4
3
3
47
5
FE
7
51
Figure 4.45: Students Analysis Performance with an increased workload and with GEBL introduced after Second Assessment
4.3.5 Addressing the Fourth Research Question
In addressing the fourth research question ‘To what extent would the formulation and
use of key performance indicators (KPIs) be an effective tool for ascertaining students’
attainment of desired educational outcomes in MTHE 2?’; the measurements were
taken with the KPIs and analysed with PASW. These will be discussed to point out the
degree of achievement of the outcomes in each of the assessments performed.
37
34
36
40 40
30
32
34
36
38
40
42
1 2 3 4 5
PE
RC
EN
TA
GE
TESTS 1, 1B, 2, 3 & FINAL EXAMINATION
ANALYSIS PERFORMANCE WITH
INCREASED WORKLOAD

199
Data from KPI Analysis Measurements Test1:
Statistics
ANALYSIS
N Valid 20
Missing 0
Mean 49.600
Standard. Error of Mean 2.2494
Median 48.500
Mode 43.0a
Standard. Deviation 10.0598
Variance 101.200
Skewness .200
Standard. Error of Skewness .512
Kurtosis -.619
Standard. Error of Kurtosis .992
Range 34.0
Minimum 33.0
Maximum 67.0
Sum 992.0
a. Multiple modes exist. The smallest value is
shown
Table 4.31: Quantitative Statistics from KPI Analysis Measurements in Test 1

200
Figure 4.46: Analysis Measurements with KPIs in Test 1
KPIs analysis measurement for Test 1 had a mean of 49.6 and a positive skewness of
0.200. These KPIs measured the ‘Students’ ability to apply MTHE 2 principles to analyse
and solve the problem accurately’ and the ‘Students’ ability to analyse a problem and
produce a solution, taking into account crucial factors in a systematic approach towards
the solution’. The data indicated that the central tendency was about 48.5% with the
score which was most often recorded being 43%. Outcomes were achieved by 49.6%
as a result of traditional teaching and learning approaches. The students’ ability to
acquire conceptual knowledge and understanding and the ability to use this knowledge
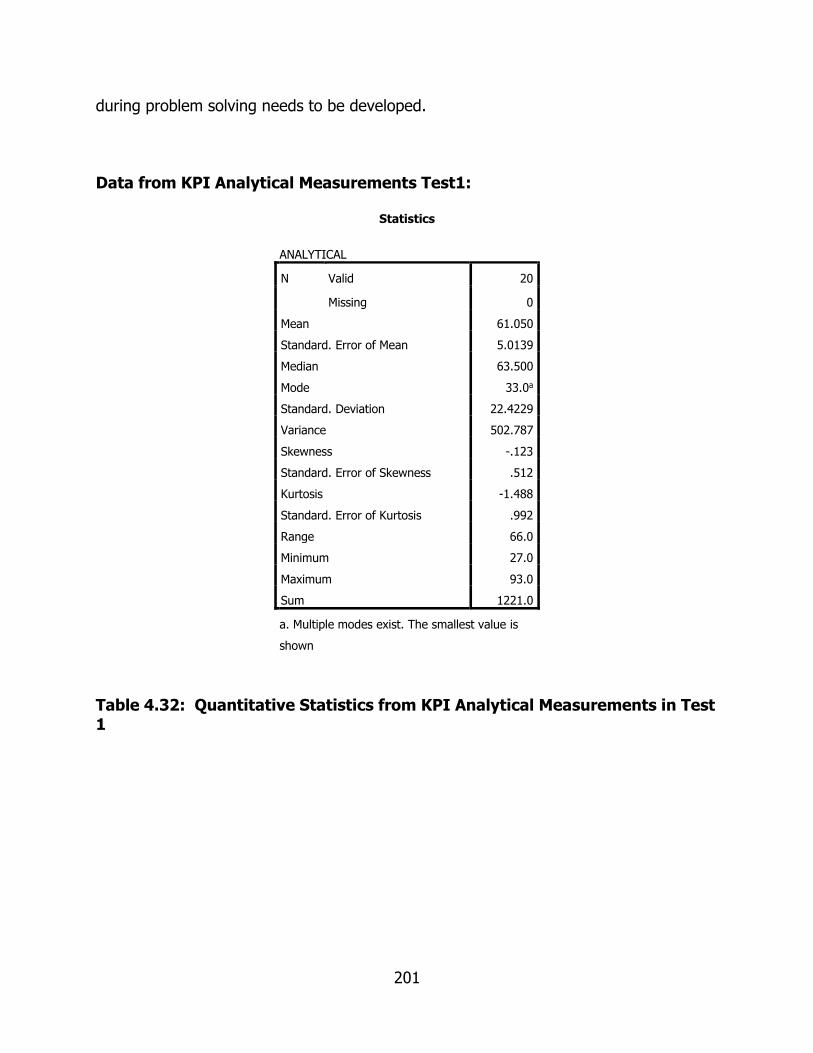
201
during problem solving needs to be developed.
Data from KPI Analytical Measurements Test1:
Statistics
ANALYTICAL
N Valid 20
Missing 0
Mean 61.050
Standard. Error of Mean 5.0139
Median 63.500
Mode 33.0a
Standard. Deviation 22.4229
Variance 502.787
Skewness -.123
Standard. Error of Skewness .512
Kurtosis -1.488
Standard. Error of Kurtosis .992
Range 66.0
Minimum 27.0
Maximum 93.0
Sum 1221.0
a. Multiple modes exist. The smallest value is
shown
Table 4.32: Quantitative Statistics from KPI Analytical Measurements in Test 1

202
Figure 4.47: Analytical Measurements with KPIs in Test 1
KPIs analytical measurement of Test 1 had a mean of 61.05 and a negative skewness
of 0.123. These KPIs measured the ‘Students’ ability to apply MTHE 2 principles to
analyse and solve the problem accurately’ and the ‘Students’ ability to analyse a
problem and produce a solution, taking into account crucial factors in a systematic
approach towards the solution’. A few extreme cases were recorded in the upper and
lower percentages. The central tendency was 63.5% which was approximately 2.5%
higher than the mean. However, the score most often recorded was 33%. In this case
the students achieved the outcomes measured by these KPIs by 61.05% with traditional
teaching and learning approaches. The students’ ability to acquire factual and
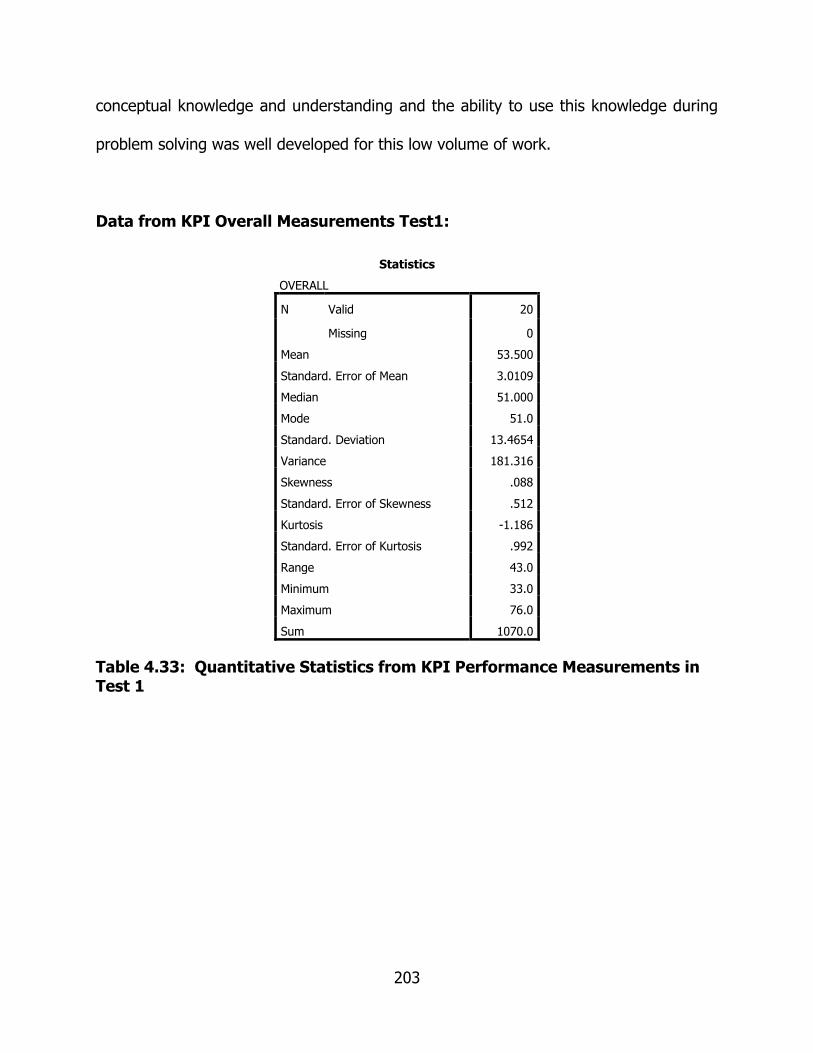
203
conceptual knowledge and understanding and the ability to use this knowledge during
problem solving was well developed for this low volume of work.
Data from KPI Overall Measurements Test1:
Statistics
OVERALL
N Valid 20
Missing 0
Mean 53.500
Standard. Error of Mean 3.0109
Median 51.000
Mode 51.0
Standard. Deviation 13.4654
Variance 181.316
Skewness .088
Standard. Error of Skewness .512
Kurtosis -1.186
Standard. Error of Kurtosis .992
Range 43.0
Minimum 33.0
Maximum 76.0
Sum 1070.0
Table 4.33: Quantitative Statistics from KPI Performance Measurements in Test 1

204
Figure 4.48: Overall Performance Measurements with KPIs in Test 1
The overall KPI measurement for Test 1 had a mean of 53.5 and a low positive
skewness of 0.088. The central tendency was 51% and the score most often recorded
was also 51%. Therefore, the extent to which the outcomes have been achieved in Test
1 as measured by the KPIs were 53.5% using traditional teaching and learning
approaches on the first half of module 1. The extent to which traditional teaching and
learning assisted the students in acquiring factual and conceptual knowledge and
understanding and the ability to use this knowledge during problem solving needs to be
developed more effectively.

205
Data from KPI Analysis Measurements Test 1b:
Statistics
ANALYSIS
N Valid 20
Missing 0
Mean 47.000
Standard. Error of Mean 1.7244
Median 46.000
Mode 43.0
Standard. Deviation 7.7119
Variance 59.474
Skewness -.171
Standard. Error of Skewness .512
Kurtosis -.281
Standard. Error of Kurtosis .992
Range 29.0
Minimum 31.0
Maximum 60.0
Sum 940.0
Table 4.34: Quantitative Statistics from KPI Analysis Measurements in Test 1b
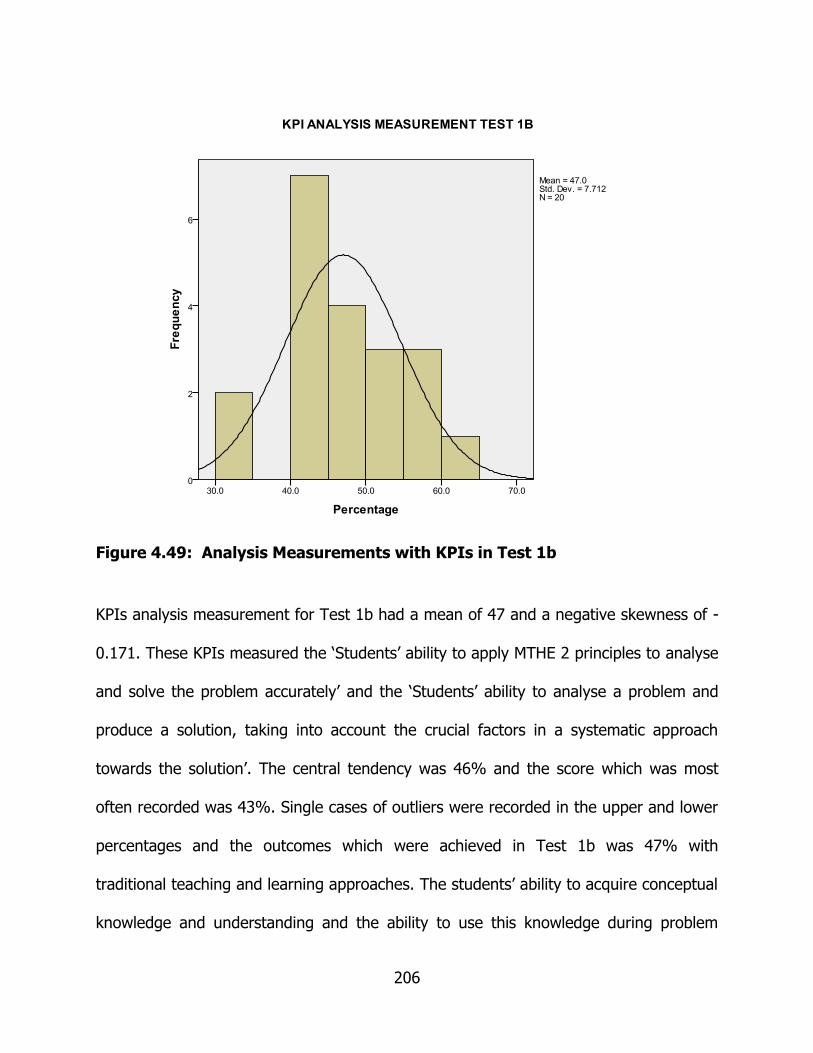
206
Figure 4.49: Analysis Measurements with KPIs in Test 1b
KPIs analysis measurement for Test 1b had a mean of 47 and a negative skewness of -
0.171. These KPIs measured the ‘Students’ ability to apply MTHE 2 principles to analyse
and solve the problem accurately’ and the ‘Students’ ability to analyse a problem and
produce a solution, taking into account the crucial factors in a systematic approach
towards the solution’. The central tendency was 46% and the score which was most
often recorded was 43%. Single cases of outliers were recorded in the upper and lower
percentages and the outcomes which were achieved in Test 1b was 47% with
traditional teaching and learning approaches. The students’ ability to acquire conceptual
knowledge and understanding and the ability to use this knowledge during problem

207
solving needs to be developed.
Data from KPI Analytical Measurements Test 1b:
Statistics
ANALYTICAL
N Valid 20
Missing 0
Mean 57.000
Standard. Error of Mean 2.9558
Median 60.000
Mode 65.0
Standard. Deviation 13.2188
Variance 174.737
Skewness -1.091
Standard. Error of Skewness .512
Kurtosis 2.469
Standard. Error of Kurtosis .992
Range 60.0
Minimum 20.0
Maximum 80.0
Sum 1140.0
Table 4.35: Quantitative Statistics from KPI Analytical Measurements in Test 1b
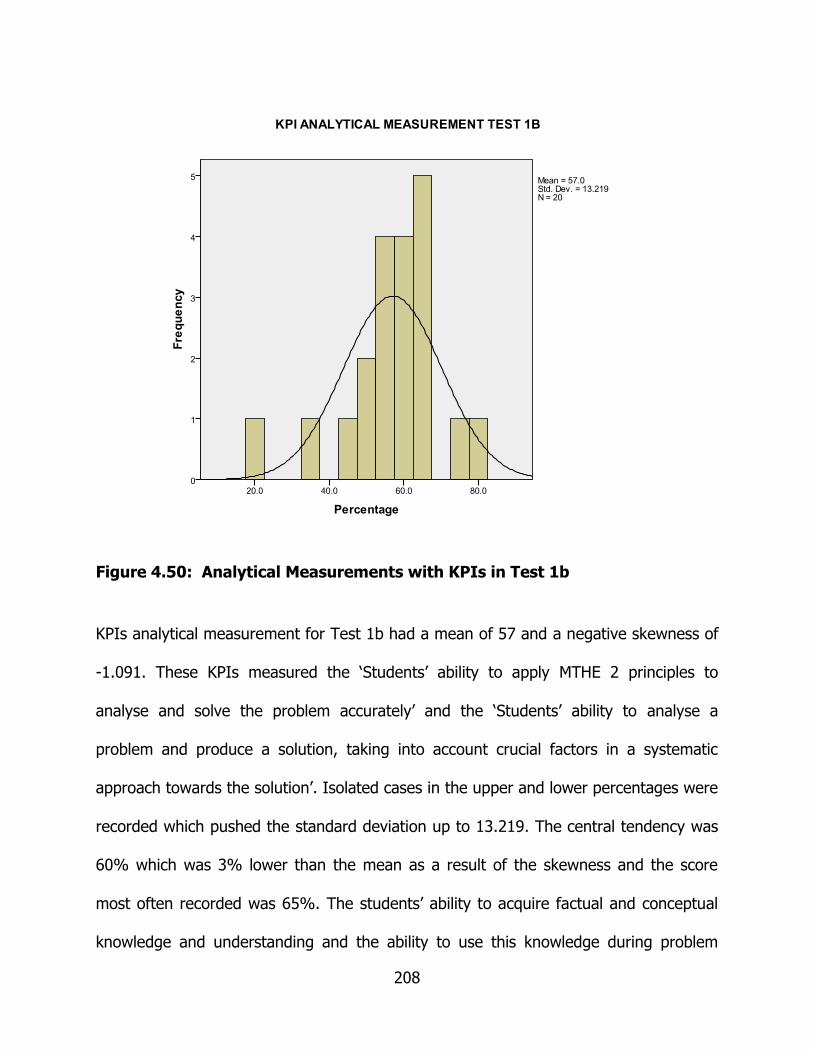
208
Figure 4.50: Analytical Measurements with KPIs in Test 1b
KPIs analytical measurement for Test 1b had a mean of 57 and a negative skewness of
-1.091. These KPIs measured the ‘Students’ ability to apply MTHE 2 principles to
analyse and solve the problem accurately’ and the ‘Students’ ability to analyse a
problem and produce a solution, taking into account crucial factors in a systematic
approach towards the solution’. Isolated cases in the upper and lower percentages were
recorded which pushed the standard deviation up to 13.219. The central tendency was
60% which was 3% lower than the mean as a result of the skewness and the score
most often recorded was 65%. The students’ ability to acquire factual and conceptual
knowledge and understanding and the ability to use this knowledge during problem

209
solving needs to be developed.
Data from KPI Overall Measurements Test 1b:
Statistics
OVERALL
N Valid 20
Missing 0
Mean 50.650
Standard. Error of Mean 1.9858
Median 52.000
Mode 49.0a
Standard. Deviation 8.8809
Variance 78.871
Skewness -.917
Standard. Error of Skewness .512
Kurtosis 1.808
Standard. Error of Kurtosis .992
Range 38.0
Minimum 27.0
Maximum 65.0
Sum 1013.0
a. Multiple modes exist. The smallest value is
shown
Table 4.36: Quantitative Statistics from KPI Overall Performance Measurements in Test 1b
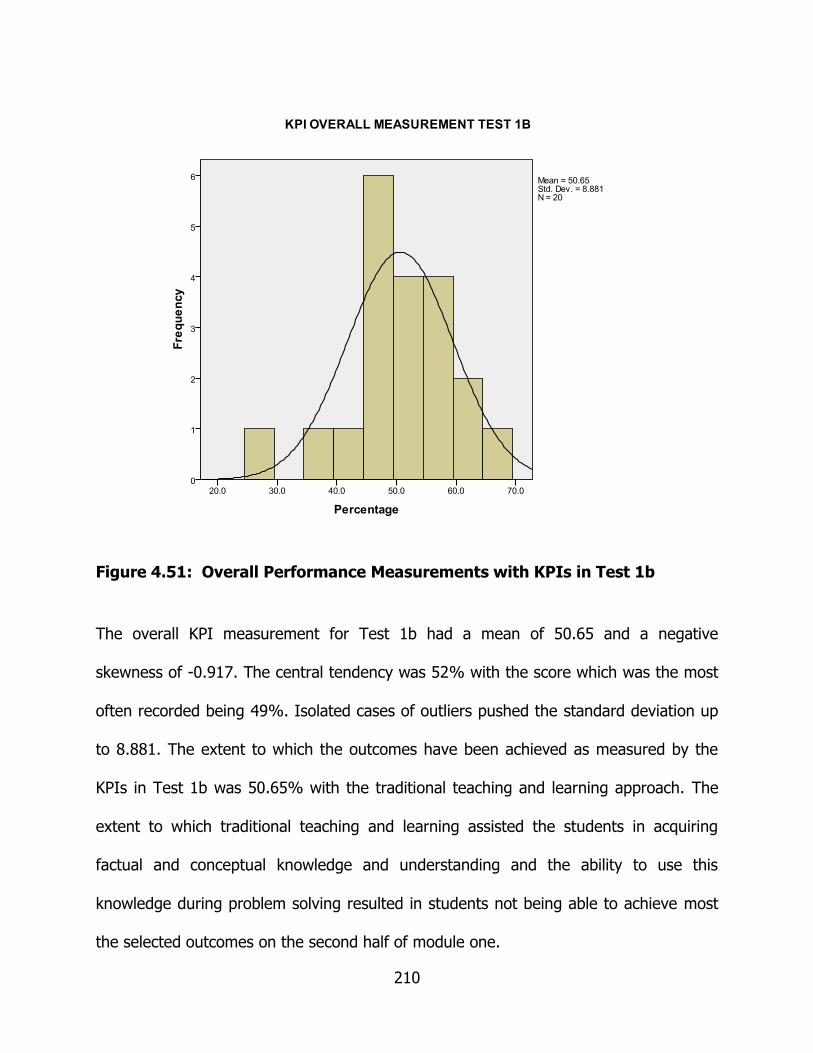
210
Figure 4.51: Overall Performance Measurements with KPIs in Test 1b
The overall KPI measurement for Test 1b had a mean of 50.65 and a negative
skewness of -0.917. The central tendency was 52% with the score which was the most
often recorded being 49%. Isolated cases of outliers pushed the standard deviation up
to 8.881. The extent to which the outcomes have been achieved as measured by the
KPIs in Test 1b was 50.65% with the traditional teaching and learning approach. The
extent to which traditional teaching and learning assisted the students in acquiring
factual and conceptual knowledge and understanding and the ability to use this
knowledge during problem solving resulted in students not being able to achieve most
the selected outcomes on the second half of module one.

211
Data from KPI Analysis Measurements Test 2:
Statistics
ANALYSIS
N Valid 20
Missing 0
Mean 50.100
Standard. Error of Mean 2.2975
Median 49.000
Mode 42.0
Standard. Deviation 10.2746
Variance 105.568
Skewness .100
Standard. Error of Skewness .512
Kurtosis -.869
Standard. Error of Kurtosis .992
Range 38.0
Minimum 31.0
Maximum 69.0
Sum 1002.0
Table 4.37: Quantitative Statistics from KPI Analysis Measurement in Test 2

212
Figure 4.52: Analysis Measurements with KPIs in Test 2
KPIs analysis measurement for Test 2 had a mean of 50.1 and a positive skewness of
0.1 These KPIs measured the ‘Students’ ability to apply MTHE 2 principles to analyse
and solve the problem accurately’ and the ‘Students’ ability to analyse a problem and
produce a solution, taking into account crucial factors in a systematic approach towards
the solution’. The central tendency here was 49% and the score most often recorded
was 42%. The degree of achievement of the outcomes was however higher than in
Test 1b which can be contributed to the fact that GEBL did assist student learning and
knowledge retention despite the larger volumes of work. It can also be pointed out that
GEBL assisted the students in developing the ability to deal with more complex work

213
and master it.
Data from KPI Analytical Measurements Test 2:
Statistics
ANALYTICAL
N Valid 20
Missing 0
Mean 52.250
Standard. Error of Mean 2.3917
Median 50.000
Mode 60.0
Standard. Deviation 10.6962
Variance 114.408
Skewness .023
Standard. Error of Skewness .512
Kurtosis -.926
Standard. Error of Kurtosis .992
Range 35.0
Minimum 35.0
Maximum 70.0
Sum 1045.0
Table 4.38: Quantitative Statistics from KPI Analytical Measurements in Test 2

214
Figure 4.53: Analytical Measurements with KPIs in Test 2
KPIs analytical measurement for Test 2 had a mean of 52.25 and a small positive
skewness of 0.023. KPIs measured the ‘Students’ ability to apply MTHE 2 principles to
analyse and solve the problem accurately’ and the ‘Students’ ability to analyse a
problem and produce a solution, taking into account crucial factors in a systematic
approach towards the solution’. The central tendency in this case was 50% and the
score that was recorded the most often was 60%. The degree of achievement of the
outcomes was however lower than with traditional teaching and learning which can be

215
contributed to the fact that the GEBL intervention took some time before its full effect
was realised and experienced by the students.
Data from KPI Overall Measurements Test 2:
Statistics
OVERALL
N Valid 20
Missing 0
Mean 51.850
Standard. Error of Mean 1.6047
Median 50.500
Mode 59.0
Standard. Deviation 7.1765
Variance 51.503
Skewness -.261
Standard. Error of Skewness .512
Kurtosis -.706
Standard. Error of Kurtosis .992
Range 26.0
Minimum 37.0
Maximum 63.0
Sum 1037.0
Table 4.39: Quantitative Statistics from KPI Overall Performance Measurements in Test 2

216
Figure 4.54: Overall Performance Measurements with KPIs in Test 2
The overall KPI measurement for Test 2 had a mean of 51.85 and a negative skewness
of -0.261. The central tendency here was 50% with the score that was the most
recorded being 59%. The extent to which the course outcomes for these two modules
have been achieved by GEBL was 51.85%. The average of the first two tests on just
one module was 52.075%. However, although the work load and the degree of
difficulty increased in Test 2, they were able to get 51.85%. Without GEBL this would
not have been possible. 51.85% is lower than the 52.075% which was achieved
through traditional teaching and learning.
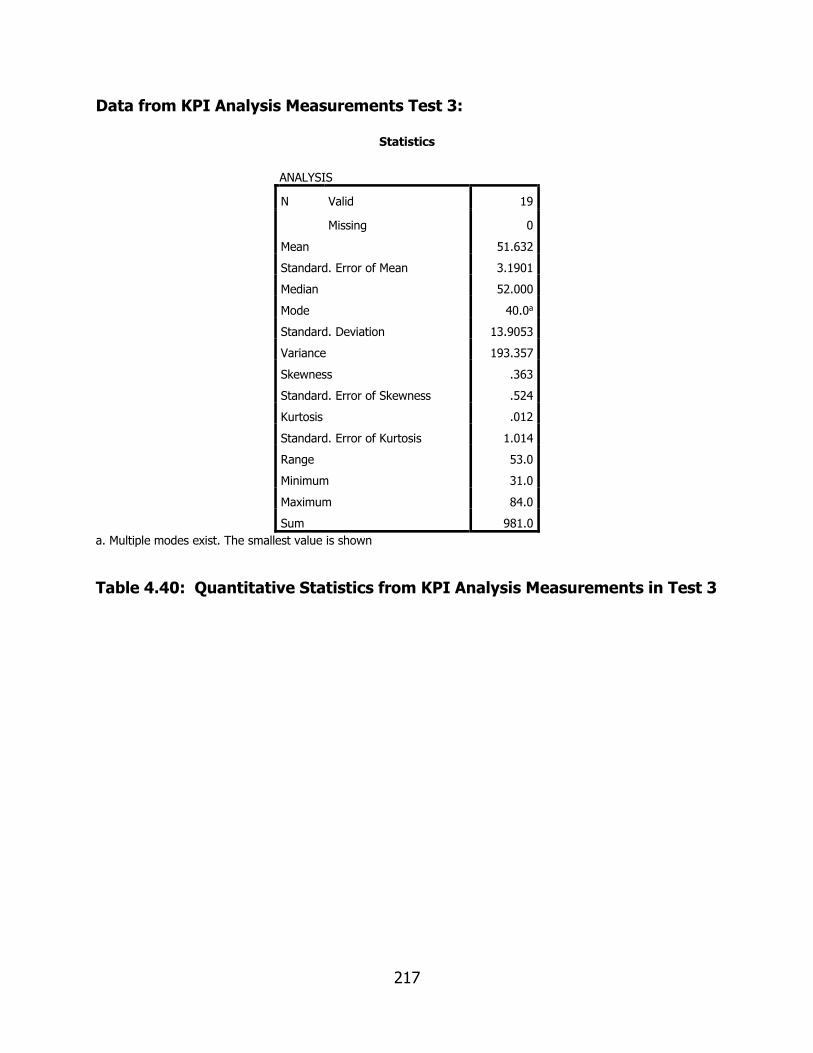
217
Data from KPI Analysis Measurements Test 3:
Statistics
ANALYSIS
N Valid 19
Missing 0
Mean 51.632
Standard. Error of Mean 3.1901
Median 52.000
Mode 40.0a
Standard. Deviation 13.9053
Variance 193.357
Skewness .363
Standard. Error of Skewness .524
Kurtosis .012
Standard. Error of Kurtosis 1.014
Range 53.0
Minimum 31.0
Maximum 84.0
Sum 981.0
a. Multiple modes exist. The smallest value is shown
Table 4.40: Quantitative Statistics from KPI Analysis Measurements in Test 3

218
Figure 4.55: Analysis Measurements with KPIs in Test 3
KPIs analysis measurement for Test 3 had a mean of 51.63 and a positive skewness of
0.363. KPIs measured the ‘Students’ ability to apply MTHE 2 principles to analyse and
solve the problem accurately’ and the ‘Students’ ability to analyse a problem and
produce a solution, taking into account crucial factors in a systematic approach towards
the solution’. In this case the central tendency was 52% and the score that was
recorded most often was 40%. The outliers at the extreme ends of the scale pushed
the standard deviation up to 13.905. The degree of achievement of the outcomes was
however higher than in Tests 1b and 2, which can be contributed to the fact that GEBL
did assist student learning and knowledge retention despite the larger volumes of work.

219
It can also be pointed out that the students developed the ability to deal with more
complex work and could master it.
Data from KPI Analytical Measurements Test 3:
Statistics
ANALYTICAL
N Valid 19
Missing 0
Mean 58.000
Standard. Error of Mean 3.5836
Median 62.000
Mode 62.0
Standard. Deviation 15.6205
Variance 244.000
Skewness .142
Standard. Error of Skewness .524
Kurtosis .384
Standard. Error of Kurtosis 1.014
Range 64.0
Minimum 30.0
Maximum 94.0
Sum 1102.0
Table 4.41: Quantitative Statistics from KPI Analytical Measurements in Test 3

220
Figure 4.56: Analytical Measurements with KPIs in Test 3
KPIs analytical measurement for Test 3 had a mean of 58 and a positive skewness of
0.142. KPIs measured the ‘Students’ ability to apply MTHE 2 principles to analyse and
solve the problem accurately’ and the ‘Students’ ability to analyse a problem and
produce a solution, taking into account crucial factors in a systematic approach towards
the solution’. The central tendency in this case was 62% with the score recorded most
often also being 62%. The low number outliers on the scale pushed the standard
deviation up to 15.62. The degree of achievement of the outcomes was however higher
than in Tests 1b and 2 which can be contributed to the fact that GEBL did assist student

221
learning and knowledge retention despite the larger volumes of work. It can also be
pointed out that the students developed the ability to deal with more complex work and
could master it.
Data from KPI Overall Measurements Test 3:
Statistics
OVERALL
N Valid 19
Missing 0
Mean 53.842
Standard. Error of Mean 3.0380
Median 56.000
Mode 50.0a
Standard. Deviation 13.2425
Variance 175.363
Skewness -.107
Standard. Error of Skewness .524
Kurtosis -.468
Standard. Error of Kurtosis 1.014
Range 47.0
Minimum 32.0
Maximum 79.0
Sum 1023.0
a. Multiple modes exist. The smallest value is
shown
Table 4.42: Quantitative Statistics from KPI Overall Performance Measurements in Test 3

222
Figure 4.57: Overall Performance Measurements with KPIs in Test 3
The overall KPI measurement for Test 3 had a mean of 53.84 and a negative skewness
of -0.107. The central tendency in this case was 56% and the score recorded most
often was 50%. The outliers in this case pushed the standard deviation up to 13.242.
The extent to which the outcomes have been achieved in Test 3 as measured by the
KPIs was 53.84% which is an improvement from the 51.85% in Test 2. Again attention
must be drawn here to the fact that Test 3 was written on three modules which were
more complex than module 1 for Tests 1 and 1b and more complex than the two
modules for Test 2. The degree of achievement of the outcomes was however higher
than in Tests 1b and 2 which can be contributed to the fact that GEBL did assist student
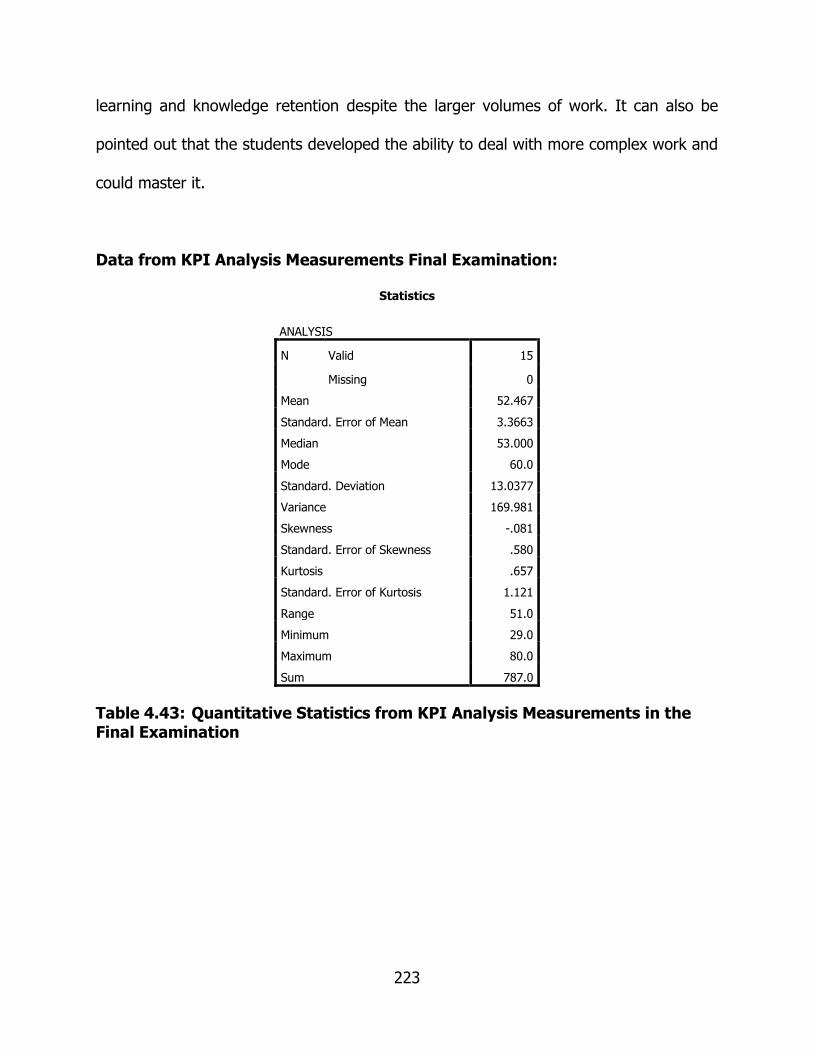
223
learning and knowledge retention despite the larger volumes of work. It can also be
pointed out that the students developed the ability to deal with more complex work and
could master it.
Data from KPI Analysis Measurements Final Examination:
Statistics
ANALYSIS
N Valid 15
Missing 0
Mean 52.467
Standard. Error of Mean 3.3663
Median 53.000
Mode 60.0
Standard. Deviation 13.0377
Variance 169.981
Skewness -.081
Standard. Error of Skewness .580
Kurtosis .657
Standard. Error of Kurtosis 1.121
Range 51.0
Minimum 29.0
Maximum 80.0
Sum 787.0
Table 4.43: Quantitative Statistics from KPI Analysis Measurements in the Final Examination

224
Figure 4.58: Analysis Measurements with KPIs in the Final Examination
KPIs analysis measurement for the final examination had a mean of 52.47 and a
negative skewness of -0.81. KPIs measured the ‘Students’ ability to apply MTHE 2
principles to analyse and solve the problem accurately’ and the ‘Students’ ability to
analyse a problem and produce a solution, taking into account crucial factors in a
systematic approach towards the solution’. The central tendency here was 53% and the
score that most often recorded was 60%. The low number outliers pushed the standard
deviation up to 13.038. The degree of achievement of the outcomes was however
higher than that of all the previous assessments, which can be contributed to the fact
that GEBL did assist student learning and knowledge retention despite the larger

225
volumes of work. It can also be pointed out that the students developed the ability to
deal with more complex work and could master it
Data from KPI Analytical Measurements Final Examination:
Statistics
ANALYTICAL
N Valid 15
Missing 0
Mean 59.600
Standard. Error of Mean 3.4583
Median 59.000
Mode 58.0a
Standard. Deviation 13.3940
Variance 179.400
Skewness -.997
Standard. Error of Skewness .580
Kurtosis 3.094
Standard. Error of Kurtosis 1.121
Range 59.0
Minimum 24.0
Maximum 83.0
Sum 894.0
a. Multiple modes exist. The smallest value is
shown
Table 4.44: Quantitative Statistics from KPI Analytical Measurements in the Final Examination

226
Figure 4.59: Analytical Measurements with KPIs in the Final Examination
KPIs analytical measurement for the final examination had a mean of 59.6 and a
negative skewness of -0.997. KPIs measured the ‘Students’ ability to apply MTHE 2
principles to analyse and solve the problem accurately’ and the ‘Students’ ability to
analyse a problem and produce a solution, taking into account crucial factors in a
systematic approach towards the solution’. The central tendency here was 59% and the
score that was recorded most often was 58%. The low number of outliers pushed the
standard deviation up to 13.394. The degree of achievement of the outcomes was
however higher than Tests 1b, 2 and 3, which can be contributed to the fact that GEBL
did assist student learning and knowledge retention despite the larger volumes of work.
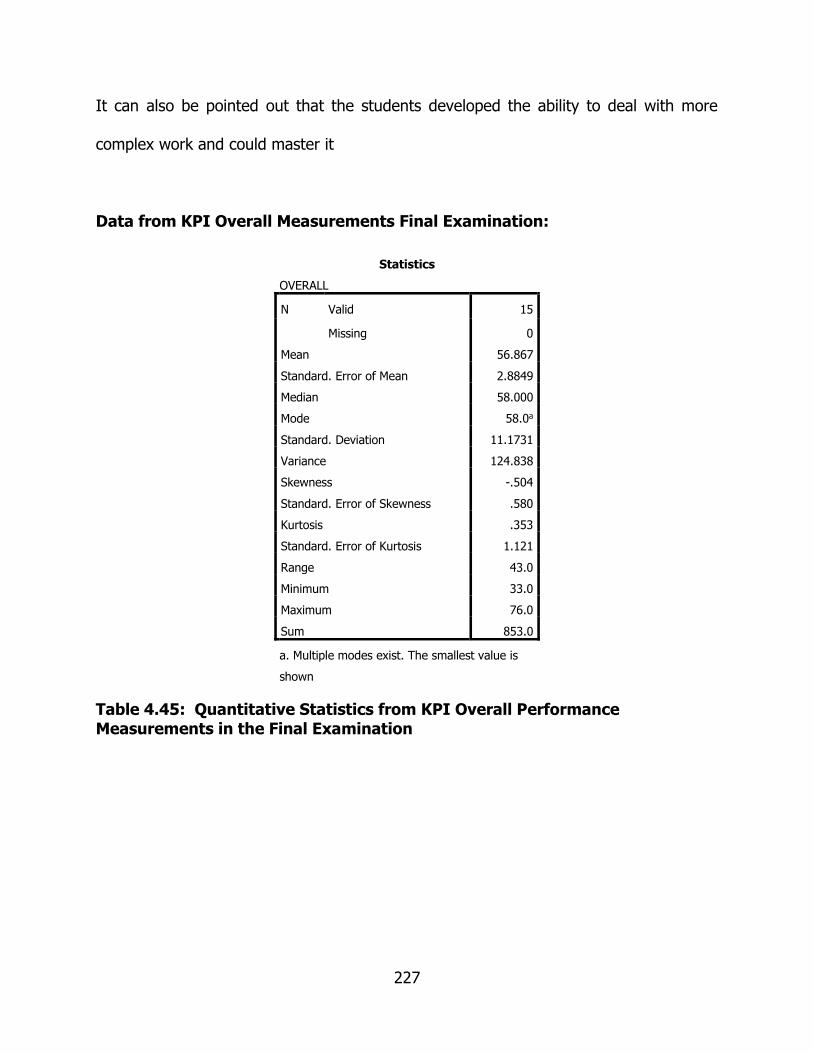
227
It can also be pointed out that the students developed the ability to deal with more
complex work and could master it
Data from KPI Overall Measurements Final Examination:
Statistics
OVERALL
N Valid 15
Missing 0
Mean 56.867
Standard. Error of Mean 2.8849
Median 58.000
Mode 58.0a
Standard. Deviation 11.1731
Variance 124.838
Skewness -.504
Standard. Error of Skewness .580
Kurtosis .353
Standard. Error of Kurtosis 1.121
Range 43.0
Minimum 33.0
Maximum 76.0
Sum 853.0
a. Multiple modes exist. The smallest value is
shown
Table 4.45: Quantitative Statistics from KPI Overall Performance Measurements in the Final Examination

228
Figure 4.60: Overall Performance Measurements with KPIs in the Final Examination
The overall KPI measurement for the final examination had a mean of 56.867 and a
negative skewness of -0.504. The central tendency in this case was 58% and the score
recorded most often was also 58%. The low number of outliers on the extreme end of
the scale pushed the standard deviation up to 11.1731. The extent to which the
outcomes for MTHE 2 have been achieved as measured with the KPIs was 56.867%.
This is a significant improvement from the previous tests and what made it even more
significant was the fact the final examination was on seven modules (progressively
more difficult and a larger volume of work) which was covered over a period of 13
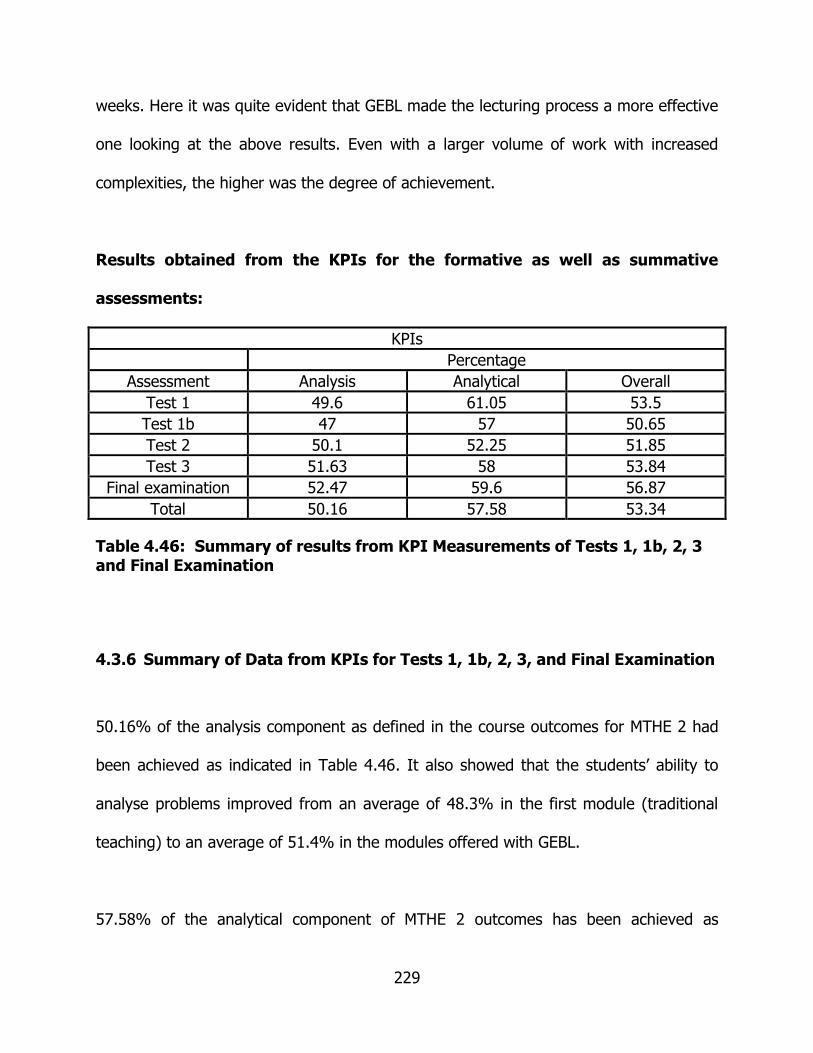
229
weeks. Here it was quite evident that GEBL made the lecturing process a more effective
one looking at the above results. Even with a larger volume of work with increased
complexities, the higher was the degree of achievement.
Results obtained from the KPIs for the formative as well as summative
assessments:
KPIs
Percentage
Assessment Analysis Analytical Overall
Test 1 49.6 61.05 53.5
Test 1b 47 57 50.65
Test 2 50.1 52.25 51.85
Test 3 51.63 58 53.84
Final examination 52.47 59.6 56.87
Total 50.16 57.58 53.34
Table 4.46: Summary of results from KPI Measurements of Tests 1, 1b, 2, 3 and Final Examination
4.3.6 Summary of Data from KPIs for Tests 1, 1b, 2, 3, and Final Examination
50.16% of the analysis component as defined in the course outcomes for MTHE 2 had
been achieved as indicated in Table 4.46. It also showed that the students’ ability to
analyse problems improved from an average of 48.3% in the first module (traditional
teaching) to an average of 51.4% in the modules offered with GEBL.
57.58% of the analytical component of MTHE 2 outcomes has been achieved as

230
indicated in Table 4.46. It showed that the students’ ability to perform analytical
procedures on one module of the syllabus was 59.03% on one module covered with
traditional teaching and their ability to perform analytical procedure was an average of
56.62% on 2, 3 and 7 modules covered with GEBL.
The first module’s outcomes were 52.08% and that of the GEBL modules was 54.19%
as indicated in Table 4.46. These results indicated that the GEBL intervention had a
50.16% success rate in developing the students’ ability to analyse problems. There was
a 57.58% success rate in terms of students’ ability in developing an analytical solution
to a particular problem. The overall achievement of course outcomes measure by KPIs
‘1’ and ‘4’ was 53.34%. The KPIs achievements of the selected course outcomes are
indicated in Fig. 4.61.
KPI Achievement with GEBL
Line Number Number of modules
Score %
1
0.5
55
2
0.5
52
3
2
52
4
3
54
5
7
57
Figure 4.61: Overall KPI Achievement with an increased workload, with GEBL being introduced after the Second Assessment
49
50
51
52
53
54
55
56
57
58
T1 T1b T2 T3 FE
Pe
rce
nta
ge
s
KPIs Percentage Achievements
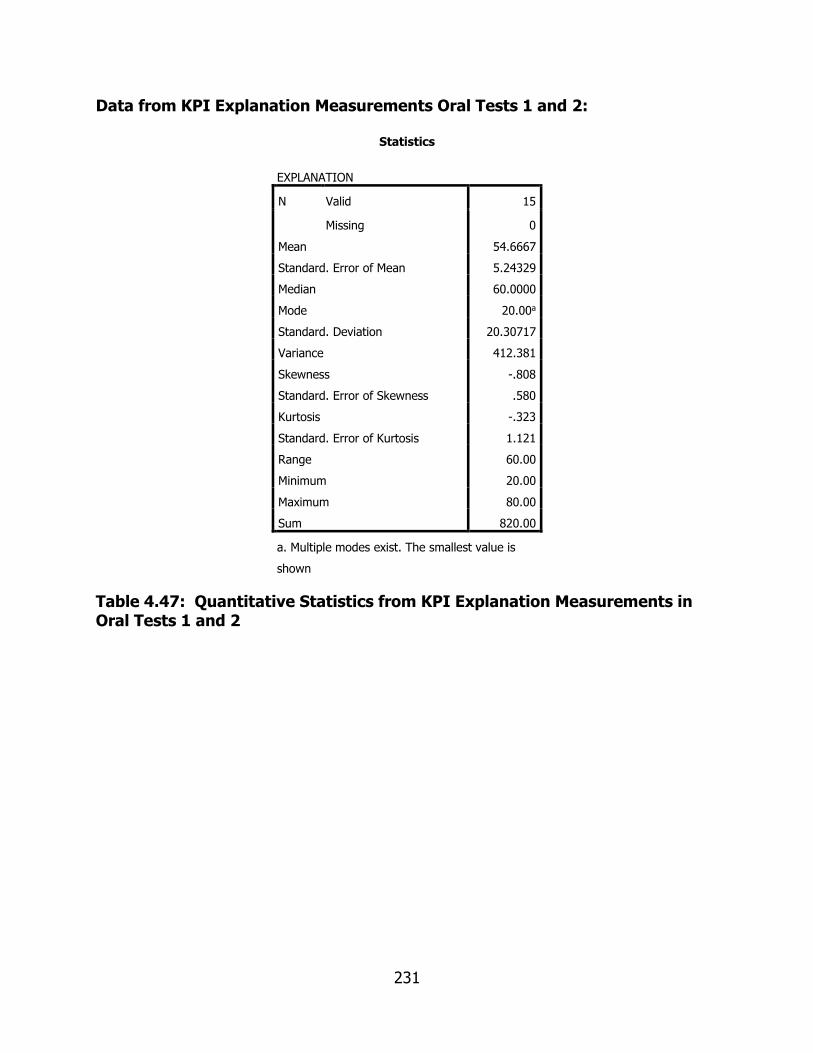
231
Data from KPI Explanation Measurements Oral Tests 1 and 2:
Statistics
EXPLANATION
N Valid 15
Missing 0
Mean 54.6667
Standard. Error of Mean 5.24329
Median 60.0000
Mode 20.00a
Standard. Deviation 20.30717
Variance 412.381
Skewness -.808
Standard. Error of Skewness .580
Kurtosis -.323
Standard. Error of Kurtosis 1.121
Range 60.00
Minimum 20.00
Maximum 80.00
Sum 820.00
a. Multiple modes exist. The smallest value is
shown
Table 4.47: Quantitative Statistics from KPI Explanation Measurements in Oral Tests 1 and 2

232
Figure 4.62: Explanation Measurements with KPIs in Oral Tests 1 and 2
The KPI explanation measurement for oral Tests 1 and 2 had a mean of 54.67 and a
negative skewness of -0.808. KPIs measured the ‘Students’ ability to explain/discuss;
the operation of a system, components or parts of a system in MTHE 2, components
function in the overall plant which it forms part of, treatment and maintenance
procedures in specific components’ and the ‘Students’ ability to perform technical
discussions on MTHE 2 topics, communicates fluently, explains and demonstrates
concepts effectively in MTHE 2’. The outliers in the lower percentages pushed the
standard deviation up to 20.307. The central tendency in this case was 60% and the
scored most often recorded was about 20%. GEBL assisted the students in developing
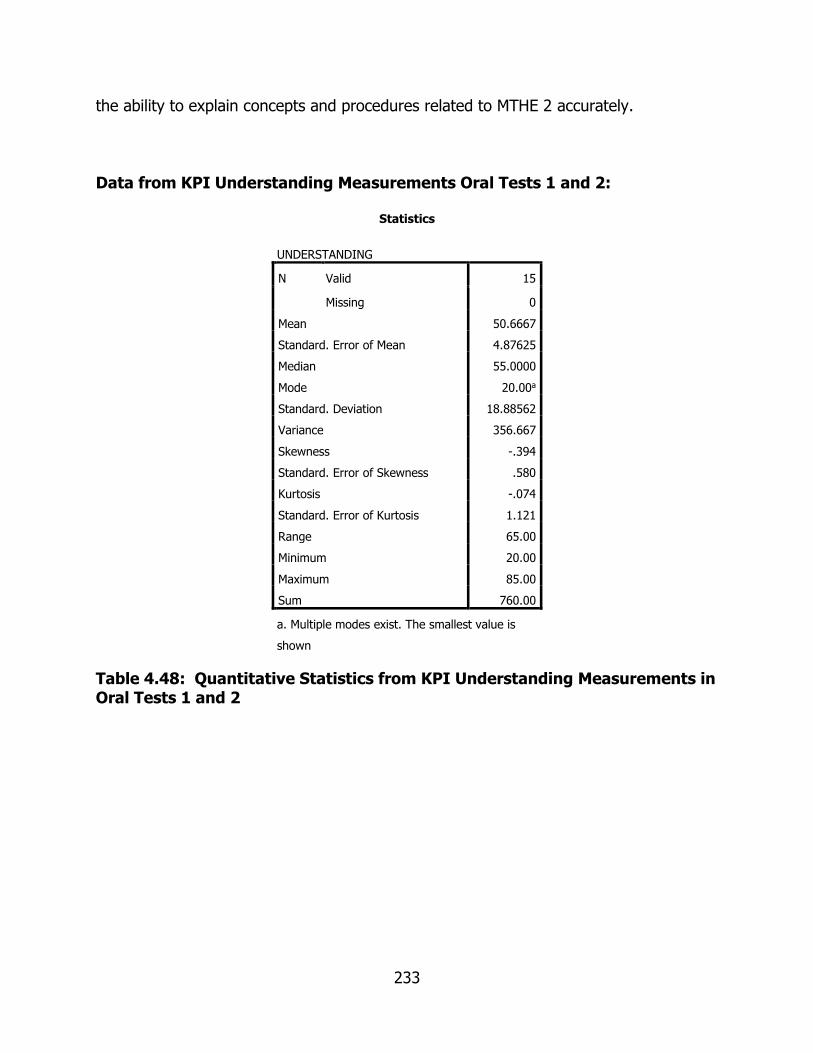
233
the ability to explain concepts and procedures related to MTHE 2 accurately.
Data from KPI Understanding Measurements Oral Tests 1 and 2:
Statistics
UNDERSTANDING
N Valid 15
Missing 0
Mean 50.6667
Standard. Error of Mean 4.87625
Median 55.0000
Mode 20.00a
Standard. Deviation 18.88562
Variance 356.667
Skewness -.394
Standard. Error of Skewness .580
Kurtosis -.074
Standard. Error of Kurtosis 1.121
Range 65.00
Minimum 20.00
Maximum 85.00
Sum 760.00
a. Multiple modes exist. The smallest value is
shown
Table 4.48: Quantitative Statistics from KPI Understanding Measurements in Oral Tests 1 and 2

234
Figure 4.63: Understanding Measurements with KPIs in Oral Tests 1 and 2
The KPIs understanding measurement for Oral Tests 1 and 2 had a mean of 50.67 and
negative skewness of -0.394. KPIs measured the ‘Students’ ability to explain/discuss;
the operation of a system, components or parts of a system in MTHE 2, components
function in the overall plant which it forms part of, treatment and maintenance
procedures in specific components’ and the ‘Students’ ability to perform technical
discussions on MTHE 2 topics, communicates fluently, explains and demonstrates
concepts effectively in MTHE 2’. The outliers in the upper and lower percentages
pushed the standard deviation up to 18.886. The central tendency in this case was 55%
and the score most often recorded was 20%. GEBL assisted the students in

235
understanding MTHE 2 concepts, processes and procedures by expressing it in their
own words.
Data from KPI Discussion Measurements Oral Tests 1 and 2:
Statistics
DISCUSSION
N Valid 15
Missing 0
Mean 68.6000
Standard. Error of Mean 4.23568
Median 71.0000
Mode 71.00a
Standard. Deviation 16.40470
Variance 269.114
Skewness -.614
Standard. Error of Skewness .580
Kurtosis .011
Standard. Error of Kurtosis 1.121
Range 55.00
Minimum 36.00
Maximum 91.00
Sum 1029.00
a. Multiple modes exist. The smallest value is
shown
Table 4.49: Quantitative Statistics from KPI Discussion Measurements in Oral Tests 1 and 2
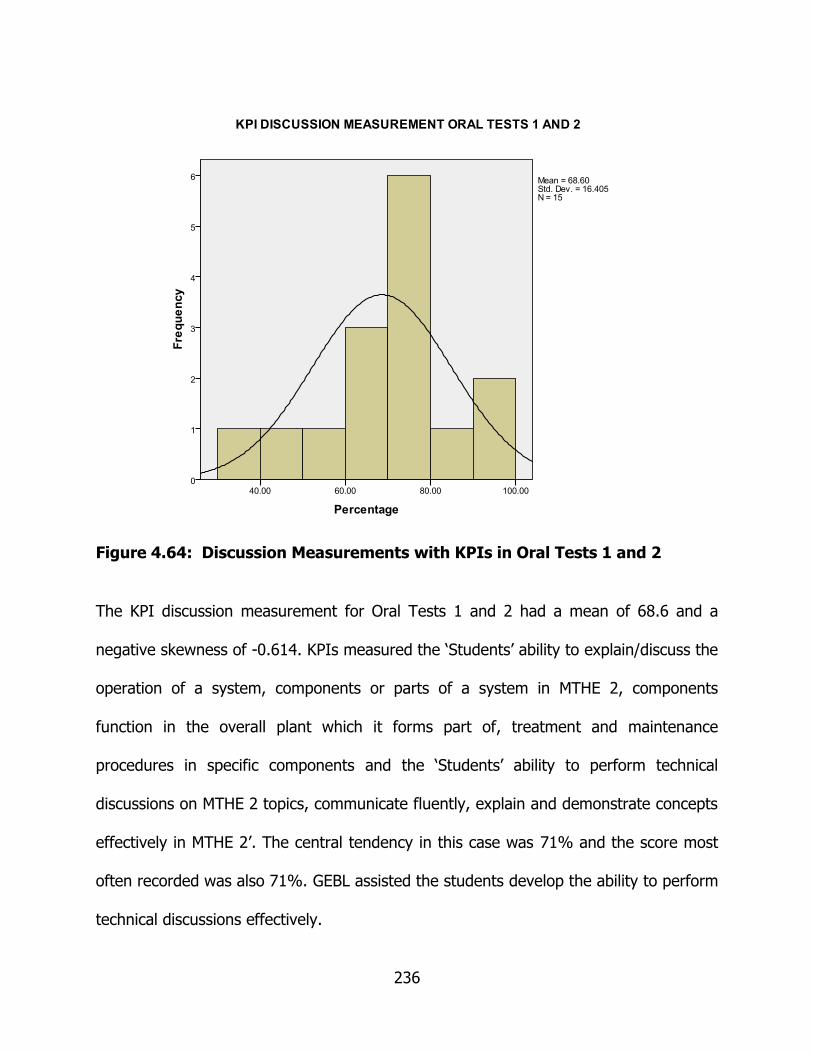
236
Figure 4.64: Discussion Measurements with KPIs in Oral Tests 1 and 2
The KPI discussion measurement for Oral Tests 1 and 2 had a mean of 68.6 and a
negative skewness of -0.614. KPIs measured the ‘Students’ ability to explain/discuss the
operation of a system, components or parts of a system in MTHE 2, components
function in the overall plant which it forms part of, treatment and maintenance
procedures in specific components and the ‘Students’ ability to perform technical
discussions on MTHE 2 topics, communicate fluently, explain and demonstrate concepts
effectively in MTHE 2’. The central tendency in this case was 71% and the score most
often recorded was also 71%. GEBL assisted the students develop the ability to perform
technical discussions effectively.

237
Data from KPI Overall Measurements Oral Tests 1 and 2:
Statistics
OVERALL
N Valid 15
Missing 0
Mean 57.9333
Standard. Error of Mean 3.50165
Median 64.0000
Mode 69.00
Standard. Deviation 13.56185
Variance 183.924
Skewness -.906
Standard. Error of Skewness .580
Kurtosis .012
Standard. Error of Kurtosis 1.121
Range 46.00
Minimum 28.00
Maximum 74.00
Sum 869.00
Table 4.50: Quantitative Statistics from KPI Overall Performance Measurements in Oral Tests 1 and 2

238
Figure 4.65: Overall Performance Measurements with KPIs in Oral Tests 1 and 2
The overall KPI measurement for Oral Tests 1 and 2 had a mean of 57.93 and a
negative skewness of -0.906. The central tendency in this case was 64% and the score
most often recorded was 69%. The low number of outliers in the lower percentages
pushed the standard deviation up to 13.562. The extent to which the outcomes of
MTHE 2 have been achieved as measured by the KPIs was 57.93%. This was the first
time that oral assessments on the entire syllabus were done in MTHE 2 and also the
first time that the KPI measurement was used. The data showed that the students
achieved the outcomes by demonstrating their ability as stipulated in the KPIs in
explaining, understanding and discussing various topics of the syllabus satisfactorily.
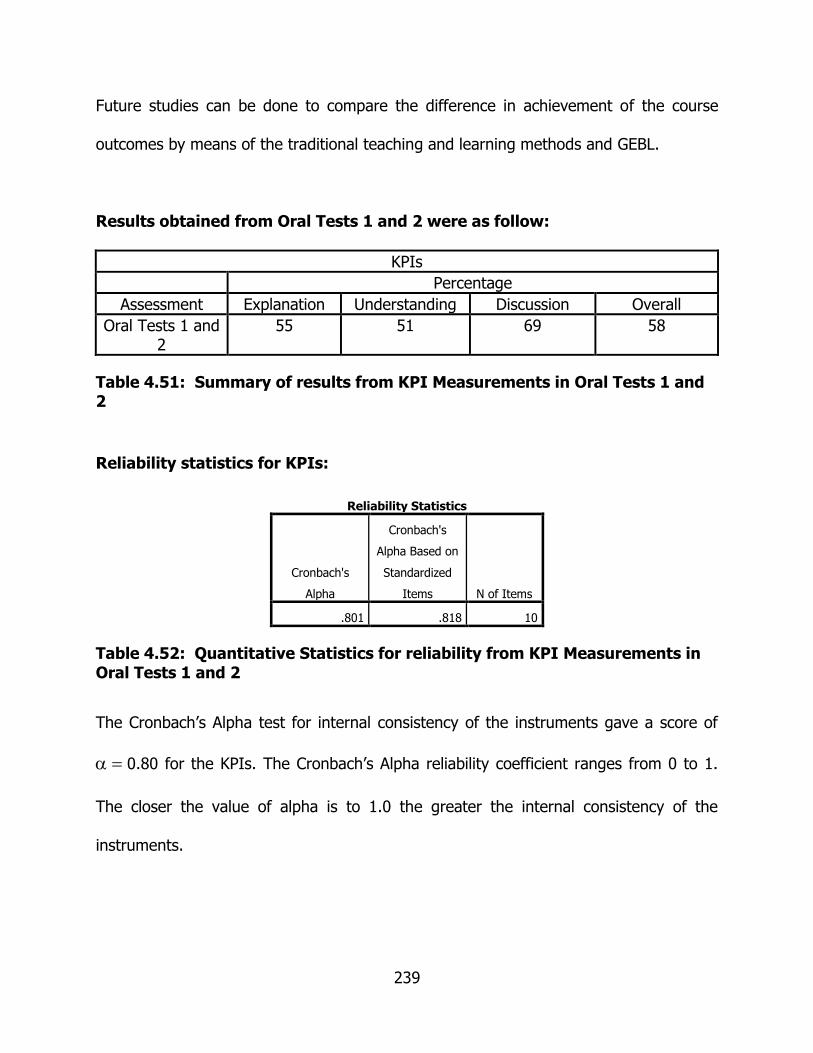
239
Future studies can be done to compare the difference in achievement of the course
outcomes by means of the traditional teaching and learning methods and GEBL.
Results obtained from Oral Tests 1 and 2 were as follow:
KPIs
Percentage
Assessment Explanation Understanding Discussion Overall
Oral Tests 1 and 2
55 51 69 58
Table 4.51: Summary of results from KPI Measurements in Oral Tests 1 and 2
Reliability statistics for KPIs:
Reliability Statistics
Cronbach's
Alpha
Cronbach's
Alpha Based on
Standardized
Items N of Items
.801 .818 10
Table 4.52: Quantitative Statistics for reliability from KPI Measurements in Oral Tests 1 and 2
The Cronbach’s Alpha test for internal consistency of the instruments gave a score of
0.80 for the KPIs. The Cronbach’s Alpha reliability coefficient ranges from 0 to 1.
The closer the value of alpha is to 1.0 the greater the internal consistency of the
instruments.

240
4.3.7 Summary of Data from KPIs for Oral Tests 1 and 2
55% of the students could give a satisfactory explanation of the questions posed to
them. This also indicated that these students could express themselves properly and
could use the correct terms during explanations (see table 4.51).
51% of the students understood the questions posed to them. They could make a
connection between the theory and what happened in practice of what was being
asked. These students understood how the plant operated, what the function of each
component was and how the one component affected the other. They also knew which
factors could influence the overall operation and with regard to safety which reading
should be monitored closely (see table 4.51).
69% of the students were able to perform discussions on various issues and could
express themselves satisfactory. Here the students were able to discuss operations,
processes and procedures satisfactory (see table 4.51).
KPIs ‘2’ and ‘3’ were used to measure the extent to which the relevant outcomes were
achieved, which was 58% as indicated in table 4.51.
241
4.4 Summary of Highest Scored Data
4.4.1 Theory Questions from Written Assessments
From the data collected, a summary of the highest scored theory questions are given
below.
Test 2 (see Appendix 5)
Question 2.3
“Explain the steps to be followed to calculate all that is required to do an analysis”.
Test 3 (see Appendix 6)
Question 4.1
“Draw a detailed flow diagram of the Rankine cycle”.
Final Examination (see Appendix 8)
Question 4.1 (T7)
“Complete the attached diagram/s, indicate clearly the wet and dry air pump units and
fill in all relevant detail as well as the directions of flow for the air, water and steam”.
In the questions listed above, students had achieved scores of 77%, 73% and 65%,
respectively. Here they demonstrated a clear understanding of the problem presented
to them as well as the ability to analyse the information provided in the problem. The
majority were also able to use that information to accurately address the questions

242
posed, which shows a high level of conceptual knowledge. The students were also able
to link the theory of processes with diagrams successfully (see tables 4.9, 4.12 & 4.15).
4.4.2 Structured Questionnaire (see Appendix 1)
Student responses to the following questions:
Questions Strongly agree
Agree Neutral Disagree Strongly disagree
4. This method helped me to understand the work and not to just memorise it.
66.7%
26.7%
6.7%
0%
0%
5. This method helped me develop the ability to solve problems on my own.
26.7%
66.7%
6.7%
0%
0%
1. 7. The Thermodynamics booklets’ additional questions and answers helped me to understand and analyse new problems better.
26.7%
60%
13.3%
0%
0%
4.4.3 Interviews (see Appendices 2 & 13):
Item 1a: The group sessions motivated you to come prepared to class.
Positive responses: So that I can work together and not be left behind/I will have to explain what I understand/it was like a competition and nobody wants to look stupid 18 (N = 18)
Neutral or negative responses: Group sessions did not motivate me to come prepared to class 0 (N = 18)
Item 1b: The group sessions helped developing your communication skills.
Positive responses: In the group you use English so you become use to the language/I can explain to others and we can share/because I have to talk to others and on my own I do not communicate 18 (N = 19)
Neutral or negative responses: It was difficult to take part in the group sessions because I am a shy person 1 (N = 19)
Item 4: This method helped me to understand the work and not to just memorise it.
Positive responses: We share information and analyse the problem so we understood what to do/group discussions helped us to understand the work/we were able to use questions to analyse new problems 20 (N = 20)
Neutral or negative responses: This method did not help me to understand the work and I still have to memorise it 0 (N = 20)
Student A
“... not just knowing what you calculate but what is it in the engineering field what
significance does it have...”

243
Student C
“... this method gives us the ability to understand it and not just guessing or
memorizing it... You know in discussions you would go through in groups, debates
and we are challenging each other in the groups someone gets to be disagreeing
with you in the group and you will have to try to convince and explain to him
exactly how you really view this...”
Student I
“... because group working is all about all the students participating...”
4.4.4 Oral Test 1 (see Appendix 7)
Question 7
“Explain which components constitute the steady flow energy equation”.
Question 11
“Which products of combustion appear in the table for a mass analysis?”
Oral Test 2 (see Appendix 7)
Question 3
“What are the differences between the following processes: adiabatic, polytropic and
isothermal?”
In the questions listed above the students had achieved scores of 91.4%, 91.4% and

244
100%, respectively. The students were able to give clear and accurate explanations.
They also had a good understanding of the process/processes involved and could list
the differences clearly (see tables 4.19 & 4.20).
4.4.5 Interviews (see Appendices 2 & 13):
Item 1b: The group sessions helped developing your communication skills.
Positive responses: In the group you use English so you become use to the language/I can explain to others and we can share/because I have to talk to others and on my own I do not communicate 18 (N = 19)
Neutral or negative responses: It was difficult to take part in the group sessions because I am a shy person 1 (N = 19)
Item 2: The enquiry based sessions helped me to analyse problems effectively.
Positive responses: The questions given help me to analyse the problems/I have to ask myself what do I understand about the problem/we were taught how to tackle problems and how to get answers to our questions/when I work on my own I try to ask myself questions about what is given and what do I understand about the problem 20 (N = 20)
Neutral or negative responses: The enquiry based sessions did not help me to analyse problems more effectively 0 (N = 20)
Item 4: This method helped me to understand the work and not to just memorise it.
Positive responses: We share information and analyse the problem so we understood what to do/group discussions helped us to understand the work/we were able to use questions to analyse new problems 20 (N = 20)
Neutral or negative responses: This method did not help me to understand the work and I still have to memorise it 0 (N = 20)
Student responses from interviews regarding GEBL and in particular its influence on
communication, the ability of students to express themselves and to interact:
Student B
“In Thermodynamics there are a number of terms and well just terms you need to
know that you don’t really pick up if you do work without talking about the work.
So the fact that you were talking about the work helped you to understand these
terms and in turn helped you understand more Thermodynamics”.

245
Student K
“It helped develop our communication skills because you get to speak out,
explaining what is happening...’’
Student L
“I think in this method you gain a lot of skill other than solving the problem, first
you get a chance to communicate and be motivated to be not shy in class... you
gain other skills other than solving problems like talking in front of the people...”
4.4.6 Calculation Questions from Written Assessments
Test 2 (see Appendix 5)
Question 2.4
“Perform the calculations as explained in 2.3”.
Test 3 (see Appendix 6)
Question 3.3
“Determine the degree of dryness in the main supply line”.
Final Examination (see Appendix 8)
Question 2.2 (C5)
“Determine the work done by the steam during the heating process”.

246
In the questions listed above, the students had achieved scores of 84.15%, 89.42%
and 89.27%, respectively. The students were able to manipulate and use the
information supplied in the problem to determine the required solution. It shows that
they understood the relationship between the information presented (variables supplied
in problems) as well as the particular process involved and how to work systematically
to find a solution (see tables 4.10, 4.13 & 4.16).
4.4.7 Structured Questionnaire (see Appendix 1)
Questions Strongly agree
Agree Neutral Disagree Strongly disagree
2. The enquiry based sessions helped me to analyse problems effectively.
73.7%
26.7%
0%
0%
0%
3. When working alone the enquiry based approach helped me to analyse problems effectively.
33.3%
26.7%
40%
0%
0%
5. This method helped me develop the ability to solve problems on my own.
26.7%
66.7%
6.7%
0%
0%

247
4.4.8 Interviews (see Appendices 2 & 13):
Item 2: The enquiry based sessions helped me to analyse problems effectively.
Positive responses: The questions given help me to analyse the problems/I have to ask myself what do I understand about the problem/we were taught how to tackle problems and how to get answers to our questions/when I work on my own I try to ask myself questions about what is given and what do I understand about the problem 20 (N = 20)
Neutral or negative responses: The enquiry based sessions did not help me to analyse problems more effectively 0 (N = 20)
Item 3: When working alone the enquiry based approach helped me to analyse problems effectively.
Positive responses: I used the information which I have learned during the group sessions/I follow the same approach in analysing the question that we have used in group sessions/I asked myself similar questions to those that we have asked during group sessions, when working alone 20 (N = 20)
Neutral or negative responses: The enquiry bases approach did not help me to solve problems when working alone 0 (N = 20)
Item 5: This method helped me develop the ability to solve problems on my own.
Positive responses: When alone use the same approach that have been used during group sessions, analyse the new problem by asking questions/you have many methods of approaching the problem and how to ask questions that leads you to ways to solve the problem/asking question gives me more information about a problem 20 (N = 20)
Neutral or negative responses: This method did not help me to develop the ability or to improve my ability to solve problems 0 (N = 20)
Item 6: The Thermodynamics booklet with questions and answer helped me to understand the work better.
Positive responses: The layout and explanations in the booklet helped us to understand new work better/
Neutral or negative responses: The Thermodynamics booklet did not help to understand the work better 0 (N =20)
Item 7: The Thermodynamics booklet’s additional questions and answers helped me to understand and analyse new problems better.
Positive responses: The additional questions in the booklet assisted us to analyse new problems/the additional questions helped me to gain more information about the problem 4 (N = 4)
Neutral or negative responses: The booklet with the additional questions and answers did not help to understand and analyse new problems better 0 (N = 4)
Student A
“... I am in a position to analyse the question and to manipulate whatever it is that
I have...”

248
Student C
“We were encouraged to write down a certain sequence of each question and how
to answer the question and we were given time before each problem to evaluate
how we were going to actually answer the question, not just looking at the
question and trying to answer that specific question, cause you have to find a
number of things before you answer the actual question that’s asked... before we
actually tackle the problem we would have a list of certain questions that we ask
to ourselves”.
Student J
“... to know which step you should move to and how you should approach the
question. In a way it gives us a start in approaching the questions...”
4.5 Summary
From the data presented there are several significant findings.
Firstly, GEBL assisted the students in factual recall of MTHE 2 concepts. There was
evidence that students’ performance increased with an increased work load. These
were supported by the data from the structured questionnaires as well as the interview
responses (see subsections 4.3.3, 4.4.2 & 4.4.3).
Secondly, GEBL assisted the students in understanding MTHE 2 concepts, principles and
249
applications. Students were also able to learn new material, understand it and apply
this knowledge in solving problems. These were also supported by the data from the
structured questionnaires and the students’ responses to the interviews (see
subsections 4.3.3, 4.4.2 & 4.4.3).
Thirdly, GEBL assisted the students in their communication skills and the use of MTHE 2
terms. Students were also able to explain concepts, processes and procedures
accurately as indicated in assessment scores (see subsections 4.3.3, 4.4.2 & 4.4.5).

250
CHAPTER 5
DISCUSSION OF FINDINGS, CONCLUSION AND RECOMMENDATIONS
This chapter discusses and highlights the findings from the data collected in chapter 4.
Both qualitative and quantitative finding are discussed in relation to the literature
reviewed and the research questions and objectives. The performance of the students
during these assessments as well as their interview responses are also compared to
determine whether there was a correlation between the quantitative and qualitative
data. These findings are then compared with what is reported in literature.
The discussion first concentrates on how the students performed in the theoretical
components of the assessments. Secondly their performances in the questions where
they had to perform certain calculations are discussed. Finally the achievements of the
KPIs will be discussed.
A conclusion will also be made on how the findings from this study addressed the aim
and objectives of this research study and how these findings are congruent with those
from similar studies. This chapter will then be concluded by recommendations and a
proposed future model for presenting MTHE 2 and mechanical engineering courses in
general.

251
5.1 GEBLs Impact on Student Performance
Discussions with regard to the findings will now be made in an attempt to address the
research questions.
5.1.1 High Scores - Written Theory Assessments
In addressing the first and second research question: ‘What would be the effect of a
guided enquiry-based learning (GEBL) approach on mechanical engineering students’
factual recall of MTHE 2 concepts?’ and ‘What would be the effect of a guided enquiry-
based learning (GEBL) approach on mechanical engineering students’ conceptual
understanding of MTHE 2 concepts, principles and applications?’ the mean values from
the following tables will be considered:
Table 4.9: Question T2.3 mean 77%;
Table 4.12: Question T4.1 mean 73.053%;
Table 4.18: Question T7 mean 65.133%.
Students’ responses on how GEBL assisted their learning:
“... this method gives us the ability to understand it and not just guessing or
memorizing it...”

252
“... not just knowing what you calculate but what is it in the engineering field
what significance does it have...”
From the structured questionnaire item ‘This method helped me to understand the work
and not to just memorise it’, 66.7% of the students strongly agreed and from the item
‘This method helped me develop the ability to solve problems on my own’ 26.7%
strongly agreed and 66.7% agreed.
With regard to the above results and responses: These results suggested that the
students gave satisfactory answers to the various questions. They were also able to
recall factual knowledge and demonstrate understanding of conceptual knowledge.
These performances are also supported by the students’ interview responses. Similar
findings where students had to recall facts, explain processes and procedures are
consistent with those from other studies done on active learning in engineering
education (Prince, 2004; Felder & Brent, 2003; Spronken-Smith, 2007). Findings from
studies done on Kolb’s learning cycle as pedagogy for teaching students in engineering
to address different learning styles, are similar and in support of those found by this
study (Ogot & Okudan, 2006; Kapranos, 2007; Aziz & Chassapis, 2008; Altuger et al.,
2009; Stappenbelt, 2010; Elshorbagy & Schonwetter, 2002). The process followed with
GEBL i.e. introducing new concepts and principles; performing a class example
engaging students during question formulation; group sessions with interaction
between group members and group members and lecturer; feedback on group

253
approaches and progress; individual homework and problem solving, allowed for
students with different learning styles to be catered for by one or more of the stages of
GEBL approach. It has different learning approaches which cater for a larger spectrum
of learning styles which is not the case with the traditional teaching and learning
method. This resulted in the increase of the class average from 46% to 55%. The
above observations are also supported by researchers who investigated the impact of
learning styles on student performance (Goldfinch et al., 2008; Kapadia, 2008;
Lamancusa et al., 2008; Naher et al., 2008; O’Dwyer, 2008). GEBL has also resulted in
an effective teaching strategy of MTHE 2. GEBL as an effective teaching strategy is
supported by Killen (2006, p.3). Findings from this study that GEBL also assists deep
learning which resulted in higher retention rates are in line with those from other
studies done on deep learning in engineering education (Ying, 2003; Fowler, 2004;
Qualters et al., 2008; Felder & Brent, 2010).
5.1.2 High Scores - Written Calculation Assessments
In addressing the first and second research question: ‘What would be the effect of a
guided enquiry-based learning (GEBL) approach on mechanical engineering students’
factual recall of MTHE 2 concepts?’ and ‘What would be the effect of a guided enquiry-
based learning (GEBL) approach on mechanical engineering students’ conceptual
understanding of MTHE 2 concepts, principles and applications?’ the mean values from
the following tables will be considered:

254
Table 4.10: Question C2.4 mean 84.15%;
Table 4.13: Question C3.3 mean 89.421%;
Table 4.19: Question C5 mean 89.267%.
Students’ responses on how GEBL assisted them when they had to solve problems:
“... I am in a position to analyse the question and to manipulate whatever it is
that I have...”
“... before we actually tackle the problem we would have a list of certain
questions that we ask to ourselves”.
“... to know which step you should move to and how you should approach the
question. In a way it gives us a start in approaching the questions...”
From the structured questionnaire item ‘The enquiry based sessions helped me to
analyse problems effectively’, 73.7% of the students strongly agreed and from item
‘This method helped me develop the ability to solve problems on my own’, 26.7% of the
students strongly agreed and 66.7% agreed.
With regard to the above results and responses: GEBL gave the students a departure
point when they were facing new problems. This view is also expressed by the students

255
during the interviews. It assisted them to start the analysis process which helped them
to understand the process involved and what variables were given and also what the
relationships between those variables were. GEBL also sought to develop students’
ability to manipulate information supplied in questions and to approach a particular
problem from different angles in order to find a solution. Here, the students used
critical thinking skills to achieve their goal. Studies done on the importance of Bloom’s
taxonomy for the development of critical thinking skills and the achievement of learning
outcomes in engineering education (Boles et al., 2005, p.3) are in agreement with the
findings, presented above, from this study. The results from the tables 4.10, 4.13 and
4.19 suggest that GEBL assists deep learning which, results in effective problem solving
abilities. Similar views are corroborated by researchers who have done studies on deep
learning in engineering education (Robbins & Ardebili, 2006, p.6). GEBL also assisted in
the achievement of significant learning to a certain degree, by guiding students through
a number of steps which they had to follow when solving problems. This corresponds
with the ‘learn how to learn’ described in Finks taxonomy of significant learning (Fink,
2003, pp.4-6). GEBL promoted the movement through Kolb’s learning circle which
resulted in students retaining information for longer periods of time and being able to
apply it in different problem-solving situations. This view is supported by Elshorgaby et
al., (2002, p.297).
5.1.2.1 Factual Knowledge
There was an improvement in the students’ ability to use factual knowledge (formulas,

256
relationships between variables) as indicated in Fig. 4.62. It also indicated that students
were more competent in using their background knowledge and experience gained
through the group sessions to analyse and solve new problems which suggested that
they had achieved deeper learning. These findings are in line with similar studies on
deep learning approaches (Ying, 2003; Fowler, 2004). Results found by this study
correspond well with findings from studies done on active learning approaches which
showed an improvement in student learning (Junglas, 2006; Fuehne, 2007). This
suggested that a GEBL approach of learning new material by means of interactions,
group discussions, sharing ideas and interpretations and using systematic enquiry-
based approaches to solving new problems as showed by the evidences provided by
this study improved students learning.
5.1.2.2 Conceptual Knowledge
Correct understanding of concepts form building blocks of principles and relationships.
With regard to the theoretical part of the course where students had to understand new
theories, processes, principles and relationships the enquiry-based approach also
assisted in the improvement of the students’ knowledge retention ability. This can be as
a result of the way in which the students encountered new information and how the
new information was discussed and shared which made their understanding of the new
information more effective. From the scores in Fig. 4.63 it is quite evident that GEBL
helped the students in understanding new concepts, theories and enabled them to
analyse problems effectively so that they understood the process/processes involved

257
and were able to reflect these process/processes on diagrams accurately. GEBL also
improved the students’ ability to deal with larger complex volumes of work successfully.
These results are in line with findings from other studies that active student-centred
learning improve students’ knowledge retention, the development of (higher) order
thinking skills, group work, problem solving, the formulation of good questions,
analysing problems and developing solutions (see for example, Lee, 2004; Prince, 2004;
Prince & Felder, 2006; Huet et al., 2007; Ma, 2009).
5.1.3 High Scores - Oral Assessments
In addressing the third research question: ‘What would be the effect of a guided
enquiry-based learning (GEBL) approach on mechanical engineering students’ ability to
communicate procedures and processes related to MTHE 2?’ the mean values from the
following tables will be considered:
Table 4.15: Question T7 mean 91.42%, Question T11 mean 91.42%;
Table 4.16: Question T3 mean 100%.

258
Students’ responses to the influence of GEBL on communication skills:
“In Thermodynamics there are a number of terms and well just terms you need
to know that you don’t really pick up if you do work without talking about the
work. So the fact that you were talking about the work helped you to understand
these terms and in turn helped you understand more Thermodynamics”.
“It helped develop our communication skills because you get to speak out,
explaining what is happening...’’
With regard to the above results and responses: During the Oral tests the majority of
the students could give a satisfactory answer to many of the questions, thereby
showing a high level of conceptual knowledge on relevant sections of the work.
Students who were normally shy and not confident in using Thermodynamic terms
could express themselves and actively participate in technical discussions. Other studies
done on the impact of active learning in engineering education also found that it
enhanced student interaction and assisted technical communication. This view is
corroborated by many researchers in the field (Weck, 2003; Zubair & Antar, 2004;
Charelvoix, 2008).
5.2 KPI Achievement with GEBL
In addressing the fourth research question: ‘To what extent would the formulation and

259
use of key performance indicators (KPIs) be an effective tool for ascertaining students’
attainment of desired educational outcomes in MTHE 2?’ the mean values from the
following tables will be considered:
Table 4.33 Test 1 mean 53.5%;
Table 4.36 Test 1b mean 50.65%;
Table 4.39 Test 2 mean 51.85%;
Table 4.42 Test 3 mean 53.842%;
Table 4.45 Final Examination mean 56.867%;
Table 4.50 Oral Tests 1 and 2 mean 57.9333%;
With regard to the above results: The data collected from these KPI measurements
indicated a drop in achievement of outcomes from Test 1 to Test 1b with the traditional
lecturing approach as indicated in Fig. 4.64. The GEBL was introduced after Test 1b and
there was an improvement in achieving the outcomes from 50.65% to 51.85%. These
scores progressively improved over the remainder of the modules. There was no control
group in this study, so a comparison with traditional teaching and learning outcomes
could not be made. However these findings gave an indication of the extent to which
the outcomes of MTHE 2 had been achieved in the respective modules. Follow-up
studies can use these KPIs in a control/experimental group design to determine the
effectiveness of GEBL compared to the traditional approach of teaching and learning.
This however, lies outside the scope of this research.

260
5.3 Conclusion
From the qualitative and quantitative data collected in this study and the data
presented by similar studies the following conclusions can be made:
In this study active learning had a positive impact on student learning and the
introduction of GEBL in MTHE 2 resulted in a fruitful experience with the improvement
of overall scores. It was found that when students were more actively involved in the
learning process, they learned new concepts easier than what was in the past and
understood the work better. All types of presented data show these factors. Similar
views are corroborated by other researchers (Lee, 2004; Prince, 2004; Fuehne, 2007).
The students were also able to apply the information in new situations. This in turn
resulted in an improved academic performance. GEBL also exposed the students more
often to situations which required them to communicate and to use MTHE 2 terms
compared to the traditional teaching and learning approach as transcriptions of
interview data in particular point to. This also assisted them in developing
communication skills. The assistance that active learning had on the improvement of
communication skills are supported also by other researchers in the field (De Weck et
al., 2003; Zubair & Antar, 2004).
From the twenty students in the GEBL group, 75% qualified for the final examination.
80% of those who wrote the final examination passed which resulted in 60% of the
original GEBL group who passed the course overall. The average pass rate for this

261
course with traditional teaching method was below 40% which indicated a significant
improvement in student performance with GEBL.
The KPIs that were developed can be used for future measurements of the
achievement of MTHE 2 course outcomes and will give an indication of the effectiveness
of the teaching and learning method used in terms of achieving the specified outcomes.
These KPIs can also be used for the other mechanical engineering courses which have
similar outcomes to that of MTHE 2.
In conclusion, it is clear that GEBL improved student learning and the development of
professional skills in this study. However the degree to which this approach is more
effective than the traditional practices can only be determined through comparative
studies in future although the 60% pass of GEBL students when compared to 40% pass
for traditional method students show the better effectiveness of GEBL. There was also
sufficient evidence that GEBL improved students’ factual recall of thermodynamics
concepts; students’ conceptual understanding of thermodynamics concepts, principles
and applications; and students’ ability to communicate procedures and processes
related to thermodynamics. The measurements obtained from the KPIs gave feedback
to the researcher regarding the effectiveness of GEBL in achieving the specified
outcomes in each section of the syllabus of MTHE 2. This can be used for future
improvement of teaching and learning methods. In summary, the aim and objectives
stated for this study have therefore been successfully achieved.

262
5.4 Recommendations
Recommendations resulting from the findings of this study are as follows:
Lecturers need to pay more attention to the atmosphere which is created in the
classrooms. Students need to feel being welcomed and comfortable during a lecturing
session. Attention must be paid to the relationship between the lecturer and the
students. Although this should remain professional, the atmosphere created must allow
students to feel free to approach the lecturer. Lecturing venues should also be
equipped with re-groupable standing desks and chairs to allow for group work.
Suggested future presentations of MTHE 2:
The lecturer supplies the students with GEBL notes prior to the commencement
of the lecture. The lecturer introduces new concepts, principles and theories in
MTHE 2 to students. Students listen and take the necessary notes. This part of
the lecture must be minimised to allow for maximum interaction from students;
The lecturer does an example with the whole class following the EBL approach.
Students are involved by formulating questions to analyse the example;
The students are randomly divided into groups to avoid clicks to be formed
within any group. The students are then presented with a new problem to solve.
They work in groups and are given a few minutes to formulate the three to five
most relevant questions pertaining to the problem. This can be done by selecting
questions from the GEBL notes, formulating questions, interacting and discussing
all the detail needed to understand the process or processes involved.
The lecturer stops the whole class to get feedback from each group regarding

263
the questions they have formulated. Any irrelevant question or problems are
dealt with.
The students then use the information gathered from the questions and
discussions to develop a solution to the problem within a specified time. The
lecturer moves between the groups and assists individuals or groups with
problems.
At the end of the time feedback is given from each group and problems are dealt
with. The process is repeated until the lecture comes to ends.
Students are given homework to do for the next lecture and the lecturer
motivate them to do the homework and also needs to check and ensure that
they do the work as assigned.
The models (see subsections 5.5 & 5.6 that follow) proposed below and the
Appendices, especially Appendix 12 will help to implement GEBL effectively and
efficiently.
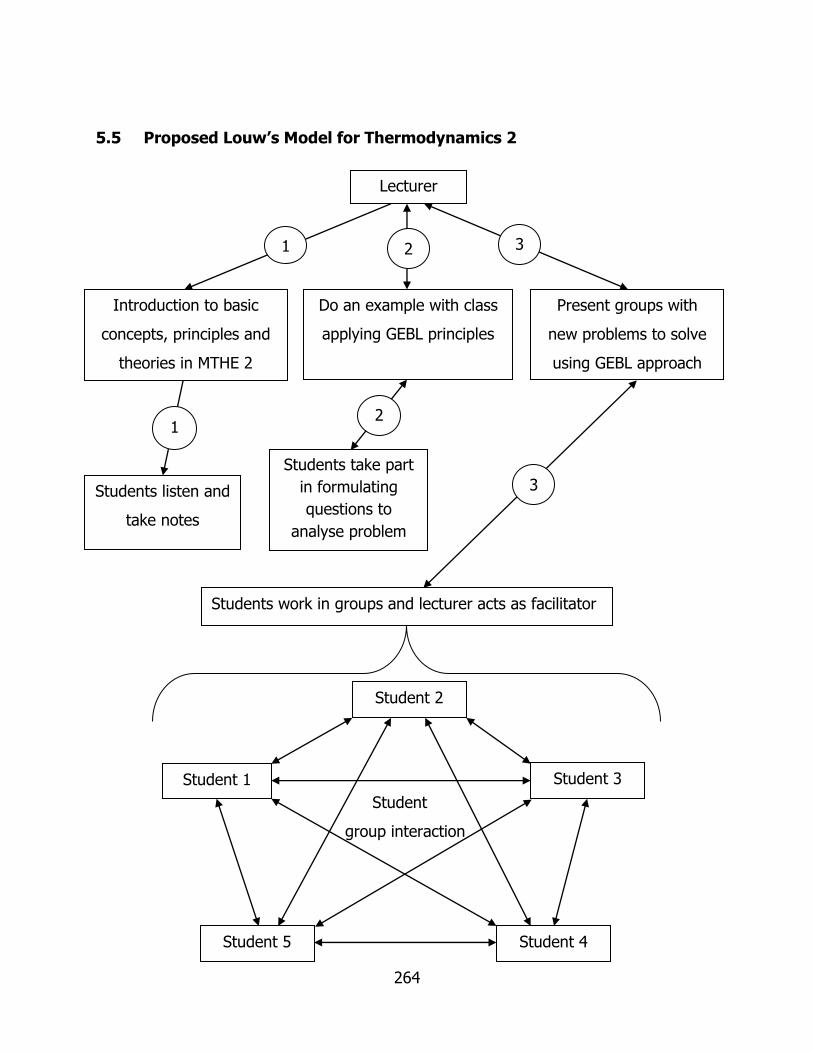
264
5.5 Proposed Louw’s Model for Thermodynamics 2
Student
group interaction
Introduction to basic
concepts, principles and
theories in MTHE 2
Lecturer
Student 1
Do an example with class
applying GEBL principles
Student 5 Student 4
Student 3
Student 2
Present groups with
new problems to solve
using GEBL approach
Students listen and
take notes
Students take part
in formulating
questions to
analyse problem
1
1
2
3
2
3
Students work in groups and lecturer acts as facilitator

265
5.6 General Model
From the above model, a possible pragmatic general model can be implemented in an
inductive approach. Lecturers must pay attention to the time that they spend on
lecturing. This time must be kept to a minimum to allow more time for group-work.
Suggested future presentations of mechanical engineering courses (see the general
model below):
The lecturer supplies the students with GEBL notes prior to the commencement
of the lecture. The lecturer introduces new concepts, principles and theories in
the particular course to students. Students listen and take the necessary notes.
This part of the lecture must be minimised to allow for maximum interaction
from students;
The lecturer does an example with the whole class following the EBL approach.
Students are involved by formulating questions to analyse the example;
The students are randomly divided into groups to avoid clicks to be formed
within any group. The students are then presented with a new problem to solve.
They work in groups and are given a few minutes to formulate the three to five
most relevant questions pertaining to the problem. This can be done by selecting
questions from the GEBL notes, formulating questions, interacting and discussing
all the detail needed to understand the process or processes involved.
The lecturer stops the whole class to get feedback from each group regarding
the questions they have formulated. Any irrelevant question or problems are

266
dealt with.
The students then use the information gathered from the questions and
discussions to develop a solution to the problem within a specified time. The
lecturer moves between the groups and assists individuals or groups with
problems.
At the end of the time feedback is given from each group and problems are dealt
with. The process is repeated until the lecture comes to ends.
Students are given homework to do for the next lecture.

267
5.7 Proposed Louw’s General Model for Engineering Courses
Student
group interaction
Introduction to basic
concepts, principles and
theories in engineering
courses
Student 1
Do an example with class
applying GEBL principles
Student 5 Student 4
Student 3
Student 2
Present groups with
new problems to solve
using GEBL approach
Students listen and
take notes
Students take part
in formulating
questions to
analyse problem
1
1
2
3
2
3
Students work in groups and lecturer acts as facilitator
Lecturer

268
ACKNOWLEDGEMENTS
The opportunity granted by WSU’s Faculty of Education to enroll for this study, the
professional and academic support from WSU’s Directorate of Postgraduate Studies and
the financial support from WSU’s Directorate of Research Development are gratefully
acknowledged.

269
REFERENCES
Adams, J. T., Kaczmarczyk, S., Picton, P. & Demian, P., 2007. Improving problem solving and encouraging creativity in engineering undergraduates. In: International Conference on Engineering Education. 3-7 September 2007. Portugal: Coimbra. Alters, B. J. & Nelson, C. E., 2002. Perspective: Teaching evolution in higher education. International Journal of Organic Evolution, 56(10), pp.1891-1901. Altuger, G., Tumkor, S. & Chassapis, C., 2009. Introduction to the mechanical engineering discipline through hands-on product development case studies, US – Turkey workshop on rapid technologies, 24 September 2009, pp.59-62. Anderson, E. E., Taraban, R. & Sharma, M. P., 2005. Implementing and assessing computer-based active learning materials in introductory thermodynamics. International Journal of Engineering Education, 21(6), pp.1168-1176. Aquirre, E., Jacmot, C., Milgrom, E., Raucent, B., Soucisse, A. & Vander Borght C., 2001. Meeting the needs of our stake holders. In: Engineering a new engineering curriculum at UC Louvain SEFI conference. 12-14 September 2001. Netherlands: Copenhagen. Armarego, J., 2007. Deconstructing students’ attitude to learning: A case study in IT education. In: Proceedings of the 2007 computer science and IT education conference. 16-18 November 2007. The Republic of Mauritius. Ary, D., Jacobs, L. C., Razavieh, A. & Sorensen, C., 2010. Introduction to research in education. 8th ed. Belmount, CA: Wadsworth. Australian Catholic University Learning and Teaching Plan 2009-2011. Avison, D., Lau, F., Myers, M. & Nielsen, P. A., 1999. Action research. Communications of the ACM, 42(1), pp.94-97. Aziz, E. & Chassapis, C., 2008. Introduction to the ME curriculum through product engineering case studies. In: 38th ASEE/IEEE Frontiers in education conference, 22-25 October 2008. USA: Saratoga Springs, NY. Bales, E., 1996. Corporate universities versus traditional universities: friends or foes? Third annual EDINEB (Educational Innovations in Economics and Business)

270
international conference. USA: Orlando, Florida. Bardet, J., & Ragusa, G., 2009. Analysis of body of knowledge in civil engineering. American Society for Engineering Education. Barrows, H. S., 1986. ‘A Taxonomy of Problem Based Learning Methods’, Medical education, 20, pp.481-486. Bless, C., Higson-Smith, C. & Kagee, A., 2006. Fundamental of social research: An african perspective. 4th ed. Cape Town: Juta. Board of European Students of Technology, 2006. “Active Learning in Engineering Education”. Symposium on education. 1-6 May 2006. Portugal: Porto. Boles, W., Beck, H. & Hargreaves, D., 2005. Deploying Bloom’s taxonomy in a work integrated learning environment, ASEE/AAEE 4th global colloquium on engineering education. Borrego, M., Douglas, E. P. & Amelink, C. T., 2009. Quantitative, qualitative, and mixed research methods in engineering education. Journal of Engineering Education, 98(1), pp.53-66. Boud, D. & Felleti, G., 1998. The challenge of problem-based learning. 2nd ed. London: Routledge. Bower, K. C., Mays, T. W. & Miller, C. M., 2004. Small group, self-directed problem based learning development in a traditional engineering program. In: 34th ASEE/IEEE frontiers in education conference. 20-23 October 2004. GA: Savannah. Brannick, T. & Coghlan, D., 2007. In defense of being ‘native’: The case for insider academic research. Organizational Research Methods, 10(1), pp.59-74. Brodie, L. & Gibbings, P., 2007. Developing problem based learning communities in virtual space. In: Connected 2007 international conference on design education. 9-12 July 2007. Australia: Sydney. Bryman, A. ed., 1989. Research methods and organization studies. London: Routledge. Burns, N. & Grove, S. K., 2004. The practice of nursing research: conduct, critique, and utilization. 5th ed. St Louis: Elsevier Saunders. Cano, V., 2000. Reliability & Validity in Qualitative Research. Available at: http://www.qmu.ac.uk/psych/Rtrek/study_notes/web/sn5.htm.

271
Carbone, A. C., Conway, D. & Farr, G., 2004. Techniques for effective tertiary teaching, school of computer science and software engineering, Monash University. Carmine, E. G. & Zeller, R. A., 1979. Reliability and validity assessment. London: Sage. Case, J. M. & Marshall, D., 2009. Approaches to learning. In: Tight, M., Huisman, J., Mok, K. H. & Morpew, C. ed. The Routledge International Handbook of Higher Education. London and New York: Routledge Falmer. Castles, R., Lohani, V. K. & Kachroo, P., 2009. Utilizing hands-on learning to facilitate progression through Bloom’s taxonomy within the first semester. In: 39th ASEE/IEEE frontiers in education conference, 18-21 October 2009. TX: San Antonio. Chang, R. L., Stern, L., Sondergaard, H. & Hadgraft, R., 2009. Places for learning engineering: A preliminary report on informal learning spaces. In: Proceedings of the research in engineering education symposium, 2009. Australia: Palm Cove, QLD. Charlevoix, D., Strey, S. & Mills, C., 2009. Design and implementation of enquiry-based, technology-rich learning activities in a large enrollment blended learning course. Journal of the Research Centre for Educational Technology, 5(3), pp.15-28. Committee of Technikon Principals (CTP), 2001, What is a Technikon? Available at: http://www.technikons.co.za/whatistech/techintro.html. Cope, C., 2003. Educationally critical characteristics of deep approaches to learning about the concept of an information system. Journal of Information Technology Education, 2, pp.415-427. Council on Higher Education, 2007. Higher education monitor, a case for improving teaching and learning in South African higher education, HE Monitor no.6, pp.26- 27. Craig, A., Joines, J., Miller, C., Miller, T., Raubenheimer, D., Rouskas, G., Silverberg, L. & Wiebe, E., 2008. Computing across curricula. In: ASEE Annual conference. June 2008. USA: Pittsburgh, PA. Creswell, J. W., 2003. Research design: qualitative, quantitative, and mixed method approaches. 2nd ed. Thousand Oaks, CA: Sage. Cronbach, L. J., 1951. Coefficient alpha and the internal structure of tests. Psychometrika, 16, pp.297-334.

272
Davis, B. G., 1993. Tools for teaching. San Francisco: Jossey-Bass. Davis, C. & Wilcock, E., 2008. Teaching materials using case studies, UK centre for materials education. De Graaf, E., Saunders-Smits, G. & Nieweg, M., 2005. Research and practice of active learning in engineering education. 1st ed. Netherlands: Amsterdam University Press. Delaney, K. & Kelleher, J., 2008. Real-world process design for mechanical engineering students: A case study of PBL in Dublin Institute of Technology. In: International symposium for engineering education, ISEE-08. Ireland: Dublin. De La Harpe, B. & Radloff, A., 2007. The value of assessing learning strategies for effective learning and teaching: strengthening the partnership between learners and teachers. Curtin business school, Curtin University of Technology. Faculty of Life Sciences, RMIT University. De Weck, O. L., Young, P. W. & Adams, D., 2003. The three principles of powered flight: An active learning approach. In: American society for engineering education annual conference & exposition. 22-25 June 2003. USA: Nashville, Tennessee. Ditcher, A. K., 2001. Effective teaching and learning in higher education, with particular reference to the undergraduate education of professional engineers. International Journal of Engineering Education, 17(1), pp.24-29. Donath, L., Spray, R., Thompson, N. S., Alford, E. M., Craig, N. & Matthews, M. A., 2005. Characterizing discourse among undergraduate researchers in an enquiry-based community of practice. Journal of Engineering Education, 94(3), pp.403-417. Downward, P. & Mearman, A., 2006. Retroduction as mixed-methods triangulation in economic research: reorienting economics into social science. Cambridge Journal of Economics, pp.1-23. Druckman, D., 2005. Doing research: methods of enquiry for conflict analysis. London: Sage. Edwards, R. & Recktenwald, G., 2008. Guided enquiry in an engineering technology classroom. In: American society for engineering education annual conference and exposition. USA: Pittsburgh, PA. Elshorgaby, A. & Schonwetter, D. J., 2002. Engineering morphing: bridging the gap

273
between classroom teaching and the engineering profession. International Journal of Engineering Education, 18(3), pp.295-300. Elston, R. & Johnson, W., 1994. Populations, samples and study design. In: Essentials of biostatistics. 2nd ed. Philadelphia: Davis Company. Engineering Council of South Africa, 2009. Criteria for accreditation of engineering programs meeting stage 1 requirements. Available at: http://www.ecsa.co.za/documents/080207_E-03- P_Criteria_For_Accreditation.pdf Farrell, S. & Hesketh R. P., 2000. An inductive approach to heat and mass transfer. In: American society for engineering education annual conference. USA: Glassboro, New Jersey. Felder, R. M. & Brent, R., 2003. Learning by doing. Chemical Engineering Education, 37(4), pp.282-283. Felder, R. M. & Brent, R., 2010. The national effective teaching institute: assessment of impact and implications for faculty development. Journal of Engineering Education, 99(2), pp.121-134. Felder, R. M. & Silverman, L. K., 1988. Learning and teaching styles in engineering education. Journal of Engineering Education, 78(7), pp.674-681. Felder, R. M., Woods, D. R., Stice, J. E. & Rugarcia, A., 2000. The future of engineering education II: teaching methods that work. Chemical Engineering Education, 34(1), pp.26-39. Ferreira, J. M. & Mueller, D., 2004. The Marvel EU project: a social constructivist approach to remote experimentation. Fink, L. D., 2003. What is “Significant Learning”? Author of creating significant learning experiences: an integrated approach to designing college courses. San Francisco, CA: Jossey-Bass. Flick, U., 2006. An introduction to qualitative research. 3rd ed. London: Sage. Floyd, K. S., Harrington, S. J. & Santiago J., 2009. The effect of engagement and perceived course value on deep and surface learning strategies. Informing Science: The International Journal of an Emerging Transdiscipline, 12, pp.181- 190.

274
Fowler, D. A., 2004. Defining and determining the impact of a freshman engineering student’s approach to learning (surface versus deep). Ph. D. Texas: A & M University. Fraser, B. J. & Tobin, K., 1997. International handbook of science education hardback. Netherlands: Kluwer Academic Publishers Group. Fuehne, J., 2007. Experience with active learning, frequent assessment and student evaluations. In: American society for engineering education Illinois-Indiana section conference. Spring 2007. USA: Indianapolis, Indiana. Gaither, G., Nedwek, B. P. & Neal, J. E., 1994. Measuring up: the promises and pitfalls of performance indicators in higher education. ASHE-ERIC Higher Education Report Series, 94-5, volume 23-5. Available at: http://www.ntlf.com/html/lib/bib/94-5dig.htm Gallow, D., 2000. Problem-Based Learning Faculty Institute, What is Problem-Based Learning? Available at: http://www.pbl.uci.edu/whatispbl.html Geer, U. C. & Rudge, D. W., 2004. A review of research on constructivist-based strategies for large lecture science classes. Available at: http://wolfweb.unr.edu/homepage/crowther/ejse/geer.pdf Gibson, I. S., 2002. Assessment in engineering education, a European perspective. International Journal on Engineering Education, 18(4), pp.465-471. Goldfinch, T., Carew, A. L. & McCarthy, T., 2008. Improving learning in engineering mechanics: the significance of understanding. In: Australasian association for engineering education conference. Australia: Yeppoon, Queensland. Hanrahan, H., 2007. Developing engineering qualifications within the South African NQF: a view from ECSA. In: Proceedings of the 7th Q-Africa conference. Available at: http:// www.saqa.org.za/docs/conference/qafrica/2007/developing.pdf Hanson, D. M., 2006. Instructor’s guide to process-oriented guided-enquiry learning. Lisle, IL: Pacific Crest. Hardjito, D., 2010. The use of scaffolding approach to enhance students’ engagement in learning structural analysis. International Education Studies, 3(1), pp.130-135. Hay, D. B., 2007. Using concept maps to measure deep, surface and non-learning outcomes. Studies in higher education, 32(1), pp.39-57.
275
Hester, E. L., 1995. Successful marketing research: the complete guide to getting and using essential information about your customers and competitors. Canada: Wiley & Sons. Hesketh, R. P., Farrell, S. & Slater C. S., 2002. The role of experiments in inductive learning. In: Proceedings of the American society for engineering education annual conference & exposition. June 2002. Canada: Montreal. Heukelom, F., 2009. Origin and interpretation of internal and external validity in economics. Nijmegen center for economics, working paper 09-111, August 2009. Available at: http://www.ru.nl/nice/workingpapers Higher Education Management Information System, 2009. Hodkinson, P., 2005. ‘Insider Research’ in the study of youth cultures. Journal of Youth Studies, June 2005, 8(2), pp.131-149. Holford, K. M. & Moore, C. J., 1994. Engineers fit for industry. Staff and educational development association, the new academic volume 3(1993/4), Vol. 3.2. Holloway, I., 1997. Basic concepts for qualitative research. New Jersey: Wiley – Blackwell. Hopson, M. H., Simms, R. L. & Knezek, G. A., 2002. Using a technology-enriched environment to improve higher-order thinking skills. Journal of Research on Technology in Education, 34(2), Winter 2001-2002, pp.109-119. Huet, S., Mourtos, N. J., Costa, N., Pacheco, O. & Tavares, J., 2007. Models for research-based teaching in engineering courses: a case study at the University of Aveiro (PT) and San Jose University (USA). In: International conference on engineering education. 3-7 September 2007. Portugal: Coimbra. Huizer, G., 1997. Participatory action research and people's participation: introduction and case studies. Available at: http://www.fao.org/WAICENT/FAOINFO/SUSTANDARDEV/PPdirect/PPre0020.htm
Hyslop-Margison, E. J. & Strobel, J., 2008. Open forum, constructivism and education: misunderstandings and pedagogical implications. The Teacher Educator, 43, pp.72-86. Indian Express.com, 2009. August 10th.

276
Irish, R., 1999. Engineering thinking: using Benjamin Bloom and William Perry to design assignments. Language and Learning Across the Disciplines, 3(2), pp.83-102. Integrated Tertiary Software records, WSU, 2008. Jollands, M., McCallum, N. & Bondy, J., 2009. If students want feedback why don’t they collect their assignments? In: 20th Australasian association for engineering education conference. 6-9 December 2009. Australia: Adelaide. Jones, M. G. & Brader-Araje, L., 2002. The impact of constructivism on education: language, discourse, and meaning, school of education, University of North Carolina, Chapel Hill. American Communication Journal, 5(3). Available at: http://acjournal.org/holdings/vol5/iss3/special/jones.htm Jones, R. C., 1998. World expertise llc, global status of engineering education, outcomes of the global congress on engineering education at Cracow, Poland. Available at: http://www.worldexpertise.com/global_status_of_engineering_edu.htm
Joughin, G., 2003. Oral assessment from the learner’s perspective: the experience of oral assessment in the post-compulsory education. Ph. D. Brisbane: Griffith University. Available at: http://www4.gu.edu.au:8080/adt-root/uploads/approved/adt- QGU20031125.091403/public/02Whole.pdf
Junglas, P., 2006. Simulation programs for teaching thermodynamics. Global Journal of Engineering Education, 10(2), pp.175-180. Kabir, K. B., Khan, M. S. & Mahmud, I., 2008. Novel ideas on engineering education in Bangladesh. Chemical Engineering Research Bulletin, (12), pp.11-19. Kapadia, R. J., 2008. Teaching and Learning Styles in Engineering Education. In: 38th ASEEIEEE frontiers in education conference. 22-25 October 2008. USA: Saratoga Spring, New York. Kapranos, P., 2007. 21st Century teaching & learning: Kolb’s cycle & reflective thinking as part of teaching, creativity, innovation, enterprise and ethics to engineers. In: International symposium for engineering education 2007. Ireland: Dublin. Kaw, A. K., Besterfield, G. H. & Eison, J., 2005. Assessment of a web-enhanced course in numerical methods. International Journal on Engineering Education, 21 July, 21(4), pp.712-722.
277
Kaw, A. & Garapati, S., 2010. Development of digital audiovisual lectures for an engineering course: a you tube experience. In: American society for engineering education southeast section conference. USA: South Florida. Killen, R., 2006. Effective teaching strategies: lessons from research and practice. 4th ed. Spain: Social Science Press. Kirk, J. & Miller, M. L., 1986. Reliability and validity in qualitative research. 8th ed. Beverly Hills, CA: Sage. Kitto, K. L., 2009. Using cooperative writing and oral presentations as peer teaching - evaluating the effectiveness of elements of inductive teaching and social constructivism on student outcomes. In: 39th ASEE/IEEE frontiers in education conference. 18-21 October 2009. Texas: San Antonio. Kitto, K. L., 2010. Understanding the effectiveness of cognitive and social constructivism, elements of inductive practice, and student learning styles on selected learning outcomes in materials engineering. In: 40th ASEE/IEEE frontiers in education conference. 27-30 October 2010. USA: Washington, DC. Klentschy, M., & Thompson, L., 2008. Scaffolding science enquiry through lesson design: using a research-based template to plan classroom instruction. Portsmouth, NH: Heinemann. Kok-Soo, T., 2003. Project-based learning in engineering education: an approach used by Monash University Malaysia. In: International conference on engineering education, 21-25 July 2003, Spain: Valencia. Kuri, N. P., 2000. Kolb’s learning cycle: an alternative strategy for engineering education. Available at: http://www.ineer.org/Events/ICEE1998/ICEE/papers/225.pdf Lamancusa, J. S., Zayas, J. L., Soyster, A. L., Morell, L. & Jorgensen, J., 2008. The learning factory: industry-partnered active learning. Journal of Engineering Education, 15 May, 97(1), pp.1-15. Lattuca, L. R., Terenzini, P. T., Volkwein, J. F. & Peterson, G. D., 2006. The changing face of engineering education. The Bridge, 36(2), pp.5-13. Lee, V. S., 2004. Teaching and learning through enquiry: a guidebook for institutions and instructors. Sterling, VA: Stylus. Lincoln, Y. S. & Guba, E. G., 1985. Naturalistic enquiry. London: Sage.

278
Linsey, J., Talley, A., White, C. & Jensen, D., 2009. From tootsie rolls to broken bones: an innovative approach for active learning in mechanics of materials. In: American Society for Engineering Education - Advances in Engineering Education, 1(3), pp.18-19. Litzinger, T. A., Lattuca, L. R. & Hadgraft, R. G., 2011. Engineering education and the development of expertise. Journal of Engineering Education, 100(1), pp.123-150. Lublin, J., 2003. Deep, surface and strategic approaches to learning. centre for teaching and learning good practice in teaching and learning, University College Dublin, pp.1-11. Ma, A. W. W., 2009. Computer supported collaborative learning and higher order thinking skills: a case study of textile studies. Interdisciplinary Journal of E- Learning and Learning Objects, 5, pp.145-167. Maier, P., Barnett, L., Warren, A. & Brunner, D., 1998. Using technology in teaching and learning. New York: Routledge. Marshall, C. & Rossman, G. B., 2006. Designing qualitative research. 4th ed. Thousand Oaks, CA: Sage. Martin, D. J., 2009. Elementary science methods: a constructivist approach. 5th ed. Belmount, CA: Wadsworth. Martin, R., Maytham, B., Case, J. & Fraser, D., 2005. Engineering graduates’ perceptions of how well they were prepared for work in industry. European Journal of Engineering Education, 30(2), pp.167-180. Materu, P. N., 2007. Higher education quality assurance in Sub Saharan Africa: status, challenges, opportunities, and promising practices. Washington: The World Bank. Mazumder, Q. H., 2010. Metacognition approaches to enhance student learning in mechanical engineering classroom. In: World congress on engineering, 2, June 30-July 2, U.K: London. McKenna, A. F., Yalvac, B. & Light, G. J., 2009. The Role of collaborative reflection on shaping engineering faculty teaching approaches. Journal of Engineering Education, 98, pp.17-26. Merriam, S. B., 1995. What can you tell from an N of 1?: issues of validity and reliability in qualitative research – theory to practice. PAACE Journal of Lifelong Learning, 4, pp.51-60.

279
Michaelides, I., Eleftheriou, P. & Muller, D., 2004. A remotely accesseble solar energy laboratory - a distributed learning experience. In: 1st Remote engineering and virtual instrumentation international symposium (REV'04), 28-29 September 2004. Austria: Villach. Miller-Young, J., 2007. CSI (Crash Scene Investigation): An inquiry-based learning project. American society for engineering education. 2007. USA: Hattiesburg, MS. Mohammadi, I. M., 2008. Department of agricultural extension education, college of agriculture, University of Tehran, Karaj, Iran, variables refinery process to ensure research unbiasedness (validity) and invariance (reliability) in agricultural extension and education. American Journal of Agricultural and Biological Sciences, 3(1), pp.342-347. Naher, S., Brabazon, D. & Looney, L., 2008. Affects of student attendance on performance in undergraduate materials and manufacturing modules. International symposium for engineering education. 8-10 September. Ireland: Dublin. Nicklow, J., Kowalchuk, R., Gupta, L., Tezcan, J. & Mathias, J., 2009. A short-term assessment of a multi-faceted engineering retention program, Southern Illinois University. In: 39th ASEE/IEEE frontiers in education conference. 18-21 October 2009. TX: San Antonio. Nicol, D. J. & Boyle, J. T., 2003. Peer instruction versus class-wide discussion in large classes: a comparison of two interaction methods in the wired classroom. Studies in Higher Education, 28(4), pp.457-473. Nilson, L. B., 2010. Teaching at its best: a research-based resource for college instructors. 3rd ed. San Francisco, CA: Jossey-Bass. O'Dwyer, A., 2008. Learning styles of first year level 7 electrical and mechanical engineering students at DIT. In: Proceedings of the international symposium for engineering education ISEE-08, 1 January, pp.69-74. O’Dwyer, A., 2009. Analysis of learning styles of first year engineering students on two Level 7 programmes. In: All-Ireland society for higher education (AISHE) conference. Ireland: NUI, Maynooth. Ogot, M. & Okudan, G. L. E., 2006. Systematic creativity methods in engineering education: a learning styles perspective. International Journal of Engineering Education, 22(3), pp.566-576.

280
Orlich, D. C., Harder, R. J., Callahan, R. C., Trevisan, M. S. & Brown, A. H., 2007. Teaching strategies: a guide to effective instruction. 9th ed. Boston, MA: Wadsworth. Pendergrass, N. A., Kowalczyk, R. E., Dowd, J. P., Laoulache, R. N., Nelles, W., Golen, J. A. & Fowler, E., 1999. Improving first-year engineering education. In: 29th ASEE/IEEE frontiers in education conference, 10-13 November 1999. USA: San Juan, Puerto Rico. Prince, M., 2004. Does active learning work? Review of research, department of chemical engineering Bucknell University. Journal of Engineering Education 93(3), pp.223-231. Prince, M. J. & Felder, R. J., 2006. Inductive teaching and learning methods: definitions, comparisons and research bases. Journal of Engineering Education, 95(2), pp.123-138. Prince, M. & Hoyt, B., 2002. Helping students make the transition from novice to expert problem-solvers. In: 32nd ASEE/IEEE frontiers in education conference. 6-9 November 2002. USA: Boston, MA. Punch, K., 2005. Introduction to social research: quantitative and qualitative approaches. 2nd ed. London: Sage. Pundak, D., Herscovitz, O., Shacham, M. & Wiser-Biton, R., (2009) Instructors' attitudes toward active learning. Interdisciplinary Journal of E-Learning and Learning Objects, (5), pp.215-226. Purcell, P., 2007. Engineering student attendance at lectures: effect on examination performance, University College Dublin, Ireland. In: International conference on engineering education. 3-7 September 2007. Portugal: Coimbra. Qualters, D. M., Sheahan, T. C. Mason, E. J., Navick, D. S. & Dixon M., 2008. Improving learning in first-year engineering courses through interdisciplinary collaborative assessment. Journal of Engineering Education, 97(1), pp.37-45. Ramsuroop, S., 2011. Developing engineering conceptual competencies in chemical engineering students through socially relevant diy projects. In: Proceedings of the 1st Biennial conference of the South African society for engineering. 10-12 August 2011. SA: Stellenbosch. Reagan, T. G. & Osborn, T. A., 2002. The foreign language educator in society: toward a critical pedagogy. Mahwah, NJ: Lawrence Erlbaum Associates.

281
Reason, P., 1994. Three approaches to participative enquiry. Research and action enquiry: three approaches to participative enquiry. Prepared for the handbook of qualitative research, edited by Denzin, N. K. & Lincoln, Y. S. Thousand Oaks: Sage. Reason, P. & Bradbury, H., 2008. The Sage handbook of action research: participative enquiry and practice. 2nd ed. London: Sage. Reid, G., 2005. Learning styles and inclusion. London: Sage. Reeves, J., Courter, S., Nickels, K., Noyce, D., Pearce, A., Schaefer, L., Wickramasinghe, R. & Lyle, R., 1999. Change agents: immediately implementable teaching and educational hints from the engineering education scholars program. In: American society for engineering education annual conference. 20-23 June 1999. USA: Charlotte, North Carolina. Richards, L. G. & Schnittka, C. G., 2007. Workshop - bringing engineering into middle schools: learning science and math through guided enquiry and engineering design. In: 37th ASEE/IEEE frontiers in education conference. 10-13 October 2007. USA: Milwaukee, WI. Ritchie, J., Zwi, A. B., Blignault, I., Bunde-Birouste, A. & Silove, D., 2009. Insider- outsider positions in health-development research: reflections for practice. Development in Practice, 19(1), pp.106-112. Robbins, D. & Ardebili, M., 2006. Engineering students’ conceptions of heat and temperature pre and post thermodynamics course. American Society of Engineering Education, pp.1-9. Roe, B. E. & Just, D. R., 2009. Internal and external validity in economics research: tradeoffs between experiments, field experiments, natural experiments and field data. In: 2009 ASSA annual meeting. USA: San Francisco, CA. Rose, C. P., Kumar, R., Aleven, V., Robinson, A. & Wu, C., 2006. Cycle talk: data driven design of support for simulation based learning. International Journal of Artificial Intelligence in Education Special Issue of the Best of ITS ’04, 16, pp.195-223. Rugarcia, A., Felder R. M., Woods D. R. & Stice J. E., 2000. The future of engineering education. 1. A vision for a new century. Chemical Engineering Education, 34(1), pp.16-25.

282
Rutkowski, J., Moscinska, K. & Jantos, P., 2010. Application of Bloom’s taxonomy for increasing teaching efficiency – case study. In: International conference on engineering education. 18-22 July 2010. Poland: Gliwice. Salmi, J., 2001. Tertiary education in the 21st century: challenges and opportunities. Journal of the Programme on Institutional Management in Higher Education, 13(2), pp.105-131. Sandoval, W. A., 2005. Understanding students’ practical epistemologies and their influence on learning through enquiry. 27 May, pp.634-656. Available at: http://www.interscience.wiley.com Savage, R. N., Chen, K. C. & Vanasupa, L., 2007. Integrating project-based learning through-out the undergraduate engineering curriculum, submitted to the J. STEM education, October 2006. Schofield, A., 2007. The Higher education academy - embedding strategies to enhance learning and teaching in Scottish HEIs: an approach to self-assessment. Serfontein, D. E. & Fick, J. I. J., 2011. Implementation experience with project-based inductive learning in an introductory undergraduate module in nuclear engineering. In: Proceedings of the 1st Biennial conference of the South African society for engineering. 10-12 August 2011. SA: Stellenbosch. Shenton, A. K., 2004. Strategies for ensuring trustworthiness in qualitative research projects. Education for Information, 22(2), pp.63-75. Smith, B. L. & MacGregor, J. T., 1992. What is collaborative learning?: A sourcebook for higher education, University Park, national center on postsecondary teaching, learning, and assessment, Pennsylvania State University. South African Qualifications Authority document on the registered National Diploma Mechanical Engineering, 2009. Spronken-Smith, R., Angelo, T., Matthews, H., O’Steen, B. & Robertson, J., 2007. How Effective is enquiry-based learning in linking teaching and research? Available at: http://portal-live.solent.ac.uk/university/rtconference/colloquium_papers.aspx
Stappenbelt, B., 2010. The influence of action learning on student perception and performance. Australasian Journal of Engineering Education, 16(1), pp.1-12. Strangman, N. & Hall, T. E., 2004. Background knowledge, MA: national center on accessing the general curriculum. Available at: http://www.cast.org/publications/ncac/ncac_backknowledge.html

283
Su, K. D., 2008. An integrated science course designed with information communication technologies to enhance university students’ learning performance. Computers & Education, 51(2008), pp.1365-1374. Available at: http://www.sciencedirect.com Taraban, R., Anderson, E. E., De Finis, A., Brown, A. G., Weigold, A. & Sharma, M. P., 2007. First steps in understanding engineering students’ growth of conceptual and procedural knowledge in an interactive learning context. Journal of Engineering Education, 96(1), pp.57-68. Terry, R. E. & Harb, J. N., 1993. Kolb, Bloom, creativity, and engineering design. In: ASEE Annual Conference Proceedings. 20-24 June 1993. USA: Illinois-Urbana. Tesch, R., 1990. Qualitative research: analysis types and software tools. London: Routledge. Thiétart, R. A., 2001. Doing management research: a comprehensive guide. Thousand Oaks, CA: Sage. Thompson, N. S., Alford, E. M., Liao, C., Johnson, R. & Matthews, M. A., 2005. Integrating undergraduate research into engineering: a communications approach to holistic education. Journal of Engineering Education, 94(3), pp.297- 307. Tinker, C. & Armstrong, N., 2008. From the outside looking in: how an awareness of difference can benefit the qualitative research process. The Qualitative Report, (13)1, pp.53-60. Tharp, R. & Gallimore, R., 1988. Rousing minds to life. New York: Cambridge University Press. Tully, M. F. & Clarke, D. P., 2008. Use of the infinity project to improve student recruitment and retention on university engineering programmes and apprenticeship training in Ireland. In: International conference on engineering education, 2008. Hungary: Budapest. University of Johannesburg, strategic planning and resourcing, 2007. Uziak, J., Oladiran, M. T. & Moalosi, R., 2010. Reviewing and developing course descriptions to comply with accreditation requirements. Global Journal of Engineering Education, 12(1), pp.30-37. van Niekerk, W., Mentz, E. & Smit, W., 2011. Co-operative learning in thermodynamics: solving problems in pairs. In: Proceedings of the 1st Biennial

284
conference of the South African society for engineering. 10-12 August 2011. SA: Stellenbosch. Vlasceanu, L., Grunberg, L. & Parlea, D., 2007. Quality assurance and accreditation: a glossary of basic terms and definitions. UNESCO-CEPES 2007. Romania: Bucharest. Walter Sisulu University faculty prospectus, 2010. Weir, J. A., 2004. Active learning in transportation engineering. Ph. D. Massachusetts: Worcester Polytechnic Institute. Woollacott, L., 2011. MIGs: Mediated interaction groups for enhancing learning among engineering students. In: Proceedings of the 1st Biennial conference of the South African society for engineering. 10-12 August 2011. SA: Stellenbosch. Yaman, S., 2005. Teacher learning and change: consistency between personal theories and behaviours. Mersin University Journal of the Faculty of Education, 1(1), pp.24-47. Ying, Y., 2003. Using problem-based teaching and problem-based learning to improve the teaching of electrochemistry. The China Papers, pp.42-47. Zubair, S. M. & Antar, M. A., 2004. Project-based teaching and learning in thermo- fluid courses. Available at: http://www.engconfintl.org/8axabstracts/Session%205A/rees08_submission_84.doc
Żywno, M. S., 2003. Hypermedia instruction and learning outcomes at different levels of Bloom’s taxonomy of cognitive domain. Global Journal of Engineering Education, 7(1), pp.59-70.

285
APPENDICES
Appendix 1 – Structured Questionnaire testing students experience with
GEBL
Items Strongly
agree
Agree Neutral Disagree Strongly
disagree
1. I enjoyed the group sessions. 10 4 0 1 0
2. The enquiry based sessions helped me to analyse problems effectively.
11
4
0
0
0
3. When working alone the enquiry- based approach helped me to analyse problems effectively.
5 4 6 0
0
4. This method helped me to understand the work and not to just memorise it.
10
4
1
0
0
5. This method helped me develop the ability to solve problems on my own.
4
10
1
0
0
6. The Thermodynamics booklet with questions and answer discussions helped me to understand the work better.
9
5
0
1
0
2. 7. The Thermodynamics booklets’ additional questions and answers helped me to understand and analyse new problems better.
4
9
2
0
0
3. 8. This method can help me to understand other courses better.
6 7 1 1 0
9. This method should also be introduced in other courses.
9
5
0
0
1

286
Appendix 2 – Qualitative interviews with students participating in GEBL
Interview schedule
The interview will be based on the students involved with GEBL group sessions and who
made use of the MTHE2 booklet on enquiry learning. The purpose of the interview will
be to determine the students experience and opinions with regard to this method of
teaching. The interviews will be approximately twenty minutes.
Please state for the record your Name, Surname, Age, Race, Gender, Student number
and whether you were enrolled for MTHE2 with Mr Louw.
Could you kindly confirm that you were thoroughly briefed about the purpose of this
interview, that you received a letter explaining its purpose and that you signed an
informed consent form. You also realise that your participation is voluntary and that you
are under no obligation to answer all the questions and that you may withdraw at any
time during the interview.
Items Follow-up
Item 1
The group sessions were very
enjoyable.
If yes, explain what
exactly you enjoyed.
In terms of interaction
with peers did the
sessions made the
course more enjoyable?
If no, explain why not.

287
Item 1a
The group sessions motivated you
to come prepared to class.
If yes, explain why the
group sessions made
you feel responsible to
come prepared to the
next class?
If no, explain why not.
Item 1b
The group sessions helped
developing your communication
skills.
If yes, explain how did
the group sessions
develop your
communication skills?
If not, explain why not.
Did you not take part in
group discussions?
Item 2
The enquiry based sessions helped
me to analyse problems
effectively.
If yes, explain how the
group sessions helped
you in analysing
problems.
Are you not relying too
much on group member
support?
What exactly about this
method helped you to
analyse problems more
effectively?
If not, explain why it
did not help.
What could have been
done to change this?
Item 3
If yes, explain how the
If not, explain why it

288
When working alone the enquiry
based approach helped me to
analyse problems effectively.
enquiry based approach
helped you in analysing
problems when working
on your own.
Explain briefly how you
applied the IB method
when working on your
own.
did not help.
What could have been
done to change this?
Item 4
This method helped me to
understand the work and not to
just memorise it.
If yes, explain how this
approach helped you to
understand the subject
content better.
Was this better
understanding because
of the different approach
you use in studying the
work?
If no, explain why you
think it did not help.
What could have been
done to change this?
Item 5
This method helped me develop
the ability to solve problems on
my own.
If yes, explain this ability
that you have developed
to solve problems on
your own – how are you
now more able?
If no, explain why it did
not help.
What could have been
done to change this?

289
Did the systematic
approach in analysing a
problem together with
your better
understanding of the
course content made
you feel confident that
you are on the correct
track?
Item 6
The Thermodynamics booklet with
questions and answer helped me
to understand the work better.
If yes, explain what in
the booklet helped you
to understand the work
better.
Are you saying you were
manipulating your
approach to get to the
answer?
Did you not find the way
of explaining the work
easier to follow,
understand and to
apply?
If no, explain why it did
not help.
What can be done to
make the booklet more
helpful?

290
Item 7
The Thermodynamics booklet’s
additional questions and answers
helped me to understand and
analyse new problems better.
If yes, explain how
these additional
questions with answers
helped you understand
and analyse problems
better.
Did the additional
questions with answers
helped you to develop
the skill to interpret and
analyse new more
complex problems
easier?
Have you developed the
skill to deal with
problems that you have
never seen before or
that are not similar to
those that you have
done?
If no, explain why it did
not help.
What can be done to
make the booklet more
helpful in understanding
and analysing
problems?
Item 8
This method can help me to
If yes, explain why you
think it will help you
understand other
If no, explain why it will
not help you.
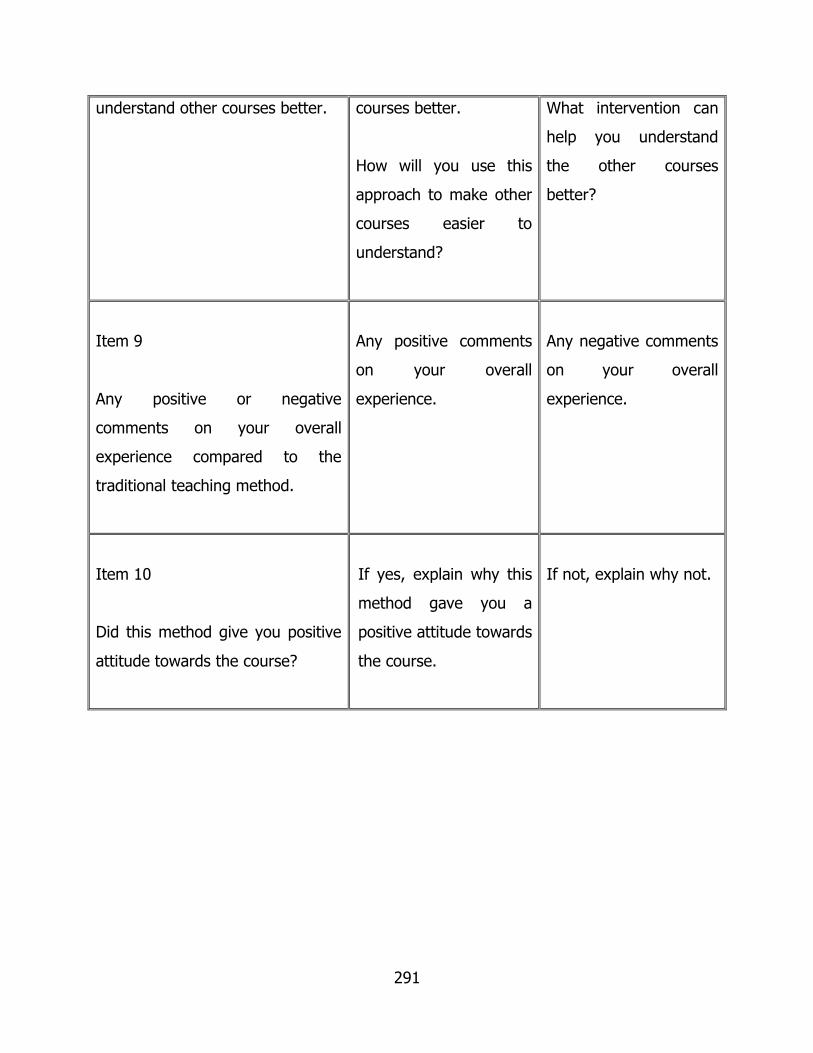
291
understand other courses better.
courses better.
How will you use this
approach to make other
courses easier to
understand?
What intervention can
help you understand
the other courses
better?
Item 9
Any positive or negative
comments on your overall
experience compared to the
traditional teaching method.
Any positive comments
on your overall
experience.
Any negative comments
on your overall
experience.
Item 10
Did this method give you positive
attitude towards the course?
If yes, explain why this
method gave you a
positive attitude towards
the course.
If not, explain why not.

292
Appendix 3 – Formative assessment 1 (semester test 1)
NATIONAL DIPLOMA ENGINEERING: MECHANICAL
DIPLOMA CODE: 3208110
THERMODYNAMICS 2
SUBJECT CODE: 81908922
Student No:__________________
EXAMINER: C LOUW
Surname:____________________
MARKS: 46
Group:______________________
TIME: 90 min
TEST 1
FEBRUARY 2010
Read the problems carefully and answer the questions in the respective spaces
on the answer sheet:
QUESTION 1
An experiment was conducted with a certain gas. It was found that when the
gas is maintained in a constant volume container, 70 kJ/kg of energy are
required to raise the temperature 830C. It is known that = 1,5 for the gas.
1.1 Analyse this question and make a neat drawing of the process before

293
and after the energy was supplied. Indicate all relevant detail
clearly. Explain which variables changed and which ones
remained unchanged during this process;_____________________
______________________________________________________
______________________________________________________
(7)
Explain and calculate:
1.2 the specific heat capacity at constant pressure for the gas;_______
_____________________________________________________
_____________________________________________________
(8)
Explain and calculate:
1.3 the gas constant for this gas.______________________________
____________________________________________________
____________________________________________________
(6)
1.4 During the operation of this device, which readings/factors will
have to be monitored to ensure the safety of the equipment and
people. Explain why these reading/factors can pose a danger to the
equipment and people:___________________________________
_____________________________________________________
_____________________________________________________

294
_____________________________________________________
_____________________________________________________
_____________________________________________________
_____________________________________________________
_____________________________________________________
_____________________________________________________
_____________________________________________________
_____________________________________________________
_____________________________________________________(4)
[25]
QUESTION 2
A closed system undergoes a polytropic process in which the heat added is
17kJ and the internal energy increases by 48kJ. The initial state is 130kPa and
0,15m3 and the final pressure is 800kPa. The gas used in the process was air
and the initial temperature was 300K.
2.1 Analyse this question and make a neat pressure-volume diagram of
the process with all relevant detail indicated clearly. Explain why
the values changed the way they did (e.g. if volume decreased
explain why);___________________________________________
______________________________________________________
______________________________________________________
295
P
V
(11)
Explain and calculate:
2.2 the final volume in the process;_____________________________
______________________________________________________
______________________________________________________
(10)
[21]

296
Appendix 4 – Formative assessment 1b (semester test 1b)
NATIONAL DIPLOMA ENGINEERING: MECHANICAL
DIPLOMA CODE: 3208110
THERMODYNAMICS 2
SUBJECT CODE: 81908922
Student No:__________________
Examiner: C Louw
Surname:____________________
MARKS: 85
Group:______________________
TIME: 2 Hrs
TEST 1b
February 2010
Read the problems carefully and answer the questions in the respective spaces
on the answer sheet:
QUESTION 1
A piston-cylinder device with stops is used during an experiment. The
following data was recorded during:
Heat supplied:
mass of air = 0.465kg

297
initial temperature = 270C
initial pressure 200kPa
V1 = 0.2m3
V2 = 0.5m3
P1 = P2
Compression:
T3 = 6000C
V3 = V1
Solution:
1.1 Explain the type of process or processes involved in the question;_______________________________________________
______________________________________________________
______________________________________________________
_____________________________________________________
_____________________________________________________
_____________________________________________________
_____________________________________________________
_____________________________________________________(8)

298
1.2 Reflect the process or processes on the pressure-volume diagram,
with all given information clearly indicated;
P
V
(7)
Explain and determine:
1.3 the total heat flow;
_______________________________________________________
_______________________________________________________
_______________________________________________________
(17)
Explain and determine:
1.4 the amount of heat removed from the air to return it to the initial condition;_____________________________________________
_____________________________________________________
_____________________________________________________
_____________________________________________________

299
_____________________________________________________
_____________________________________________________
_____________________________________________________
_____________________________________________________
_____________________________________________________
(9)
[41]
QUESTION 2
A piston-cylinder device, with a set of stops on the top, initially contains
3kg of air at 200kPa and 270C. Heat is now transferred to the air, and the
frictionless piston rises, keeping the pressure constant, until it hits the stops,
at which point the volume is twice the initial volume. More heat is transferred
until the pressure inside the cylinder also doubles.
Solution:
2.1 Analyse this question and make a neat pressure-volume diagram of the
process with all relevant detail indicated clearly. Explain why the values
changed the way they did (e.g. if volume decreased explain why). Explain
also the type of process or processes involved in the question;
___________________________________________________________
___________________________________________________________
___________________________________________________________
___________________________________________________________
___________________________________________________________

300
P
V
(15)
Explain and calculate:
2.2 the work done;
_____________________________________________________________
_____________________________________________________________
_____________________________________________________________
_____________________________________________________________
_____________________________________________________________
_____________________________________________________________
(10)
Explain and calculate:
2.3 the amount of heat transfer during the complete process.
___________________________________________________________
___________________________________________________________
___________________________________________________________
(19)
[44]

301
Appendix 5 – Formative assessment 2 (semester test 2)
NATIONAL DIPLOMA ENGINEERING: MECHANICAL
DIPLOMA CODE: 3208110
THERMODYNAMICS 2
SUBJECT CODE: 81908922
Student No:__________________
Examiner: C Louw
Surname:____________________
MARKS: 55
TIME: 1hr
SEMESTER TEST 2
19 MARCH 2010
Read the problems carefully and answer the questions in the respective spaces
on the answer sheet:
QUESTION 1
Air is compressed from 100kPa and 220C to a pressure of 1MPa while being
cooled at a rate of 16kJ/kg by circulating water through the compressor
casing. The volume flow rate of the air at inlet conditions is 150m3/min and
the power input to the compressor is 500kW. Determine:
1.1 Explain the type of process or processes involved in this question;_______
____________________________________________________________

302
____________________________________________________________
____________________________________________________________
____________________________________________________________(4)
1.2 Draw a sketch of the device used in the question with all given information reflected as well as directions of flow;
(3)
Explain and determine the following:
1.3 the mass flow rate of the air; ___________________________________________________________
___________________________________________________________
___________________________________________________________
(4)
Explain and determine the following:
1.4 the temperature at the compressor exit:
____________________________________________________________
____________________________________________________________
____________________________________________________________
(4)
1.5 How does the outlet temperature compare to the inlet temperature and what
causes this difference?
_____________________________________________________________
_____________________________________________________________
_____________________________________________________________
303
_____________________________________________________________
_____________________________________________________________
_____________________________________________________________
_____________________________________________________________(5)
1.6 Explain the importance of cooling the compressor during operation and also explain what will be the effect if cooling is not done effectively:
_____________________________________________________________
_____________________________________________________________
_____________________________________________________________
_____________________________________________________________
_____________________________________________________________
_____________________________________________________________
_____________________________________________________________
_____________________________________________________________
_____________________________________________________________(3)
[23]
QUESTION 2
A furnace gas has the following volumetric analysis: H2 15%, CO 24%, CO2 6%,
CH4 12%, O2 3% and N2 40%. Calculate the volumetric analysis of the dry
products of combustion with 30% excess air.
2.1 Explain the type of process or processes involved in the
question;____________________________________________________
___________________________________________________________(1)
2.2 Explain what is required in order for one to be able to do an analysis of

304
products of combustion;________________________________________
___________________________________________________________(3)
2.3 Explain the steps to be followed to calculate all that is required to
do an analysis;_______________________________________________
___________________________________________________________
_____________________________________________________
_____________________________________________________
___________________________________________________________(5)
2.4 Perform the calculations as explained in 2.3:
(11)
2.5 Tabulate your results and explain what these values mean:
(12)
[32]

305
Appendix 6 – Formative assessment 3 (semester test 3)
NATIONAL DIPLOMA ENGINEERING: MECHANICAL
DIPLOMA CODE: 3208110
Group: ______________
THERMODYNAMICS 2
SUBJECT CODE: 81908922
Student No:__________________
EXAMINER: C LOUW
Surname:____________________
MARKS: 113 [110 = 100%]
TIME: 3 HRS
SEMESTER – TEST 3
April 2010
Read the problems carefully and answer the questions in the respective spaces
on the answer sheet:
QUESTION 1
A quantity of steam at a pressure of 3MPa has a dryness fraction of 0.72.
The steam occupies a volume of 0.4m3. Heat is transferred into the steam
while the pressure remains constant until the steam is dry saturated. The steam
is then cooled at constant volume until the pressure becomes 1.8MPa.
1.1 Explain the type of process or processes involved in the question;________

306
________________________________________________________________
________________________________________________________________(4)
1.2 Reflect the process or processes on the pressure-volume diagram and a
temperature-entropy diagram, with all given information clearly indicated;
P T
V S
(5)
Explain and determine the following:
1.3 the heat transfer during the constant pressure process;
____________________________________________________________
____________________________________________________________
____________________________________________________________
(9)
Explain and determine the following:
1.4 the percentage of heat flow which is converted into work done; ____________________________________________________________
____________________________________________________________
____________________________________________________________
(7)
307
Explain and determine the following:
1.5 the heat transferred during the constant volume process.
____________________________________________________________
____________________________________________________________
____________________________________________________________
(10)
[35]
QUESTION 2
Feed water at 290C is fed to a boiler at a rate of 500 l/h. The isobaric boiler
pressure is 700kPa. The super-heater receives the steam which is 90% dry
and superheats the steam to 4000C.
2.1 Draw a fully detailed pressure-volume and temperature-entropy
diagram of this process.
P T
V S
(5)

308
Explain and determine the following:
2.2 energy absorbed by the steam per minute in the:
2.2.1 evaporator;
________________________________________________________
________________________________________________________
________________________________________________________
(8)
2.2.2 super-heater.
_____________________________________________________
______________________________________________________
______________________________________________________
______________________________________________________
(7)
Explain and determine the following:
2.3 Calculate the overall efficiency of the plant for a fuel consumption of
70kg/hr. The calorific value of the fuel is 38MJ/kg.
___________________________________________________________
___________________________________________________________
___________________________________________________________
___________________________________________________________
(6)
[26]

309
QUESTION 3
The mass of water accumulated in the separator of a combined separating and
throttling calorimeter during a dryness test is 2.24kg and the mass of the
condensate 24kg. The pressure in the main supply line is 1300kPa and after
throttling the pressure and temperature are 100kPa and 1050C.
3.1 Explain the process or processes involved in the problem;______________
_______________________________________________________________
_______________________________________________________________
_______________________________________________________________(6)
3.2 Make a neat diagram of the unit and indicate the given information clearly;
(4)
Explain and determine the following:
3.3 the degree of dryness in the main supply line.
____________________________________________________________
____________________________________________________________
____________________________________________________________
(10)
[20]

310
QUESTION 4
A Rankine cycle power plant has a feed pump, economiser, steam generator,
super-heater, turbine and condenser. Steam enters the turbine at 800kPa and
4000C. Steam leaves the turbine at 40kPa after undergoing reverseble
adiabatic expansion through the turbine. The steam is condensed to saturated
liquid and is pumped back through the system.
4.1 Draw a detailed flow diagram of this plant fully labelled; (4)
4.2 Draw a detailed T-S diagram of the plant. (6)
T
S

311
Explain and determine the following:
4.3 the work done by the turbine; _______________________________________________________________
_______________________________________________________________
______________________________________________________________
______________________________________________________________
(7)
Explain and determine the following:
4.4 the heat supplied per kg of steam;
_________________________________________________________________
_________________________________________________________________
_________________________________________________________________
_________________________________________________________________
(8)
Explain and determine the following:
4.5 the brake thermal efficiency for a steam consumption of 7.2kg/h
and with a condensate temperature of 340C.
_____________________________________________________________
_____________________________________________________________
_____________________________________________________________
_____________________________________________________________
_____________________________________________________________
(7)
[32]

312
Appendix 7 – Formative assessment (oral test)
NATIONAL DIPLOMA ENGINEERING: MECHANICAL
DIPLOMA CODE: 3208110
THERMODYNAMICS 2
SUBJECT CODE: 81908922
Student No:__________________
EXAMINER: C LOUW
Surname:____________________
TIME: 15 MIN.
SCHEDULED ORAL TEST QUESTIONNAIRE
MAY 2010
Non-flow processes
1. Explain what a non-flow process is. 2 –
2. Define the term ‘reverseble process.’ 2 –
3. What are the differences between the following process: adiabatic,
polytropic and isothermal? 3 –
4. What does the adiabatic index of compression or expansion
mean and how can this value be determined? 3 –
Marks
______
5
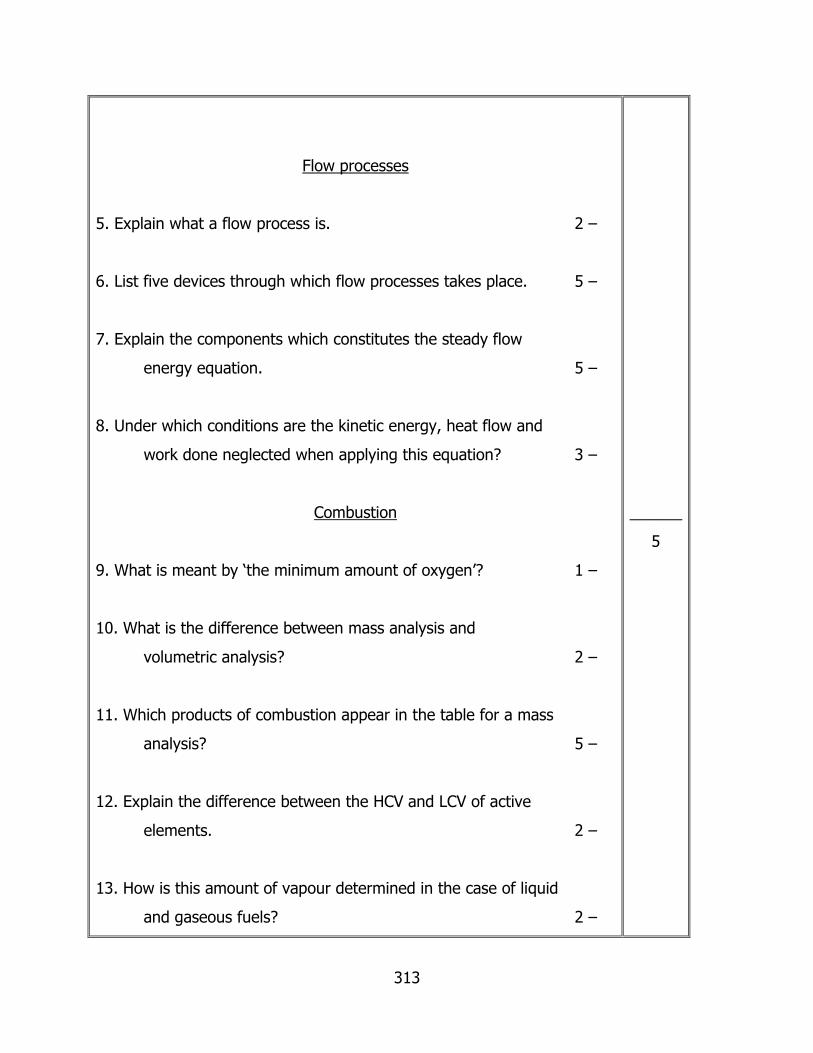
313
Flow processes
5. Explain what a flow process is. 2 –
6. List five devices through which flow processes takes place. 5 –
7. Explain the components which constitutes the steady flow
energy equation. 5 –
8. Under which conditions are the kinetic energy, heat flow and
work done neglected when applying this equation? 3 –
Combustion
9. What is meant by ‘the minimum amount of oxygen’? 1 –
10. What is the difference between mass analysis and
volumetric analysis? 2 –
11. Which products of combustion appear in the table for a mass
analysis? 5 –
12. Explain the difference between the HCV and LCV of active
elements. 2 –
13. How is this amount of vapour determined in the case of liquid
and gaseous fuels? 2 –
______
5

314
14. What is the difference in terms of POC when ma and when mT
is supplied? 4 -
15. What is meant by ‘the minimum amount of oxygen’? 1 –
16. What is the difference between mass analysis and
volumetric analysis? 1 –
17. Which products of combustion appear in the table for
a mass analysis? 5 –
18. Explain the difference between the HCV and LCV of active
elements. 2 –
19. How is this amount of vapour determined in the case of liquid
and gaseous fuels? 2 –
20. What is the difference in terms of POC when ma and when mT
is supplied? 4 –
Steam and throttling
21. Explain the different phases of steam and when these
conditions are reached. 2 –
22. What is the meaning of the following terms: saturation
temperature, degree of superheat? 2 -
______
5

315
23. Explain why calorimeters are used. Why is this measurement
important? 3 –
24. Explain when a throttling calorimeter is used and the process
followed to determine the condition of the steam. 2 –
25. Illustrate and explain an adiabatic compression of dry
saturated steam on a T-s diagram. 3 –
26. Illustrate and explain an isothermal expansion process of dry
saturated steam on a T-s diagram. 3 -
27. Explain why it is important to measure the quality of steam
produced by a boiler plant and what instrument is used for
this purpose. 2 –
28. Explain when a separating calorimeter is used and the process
followed to determine the condition of the steam. 2 –
Boiler plant
29. Explain the operation of a boiler plant. Support your answer
with a line diagram 5 –
30. Why is the treatment of feed water important? 4 –
31. What does the boiler efficiency measure? 1 –
32. What does the efficiency of a component e.g. evaporator
______
5

316
mean? 1 –
33. Explain how water is heated in an electrode boiler. 2 –
34. How does the water treatment of an electrode differ from a
fuel boiler? 2 –
35.How does the wrong calorific value of the fuel affect the
performance of the boiler plant? 4 –
36. List important safety devices on a boiler and explain their
function. 3 –
37. Explain the reason for blow-down. 1 –
Rankine cycle
38. Explain the operation of a Rankine cycle. Support you answer
with a diagram. 3 –
39. What is the difference between isentropic and actual
expansion through the turbine? Support your answer
with a sketch. 3 –
40. Explain what is the difference between the Rankine efficiency
and the Brake-thermal efficiency? 2 –
41. What do you understand under the term ‘specific
steam consumption’? 2 –
_____
5

317
Condensers
42. Explain the difference between a surface condenser
and a jet condenser. 1 –
43. What is the advantage in using a surface condenser in terms
of water treatment and turbine work done? 4 –
44. How does the air get into the system? 1 –
45. Why is it important to get rid of the air? 1 –
46. Explain the difference between a dry and a wet air pump. 4 –
PERCENTAGE: __
SIGN:___________
______
5
______
5
______
35

318
Appendix 8 – Summative assessment (final examination)
WALTER SISULU UNIVERSITY
FACULTY OF SCIENCE, ENGINEERING AND TECHNOLOGY
JUNE 2010
SUBJECT : THERMODYNAMICS II
MAIN EXAMINATION
SUBJECT CODE : MTHE 2/0
SAPSE CODE : 81908922
QUALIFICATION : NATIONAL DIPLOMA: MECHANICAL
ENGINEERING
DIPLOMA CODE : 3208110
EXAMINER : C. LOUW
MODERATOR : I. SUNJKA
INSTRUCTIONS : 1. ANSWER ALL QUESTIONS.
319
2. START EACH QUESTION ON A NEW
PAGE.
3. MARK QUESTIONS CLEARLY.
ANNEXTURES : 1. STEAM TABLES
2. ENTHALPY/ENTROPY CHART.
DURATION : 3 HOURS
MARKS : 117 [110 = 100%]
NUMBER OF PAGES : 3 (INCLUDING COVERPAGE BUT EXCLUDING
ANNEXTURE)
EXAMINATION RULES ARE NOW IN EFFECT.
DO NOT TURN THE PAGE BEFORE TOLD TO DO SO.
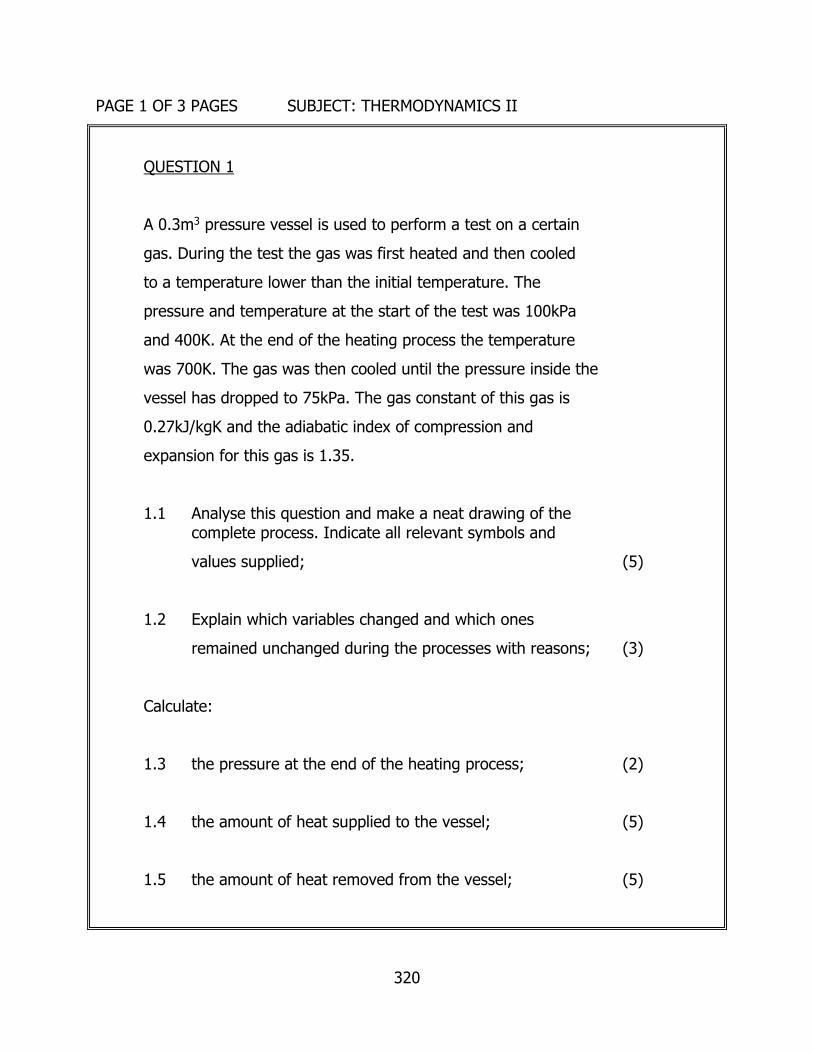
320
PAGE 1 OF 3 PAGES SUBJECT: THERMODYNAMICS II
QUESTION 1
A 0.3m3 pressure vessel is used to perform a test on a certain
gas. During the test the gas was first heated and then cooled
to a temperature lower than the initial temperature. The
pressure and temperature at the start of the test was 100kPa
and 400K. At the end of the heating process the temperature
was 700K. The gas was then cooled until the pressure inside the
vessel has dropped to 75kPa. The gas constant of this gas is
0.27kJ/kgK and the adiabatic index of compression and
expansion for this gas is 1.35.
1.1 Analyse this question and make a neat drawing of the complete process. Indicate all relevant symbols and
values supplied; (5)
1.2 Explain which variables changed and which ones
remained unchanged during the processes with reasons; (3)
Calculate:
1.3 the pressure at the end of the heating process; (2)
1.4 the amount of heat supplied to the vessel; (5)
1.5 the amount of heat removed from the vessel; (5)

321
1.6 the overall change in enthalpy of the gas. (2)
1.7 Which reading/s must be closely monitored during the
operation of a pressure vessel to ensure the safety of
equipment and people? Explain why? (2)
[24]
QUESTION 2
Steam at 3000kPa and with a dryness fraction of 0.7 is heated
at constant pressure until the temperature was 4000C. The
steam is now cooled down at constant volume until it is just dry.
2.1 Explain the process or processes involved, which variable/s
stays constant, which ones changes and how does the
condition of the steam changed during each process; (3)
PAGE 2 OF 3 PAGES SUBJECT: THERMODYNAMICS II
QUESTION 2
Determine:
2.2 the work done by the steam during the heating process; (8)
2.3 the heat supplied to the steam; (6)
2.4 the pressure at which the steam becomes just dry. (2)

322
2.5 Draw a detailed pressure-volume and temperature-entropy
diagram of the complete process reflecting all symbols.
Indicate the area which represents the work done during
the heating process as well as the area which represents
the heat flow during the cooling process. (5)
[24]
QUESTION 3
Water is converted into steam by a boiler plant for the purpose
of melting re-cycled plastic items. The plant consist of an
evaporator, super-heater and air pre-heater. The air pre-heater
increases the incoming air temperature from 250C to 1500C.
Water enters the plant at 140C and leaves the super-heater at 3000C.
The plant operating pressure is 3000kPa and the steam leaving
the evaporator has a dryness fraction of 0.85. The melting process
requires 2000kg/hr of steam and the plant is driven be crude oil at
a rate of 420kg/hr and with a calorific value of 30MJ/kg. The air/fuel
ratio can be taken as 12/1.
Calculate:
3.1 the thermal efficiency of the plant; (4)
3.2 the heat absorbed by the steam in the evaporator in kW; (4)
3.3 the heat absorbed by the steam in the super-heater
expressed per kilogram fuel; (2)

323
3.4 the heat absorbed by the air in the air pre-heater in kJ/hr; (3)
3.5 the percentage of total heat absorption which takes place in the super-heater. (4)
PAGE 3 OF 3 PAGES SUBJECT: THERMODYNAMICS II
QUESTION 3
3.6 Study the attached flow diagram, and fill in the relevant information (symbols and values) on the diagram. Indicate on the diagram corrections which need to be made to reflect the plant described in the question. (6)
[23]
QUESTION 4
A surface condenser is used to condense process steam for
re-circulation. Air was removed from the system by means of a
wet air pump. This system was then replaced by a dry air pump.
Steam enters the unit at 10kPa and with a dryness fraction of
0.9. Condensate leaves at 290C and the air suction spout
temperature is 24.10C. Cooling water temperature increases from
140C to 250C across the unit. Air leakage into the unit at a rate of
20kg/hr.
4.1 Complete the attached diagram/s, indicate clearly the wet
and dry air pump units and fill in all relevant detail as well
as the directions of flow for air, water and steam; (9)

324
4.2 Explain in terms running cost why it was an improvement
to install a dry air pump. (5)
Calculate:
4.3 the extra amount of condensate lost when using a wet air
pump in kg/hr; (10)
4.4 the condenser efficiency. (2)
[26]
QUESTION 5
A fuel sample consist of the following:
45% H2, 50% C, 1% S, 2% O2 and 2% N.
Calculate:
5.1 the amount of oxygen required for complete combustion
of 1kg of this fuel (show balanced reaction equations); (6)
5.2 the mass analysis of the products of combustion. (10)
5.3 What will be the effect in terms of available heat and the
type of combustion products, if insufficient air was
supplied to the combustion chamber? (4)
[20]

325
Appendix 9 – KPIs for measuring achievement in outcomes with formative
assessments 1, 2 and 3
NATIONAL DIPLOMA ENGINEERING: MECHANICAL
DIPLOMA CODE: 3208110
THERMODYNAMICS 2
SUBJECT CODE: 81908922
EXAMINER: C LOUW
Student No:__________________
Surname:____________________
KPI MEASUREMENT RESEARCH GROUP 2010
TEST NO.: _ QUESTION No.:__
KPIs PERFORMANCE RATING
Students
’ ability
to apply
MTHE 2
principle
s to
analyse
and
solve the
problem
accuratel
y.
Analysis
completely
correct
Minor
misinterpretations
(explanation,
discussion,
definition)
Student made a
single error
Some
misinterpretations
(explanation,
discussion,
definition)
Student made more
than one error
Point values are
indicated correctly
on graph but graph
is incorrect or
partially correct
Major
misinterpretations
(explanation,
discussion,
definition)
Student have one
correct statement
Graph/sketch does
not correspond with
interpretation
Analysis completely
incorrect
5 4 3 2 1
Full mark Full mark allocation Full mark allocation Full mark allocation Full mark allocation

326
allocation
Point
s
1
2
3
4
5
6
7
8
9
10
11
etc
Ou
t
of
1
2
3
4
5
6
7
8
9
10
11
etc
Points
2
3
4
5
6
7
8
9
10
Etc
Out of
3
4
5
6
7
8
9
10
11
etc
Points
1
2
3
4
5
6
Out of
2
4, 5, 6
etc
5, 6, 7
etc
6, 7, 8
etc
7, 8, 9
etc
8, 9, 10
etc
Points
1
Out of
3, 4, 5
etc
Points
0
Out of
1, 2, 3
etc
Halve
mark
allocation
Halve mark
allocation
Halve mark
allocation
Halve mark
allocation
Halve mark
allocation
Point
s
1
2
3
4
5
6
7
8
9
10
11
etc
Ou
t
of
1
2
3
4
5
6
7
8
9
10
11
etc
Points
1.5
2.5
3.5
4.5
5.5
6.5
7.5
8.5
9.5
10.5
etc
Out of
2
3
4
5
6
7
8
9
10
11
etc
Points
1
1.5
2
2.5
3
3.5
4
4.5
5
5.5
6
6.5
etc
Out of
2
3, 4, 5
etc
4, 5, 6
etc
4, 5, 6
etc
5, 6, 7
etc
5, 6, 7
etc
6, 7, 8
etc
6, 7, 8
etc
7, 8, 9
etc
7, 8, 9
etc
8, 9, 10
etc
8, 9 10
etc
Points
0.5
Out of
1, 2, 3
etc
Points
0
Out of
1, 2, 3
etc

327
Analytical
solution
completely
correct
Minor
calculation/substitu
tion errors
Student made one
error
Some
calculation/substitu
tion errors
Student made more
than one error
Major
calculation/substitu
tion errors
Student have one
correct
calculation/substitu
tion
Completely
incorrect
calculation/substitu
tion
5 4 3 2 1
Full mark
allocation
Full mark allocation Full mark allocation Full mark allocation Full mark allocation
Point
s
1
2
3
4
5
6
7
8
9
10
11
etc
Ou
t
of
1
2
3
4
5
6
7
8
9
10
11
etc
Points
2
3
4
5
6
7
8
9
10
etc
Out of
3
4
5
6
7
8
9
10
11
etc
Points
1
2
3
4
5
6
etc
Out of
2
4, 5, 6
etc
5, 6, 7
etc
6, 7, 8
etc
7, 8, 9
etc
8, 9, 10
etc
Points
1
Out of
3, 4, 5
etc
Points
0
Out of
1, 2, 3
etc
Halve
mark
allocation
Halve mark
allocation
Halve mark
allocation
Halve mark
allocation
Halve mark
allocation
Point
s
1
2
3
4
5
6
7
8
9
Ou
t
of
1
2
3
4
5
6
7
8
9
Points
1.5
2.5
3.5
4.5
5.5
6.5
7.5
8.5
9.5
10.5
etc
Out of
2
3
4
5
6
7
8
9
10
11
etc
Points
1
1.5
2
2.5
3
3.5
Out of
2
3, 4, 5
etc
4, 5, 6
etc
4, 5, 6
etc
5, 6, 7
etc
5, 6, 7
etc
Points
0.5
Out of
1, 2, 3
etc
Points
0
Out of
1, 2, 3
etc

328
10
11
etc
10
11
etc
4
4.5
5
5.5
6
6.5
etc
6, 7, 8
etc
6, 7, 8
etc
7, 8, 9
etc
7, 8, 9
etc
8, 9, 10
etc
8, 9 10
etc
SCORE:
Students
’ ability
to
analyse
a
problem
and
produce
a
solution,
taking
into
account
crucial
factors
in a
systemat
ic
approac
h
towards
the
solution.
Considere
d all
crucial
factors
Considered most
crucial factors
Considered some
crucial factors
Considered one
crucial factor
Considered no
crucial factors
5 4 3 2 1
Full mark
allocation
Full mark allocation Full mark allocation Full mark allocation Full mark allocation
Point
s
1
2
3
4
5
6
7
8
9
10
11
etc
Ou
t
of
1
2
3
4
5
6
7
8
9
10
11
etc
Points
2
3
4
5
6
7
8
9
10
etc
Out of
3
4
5
6
7
8
9
10
11
etc
Points
1
2
3
4
5
6
etc
Out of
2
4, 5, 6
etc
5, 6, 7
etc
6, 7, 8
etc
7, 8, 9
etc
8, 9, 10
etc
Points
1
Out of
3, 4, 5
etc
Points
0
Out of
1, 2, 3
etc
Halve
mark
allocation
Halve mark
allocation
Halve mark
allocation
Halve mark
allocation
Halve mark
allocation
Point
s
Ou
t
of
Points
1.5
2.5
Out of
2
3
Points
1
1.5
Out of
2
3, 4, 5
Points
0.5
Out of
1, 2, 3
etc
Points
0
Out of
1, 2, 3
etc

329
1
2
3
4
5
6
7
8
9
10
11
etc
1
2
3
4
5
6
7
8
9
10
11
etc
3.5
4.5
5.5
6.5
7.5
8.5
9.5
10.5
etc
4
5
6
7
8
9
10
11
etc
2
2.5
3
3.5
4
4.5
5
5.5
6
6.5
etc
etc
4, 5, 6
etc
4, 5, 6
etc
5, 6, 7
etc
5, 6, 7
etc
6, 7, 8
etc
6, 7, 8
etc
7, 8, 9
etc
7, 8, 9
etc
8, 9, 10
etc
8, 9 10
etc
SCORE:

330
Appendix 10 – KPIs for measuring achievement of outcomes of oral test 1
NATIONAL DIPLOMA ENGINEERING: MECHANICAL
DIPLOMA CODE: 3208110
THERMODYNAMICS 2
SUBJECT CODE: 81908922
EXAMINER: C LOUW
Student No:__________________
MARKS:
Surname:____________________
KPI MEASUREMENT RESEARCH GROUP MAY2010
ORAL TEST NO.: __ QUESTION No.:__
KPIs PERFORMANCE RATING
Students’ ability
to
explain/discuss;
the operation of
a system,
components or
parts of a
system in MTHE
2, components
function in the
overall plant
which it forms
part of,
treatment and
Explanation of
operations
clear and
correct
Minor errors in
understanding
unit operations
but overall
correct
A number of errors
in understanding
unit operations
Major errors in
understanding of
unit operations
Explanation of
unit operation
completely
incorrect
5 4 3 2 1
Points
1
2
3
4
5
6
7
Out of
1
2
3
4
5
6
7
Points
1.5
2.5
3.5
4.5
5.5
6.5
7.5
Out of
2
3
4
5
6
7
8
Points
1
1.5
2
2.5
Out of
2
3, 4, 5
etc
4, 5, 6
etc
4, 5, 6
etc
Points
0.5
Out of
1, 2, 3
etc
Points
0
Out of
1, 2, 3
etc

331
maintenance
procedures in
specific
components.
8
9
10
11
etc
8
9
10
11
etc
8.5
9.5
10.5
etc
9
10
11
etc
3
3.5
4
4.5
5
5.5
6
6.5
etc
5, 6, 7
etc
5, 6, 7
etc
6, 7, 8
etc
6, 7, 8
etc
7, 8, 9
etc
7, 8, 9
etc
8, 9, 10
etc
8, 9, 10
etc
Excellent
understanding
of units
function in
overall plant
operations
Minor
misconceptions
in units
function in
overall plant
operations
Some
misunderstandings
with regard to units
function in overall
plant operations
Major
misunderstandings
with regard to units
function in overall
plant operations
No clear
understanding
of units
function in
overall plant
operations
5 4 3 2 1
Points
1
2
3
4
5
6
7
8
9
10
11
etc
Out of
1
2
3
4
5
6
7
8
9
10
11
etc
Points
1.5
2.5
3.5
4.5
5.5
6.5
7.5
8.5
9.5
10.5
etc
Out of
2
3
4
5
6
7
8
9
10
11
etc
Points
1
1.5
2
2.5
3
3.5
4
4.5
5
5.5
Out of
2
3, 4, 5
etc
4, 5, 6
etc
4, 5, 6
etc
5, 6, 7
etc
5, 6, 7
etc
6, 7, 8
etc
6, 7, 8
etc
7, 8, 9
etc
7, 8, 9
etc
Points
0.5
Out of
1, 2, 3
etc
Points
0
Out of
1, 2, 3
etc
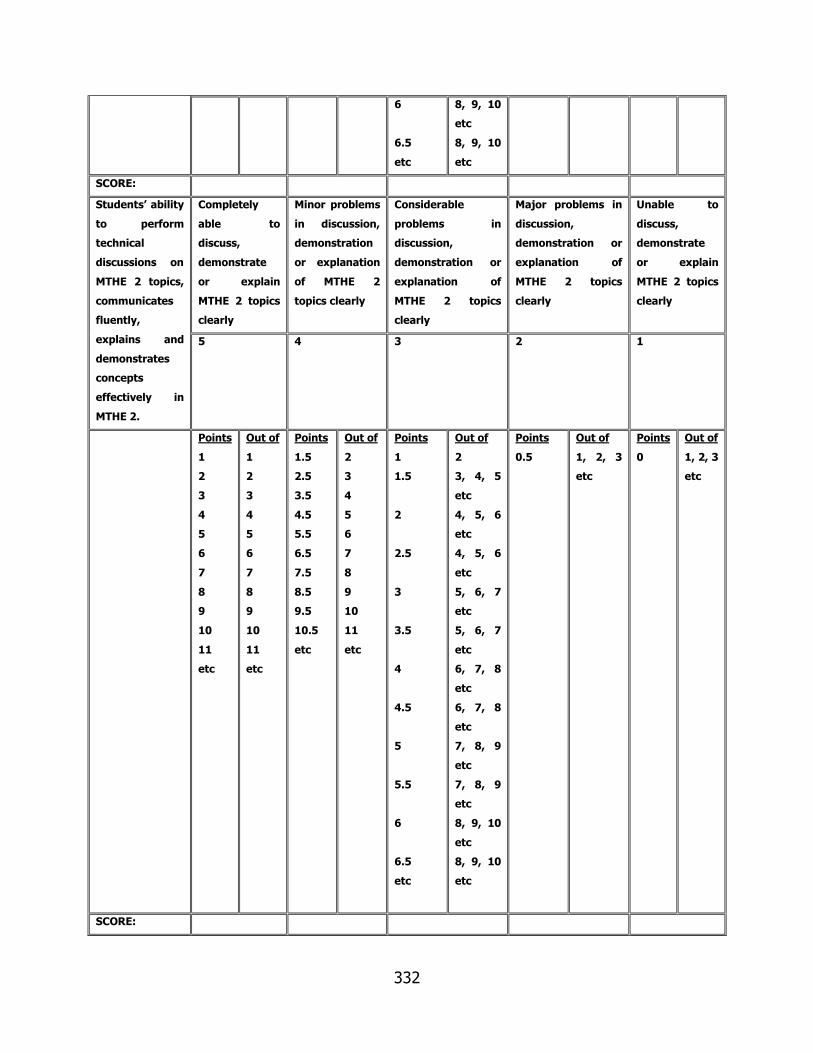
332
6
6.5
etc
8, 9, 10
etc
8, 9, 10
etc
SCORE:
Students’ ability
to perform
technical
discussions on
MTHE 2 topics,
communicates
fluently,
explains and
demonstrates
concepts
effectively in
MTHE 2.
Completely
able to
discuss,
demonstrate
or explain
MTHE 2 topics
clearly
Minor problems
in discussion,
demonstration
or explanation
of MTHE 2
topics clearly
Considerable
problems in
discussion,
demonstration or
explanation of
MTHE 2 topics
clearly
Major problems in
discussion,
demonstration or
explanation of
MTHE 2 topics
clearly
Unable to
discuss,
demonstrate
or explain
MTHE 2 topics
clearly
5 4 3 2 1
Points
1
2
3
4
5
6
7
8
9
10
11
etc
Out of
1
2
3
4
5
6
7
8
9
10
11
etc
Points
1.5
2.5
3.5
4.5
5.5
6.5
7.5
8.5
9.5
10.5
etc
Out of
2
3
4
5
6
7
8
9
10
11
etc
Points
1
1.5
2
2.5
3
3.5
4
4.5
5
5.5
6
6.5
etc
Out of
2
3, 4, 5
etc
4, 5, 6
etc
4, 5, 6
etc
5, 6, 7
etc
5, 6, 7
etc
6, 7, 8
etc
6, 7, 8
etc
7, 8, 9
etc
7, 8, 9
etc
8, 9, 10
etc
8, 9, 10
etc
Points
0.5
Out of
1, 2, 3
etc
Points
0
Out of
1, 2, 3
etc
SCORE:

333
Appendix 11 – KPIs for measuring achievement of outcomes of final
examination
NATIONAL DIPLOMA ENGINEERING: MECHANICAL
DIPLOMA CODE: 3208110
THERMODYNAMICS 2
SUBJECT CODE: 81908922
EXAMINER: C LOUW
Student No:__________________
Surname:____________________
KPI MEASUREMENT RESEARCH GROUP 2010
FINAL EXAMINATION: _ QUESTION No.:__
KPIs PERFORMANCE RATING
Students
’ ability
to apply
MTHE 2
principle
s to
analyse
and
solve the
problem
accuratel
y.
Analysis
completely
correct
Minor
misinterpretations
(explanation,
discussion,
definition)
Student made a
single error
Some
misinterpretations
(explanation,
discussion,
definition)
Student made more
than one error
Points values are
indicated correctly
on graph but graph
is incorrect or
partially correct
Major
misinterpretations
(explanation,
discussion,
definition)
Student have one
correct statement
Graph/sketch does
not correspond with
interpretation
Analysis completely
incorrect

334
5 4 3 2 1
Point
s
1
2
3
4
5
6
7
8
9
10
11
etc
Ou
t
of
1
2
3
4
5
6
7
8
9
10
11
etc
Points
1.5
2.5
3.5
4.5
5.5
6.5
7.5
8.5
9.5
10.5
etc
Out of
2
3
4
5
6
7
8
9
10
11
etc
Points
1
1.5
2
2.5
3
3.5
4
4.5
5
5.5
6
6.5
etc
Out of
2
3, 4, 5
etc
4, 5, 6
etc
4, 5, 6
etc
5, 6, 7
etc
5, 6, 7
etc
6, 7, 8
etc
6, 7, 8
etc
7, 8, 9
etc
7, 8, 9
etc
8, 9, 10
etc
8, 9, 10
etc
Points
0.5
Out of
1, 2, 3
etc
Points
0
Out of
1, 2, 3
etc
Analytical
solution
completely
correct
Minor
calculation/substitu
tion errors
Student made one
error
Some
calculation/substitu
tion errors
Student made more
than one error
Major
calculation/substitu
tion errors
Student have one
correct
calculation/substitu
tion
Completely
incorrect
calculation/substitu
tion
5 4 3 2 1
Point
s
1
2
3
4
5
6
Ou
t
of
1
2
3
4
5
6
Points
1.5
2.5
3.5
4.5
5.5
6.5
7.5
8.5
Out of
2
3
4
5
6
7
8
9
Points
1
1.5
2
2.5
3
Out of
2
3, 4, 5
etc
4, 5, 6
etc
4, 5, 6
etc
5, 6, 7
Points
0.5
Out of
1, 2, 3
etc
Points
0
Out of
1, 2, 3
etc
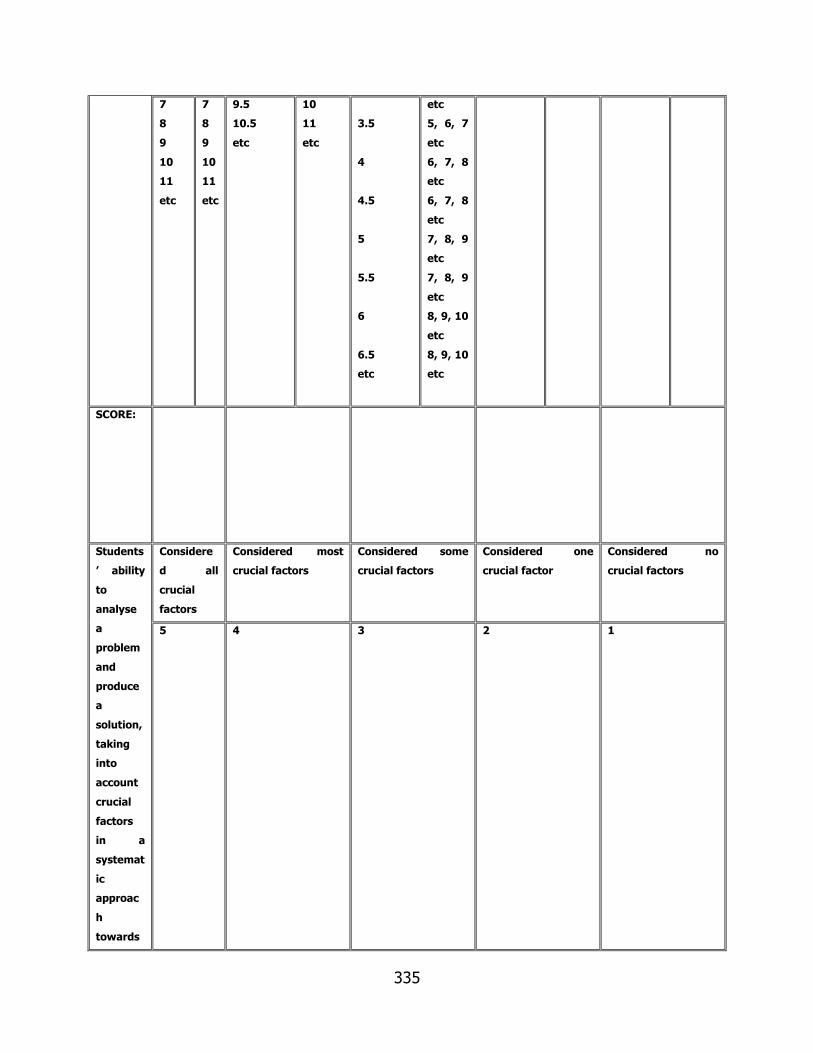
335
7
8
9
10
11
etc
7
8
9
10
11
etc
9.5
10.5
etc
10
11
etc
3.5
4
4.5
5
5.5
6
6.5
etc
etc
5, 6, 7
etc
6, 7, 8
etc
6, 7, 8
etc
7, 8, 9
etc
7, 8, 9
etc
8, 9, 10
etc
8, 9, 10
etc
SCORE:
Students
’ ability
to
analyse
a
problem
and
produce
a
solution,
taking
into
account
crucial
factors
in a
systemat
ic
approac
h
towards
Considere
d all
crucial
factors
Considered most
crucial factors
Considered some
crucial factors
Considered one
crucial factor
Considered no
crucial factors
5 4 3 2 1

336
the
solution.
SCORE:
337
Appendix 12 – Louw’s Guided Enquiry Based Learning Guide for assisting
students’ learning
A guide to learn and understand
THERMODYNAMICS 2
C LOUW
?
338
Contents
Background……………………………………………………………………….……………..5
Chapter 1………………………………………………………………………...................6
Introduction to Thermodynamics……………………………………………….…......6
Non-flow processes…………………………………………………………………………..8
Example 1………………………………………………………………………………………..8
More relevant questions on this section…………………………………………….10
Exercise 1………………………………………………………………………………………16
Tutorial………………………………………………………………………………………….17
Chapter 2 - Flow processes - Example 1…………………..……………………….23
More relevant questions on this section…………………………………………….25
Exercise 2………………………………………………………………………………………30
Tutorial……………………………………………………………………………………….…31
Chapter 3 – Steam - Example 1…………………………...……………………….…35
More relevant questions on this section……………………………………………40
Exercise 3……………………………………………………………………………………...43
Tutorial……………………………………………………………………………………….…46
Chapter 4 - Throttling of steam - Example 1…………………………………….52
More relevant questions on this section…………………………………………..54
Exercise 4……………………………………………………………………………………..59
Tutorial…………………………………………………………………………………………60
Chapter 5 - Boiler and steam plant - Example 1…………………………….…64
Boiler plant flow diagram……………………………………………………………...64a
More relevant questions on this section…………………………………………..67
Exercise 5.1.…………………………………………………………………………………72
Tutorial………………………………………………………………………………………..74
339
Rankine cycle - Example 2……………………………………………………………..80
More relevant questions on this section……………………………………….…83
Exercise 5.2………………………………………………………………………………...86
Tutorial……………………………………………………………………………………….88
Chapter 6 – Condensers - Example 1…………………………………………..…92
Surface condenser diagrams……………………………………………………....92a
More relevant questions on this section………………………………………...95
Exercise 6………………………………………………………………………….........100
Tutorial……………………………………………………………………………..........101
Chapter 7 – Combustion - Example 1…………………………………………..107
More relevant questions on this section……………………………………….111
Exercise 7……………………………………………………………………………......117
Tutorial…………………………………………………………………………….........118
Revision Exercise……………………………………………………………………….123

340
Nomenclature
A area (m2)
A/F air fuel ratio
c velocity (m/s)
Cp specific heat capacity at constant pressure (kJ/kgK)
Cv specific heat capacity at constant volume (kJ/kgK)
CV calorific value (kJ/kg, MJ/kg)
EE equivalent evaporation from and at 1000C (kg steam/kg fuel)
h enthalpy (kJ)
h specific enthalpy (kJ/kg)
h1 specific enthalpy of steam leaving the boiler plant (kJ/kg)
h0 specific enthalpy of water entering the boiler plant (kJ/kg)
hsup superheated steam specific enthalpy (kJ/kg)
hg saturated steam specific enthalpy (kJ/kg)
hfg specific latent heat of vaporization (kJ/kg)
hf saturated liquid specific enthalpy (kJ/kg)
KE kinetic energy (kJ/kg)
M Molar mass (kg/kmol)
m mass (kg)
ma minimum mass of air (kg)
me excess air mass (kg)
mf mass of fuel (kg)
mS mass of steam or condensate (kg)
mT total mass of air (kg)
mW mass of water (kg)
nT number of tubes
P pressure (kPa, MPa, bar)
Pa partial pressure of the dry air (kPa)

341
Pc condenser pressure (kPa, mmHg)
Pv partial pressure of the vapour (kPa)
PE potential energy (kJ/kg)
POC products of combustion
Q heat flow (kJ)
Ro universal gas constant (kJ/kgK)
R gas constant (kJ/kgK)
rW work ratio
Ssc specific steam consumption (kg/kWhr)
T temperature (0C, K)
TF superheated temperature (0C, K)
Tk temperature of condensate (0C, K)
TS saturation temperature (0C, K)
tw temperature of cooling water (0C, K)
u internal energy (kJ)
u change in internal energy (kJ)
U overall heat transfer coefficient (kW/m2 0C)
V volume (m3)
Va volume of air (m3)
Vg specific volume of dry saturated vapour (m3/kg)
Vs specific volume (m3/kg)
WD work done (kJ)
WDT turbine specific work done (kJ/kg)
x dryness fraction
x0 dryness fraction of steam in separating calorimeter
x1 dryness fraction of steam in throttling calorimeter
efficiency (%)
R Rankine efficiency (%)
density (m3/kg)
342
Background
The purpose of this guide is to help engineering learners to solve problems using the
Enquiry Based Learning (EBL) approach. To be able to solve a problem, one needs to
understand the process or system’s operations in question completely. Questions must
be asked to guide the learner through an information gathering process relevant to the
process or system under discussion. Answers to these questions can be found only if
the learner is actively involved in the learning process i.e. if action is taken to find
answers to these questions and learn how the process or system functions. Reference
material listed at the end of the study guides, text books, websites, papers or journals
can be used to gather information. Each problem has a specific solution or in some
cases more than one. The questions asked must be structured such that with every
answer of a question asked, the solution is a step closer. This process might seem very
time consuming at first, but with more practice and more knowledge gained in a
particular field, the skill to ask goal-directed questions will be developed.
The type of examples used is aimed at first year second semester students (S2) and
based on the fact that these learners has completed their first semester in engineering
and has therefore been exposed to background, terms and expressions used. Only one
example per chapter is given with a guide as to how to go through the process of
asking questions in order for the learner to gain more information about the problem
and to understand it completely so that a solution can be developed. At the end of each
example more relevant questions pertaining to the section under study are given with
answers for further assistance. The content of this guide should be regarded as merely
a support document to learners to learn Thermodynamics 2.
Develop an enquiry mind – solve problems by asking questions – BE ACTIVE!
Ask questions pertaining to the problem. On each question asked you must ‘ACT’, by

343
this I mean you must read, investigate and search to find an answer to the question.
This will guide you through the process of gathering information and learning. This will
enable you to learn more about the problem understand the problem and eventually
solve it. Questions with no action from the learner results in no knowledge gained. The
information in this guide will only be of help if the learner is actively involved in the
learning process. Ask until you understand the problem completely only then can you
effectively solve it. Initially this may take some time, until you have developed the skill
to read a question, define the problem and ask specific questions to guide you
effectively to the solution (depending on the complexity of the problem this may only
take a few seconds):
Example of relevant questions: Examples of irrelevant questions:
What is the process under discussion? Who set the question?
How does this process work? Why is this question asked?
What is the working fluid in the process? What colour is the equipment?

344
CHAPTER 1
Introduction to Thermodynamics
Terms and Definitions
1. Units
Heat - Joules = J = Nm
Pressure = Pascals or kilo-pascals or bar
1bar = 100kPa
1kPa = 1000 Pa
Temperature = Kelvin or Degrees Celsius
Kelvin (K) = Degrees Celsius (oC) + 273
Degrees Celsius (oC) = Kelvin (K) + 273
S.T.P. = standard temperature and pressure = 101,3kPa and 273 K
Volume = m3 specific volume = m3/kg
2. Specific heat capacity (C) [kJ/kgK]
Def.: The specific heat capacity of an object is the amount of thermal energy required
to give a unit mass of the object a unit temperature rise.
Eg. C of water is 4,187kJ/kgK
2.1 Specific heat capacity at constant volume (Cv) [kJ/kgK]:
It is the amount of thermal energy required to give a unit mass of the gas by one
degree, with the volume remaining constant.

345
2.2 Specific heat capacity at constant pressure (Cp) [kJ/kgK]:
It is the amount of thermal energy required to give a unit mass of the gas by one
degree, with the pressure remaining constant.
3. Gas laws
3.1 Boyle’s law
Boyle found by means of an experiment that the volume of a mass of gas is inversely
proportional to the pressure on it, if the temperature remains constant.
PV = c or P1V1 = P2V2 = P3V3 ….
3.2 Charles’ law
Charles found by means of an experiment that the volume of a mass of gas, at constant pressure, changes by 1/273 of its volume at 00C for every degree change in temperature.
V/T = c or V1/T1 = V2/T2 = V3/T3 … 3.3 Combined or general law
A combination of the previous laws, results in: PV/T = c or P1V1/T1 = P2V2/T2 = P3V3/T3 …
3.4 Gas constant (R)
The universal gas constant Ro has a value 8,314 kJ/kgK

346
Each gas has its own gas constant R value determined as follows:
R = Ro/M R = gas constant in kJ/kgK M = molar mass of the gas in (kg/kmol)
3.5 Characteristic gas constant
According to Boyle and Charles PV/T = c and c = mR
This equation becomes then: PV/T = mR PV = mRT where m is the mass of gas in kilogram
3.6 First law of Thermodynamics
This law basically states that energy cannot be created or destroyed, but can only be changed from on form to another. For a non-flow process: heat gained or lost = work done + change in internal energy of the gas Q = WD +Δu U is the symbol for the internal energy of an ideal gas and is mainly determent by the temperature of the gas. Internal energy is also a point function and is independent of the rout followed to get from one point to another. For this reason is the change in internal energy always calculate with the next formula: Δu = mCv(T2 – T1)

347
Non-flow processes
Example 1
Oxygen is heated up in a sealed container. The original pressure was 10kPa and the final pressure is 100kPa. The container has an inside diameter of 0.3m and an internal height of 0.5m. The temperature at the beginning of the process was 1100C. Take the molecular mass of oxygen as 32. Determine: 1.1 the mass of oxygen in the container; 1.2 the final temperature of the oxygen. 1.1 Questions to ask in order for me to understand the problem and to come up
with a solution:
Q: what process is this? A: a heating process
Q: what type of heating process is it if it takes place inside a container? A: a constant volume heating process and because the process takes place inside a
sealed container, which means the gas is trapped inside the container it is therefore also a non-flow process.
Q: what exactly is a constant volume process? A: it is a process that takes place such that the volume remains unchanged during
the duration of the process, but the temperature and pressure changes, these changes in temperature causes the gas to expand or contract due to more or less rapid movement of the molecules, this in turn results in an increase or decrease in pressure.
Q: can this process be illustrated on a diagram? A: yes. A pressure volume diagram can be used to show the relationship between
the pressure, volume and temperature at the various points in the process.

348
P T2 P2 2 T1 P1 1 V1 = V2 V Q: what is the relationship between pressure, volume and temperature during this
process? A: P1V1/T1 = P2V2/T2 but V1 = V2
» P1/T1 = P2/T2
Q: what type of gas is oxygen? A: it is a perfect gas, so the characteristic equation applies:
PV = mRT Q: The mass of the oxygen must be calculated. Which formulas contain mass that
can be a posseble option? A: PV = mRT Δu = mCv(T2 – T1) Q: can the first equation be used? A: yes, because in P1V1 = mRT1 the unknowns are m and R, but R can be solved by
using the universal gas constant equation R = Ro/M R = Ro/M R = 8.314/32 = 0.2598kJ/kgK 10 * π/4 * 0.32 * 0.5 = m * 0.2598 * (110 + 273)

349
m = 3.55 *10-3 kg → answer Q: can the second equation be used? A: no, because Δu, Cv and T2 are unknown. 1.2 Q: Determine the final temperature T2 of the gas. Which formulas contain T2 that
can give a posseble solution? A: P2V2 = mRT2 it is a constant volume process therefore V1=V2 and hence
everything is known except T2 and it can be solved: 100 * π/4 * 0.32 * 0.5 = 3.55 *10-3 * 0.2598 * T2
T2 = 3832.08 K → answer
P1/T1 = P2/T2 this is the most straight forward solution to the question, because everything is known except T2:
10/383 = 100/T2
T2 = 3830 K → answer Δu = mCv(T2 – T1) this equation also contains T2, but Cv and Δu are unknown. Cv can be calculated but not Δu and therefore this will not be an option. More relevant questions and answers on this section Q: What are the different types of non-flow processes? A: Constant volume process (CVP), constant pressure process (CPP), isothermal process (IP), adiabatic process (AP), polytropic process (PP). Q: What is the relationship between pressure, volume and temperature for each process? A: CVP: P1/T1 = P2/T2 CPP: V1/T1 = V2/T2
IP: P1V1 = P2V2 AP: P1V1 = P2V2
PP: P1V1
n = P2V2n
Q: What is and n? A: is the adiabatic index of compression or expansion and can be determined
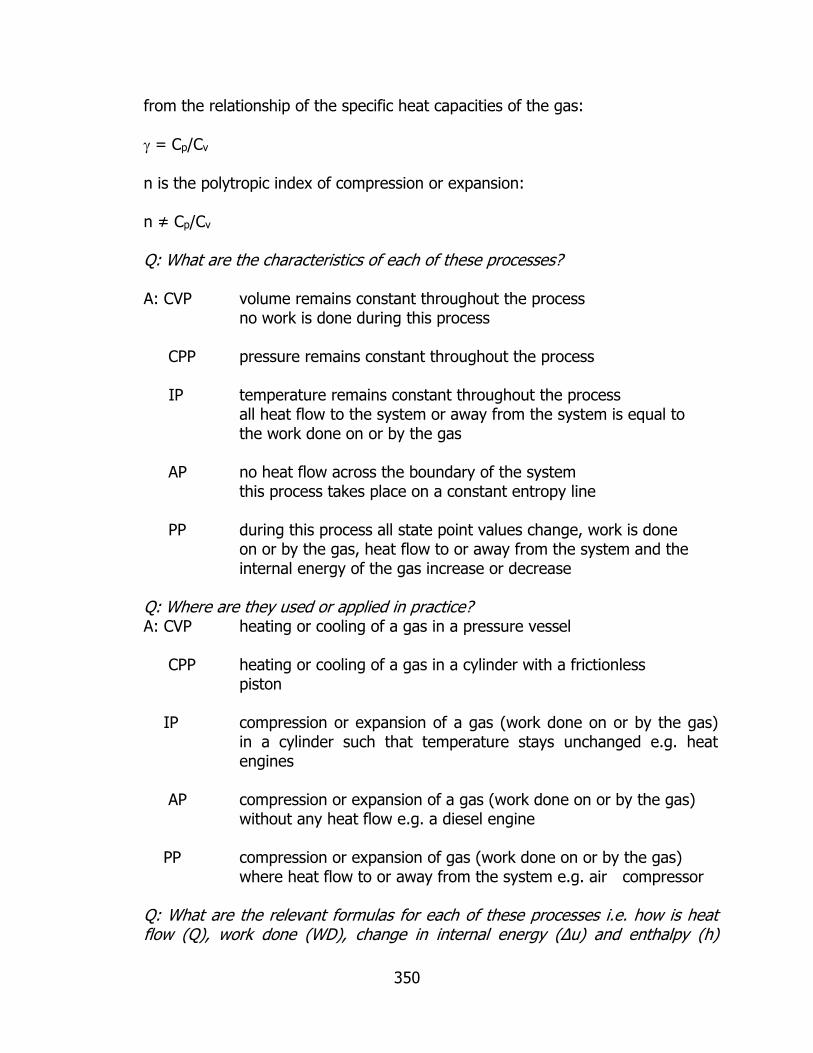
350
from the relationship of the specific heat capacities of the gas: = Cp/Cv
n is the polytropic index of compression or expansion: n ≠ Cp/Cv Q: What are the characteristics of each of these processes? A: CVP volume remains constant throughout the process no work is done during this process CPP pressure remains constant throughout the process IP temperature remains constant throughout the process all heat flow to the system or away from the system is equal to the work done on or by the gas AP no heat flow across the boundary of the system this process takes place on a constant entropy line PP during this process all state point values change, work is done on or by the gas, heat flow to or away from the system and the internal energy of the gas increase or decrease Q: Where are they used or applied in practice? A: CVP heating or cooling of a gas in a pressure vessel CPP heating or cooling of a gas in a cylinder with a frictionless piston
IP compression or expansion of a gas (work done on or by the gas) in a cylinder such that temperature stays unchanged e.g. heat engines
AP compression or expansion of a gas (work done on or by the gas) without any heat flow e.g. a diesel engine PP compression or expansion of gas (work done on or by the gas) where heat flow to or away from the system e.g. air compressor Q: What are the relevant formulas for each of these processes i.e. how is heat flow (Q), work done (WD), change in internal energy (Δu) and enthalpy (h)
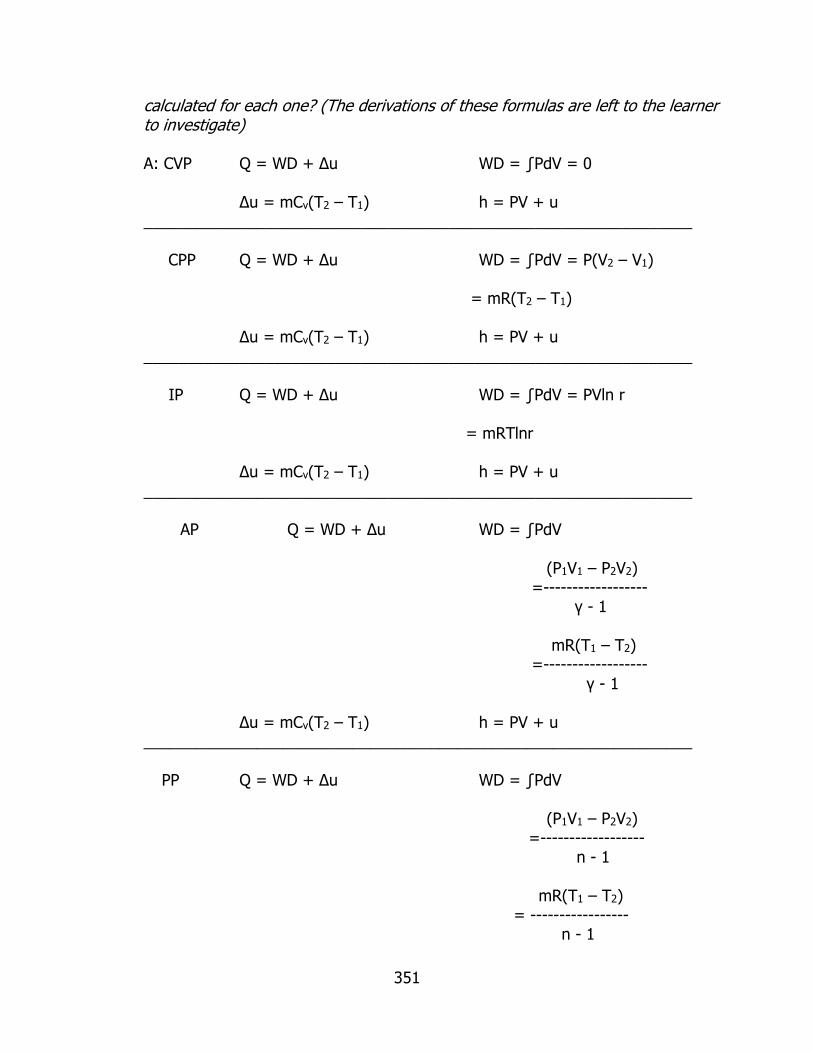
351
calculated for each one? (The derivations of these formulas are left to the learner to investigate)
A: CVP Q = WD + Δu WD = ∫PdV = 0 Δu = mCv(T2 – T1) h = PV + u _______________________________________________________________ CPP Q = WD + Δu WD = ∫PdV = P(V2 – V1) = mR(T2 – T1) Δu = mCv(T2 – T1) h = PV + u _______________________________________________________________ IP Q = WD + Δu WD = ∫PdV = PVln r = mRTlnr
Δu = mCv(T2 – T1) h = PV + u _______________________________________________________________
AP Q = WD + Δu WD = ∫PdV
(P1V1 – P2V2) =------------------ γ - 1 mR(T1 – T2) =------------------ γ - 1
Δu = mCv(T2 – T1) h = PV + u _______________________________________________________________
PP Q = WD + Δu WD = ∫PdV (P1V1 – P2V2)
=------------------ n - 1 mR(T1 – T2) = ----------------- n - 1

352
Δu = mCv(T2 – T1) h = PV + u
Q: How is each one illustrated on a pressure volume diagram? A: CVP P 1 B 1 – 2 cooling A – B heating
2 A
V CPP P 1 2 1 – 2 heating B A A – B cooling
WD V
IP P B 1 1 – 2 expansion A – B compression 2 WD A
V AP P 2 A 1 – 2 compression A – B expansion B
WD 1 V
PP P 2 A 1 – 2 compression A – B expansion B
WD 1 V

353
Exercise 1
1.1 A mass of 1.2kg of air at 150kPa and 120C is contained in a gas-tight, frictionless piston-cylinder device. The air is now compressed to a final pressure of 600kPa. During the process heat is transferred from the air such that the temperature inside the cylinder remains constant. Calculate the work done during this process. (-136kJ)
1.2 A student living in a 4m x 6m x 6m dormitory room turns on her 150W fan
before she leaves the room on a summer day, hoping that the room will be cooler when she comes back in the evening. Assuming all the doors and windows are tightly closed and disregarding any heat transfer through the walls and windows, determine the temperature in the room when she comes back 10hrs later. Assuming the room to be at 100kPa and 150C when she leaves. (58.20C)
1.3 A piston device contains 0.1m3 of air at 400kPa and 500C. Heat is transferred
to the air in the amount of 40kJ as the air expands isothermally. Determine the amount of boundary work done during this process. (40kJ)
1.4 A piston-cylinder device whose piston is resting on a set of stops, initially
contains 3kg of air at 200kPa and 270C. The mass of the piston is such that a pressure of 400kPa is required to move it. Heat is now transferred to the air until its volume doubles. Determine:
1.4.1 the work done by the air; (516kJ) 1.4.2 the total heat transferred to the air during this process. (2674kJ)
1.5 A piston-cylinder device, with a set of stops on the top, initially contains 3kg
of air at 200kPa and 270C. Heat is now transferred to the air, and the piston rises until it hits the stops, at which point the volume is twice the initial volume. More heat is transferred until the pressure inside the cylinder also doubles. Determine:
1.5.1 the work done; 1.5.2 the amount of heat transfer for this process.
1.6 A certain gas has a density of 1.925kg/m3 at 101.3kPa and 160C.
1.6.1 Calculate the gas constant ’R’. (0.182kJ/kgK)
If 0.86kg of this gas is heated from 160C to 2550C, at constant pressure,

354
205.54kJ is needed. Calculate:
1.6.2 the specific heat capacity at constant pressure; (1kJ/kgK) 1.6.3 the specific heat capacity at constant volume; (0.818kJ/kgK) 1.6.4 the total work done. (37.4kJ)
1.7 A quantity of gas is compressed from 103.5kPa and a volume of 0.12m3 to a
temperature of 1170C. The original temperature of the gas was 190C and 3.85kJ heat was rejected to the atmosphere during the process. Take R = 0.228kJ/kgK, Cp = 0.92kJ/kgK and calculate:
1.7.1 the value of the index of compression; (n = 1.252) 1.7.2 the final pressure. (435.87kPa)
Tutorial
1.1 A mass of 1.2kg of air at 150kPa and 120C is contained in a gas-tight,
frictionless piston-cylinder device. The air is now compressed to a final pressure of 600kPa. During the process heat is transferred from the air such that the temperature inside the cylinder remains constant. Calculate the work done during this process. (-136kJ)
Questions relevant to understand and solve this problem: Is this a flow or non-flow process? What initial and final information is given in the question? Is there any relationship between these values during the execution of the process? If the air is compressed in this cylinder device, what happens to the pressure, volume and temperature and which processes are included or eliminated by this? What is the relationship between pressure, volume and temperature for this process? By answering the above questions, you will be able to identify the process. You can now apply all the formulas pertaining to this process to find the answer. You can also draw the process on a pressure-volume diagram and indicate the area which represents the work done. The following steps are suggested for drawing the diagram:
1. Identify the process in the question – in this case it is a constant temperature (isothermal) process.

355
2. Draw the p-v axis and the constant temperature curve. 3. Remember that the process must stay on the isothermal curve and
movement between the initial and final point is restricted to this line. 4. Now the type of isothermal process must be identified – in this case it is a
compression process. 5. During compression the volume decreases and the pressure increases. 6. To be able to reflect this on the isothermal curve, make a point ‘1’ at the
lower right hand side and then move up with the curve to a position higher which will be point ‘2’.
7. Draw vertical dotted lines from these points to the volume axis. 8. The enclosed area under the graph represents the work done the gas during
the process.
NOTE: This systematic approach can be applied to all processes and even to problems consisting of more than one process. In a case where there are more than one process involved, remember that the end point of the first process is the starting point of the second process and so on.
Find answers to these questions and use them as a guide to solve this problem. You can add more questions if necessary. Apply the same approach to the remaining questions in the exercise.

356
Chapter 2
Flow processes
Example 1
Air flows through a compressor with an initial velocity of 10m/s and an exit velocity of 100 m/s. At inlet the air has a pressure of 100kPa and a specific volume 0.83m3/kg. The exit pressure is 200kPa and the specific volume 0.66m3/kg. During is passage through the compressor, the internal energy is increased by 100kJ/kg. Calculate the heat flow to or away from the compressor if it requires 25kW to compress the air at a flow rate of 2kg/s. Q: what is a flow process? A: it is a process whereby the fluid undergoing the process crosses the boundaries
of the system. Units through which flow processes occurs are: pipelines, heat exchangers, nozzles, condensers, compressors and turbines. During a flow process the fluid will enter the system at a specific monitoring point with specific values with regard to its velocity, pressure, specific volume, temperature and flow rate. The fluid will leave the system at another monitoring point with different values except for the mass flow rate. The mass flow rate will be constant measured at any state and therefore these processes are referred to as steady state flow processes.
Q: what is an air compressor and how does it function? A: air compressors are devices that compress the air entering the unit to a higher
pressure according to its application. Different compressors are widely used and can be classified as radial flow, axial flow, screw and positive displacement units.
Q: what are the relationships between the inlet and outlet conditions and how can
this be expressed in terms of an equation? A: draw up an energy balance across the compressor. This is an equation which
states that all energy entering the compressor must be equal to all energy leaving the unit. This is based on the first law of thermodynamics which states that energy can not be created or destroyed but can only change from one form to another. This equation is as follows:
KE1 + PE1 + P1Vs1 + u1 + Q = KE2 + PE2 + P2Vs2 + u2 + WD KE1 = kinetic energy at inlet, considering a mass flow rate of 1 kg/s = c1
2/2000(kJ/kg)
PE1 = potential energy at inlet, measured from a specific datum line for a mass flow rate of 1 kg/s
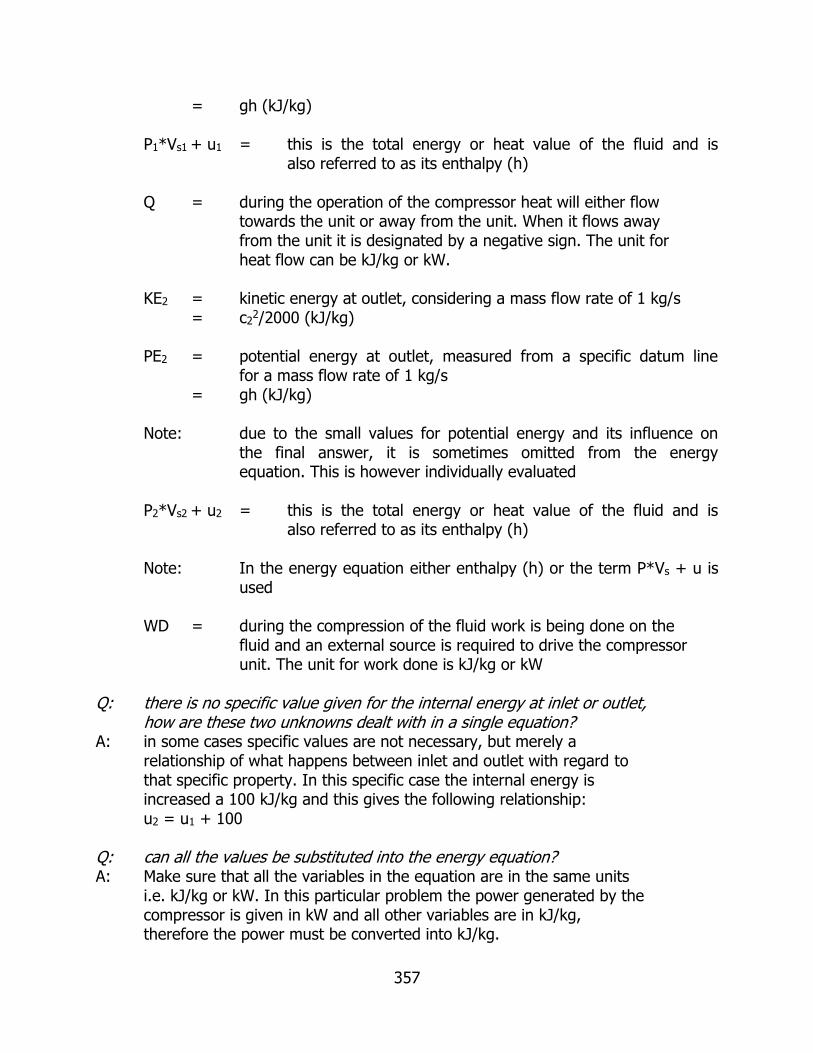
357
= gh (kJ/kg)
P1*Vs1 + u1 = this is the total energy or heat value of the fluid and is also referred to as its enthalpy (h)
Q = during the operation of the compressor heat will either flow towards the unit or away from the unit. When it flows away from the unit it is designated by a negative sign. The unit for heat flow can be kJ/kg or kW. KE2 = kinetic energy at outlet, considering a mass flow rate of 1 kg/s = c2
2/2000 (kJ/kg)
PE2 = potential energy at outlet, measured from a specific datum line for a mass flow rate of 1 kg/s
= gh (kJ/kg) Note: due to the small values for potential energy and its influence on
the final answer, it is sometimes omitted from the energy equation. This is however individually evaluated
P2*Vs2 + u2 = this is the total energy or heat value of the fluid and is
also referred to as its enthalpy (h) Note: In the energy equation either enthalpy (h) or the term P*Vs + u is
used WD = during the compression of the fluid work is being done on the fluid and an external source is required to drive the compressor unit. The unit for work done is kJ/kg or kW Q: there is no specific value given for the internal energy at inlet or outlet, how are these two unknowns dealt with in a single equation? A: in some cases specific values are not necessary, but merely a relationship of what happens between inlet and outlet with regard to that specific property. In this specific case the internal energy is increased a 100 kJ/kg and this gives the following relationship: u2 = u1 + 100 Q: can all the values be substituted into the energy equation? A: Make sure that all the variables in the equation are in the same units i.e. kJ/kg or kW. In this particular problem the power generated by the compressor is given in kW and all other variables are in kJ/kg, therefore the power must be converted into kJ/kg.

358
Q: how is kW converted into kJ/kg? A: in this problem mass flow is also given in kg/s: kW = kJ/s
kJ/kg = kJ/s * s/kg i.e. power in kW is simply divided by the given mass flow in kg/s to convert it to kJ/kg
Q: calculate the heat flow to or away from the compressor A: substitute and solve for Q:
102/2000 + 100*0.83 + u1 + Q = 1002/2000 + 200*0.66 + u1 + 100 + 25/2
Q = 166.45 kJ/kg → answer
Q: is the heat flowing to or away from the compressor? A: the compressor is driven by an external source such as an electric motor and therefore it is doing work on the air. Compressing the air will generate friction within the air molecules and also friction between the cylinder and piston surfaces during the up and downward motion. This friction will cause the temperature of the air and that of the compressor to rise above that of the surrounding air. Therefore heat will flow from the compressor (high temperature) to surrounding air (low temperature). → answer More relevant questions on this section Q: What is the relationship between the mass flow rate at inlet and the mass flow rate at outlet? A: m1 = m2 and the unit is kg/s Q: How can this mass flow rate be calculated? A: m1 = c1A1/Vs1 = m2 = c2A2/Vs2
Q: Which factors affect the mass flow rate? A: The diameter (cross sectional area) of the inlet and outlet pipes The velocity at inlet and outlet The specific volume of the fluid at inlet and outlet Q: What are the characteristics of the other units operating on a flow

359
process? A: Pipelines: 1. No work done through a rigid pipe 2. If pipes are perfectly thermally insulated no heat flows Heat exchangers: The purpose of these units is to transfer heat No work done Nozzles: 1. The purpose of this device is to accelerate the fluid as the pressure drop No work done 2. If the nozzles is perfectly thermally insulated no heat flows 3. If inlet velocity is small it can be neglected (c < 70m/s) Diffusers: 1. The purpose of this device is to retard the fluid velocity No work done 2. If the diffuser is perfectly thermally insulated no heat flows 3. If exit velocity is small it can be neglected Condensers: The purpose of these units is to remove heat from hot fluid No work done Compressors: 1. The purpose of this device is to increase the pressure of the fluid by means of mechanical work 2. If the compression is adiabatic no heat flows Turbines: The purpose of this device is to utilize the kinetic energy of the fluid flowing through it to develop mechanical power on the output shaft Q: How does this affect the steady flow energy equation? A: Pipelines: 1. KE1 + PE1 + P1Vs1 + u1 + Q = KE2 + PE2 + P2Vs2 + u2 2. KE1 + PE1 + P1Vs1 + u1 = KE2 + PE2 + P2Vs2 + u2 Heat exchangers: KE1 + PE1 + P1Vs1 + u1 + Q = KE2 + PE2 + P2Vs2 + u2 Nozzles: 1. KE1 + PE1 + P1Vs1 + u1 + Q = KE2 + PE2 + P2Vs2 + u2 2. KE1 + PE1 + P1Vs1 + u1 = KE2 + PE2 + P2Vs2 + u2

360
3. PE1 + P1Vs1 + u1 + Q = KE2 + PE2 + P2Vs2 + u2 + WD Diffusers: 1. KE1 + PE1 + P1Vs1 + u1 + Q = KE2 + PE2 + P2Vs2 + u2 2. KE1 + PE1 + P1Vs1 + u1 = KE2 + PE2 + P2Vs2 + u2
3. KE1 + PE1 + P1Vs1 + u1 + Q = PE2 + P2Vs2 + u2 + WD Condensers: KE1 + PE1 + P1Vs1 + u1 + Q = KE2 + PE2 + P2Vs2 + u2 Compressors: 1. KE1 + PE1 + P1Vs1 + u1 + Q = KE2 + PE2 + P2Vs2 + u2
+ WD 2. KE1 + PE1 + P1Vs1 + u1 = KE2 + PE2 + P2Vs2 + u2 + WD Turbines: KE1 + PE1 + P1Vs1 + u1 + Q = KE2 + PE2 + P2Vs2 + u2 + WD Q: When the fluid undergoing the flow process is not a perfect gas e.g. steam, how are the properties at inlet and outlet calculated? A: For steam the inlet pressure, volume and temperature will be used to determine the condition from steam table or the Mollier chart. The approach for outlet will be the same using outlet values.

361
Exercise 2
2.1 Air enters an adiabatic nozzle steadily at 300kPa, 2000C, and 30m/s and
leaves at 100kPa and 180m/s. The inlet area of the nozzle is 80cm2. Determine:
2.1.1 the mass flow rate through the nozzle; (0.5304kg/s) 2.1.2 the exit temperature of the air; (184.60C) 2.1.3 the exit area of the nozzle. (38.7cm2)
2.2 Air enters a nozzle steadily at 300kPa, 770C, and 50m/s and leaves at
100kPa and 320m/s. The heat loss from the nozzle is estimated to be 3.2kJ/kg of air flowing. The inlet area of the nozzle is 100cm2. Determine:
2.2.1 the exit temperature of air; (24.20C) 2.2.2 the exit area of the nozzle.(39.7cm2)
2.3 Air at 600kPa and 4000C enters an adiabatic nozzle that has an inlet-to-exit
area ratio of 2:1 with a velocity of 120m/s and leaves with a velocity of 380m/s. Determine:
2.3.1 the exit temperature; (436.5K) 2.3.2 the exit pressure of the air. (330.8kPa)
2.4 Air at 80kPa and 1270C enters an adiabatic diffuser steadily at a rate of
6000kg/hr and leaves at 100kPa. The velocity of the air stream is decreased from 230m/s to 30m/s as it passes through the diffuser. Find:
2.4.1 the exit temperature of the air; 2.4.2 the exit area of the diffuser.
2.5 Air at 80kPa and -80C enters an adiabatic diffuser steadily with velocity of
200m/s and leaves with a low velocity at a pressure of 95kPa. The exit area of the diffuser is 5 times the inlet area. Determine:
2.5.1 the exit temperature; 2.5.2 the exit velocity of the air.
2.6 Air at 80kPa, 270C, and 220m/s enters a diffuser at a rate of 2.5kg/s and
leaves at 420C. The exit area of the diffuser is 400cm2. The air is estimated to lose heat at a rate of 18kJ/s during this process. Determine:
2.6.1 the exit velocity; (62m/s)

362
2.6.2 the exit pressure of the air. (91.1kPa) 2.7 Air flows steadily through an adiabatic turbine, entering at 1MPa, 5000C, and
120m/s and leaving at 150kPa, 1500C, and 250m/s. The inlet area of the turbine is 80cm2. Determine:
2.7.1 the mass flow rate of the air; 2.7.2 the power output of the turbine.
2.8 Air enters the compressor of a gas turbine plant at ambient conditions of
100kPa and 250C with a low velocity and exits at 1MPa and 3470C with a velocity of 90m/s. The compressor is cooled at a rate of 1500kJ/min and the power input to the compressor is 250kW.Determine the mass flow rate of air through the compressor. (0.68kg/s)
2.9 Air is compressed from 100kPa and 220C to a pressure of 1MPa while being
cooled at a rate of 16kJ/kg by circulating water through the compressor casing. The volume flow rate of the air at inlet conditions is 150m3/min and the power input to the compressor is 500kW. Determine:
2.9.1 the mass flow rate of the air; (2.95kg/s) 2.9.2 the temperature at the compressor exit. (1740C)
2.10 In a centrifugal compressor air flows steadily at a rate of 2.1kg/s and 81m/s
with a pressure of 90kPa and specific volume of 0.85m3/kg. The exit conditions are: speed 200m/s, pressure 900kPa and specific volume of 0.13m3/kg. The internal energy of the air at exit is 90kJ/kg greater than that of the air at inlet. Heat is lost during compression at a rate of 95kJ/s. Calculate:
2.10.1 the power required to drive the compressor; (404kW) 2.10.2 the diameters of the inlet and outlet pipes. (167.5mm, 41.7mm)
Tutorial
2.1 Air enters an adiabatic nozzle steadily at 300kPa, 2000C, and 30m/s and leaves
at 100kPa and 180m/s. The inlet area of the nozzle is 80cm2. Determine:
2.1.1 the mass flow rate through the nozzle; (0.5304kg/s) 2.1.2 the exit temperature of the air; (184.60C) 2.1.3 the exit area of the nozzle. (38.7cm2)
Questions relevant to understand and solve this problem:
Is this a flow or non-flow process?

363
What is the fluid flowing through the nozzle? What are the inlet and outlet conditions and what information is supplied at these points? What is the process through this nozzle? By answering the above questions, you will be able to identify the process. You can now apply all the formulas pertaining to this process to find the answer. Find answers to these questions and use them as a guide to solve this problem. You can add more questions if necessary. Apply the same approach to the remaining questions in the exercise.
364
Chapter 3
Steam
Example 1
Water at 100kPa and 150C is heated up in a pressure cooker on a stove. The location at which the exercise takes place is at sea level i.e. 100kPa. 1.1 What will be the condition of the steam when the pressure gauge reads 300kPa and 2000C? 1.2 How much heat has been given to the steam? 1.3 Plot the process on a temperature-entropy diagram. 1.1 Questions to be asked in order for one to understand the problem and be able to answer the questions: Q: what is a pressure cooker? A: it is a pressure vessel that allows pressure to build up within it, in order for the temperature to increase so that the food inside the cooker can be cooked faster.
The volume of the cooker remains unchanged during the process. This means that the specific volume of the steam before and after the process is unchanged: Vs1 = Vs2 (m3/kg)
Q: will the pressure cooker not explode at some stage? A: no, because it has safety valves fitted to the lid. These safety valves will open
and ensure that steam is blown once maximum operating pressure is reached. This value is normally indicated on the lid and the bottom of the pot. E.g. a 7l Tedelex pressure cooker has a maximum operating pressure of 80kPa.
Q: why will the food cook faster when the pressure inside the vessel increases? A: there is a direct relationship between pressure and temperature. The more the pressure increases the higher the temperature at which the water will boil. At 100kPa water boils at 990C, if the pressure of the container is increased to 200kPa, the water will only start boiling at 1200C. The temperature at a specific pressure where the water will start boiling is referred to as the saturation temperature and these are the values listed in the steam tables. This higher temperature allows the food to be cooked faster than in the normal pot. Q: what does the term ‘condition of the steam’ mean? A: when dealing with water and steam the condition of the steam refers to the quality of the steam. This means the amount of water and the amount of steam at the particular condition that co-exists in the same container and it is normally expressed in terms of a fraction called the ‘dryness fraction x’. The

365
water and the steam represent different phases. Water represents the liquid phase and steam, the vapour phase. At any pressure water temperature will increase until it reaches the saturation temperature corresponding to that pressure. At this point the water is said to be saturated liquid. If water at atmospheric conditions is heated up it will reach saturation point at sea level (100kPa) at approximately 99.60C. At this point bubbles are forming within the water and any heat addition will start changing some of the water into steam. Now there are two phases in one container and this is referred to as wet steam. The relationship between the amount of liquid and the amount of vapour will determine the condition (dryness fraction) of the steam. Q: how does one find this condition? A: there are steam tables and enthalpy/entropy charts (Mollier charts) available which reflects the relationship between steam at a certain pressure and temperature. From these tables or chart the reading will be taken at 300kPa and 2000C. On the steam tables the following values are listed: Temperature; pressure; specific volume; saturated liquid enthalpy; latent heat of evaporation; saturated vapour enthalpy. For any specific pressure there is a temperature at which water will boil. If the pressure is increased the boiling temperature also increases. At a specific pressure water will reach saturation point when its temperature is raised to the temperature corresponding to the saturation temperature listed in the tables. At this point the enthalpy of the water will be that of saturated liquid (hf). Any more heat supplied to the water will start transforming the water into steam. It will be noted that during this transformation process the temperature of the water remains constant. This is because the heat supplied to the water is used to transform the water from water into steam which is a phase change. This heat is then also called latent heat of vaporization (hfg). Once this phase change process is completed, the steam is said to be saturated vapour (hg) and any further addition of heat will increase the temperature of the steam. The steam will now enter the superheated region and will be referred to as superheated steam and the enthalpy denoted as hsup. Once the temperature of the steam is higher than the saturation temperature listed in the steam tables, then the superheated tables or the Mollier chart must be used to determine the enthalpy, specific volume etc. To answer the question, the saturation temperature corresponding with 300kPa is 133.50C and therefore if the steam temperature is 2000C, it is definitely superheated. → answer 1.2 To be able to answer the second question the following questions need to asked:

366
Q: what was the initial heat value of the water/steam? A: when the process started, the water was at 150C and 100kPa. The total heat value is the enthalpy of the water and it is calculated from: hf = 4.187 * 15 = 62.81kJ/kg or read from the table at hf The final enthalpy of the superheated steam can be read of the superheated steam tables or Mollier chart or calculated if the specific heat capacity for the steam was available: hsup = hg + Cp ( TF – TS); TF = final temperature; TS = saturation temperature; Cp = specific heat capacity at constant pressure. However Cp is not given, therefore the value for hsup is read from the table or chart: hsup = 2866kJ/kg The heat supplied to the steam is therefore the difference between the original and the final heat value of the steam: Heat supplied = final heat - initial heat = hsup - hf
= 2866 – 62.81 = 2803.19kJ/kg → answer 1.3 to be able to answer this question the following questions need to be asked: Q: what is a temperature-entropy diagram? A: it is a diagram with the vertical axis the temperature scale and the horizontal axis the entropy scale. On this diagram there is also a saturation curve (OAB) which indicates the liquid, wet and superheated regions. The line OA represents the saturated liquid line, the point ‘B’ represents the critical point and the line AB represents the saturated vapour line. Different pressure lines are also indicated and run from bottom left to the top right. The curved line indicates the constant volume lines.

367
T (temp) A Volume liquid Pressure wet steam superheated steam hfg hf hg B O s (entropy)
The area under a curve on this diagram will represent the heat flow (Q) during the process. If it is a constant pressure process the process will remain on one pressure line from the start to the end of the process. In the case of the question the process starts at a pressure of 100kPa and end at 200kPa. To be able to plot the process on this diagram some information regarding the initial and end conditions are required. Again a number of questions must be asked: Q: What was the condition of the steam when the process started? A: the steam was pure water at atmospheric pressure; Q: What route did it followed to get to the end point? A: a pressure cooker was used and therefore the specific volume before and after the process remained unchanged. Q: What was the condition of the steam at the end point? A: the temperature of the steam at the end of the process was higher than
the saturation temperature corresponding with the pressure and that means that the steam was superheated.
Now the process can be plotted:

368
T 2 T2 = 2000C Tsat = 120.20C 200kPa V 100kPa Tsat = 990C T1 = 150C 1 s More relevant questions on this section Q: What other non-flow processes can steam be subjected to?
A: Constant volume process (CVP), constant pressure process (CPP), isothermal process (IP), adiabatic process (AP), polytropic process (PP).
Q: What are the relevant relationships between pressure, volume and

369
temperature for these processes?
A: CVP: P1/T1 = P2/T2 CPP: V1/T1 = V2/T2
IP: P1V1 = P2V2 AP: P1V1 = P2V2
PP: P1V1
n = P2V2n
Q: How is the steam’s condition determined at various points of the process?
A: By using any two of the following properties pertaining to the specific point: enthalpy, pressure, specific volume, temperature, dryness fraction and entropy. Note that if the steam is at the saturation temperature, its dryness fraction can be between 0 and 1 and therefore it must be determined exactly.
This information can then be used with the Mollier chart or the steam tables. Q: How is heat flow, work done, change in internal energy and enthalpy during these processes determined? A: CVP Q = WD + Δu WD = 0 Δu = (h2 – h1) – (P2V2 – P1V1) h = PV + u _______________________________________________________________ CPP Q = WD + Δu WD = P(V2 – V1) Δu = (h2 – h1) – (P2V2 – P1V1) h = PV + u _______________________________________________________________ IP Q = WD + Δu Q = T(s2 – s1) Δu = (h2 – h1) – (P2V2 – P1V1) h = PV + u _______________________________________________________________ AP Q = WD + Δu Q = 0 s1 = s2
Δu = (h2 – h1) – (P2V2 – P1V1) h = PV + u
_______________________________________________________________ PP Q = WD + Δu WD (P1V1 – P2V2) = ----------------- n - 1 Δu = (h2 – h1) – (P2V2 – P1V1) h = PV + u
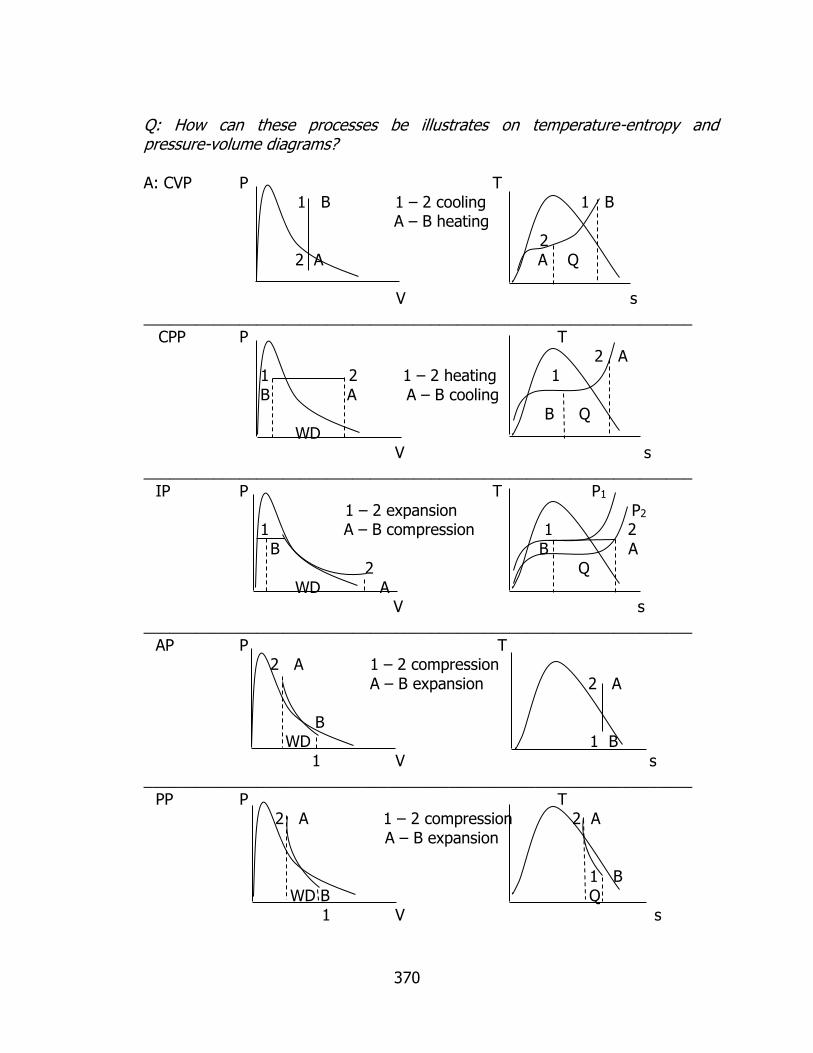
370
Q: How can these processes be illustrates on temperature-entropy and pressure-volume diagrams? A: CVP P T 1 B 1 – 2 cooling 1 B A – B heating
2 2 A A Q
V s _______________________________________________________________ CPP P T 2 A 1 2 1 – 2 heating 1 B A A – B cooling
B Q WD V s
_______________________________________________________________ IP P T P1
1 – 2 expansion P2 1 A – B compression 1 2 B B A 2 Q WD A
V s _______________________________________________________________
AP P T 2 A 1 – 2 compression A – B expansion 2 A B
WD 1 B 1 V s
_______________________________________________________________ PP P T
2 A 1 – 2 compression 2 A A – B expansion 1 B WD B Q
1 V s

371
Note: steam is not a perfect gas and therefore phase changes occur. It is important to identify the initial and final condition of the steam when using the above formulas to ensure that the correct phase is represented when substituting values. Q: What is entropy and what is it used for? A: for the purpose of this course we will only give an introduction to entropy (s). Entropy is a measure of the amount of disorder or the amount of energy which is not available to do work or the amount of energy which can not be converted into work. Entropy is also a point function and is not influenced by the process followed to get to the point. This is also the property which remains constant during an adiabatic process, i.e. an adiabatic process takes place on a constant entropy line. From a engineering point of view the change
in entropy (s) is most of the time of more value than the actual entropy value at a specific point. s = Q/T
s = Q/T

372
Exercise 3
3.1 Determine the specific enthalpy of steam at 600kPa and 0.96 degrees of
dryness. (2671.6kJ/kg) 3.2 At a pressure of 1.5MPa steam has a specific volume of 0.1982m3/kg.
Determine the specific enthalpy and temperature of the steam. (3228kJ/kg, 3900C)
3.3 A closed container with a volume of 0.035m3 contains dry saturated steam at a
pressure of 750kPa. Determine:
3.3.1 the mass of the steam; (0.137kg) 3.3.2 the enthalpy of the steam. (378.8kJ)
3.4 Superheated vapour at 1MPa and 3000C is allowed to cool at constant volume
until the temperature drops to 1500C. At the final state, determine:
3.4.1 the pressure; (475.8kPa) 3.4.2 the quality; (0.656) 3.4.3 the enthalpy. (2019kJ/kg)
3.5 Steam at 7bar, dryness fraction of 0.9, expands reversebly at constant
pressure until the temperature is 2000C. Calculate:
3.5.1 the work input per kilogram of steam; (38.2kJ/kg) 3.5.2 the heat supplied per kilogram of steam. (288.7kJ/kg)
3.6 A quantity of steam at a pressure of 3MPa has a dryness fraction of 0.72. The
steam occupies a volume of 0.4m3. Heat is transferred into the steam while the pressure remains constant until the steam is dry saturated. The steam is then cooled at constant volume until the pressure becomes1.8MPa. Determine:
3.6.1 the heat transferred during the constant pressure process;
(4189.95kJ) 3.6.2 the percentage of heat transfer which appears as work transfer;
(11.4%) 3.6.3 the heat transferred during the constant volume process. (-
5708.44kJ)
3.7 Steam at a pressure of 2MPa and with a temperature of 2500C is expanded to a pressure of 0.4MPa, the law of expansion being PV1.2 = C. After expansion the steam is cooled at constant volume to a pressure of 0.2MPa.

373
Determine:
3.7.1 the condition of the steam after expansion according to the law PV1.2 = C; (0.921)
3.7.2 the heat transfer per kilogram of steam during the expansion; (-91kJ/kg)
3.7.3 the condition of the steam after the constant volume cooling; (0.481)
3.7.4 the heat transferred per kilogram of steam during the constant volume cooling. (-921kJ/kg)
3.8 Determine the enthalpy, volume and density of 4.5kg of steam at a pressure
of 2MPa and with a temperature of 3000C. (13612kJ, 0.5625m3, 7.97kg/m3) 3.9 Determine the specific enthalpy and specific volume of steam at a pressure
of 18bar and with a temperature of 3200C. (3075.16kJ/kg, 0.149m3/kg) 3.10 1kg supply water at 00C is changed at 1.4MPa to wet steam with a dryness
fraction of 0.82. The wet steam is heated still further, at constant pressure, to a final volume of 0.1568m3. Calculate:
3.10.1 the work done to form super heated steam from wet steam;
(58kJ/kg) 3.10.2 the heat supplied to form super heated steam from wet steam.
(455.7kJ/kg) 3.11 5220kJ of heat is required to form 2kg wet steam at 1.3MPa from supply
water at 290C. The wet steam is heated still further, at constant pressure, until the final temperature is 2500C. Calculate:
3.11.1 the work done to form super heated steam from wet steam;
(38.74kJ/kg) 3.11.2 the heat supplied to form super heated steam from wet steam.
(204kJ/kg) 3.12 Steam at 500kPa and 2500C expands isentropically to a pressure of 70kPa.
Using the Mollier chart, determine the dryness fraction of the steam. (0.96)
3.13 Steam at 1400kPa and 2160C expands isentropically to a pressure of 100kPa. Calculate the dryness fraction of the steam after expansion. (0.86)
3.14 A quantity of steam enters a condenser operating at a pressure of 5kPa,
and is condensed to water. Calculate the heat removed per kilogram of steam. (2557kJ/kg)

374
Tutorial
3.3 Superheated vapour at 1MPa and 3000C is allowed to cool at constant
volume until the temperature drops to 1500C. At the final state, determine:
3.3.1 the pressure; (475.8kPa) 3.3.2 the quality; (0.656) 3.3.3 the enthalpy. (2019kJ/kg)
Questions relevant to understand and solve this problem:
Is this a flow or non-flow process? What type of non-flow process is this? What information is supplied for initial and final state points? Can this information be used to determine the condition of the steam at any of the state points? By answering the above questions, you will be able to identify the process. You can now apply all the formulas pertaining to this process to find the answers.
This process can also be plotted on a pressure-volume and temperature- entropy diagram. Find answers to these questions and use them as a guide to solve this problem. You can add more questions if necessary. Apply the same approach to the remaining questions in the exercise.
375
Chapter 4
Throttling of steam
Example 1
Steam is supplied by a boiler plant to drive a turbine which in turn drives a generator that generates power for consumption. The absolute pressure in the main supply line was 1.5MPa. The pressure after throttling was 120kPa and the temperature 1100C. The mass of the water accumulated was 0.48kg and that of the condensate 4.58kg. For the quality of steam used, the specific heat capacity at constant pressure can be taken as 2.1kJ/kgK. A combined separating and throttling calorimeter was used during the test. Calculate the quality of steam in the main supply line. Questions to be asked in order for one to understand the problem and be able to answer the question: Q: what is meant by absolute pressure? A: on the pipe line will be a pressure gauge reading the pressure inside the pipe.
This reading on the pressure gauge added to the atmospheric pressure will give the absolute pressure in kPa. Atmospheric pressure can be given in kPa or mmHg. To convert mmHg to kPa simply divide the mmHg by 7.5. The pressure values used to take readings from tables and charts are the absolute values.
Q: how does a combined separating and throttling calorimeter works? A: to be able to understand the meanings of the readings taken during the test and
how to use it, it is important to understand the operation of a combined separating and throttling calorimeter. A combined separating and throttling calorimeter is a device that first separates the excess water from the steam by a sharp change in direction of flow. The heavier water droplets can not accomplish this and separates from the steam and is collected in the bottom of the device. The second process then allows the steam to flow through a throttling device which works very much the same as a needle valve. A certain amount of steam is allowed to slip through the opening created by the needle valve into a space at a lower pressure. This allows some of the water in the steam to vaporise further, changing the steam either into wet or superheated steam.
Q: how are the readings taken, used in calculating the quality of the steam? A: throttling is a flow process. Steam enters the device at a certain point with
specific properties and leave at another with different properties. The definition of throttling can be worded as follows:
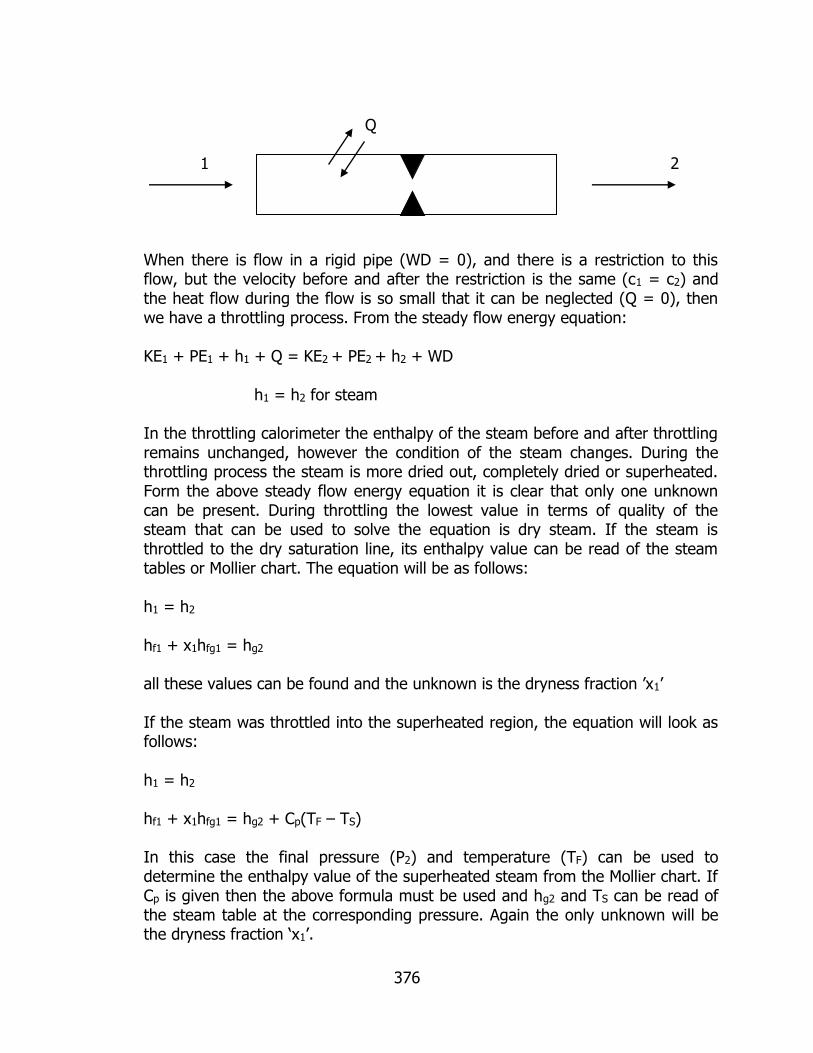
376
Q 1 2
When there is flow in a rigid pipe (WD = 0), and there is a restriction to this flow, but the velocity before and after the restriction is the same (c1 = c2) and the heat flow during the flow is so small that it can be neglected (Q = 0), then we have a throttling process. From the steady flow energy equation: KE1 + PE1 + h1 + Q = KE2 + PE2 + h2 + WD
h1 = h2 for steam In the throttling calorimeter the enthalpy of the steam before and after throttling
remains unchanged, however the condition of the steam changes. During the throttling process the steam is more dried out, completely dried or superheated. Form the above steady flow energy equation it is clear that only one unknown can be present. During throttling the lowest value in terms of quality of the steam that can be used to solve the equation is dry steam. If the steam is throttled to the dry saturation line, its enthalpy value can be read of the steam tables or Mollier chart. The equation will be as follows:
h1 = h2 hf1 + x1hfg1 = hg2 all these values can be found and the unknown is the dryness fraction ’x1’ If the steam was throttled into the superheated region, the equation will look as
follows: h1 = h2
hf1 + x1hfg1 = hg2 + Cp(TF – TS) In this case the final pressure (P2) and temperature (TF) can be used to
determine the enthalpy value of the superheated steam from the Mollier chart. If Cp is given then the above formula must be used and hg2 and TS can be read of the steam table at the corresponding pressure. Again the only unknown will be the dryness fraction ‘x1’.

377
For the separating calorimeter the following relationship is used to determine the
dryness fraction of the wet steam passing through it: x0 = ms/(ms + mw) ms = mass of steam or condensate; mw = mass of water The product of x0 in the separating calorimeter and x1 in the throttling
calorimeter will give the dryness fraction in the supply line: x = x1 * x0 Now the question can be answered: x0 = ms/(ms + mw) = 4.58/(4.58 + 0.48) = 0.905 h1 = h2
hf1 + x1hfg1 = hg2 + Cp(TF – TS) 845 + x1*1945 = 2683 + 2.1*(110 – 104.8) x1 = 0.951 x = x1 * x0
x = 0.951*0.905 x = 0.86 → answer More relevant questions on this section
Q: How does a separating calorimeter works? A: A steam sample collected from the main supply enters the calorimeter. At the end of the collection tube a perforated dish ensures a change in flow direction. Here the heavier water droplets are separated from the lighter vapour droplets. This separated water is collected in a container. The dried out steam flows

378
further in the tube. It enters a condenser where it is completely condensed and collected in another container. (Read this while studying the sketch) Q: How is the steam quality determined when using a separating calorimeter? A: x0 = ms/(ms + mw) Q: How does a throttling calorimeter works? A: A steam sample collected from the main supply enters the calorimeter. At the throttling valve, small amounts of wet steam on the high pressure side, is allowed through to the low pressure side. This allows the steam to vaporize further. Depending on the pressure and temperature after throttling, the steam can be just dry or superheated. Q: How is the steam quality determined when using a throttling calorimeter? A: The definition of throttling states that enthalpy does not change during throttling. Therefore:
h1 = h2
hf1 + x1hfg1 = hg2 + Cp(TF – TS)
In these equations everything is known except the dryness fraction x1 which can be determined. Note that if the specific heat capacity of the superheated steam is not given, the value of the superheated enthalpy must be read off the Mollier chart or steam tables. In this case the equation on the right can not be used. Q: What is the least dryness fraction which can be theoretically determined under a given pressure? A: The steam must be dry saturated at least after throttling. This will give one equation with one unknown x1. If the steam is wet after throttling there will be two unknowns which make it imposseble to solve:
h1 = h2
hf1 + x1hfg1 = hf2 + x2hfg2 Both x1 and x2 are unknown and can not be solved. If the steam is dry saturated after throttling:
h1 = h2

379
hf1 + x1hfg1 = hg One unknown and x1 can be solved. Q: How is the pressure values given in a throttling calorimeter used during calculation? A: This depends upon the information given in the particular question. If the pressure values are absolute, then it can be read off the steam table directly. If the pressure values are gauge pressure, with atmospheric pressure available, then the absolute pressure value must be calculated: Pabs = PG + Patm = PG + mmHg/7.5 if atmospheric values are given in mmHg To find the absolute pressure value after throttling, when atmospheric pressure (barometer reading in mmHg) is given and the manometer reading in mmHg (gauge pressure after throttling) is available: Pabs = (Bh + Mh)/7.5

380
Exercise 4
4.1 The manometer reading of a throttling calorimeter is 70.5mmHg. The
barometer reading is 754.5mmHg and the gauge pressure in the main supply line is 940kPa. Determine the pressure of the calorimeter and the absolute pressure in the main supply line. (110kPa, 1040kPa)
4.2 A combined separating and throttling calorimeter is used to determine the
dryness fraction of steam in a main. The pressure of the steam in the main and the separator is 6.9bar. After throttling to 1.5bar the temperature is 1270C. During a ten-minute test 0.09kg of water is collected at the separator and 1.53kg of condensate is collected after throttling. Calculate the dryness fraction of the steam in the main. (0.927)
4.3 A combined separating and throttling calorimeter is used in test to determine
the dryness fraction of some steam. The following results were obtained during the test:
Pressure of the test steam = 1.2MPa Pressure of the steam after throttling = 150kPa Temperature of the steam after throttling = 1150C Mass of water collected in separator = 0.12kg Mass of condensate collected after throttling in the same time = 3.4kg From these results, determine the dryness fraction of the steam. (0.933) 4.4 A throttling calorimeter is used to determine the quality of steam which is at
a pressure of 2.2MPa. The pressure and the temperature after throttling are 0.12MPa and 109.60C, respectively. Determine:
4.4.1 the dryness fraction of the steam at 2.2MPa; (0.943) 4.4.2 the least dryness fraction which can be theoretically determined under the given pressure conditions. (0.938)
4.5 Wet steam was throttled in a throttle calorimeter and a manometer reading
of 97.5mmHg was obtained. If the barometer reading is 690mmHg, determine the pressure in the calorimeter. (105kPa)
4.6 Determine the degree of dryness of steam in a separator calorimeter which
has 0.2kg of water in the separator and 1.8kg of condensate. (0.9) 4.7 Steam at a gauge pressure of 640kPa was subjected to a throttle calorimeter
test and the following readings were obtained:

381
Barometer height = 750mmHg Manometer height = 75mmHg Thermometer reading 1150C Specific heat capacity Cp for superheated steam = 2.1kJ/kgK Calculate the dryness fraction of the steam. (0.972) 4.8 The mass of water accumulated in the separator of a combined separating
and throttling calorimeter during a dryness test is 2.24kg and the mass of the condensate 24kg. The pressure in the main supply line is 1300kPa and after throttling the pressure and temperature are 100kPa and 1050C. Calculate the degree of dryness in the main supply line. (0.87)
4.9 The following results were obtained during a dryness test using a separating
– throttling calorimeter:
Gauge pressure in the main supply line = 1.2kPa Mass of water accumulated = 0.46kg Mass of condensate = 5.54kg Barometer reading = 750mmHg Manometer reading = 150mmHg Temperature after throttling = 1200C Calculate the degree of dryness in the main supply line. (0.892)
Tutorial
4.1 The manometer reading of a throttling calorimeter is 70.5mmHg. The
barometer reading is 754.5mmHg and the gauge pressure in the main supply line is 940kPa. Determine the pressure of the calorimeter and the absolute pressure in the main supply line. (110kPa, 1040kPa)
Questions relevant to understand and solve this problem:
What type of calorimeter is this? What information is supplied in the question? Are the pressure values supplied absolute or gauge values? Can the absolute values be determined? What must be determined and what are the formulas that can be used? By answering the above questions, you will be able to identify the process. You can now apply all the formulas pertaining to this process to find the answers.
The position of the steam after throttling can also be pinpointed on the Mollier

382
chart using the pressure and temperature values after throttling. The initial position can then be traced from this point to the left, where the horizontal line intersects the main pressure line. Find answers to these questions and use them as a guide to solve this problem. You can add more questions if necessary. Apply the same approach to the remaining questions in the exercise.

383
Chapter 5
Boiler and steam plant
Example 1
The following data refers to a test done on a water tube steam boiler: Mass of water evaporated = 4800kg/hr Mass of coal burnt = 9kg/min Calorific value of coal = 32 MJ/kg Air/fuel ratio = 12:1 Boiler pressure = 3MPa Supply water temperature = 47.70C Inlet temperature to evaporator = 850C Dryness fraction of steam leaving evaporator = 0.8 Superheated temperature of steam = 2500C Specific heat capacity of superheated steam = 2.15kJ/kgK Specific heat capacity of flue gas = 2.5kJ/kgK Calculate: 1.1 the efficiency of the boiler; 1.2 the equivalent evaporation from and at 1000C; 1.3 the amount of heat absorbed by the steam in the evaporator. Questions to be asked in order for one to understand the problem and be able to answer the question: Q: what is a steam boiler? A: it is a pressure vessel that converts water into steam. Q: how does this process take place inside the plant? A: water is supplied to the boiler plant which consists of a number of components.
There are water tube and flame tube boilers. In the water tube boilers the water flows inside the tube and in the flame tube boilers the hot flue gas from the fire flows inside the tubes. At the end of the day the purpose is to convert water into steam with the available heat. The plant may have an economizer, the plant will have a boiler (evaporator) and it may have a super heater. These components are necessary to convert the supply water into steam. The plant may have an air cooler to preheat the air before it enters the combustion chamber to improve the combustion efficiency. As the water flow through these components the temperature is increased up to the desired temperature at outlet. The process through a boiler plant is a constant pressure process and once the outlet

384
temperature is increased above the boiler pressure is the steam superheated. The heat required to increase the water temperature is receive from the heat of the combustion chamber. Different types of boilers are available for e.g. coal fire boilers, electrode boilers, diesel/crude oil boilers. Once the steam has reached its desired temperature, it leaves the boiler plant to be applied at the consumption point.
1.1 Q: what is the efficiency of a boiler plant? A: it is the ratio of the heat absorbed by the water as it flows through the plant, to
the heat generated by the combustion chamber. The heat generated by the combustion chamber depends upon the calorific value of the fuel used by the plant, in the case of a coal or diesel fuel/crude oil boiler, or the wattage (or current) generated by the electrodes of the electrode boiler. The ratio is express in the following equation:
η = [ms(h1 – h0)]/[mf*CV)] where, ms = mass flow rate of steam generated in kg/s or kg/min or kg/hr or kg
steam generated per kg fuel burnt h1 = the enthalpy of the steam leaving the plant at boiler pressure and final
temperature h0 = the enthalpy of the water entering the plant mf = the mass flow rate of the fuel supplied to the combustion chamber in
kg/s or kg/min or kg/hr or kg /kg steam generated CV = the calorific value of the fuel used in the combustion chamber. This is
the heat released per kg of fuel burnt. To answer the first question: η = [ms(h1 – h0)]/[mf*CV)] h1 = 2858 kJ/kg from table or chart h0 = 4.187*47.7 = 199.72 kJ/kg from tables η = [4800(2858 – 199.72)]/[9*60*32000] = 73.84% → answer

385
Note: the mass of fuel and steam must be in the same units when substituted
into the equation. Q: what will influence the efficiency of the boiler plant? A: there are a number of factors that can influence the efficiency of the boiler plant.
A few are listed for this example: The quality of coal, if the calorific value of the coal supplied is different than the correct value, the heat given of during combustion will be different and that will affect the quality of steam produced. Dirty components (economizer, evaporator, super heater), if these components have dirty tubes (inside or outside or both sides of the tubes) then the heat transfer process will be delayed and the necessary heat will not be given to the water/steam circulating through the components. This can be reduce to a large extent by feed water treatment with different chemicals (read about the chemicals used and their purpose) to purify the water. This purification process will reduce scale built-up on tube walls and reduce corrosion of boiler components which will prolong the plants’ lifespan. Worn feed pump, this will not supply the correct amount of water to the plant which can cause overheating and bursting of tubes. Dirty air pre-heater, this will affect the combustion efficiency and the heat given of to the steam.
1.2 Q: what is the equivalent evaporation of a boiler plant? A: it is the amount of water at 1000C that this plant can convert to steam at 1000C
by the heat of 1kg of fuel burnt. Remember that the heat required to change water into steam is called latent heat and that during this process the temperature of the water remains constant, it is merely a phase change. The expression for equivalent evaporation is as follows:
EE = [ms(h1 – h0)]/[mf*2257)]
hfg = 2257kJ/kg is the latent heat of evaporation required to change 1kg of water at 1000C into steam at 1000C.
EE = [4800(2858 – 199.72)]/[9*60*2257] EE = 10.47kg steam/kg fuel → answer 1.3 Q: the amount of heat absorbed by the steam in the evaporator? A: to be able to answer this question it is important to know what the general
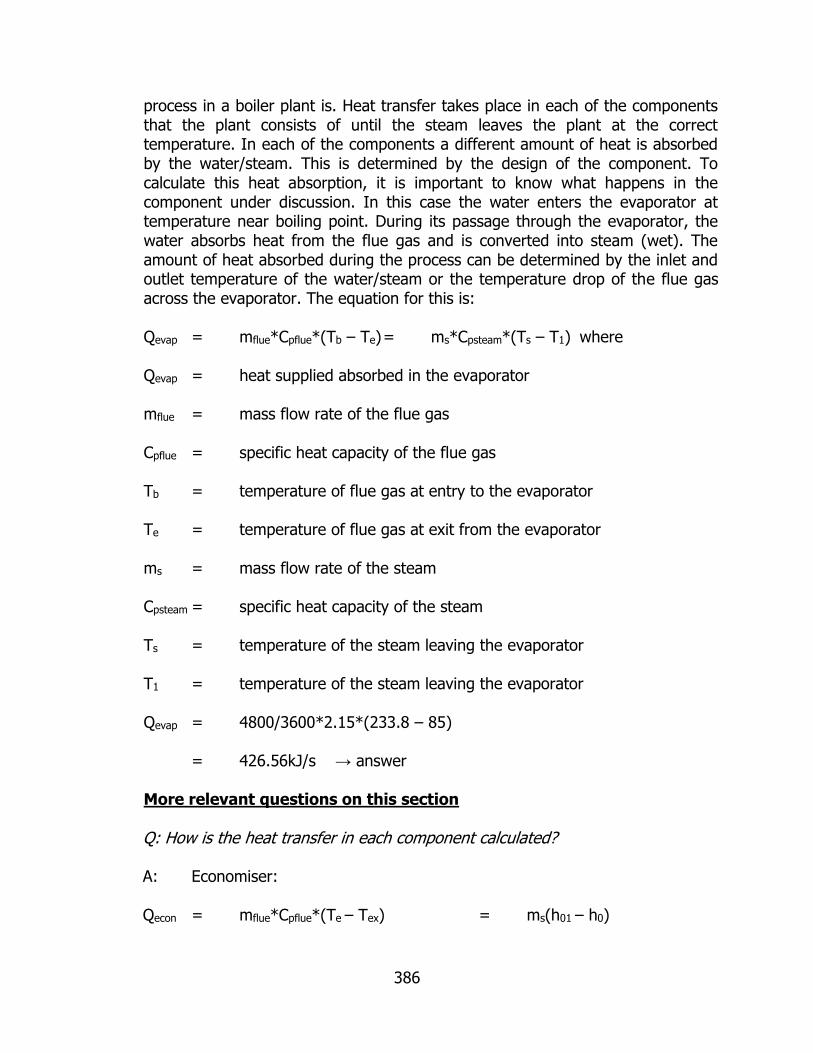
386
process in a boiler plant is. Heat transfer takes place in each of the components that the plant consists of until the steam leaves the plant at the correct temperature. In each of the components a different amount of heat is absorbed by the water/steam. This is determined by the design of the component. To calculate this heat absorption, it is important to know what happens in the component under discussion. In this case the water enters the evaporator at temperature near boiling point. During its passage through the evaporator, the water absorbs heat from the flue gas and is converted into steam (wet). The amount of heat absorbed during the process can be determined by the inlet and outlet temperature of the water/steam or the temperature drop of the flue gas across the evaporator. The equation for this is:
Qevap = mflue*Cpflue*(Tb – Te) = ms*Cpsteam*(Ts – T1) where Qevap = heat supplied absorbed in the evaporator mflue = mass flow rate of the flue gas Cpflue = specific heat capacity of the flue gas Tb = temperature of flue gas at entry to the evaporator Te = temperature of flue gas at exit from the evaporator ms = mass flow rate of the steam Cpsteam = specific heat capacity of the steam Ts = temperature of the steam leaving the evaporator T1 = temperature of the steam leaving the evaporator Qevap = 4800/3600*2.15*(233.8 – 85) = 426.56kJ/s → answer More relevant questions on this section
Q: How is the heat transfer in each component calculated? A: Economiser: Qecon = mflue*Cpflue*(Te – Tex) = ms(h01 – h0)

387
Evaporator: Qevap = mflue*Cpflue*(Tb – Te) = ms(hwet – h01) Super heater: Qsuph = mflue*Cpflue*(Tc – Tb) = ms(h1 – hwet) Air pre-heater: Qair = mflue*Cpflue*(Tex1 – Tex) = maCpa(Ta2 – Ta1) Q: How is the performance of these components expressed as a percentage of total heat absorbed, as a percentage of total heat available and per kilogram of fuel burned? A: Expressed as a percentage of total heat absorbed: Qtot abs = ms(h1 – h0) % absorbed in economiser:
%Qecon = Qecon/Qtot abs * 100 % absorbed in evaporator:
%Qevap = Qevap/Qtot abs * 100 % absorbed in super heater:
%Qsuph = Qsuph/Qtot abs * 100 Expressed as a percentage of total heat available: Qin = mf * CV
% absorbed in economiser:
%Qecon = Qecon/Qin * 100 % absorbed in evaporator:
%Qevap = Qevap/Qin * 100

388
% absorbed in super heater:
%Qsuph = Qsuph/Qin * 100 Expressed per kilogram fuel burnt: In economiser: Qecon = ms(h01 – h0)/mf
In evaporator: Qevap = ms(hwet – h01)/mf
In super heater: Qsuph = ms(h1 – hwet)/mf
In air pre-heater: Qair = maCpa(Ta2 – Ta1)/mf
Q: What other types of boiler/steam generating plant are there? A: Water tube boilers: Electric boilers, gas/oil boilers, coal boilers Fire tube boilers: Coal boilers (fossil fuel)
Q: Which different types of fuel or methods of converting water into steam can be used?
A: Electricity (electrode boilers), coal, gas/oil, nuclear power (Boiling water reactors – BWR and Pressurized water reactors - PWR)
Nuclear boilers are becoming a more attractive alternative – find out how do these units convert water into steam, what is the fuel used and what are the health and safety risks posed by these plants. How are these problems overcome? Q: How do these plants generate steam from water? A: Water tube boilers: In the combustion chamber heat is generated by burning the fuel and forming

389
flue gas (hot combustion gas). Water flows inside the tubes and is heated up by the flue gas from the combustion chamber which heats up the tube walls on the outside, until it is converted into steam. This process can take place in different section of the tubes called the economiser, evaporator and super heater. These boilers can operate at high pressures and can supply large amounts of steam over 1000 000kg/hr. Fire tube boilers: In the combustion chamber heat is generated by burning the fuel and forming flue gas (hot combustion gas). Water flows on the outside of the tubes and is heated up by the flue gas from the combustion chamber which heats up the tubes from the inside as it flows through it. These boilers are not suitable for high pressure and are much smaller in capacity e.g. a size of 500kg/hr. Q: Which chemicals are used to purify water? A: Advantage is a corrosion and deposit inhibitor.
Drewplex AT to control scale and deposits, and Drewplex OX corrosion inhibitor.
GC (concentrated alkaline liquid) to prevent calcium scale deposits, by converting calcium hardness into soft, non-adherent sludge that is easily removed by blow down.
Q: Which safety devices are required on these plants to make them legal? A: Two water level indicators Two water supply pumps High pressure safety valves Thermometers Blow down valves Q: which additional chemical is used in electric boilers and for what reason? A: THIS ANSWER IS LEFT TO THE READER TO INVESTIGATE AS PART OF
PROJECT 1. Q: What is the environmental impact of the exhaust gases produced by these plants? A: THIS ANSWER IS LEFT TO THE LEANER TO INVESTIGATE AS PART OF
PROJECT 1.

390
Q: How can this negative impact be reduced? A: By reducing the amount of flue gas released to atmosphere and by improving the efficiency of the plant so that more heat absorption takes place and the flue gas exit temperature is lower. Q: What are the start-up procedures and shut-down procedures for such a plant? A: THIS ANSWER IS LEFT TO THE LEANER TO INVESTIGATE AS PART OF
PROJECT 1. Q: What maintenance is done to ensure effective operation and prolonged lifetime? A: Treatment of supply water to the plant. Safety devices to ensure operation stay within the design specifications. Scheduled maintenance to ensure all components are in good working
order. Testing the quality of fuel supplied.

391
Exercise 5.1
5.1.1 A boiler with super heater generates 6000kg/hr of steam at a pressure of
1.5MPa, 0.98 dry at exit from the boiler and at a temperature of 3000C on leaving the super heater. If the feed water temperature is 800C and the overall efficiency of the combined boiler and super heater is 85%, determine:
5.1.1.1 the amount of coal of calorific value 30MJ/kg used per hour; (636kg/hr) 5.1.1.2 the equivalent evaporation from and at 1000C for the combined unit; (11.3kg/hr) 5.1.1.3 the heating surface required in the super heater if the rate of heat transmission may be taken as 450 000kJ/m2 of heating surface per hour. (3.85m2)
5.1.2 A boiler is to produce 6250kg/hr of steam superheated by 400C at a
pressure of 2.1MPa. The temperature of the feed water is 500C. If the thermal efficiency of the boiler is 70%, how much fuel oil will be consumed in one hour? The calorific value of the fuel oil used is 45MJ/kg, Cp for superheated steam = 2.093kJ/kgK (531kg)
5.1.3 The feed water to a boiler enters an economizer at 320C and leaves at
1200C, being fed into the boiler at this temperature. The steam leaves the boiler 0.95 dry at 2.0MPa and passes through a super-heater where its temperature is raised to 2500C without change in pressure. The steam output is 8.2kg/kg of coal burned and the calorific value of the coal is 28MJ/kg. Take the specific heat capacity of superheated steam = 2.093kJ/kgK and that for the feed water = 4.18kJ/kgK. Determine the energy received per kilogram of water and steam in the following components and express your answers as percentages of the energy supplied by the coal:
5.1.3.1 the economizer; (10.77%) 5.1.3.2 the boiler; (64.5%) 5.1.3.3 the super-heater. (5.07%)
5.1.4 In a test on a boiler, the following observations were made:
Coal burned per hour = 480kg Water evaporated per hour = 4375kg
Boiler pressure = 3.0MPa Feed water temperature = 950C Temperature of steam leaving the boiler = 2600C Calorific value of coal used = 30.7MJ/kg

392
Take: Cp of superheated steam = 2.093kJ/kgK Determine:
5.1.4.1 the efficiency of the boiler; (73%) 5.1.4.2 the equivalent evaporation from and at 1000C. (4769kg/hr)
5.1.5 The equivalent evaporation of a boiler from and at 1000C is 10.4kg
steam/kg fuel. The calorific value of the fuel is 29800kJ/kg. Determine the efficiency of the boiler. (78.8%)
If the boiler produces 15000kg steam/hr at 24bar from feed water at 400C, and the fuel consumption is 1650kg/hr, determine the condition of the steam produced. (0.972)
5.1.6 A boiler produces steam at a pressure of 3.0MPa and with a temperature of
3000C from feed water at 600C. The steam is supplied to a turbine developing 2.5MW with a steam consumption of 15120kg/MWhr (i.e.4.2kg/MJ). The coal burned in the boiler has a calorific value of 31.6MJ/kg and the boiler efficiency is 82%. Determine the required grate area of the furnace for a firing rate of 215kg/m2 of grate area/hour. (18.6m2)
5.1.7 A boiler uses supply water at 37.70C. Steam leaves the boiler 0.93 dry at a
pressure of 2MPa and passes through a super-heater at constant pressure where its temperature is raised to 3100C. The steam output is 9.5kg/kg coal burnt with a calorific value of 37.5MJ/kg. Calculate:
5.1.7.1 the boiler efficiency; (73.26%) 5.1.7.2 the equivalent evaporation from and at 1000C; (12.2kg/kgf) 5.1.7.3 the heat transfer per kilogram fuel in the evaporator; (23638kJ/kg) 5.1.7.4 the heat transfer per kilogram fuel in the super-heater. (3660kJ/kg)
Tutorial
5.1.1 A boiler with super heater generates 6000kg/hr of steam at a pressure of
1.5MPa, 0.98 dry at exit from the boiler and at a temperature of 3000C on leaving the super heater. If the feed water temperature is 800C and the overall efficiency of the combined boiler and super heater is 85%, determine:
5.1.1.1 the amount of coal of calorific value 30MJ/kg used per hour; (636kg/hr)

393
5.1.1.2 the equivalent evaporation from and at 1000C for the combined unit; (11.3kg/hr) 5.1.1.3 the heating surface required in the super heater if the rate of heat transmission may be taken as 450 000kJ/m2 of heating surface per hour. (3.85m2)
Questions relevant to understand and solve this problem: Which components are involved in this plant? How can the given information be used? Where does the information feature on the diagram? What must be determined and which formulas can be used? By answering the above questions, you will be able to identify the process. You can now apply all the formulas pertaining to this process to find the answers. Find answers to these questions and use them as a guide to solve this problem. You can add more questions if necessary. Apply the same approach to the remaining questions in the exercise.

394
Rankine Cycle
Example 2
A steam plant operates on a Rankine cycle between a pressure of 75kPa and 4000kPa. The steam enters the turbine at a temperature of 4500C and expansion through the turbine takes place isentropically. Determine:
2.1 the work done by the turbine; 2.2 the Rankine efficiency, neglecting pump work; 2.3 the specific steam consumption; 2.4 the work ratio.
Questions to be asked in order for one to understand the problem and be able to answer the question: Q: what is a Rankine cycle? A: first the name Rankine was the surname of the person who developed this cycle,
William John Rankine from Glasgow University Professor. This cycle consists of a number of components with each a specific function. The components are: condenser, feed pump, boiler plant, turbine and cooling tower with all its accessories. The condenser condenses the wet steam coming from the turbine (read about the different type of condensers and how they operate). The feed pump pumps the condensate back to the boiler (read about the different types of feed pumps and how they function). The boiler converts the condensate to steam at the required superheated temperature at boiler pressure (read about the different type of boilers and how the operate. This will be revision because the section on boilers has just been completed). The turbine is driven by the steam and drives a power generator which generates power (read about the different types of turbine and how they function). The cooling tower cools the hot water which circulates through the condenser tubes and in the process absorbs heat from rejected by the steam, to enable the steam to condense (read about different types of cooling towers and how they function). The circulating fluid through the Rankine cycle is obviously water converted to steam.
Q: what are the two pressure values given in the question? A: the lower pressure (P2) the condenser pressure and the higher pressure (P1) the
boiler pressure. The boiler pressure will be the design pressure for a particular boiler and is the safe operating pressure for that plant. Remember the higher the water pressure, the higher the boiling point and the higher the enthalpy (energy) value of the steam produced. This steam must drive a specific turbine which requires a certain amount of energy to operate it at optimum capacity. The condenser pressure is lower than atmospheric pressure and this allows the turbine to generate more power. The higher the pressure drops across the

395
turbine the higher the energy given of to the turbine. By dropping the condenser pressure to a value below atmospheric pressure allows for this.
Q: what is the meaning of the temperature value at entry to the turbine? A: this value together with the pressure value enables one to determine the
enthalpy of the steam at entry to the turbine. Q: what is isentropic expansion through the turbine? A: the process through the turbine is a flow process. The steam enters with specific
properties and leaves with specific properties. During this expansion there is no heat flow to or away from the turbine. This means that the process can be plotted on a Mollier chart and temperature-entropy diagram by a vertical line (no area under the graph, no heat flow).
2.1 Q: how is the turbine work done calculated? A: steam enters the turbine with a certain enthalpy and leaves with a different
enthalpy. The difference between these values is the work done per kilogram of steam flow through the turbine. There is no mass flow indicated in the question and hence the work done will be expressed per kilogram.
Q: how is the outlet enthalpy determined? A: on the Mollier chart the entry point is marked by using the 4000kPa and 4500C
values. A vertical line is drawn from this point until it intersects with the 75kPa condenser pressure line. This point is marked and the enthalpy is read off. At this point the dryness fraction line running through the point indicated the condition of the steam at outlet from the turbine.
WDT = h1 – h2
= 3330 – 2470 = 860kJ/kg → answer 2.2 Q: what is the Rankine efficiency? A: it is a ratio between the useful work done by the turbine and the amount of heat
supplied to convert the water to steam in the boiler plant. It can be expressed as follows:
ηR = [(h1 – h2) –( h4 – h3)]/[( h1 – h3) –( h4 – h3)] where

396
h1 – h2 positive work done through turbine h4 – h3 negative work done by feed pump h1 – h3 heat supplied to water in boiler plant h4 – h3 heat supplied to water by feed pump Q: how is the value of h3 and h4 determined? A: the process inside the condenser is complete condensation. The wet steam
enters the condenser and latent heat is removed until the steam is condensed to saturated water. The temperature during this process is constant (latent heat) and the pressure inside the condenser is constant. The exit point from the condenser is the point where the condenser pressure line intersects with the saturated liquid line and the enthalpy at this point is hf, read of the tables. The work done through the feed pump can be expressed by the following equations:
WDf/p = h4 – h3 = (m/ρ)/(P1 – P2) = Vs/(P1 – P2) m = mass of water (kg) Vs = specific volume of water (m3/kg) ρ = density of water (kg/m3) Q: what does the statement ‘neglect pump work’ means? A: this means that the difference between the inlet and outlet enthalpy value of the
water though the feed pump is so small and ha so little influence on the calculations that the value of h3 and h4 for calculation purposes can be taken as being equal. This will simplify the Rankine efficiency formula to the following:
ηR = (h1 – h2)/( h1 – h3) = (3330 – 2470)/(3330 – 385) = 29.2% → answer 2.3 Q: what is the specific steam consumption of a plant? A: it is the amount of steam at the boiler pressure and outlet temperature required
to generate 1kW and it is indicated by the symbol Ssc. The unit for specific steam consumption is kg/kWhr (read about this particular unit and why it is expressed in this form). Specific steam consumption can be expressed as follows:
Ssc = 3600/(h1 – h2) = 3600/(3330 -2470)

397
= 4.186kg/kWhr → answer 2.4 Q: what is the work ratio of a plant? A: the ratio (rw) of the net work output to the gross work output is called the work
ratio. This ratio gives an indication of the plant size. The following equation can be used to express this relationship:
rw = (net work done)/(positive work done) = [(h1 – h2) –( h4 – h3)]/ (h1 – h2) = [(3330 - 2470) – (1/1000(4000 – 75)]/(3330 – 2470) = 0.995 → answer P1
T 1 1 – 2 turbine work done 2 – 3 heat removed in
condenser 4 P2 3– 4 feed pump work
done
4 – 1 heat supplied by 3 2 boiler
s1 = s2 s

398
1 Turbine Sup/h Evap 2 Econ Cond 4 3 Feedpump
More relevant questions on this section Q: How does the quality of the steam at entry to the turbine impact on the plant performance? A: The higher the enthalpy of the steam the more energy is available for driving the turbine. Therefore super heated steam will drive a larger unit more effectively than saturated or even wet steam. Q: How can the quality of steam at exit from a multi-stage turbine impact on the life span and performance of the unit? A: If the steam is to wet at exit from the turbine it can cause corrosion in the unit which will result in a reduction in the lifespan. If the steam starts to condense inside the unit it will result in power lost due to the fact that the heavier water molecules have different flow characteristics to that of the lighter vapour molecules. Q: What can be done to overcome this? A: In large units (many stages) the steam is tapped off at a specific point and return to the boiler plant to be re-heated again. This will ensure that steam leaves the unit with the correct dryness fraction. Q: If expansion through the turbine is not isentropic, how will this impact on the power developed by this unit? A: Isentropic expansion through the unit means that no heat flows and that the process takes place on a constant entropy line. Point 2 will also be the lowest point achieved, which makes the enthalpy difference between point 1 and 2 a

399
maximum. If the expansion is not isentropic, it means that heat flow exits and that it is because of friction between the steam molecules internally and between the steam molecules and the metal surfaces. This means that the enthalpy value of the steam at exit (numbered as 2’) is closer to point 1 then that of the isentropic value and therefore the energy available for driving the turbine is less. On the temperature-entropy diagram line 1-2’ is slightly curved to the right and not vertical like line 1-2. The area under this line indicates the heat flow because of friction. Q: What can cause the expansion through the turbine not to be isentropic? A: Lubrication, internal friction between molecules and between molecules and the metal surface finishes and difference in density between water and vapour molecules. Q: How can this new power be calculated?
A: I = (h1 – h2’)/(h1 – h2) = isentropic efficiency Enthalpy h1 and h2 can be read off the Mollier chart and substituted into this equation to determine h2’. The actual turbine work done is the calculated as follow:
WDT = h1 – h2’
Q: Why can the steam from the turbine not be exhaust into the atmosphere?
A: Condensers operates at pressures lower than atmospheric pressure to allow for a greater enthalpy change across the turbine. The exhaust from the turbine must therefore be directly into the condenser to maintain this condition. The steam used in these plants is treated water and is therefore kept in a close system to minimize treatment costs. The temperature at exit from the condenser is also much higher than the make-up water temperature which further reduces the amount of heat required to achieve the desired exit conditions. Q: What will the influence be on the plant performance if the condenser is under-cooling the condensate too much? A: Under-cooling in a condenser means that the water leaves the condenser at a lower temperature then the saturation temperature corresponding with pressure 2. This will result in ‘cooler’ water entering the boiler plant, which means more energy will be required to achieve the required exit conditions from the plant. This in turn means more heat required, i.e. more fuel burn which results in

400
higher running costs.

401
Exercise 5.2
5.2.1 Steam is supplied dry saturated at 40bar to a turbine and the condenser pressure is 0.035bar. If the plant operates on the Rankine cycle, calculate per kilogram of steam:
5.2.1.1 the work output neglecting the feed pump work; (982.4kJ) 5.2.1.2 the work required for the feed pump; (4kJ) 5.2.1.3 the heat transfer to the condenser cooling water, and the amount of cooling water required through the condenser if the temperature rise of the water is assumed to be 5.5K; (1706.6kJ, 74.1kJ) 5.2.1.4 the heat supplied; (2685kJ) 5.2.1.5 the Rankine efficiency; (36.6%) 5.2.1.6 the specific steam consumption. (3.66kg/kWhr)
5.2.2 A steam turbine is supplied with steam at a pressure of 2.5MPa and a
temperature of 3000C and exhausts into a condenser where the pressure is 20kPa. The steam consumption is 6000kg/hr and the thermal efficiency is 20%. Determine the power developed by the turbine. (920kW)
If the dryness fraction of the exhaust steam is 0.95, the temperature of the condensate is 600C and the mass of the cooling water is 90 000kg/hr, determine the rise in temperature of the cooling water in passing through the condenser. (35.70C)
5.2.3 Steam at a pressure of 4MPa and a temperature of 3500C expands to
100kPa in a steam turbine. Calculate the Rankine efficiency and steam consumption per kWhr. (26%, 5.1kg)
5.2.4 A steam plant operating on the Rankine cycle has a supply to the turbine,
superheated with a temperature of 2500Cand a pressure of 900kPa. After expansion in the turbine the steam has a dryness fraction of 0.9. Determine:
5.2.4.1 the condenser pressure; (45kPa) 5.2.4.2 the steam enthalpies at the main points; (2948kJ/kg, 2415kJ/kg, 330kJ/kg, 331kJ/kg) 5.2.4.3 the thermal efficiency of the plant; (20.36%) 5.2.4.4 the efficiency ratio with a rate of steam used at 7.5kg/kWhr and the condensate temperature 700C. (0.88)
5.2.5 Consider a 300MW steam power plant which operates on a simple ideal
Rankine cycle. Steam enters the turbine at 10MPa and 5000C and is cooled in the condenser at a pressure of 10kPa. Determine:

402
5.2.5.1 the quality of steam at the turbine exit; (0.793) 5.2.5.2 the mass flow rate of the steam.(235.4kg/s)
Tutorial
5.2.1 Steam is supplied dry saturated at 40bar to a turbine and the condenser
pressure is 0.035bar. If the plant operates on the Rankine cycle, calculate per kilogram of steam:
5.2.1.1 the work output neglecting the feed pump work; (982.4kJ) 5.2.1.2 the work required for the feed pump; (4kJ) 5.2.1.3 the heat transfer to the condenser cooling water, and the amount of cooling water required through the condenser if the temperature rise of the water is assumed to be 5.5K; (1706.6kJ, 74.1kJ) 5.2.1.4 the heat supplied; (2685kJ) 5.2.1.5 the Rankine efficiency; (36.6%) 5.2.1.6 the specific steam consumption. (3.66kg/kWhr)
Questions relevant to understand and solve this problem: What is the inlet condition of the steam to the turbine? Is the expansion through the turbine isentropic? How can the given information be used? What must be determined and what are the formulas that can be used? By answering the above questions, you will be able to identify the process. You can now apply all the formulas pertaining to this process to find the answers. Find answers to these questions and use them as a guide to solve this problem. You can add more questions if necessary. Apply the same approach to the remaining questions in the exercise.
403
Chapter 6
Condensers
Example 1
A steam turbine discharges 5000kg of steam per hour at 400C and with a dryness of 0.85. The estimated air leakage is 15 kg/hr. The temperature at the suction of the air pump is 320C and the temperature of the condensate is 350C. The barometer reading is 760mm Hg. Calculate:
1.1 the vacuum gauge reading;
1.2 the loss of condensate in kilogram per hour;
1.3 the quantity of cooling water required if the rise temperature of the cooling
water is limited to 100C. Questions to be asked in order for one to understand the problem and be able to answer the question: Q: what do I do with the values given in the question? A: the turbine in the question forms part of the Rankine cycle and therefore the
discharged steam will enter the condenser where it will be condensed. The information in this question is that for the condenser in the cycle and will be used to answer the questions asked.
Q: what is a condenser and how does it function? A: condensers can be divided into two main groups: surface condensers and jet
condensers. A surface condenser consists of a shell with a large number of tubes inside. The steam will enter the condenser at the top and leave at the bottom as condensate (hot water). Cooling water will flow through the tubes and will completely condense the steam. The steam and cooling water does not mix and this makes this type of condenser very popular (read about jet condensers, their construction, how they operate and their application). The steam is treated feed water to the boiler and is more pure than the circulating cooling water. Mixing the two will require more water treatment, pushing up running costs. During the flow of steam and cooling water, heat is rejected by the steam and absorbed by the cooling water. The cooling water will therefore enter with a specific temperature and leave with a specific higher temperature. This is referred to as the temperature rise of the cooling water. It is also clear to see that there is a direct relationship between the amount of cooling water and the amount of
steam circulating through a specific condenser. This relationship can be expressed as follows:

404
Heat rejected by steam = heat absorbed by cooling water ms*[x*hfg + 4.187*(Ts – Tk)] = mw*4.187*(tw2 – tw1) where ms = mass of steam entering the condenser or the mass of condensate leaving x = the quality of the steam entering hfg = latent heat of evaporation of steam at condenser pressure Ts = saturation temperature of steam corresponding to condenser pressure Tk = condensate temperature at exit from the condenser mw = mass flow rate of the cooling water tw1 = cooling water temperature at entry
tw2 = cooling water temperature at exit The condenser also operates at a pressure lower than atmospheric pressure
which means it is pressurized by the air surrounding it. This results in air leaking into the system, which must be removed to prevent it from lowering the boiler efficiency. The device used to remove the air is called an air pump. (Read more about the different types of air pumps and their operation). The air leakage value in this question indicates the air leaking into the condenser.
2.1 Q: what is the vacuum gauge reading? A: the condenser operates at a pressure lower than atmospheric pressure. Any
pressure lower than atmospheric pressure, is referred to as a vacuum. The vacuum gauge reading is therefore the condenser gauge pressure reading, normally expressed in millimeters mercury (mmHg). There is also a relationship between the condenser pressure, atmospheric pressure and vacuum gauge reading and can be expressed in the following relationship:
Pc = (Bh – Vm)/7.5 where Pc – condenser pressure in kPa Bh – atmospheric pressure at the specific location in mm Hg Vm – vacuum gauge reading on the condenser in mm Hg Q: how is condenser pressure determined? A: the steam in this question enters the condenser as wet steam and will therefore
be at the saturation temperature corresponding with the condenser pressure. The temperature is 400C and the condenser pressure can be read of the steam table from this value as 7.384kPa.
To answer the question:
405
Pc = (Bh – Vm)/7.5
7.384 = (760 – Vm)/7.5 Vm = 704.95mm Hg → answer 2.2 Q: what is the loss of condensate kilogram per hour? A: it is the amount of treated boiler feed water (condensed steam) which is pumped
away by the air pump drawing the air from the system. Q: how is this condensate loss value calculated? A: the loss of condensate is the amount of feed water extracted with the air by the
air pump. To determine the amount of condensate loss it is important to know what the air pump suction spout temperature is. If this temperature is the same as that of the condensate it is called a wet air pump. If the suction spout temperature is different to that of the condensate then it will be given in the question and this air pump is called a dry pump. This is the case in the given question. The mass of condensate is calculated from the following relationship:
mv = Va/Vg where mv = mass of condensate in kg/hr Va = volume of the air at air pump suction in m3/hr at the partial pressure of
the air at this point Vg = volume of the dry saturated vapour at air pump suction in m3/kg at the
partial pressure of the vapour at this point Q: what is the partial pressure of the air and the vapour at a specific point? A: according to Dalton-Gibbs law of partial pressures the total pressure of a space is
made up by the sum of the partial pressures of the individual gases in the space at the same temperature. Look at the following example. A container is filled with two gases, A and B. The total pressure (PT) in the cylinder will then be PT = PA + PB, where PA and PB are the partial pressures of gases A and B individually where both these gases are at the same temperature.
Pc = Pv + Pa where Pc = condenser pressure
406
Pv = partial pressure of the vapour at the suction spout temperature Pa = partial pressure of the air Q: how are Pa and Pv determined? A: Pv is found from the steam tables at the air pump suction temperature. Pa is then
determined from the above equation. The following steps can be followed: Pc = Pv + Pa 7.384 = 4.799 + Pa Pa = 2.59kPa PaVa = maRaTa
2.59 * Va = 15 * 0.287 * (32 + 273) Va = 507.9 m3/hr Vg is read off from the steam tables at 320C as 29.82m3/kg. mv = 507.9/29.82 = 17.031kg/hr → answer 2.3 Q: what is the amount of cooling water required if the temperature rise of the
cooling water is kept to 100C? A: from the explanation of the condenser operation the following relationship is
made between the heat rejected by the steam and the heat absorbed by the cooling water:
ms*[x*hfg + 4.187*(Ts – Tk)] = mw*4.187*(tw2 – tw1) 5000*[0.85*2406.72 + 4.187*(40 – 32)] = mw * 4.187 * (10) mw = 248293.29kg/hr → answer
More relevant questions on this section Q: Which different types of condensers are there?

407
A: The main categories for condensers are: surface condensers and jet condensers. Types of surface condensers: Single pass, two pass condensers Regenerative condensers Evaporative condensers Types of let condensers: Low level jet condensers (parallel flow or counter flow) High level jet condensers THE INVESTIGATION OF THE FOLLOWING IS LEFT TO THE READER: THE TYPES OF SURFACE AND JET CONDENSERS AND THEIR OPERATION; THE ADVANTAGES AND DISADVANTAGES OF EACH CATEGORY; THE INDUSTRIAL APPLICATION OF EACH CATEGORY Q: How does the inside configuration of these categories differs from one another? A: Surface condensers: In these units the hot and cold water circuits are not mixing which allows for the re-use of treated condensate from the turbine. The one fluid will enter the shell and flow over the tubes and the other will enter the tubes and flow through them. This reduces the water treatment of the boiler plant. Jet condensers: The hot and cold fluid enters a common chamber and mixes. The mixture is then re-circulated to the plant for use. Q: Heat flows from the hot fluid to the tube and from the tube to the cold fluid, what are the formulas to determine this relationship of heat transfer?
A: Heat rejected by steam = heat flow through tube walls = heat absorbed by cooling water
ms*[x*hfg + 4.187*(Ts – Tk)] = AUTln = mw*4.187*(tw2 – tw1)

408
Q: What is the overall heat transfer coefficient ‘U’ for a unit? A: It is a heat transfer coefficient which includes the convection heat transfer coefficient between the hot fluid and the tube walls, the thermal conductivity of the tube walls for conduction heat transfer through the tube walls and the convection heat transfer between the tube walls and the cold fluid. The formula also caters for the effect of scale built-up on the tube inside and outside walls which act as an insulator which reduces the heat transfer rate. The calculation of the overall heat transfer coefficient will be done at a later stage and does not form part of this syllabus. Q: What is the logarithmic mean temperature difference? A: This is a formula used to trace the average temperature difference between the hot and cold fluid as they flow through the condenser. Q: How is the logarithmic mean temperature difference determined for a specific unit? A: Tln = [T1 - T2]/[ln(T1/T2)]
Parallel flow: Counter flow: Tcold in
Thot in Thot in Tcold in

409
Thot in Thot in
T1 Tcold out Thot out
T1 Tcold out T2 Thot out
T2
Tcold in
T cold in
Q: How does the internal configuration impact on this calculation? A: If there are more than one tube pass a correction factor must be brought in because the above calculation is for pure parallel or pure counter flow units. This will be done at a later stage and is not included in this syllabus. Q: How is the condenser efficiency determined? A: c = (tw2 – tw1)/(Ts – tw1) Q: Why will a wet air pump be replaced with a dry air pump? A: The dry air pump suction temperature is lower than that of the wet air pump which means that less vapour will be pumped out. This means a reduction in make-up water as well as water treatment costs. The size of the dry air pump is also smaller than that of the wet air pump, which also means a saving in electricity due to the smaller electrical drive motor.

410
Exercise 6
6.1 A surface condenser is fitted with separate air and condensate outlets. A portion of the cooling surface is screened from the incoming steam and the air is passes over these screened tubes to the air extraction and becomes cooled below the condensate temperature. The condenser receives 20 000kg/hr of dry saturated steam at 36.20C. At the condensate outlet the temperature is 34.60C and at the air extraction the temperature is 290C. The volume of air and vapour leaving the condenser is 3.8m3/min. Assume constant pressure throughout the condenser, calculate:
6.1.1 the mass of air removed per 10 000kg of steam; (2.63kg) 6.1.2 the mass of steam condensed in the air cooler per minute; (0.5kg/min) 6.1.3 the heat rejected to the cooling water. (13451kW)
6.2 A condenser condenses 2700kg steam per hour while air leaks into it at
2.2kg/hr. The condensate and air suction spout temperatures are 32.90C. The barometer and vacuum gauge readings are 765mmHg and 690mmHg respectively. The condenser uses 125.55Mg of cooling water per hour to condense steam with a dryness fraction of 0.86 and the air pump has a volumetric efficiency of 82.5%. Take R = 0.287kJ/kgK for air and calculate:
6.2.1 the temperature rise of the cooling water; (10.850C) 6.2.2 the air pump capacity in m3/min. (0.78m3/min)
6.3 5595kg of steam with a dryness fraction of 0.85 is condensed per hour by a
surface condenser while air leaks into it at a rate of 0.87kg/1000kg of steam condensed. The barometer reading is 745.5mmHg and the vacuum gauge reading 674.25mmHg. The temperature of the air suction spout of the air pump and condensate are each 37.70C and R for air is 0.287kJ/kgK. The cooling water enters and leaves the condenser at 17.50C and 40.50C respectively. Calculate:
6.3.1 the cooling water required in m3/min; (2m3/min) 6.3.2 the capacity of the air pump in m3/min if an air cooler which cools the air to 21.10C before it is pumped out, is fitted; (0.978m3/min) 6.3.3 the percentage saving in pump volume by cooling the air from 37.70C to 21.10C. (59.4%)
6.4 A condenser works under a vacuum of 700mmHg while air leaks into it at a
4.25kg/hr. The air pump extraction spout has a temperature of 32.90C and the barometer reading is 760mmHg. Take r for air 0.287kJ/kgK and calculate:

411
6.4.1 the volume of air removed per hour; (124.37m3/hr) 6.4.2 the mass of vapour present in the air per hour. (4.41kg/hr)
6.5 A condenser condenses wet steam which enters it at 49.50C and leaves it at
37.70C, while the cooling water absorbs 1838MJ heat per kilogram steam. Take R for air 0.287kJ/kgK and calculate:
6.5.1 the dryness fraction of the wet steam; (0.75) 6.5.2 the air leakage per kilogram of steam. (1.358kg air/kg steam)
6.6 The temperature of the cooling water in a condenser rises from 15.30C to
25.80C while condensing 12 500kg steam per hour, 0.94 dry and at a pressure of 4.5kPa absolute. The temperature of the condensate is 290C and the heat transfer coefficient 4kW/m2 0C. The condenser has two passes and contains tubes with outside diameter 20mm and wall thickness 1.5mm with cooling water at 0.8m/s through it. Calculate the number and the length of the tubes. (1992, 2m)
6.7 18 000kg of steam is condensed per hour by a condenser while air leaks into
it at 0.35kg per 1000kg of steam. The steam enters the condenser dry saturated at 37.70C and the condensate leaves it at 34.60C. The loss of condensate is made up by addition of water at 60C. An air pump, fitted with an air cooler extracts the air from the condenser at 24.10C. Calculate:
6.7.1 the saving in condensate by using a dry air pump; (18.22kg/hr) 6.7.2 the heat supplied by the boiler. (2182kJ/hr)
Tutorial
6.1 A surface condenser is fitted with separate air and condensate outlets. A
portion of the cooling surface is screened from the incoming steam and the air is passes over these screened tubes to the air extraction and becomes cooled below the condensate temperature. The condenser receives 20 000kg/hr of dry saturated steam at 36.20C. At the condensate outlet the temperature is 34.60C and at the air extraction the temperature is 290C. The volume of air and vapour leaving the condenser is 3.8m3/min. Assume constant pressure throughout the condenser, calculate:
6.1.1 the mass of air removed per 10 000kg of steam; (2.63kg) 6.1.2 the mass of steam condensed in the air cooler per minute;
(0.5kg/min) 6.1.3 the heat rejected to the cooling water. (13451kW)

412
Questions relevant to understand and solve this problem: What category of condenser is involved in this question? What information is given and how can this be used? From the given information is it posseble to determine which type of air pump (dry or wet) is used? What is the mass of air removed and how is it determined? What is the mass of steam condensed and how is it determined? What is the relation ship between heat rejected by the steam and heat absorbed by the cooling water? By answering the above questions, you will be able to identify the process. Make a neat sketch of the unit and fill in all the information supplied and the correct positions. This will ensure that the correct values are used during calculations. You can now apply all the formulas pertaining to this process to find the answers.
Find answers to these questions and use them as a guide to solve this problem. You can add more questions if necessary. Apply the same approach to the remaining questions in the exercise.

413
Chapter 7
Combustion
Example 1
A fuel contains 4% hydrogen, 89% carbon, 1% sulphur, 2.5% oxygen and 3.5% ash. The fuel is supplied with 20% excess air. Calculate: 1.1 the air-fuel ratio (A/F); 1.2 the products of combustion for complete combustion; 1.3 The dry products of combustion (POC) by volume. Questions to be asked in order for one to understand the problem and be able to answer the question: Q: what is the air-fuel ratio? A: in combustion calculations this is the ratio of the amount of air (kg) in the
combustion chamber to the amount of fuel (kg) in the combustion chamber. Combustion calculations are always expressed in terms of one kilogram of fuel burnt. If the exact amount of air (ma) is supplied to burn the one kilogram of fuel out completely, it called the stoichiometric air-fuel ratio (theoretical air-fuel ratio). At this point only complete combustion processes are considered. The ratio will be expressed as follows:
ma:1 If more air is supplied than the required amount, then the extra air supplied is
called the excess air (me). To be able to determine the air-fuel ratio the total amount of air (mT) in the combustion chamber must be determined. The total mass of air is made up of the exact amount and the excess air supplied:
mT = ma + me
The air-fuel ratio is now termed the actual air-fuel ratio and expressed as follows: mT:1
Q: how are these different masses of air calculated? A: first the oxygen required for complete combustion of the must be determined. In
each fuel sample there are active elements that require oxygen to take part in the combustion process. Solid and liquid fuels will normally have active elements

414
such as carbon, hydrogen and sulphur. The sulphur content in the fuel is normally kept to a minimum because of its corrosive nature which can damage the engine components. Gaseous fuels will have active element such as methane, hydrogen and carbon-dioxide. The fuel sample in the question is either a solid or liquid fuel looking at the elements that it consists of. In this fuel sample the active elements are hydrogen, carbon and sulphur. To determine the oxygen required for complete combustion of each element a chemical reaction equation and the molecular mass of the element is required:
H2 + O2 » H2O Balance the equation and determine the amount of oxygen per kilogram of
hydrogen required. Molar mass of hydrogen (H) is 1 and that of oxygen (O) is 16.
2H2 + O2 » 2H2O 2*1*2 + 16*2 » 2*(1*2 + 16) 4 + 32 » 36 divide by 4 to express per kilogram of fuel: 1 + 8 » 9
This means that 1kg of hydrogen requires 8kg of oxygen to burn out completely and form water.
Repeat this process for carbon and sulphur. Molar mass of carbon (C) is 12 and that of sulphur (S) is 32. For carbon: C + O2 » CO2 C + O2 » CO2 12 + 32 » (12 + 32) 12 + 32 » 44 1 + 32/12 » 44/12 This means that 1kg of carbon requires 32/12 kg of oxygen to burn out completely and form carbon-dioxide.

415
For sulphur: S + O2 » SO2
32 + 32 » (32 + 32) 32 + 32 » (64) 1 + 1 » 2
This means that 1kg of sulphur requires 1kg of oxygen to burn out completely and form sulphur-dioxide. To determine the total amount of oxygen required, add up the amount of oxygen for each element: mO2 = %H2*8/100 + %C*32/1200 + %S*1/100 (kg oxygen/kg fuel)
Q: what is purpose of the oxygen in the fuel sample? A: this fuel sample contains an amount of oxygen which will react with the
hydrogen at room temperature and pressure (250C and 101.325kPa) to form water. The other active elements will not react with oxygen at these conditions. This means that a certain amount of the hydrogen is already supplied by oxygen. The rest of the hydrogen will require in the supplied air to burn. In the above equation this amount of oxygen in the fuel must then be subtracted from the total amount supplied:
mO2 = %H2*8/100 + %C*32/1200 + %S*1/100 - %O2 in fuel/100 (kg oxygen/kg fuel)
= 4*8/100 + 89*32/1200 + 1*1/100 – 2.5/100
= 2.678 kgO2/kg fuel Q: how is this mass of oxygen converted into mass of air? A: by mass air mainly consists of 23.3% oxygen and 76.7% nitrogen. To determine
the amount of oxygen in the air the following relation ship is used: ma = mO2/23.3*100 = 2.678/23/3*100 = 11.494kg air/kg fuel

416
20% excess air is supplied in this question and therefore the mass of this excess air must be calculated. The following relationship is used:
me = ma*%excess air/100 = 11.949*20/100 = 2.299kg air /kg fuel The total amount of air supplied to the combustion chamber is now calculated: mT = ma + me = 11.949 + 2.299 = 13.793kg air/kg fuel 1.1 To answer the question:
The actual air-fuel ratio is: mT:1 13.793:1 → answer
1.2 Q: what are the products of combustion? A: during the combustion process the active elements react with the oxygen to form
stable products like water, carbon-dioxide and sulphur. The nitrogen in the supplied air does not take part in the combustion process and will leave the combustion chamber with these stable products. All the extra air supplied also contains oxygen which will not have any active products to react with therefore this oxygen will also leave the combustion chamber. All the products that are formed and those that did not take part in the combustion process are named the products of combustion. These products will be tabulated indicating their mass and percentages as follows:

417
Elements Mass /kg fuel
percentage %
N2
mT * %N2 in air/100 + %N2 in fuel/100 13.793 * 76.7/100 + 0
10.579
10.579/14.758*100
71.68
O2
me * %O2 in air/100 2.299 * 23.3/100
0.536
0.536/14.758*100
3.6
CO2
%C * 44/1200 + %CO2 in fuel/100 89 * 44/1200 + 0
3.263
3.263/14.758*100
22.11
SO2
%S * %/100 1 * 2/100
0.02
0.02/14.758*100
0.14
H2O
%H2 * 9/100 + %H2O in fuel/100 4 * 9/100 + 0
0.36
0.36*14.758/100
2.44
Total mass of products: 14.758 100
→ answer Q: what are dry products of combustion by volume? A: the above table gives the product of combustion in kilograms and is called a
mass analysis. If the products of combustion had to be tabulated in terms of volume it is called a volumetric analysis of product of combustion. The same table as above is used, but the molecular mass, volume and percentage volume columns replace the last two columns. The question also specifies dry products which mean that the table should not include hydrogen which forms water during the combustion. The table will look as follows:
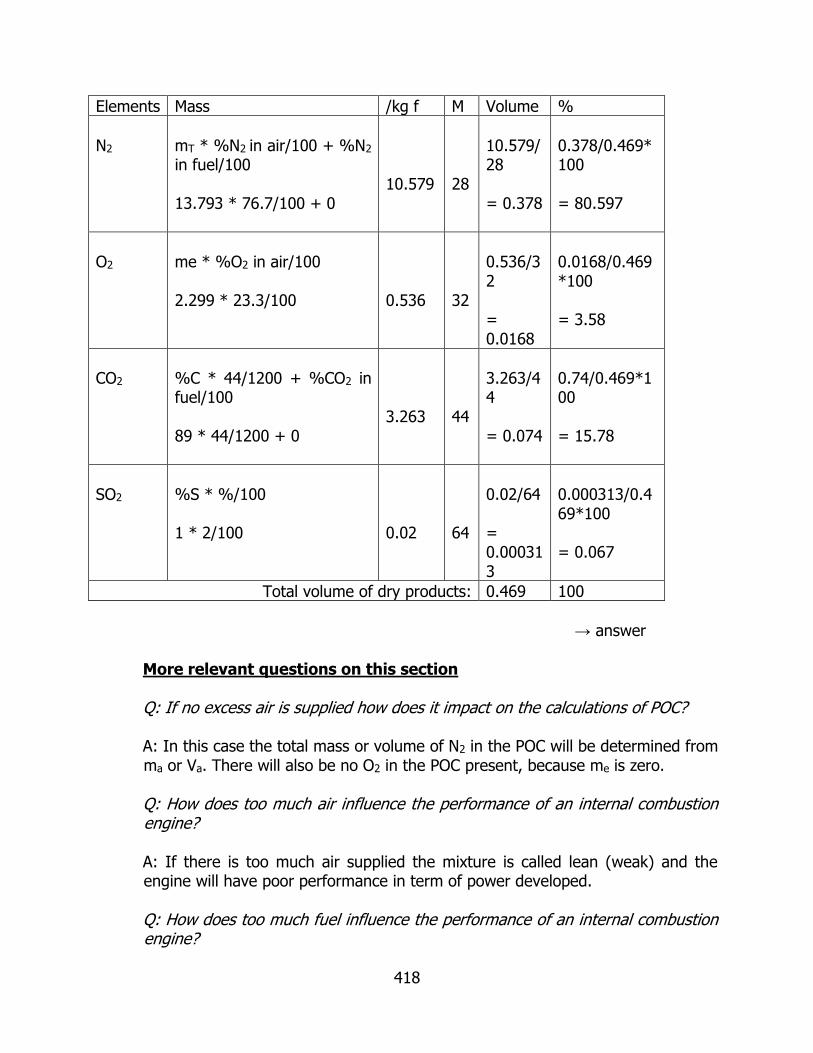
418
Elements Mass /kg f M Volume %
N2
mT * %N2 in air/100 + %N2 in fuel/100 13.793 * 76.7/100 + 0
10.579
28
10.579/28 = 0.378
0.378/0.469*100 = 80.597
O2
me * %O2 in air/100 2.299 * 23.3/100
0.536
32
0.536/32 = 0.0168
0.0168/0.469*100 = 3.58
CO2
%C * 44/1200 + %CO2 in fuel/100 89 * 44/1200 + 0
3.263
44
3.263/44 = 0.074
0.74/0.469*100 = 15.78
SO2
%S * %/100 1 * 2/100
0.02
64
0.02/64 = 0.000313
0.000313/0.469*100 = 0.067
Total volume of dry products: 0.469 100
→ answer
More relevant questions on this section Q: If no excess air is supplied how does it impact on the calculations of POC? A: In this case the total mass or volume of N2 in the POC will be determined from ma or Va. There will also be no O2 in the POC present, because me is zero. Q: How does too much air influence the performance of an internal combustion engine? A: If there is too much air supplied the mixture is called lean (weak) and the engine will have poor performance in term of power developed. Q: How does too much fuel influence the performance of an internal combustion engine?

419
A: If there is too much fuel supplied, the mixture is called rich and the engine will not be able to burn all the fuel, because there is not enough air supplied for the amount of fuel. This will result in the engine having a high fuel consumption. Q: How is the minimum amount of oxygen determined if different fuels burn completely in a specific ratio? A: Let the two fuels be liquids with a composition: Benzene (C6H6) and octane (C8H18) and the specific ratio for the purpose of explaining C6H6 : C8H18 = 3:4 From first principles: C6H6 + O2 » CO2 + H2O
C6H6 + 7.5O2 » 6CO2 + 3H2O
(12*6 + 1*6) + (7.5*32) » 6*(12 + 32) + 3*(2 + 16)
78 + 240 » 264 + 54 divide by 78 to express per kilogram of fuel:
1 + 3.08 » 3.38 + 0.69 This means that 1kg of benzene requires 3.08kg of oxygen to burn out completely and form water and carbon-dioxide. The amount of benzene present in the sample is not 1kg but 3 parts out of a total of 7 parts. The amount of O2 required is then: 3.08 * 3/7 = 1.32kg C8H18 + O2 » CO2 + H2O
C8H18 + 12.5O2 » 8CO2 + 9H2O
(12*8 + 1*18) + (12.5*32) » 8*(12 + 32) + 9*(2 + 16)
114 + 400 » 352 + 162 divide by 114 to express per kilogram of fuel:
1 + 3.51 » 3.09 + 1.42 This means that 1kg of octane requires 3.51kg of oxygen to burn out completely and form water and carbon-dioxide.

420
The amount of octane present in the sample is not 1kg but 4 parts out of a total of 7 parts. The amount of O2 required is then: 3.51 * 4/7 = 2.01kg The total amount of O2 required for complete combustion of the sample: mO2 = 1.32 + 2.01 = 3.33kg
Q: How are the POC determined in such a case? A: No excess air is supplied therefore me = 0 ma = mO2/23.3 * 100 = 14.29 mT = ma
Elements Mass /kg fuel
percentage %
N2
mT * %N2 in air/100 + %N2 in fuel/100 14.29 * 76.7/100 + 0
10.96
10.96/15.28*100
71.72
O2
me * %O2 in air/100 0 * 23.3/100
0
0
0
CO2
CO2 from C6H6*3/7 + CO2 from C8H18 * 4/7 3.38 * 3/7 + 3.09 * 4/7
3.21
3.21/15.28*100
21.01
SO2
0
0
0
0
H2O
H2O from C6H6*3/7 + H2O from C8H18 * 4/7

421
0.69 * 3/7 + 1.42 * 4/7
1.11 1.11/15.28*100 7.26
Total mass of products: 15.28 100
Q: If the fuel is a gas, how does it influence the balancing of the chemical
reaction?
A: Let the two fuels be: Ethane (C2H6) and Propane (C3H8) From first principles: C2H6 + O2 » CO2 + H2O
C2H6 + 3.5O2 » 2CO2 + 3H2O
1 + 3.5 » 2 + 3 equation is per m3 fuel:
This means that 1m3 of ethane requires 3.5m3 of oxygen to burn out completely and form water and carbon-dioxide. C3H8 + O2 » CO2 + H2O
C3H8 + 10O2 » 3CO2 + 4H2O
1 + 10 » 3 + 4 equation is per m3 fuel:
This means that 1m3 of propane requires 10m3 of oxygen to burn out completely and form water and carbon-dioxide.
Q: How will the minimum amount of air in this case be determined?
A: For gaseous fuel the volume of O2 will be determined. Let assume that the sample consists of the following ratio for this explanation: C2H6 : C3H8 = 2:3
The amount of ethane present in the sample is not 1m3 but 2 parts out of a total of 5 parts. The volume of O2 required is then: 3.5 * 2/5 = 1.4m3
The amount of octane present in the sample is not 1m3 but 3 parts out of a total of 5 parts. The volume of O2 required is then:
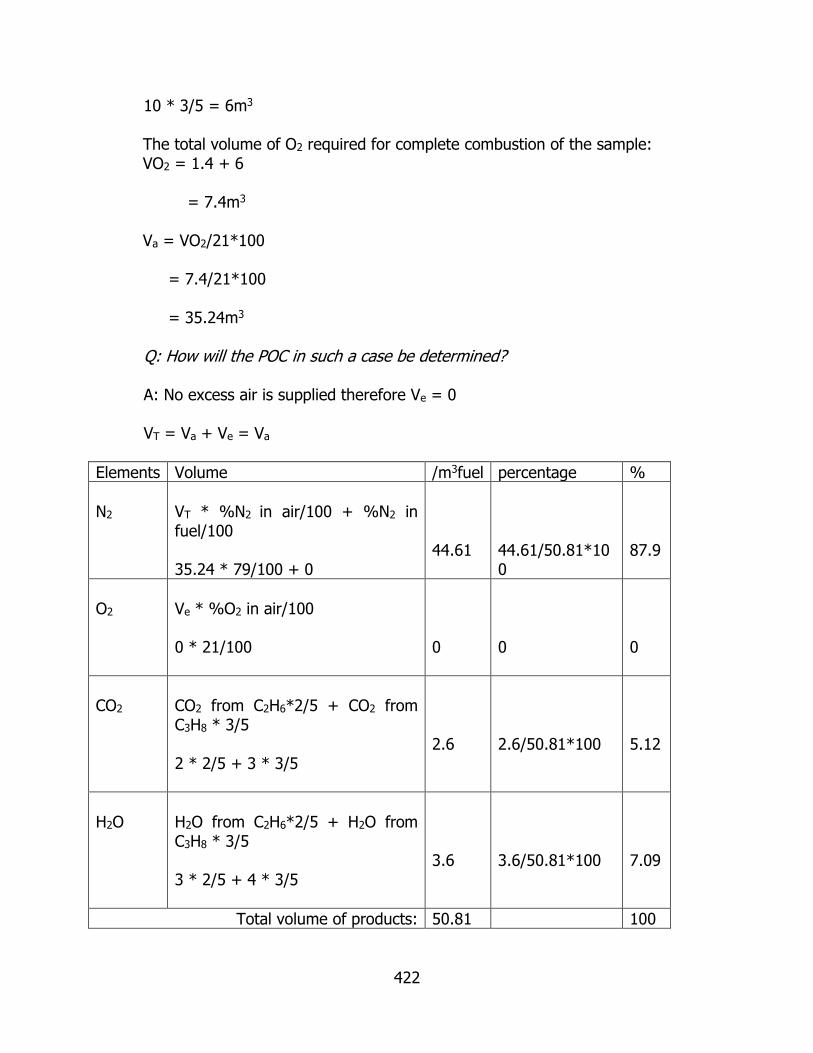
422
10 * 3/5 = 6m3
The total volume of O2 required for complete combustion of the sample: VO2 = 1.4 + 6 = 7.4m3
Va = VO2/21*100
= 7.4/21*100 = 35.24m3 Q: How will the POC in such a case be determined? A: No excess air is supplied therefore Ve = 0 VT = Va + Ve = Va
Elements Volume /m3fuel percentage %
N2
VT * %N2 in air/100 + %N2 in fuel/100 35.24 * 79/100 + 0
44.61
44.61/50.81*100
87.9
O2
Ve * %O2 in air/100 0 * 21/100
0
0
0
CO2
CO2 from C2H6*2/5 + CO2 from C3H8 * 3/5 2 * 2/5 + 3 * 3/5
2.6
2.6/50.81*100
5.12
H2O
H2O from C2H6*2/5 + H2O from C3H8 * 3/5 3 * 2/5 + 4 * 3/5
3.6
3.6/50.81*100
7.09
Total volume of products: 50.81 100

423
Exercise 7 7.1 A sample of coal gave the following analysis by mass: C 81.9%; H2 4.9%; O2
6%; N2 2.3%; ash 4.9%. Calculate:
7.1.1 the stoichiometric air/fuel ratio; (10.8/1) 7.1.2 the analysis by volume of the wet and dry products of combustion when the air supplied is 25% in excess of that required for complete combustion. (CO2 14.16%, H2O 5.07%, O2 4.04%, N2 76.7%, CO2 14.9%, O2 4.24%, N2 80.9%)
7.2 Calculate the air/fuel ratio for benzene (C6H6), and the wet and dry analysis
of the products of combustion. (13.2/1, CO2 16%, H2O 8.05%, N2 75.8%, CO2 17.5%, N2 82.5%)
7.3 The coal supplied to a boiler has the following composition by mass:
hydrogen 4%, carbon 84%, moisture 5%, the remainder ash. The air supplied is 40% in excess of that required for complete combustion and coal is burned at the rate of 2000kg/hr. Assuming that the specific volume of the flue gases at entrance to the flue stack is 1.235m3/kg and that the maximum permisseble flue gas velocity is 7.75m/s, find the area of the cross-section of the stack at entrance. Assume that air contains 23% oxygen by mass. (1.47m2)
7.4 A furnace gas has the following volumetric analysis: H2 15%, CO 24%, CO2
6%, CH4 12%, O2 3% and N2 40%. Calculate the volumetric analysis of the dry products of combustion with 30% excess air. (N2 81.46%, O2 4.17%, CO2 14.37%)
7.5 The volumetric analysis of a furnace gas is: CO 17.8%, H2 51.3%, CH4
22.5%, O2 0.8%, CO2 5.2% and N2 2.4%. Calculate the air/fuel ratio with 20% excess air. (4.5m3/m3f)
7.6 A fuel with a formula of C7H16 is burned with air. Calculate the minimum
mass and volume of air required for complete combustion of 1kg and 1m3 fuel respectively. (15.1kg, 52.38m3)
7.7 A fuel with a formula of C4H10 is burned with air. Calculate the minimum
mass and volume of air required for complete combustion of 1kg and 1m3 fuel respectively. (21.3kg, 42.86m3)
7.8 Coal with a mass analysis of C 85%, H2 10%, O2 2%, S 1% and 2% ash is
used in a boiler. If 25% excess air is supplied calculate:

424
7.8.1 the stoichiometric air/fuel ratio; (13.12/1) 7.8.2 the percentage composition according to mass of the products of combustion; (N2 72.38%, O2 4.4%, CO2 17.93%, SO2 0.12%, H2O 5.18%) 7.8.3 the volume of the exhaust gas at S.T.P. with R = 0.28kJ/kgK; (13.12m3/kgf) 7.8.4 the heat rejected to the atmosphere by the dry exhaust gas in the form of a vapour with the pressure 120kPa and temperature 186.80C at the chimney. Take Cpex = 1.23kJ/kgK (1662kJ/kgf)
7.9 A fuel contains according to mass carbon 82%, hydrogen 11%, sulphur
1.5%, oxygen 3.5% and the remainder ash. Calculate the higher and lower calorific values of the fuel if the partial pressure of the steam in the exhaust gas is 6kPa. (42.8MJ/kg, 40.4MJ/kg)
7.10 The volumetric analysis of a gas is: CO 24.5%, CO2 4.5%, H2 5.5%, CH4
34.5%, O2 2.2% and N2 28.8%. Calculate the higher and lower calorific values of the fuel per m3, if every m3 vapour that formed absorbs 2.4 MJ of heat. (16.62MJ/m3, 16.49MJ/m3)
Tutorial
7.1 A sample of coal gave the following analysis by mass: C 81.9%; H2 4.9%; O2
6%; N2 2.3%; ash 4.9%. Calculate:
7.1.1 the stoichiometric air/fuel ratio; (10.8/1) 7.1.2 the analysis by volume of the wet and dry products of combustion when the air supplied is 25% in excess of that required for complete combustion. (CO2 14.16%, H2O 5.07%, O2 4.04%, N2 76.7%, CO2 14.9%, O2 4.24%, N2 80.9%)
Questions relevant to understand and solve this problem:
What information is given and how can this be used to determine the type of fuel? What is a stoichiometric air/fuel ratio and what is an actual air/fuel ratio? What is a volumetric analysis of POC? What is the difference between a dry and wet analysis? By answering the above questions, you will be able to identify the type of fuel. You can now apply all the formulas pertaining to this process to find the answers. When doing a mass or volumetric analysis of POC, a table format is suggested.

425
Find answers to these questions and use them as a guide to solve this problem. You can add more questions if necessary. Apply the same approach to the remaining questions in the exercise.

426
Revision exercise Apply your enquiry based learning skills which you have been developing throughout the course to solve the following problems. At this point you should also be able to formulate questions and answers based on your knowledge gained in this course. This will also be an exercise to indicate to you the effectiveness of your learning process in terms of knowledge retention, understanding and application in solving problems. Briefly list all your questions with answers below each question before solving the problem: 1. During a moulding process, air is compressed from a pressure of
150kPa to a pressure of 500kPa and a temperature of 400K. During this process the volume is reduced to one third its original value. Calculate:
1.1.1 the value of the index of compression ‘n’. Round-off to three decimals; (2) 1.1.2 the work done during compression per kilogram of air; (4) During the second stage of the process is reversed and the air is expanded polytropically to double the initial volume. Calculate: 1.1.3 the pressure at the end of expansion; (2) 1.1.4 the temperature at the end of expansion; (2) 1.1.5 heat flow during expansion per kilogram of air; (6)
1.1.6 Sketch a neat fully detailed pressure-volume diagram. Shade the area which represents the compression work done. (5) [21] List your questions and answers below:

427
2. The pressure of a certain gas in the cylinder of an engine rises from 75kPa to 1.15MPa during the compression stroke. During this stroke the volume decreases from 0.5m3 to 0.06m3 and the compression takes place according to the law PVn = constant. The initial temperature of the gas is 390C. Assume R = 0.285kJ/kgK for the gas and Cv = 0.715kJ/kgK. Calculate:
2.1.1 the value of the index of compression ‘n’; (3) 2.1.2 the work done during compression; (2) 2.1.3 the mass of the gas in the cylinder; (2) 2.1.4 the change in internal energy; (4) 2.1.5 the heat exchange with the surroundings. (2) 2.1.6 Sketch a fully detailed PV-diagram indicating clearly the area which represents the work done. (4) 2.2 A quantity of gas occupies a volume of 1.4m3 at a pressure of 96.5kPa and temperature of 930C. The gas is compressed according to the law PV1.25 = constant to a pressure of 860kPa, and then heated at constant volume to a pressure of 3.1MPa. Take Cp = 1.255kJ/kgK and R = 0.29kJ/kgK. 2.2.1 Draw a fully detailed PV-diagram of the process and indicate the area which represents the polytropic work done. (5) 2.2.2 Calculate the volume and temperature at the end of heat addition. (6) [28] List your questions and answers below:

428
3. In a steady flow system, 1kg of fluid per second enters the control volume at a pressure of 1 bar and it leaves the system at a pressure of 10bar. The inlet and exit velocities are 40m/s and 20m/s respectively. During the process 36000kJ of heat is transferred per hour to the control volume. The rise in enthalpy of the fluid is 15kJ/kg. Calculate the power developed by the system. [4] List your questions and answers below:

429
4. A steam turbine receives a steam flow of 25 000 kg/hr and its power output is 500 kW. Neglecting any heat loss from the turbine, find the change in specific enthalpy of the steam flowing through the turbine taking inlet and outlet velocity as 80 m/s and 300 m/s. (3) List your questions and answers below:

430
5. Determine how much energy is required to change 3.5kg of water at 150C into superheated steam in a rigid vessel. The degree of superheat is 300C at a pressure of 500kPa. [5]
List your questions and answers below:
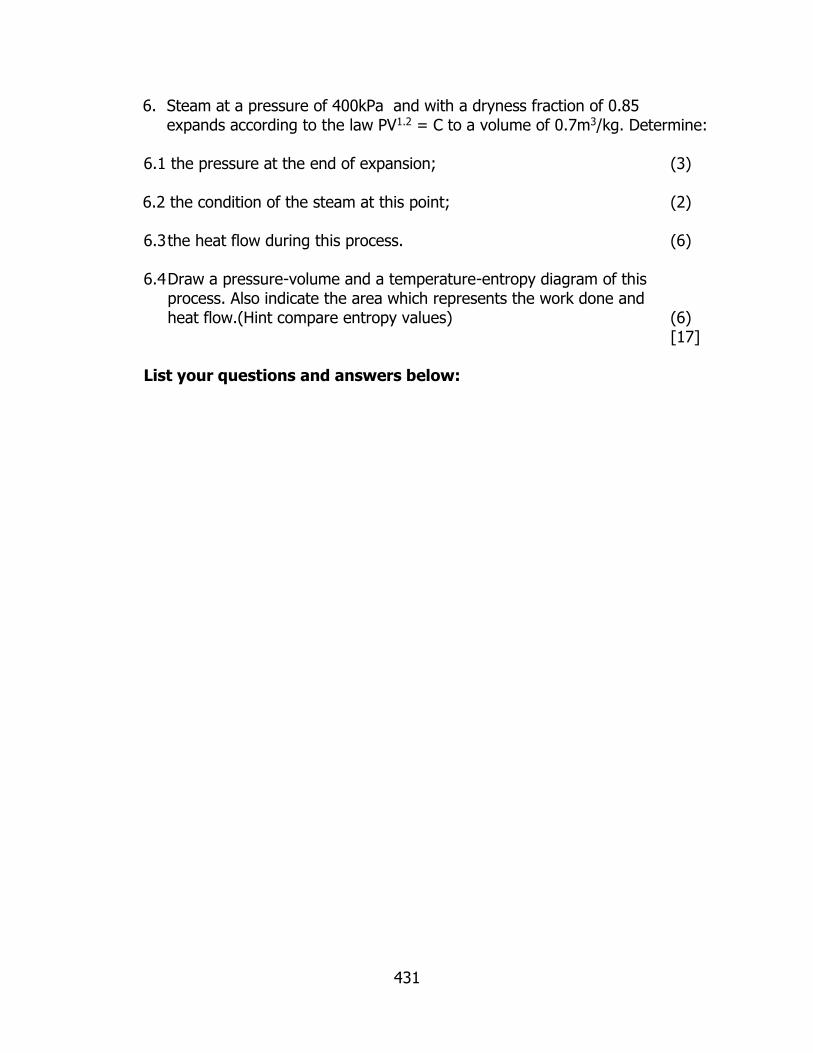
431
6. Steam at a pressure of 400kPa and with a dryness fraction of 0.85 expands according to the law PV1.2 = C to a volume of 0.7m3/kg. Determine:
6.1 the pressure at the end of expansion; (3) 6.2 the condition of the steam at this point; (2)
6.3 the heat flow during this process. (6)
6.4 Draw a pressure-volume and a temperature-entropy diagram of this
process. Also indicate the area which represents the work done and heat flow.(Hint compare entropy values) (6)
[17] List your questions and answers below:

432
7. A combined separating and throttling calorimeter was used to determine the dryness fraction of the steam in the main steam pipe in which the pressure was 860kPa. The observations were:
Water collected in separator - 0.3kg/min
Steam condensed after throttling - 10kg/min Steam pressure after throttling - 140kPa Steam temperature after throttling - 1300C Specific heat capacity of steam - 2.1kJ/kgK
Determine: 7.1 the dryness fraction of the steam in the main steam pipe. (8) 7.2 Draw the throttling process on a Mollier chart with all relevant detail. (3)
[11] List your questions and answers below:

433
8. A boiler fitted with a super-heater generates 1800kg of steam per hour at a pressure of 11bar and temperature of 2500C, from feed water at 900C. The dryness fraction of the steam as it enters the super-heater is 0,98. The has a calorific value of 26 000kJ/kg, and is consumed at a rate of 467kg/hr. Calculate:
8.1 the thermal efficiency of the boiler; (4) 8.2 the percentage of the fuel heat supplied in the combustion chamber,
absorbed by the steam in the super-heater tubes; (5)
8.3 the equivalent evaporation from and at 1000C. Briefly discuss the meaning of this value. (3) [12] List your questions and answers below:

434
9. A steam plant consists of an economiser, boiler, super-heater and air pre-heater. The coal used has a calorific value of 3600kJ/kg and the ratio of air to fuel by mass is 18:1. Air enters the air pre-heater at 160C and leaves at 200C. Feed water enters the economiser at 460C and leaves at 1800C. Steam enters the super-heater 0.97 dry and leaves at 2600C. The pressure in the boiler is 2MPa. Steam is generated at the rate of 2300kg/hr. The specific heat capacity for air is 1.005kJ/kgK and that for the flue gas is 1.045kJ/kgK. The fuel consumption is 2000kg/hr.
9.1 Make a neat line sketch of the plant indicating the flow of air, steam and flue gases. (5)
9.2 Calculate the heat transfer per kilogram of fuel used, in the economiser, boiler, super-heater and air pre-heater. (9)
9.3 Calculate the plant efficiency. (2) 9.4 Calculate the equivalent evaporation from and at 1000C per kilogram fuel burnt. (2)
9.5 Calculate the temperature of the flue gases leaving the combustion chamber. (2)
[20] List your questions and answers below:

435
10 Consider a steam power plant that operates on a simple ideal Rankine cycle and has a net power output of 20MW. Steam enters the turbine at 7MPa and 5000C and is cooled in the condenser at a pressure of 10kPa by running cooling water from a lake through the tubes of the condenser at a rate of 1750kg/s. 10.1 Illustrate this process on a temperature-entropy diagram with all relevant detail. (3) Determine: 10.2 the Rankine efficiency of the cycle; (5) 10.3 the mass flow rate of steam; (2) 10.4 the temperature rise of the cooling water (2)
[12] List your questions and answers below:

436
11. A condenser receives wet steam at a pressure of 7kPa. The air leakage is 20kg/hr and take R = 0.287kJ/kgK. Mass of cooling water is 1140kg/min
and mass of the condensate is 2360kg/hr at a temperature of 36.20C. The barometer reading is 641mmHg and the rise in the cooling water temperature is 18.10C.
Calculate: 11.1 the volume of air removed per minute if: 11.1.1 a wet air pump is used; (4) 11.1.2 a dry air pump is used with a suction tube temperature of 32.90C; (4) 11.2 the dryness fraction of the exhaust steam; (3) 11.3 the vacuum gauge reading; (2) 11.4 the number of tubes for this two pass surface condenser, if the internal diameter of the pipes is 13 mm and the water speed is 3 m/s. (3) [16]
List your questions and answers below:

437
12. The air leakage into a surface condenser operating with a steam turbine
is estimated as 84kg/hr. The vacuum near the inlet of the air pump is
700mmHg when the barometer reads 760mmHg. The temperature at
the inlet of the air pump is 200C. Calculate:
12.1 the minimum capacity of the air pump; (7)
12.2 the dimensions of the reciprocating air pump to remove the air if it runs at 200rpm. Take diameter: stroke = 3:2 and the
volumetric efficiency as 100 %; (4)
12.3 the mass of vapour extracted per minute. (3)
12.4 If the air suction spout temperature is reduced to 160C, determine
the how much condensate is saved over a period of 30 days with the
plant running continuously. (7)
[21]
List your questions and answers below:
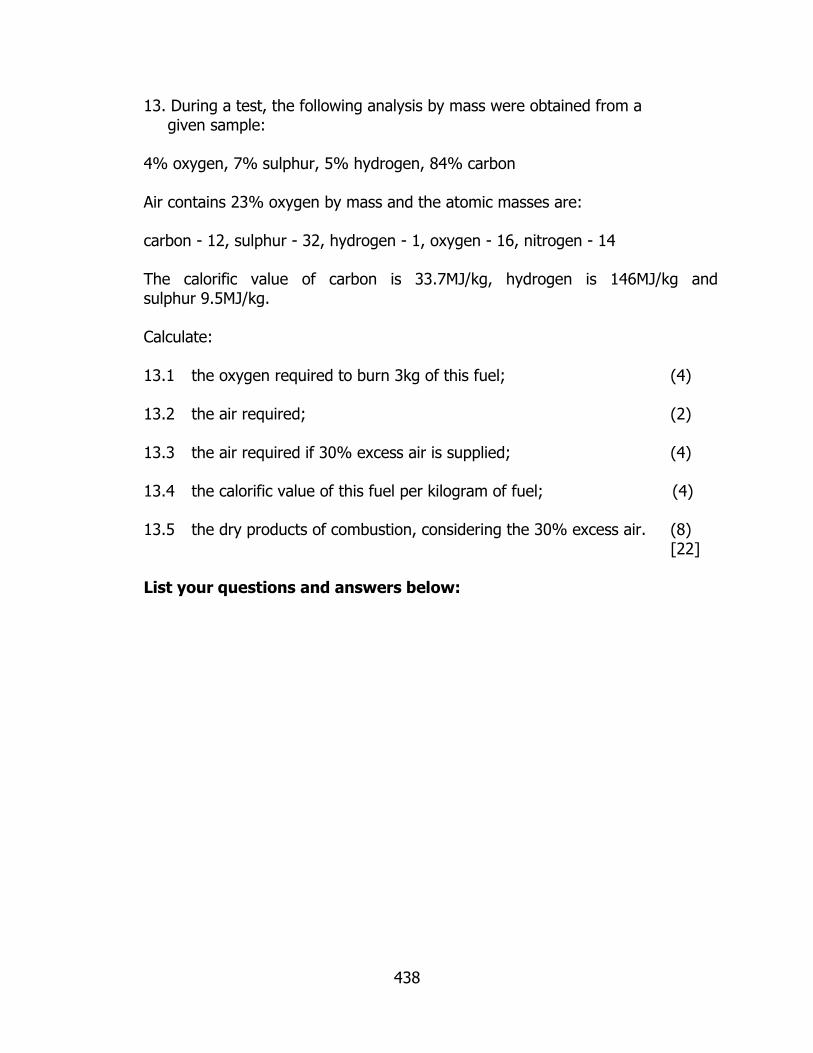
438
13. During a test, the following analysis by mass were obtained from a given sample:
4% oxygen, 7% sulphur, 5% hydrogen, 84% carbon Air contains 23% oxygen by mass and the atomic masses are: carbon - 12, sulphur - 32, hydrogen - 1, oxygen - 16, nitrogen - 14 The calorific value of carbon is 33.7MJ/kg, hydrogen is 146MJ/kg and sulphur 9.5MJ/kg. Calculate: 13.1 the oxygen required to burn 3kg of this fuel; (4) 13.2 the air required; (2) 13.3 the air required if 30% excess air is supplied; (4) 13.4 the calorific value of this fuel per kilogram of fuel; (4) 13.5 the dry products of combustion, considering the 30% excess air. (8)
[22] List your questions and answers below:

439
14. An experiment was performed with a fuel mixture consisting of the following: 44% C8H18 (n-octane), 1% S, 55% C6H6 (benzene), 5% O2 Air contains 23% oxygen by mass and the atomic masses are: carbon - 12, sulphur - 32, hydrogen - 1, oxygen - 16, nitrogen - 14 Calculate from first principles (show chemical reactions): 14.1 the air required; (10) 14.2 the amount of nitrogen released into the atmosphere after complete combustion of each kilogram of this fuel; (1) 14.3 the products of combustion, by volume. (10) [21] List your questions and answers below:
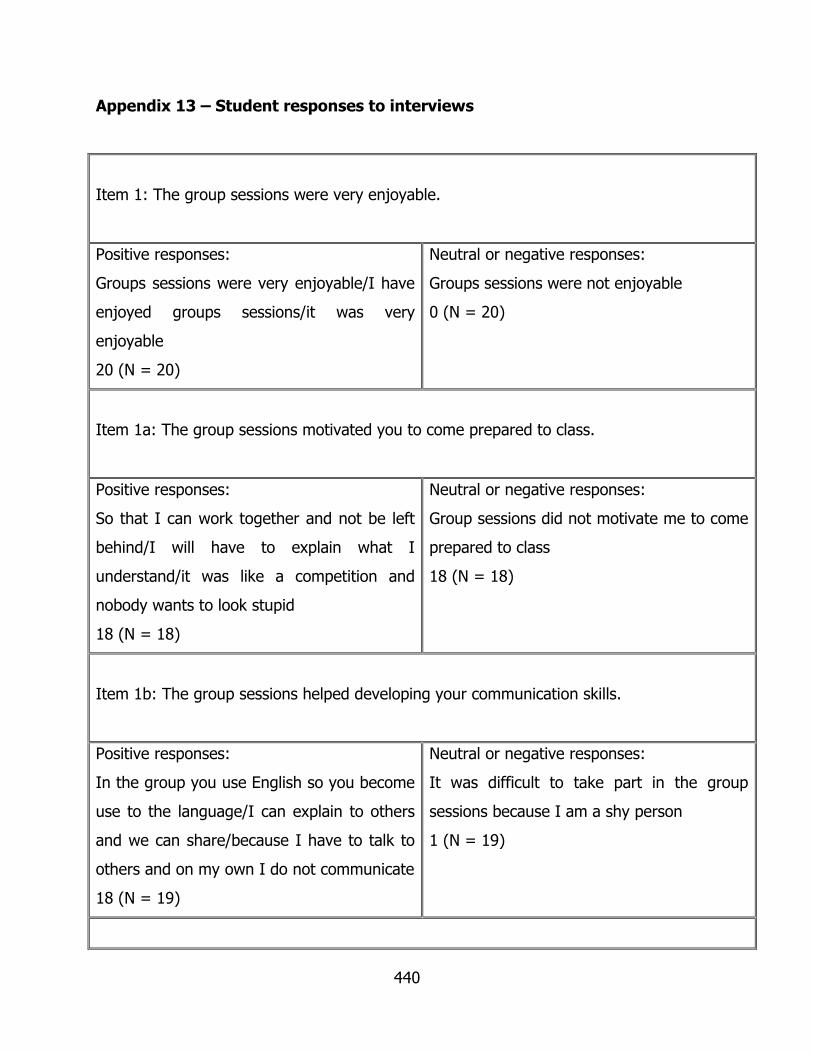
440
Appendix 13 – Student responses to interviews
Item 1: The group sessions were very enjoyable.
Positive responses:
Groups sessions were very enjoyable/I have
enjoyed groups sessions/it was very
enjoyable
20 (N = 20)
Neutral or negative responses:
Groups sessions were not enjoyable
0 (N = 20)
Item 1a: The group sessions motivated you to come prepared to class.
Positive responses:
So that I can work together and not be left
behind/I will have to explain what I
understand/it was like a competition and
nobody wants to look stupid
18 (N = 18)
Neutral or negative responses:
Group sessions did not motivate me to come
prepared to class
18 (N = 18)
Item 1b: The group sessions helped developing your communication skills.
Positive responses:
In the group you use English so you become
use to the language/I can explain to others
and we can share/because I have to talk to
others and on my own I do not communicate
18 (N = 19)
Neutral or negative responses:
It was difficult to take part in the group
sessions because I am a shy person
1 (N = 19)
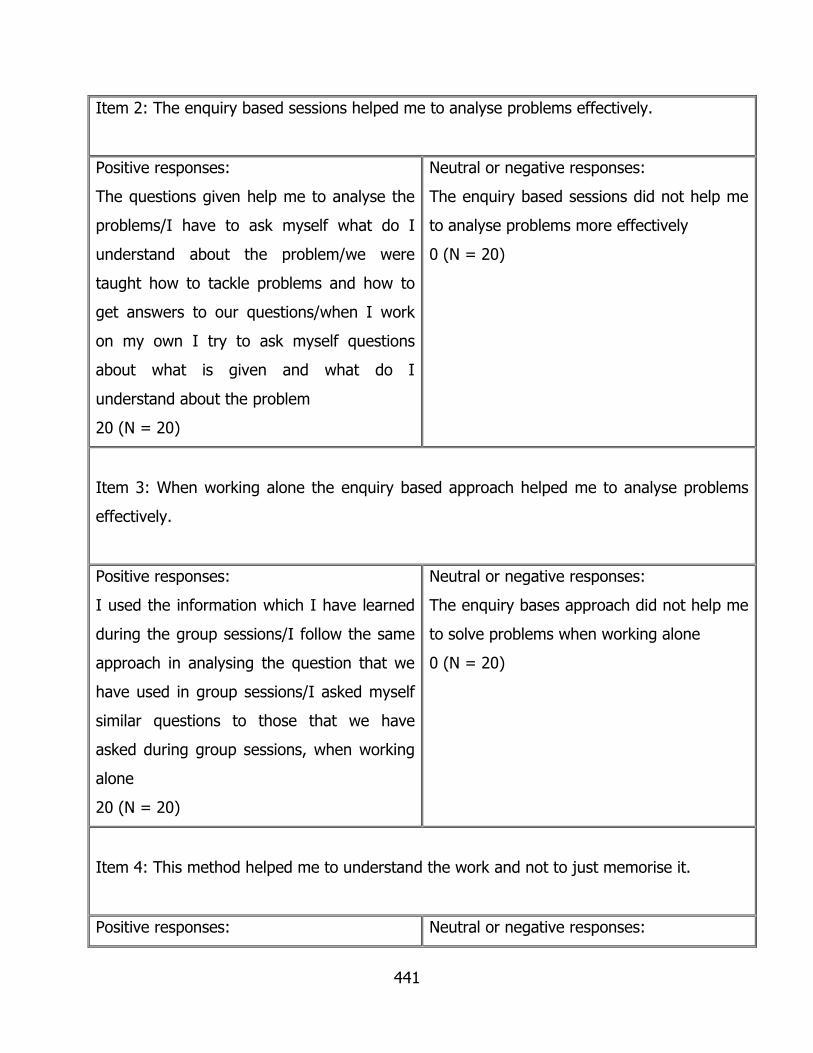
441
Item 2: The enquiry based sessions helped me to analyse problems effectively.
Positive responses:
The questions given help me to analyse the
problems/I have to ask myself what do I
understand about the problem/we were
taught how to tackle problems and how to
get answers to our questions/when I work
on my own I try to ask myself questions
about what is given and what do I
understand about the problem
20 (N = 20)
Neutral or negative responses:
The enquiry based sessions did not help me
to analyse problems more effectively
0 (N = 20)
Item 3: When working alone the enquiry based approach helped me to analyse problems
effectively.
Positive responses:
I used the information which I have learned
during the group sessions/I follow the same
approach in analysing the question that we
have used in group sessions/I asked myself
similar questions to those that we have
asked during group sessions, when working
alone
20 (N = 20)
Neutral or negative responses:
The enquiry bases approach did not help me
to solve problems when working alone
0 (N = 20)
Item 4: This method helped me to understand the work and not to just memorise it.
Positive responses: Neutral or negative responses:

442
We share information and analyse the
problem so we understood what to do/group
discussions helped us to understand the
work/we were able to use questions to
analyse new problems
20 (N = 20)
This method did not help me to understand
the work and I still have to memorise it
0 (N = 20)
Item 5: This method helped me develop the ability to solve problems on my own.
Positive responses:
When alone use the same approach that
have been used during group sessions,
analyse the new problem by asking
questions/you have many methods of
approaching the problem and how to ask
questions that leads you to ways to solve the
problem/asking question gives me more
information about a problem
20 (N = 20)
Neutral or negative responses:
This method did not help me to develop the
ability or to improve my ability to solve
problems
0 (N = 20)
Item 6: The Thermodynamics booklet with questions and answer helped me to understand
the work better.
Positive responses:
The layout and explanations in the booklet
helped us to understand new work better/
Neutral or negative responses:
The Thermodynamics booklet did not help to
understand the work better
0 (N =20)

443
Item 7: The Thermodynamics booklet’s additional questions and answers helped me to
understand and analyse new problems better.
Positive responses:
The additional questions in the booklet
assisted us to analyse new problems/the
additional questions helped me to gain more
information about the problem
4 (N = 4)
Neutral or negative responses:
The booklet with the additional questions
and answers did not help to understand and
analyse new problems better
0 (N = 4)
Item 8: This method can help me to understand other courses better.
Positive responses:
Yes because in other course the lecturer just
talks and walk out/ in other subjects you
don’t get a chance to analyze the question
but you just memorize the formulas and
substitute it, but the core information you
don’t know
20 (N =20)
Neutral or negative responses:
This method cannot help to understand
other course better
0 (N = 20)
Item 9: Any positive or negative comments on your overall experience compared to the
traditional teaching method.
Positive responses:
I think this one is very good, because when
you are going to school or class what you
need most is understanding/now I learnt
Neutral or negative responses:
Any negative comments on your overall
experience
0 (N =20)

444
how to tackle questions I learned to do
things
20 (N = 20)
Item 10: Did this method give you positive attitude towards the course?
Positive responses:
because in understanding Thermodynamics
that made me enjoy it a lot in fact I realized
it is a very exciting course/ I mean you
always like something that you are good at/
it gave me a way of how to approach a sum
how to ask questions that are relevant that
will lead you to answer the question
20 (N = 20)
Neutral or negative responses:
This method did not give me a positive
attitude towards the course
0 (N = 20)

445
Appendix 14 – Electronic Thesis & Dissertations (ETD) and Plagiarism
Requirements
WALTER SISULU UNIVERSITY
DIRECTORATE OF POSTGRADUATE STUDIES
MANDATORY CONSENT FORM: ELECTRONIC THESES & DISSERTATIONS (ETD) AND PLAGIARISM
REQUIREMENT (For postgraduate research outputs from 2009 September)
THE STUDENT AND SUPERVISOR CONSENT FOR PUBLICATION OF ELECTRONIC RESEARCH OUTPUT ON INTERNET
AND WSU INTRANET
FACULTY: EDUCATION
QUALIFICATION NAME: DOCTOR OF EDUCATION ABBREVIATION: D.Ed. YEAR: 2012
STUDENT’S FULL NAME: CHRISTOFFEL LOUW STUDENT NUMBER: 209187158
TYPE OF RESEARCH OUTPUT: THESIS
TITLE OF THE RESEARCH OUTPUT: ‘THE EFFECT OF A GUIDED ENQUIRY BASED LEARNING APPROACH ON
MECHANICAL ENGINEERING STUDENTS’ UNDERSTANDING OF THERMODYNAMICS’
CONSENT: I HEREBY GIVE MY CONSENT TO WALTER SUSULU UNIVERSITY TO PUBLISH MY RESEARCH OUTPUT FOR
THE QUALIFICATION ABOVE ON THE WSU INTRANET AND INTERNET. I CERTIFY THAT TO THE BEST OF MY
KNOWLEDGE, THERE IS NO PLAGIARISM IN THE RESEARCH OUTPUT AS SUBMITTED. I HAVE TAKEN REASONABLE
CARE TO ENSURE THAT THE RESEARCH OUTPUT MEETS THE QUALITY LEVEL EXPECTED FOR THE PRESENT
QUALIFICATION LEVEL BOTH IN TERMS OF CONTENT AND TECHNICAL REQUIREMENTS. I FULLY UNDERSTAND THE
CONTENTS OF THIS DECLARATION.
___________________________________ _______________________________
SIGNATURE OF STUDENT DATE
ENDORSEMENTS BY:
SUPERVISOR:
FULL NAME: ____________________________________SIGNATURE:___________________________
DATE: _______________

446
CO-SUPERVISOR(S):
1 FULL NAME: _________________________________SIGNATURE:________________________________
DATE: _______________
2. FULL NAME: ________________________________SIGNATURE:___________________________________
DATE: _______________