the effect of accounting versus economic determinants on ... · the effect of accounting versus...
TRANSCRIPT
The Effect of Accounting versus Economic Determinants on the use of
Broad-based Option Plans
Hemang Desai* Edwin L. Cox School of Business
Southern Methodist University (214) 768-3185 [email protected]
Zining Li
Edwin L. Cox School of Business Southern Methodist University
(214) 768-9293 [email protected]
and
Suning Zhang
Department of Accounting School of Management
George Mason University (703) 993-1804
First Draft: August, 2009
Current Draft: February 11, 2010
Comments Welcomed
_______________________________________________________________________ *Corresponding author. We acknowledge helpful comments from Swami Kalpathy, Mary Stanford, Ram Venkataraman, and seminar participants at SMU and TCU. We thank Simi Kedia and Shiva Rajgopal for sharing their Unemployment Data for Metropolitan Statistical Areas. We thank Preeti Chaudhary, Shiva Rajgopal, and Mohan Venkatachalam for sharing the sample of firms that voluntarily adopted expensing employee options before 2005.
Abstract Accounting for employee stock options has been one of the most controversial accounting standards in recent years. It has been argued that favorable accounting treatment of options resulted in excessive (and inefficient) use of options in employment agreements. In this paper we examine whether accounting or economic considerations were the primary drivers of the dramatic increase in the use of options in the 1990s as well as the recent decline in the use of stock options subsequent to the issuance of SFAS 123R. Our analysis over the period 1995-2007 shows that economic and labor market considerations such as attracting optimistic employees, employee retention, and tightness of labor markets are strongly associated with broad-based option grants but we do not find any reliable evidence of an association between financial reporting costs and employee stock option grants. The analysis of annual change in option grants and the change in option grants following the adoption of SFAS 123R shows that the change in option grants is associated with contemporaneous changes in economic and labor market factors but there is no reliable association between change in option grants and change in financial reporting costs. Overall, our results are consistent with economic factors as opposed to accounting considerations being the primary drivers of option grants.
1
1. Introduction
The use of stock options in compensation contracts for the top management as well as
for the rank-and-file employees increased dramatically in the 1990s and despite a decline in
recent years, it still represents a multi-fold increase from the early 1990s.1 This dramatic
growth in employee options has been highly controversial generating considerable interest
from academics, employees, politicians, practitioners, and regulators. The controversy is
centered on the determinants of employee option grants and in particular on the role of
accounting in determining the use of option grants. A key aspect of this controversy is
whether the growth in employee options in the 1990s is driven by economic/labor market
factors or that favorable accounting treatment encouraged “excessive” use of employee stock
options. Similarly, is the recent reduction in option grants by firms due to the expensing
requirement of options mandated by SFAS 123R or due to changes in economic and labor
market conditions? It is important to address these questions because if favorable accounting
caused firms to overweight options in compensation contracts then it implies that incentive
contracts were inefficient and that firms dissipated significant shareholder value in order to
increase short-term accounting earnings.2 It is not clear why such inefficient contracts would
persist for such a long period of time. Thus, Core, Guay and Larcker (2003) argue that the
role of accounting for employee options is not well understood and they call for future
research to examine the role of accounting in motivating the use of employee options.
1 For example, Hall and Murphy (2003) report that the grant date value of employee options for the S&P 500 firms increased from $11 billion in 1992 to $119 billion in 2000 and then fell to $71 billion in 2002 with over 90% of these grants going to employees that were not the top-five executives of the company. 2 Although SFAS 123 did not require mandatory expensing of employee options, firms were required to disclose in the footnotes the pro-forma earnings that reflected the fair value of options granted. Evidence in Aboody (1996) and Aboody et al. (2004a) suggests that the market takes the fair value of options into account in pricing a firm’s stock. Thus, it is not clear that there was a valuation benefit to firms of not expensing fair value of employee options.
2
In this paper we address these questions by examining the relation between employee
option grants and financial reporting costs (benefits) while controlling for the economic and
labor market determinants of employee option grants. To mitigate the concern that we may
have omitted some unknown determinants of option grants, we relate annual change in option
grants to corresponding changes in economic/labor market factors and to changes in financial
reporting costs (benefits). Finally, we relate the change in option grants subsequent to the
issuance of SFAS 123R to changes in economic and labor market conditions during that time
to determine whether reduction in option grants is due to mandatory expensing of options or
due to contemporaneous changes in economic and labor market conditions. 3 Thus, our
analysis allows us to evaluate the relative importance of economic/labor market
considerations versus financial reporting considerations in determining the magnitude of
employee option grants.
The traditional argument in favor of stock options is that option compensation
mitigates agency conflicts by aligning the incentives of the managers with those of the
shareholders by linking the managers’ pay to stock market performance of the firm (Jensen
and Meckling 1976). Other economic considerations influencing the use of options include
the presence of growth options, information asymmetry, monitoring costs, liquidity
constraints, etc. (Demsetz and Lehn, 1985, Smith and Watts, 1992). While the above factors
help explain option grants for executives, it should be noted that over 90% of the option
3 On March 12, 2003, FASB added accounting for stock-based compensation to its agenda and announced new option expensing requirement likely effective for 2004 (SFAS 123R). In October 2004, FASB delayed the effective date of the new statement to June 15, 2005, under pressure from firms already burdened by Sarbanes-Oxley deadlines. On April 14, 2005 the SEC delayed the effective date of SFAS 123R for many public companies. Public companies did not have to begin complying with SFAS 123R until the first quarter of the first fiscal year beginning after June 15, 2005 (December 15, 2005 for “small business issuers”), rather than the first quarterly or annual period beginning after that date, as originally prescribed by SFAS123R.
3
grants are made to non-executive employees. Such broad-based option grants are difficult to
reconcile within an incentive/agency framework as it is not clear whether actions of lower-
ranked employees can directly influence firm value. Moreover, for any increase in
employees’ effort induced by option compensation, the costs of increased risk imposed and
incentives to free ride are likely to dominate the benefit of increased efforts (Oyer 2004).
Thus, financial economists have attempted to provide alternate economic rationale for the
prevalence of broad-based option plans. One of the arguments suggests that broad-based
option grants help attract optimistic employees (Oyer and Schafer, 2005). Employees or
potential employees that have favorable beliefs about a firm’s prospects would assess its stock
options at a higher value than their cash equivalent amount of cash or restricted stock. Firms
thus can save on compensation costs by using stock options to attract these employees. The
firm also benefits if optimistic employees are more likely to invest in firm-specific human
capital. A second argument suggests that the use of stock options also helps the firm with
employee retention as options serve to index an employee’s compensation to outside
opportunities (Oyer, 2004). Furthermore, employee attraction and retention are likely to be
particularly important in tight labor markets and hence the use of options is expected to be
higher in tight labor markets. Consistent with the above predictions, several recent empirical
studies provide evidence supporting the attraction and retention benefit of employee options
(Core and Guay, 2001; Ittner et al., 2003; Oyer and Schaefer, 2005; Bergman and Jenter, 2007;
Kedia and Rajgopal, 2009; and Hodge et al., 2009).
In contrast, Hall and Murphy (2003) claim that the magnitude of options granted to
non-executive employees in 1990s was too large to be efficient regardless of possible
attraction and retention benefits. They argue that since accounting treatment (prior to SFAS
4
123R) required expensing of all employee compensation but not stock options, the financial
reporting benefits of stock options motivated firms to grant options excessively: firms would
prefer granting options if they perceive that the benefits of higher reported earnings outweigh
the increased economic costs of options. This argument implies that if accounting
considerations influence option compensation, firms with higher reporting concerns are likely
to grant more options because of the larger accounting benefits. Stated differently, it suggests
that cross-sectional variation in option grants at a given point in time is related to differences
in financial reporting costs (benefits) across firms. Prior evidence suggests that firms are
under pressure by capital markets to maintain a string of consecutive earnings increases, or to
persistently meet or beat analysts’ earnings expectations in consecutive quarters (Barth et al.,
1999; Bartov et al., 2001; Beatty et al., 2002). Extant evidence also finds that firms engage in
manipulations of accounting accruals or real activities in order to achieve higher reported
earnings when they are close to violating debt covenants (Dyreng, 2009). Therefore,
accounting and finance literature has employed a combination of firm characteristics to
capture financial reporting costs including persistence in meeting or beating analysts’ earnings
expectations, frequent occurrence of earnings increases, imminent need of access to capital
markets (equity or debt), and the current interest burden (measured by leverage or interest
coverage ratio).4
As evidence in support of the impact of accounting treatment on the use of stock
options, Carter et al. (2007) report a positive association between financial reporting costs and
the use of options in CEO compensation over the period 1995-2001. They also suggest that
firms that decided to start expensing stock options voluntarily in 2002 or 2003 have reduced
4 Examples include Matsunaga (1995), Yermack (1995), and more recently Carter et al. (2007).
5
option grants to their CEOs. Brown and Lee (2007) examine the change in executive option
grants around the issuance of SFAS 123R and find that the reduction in options granted to top
executives is related to the extent to which firms relied on the favorable treatment of stock
options to meet their financial reporting objectives. Based on the above results, the
aforementioned papers conclude that financial reporting considerations significantly
influenced the magnitude of employee option grants. However, in relating option grants to
financial reporting considerations, the above studies do not control for the economic and labor
market determinants that are particularly relevant for option grants to non-executive
employees. Furthermore, the above studies examine only option grants to either the CEO or
the top-five executives. Given that option grants to non-executives comprise over 90% of the
total option grants made by a typical firm, the impact on reported earnings from option grants
(if they were expensed) would be better represented by the fair value of grants made to non-
executive (rank-and-file) employees rather than to the CEO or top executives. 5
Our results show that economic and labor market considerations such as employee
sentiment, attracting optimistic employees (sorting) and employee retention significantly
influence broad-based option grants not only in the period before SFAS 123R when options
were not required to be expensed (1995-2004) but also in the period subsequent to the
issuance of SFAS 123R when all firms are required to expense options (2005-2007).
However, there is no reliable association between financial reporting costs and broad-based
option grants in either sub-period.6 This suggests that accounting considerations were not the
5 In our sample, the number of option granted to the CEO accounts for about 5% of total options granted to all employees over 1995-2007. 6 Our results are not sensitive to the exclusion of firms that started to voluntarily expense stock options during 2002-2004. In addition, we also analyze this sample of firms separately and find that sentiment, sorting and retention considerations significantly influence option grants at these firms but we find no significant association between financial reporting costs and option usage for this sample of firms.
6
primary drivers of broad-based option grants, instead economic and labor market related
considerations appear to be the key drivers of employee stock options. An analysis of year-
to-year change in option grants shows that the change in option grants is significantly related
to changes in proxies for employee sentiment, sorting, employee retention and tightness of
labor markets but there is no reliable association between changes in financial reporting costs
and the change in option grants. Finally, we examine the assertion that firms reduced option
grants following their decision to expense options (either voluntarily or following the
effective date of SFAS 123R). The results show that the change in option grants following
the decision to expense options is not related to change in financial reporting costs. Instead,
contemporaneous changes in economic and labor market factors discussed above continue to
be significantly related to the change in option grants subsequent to SFAS 123R. Thus, our
results show that the recent the change in option grants are better explained by corresponding
changes in economic and labor market conditions than the requirement to expense employee
options.
We recognize and acknowledge the difficulty to empirically measure a firm’s concern
over reported earnings and that our proxy, though based on extant research, may not fully
capture financial reporting costs. Moreover, extant research has identified special situations
where financial reporting concerns seem to have influenced compensation decisions. 7 As a
result, we do not claim that accounting considerations do not influence the design of incentive
compensation but at a minimum, our results suggest that economic and labor market
considerations played a far more important role in option grants than accounting
7 Extant research has identified situations where financial reporting considerations have affected firm’s compensation decisions. Carter et al. (2003) show that firms accelerated option repricing prior to December 15, 1998 to avoid recognizing an expense and Choudhary et al. (2009) find that firms accelerated vesting of employee options prior to effective date of SFAS 123R to avoid recognizing an expense.
7
considerations. Thus, our results are comforting as they suggest that the economic costs, if
any, incurred by firms to obtain favorable accounting treatment (dead weight costs) appear to
be far less than what has been widely perceived (Hall and Murphy, 2002; Carter et al., 2007).
The remainder of this paper is organized as follows: the next section provides
background information and motivations for this study; section 3 discusses the data, variable
measurement, and empirical design; section 4 describes our findings; and section 5 concludes
the paper.
2. Background and motivation
In a seminal article Jensen and Murphy (1990) argue that U.S. CEOs were paid like
bureaucrats in the sense that their compensation showed little variability relative to changes in
shareholder wealth.8 As a result of poorly aligned incentives, the CEOs had more incentive to
grow the size of the firm and consume perks rather than increase shareholder value. In the
two decades subsequent to the publication of Jensen and Murphy (1990), the compensation of
a U.S. CEO has changed dramatically. The grant-date value of stock options awarded to a
CEO of a S&P 500 firm went from close to zero in 1970 up to $7 million in 2000, and fell
back to $4 million in 2002 (Jensen, Murphy, and Wruck, 2004). An even more dramatic
statistic reported by Jensen et al. (2004) is that for the sample of S&P 500 firms, the grant-
date value of options grew from $22 million per company in 1992 to $238 million in 2000
(falling to $141 million in 2002). Of the grants made in 2002, the top-five executives on
average received 9.5% of these grants while the employees ranked below the top five received
90.5%. Thus, overwhelming majority of the option grants were made to employees that were
8 Their estimate of the pay-performance relation indicates that CEO wealth changes $3.25 for every $1,000 change in shareholder wealth.
8
not among the five highest compensated employees of the company. However, such broad-
based grants are difficult to reconcile within an incentive/agency framework as it is not clear
how lower-ranked employees can take actions that directly affect firm value. This dramatic
growth in employee options coupled with the inability to reconcile this growth within an
agency/incentive based framework has made employee options highly controversial. One
explanation suggested by Hall and Murphy (2002) and Jensen et al. (2004) for excessive
option grants is that executives and the Boards believed that employee stock options were
essentially free as they incurred no accounting charge or cash outlay. Thus, favorable
accounting treatment of stock options may have contributed to excessive use of options in pay
packages of not only the CEOs but also of lower level employees.
Prior research has examined whether the use of option grants is consistent with
incentive, agency, and financial reporting considerations. Yermack (1995) summarizes ten
studies from the 1980s and early 1990s that address these issues. These studies examine
periods prior to 1990 which were before the significant increase in the use of options.
Moreover, most of these studies examine small samples and report conflicting results making
it difficult to draw reliable inferences. Using a sample of stock option awards to CEOs,
Yermack (1995) tests several theories of determinants of stock options. His results are
generally inconsistent with theoretical predictions and he concludes that either the
corporations do not follow optimal compensation policies or that the extant theories of
optimal compensation are either incomplete or incorrect. Bryan et al. (2000) extend the
analysis by examining a later time period (1992-1997) and examining both restricted stock
awards and option grants. They find that agency costs and liquidity constraints appear to
9
influence option grants but do not find support for financial reporting costs being the driver of
option grants.
In contrast to prior research that relied on a single variable such as the interest
coverage ratio or whether earnings are above or below a threshold to proxy for financial
reporting costs, Carter et al (2007) develop a comprehensive proxy for a firm’s financial
reporting costs. This proxy (explained in detail later) incorporates a multitude of reasons why
a firm might perceive expensing fair value of option grants to have significant financial
reporting costs. They re-examine the association between financial reporting costs and CEOs’
option and restricted stock grants for a sample of Execucomp firms (S&P 1500) over the
period of 1995-2001. Their results show that their proxy for reporting costs is positively
related to the fair value of option grants to CEOs and negatively related to CEOs’ restricted
share grants. Based on this finding they conclude that favorable accounting treatment of
options likely led to the overweighting of options in CEO compensation. Brown and Lee
(2007) provide evidence on the impact of accounting considerations on the use of stock
options by examining the change in stock option grants to the top-five executives subsequent
to the issuance of SFAS 123R. They find that the reduction in option grants is greater for
firms that have tighter earnings-based debt covenants, or greater incentives to achieve certain
earnings benchmarks. Thus, their results suggest that financial reporting considerations
caused firms to reduce their option grants subsequent to the issuance of SFAS 123R.
In addition to the previously discussed motivations for granting employee options,
recent research has proposed three (non-mutually exclusive) additional explanations for the
broad-based option grants – employee sentiment, sorting, and retention. When employees
have heterogeneous expectations about the prospects of a firm, an options based
10
compensation plan facilitates sorting by attracting optimistic employees if optimistic
employees overvalue stock options and hence prefer a levered position in the firm. This
allows the firm to reduce its compensation cost by selling equity to employees who attach a
high valuation to it (Oyer and Schaefer, 2005; Bergman and Jenter, 2007). Arya and
Mittendorf (2005) also argue that firms use options to attract optimistic employees from the
labor pool. Consistent with the above predictions, several studies show that optimistic
employees tend to overvalue their employer’s stock and option grants. For example, a survey
of middle level managers and future entry-level managers in Hodge et al. (2009) shows that
managers consistently over- value stock options relative to the Black-Scholes value and
relative to the value of restricted stock. Benartzi (2001) shows that employees’ equity
holdings in 401(K) plans are affected by employees’ sentiment towards their employers. For
example, employees of a firm with poor stock performance over the previous ten years on
average allocate only 10% of their contributions to the company’s stock, while employees of a
company that have experienced the strongest performance over the previous ten years allocate
40% of their contributions to their company’s stock. This suggests that a company’s past
performance affects an employee’s sentiment towards the company and that employees
exhibit a stronger preference for the equity of their employer if the firm has done well in the
past. Consistent with this prediction, Bergman and Jenter (2007) show that employee option
grants are positively associated with the past stock performance of a firm.
The retention argument for the use of stock options suggests that if an employee’s
outside opportunities are positively correlated with the firm’s (employer’s) stock price then
options serve to index an employee’s deferred compensation to his/her outside opportunities
thereby providing an effective retention mechanism (Oyer, 2004). Under the assumption that
11
labor markets for rank-and-file employees are geographically segmented, Kedia and Rajgopal
(2009) provide evidence consistent with the retention hypothesis. They find that firms whose
stock prices co-move more with other firms in the same geographic area tend to grant more
options to rank–and-file employees. Also, survey data reported in Ittner et al. (2003) indicate
that employee retention is an important driver of broad-based options grants. Furthermore,
employee attraction and retention are especially critical in tight labor markets and firms may
grant more rank-and-file options when the labor markets are tight (Mehran and Tracey, 2001).
The above discussion suggests that the tests of whether accounting considerations
were the primary drivers of increased option grants during the 1990s are mis-specified unless
other known drivers of option grants such as employee sentiment, sorting, retention and labor
market considerations are controlled for. However, prior research examining the association
between financial reporting costs and employee options does not control for these
economic/labor market determinants. Furthermore, prior research addressing this issue has
generally focused on option grants to CEOs or the top-five executives. However, as
mentioned earlier, almost 90% of the total option grants issued by firms are granted to non-
executive employees suggesting that if financial reporting costs influence the magnitude of
options grant, then they are more likely to affect the option grants to non-executive employees
rather than to executives. Thus, we add to the literature by examining non-executive option
grants in testing the role of financial reporting costs in influencing the magnitude of option
grants and by controlling for additional economic and labor market considerations that have
been shown to influence options grants to non-executive employees. To account for the
possibility that we may not have fully captured all of the determinants of employee options,
we relate the year-to-year change in option grants to corresponding changes in explanatory
12
variables. This analysis mitigates the concern that our results may be affected by some
omitted unknown firm specific characteristics. In addition, we also examine the change in
option grants subsequent to the decision to expense options (either voluntarily or pursuant to
SFAS 123R) to test whether the reduction in option grants subsequent to expensing options is
due to increased financial reporting costs or due to changes in economic/labor market
considerations. Lastly, it is important to note that option grants increased dramatically in the
1990s and started to decline around the year 2001 while options were not required to be
expensed until 2005. This time-series variation is difficult to reconcile within an accounting
based explanation. Our results show that once additional economic determinants of employee
options are controlled for, there does not appear to be a reliable association between employee
options and financial reporting costs.
3. Data Sources, Variable Definitions, and Research Design
3.1. Sample
Our sample starts with all firms covered by the ExecuComp database over 1995-2007
and is matched with financial information from Compustat and stock return data from CRSP.
The ExecuComp database provides information on annual compensation and equity holdings
of the five highest-paid executives for all firms in the S&P 500, S&P MidCap, and S&P
SmallCap stock indices starting from 1992. To ensure availability on observations, we follow
Carter et al. (2007) and begin our sample period in 1995.
We measure the value of stock options as the Black-Scholes value. Such information is
available through ExecuComp for options granted to top-five executives. However, there is
no direct information available on either the number or dollar value of options granted to non-
executive employees. Instead, prior to 2006, ExecuComp reported the percentage that each
13
option grant issued to an executive represented of all options granted by a firm in the year.
We use this information (variable “pcttotop”) and extrapolate the number of total options
granted by a firm to all employees in a year.9 Subtracting the number of options granted to top
executives yields the number of options granted only to non-executive employees. We then
use the modified Black-Scholes formula that accounts for dividend payouts (Merton, 1973) to
calculate the option value.10 We follow Bergman and Jenter (2007) and use the midpoint of
the month high and the month low stock prices as the exercise or strike price assuming 1/12th
of the total number of options granted during the year are granted each month. The estimates
of dividend yield and stock price volatility are taken from ExecuComp. We set the option
maturity uniformly to ten years and use the 10-year monthly Treasury bill yield as the risk-
free rate. Finally, we calculate the per-employee value of options by dividing the total value
of options granted to non-executive employees by the average number of employees in a year.
From 2006 onward, ExecuComp began to report the estimated Black-Scholes value of total
options granted to all employees, but stopped providing the variable “pcttotopt”. Therefore,
for observations in year 2006 and 2007, we obtain the value of options to non-executives by
subtracting the value of options to executives from the value of total options.
Although ExecuComp also provides information on restricted stock grants to top
executives, there is no information for us to extrapolate an estimate of restricted stock grants
to non-executive employees. Due to this constraint, our analysis of restricted stock grants is
limited to CEOs. 9 Following Bergman and Jenter (2007), we delete all firm-years in which the sample standard deviation of the estimates of the total number of option grants is greater than 10% of the mean. 10 Option value=[Se-dTN(Z) − Xe-rTN(Z − σT(1/2))], where Z=[log(S/X)+T(r− d + σ2/2)]/σT(1/2), N is the cumulative probability function for the normal distribution, S is the price of the underlying stock, X is the exercise price of the option, σ is the expected stock-return volatility over the life of the option, r the risk-free interest rate (treasury yield corresponding to time-to-maturity), T is the time-to-maturity of the option in years, and d is the expected dividend rate over the life of the option.
14
3.2. Measures of Financial Reporting Concerns
In contrast to prior research that has generally relied on a single variable to proxy for
financial reporting costs, Carter et al. (2007) use a principal components approach and
construct two factors to capture financial reporting costs. The factor analysis is based on five
variables: (1) the frequency of meeting or beating analysts’ earnings forecasts (FREQMBE),
(2) the frequency of positive or zero earnings change (FREQEPSUP), (3) the expected
amount of equity issuance (ISSUE_EQ), (4) the expected amount of debt issuance
(ISSUE_DBET), and (5) current financial leverage (LEVERAGE). FREQMBE and
FREQEPSUP proxy for the capital markets pressure a firm might face to maintain a string of
strong earnings and thus represent concerns about the negative impact of expensing options
on earnings. FREQMBE is the frequency of a firm meeting/beating quarterly analysts’
forecasts over the past eight quarters. FREQEPSUP is the frequency over past eight quarters
when a firm’s quarterly EPS (reported as actual earnings at IBES) is at least as high as that of
the same quarter in the previous fiscal year.11 LEVERAGE is the ratio of total debt to total
assets calculated at the end of previous fiscal year. ISSUE_EQ and ISSUE_DEBT are intended
to capture a firm’s plan to access the capital markets in the near future and hence the concerns
about reported earnings. ISSUE_EQ (ISSUE_DEBT) is the expected sale of new equity (debt)
capital and calculated as the change in common equity (total debt) from year t to t+1.12 The
first factor, FINRPT1, comprises FREQEPSUP, FREQMBE, and LEVERAGE with respective
11 We obtain similar results when we measure FREQMBE (FREQEPSUP) as the frequency of a firm meeting/beating analysts’ forecasts (or last quarter’s earnings) over all the quarters that the firm is covered in the IBES database. 12 We calculate ISSUE_EQ as [(the increase from year t to year t+1 in Compustat #85 + Compustat #210+ Compustat #130 – Compustat #88)/Compustat #6]. If this calculation yields a negative number, we replace the value with 0. We calculate ISSUE_DEBT as [the increase from year t to year t+1 in (Compustat #34 +Compustat #9) /Compustat #6]. If this calculation yields a negative number, we replace the value with 0. We calculate LEVERAGE as [(Compustat #34 + Compustat #9) /Compustat #6] in year t-1. We obtain similar results if we measure ISSUE_EQ (ISSUE_DEBT) as the change in equity (debt) from year t-1 to t.
15
weights of 0.80, 0.81, and -0.51.13 The second factor, FINRPT2 is a linear combination of
ISSUE_EQ and ISSUE_DEBT with respective weights of 0.79 and 0.81.
3.3. Proxy for Employee Sentiment, Sorting, and Retention
Our proxies for employee sentiment, sorting (attraction), and retention are derived
from the extant finance literature. Bergman and Jenter (2007) argue that employees’ sentiment
towards a firm will be related to the firm’s past performance. Consistent with this prediction,
they find that option grants to rank-and-file employees are positively related to past
performance. Following their approach, we measure employee sentiment in year t as
annualized stock returns calculated from the beginning of year t-2 to the end of year t-1 using
CRSP monthly returns data.
Oyer and Schaefer (2005) identify two other economic determinants expected to
influence a firm’s broad-based option grants: (1) to attract optimistic employees by offering
them option-based compensation (sorting), and (2) to retain employees by indexing their
deferred compensation to outside employment opportunities (retention). Assuming potential
employees hold heterogeneous beliefs about a firm, the sorting hypothesis predicts that firms
can benefit by offering options to attract optimistic employees. Using the firm volatility as a
proxy for heterogeneity of expectations, sorting model predicts that high-volatility firms are
more likely to make broad-based option grants. We measure a firm’s stock return volatility
(FIRMVOL) as the standard variation of monthly stock returns (a minimum of 5 observations
is required) in year t. However, given that the (expected) volatility of a firm is also an input in
calculating the Black-Scholes value, we also use industry volatility as an alternative measure.
The industry volatility (INDVOL) is measured as the standard deviation of the monthly
13 Interestingly, LEVERAGE is negatively weighted in FINRPT2. Carter et al. (2007) interpret this result as firms with high frequency of meeting or beating earnings targets are not concerned about violating debt covenants but are relying heavily on equity financing (i.e. relatively low leverage ratio).
16
average returns for all CRSP firms in a given 3-digit SIC code industry. We exclude
observations for which there are less than eight firms available to construct average industry
returns. For each firm, we measure the industry volatility by the standard variation of
industry average monthly returns in year t (a minimum of 5 observations is required).
The retention hypothesis predicts that option plans will be more common at firms whose
returns are more closely related to the returns of other firms that compete for the same set of
employees. Based on the approach outlined in Oyer and Schaefer (2005), we construct a
variable, the industry volatility share (VOLSHR), to proxy for the retention benefit of stock
options. To construct this variable, we first run regressions of each firm’s monthly returns on
industry returns over a period of 12 months ending the last month of year t. We average the
R2 from these regressions and define this as a firm’s industry volatility share (VOLSHR). We
require a minimum of 12 observations for each regression. Drawing on the predictions in
Oyer (2004) that broad-based option grants serve to index the employee’s outside
opportunities, Kedia and Rajgopal (2009) show that local labor market conditions affect
firms’ decision to make broad-based option grants.
Finally, attraction and retention are particularly critical in tight labor markets. To
measure local labor market competition, we construct a variable UNEMP that represents the
unemployment rate in each metropolitan statistical area (MSA) where corporate headquarters
are located. We obtain the zip code of corporate headquarters from Compustat, and obtain the
total labor force and unemployment rate at the zip-code level from the U.S. Census Bureau.
We then match each zip code to a MSA and obtain total labor force and unemployed labor
force at the MSA level by summing up over all the zip-codes in each MSA. The MSA
unemployment rate is calculated by dividing unemployed labor force by the total labor force
17
at the MSA level.
3.4. Empirical specification
3.4.1. Analysis of option grants to non-executive employees
We estimate the following Tobit model to examine the effect of accounting
considerations, employee sentiment, sorting, and retention benefits on broad option grants.
LN_OPTjt = α0 + α1SENTIMENTjt + α2FIRMVOLjt + α3VOLSHRjt + α4 UNEMPjt
+ α5FINRPT1jt +α6FINRPT2jt +α7NEWECONjt+ α8CASHCONSTRjt
+α9DIVYLDjt + α10EQCONSTRjt + α11BMjt +α12 LN_ASSETjt
+ α13RETjt +α14EARNVOLjt +α15LN_preOPTjt +εjt (1)
The dependent variable is the natural logarithm transformation of the Black-Scholes value of
the annual options ($000) granted by a firm to all non-executive employees. We exclude
executive option grants in computing the dependent variable since the incentives and
constraints for executive option grants are different from non-executive options. We also use
total options granted as the dependent variable as a robustness check. The standard errors in
each Tobit regression are adjusted to account for clustering and autocorrelation.
We assume that a firm makes decisions regarding whether to grant options and the
amount of options to be granted simultaneously, hence a Tobit model is more appropriate than
an OLS model given the truncated distribution of annual option grants to employees.14 We
estimate the model for two time periods, 1995-2004 (excluding firms that voluntarily adopted
14 However, ExecuComp covers mostly firms that make equity grants to employees (only about 5% of our sample have missing or zero equity grants). Therefore, many other studies on employee equity compensation use an OLS regression to model the determinants of option grants. As a robustness test, we also estimate an OLS regression and our results are consistent.
18
option expensing) and 2005-2007.15 Over each of the above periods, the accounting treatment
was the same for all the firms in the sample such that none of the sample firms expensed
options in the earlier period while all firms expensed options during the later period.16
We predict positive coefficients on attraction and retention proxies—SENTIMENT,
FIRMVOL, INDVOL, and VOLSHR, since firms are likely to grant more options when the
attraction and retention benefits are larger. We predict a negative coefficient on UNEMP
because a higher unemployment rate is indicative of fewer outside opportunities for
employees and hence reduces the need for firms to grant more options, ceteris paribus. We
expect aforementioned associations to persist regardless of the accounting treatment of stock
options. With respect to financial reporting costs, if the favorable accounting treatment had
motivated option grants prior to SFAS 123R, we would observe a positive correlation
between option grants and the proxies for financial reporting costs during years 1995-2004.
However, such an association is not expected in the 2005-2007 period, as all firms are
required to expense options after 2005 pursuant to SFAS 123R.
We control for other economic factors that prior literature has shown to influence the
decision to grant options. Ittner et al. (2003) find that the determinants of equity grants are
significantly different in new economy versus old economy firms. Thus, we include a dummy
variable NEWECON that equals one if a firm operates in industries such as computer,
15 From Bear Stearns Equity Research in December 2004, we obtain a list of firms that began to expense stock options voluntarily in 1995 to 2004. We do not have information on firms that adopted the SFAS 123R in 2005 before expensing became mandatory for them. 16 Although, SFAS 123R became effective as of June 15, 2005, a majority of firms adopted SFAS 123R beginning January 2005 and hence we treat the period 2005-2007 as the period where all firms were expensing employee options. We replicate our analysis using 2006-2007 as the post-SFAS 123R period and our results are substantially the same.
19
software, internet, telecommunications, or networking.17 Firms that have cash shortage are
more likely to use equity compensation since equity grants require no cash outlay (Yermack,
1995; Dechow et al., 1996). Consistent with Core and Guay (1999) and Carter et al. (2007),
we measure cash constraints (CASHCONSTR) as the three-year average of [(common and
preferred dividends – cash flow from investing – cash flow from operations)/ total assets].
Cash constraints are thus increasing in the magnitude of this variable. Dividends are generally
accrued for restricted stock but not for stock options. Hence firms that pay high dividends are
more likely to grant restricted stock and less likely to grant options, ceteris paribus. We
measure dividend yield (DIVYLD) as the three-year average (ending year t-1) of the ratio of
dividends per share to price per share.
Firms are less likely to grant options when they are close to their equity issuance
constraint. To measure a firm’s proximity to this constraint, we use the ratio of issued to
outstanding shares.18 We measure the constraint a firm faces on issuing equity (EQCONSTR)
in year t as the ratio of total options outstanding to total shares outstanding at the end of year
t-1. We estimate the total options outstanding by dividing the outstanding executive options
[ExecuComp variables UXNUMEX + UEXNUMUN] at the end of year t-1 by the previous 3-
year average of the percentage that executive option grants represent of total options granted
in each year [ExecuComp variable PCTTOTOPT].
Firms with higher growth opportunities are likely to grant more options (Smith and
Watts, 1992). We include the book-to-market ratio of common equity (BM) at the end of year
t to capture a firm’s growth opportunities. Prior literature also documents a positive
17 We follow Ittner et al. (2003) and define new economy firms as firms with the following four-digit SIC codes: SIC 4812-4899, SIC3820-3869, SIC 2830-2839, SIC 3660-3679, and SIC 7370-7379. 18 Ideally we want to use the ratio of issued to authorized shares. However, information on authorized shares is not available.
20
association between firm size and option grants. Therefore we include the logarithm of total
assets at the end of year t (LN_ASSET) to control for firm size. In addition, since employee
compensation is likely to increase with firm performance, we use the annual stock return
(RET) of year t to control for firm performance. We also control for earnings volatility since
Carter et al. (2007) argue that firms that exhibit higher earnings volatility are more likely to
grant restricted stock. Following Carter et al. (2007), we measure earnings volatility
(EARNVOL) using the square of the standard deviation of ROA (return on assets), where the
standard deviation of ROA is calculated over a period of ten years ending year t-1 (a
minimum of 5 observations is required). Carter et al. (2007) also include the prior year’s
option grants as an additional control. Although a high correlation between economic
determinants and the prior year’s stock option grants may cause estimates on other control
variables to be insignificant, we include LN_preOPT to be consistent with Carter et al
(2007).19
3.4.2. Analysis of annual change in non-executive option grants
We also conduct a change test to examine how year-to-year changes in each
explanatory variables influence the year-to-year change in option grants. We calculate the
change from year t-1 to t for all variables in model (1) except NEWECON and LN_preOPT
and estimate the following OLS regression:
19 Most studies on determinants of employee equity compensation do not include the option grants in the prior year as an explanatory variable (e.g. Core and Guay, 2003; Oyer and Schaefer, 2005). The coefficient estimates on all of our controls are significant with the predicted signs when we exclude the control for last-year option grants.
21
∆LN_OPTjt = α0 + α1∆SENTIMENTjt + α2∆FIRMVOLjt + α3∆VOLSHRjt
+ α4∆UNEMPjt +α5∆FINRPT1jt +α6∆FINRPT2jt
+α7NEWECONj + α8∆CASHCONSTRjt +α9∆DIVYLDjt
+ α10∆EQCONSTRjt + α11∆BMjt +α12 ∆LN_ASSETjt
+ α13∆RETjt +α14∆EARNVOLjt +εjt (2)
This model is estimated for the 1995-2004 and the 2005-2007 period separately. If favorable
accounting treatment affected employee option grants, we expect the coefficients on
FINRPT1 and FINRPT2 to be positive for the period of 1995-2004. The financial reporting
costs hypothesis does not make a prediction on these variables in the post-SFAS 123R (2005-
2007) period.
To shed light on the impact of the change in accounting treatment on options grants,
we also relate the change in option grants subsequent to the adoption of SFAS 123R to
changes in explanatory variables. For those firms that began to expense options during 1995-
2004 (voluntary or early adopters), we define the change in each variable following the
adoption as the difference between the average of year t-1 and t, and the average of year t and
year t+1, where t is the year of adoption. For mandatory adopters, we define the change in
each variable following the adoption as the difference between the average of year 2003 and
2004, and the average of year 2005 and 2006.
3.4.3. Determinants of CEO option and restricted stock compensation
As we have previously discussed, a firm will be more likely concerned about the
accounting impact of the total value of options granted as opposed to options granted only to
CEOs, however, to be consistent with Carter et al. (2007), we also examine the influence of
employee sentiment, return volatility (volatility share), and financial reporting costs on the
22
CEOs’ option and restricted stock grants under each accounting regime. The model
specification of stock options and restricted stock granted to CEOs are specified in equations
(3) and (4).
CEO stock option grants
Ln_CEOOPTjt = ß0 + ß1SENTIMENTjt + ß2FIRMVOLjt + ß3VOLSHRjt
+ ß4UNEMPjt +ß5FINRPT1jt +ß6FINRPT2jt +ß7NEWECONjt
+ ß8CASHCONSTRjt+ß9DIVYLDjt + ß10EQCONSTRjt
+ ß11BMjt +ß12 LN_ASSETjt + ß13RETjt +ß14EARNVOLjt
+ ß15TENUREjt + ß16DEV_INCjt +ß17LN_preCEOOPTjt-1+δjt (3)
CEO restricted stock grants
LN_CEORSTKjt = γ0 + γ1SENTIMENTjt + γ2FIRMVOLjt + + γ4VOLSHRjt
+ γ4UNEMPjt + γ5FINRPT1jt +γ6FINRPT2jt +γ7NEWECONjt
+ γ8CASHCONSTRjt +γ9DIVYLDjt + γ10EQCONSTRjt
+ γ11BMjt +γ12 LN_ASSETjt + γ13RETjt +γ14EARNVOLjt
+ γ15TENUREjt + γ16DEV_INCjt + γ17LN_preCEORSTKjt -1+λjt (4)
In addition to controls that were included in model (1), we also control for CEOs’ tenure
(TENURE) and residual equity incentives (DEV_INC). CEOs close to retirement typically
prefer less uncertainty and thus demand more fixed compensation. We measure a CEO’s
tenure as the number of years the CEO has been in the position and predict a negative
correlation between TENURE and both option grants and restricted stock grants. Further,
Core and Guay (1999) find that firms actively use new equity grants to adjust the level of
CEOs’ incentives provided by their equity holdings. DEV_INC is the residuals estimated from
23
the regression of CEOs’ equity incentives on economic determinants of CEOs’ equity
holdings. We predict a negative coefficient on DEV_INC.
4. Results
4.1. Descriptive statistics
Table 1 reports the summary statistics for our sample of S&P 1500 firms covered by
ExecuComp. The mean (median) value of options granted to non-executive employees
declined from about $55.9 ($9.4) million during 1995-2001 to $ 41.8 ($8.2) million during
2002-2007. An examination of the period post SFAS 123R shows that the mean (median)
option grants declined to $29.5 ($4.9) million. The options granted to CEOs have also
declined similarly and the grants of restricted stock have increased over this time period.
While this trend appears to be consistent with an accounting based explanation, an
examination of other statistics suggests that several key economic determinants of option
grants also changed over this time period. For example, employee sentiment declined from
17% during 1995-2001 to 12% during 2002-2007. Similarly, firm volatility declined from
12% to 10% over the same period. Also, industry volatility as well as a firm’s industry
volatility share shows a decline in the later period. The unemployment rate increased from
4.34% during 1995-2001 to 5.29% during 2002-2007 (it was 4.72% during 2005-2007). Thus,
subsequent to 2001 key economic and labor market determinants of employee options exhibit
changes that would predict a reduction in the use of employee options, underscoring the
importance of controlling for these factors before attributing the decreased use of options to
mandatory expensing. In contrast, the statistics show that mean FINRPT1 increased from 1.36
over 1995-2001 to 1.42 over 2002-2007 (it was 1.47 during 2005-2007). Under an accounting
based explanation this should predict an increase in use of employee options after 2001 (but
24
prior to the effective date of SFAS 123R). Overall, the above statistics show that the decline
in the use of employee options after 2001 was accompanied by corresponding changes in key
economic and labor market determinants of employee options underscoring the importance of
analyzing the impact of these factors in explaining changes in option granting behavior of
firms.
Table 2 reports the pair-wise correlation between the variables for the period 1995-
2007. The correlation between employee option grants and the proxies for employee
sentiment, sorting and retention is positive, while the correlation between option grants and
unemployment is negative. When we analyze these correlations separately over the different
time periods reported in Table 1, the inference is generally similar. Note that the correlation
between employee options and various proxies for economic and labor market factors is
higher than that of CEO options with respective proxies. This is consistent with the theoretical
predictions in Bergman and Jenter (2007), Oyer (2004), and Oyer and Schaefer (2005)
because these factors are more suitable in explaining rank-and-file option grants than CEO
option grants. Kedia and Rajgopal (2009) also argue that local market conditions should have
less impact on top executives’ option grants than on rank-and-file employee option grants
because executives are typically geographically mobile.
The correlation between option grants and FINRPT1 (and FINRPT2) is also positive.
However, we find that such positive correlation persists even in the post SFAS 123R period, a
finding that is not consistent with an accounting based explanation as no association is
expected between option grants and financial reporting costs in the post SFAS 123R period.
The statistics show a positive and significant correlation between proxies for financial
reporting costs and economic determinants of employee options such as sentiment and
25
industry volatility. This suggests that the significant association between financial reporting
costs and CEO options documented in Carter et al. (2007) may be due to the fact that
FINRPT1 and FINRPT2 are correlated with economic determinants of option grants. This
inference is corroborated by a significant association between FINRPT1 and employee
options in the post SFAS 123R period as well when no association is expected between
financial reporting costs and employee options. However, one should expect an association
between economic factors and employee options regardless of the accounting treatment of
options.
4.2. Analysis of option grants to non-executive employees
The results of the multivariate analysis are presented in Table 3. Instead of reporting
the analysis over the entire sample period, we report the analysis over two sub-periods, 1995-
2004 and 2005-2007 as SFAS 123R became effective in 2005.20 Thus, over each of the two
sub-periods, the reporting requirement was uniform for all firms. However, a few firms (about
200 with CRSP and Compustat data) did start to expense employee options prior to 2005. In
order not to contaminate the sample, we exclude all firms that expensed their options before
2005 from this analysis.21
Panel A of Table 3 reports the results of the effect of financial reporting costs,
employee sentiment, sorting, and retention on the magnitude of option grants to non-executive
employees over the 1995-2004 period. Over this time period, none of the firms in the sample
recognized the fair value of employee stock options as compensation expense. In column 1 we
20 Our results remain similar and the inference does not change if we estimate the regression over the entire period 1995-2007. 21 Our results are similar if we include the voluntary adopters in the analysis. We also analyze the sample of voluntary adopters separately and find that employee sentiment and firm volatility are significantly associated with option grants but neither of the proxies for financial reporting costs is associated with option grants.
26
report a specification similar to that in Carter et al. (2007) except that our dependent variable
is the value of option grants to non-executives. Consistent with prior research, we find that
new economy firms, firms with higher growth opportunities, and firms that are cash-
constrained grant more options.22 Also, consistent with prior research, we find that dividend
yield is negatively related to option grants and firms with a large number of options
outstanding (equity-constrained) grant fewer options. With respect to proxies for financial
reporting costs, we find that the coefficients on the two financial reporting cost proxies have
opposite signs. Specifically, the coefficient on FINRPT1 is positive and significant but the
coefficient on FINRPT2 is negative but not significant (p-value is 0.11).
In columns 2 and 3, we introduce proxies for other determinants of option grants such
as sentiment, sorting (attraction), retention and tightness of labor markets (proxied by MSA
unemployment rate). Consistent with the sentiment hypothesis, we find that firms with strong
past performance grant more options. The results also suggest that firms with higher volatility
grant more options, consistent with the sorting hypothesis. To mitigate the concern that firm
volatility might be highly correlated with expected volatility, which is an input in calculating
the Black-Scholes option value (dependent variable), we also use industry volatility as an
alternate proxy for sorting. The results show that the coefficient on industry volatility is
positive and significant, consistent with the sorting hypothesis. The retention model for broad-
based option grants predicts that option grants should be positively related to firm’s share of
industry volatility. Our result is consistent with this hypothesis. Furthermore, the coefficient
on UNEMP is negative and significant suggesting that firms grant more options to rank-and-
22 Oyer and Schaefer (2005) argue that employees who are not among the five highest paid executives can also be senior executives. Following their approach, we use an alternative definition of non-executive option grants by assuming options granted to executives in ranks 6-10 accounts for 10% of those granted to CEOs. We run our analyses with this alternate definition and obtain similar results.
27
file employees when labor markets are tight. The above evidence shows that economic and
labor market considerations significantly influence employee options grants. In contrast, in
column 2 or 3, neither proxy for financial reporting costs is associated with option grants.
The above results provide evidence that is supportive of economic and labor market factors as
determinants of option grants but do not provide support for financial reporting costs as
determinants of option grants over the period 1995-2004.
Panel B of Table 3 reports the results of the above specification for the period 2005-
2007. Over this period, all firms were required to expense employee options. The results
show that sentiment, sorting, retention, and labor market conditions continue to significantly
influence broad-based option grants over the more recent time period. The coefficient on
industry volatility, the alternative measure of sorting, is also positive and significant. The
coefficients on other control variables are also consistent with their predicted relations.
Turning to financial reporting costs proxies, the coefficient on FINRPT1 is positive (and
significant) but the coefficient on FINRPT2 is not significant. However, a positive and
significant coefficient on FINRPT1 is not consistent with an accounting based explanation. A
positive and significant coefficient suggests that firms with greater financial reporting
concerns grant more options over the 2005-2007 period, which is inconsistent with a financial
reporting costs argument, as these options have to be expensed and hence there should be no
association between financial reporting costs and option grants. A plausible interpretation of
positive coefficient on FINRPT1 is that it correlated with some economic determinant of
option grants. Thus, evidence over the 2005-2007 is also not consistent with financial
reporting considerations influencing broad-based option grants.
28
In addition to analyzing option grants to non-executives, we also analyze total option
grants as a firm concerned about the magnitude of reported expense is likely to be concerned
about the total expense associated with option grants. Since over 90% of the option grants are
made to non-executive employees, we do not expect the results to be much different from
what are reported in Table 3. Consistent with our conjecture, we find (not tabulated) that total
option grants are significantly associated with sentiment, sorting, retention, and
unemployment in each of the two sub-periods (1995-2004 and 2005-2007) with the exception
of VOLSHR, which is positively associated with option grants over 1995-2004 but not over
2005-2007. Also, other variables such as NEWECON, BM , DIVYLD etc. are associated with
total option grants in the predicted direction. Again, neither of the financial reporting cost
proxies is associated with total option grants in either period.
Overall, the results reported in Table 3 provide strong support for economic/labor
market considerations as significant drivers of employee options but provide little support for
financial reporting costs influencing employee options grants. Thus, contrary to popular
perceptions we do not find evidence that accounting considerations caused firms to make
excessive option grants.
4.3. Analysis of firms that voluntarily expensed stock options
As discussed earlier, the analysis reported in Table 3 excludes the firms that decided to
voluntarily expense employee options before they were required to do so under SFAS 123R.
The reason for excluding these firms was that we wanted to examine the sample of firms that
faced similar reporting requirements, hence permitting a cleaner test of the impact of cross-
sectional variation in financial reporting costs as well as other firm characteristics on option
granting behavior of firms.
29
In this section, we briefly discuss the results of the specification reported in Table 3
for this sample of voluntary adopters or early adopters.23 The results (not tabulated) show that
employee sentiment and firm volatility are significantly associated with total option grants
and option grants to non-executives, consistent with results for the full-sample. However,
neither of the financial reporting proxies is significantly associated with broad-based option
grants. In untabulated results we also find that option grants to CEOs for this sample are also
not associated with financial reporting costs proxies. This suggests that for the sample of
voluntary adopters, financial reporting considerations do not appear to be associated with the
option grants. The results also show that BM ratio and Equity constraint are significantly
associated with option grants but that other variables such as firm size, earnings volatility, and
dividend yield are not associated with option grants.
Overall, consistent with the results for the full-sample, the results for the sample of
voluntary adopters also suggest that broad-option grants are related to employee sentiment,
sorting, and retention considerations but are not associated with financial reporting costs.
4.4. Analysis of change in option grants
The results reported in Table 3 show that the cross-sectional variation in option grants
is better explained by sentiment, sorting, retention, and tightness of labor markets than by
financial reporting costs. In this section we relate year-to-year change in option grants to the
contemporaneous changes in explanatory variables. This approach allows each firm to act as
its own control, thereby minimizing the concern that our findings are driven by some omitted
firm-specific variables. This advantage however, comes at the cost of low power, as this
23 It should be noted that although this sample of voluntary adopters chose to voluntarily expense options, most of the firms chose to expense options during the period 2002-2004. Only a handful of firms expensed options prior to that period.
30
approach eliminates the cross-sectional variation in the level of option grants that is related to
the various firm characteristics.
Table 4 reports the results from the regressions of the change in annual option grants
over the two sub-periods (1995-2004 and 2005-2007) on changes in explanatory variables.
Results show that change in employee sentiment, change in firm volatility (and its alternative
measure: changes in industry volatility), change in industry volatility share (except in column
4), and change in unemployment rate at the MSA level are significantly associated with the
change in option grants. However, the association between the change in financial reporting
costs and the change in option grants is not significant. This analysis provides additional
evidence in support of economic determinants of option grants but does not support an
accounting based explanation.
The results for the shorter but more recent post-SFAS 123R period (2005-2007) are
also similar as the coefficients on the change in employee sentiment, firm volatility, and
industry volatility are positive and significant. The coefficient on unemployment is
significantly negative consistent with labor market conditions continuing to influence option
grants. However, there is no reliable association between the change in financial reporting
costs and the change in options grants. The results also show a negative and significant
intercept indicating a reduction in option grants that is not explained by changes in
explanatory variables. This negative intercept, however, cannot be interpreted as a mean
reduction in option grants due to SFAS 123R as the intercept is also negative and significant
over the period 1995-2004 (Table 4, columns 1 and 2) when none of the firms included in the

31
regression were expensing options. 24 Furthermore, in untabulated analysis, we find that
reduction in annual option grants is first observed in year 2001 and persists each year
thereafter. This suggests that overall the level of annual option grants to employees started to
decline well before the requirement to expense options. If firms reduced options grants in
response to SFAS 123R, we would likely observe a one-time decrease and not a steady
decline. Moreover, it is unlikely that companies were anticipating the requirement of
expensing in 2001.25
Overall, the results of the level and the change analysis suggest that broad-based
option grants are significantly influenced by economic and labor market considerations but
provide little support for the conjecture that favorable accounting treatment of options is an
important determinant of broad-based option grants at firms in the ExecuComp sample.
4.5. Analysis of option grants to CEOs
In Table 5, we replicate the specification reported in Carter et al (2007) and examine
the association between option grants to CEOs and sentiment, sorting, retention, and financial
reporting costs and other control variables. However, as argued earlier, the impact of financial
reporting considerations on option grants is better evaluated using total option grants or option
grants to non-executive employees because option grants to CEOs typically represent a small
fraction of the total grants. This analysis is similar to that reported in Carter et al. (2007)
except that we also include proxies for sentiment, sorting, and retention. The first three
columns in Table 5 report the results of the estimation for the period 1995-2004 (excluding
voluntary adopters). We expect sentiment and sorting to affect CEO option grants but do not 24 The difference in the intercepts from regressions for 1995-2004 and 2005-2007 is not significant. Also, note that voluntary adopters are excluded from this analysis. 25 It was not until August 2002, after the enactment of Sarbanes-Oxley, that FASB announced its intension to revisit the accounting treatment of option grants.

32
expect CEO option grants to be related to the unemployment rate in the region as CEOs are
less geographically constrained than rank-and-file employees. Our results are consistent with
the aforementioned expectations. Consistent with Carter et al. (2007), we also find that each
of the proxies for financial reporting cost, FINRPT1, and FINRPT2 is positively associated
with CEO option grants. However, as argued earlier, if an accounting subsidy caused firms
to grant more options then the analysis should consider total options granted and not just
option grants to CEOs.
Columns 4-6 of Table 5 report the results for the period 2005-2007. The results show
that similar to the results for the earlier period, employee sentiment and sorting are positively
associated with CEO option grants over the period 2005-2007. One of the proxies for
financial reporting cost (FINRPT1) is significantly associated with CEO option grants.
However, a positive coefficient is not consistent with the financial reporting costs influencing
option grants because the accounting treatment of options requires uniform expensing of
employee options after 2005.
Overall, the results show that proxies for sorting, sentiment, and financial reporting
costs are significantly associated with CEO option grants. However, financial reporting costs
continue to be associated with CEO option grants even after options are required to be
expensed clouding the inference that financial reporting costs influence option grants.
Moreover, since CEO option grants constitute a relatively small fraction of total options
granted by a firm, the impact of accounting considerations on option grating behavior is better
evaluated by analyzing the total options granted or options granted to non-executive
employees as was done in Table 3 and Table 4.
4.6. Analysis of restricted stock grants to CEOs
33
Table 6 reports the analysis of restricted stock awards to CEOs. Several papers have
analyzed the efficiency of options versus restricted stock in compensation plans (Bryan et al.,
2000; Hall and Murphy, 2002; Kole, 1997). Hall and Murphy (2002) show that when a
company is allowed to adjust existing compensation, restricted stock grants provide better
incentives than options. However, most compensation plans involve adding options on top of
existing pay packages and thus do not involve substitution of restricted stock for other forms
of pay. They argue that such “add-on” plans are not as efficient in terms of providing
incentives compared to plans that permit reduction in other forms of pay while granting
restricted stock. They suggest that favorable accounting treatment of option afforded under
SFAS 123 could be a reason for the popularity of options over restricted stock. Consistent
with this conjecture, Carter et al. (2007) show that financial reporting costs are positively
related to CEO options and negatively related to restricted stock grants to CEOs. Moreover,
they show that firms that voluntarily chose to expense options have reduced options grants
and correspondingly increased grants of restricted stock.
On the other hand, options might be preferred to restricted stock for reasons other than
favorable accounting treatment. For example, Oyer and Schaefer (2005) argue that an
important advantage of options over restricted stock is that they help attract optimistic
employees (who prefer a levered claim) and help retain employees by indexing their deferred
compensation to the company’s stock price and hence to the employees’ outside opportunities.
In addition, Bergman and Jenter (2007) suggest that companies compete with the capital
markets in providing equity claims to employees. Given that an employee can easily replicate
the pay-off from restricted stock by purchasing the company’s stock, the company does not
benefit from offering restricted stock to optimistic employees. Since traded options are
34
relatively less common, a firm can extract rents from optimistic employees by offering them a
levered claim on the firm’s equity (via stock options) that the employees value more and also
cannot easily replicate. Unfortunately, data on restricted stock grants to non-executive
employees are not available, precluding us from directly testing this conjecture. However,
consistent with the above argument, experimental evidence in Hodge et al. (2009) finds that
employees tend to overvalue their employee options.
Despite the aforementioned limitation, we replicate the specification as in Carter et al.
(2007) but also introduce proxies for sentiment, sorting, retention, and the tightness of the
labor market. The results reported in Table 6 show that firms with strong past performance
(high employee sentiment) and high return volatility (greater heterogeneity about expected
firm performance) grant less restricted stock. These associations are observed for each of the
two sub-periods, 1995-2004 and 2005-2007 and are consistent with predictions in Bergman
and Jenter (2007) and Oyer and Schaefer (2005). In contrast, neither of the proxies for
financial reporting costs is related to the restricted stock grants once economic determinants
are controlled for. This evidence once again suggests that the impact of accounting
considerations in influencing compensation design is likely overstated.
4.7. Analysis of the change in option grants subsequent to voluntary or mandatory expensing
of options
As discussed earlier, several observers have suggested that favorable accounting
treatment may have contributed to the excessive use of options in compensation plans. If that
is the case then firms would be expected to reduce their option grants after the adoption of
expensing options either voluntarily or as required under SFAS 123R. Recent articles in
popular press also suggest that firms have cut back on their option grants subsequent to the
35
mandatory expensing required under SFAS 123R (Lavalle, 2005). Carter et al. (2007)
examine a sample of firms that voluntarily decided to expense options in 2002 and 2003 and
find evidence of reduced use of options coupled with increased use of restricted stock
following the decision to voluntarily expense options. They interpret this result as evidence
that expensing of options leads to reduced use of options in equity compensation of CEOs.
Brown and Lee (2007) examine the change in option grants subsequent to the issuance of
SFAS 123R and find that firms reduced their option grants subsequent to SFAS 123R and that
the likelihood of reduction increases in the value of option grants as well as the amount of
unvested options. In addition, they find that firms with tighter earnings based covenants,
those that likely relied on favorable accounting treatment of options to meet/beat earnings
benchmarks, and those with weaker governance exhibited a greater reduction in option grants
subsequent to the issuance of SFAS 123R. Based on the above results, they infer that
expensing of stock options results in a reduction in option grants.
It is worth noting that neither of the above studies controls for changes in other factors
such as sentiment, sorting, retention or labor market considerations that have been shown to
have a strong impact on option grants. Moreover, it is important to recognize that reduced use
of options could have been due to other factors as well. For example, all firms had the ability
to expense options under SFAS 123 but virtually none of them chose to do so until 2002,
when there were a series of developments that could have prompted the decision to expense
options and also reduce option grants simultaneously. Around this time public scrutiny of
executive compensation increased following a series of corporate scandals at large and
established companies such as Enron and Worldcom. In addition, there was some evidence to
suggest that option based compensation may have motivated managers to engage in earnings
36
manipulations.26 Thus, the decision to voluntarily expense and reduce option grants could
have been motivated by political costs associated with what was perceived as excessive
compensation of executives (Ferri and Sandino, 2009). This period was also characterized by
the stock market crash and the collapse of the technology sector, both of which would predict
a reduction in the use of options, ceteris paribus. Corresponding to these changes, the
unemployment rate increased after 2001 and hence the labor market also slackened. Therefore,
it is not clear that the reduction in the use of options after 2001 can be attributed to either
voluntary or mandatory expensing of options without controlling for the aforementioned
relevant factors. While an investigation of the decision to voluntarily expense options is
beyond the scope of this study, we want to examine the extent to which changes in sentiment,
sorting, and retention proxies explain the reduction in option grants subsequent to the
expensing of options.
Table 7 reports the summary statistics for those firms that voluntarily expensed
options before the issuance of SFAS 123R (voluntary or early adopters). Specifically, the
statistics are reported for a two-year period before expensing and a two-year period after
expensing. As a comparison, we also report statistics for other firms that did not expense
options voluntarily (non-adopters) over the same time period. The results show that prior to
expensing options, firms that decided to voluntarily expense options made fewer option grants
to rank-and-file employees relative to control firms. Also, the voluntary adopters had lower
prior returns, lower firm volatility, and located in MSA areas that have higher unemployment
rate (less labor market pressure to grant options). The difference in firm characteristics and
options usage is consistent with results reported earlier in Table 3 that past performance, firm
26 Academic studies such as Burns and Kedia (2007) find that sensitivity of CEO’s options portfolio to the stock price of the firm is significantly related to the probability of earnings restatements.
37
volatility, and unemployment rate at the MSA level significantly influence option grants. The
statistics show that after firms began to expense options, the dollar value of options granted
per employee declined from $5,690 to $2,600 for the sample of voluntary adopters, a result
that has been interpreted as evidence of expensing options resulting in reduced option grants.
However, the statistics show that option grants declined dramatically even in the control
sample that did not expense options over the same time period. For example, mean dollar
value of per employee option grants declined from $20,950 to $9,610 for the control firms.
Over this period sentiment, firm volatility, industry volatility also declined and unemployment
rate increased. These statistics suggest that observed reduction in option grants may be due to
changes in economic factors and not necessarily due to the change in accounting treatment of
options.
We examine this issue more formally by relating the change in option grants following
the expensing of options (voluntary or mandatory) to changes in economic/labor market
considerations and changes in financial reporting concerns. This analysis is similar in spirit to
the analysis of the change in option grants reported in Table 4, except that instead of
examining the year-to-year change in options, we examine the change following the
expensing of options. In this analysis we combine the sample of voluntary adopters with the
sample of all other firms that had to expense options pursuant to SFAS 123R. The results
reported in Table 8 show that consistent with the results on the change in annual option grants
reported in Table 4, changes in employee sentiment, firm volatility, and industry volatility are
positively associated with the change in option grants subsequent to the decision to expense
stock options. The coefficient on UNEMP is negative and is significant in one of the two
specifications (p-values of 0.11 and 0.09). However, changes in financial reporting concerns
38
are not significantly associated with the change in option grants subsequent to expensing
options.27 These results indicate that changes in economic and labor market conditions are
significantly associated with the reduction in option grants observed subsequent to SFAS
123R. Overall, our results provide little support for financial reporting costs motivating
reduced use of employee options subsequent to expensing of options. In contrast, our results
indicate that changes in economic and labor market considerations appear to be far more
important in explaining the reduced use of employee options in recent years.
5. Conclusion
Extant academic research as well non-academic observers have argued that the
accounting subsidy (no mandatory requirement to expense employee stock options) resulted
in a dramatic increase in the use of employee stock options during the 1990s and the
requirement to expense options under SFAS 123R has caused firms to reduce their options
grants. However, prior studies investigating the role of accounting considerations in
influencing options use have two primary limitations. First, those studies do not examine
broad-based option grants, instead focusing on option grants to CEOs or top-five executives
despite the fact that over 90% of the options are granted to non-executive employees. Second,
prior studies do not control for several important economic/labor market factors that have
been shown to affect employee option grants. We overcome these limitations by examining
the broad-based option grants (as well as option grants to CEOs) and control for the economic
and labor market determinants of option grants.
27 We also estimate this model using the level of financial reporting costs preceding the adoption of expensing (instead of change in costs). We do not find a significant association between level of financial reporting costs and change in option grants.
39
We find that the cross-sectional variation in the magnitude of broad-based option
grants is significantly associated with proxies for employee sentiment, sorting, retention and
tightness of labor markets but we do not find reliable association between the magnitude of
option grants and proxies for financial reporting costs. This inference holds for the period of
1995-2004 when most firms did not expense employee options and for the more recent period
of 2005-2007 when all firms were required to expense employee options. Furthermore, an
analysis of the annual change in option grants shows that the change in option grants is
associated with changes in economic/labor market factors but not with changes in financial
reporting costs. Our analysis of the change in option grants subsequent to the expensing of
options (voluntary and mandatory) also confirms the importance of economic/labor market
factors in influencing employee options. Overall, our results are far more supportive of
economic considerations as the primary drivers of broad-based option grants and provide little
support for accounting considerations being important drivers of employee option grants.
Although our results suggest that economic factors are the primary determinants of
stock option grants, we cannot rule out the influence of accounting factors entirely as there is
a significant decline in the use of stock options subsequent to SFAS 123R that is not
explained by changes in our proxies of economic and labor market factors. On the other hand,
it should be noted that the use of stock options has steadily declined since 2001, well before
the requirement to expense them. Perhaps other factors such as increased scrutiny of
executive compensation (political costs) may have played a role in the observed reduction in
option grants. In contrast to prior research that has argued that previous favorable accounting
treatment had motivated excessive and inefficient use of options thereby imposing dead-
weight costs, our results are comforting as they suggest that the magnitude of such costs

40
appears to be far less than what has been widely perceived (Hall and Murphy, 2002; Carter et
al., 2007).
41
References
Aboody, D. 1996. Market valuation of employee stock options. Journal of Accounting and Economics 22: 357-391.
———, M. Barth, and R. Kasznik. 2004a. Firms’ voluntary recognition of stock-based
compensation expense. Journal of Accounting Research 42(2): 123-150. ———, ———, and ———. 2004b. SFAS No. 123 stock-based compensation expense and
equity market values. The Accounting Review 79 (2): 251-275. Accounting Principles Board (APB). 1972. APB Opinion No. 25: Accounting for Stock Issued
to Employees. Norwalk, CT: APB. Arya, A. and B. Mittendorf. 2005. Offering stock options to gauge managerial talent. Journal
of Accounting and Economics 40: 189-210. Baber, W., S. Janakiraman, and S. Kang. 1996. Investment opportunities and the structure of
executive compensation. Journal of Accounting and Economics 21: 297-318. Baber, M., J. Elliott, and M. Finn. 1999. Market rewards associated with patterns of
increasing earnings. Journal of Accounting and Research 37: 387-413. Bartov, E., D. Givoly, and C. Hayn. 2002. The rewards to meeting or beating earnings
expectations. Journal of Accounting and Economics 33 (2): 173-204. ——— and P. Mohanram. 2004. Private information, earnings manipulations, and executive
stock-option exercises. The Accounting Review 79 (4): 889-920.
Beatty, A., B. Ke, and K. Patroni. 2002. Earnings Management to Avoid Earnings Declines Across Publicly and Privately Held Banks. The Accounting Review 77 (3): 547-570.
Bell, T., W. Landsman, B. Miller, and S. Yeh. 2002. The valuation implications of employee
stock option accounting for profitable computer software firms. The Accounting Review 77 (4): 971-996.
Benartzi, S. 2001. Excessive extrapolation and the allocation of company stock to retirement
accounts. Journal of Finance 56(5): 1747-1764. Bergman, N. K. and D. Jerter, 2007. Employee sentiment and stock option compensation.
Journal of Financial Economics 84: 667-712. Bergstresser, D. and T. Philippon. 2006. CEO incentives and earnings management. Journal
of Financial Economics 80 (3): 511-529.
42
Bodie, Z., R. Kaplan, and R. Merton. 2003. For the last time: stock options are an expense. Harvard Business Review 81 (3): 63-71.
Brown, L. and Y., Lee. 2007. The Impact of SFAS 123R on Changes in Option-Based
Compensation. Working paper, Georgia State University. Bryan, S., L. Hwang, and S. Lilien. 2000. CEO stock-based compensation: An empirical
analysis of incentive-intensity, relative mix, and economic determinants. Journal of Business 73 (October): 661–693.
Burgstahler, D. and M. Eames. 1999. Management of earnings and analyst forecasts. Working
paper, University of Washington. Callaghan, S. R., M. Stanford, and C. Subramaniam. 2008. Do broad-based option
compensation plans improve future firm performance for technology and non-technology firms? Working paper, Texas Christian University.
Carter, M. and L. Lynch. 2003. The consequences of the FASB’s 1998 proposal on
accounting for stock option repricing. Journal of Accounting and Economics 35: 51-72. ———, ———, and I. Tuna. 2007. The role of accounting in the design of CEO equity
compensation. The Accounting Review, 82(2): 321-357. Chaudhary, P., S. Rajgopal and M. Venkatachalam. 2009. Accelerated vesting of employee
stock options in anticipation of FAS 123-R. Journal of Accounting Research 47 (1): 105-146.
Core, J. and W. Guay. 1999. The use of equity grants to manage optimal equity incentive
levels. Journal of Accounting and Economics 28: 151-184. ———, and ———. 2001. Stock option plans for non-executive employees. Journal of
Financial Economics 61 (August): 253–287. ———, ———, and D. Larcker. 2003. Executive equity compensation and incentives: A
survey. Economic Policy Review (April): 27-50. ———, Holthausen, R., and D. Larcker. 1999. Corporate governance, chief executive officer
compensation, and firm performance. Journal of Financial Economics 51: 371–406. Dechow, P., A. Hutton, and R. Sloan. 1996. Economic consequences of accounting for
stock-based compensation. Journal of Accounting Research 34 (1996): 1-20. Demsetz, H. and K. Lehn 1985. The structure of corporate ownership: causes and
consequences. Journal of Political Economy: 1155-1177. Degeorge, F., J. Patel, and R. Zeckhauser. 1999. Earnings management to exceed thresholds.
43
Journal of Business 72 (1): 1-33. Dichev, I. D. and D. J. Skinner. 2002. Large-sample evidence on the debt covenant hypothesis.
Journal of Accounting Research 40 (4): 1091-1123. Dyreng, S. 2009. The cost of private debt covenant violation. Working paper, Duke
University. Ferri, F. and T. Sandino. 2009. The impact of shareholder activism on financial reporting and
compensation: The case of employee stock options expensing. The Accounting Review, 84 (2): 433-466.
Financial Accounting Standards Board. 1995 Statement of Financial Accounting Standards
No.123: Accounting for Stock-Based Compensation. Norwalk, CT: FASB. Financial Accounting Standards Board. 2004. Statement of Financial Accounting Standards
No.123R: Share-Based Payment. Norwalk, CT: FASB. Hall, B. and K. Murhpy. 2002. Stock options for undiversified executives. Journal of
Accounting and Economics 33 (1): 3-42. ——— and ———. 2003. The trouble with stock options. Journal of Economic Perspectives
17: 49–70. Himmelberg, C., G. Hubbard, and D. Palia. 1999. Understanding the determinants of
managerial ownership and the link between ownership and performance. Journal of Financial Economics 53: 353–384.
Hodge F., S. Rajgopal, and T. Shevlin. 2008. Do managers value stock options and restricted
stock consistent with economic theory? Contemporary Accounting Research, forthcoming.
Ittner, K., R. Lambert, and D. Larcker. 2003. The structure and performance consequences of
equity grants to employees of new economy firms. Journal of Financial Economics 34: 89–127.
Jensen, M. and K. Murphy. 1990. Performance Pay and Top Management Incentives. Journal
of Political Economy 98(2):225-264
———, ———, and E. Wruck. 2004. Remuneration: where we’ve been, how we got to here, what are the problems, and how to fix them. Working Paper, European Corporate Governance Institute.
Kole, S. R. The complexity of compensation contracts. Journal of Financial Economics 43:
79-104
Kedia, S. and S. Rajgopal, 2009. Neighborhood matters: the impact of location on broad
44
based stock option plans. Journal of Financial Economics 92: 109-127 Lang, L., R. Stulz, and R. Walking. 1991. A test of the free cash flow hypothesis: the case of
bidder returns. Journal of Financial Economics 29: 315-355. Lavelle, L. More than one way to feed a fat cat. Business Week. 2003/11/3. Lavelle, L. Kicking the stock-options habit. Business Week. 2005/2/16. Matsunaga, S. 1995. The effects of financial reporting costs on the use of employee stock
options. The Accounting Review 70, 1-26. McConnell, J. and H. Servaes. 1990. Additional evidence on equity ownership and corporate
value. Journal of Financial Economics 27: 593–612. Mehran, H. and J. Tracy. 2001. The effect of employee stock options on the evolution of
compensation in the 1990s. Economic Policy Review Vol7, No. 3, Federal Reserve Bank of New York.
Merton, R. 1973. Theory of rational option pricing. Bell Journal of Economics and
Management Science 4, 141-183. Morck, R., A. Shleifer, and R. Vishny. 1988. Management ownership and market valuation:
an empirical analysis. Journal of Financial Economics 20, 293–316. Murphy, K. 1985. Corporate performance and managerial remuneration. Journal of
Accounting and Economics 7 (1-3): 11-42. ———. “Executive Compensation.” In O. Ashenfelter and D. Card, eds., Handbook of Labor
Economics, Vol. 3. Amsterdam: North-Holland. Oyer, P. 2004. Why do firms use incentives that have no incentive effects? Journal of
Finance 59: 1619–1640. ——— and S. Schaefer, 2005. Why do some firms give stock options to all employees?: An
empirical examination of alternative theories. Journal of Financial Economics 76, 99–133.
Rajgopal, S. and T. Shevlin. 2002. Empirical evidence on the relation between stock option
compensation and risk taking. Journal of Accounting and Economics 2 (33): 145–171. ———, ———, and V. Zamora 2006. “CEOs’ outside employment opportunities and the
lack of relative performance evaluation in the compensation contracts”. Journal of Finance 61 (4): 1813–1844.
Richardson, S., A., S.,H. Teoh, and P. D. Wysocki. 2004. The walk-down to beatable
45
analysts’ forecasts: The role of equity issuance and insider trading incentives. Contemporary Accounting Research 21 (4): 885-924.
Smith, C., and R. Watts. 1992. The investment opportunity set and corporate financing,
dividend, and compensation policies. Journal of Financial Economics 7: 117-61. Teoh, S. H. and T., J. Wong. 1998. Earnings management and the long-run market
performance of initial public offerings. Journal of Finance 53 (6): 1935-1974. Yermack, D. 1995. Do corporations award CEO stock options effectively? Journal of
Financial Economics 39 (2-3): 237-269.
46
Appendix A: Variable Definition
BMjt= the ratio of book value of equity to market value of equity at the end of year t for firm j;
CASHCONSTRjt= the three-year average over year t-3 to t-1 of [(common and preferred
dividends − cash flow from investing − cash flow from operations)/ total assets] for
firm j;
DIVYLDjt= three-year average over year t-3 to t-1 of [dividends per share/price per share] for
firm j;
DEV_INCjt= natural log of (actual incentive level /predicted incentive level) for year t-1.
Actual incentive level is the delta of the equity portfolio, and predicted incentive level
is estimated from a model based on Core and Guay (1999) for the CEO of firm j;
EARNVOLjt= the square of the standard deviation of ROA, where the standard deviation of
ROA is calculated over ten years prior to year t for firm j;
EQCONSTRjt= (executive options outstanding at the end of year t-1 / three-year average
percentage of total options granted to executives) / total shares outstanding for firm j;
FINRPT1jt= (0.81*FREQMBE +0.80*FREQEPSUP −0.51*LEVERAGE) for firm j in year t;
FINRPT2jt= (0.79*ISSUE_EQ +0.81*ISSUE_DEBT) for firm j in year t;
FIRMVOLjt= Standard deviation of firm j’s monthly stock returns in year t;
INDVOLjt= Standard deviation of monthly average returns of all CRSP firms in the same 3-
digit SIC code as firm j in year t;
LN_ASSETjt= natural log of total assets for firm j at the end of year t;
LN_OPTjt= natural log of Black-Scholes value of stock options granted at firm j to non-
executive employees in year t;
47
LN_preOPTjt= natural log of the Black-Scholes value of stock options granted at firm j to
non-executive employees in year t-1;
LN_CEOOPTjt= natural log of the Black-Scholes value of stock options granted at firm j to
CEO in year t;
LN_preCEOOPTjt= natural log of Black-Scholes value of stock options granted at firm j to
CEO in year t-1;
LN_CEORSTKjt= natural log of value of restricted stock granted at firm j to CEO in year t-1;
LN_preCEORSTKjt= natural log of value of restricted stock granted at firm j to CEO in year t-
1;
RET jt= cumulative 12-month returns for year t for firm j;
SENTIMENTjt= the annualized stock return of firm j calculated from the beginning of year t-2
to the end of year t-1;
TENUREjt= the number of years the CEO has been in that position (if missing, the number of
years at the firm) for firm j as of the end of year t;
UNEMPjt = annual unemployment rate calculated for the metropolitan statistical area (MSA)
where a firm’s headquarter is located;
VOLSHRjt= average R-square obtained from regressions of every CRSP firm’s monthly
returns on the industry monthly average returns within the same 3 SIC codes.
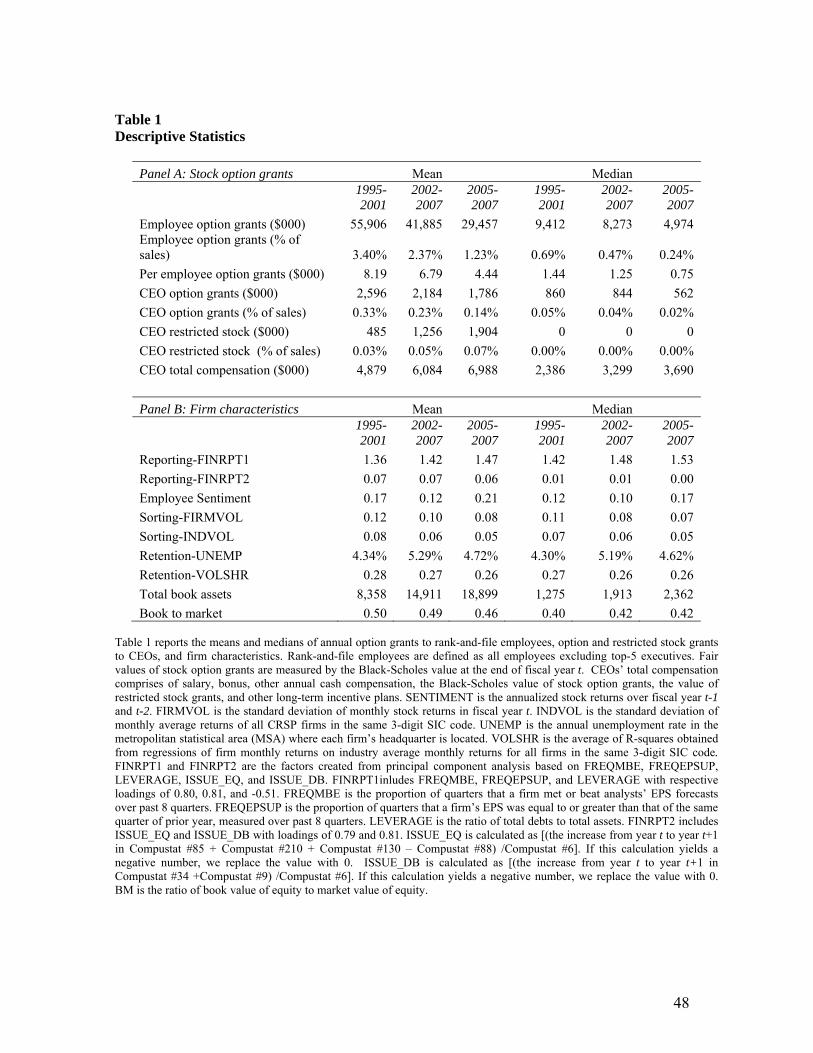
48
Table 1 Descriptive Statistics
Panel A: Stock option grants Mean Median
1995- 2001
2002-2007
2005- 2007
1995- 2001
2002-2007
2005- 2007
Employee option grants ($000) 55,906 41,885 29,457 9,412 8,273 4,974 Employee option grants (% of sales) 3.40% 2.37% 1.23% 0.69% 0.47% 0.24% Per employee option grants ($000) 8.19 6.79 4.44 1.44 1.25 0.75 CEO option grants ($000) 2,596 2,184 1,786 860 844 562 CEO option grants (% of sales) 0.33% 0.23% 0.14% 0.05% 0.04% 0.02% CEO restricted stock ($000) 485 1,256 1,904 0 0 0 CEO restricted stock (% of sales) 0.03% 0.05% 0.07% 0.00% 0.00% 0.00% CEO total compensation ($000) 4,879 6,084 6,988 2,386 3,299 3,690 Panel B: Firm characteristics Mean Median
1995- 2001
2002-2007
2005- 2007
1995- 2001
2002-2007
2005- 2007
Reporting-FINRPT1 1.36 1.42 1.47 1.42 1.48 1.53 Reporting-FINRPT2 0.07 0.07 0.06 0.01 0.01 0.00 Employee Sentiment 0.17 0.12 0.21 0.12 0.10 0.17 Sorting-FIRMVOL 0.12 0.10 0.08 0.11 0.08 0.07 Sorting-INDVOL 0.08 0.06 0.05 0.07 0.06 0.05 Retention-UNEMP 4.34% 5.29% 4.72% 4.30% 5.19% 4.62% Retention-VOLSHR 0.28 0.27 0.26 0.27 0.26 0.26 Total book assets 8,358 14,911 18,899 1,275 1,913 2,362 Book to market 0.50 0.49 0.46 0.40 0.42 0.42
Table 1 reports the means and medians of annual option grants to rank-and-file employees, option and restricted stock grants to CEOs, and firm characteristics. Rank-and-file employees are defined as all employees excluding top-5 executives. Fair values of stock option grants are measured by the Black-Scholes value at the end of fiscal year t. CEOs’ total compensation comprises of salary, bonus, other annual cash compensation, the Black-Scholes value of stock option grants, the value of restricted stock grants, and other long-term incentive plans. SENTIMENT is the annualized stock returns over fiscal year t-1 and t-2. FIRMVOL is the standard deviation of monthly stock returns in fiscal year t. INDVOL is the standard deviation of monthly average returns of all CRSP firms in the same 3-digit SIC code. UNEMP is the annual unemployment rate in the metropolitan statistical area (MSA) where each firm’s headquarter is located. VOLSHR is the average of R-squares obtained from regressions of firm monthly returns on industry average monthly returns for all firms in the same 3-digit SIC code. FINRPT1 and FINRPT2 are the factors created from principal component analysis based on FREQMBE, FREQEPSUP, LEVERAGE, ISSUE_EQ, and ISSUE_DB. FINRPT1inludes FREQMBE, FREQEPSUP, and LEVERAGE with respective loadings of 0.80, 0.81, and -0.51. FREQMBE is the proportion of quarters that a firm met or beat analysts’ EPS forecasts over past 8 quarters. FREQEPSUP is the proportion of quarters that a firm’s EPS was equal to or greater than that of the same quarter of prior year, measured over past 8 quarters. LEVERAGE is the ratio of total debts to total assets. FINRPT2 includes ISSUE_EQ and ISSUE_DB with loadings of 0.79 and 0.81. ISSUE_EQ is calculated as [(the increase from year t to year t+1 in Compustat #85 + Compustat #210 + Compustat #130 – Compustat #88) /Compustat #6]. If this calculation yields a negative number, we replace the value with 0. ISSUE_DB is calculated as [(the increase from year t to year t+1 in Compustat #34 +Compustat #9) /Compustat #6]. If this calculation yields a negative number, we replace the value with 0. BM is the ratio of book value of equity to market value of equity.
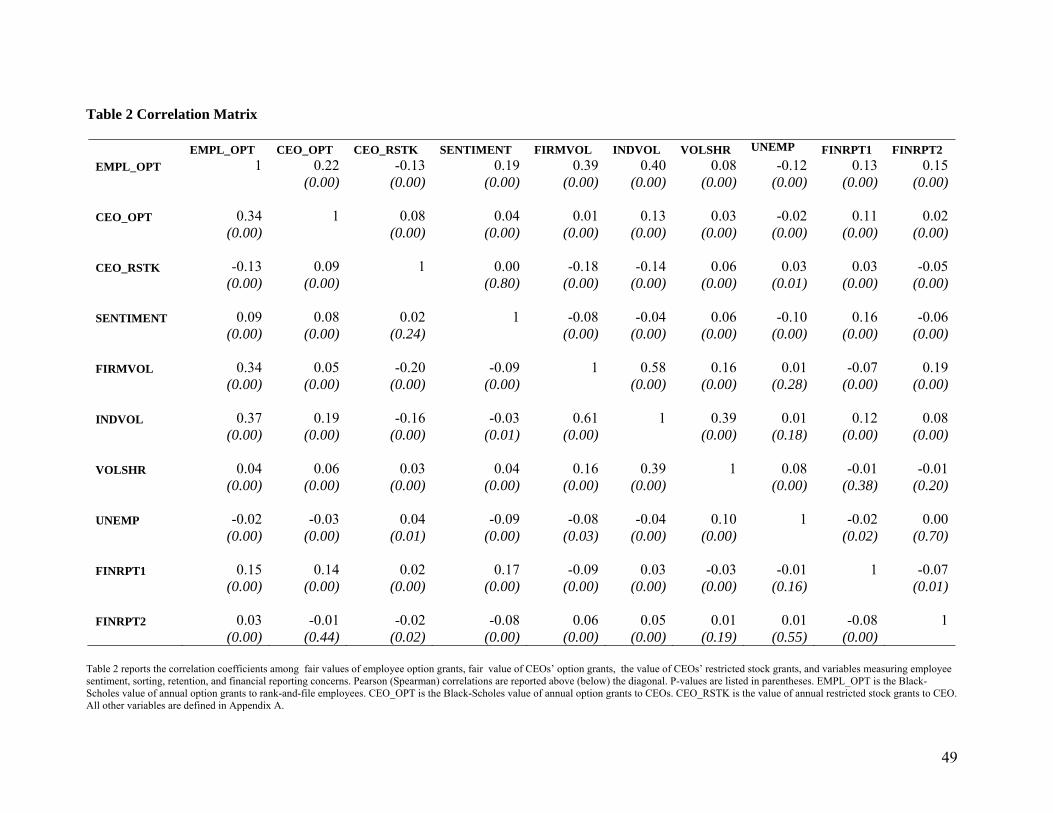
49
Table 2 Correlation Matrix
EMPL_OPT CEO_OPT CEO_RSTK SENTIMENT FIRMVOL INDVOL VOLSHR UNEMP FINRPT1 FINRPT2 EMPL_OPT 1 0.22 -0.13 0.19 0.39 0.40 0.08 -0.12 0.13 0.15 (0.00) (0.00) (0.00) (0.00) (0.00) (0.00) (0.00) (0.00) (0.00) CEO_OPT 0.34 1 0.08 0.04 0.01 0.13 0.03 -0.02 0.11 0.02 (0.00) (0.00) (0.00) (0.00) (0.00) (0.00) (0.00) (0.00) (0.00) CEO_RSTK -0.13 0.09 1 0.00 -0.18 -0.14 0.06 0.03 0.03 -0.05 (0.00) (0.00) (0.80) (0.00) (0.00) (0.00) (0.01) (0.00) (0.00) SENTIMENT 0.09 0.08 0.02 1 -0.08 -0.04 0.06 -0.10 0.16 -0.06 (0.00) (0.00) (0.24) (0.00) (0.00) (0.00) (0.00) (0.00) (0.00) FIRMVOL 0.34 0.05 -0.20 -0.09 1 0.58 0.16 0.01 -0.07 0.19 (0.00) (0.00) (0.00) (0.00) (0.00) (0.00) (0.28) (0.00) (0.00) INDVOL 0.37 0.19 -0.16 -0.03 0.61 1 0.39 0.01 0.12 0.08 (0.00) (0.00) (0.00) (0.01) (0.00) (0.00) (0.18) (0.00) (0.00) VOLSHR 0.04 0.06 0.03 0.04 0.16 0.39 1 0.08 -0.01 -0.01 (0.00) (0.00) (0.00) (0.00) (0.00) (0.00) (0.00) (0.38) (0.20) UNEMP -0.02 -0.03 0.04 -0.09 -0.08 -0.04 0.10 1 -0.02 0.00 (0.00) (0.00) (0.01) (0.00) (0.03) (0.00) (0.00) (0.02) (0.70) FINRPT1 0.15 0.14 0.02 0.17 -0.09 0.03 -0.03 -0.01 1 -0.07 (0.00) (0.00) (0.00) (0.00) (0.00) (0.00) (0.00) (0.16) (0.01) FINRPT2 0.03 -0.01 -0.02 -0.08 0.06 0.05 0.01 0.01 -0.08 1 (0.00) (0.44) (0.02) (0.00) (0.00) (0.00) (0.19) (0.55) (0.00)
Table 2 reports the correlation coefficients among fair values of employee option grants, fair value of CEOs’ option grants, the value of CEOs’ restricted stock grants, and variables measuring employee sentiment, sorting, retention, and financial reporting concerns. Pearson (Spearman) correlations are reported above (below) the diagonal. P-values are listed in parentheses. EMPL_OPT is the Black-Scholes value of annual option grants to rank-and-file employees. CEO_OPT is the Black-Scholes value of annual option grants to CEOs. CEO_RSTK is the value of annual restricted stock grants to CEO. All other variables are defined in Appendix A.
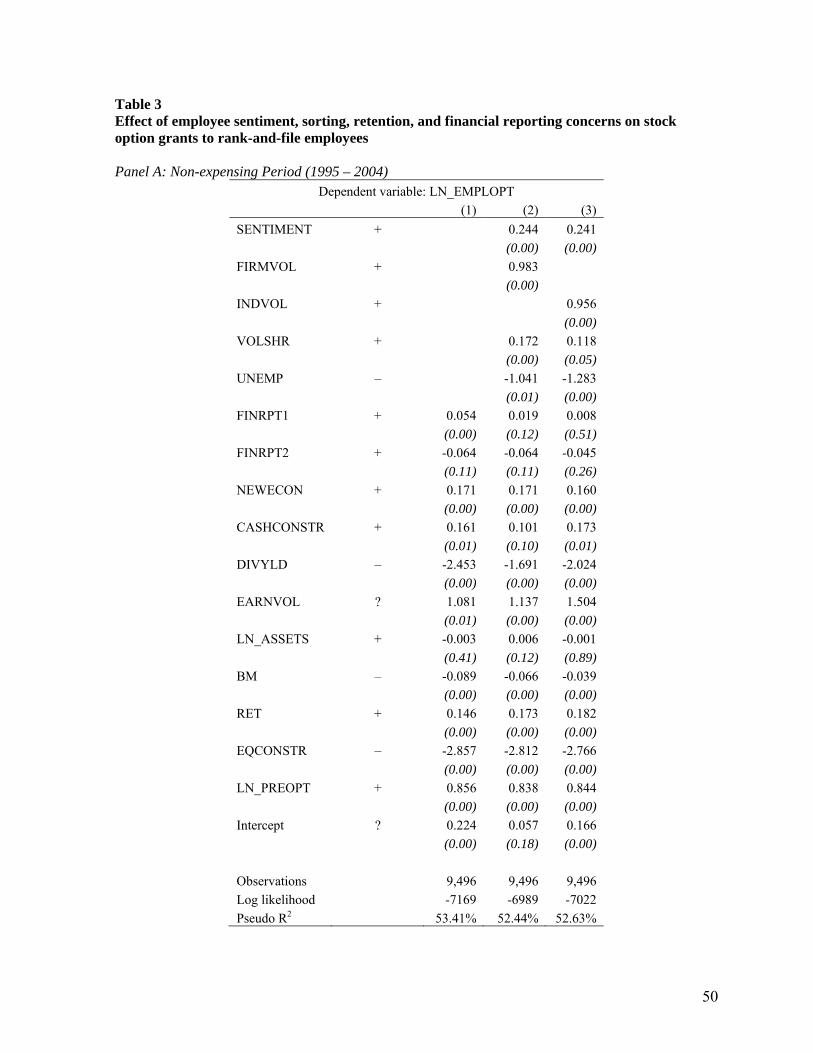
50
Table 3 Effect of employee sentiment, sorting, retention, and financial reporting concerns on stock option grants to rank-and-file employees Panel A: Non-expensing Period (1995 – 2004)
Dependent variable: LN_EMPLOPT (1) (2) (3) SENTIMENT + 0.244 0.241 (0.00) (0.00) FIRMVOL + 0.983 (0.00) INDVOL + 0.956 (0.00) VOLSHR + 0.172 0.118 (0.00) (0.05) UNEMP – -1.041 -1.283 (0.01) (0.00) FINRPT1 + 0.054 0.019 0.008 (0.00) (0.12) (0.51) FINRPT2 + -0.064 -0.064 -0.045 (0.11) (0.11) (0.26) NEWECON + 0.171 0.171 0.160 (0.00) (0.00) (0.00) CASHCONSTR + 0.161 0.101 0.173 (0.01) (0.10) (0.01) DIVYLD – -2.453 -1.691 -2.024 (0.00) (0.00) (0.00) EARNVOL ? 1.081 1.137 1.504 (0.01) (0.00) (0.00) LN_ASSETS + -0.003 0.006 -0.001 (0.41) (0.12) (0.89) BM – -0.089 -0.066 -0.039 (0.00) (0.00) (0.00) RET + 0.146 0.173 0.182 (0.00) (0.00) (0.00) EQCONSTR – -2.857 -2.812 -2.766 (0.00) (0.00) (0.00) LN_PREOPT + 0.856 0.838 0.844 (0.00) (0.00) (0.00) Intercept ? 0.224 0.057 0.166 (0.00) (0.18) (0.00) Observations 9,496 9,496 9,496 Log likelihood -7169 -6989 -7022 Pseudo R2 53.41% 52.44% 52.63%
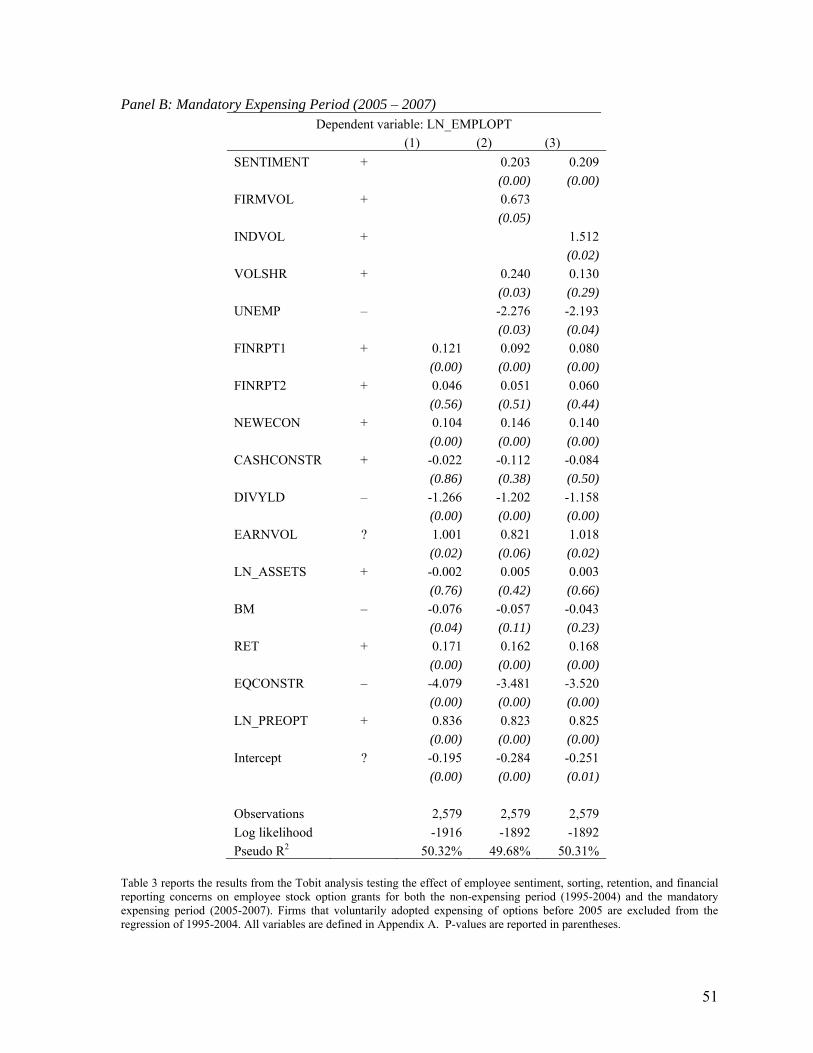
51
Panel B: Mandatory Expensing Period (2005 – 2007) Dependent variable: LN_EMPLOPT
(1) (2) (3) SENTIMENT + 0.203 0.209 (0.00) (0.00) FIRMVOL + 0.673 (0.05) INDVOL + 1.512 (0.02) VOLSHR + 0.240 0.130 (0.03) (0.29) UNEMP – -2.276 -2.193 (0.03) (0.04) FINRPT1 + 0.121 0.092 0.080 (0.00) (0.00) (0.00) FINRPT2 + 0.046 0.051 0.060 (0.56) (0.51) (0.44) NEWECON + 0.104 0.146 0.140 (0.00) (0.00) (0.00) CASHCONSTR + -0.022 -0.112 -0.084 (0.86) (0.38) (0.50) DIVYLD – -1.266 -1.202 -1.158 (0.00) (0.00) (0.00) EARNVOL ? 1.001 0.821 1.018 (0.02) (0.06) (0.02) LN_ASSETS + -0.002 0.005 0.003 (0.76) (0.42) (0.66) BM – -0.076 -0.057 -0.043 (0.04) (0.11) (0.23) RET + 0.171 0.162 0.168 (0.00) (0.00) (0.00) EQCONSTR – -4.079 -3.481 -3.520 (0.00) (0.00) (0.00) LN_PREOPT + 0.836 0.823 0.825 (0.00) (0.00) (0.00) Intercept ? -0.195 -0.284 -0.251 (0.00) (0.00) (0.01) Observations 2,579 2,579 2,579 Log likelihood -1916 -1892 -1892 Pseudo R2 50.32% 49.68% 50.31%
Table 3 reports the results from the Tobit analysis testing the effect of employee sentiment, sorting, retention, and financial reporting concerns on employee stock option grants for both the non-expensing period (1995-2004) and the mandatory expensing period (2005-2007). Firms that voluntarily adopted expensing of options before 2005 are excluded from the regression of 1995-2004. All variables are defined in Appendix A. P-values are reported in parentheses.
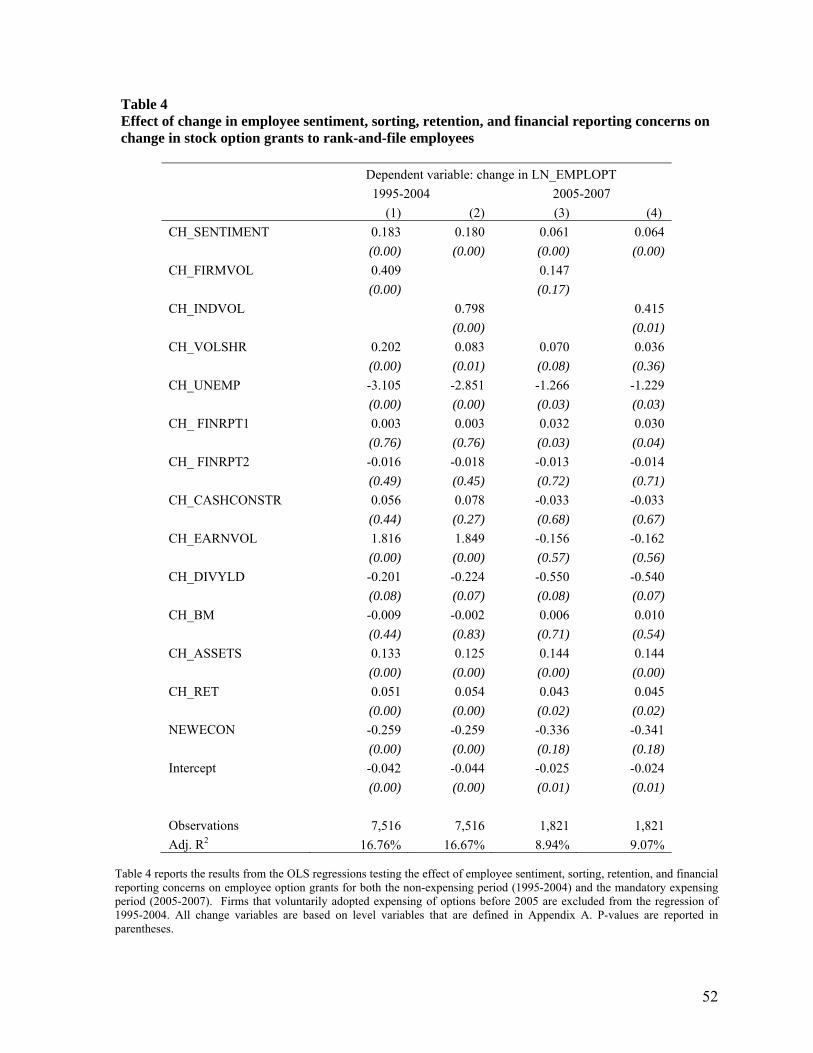
52
Table 4 Effect of change in employee sentiment, sorting, retention, and financial reporting concerns on change in stock option grants to rank-and-file employees
Dependent variable: change in LN_EMPLOPT 1995-2004 2005-2007 (1) (2) (3) (4) CH_SENTIMENT 0.183 0.180 0.061 0.064 (0.00) (0.00) (0.00) (0.00) CH_FIRMVOL 0.409 0.147 (0.00) (0.17) CH_INDVOL 0.798 0.415 (0.00) (0.01) CH_VOLSHR 0.202 0.083 0.070 0.036 (0.00) (0.01) (0.08) (0.36) CH_UNEMP -3.105 -2.851 -1.266 -1.229 (0.00) (0.00) (0.03) (0.03) CH_ FINRPT1 0.003 0.003 0.032 0.030 (0.76) (0.76) (0.03) (0.04) CH_ FINRPT2 -0.016 -0.018 -0.013 -0.014 (0.49) (0.45) (0.72) (0.71) CH_CASHCONSTR 0.056 0.078 -0.033 -0.033 (0.44) (0.27) (0.68) (0.67) CH_EARNVOL 1.816 1.849 -0.156 -0.162 (0.00) (0.00) (0.57) (0.56) CH_DIVYLD -0.201 -0.224 -0.550 -0.540 (0.08) (0.07) (0.08) (0.07) CH_BM -0.009 -0.002 0.006 0.010 (0.44) (0.83) (0.71) (0.54) CH_ASSETS 0.133 0.125 0.144 0.144 (0.00) (0.00) (0.00) (0.00) CH_RET 0.051 0.054 0.043 0.045 (0.00) (0.00) (0.02) (0.02) NEWECON -0.259 -0.259 -0.336 -0.341 (0.00) (0.00) (0.18) (0.18) Intercept -0.042 -0.044 -0.025 -0.024 (0.00) (0.00) (0.01) (0.01) Observations 7,516 7,516 1,821 1,821 Adj. R2 16.76% 16.67% 8.94% 9.07%
Table 4 reports the results from the OLS regressions testing the effect of employee sentiment, sorting, retention, and financial reporting concerns on employee option grants for both the non-expensing period (1995-2004) and the mandatory expensing period (2005-2007). Firms that voluntarily adopted expensing of options before 2005 are excluded from the regression of 1995-2004. All change variables are based on level variables that are defined in Appendix A. P-values are reported in parentheses.
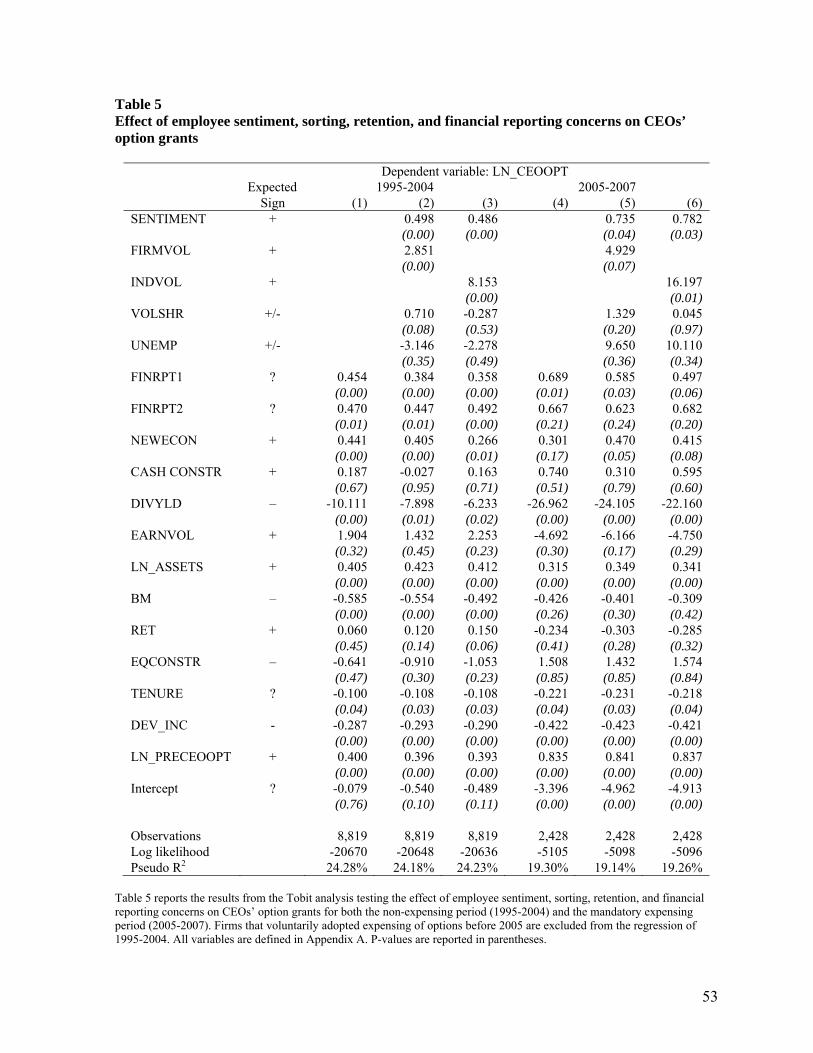
53
Table 5 Effect of employee sentiment, sorting, retention, and financial reporting concerns on CEOs’ option grants
Dependent variable: LN_CEOOPT Expected 1995-2004 2005-2007 Sign (1) (2) (3) (4) (5) (6) SENTIMENT + 0.498 0.486 0.735 0.782 (0.00) (0.00) (0.04) (0.03) FIRMVOL + 2.851 4.929 (0.00) (0.07) INDVOL + 8.153 16.197 (0.00) (0.01) VOLSHR +/- 0.710 -0.287 1.329 0.045 (0.08) (0.53) (0.20) (0.97) UNEMP +/- -3.146 -2.278 9.650 10.110 (0.35) (0.49) (0.36) (0.34) FINRPT1 ? 0.454 0.384 0.358 0.689 0.585 0.497 (0.00) (0.00) (0.00) (0.01) (0.03) (0.06) FINRPT2 ? 0.470 0.447 0.492 0.667 0.623 0.682 (0.01) (0.01) (0.00) (0.21) (0.24) (0.20) NEWECON + 0.441 0.405 0.266 0.301 0.470 0.415 (0.00) (0.00) (0.01) (0.17) (0.05) (0.08) CASH CONSTR + 0.187 -0.027 0.163 0.740 0.310 0.595 (0.67) (0.95) (0.71) (0.51) (0.79) (0.60) DIVYLD – -10.111 -7.898 -6.233 -26.962 -24.105 -22.160 (0.00) (0.01) (0.02) (0.00) (0.00) (0.00) EARNVOL + 1.904 1.432 2.253 -4.692 -6.166 -4.750 (0.32) (0.45) (0.23) (0.30) (0.17) (0.29) LN_ASSETS + 0.405 0.423 0.412 0.315 0.349 0.341 (0.00) (0.00) (0.00) (0.00) (0.00) (0.00) BM – -0.585 -0.554 -0.492 -0.426 -0.401 -0.309 (0.00) (0.00) (0.00) (0.26) (0.30) (0.42) RET + 0.060 0.120 0.150 -0.234 -0.303 -0.285 (0.45) (0.14) (0.06) (0.41) (0.28) (0.32) EQCONSTR – -0.641 -0.910 -1.053 1.508 1.432 1.574 (0.47) (0.30) (0.23) (0.85) (0.85) (0.84) TENURE ? -0.100 -0.108 -0.108 -0.221 -0.231 -0.218 (0.04) (0.03) (0.03) (0.04) (0.03) (0.04) DEV_INC - -0.287 -0.293 -0.290 -0.422 -0.423 -0.421 (0.00) (0.00) (0.00) (0.00) (0.00) (0.00) LN_PRECEOOPT + 0.400 0.396 0.393 0.835 0.841 0.837 (0.00) (0.00) (0.00) (0.00) (0.00) (0.00) Intercept ? -0.079 -0.540 -0.489 -3.396 -4.962 -4.913 (0.76) (0.10) (0.11) (0.00) (0.00) (0.00) Observations 8,819 8,819 8,819 2,428 2,428 2,428 Log likelihood -20670 -20648 -20636 -5105 -5098 -5096 Pseudo R2 24.28% 24.18% 24.23% 19.30% 19.14% 19.26%
Table 5 reports the results from the Tobit analysis testing the effect of employee sentiment, sorting, retention, and financial reporting concerns on CEOs’ option grants for both the non-expensing period (1995-2004) and the mandatory expensing period (2005-2007). Firms that voluntarily adopted expensing of options before 2005 are excluded from the regression of 1995-2004. All variables are defined in Appendix A. P-values are reported in parentheses.
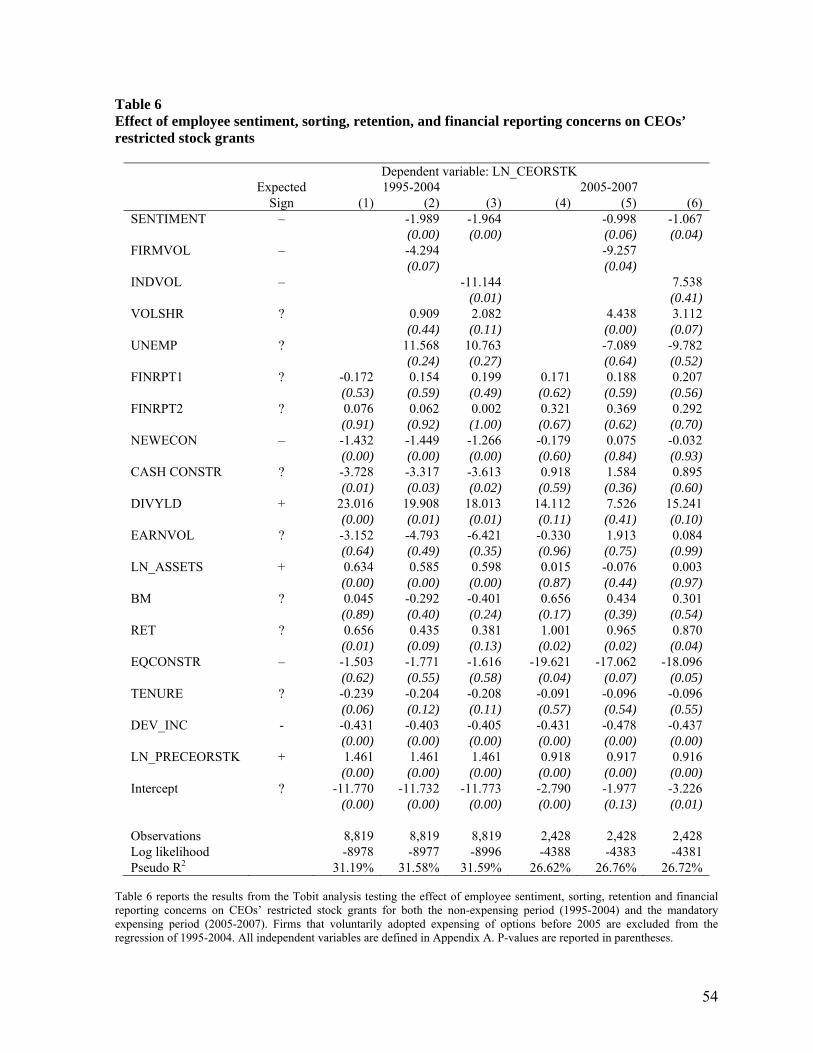
54
Table 6 Effect of employee sentiment, sorting, retention, and financial reporting concerns on CEOs’ restricted stock grants
Dependent variable: LN_CEORSTK Expected 1995-2004 2005-2007 Sign (1) (2) (3) (4) (5) (6) SENTIMENT – -1.989 -1.964 -0.998 -1.067 (0.00) (0.00) (0.06) (0.04) FIRMVOL – -4.294 -9.257 (0.07) (0.04) INDVOL – -11.144 7.538 (0.01) (0.41) VOLSHR ? 0.909 2.082 4.438 3.112 (0.44) (0.11) (0.00) (0.07) UNEMP ? 11.568 10.763 -7.089 -9.782 (0.24) (0.27) (0.64) (0.52) FINRPT1 ? -0.172 0.154 0.199 0.171 0.188 0.207 (0.53) (0.59) (0.49) (0.62) (0.59) (0.56) FINRPT2 ? 0.076 0.062 0.002 0.321 0.369 0.292 (0.91) (0.92) (1.00) (0.67) (0.62) (0.70) NEWECON – -1.432 -1.449 -1.266 -0.179 0.075 -0.032 (0.00) (0.00) (0.00) (0.60) (0.84) (0.93) CASH CONSTR ? -3.728 -3.317 -3.613 0.918 1.584 0.895 (0.01) (0.03) (0.02) (0.59) (0.36) (0.60) DIVYLD + 23.016 19.908 18.013 14.112 7.526 15.241 (0.00) (0.01) (0.01) (0.11) (0.41) (0.10) EARNVOL ? -3.152 -4.793 -6.421 -0.330 1.913 0.084 (0.64) (0.49) (0.35) (0.96) (0.75) (0.99) LN_ASSETS + 0.634 0.585 0.598 0.015 -0.076 0.003 (0.00) (0.00) (0.00) (0.87) (0.44) (0.97) BM ? 0.045 -0.292 -0.401 0.656 0.434 0.301 (0.89) (0.40) (0.24) (0.17) (0.39) (0.54) RET ? 0.656 0.435 0.381 1.001 0.965 0.870 (0.01) (0.09) (0.13) (0.02) (0.02) (0.04) EQCONSTR – -1.503 -1.771 -1.616 -19.621 -17.062 -18.096 (0.62) (0.55) (0.58) (0.04) (0.07) (0.05) TENURE ? -0.239 -0.204 -0.208 -0.091 -0.096 -0.096 (0.06) (0.12) (0.11) (0.57) (0.54) (0.55) DEV_INC - -0.431 -0.403 -0.405 -0.431 -0.478 -0.437 (0.00) (0.00) (0.00) (0.00) (0.00) (0.00) LN_PRECEORSTK + 1.461 1.461 1.461 0.918 0.917 0.916 (0.00) (0.00) (0.00) (0.00) (0.00) (0.00) Intercept ? -11.770 -11.732 -11.773 -2.790 -1.977 -3.226 (0.00) (0.00) (0.00) (0.00) (0.13) (0.01) Observations 8,819 8,819 8,819 2,428 2,428 2,428 Log likelihood -8978 -8977 -8996 -4388 -4383 -4381 Pseudo R2 31.19% 31.58% 31.59% 26.62% 26.76% 26.72%
Table 6 reports the results from the Tobit analysis testing the effect of employee sentiment, sorting, retention and financial reporting concerns on CEOs’ restricted stock grants for both the non-expensing period (1995-2004) and the mandatory expensing period (2005-2007). Firms that voluntarily adopted expensing of options before 2005 are excluded from the regression of 1995-2004. All independent variables are defined in Appendix A. P-values are reported in parentheses.
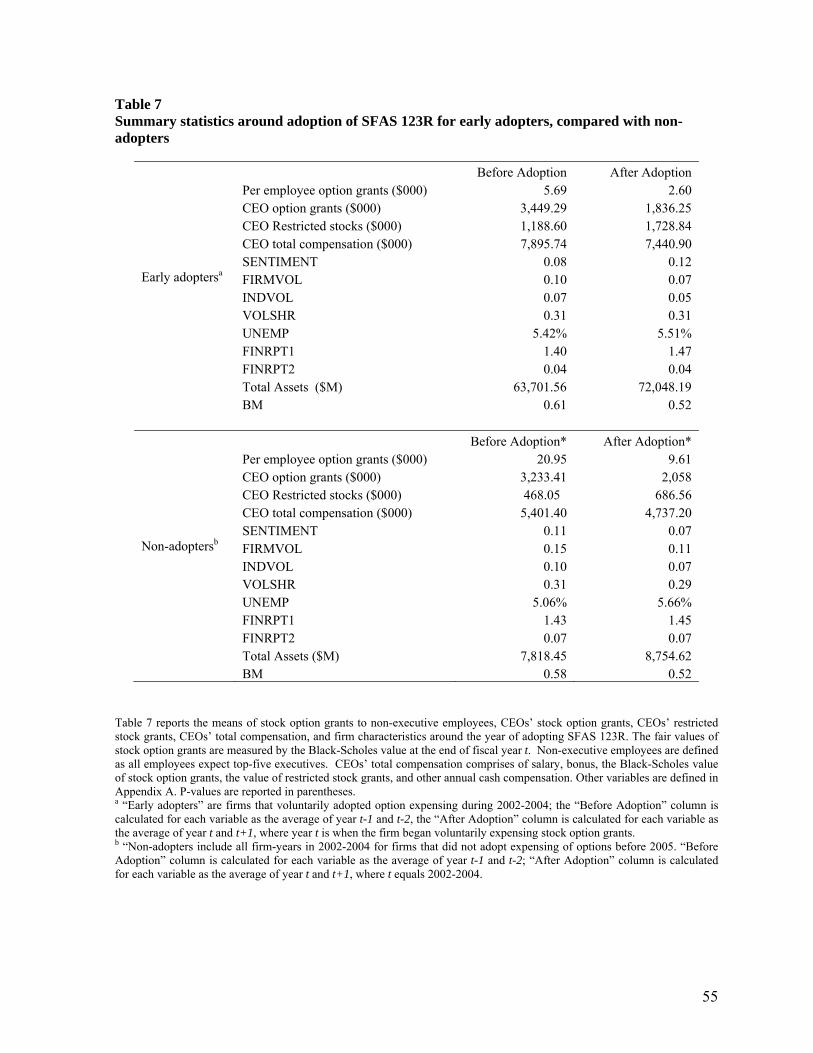
55
Table 7 Summary statistics around adoption of SFAS 123R for early adopters, compared with non-adopters
Before Adoption After Adoption Per employee option grants ($000) 5.69 2.60 CEO option grants ($000) 3,449.29 1,836.25 CEO Restricted stocks ($000) 1,188.60 1,728.84 CEO total compensation ($000) 7,895.74 7,440.90 SENTIMENT 0.08 0.12 Early adoptersa FIRMVOL 0.10 0.07 INDVOL 0.07 0.05 VOLSHR 0.31 0.31 UNEMP 5.42% 5.51% FINRPT1 1.40 1.47 FINRPT2 0.04 0.04 Total Assets ($M) 63,701.56 72,048.19 BM 0.61 0.52 Before Adoption* After Adoption* Per employee option grants ($000) 20.95 9.61 CEO option grants ($000) 3,233.41 2,058 CEO Restricted stocks ($000) 468.05 686.56 CEO total compensation ($000) 5,401.40 4,737.20 SENTIMENT 0.11 0.07 Non-adoptersb FIRMVOL 0.15 0.11 INDVOL 0.10 0.07 VOLSHR 0.31 0.29 UNEMP 5.06% 5.66% FINRPT1 1.43 1.45 FINRPT2 0.07 0.07 Total Assets ($M) 7,818.45 8,754.62 BM 0.58 0.52
Table 7 reports the means of stock option grants to non-executive employees, CEOs’ stock option grants, CEOs’ restricted stock grants, CEOs’ total compensation, and firm characteristics around the year of adopting SFAS 123R. The fair values of stock option grants are measured by the Black-Scholes value at the end of fiscal year t. Non-executive employees are defined as all employees expect top-five executives. CEOs’ total compensation comprises of salary, bonus, the Black-Scholes value of stock option grants, the value of restricted stock grants, and other annual cash compensation. Other variables are defined in Appendix A. P-values are reported in parentheses. a “Early adopters” are firms that voluntarily adopted option expensing during 2002-2004; the “Before Adoption” column is calculated for each variable as the average of year t-1 and t-2, the “After Adoption” column is calculated for each variable as the average of year t and t+1, where year t is when the firm began voluntarily expensing stock option grants. b “Non-adopters include all firm-years in 2002-2004 for firms that did not adopt expensing of options before 2005. “Before Adoption” column is calculated for each variable as the average of year t-1 and t-2; “After Adoption” column is calculated for each variable as the average of year t and t+1, where t equals 2002-2004.
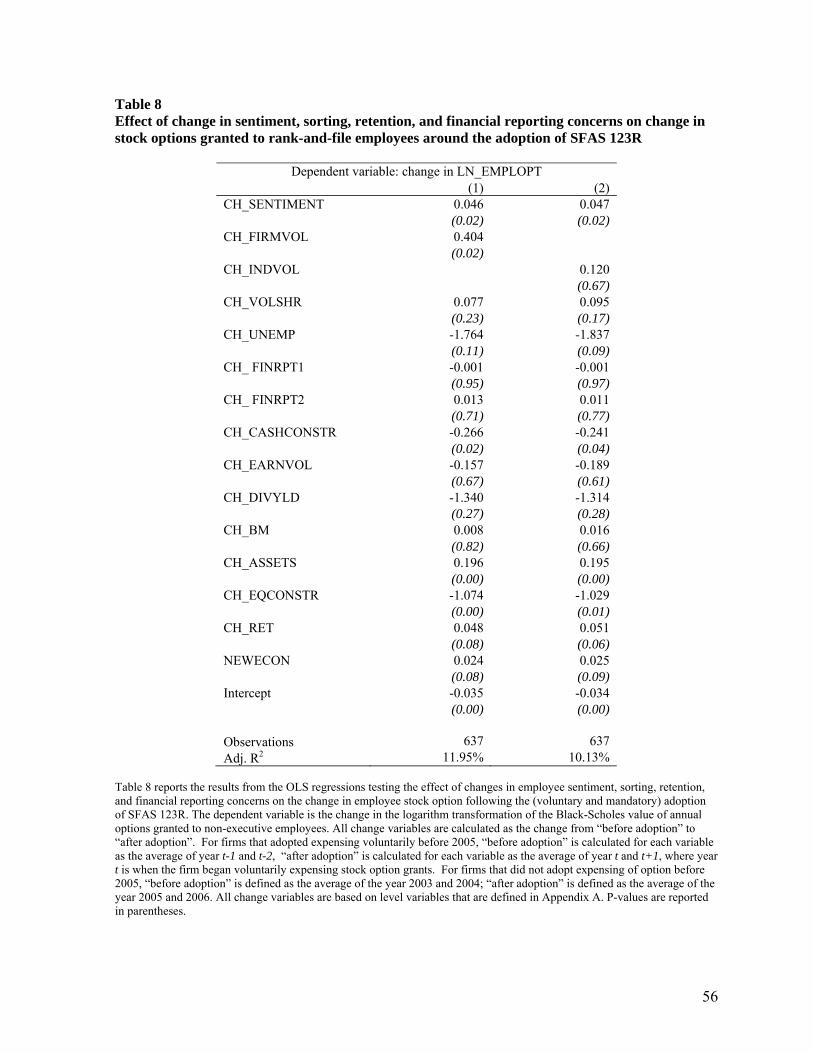
56
Table 8 Effect of change in sentiment, sorting, retention, and financial reporting concerns on change in stock options granted to rank-and-file employees around the adoption of SFAS 123R
Dependent variable: change in LN_EMPLOPT (1) (2) CH_SENTIMENT 0.046 0.047 (0.02) (0.02) CH_FIRMVOL 0.404 (0.02) CH_INDVOL 0.120 (0.67) CH_VOLSHR 0.077 0.095 (0.23) (0.17) CH_UNEMP -1.764 -1.837 (0.11) (0.09) CH_ FINRPT1 -0.001 -0.001 (0.95) (0.97) CH_ FINRPT2 0.013 0.011 (0.71) (0.77) CH_CASHCONSTR -0.266 -0.241 (0.02) (0.04) CH_EARNVOL -0.157 -0.189 (0.67) (0.61) CH_DIVYLD -1.340 -1.314 (0.27) (0.28) CH_BM 0.008 0.016 (0.82) (0.66) CH_ASSETS 0.196 0.195 (0.00) (0.00) CH_EQCONSTR -1.074 -1.029 (0.00) (0.01) CH_RET 0.048 0.051 (0.08) (0.06) NEWECON 0.024 0.025 (0.08) (0.09) Intercept -0.035 -0.034 (0.00) (0.00) Observations 637 637 Adj. R2 11.95% 10.13%
Table 8 reports the results from the OLS regressions testing the effect of changes in employee sentiment, sorting, retention, and financial reporting concerns on the change in employee stock option following the (voluntary and mandatory) adoption of SFAS 123R. The dependent variable is the change in the logarithm transformation of the Black-Scholes value of annual options granted to non-executive employees. All change variables are calculated as the change from “before adoption” to “after adoption”. For firms that adopted expensing voluntarily before 2005, “before adoption” is calculated for each variable as the average of year t-1 and t-2, “after adoption” is calculated for each variable as the average of year t and t+1, where year t is when the firm began voluntarily expensing stock option grants. For firms that did not adopt expensing of option before 2005, “before adoption” is defined as the average of the year 2003 and 2004; “after adoption” is defined as the average of the year 2005 and 2006. All change variables are based on level variables that are defined in Appendix A. P-values are reported in parentheses.