the effect of afaptive parameters on the …
TRANSCRIPT

ii
DEVELOPMENT OF TIMBER CONCRETE COMPOSITE (TCC) BEAM WITH
POST-TENSIONING
WISSAM MUSHINA OBEED
A thesis submitted in
fulfillment of the requirement for the award of the
Doctor of Philosophy
Faculty of Civil Engineering and Built Environment
Universiti Tun Hussein Onn Malaysia
MARCH 2020
PTTAPERP
USTAKAAN TUNKU T
UN AMINAH
iv
ACKNOWLEDGEMENT
I would like to express my utmost gratitude and appreciations to my main
supervisor Associate Prof. Dr. David Yeoh for his guidance,
encouragement and assistance throughout this amazing research journey.
My sincere appreciation also extends to my co-supervisors Dr. Norhayati
Abd Ghafar and Koh Heng Boon for their assistance and encouragement.
Thanks and acknowledgement to the all lectures at Structural
Engineering Department of UTHM, Specially, Prof. Ir. Dr. Abdul Aziz bin
Abdul Samad, Associate Prof. Dr. Norwati Jamalulddin and Dr.
Sallehulddin Shah Ayop from for the assistance during this research.
PTTAPERP
USTAKAAN TUNKU T
UN AMINAH

v
ABSTRACT
Post-tensioning is a method of reinforcing (strengthening) concrete or other materials
with high-strength steel strands or bars. The timber type that is used in all researches is
the engineering timber products laminated veneer lumber (LVL) and glue-laminated
wood (Glu-Lam), while avoiding using natural timber due to its properties’ variety.
More recent improvement is using post-tensioning technique for the engineering timber
products. The main material in this research is natural Kempas timber. The primary
objective of this research is to develop of a method of timber beam post-tensioning and
proposed empirical Equation to predict the bending moment capacity for timber beam
and timber concrete composite beam through the bending strength properties. The
experimental program is divided into 3 major phases across the duration of this study.
Phase A present post-tensioning method, this phase indicate two methods of post-
tensioning “forced bending jacking PT-B” and “pre-stressing jacking PT-J”. Phase B
present timber bending performance in term of (strength and failure behavior), include 4
point bending tests for timber beams and post-tensioning timber beams, the timber beam
size (40 mm x90 mm x1200 mm) the tendon type is threaded rod bar with two colors
silver color (9.4 mm) and black color (8.85 mm) . Phase C involved post-tensioned
timber concrete composite beam (the concrete layer is 65 mm) Bending Performance.
From the test results for the two methods of pre-stressing it is clear that pre-stressing
Jacking give higher residual deflection 98.2 % for silver color rod bar against black
color with 88.8 % residual deflection. So this type of rod bar (silver color with long nut
coupling) is the more efficient in use due to the high contact friction surface area for
long coupling nut. The bending tests of post-tensioned beams show the range of bending
strength capacity increasing 12 % to 46 %. There were three types of failure is tensile,
compression and splitting shear failure depending on the timber quality (degree of
natural effect). The PT-TCC give bending strength increment according to degree of
composite action 500 mm, 100 mm and 70 mm screw spacing is 68 %, 85 % and 150
% respectively. The empirical Equation derived for bending moment capacity for post-
tensioning Kempas timber beam is basically depended on the experimental relation
between vertical deflection and rod bar strain. The empirical Equation shows 3.06 kN
PTTAPERP
USTAKAAN TUNKU T
UN AMINAH

vi
constant difference for the theoretical equation and the equation form is PTempirical =
8EI∆
eL2 − 3.06. In the case of PT-TCC the proposed equation depend on the concept of
connector slip modulus. A three paths of estimation were discussed depend on push out
test slip modulus. The gamma design method show that the slip modulus of pushout test
gives a proper estimation in the case of PT-TCC specimens bending strength design.
PTTAPERP
USTAKAAN TUNKU T
UN AMINAH

vii
ABSTRAK
Post-tensioning adalah kaedah pengukuhan (menguatkan) konkrit atau bahan lain
dengan helai atau bar keluli kekuatan tinggi. Jenis kayu yang digunakan dalam semua
penyelidikan adalah produk kayu kejuruteraan kayu laminasi laminasi (LVL) dan kayu
berlapis-laminasi (Glu-Lam), sambil mengelakkan menggunakan kayu semulajadi
kerana pelbagai sifatnya. Penambahbaikan yang lebih baru menggunakan teknik pasca-
tegangan untuk produk kayu kejuruteraan. Bahan utama dalam kajian ini adalah kayu
Kempas semula jadi. Objektif utama penyelidikan ini adalah untuk membangunkan satu
kaedah rasuk balak kayu dan persamaan empirikal yang dicadangkan untuk meramalkan
kapasiti momen lentur bagi rasuk balak kayu dan rasuk konkrit balak melalui sifat
kekuatan lenturan. Program eksperimen dibahagikan kepada 3 fasa utama sepanjang
tempoh kajian ini. Fasa A iaito kaedah pasca tegangan menuinjukkan dua kaedah
"ketinggian terpaksa membongkok (PT-B) dan pra tekai abicu (PT-J). Tahap B,
menunjukkan prestasi lenturan kayu dari segi (kekuatan dan kegagalan tingkah laku),
termasuk 4 titik ujian lenturan untuk balak kayu dan bataiy bar pasca tegangan, saiz
balak kayu (40 mm x 90 mm x 1200 mm) tendon maralur dengan warma perak (9.4
mm) dan warna hitam (8.85 mm). Fasa C melibatkan balak komposit konkrit pasir
bertentangan (lapisan konkrit adalah 65 mm) prestasi lenturan. Dari hasil ujian untuk
kedua-dua kaedah pra-menekankan, bahawa pra menekanan bicu memberikan pesongan
sisa yang lebih tinggi 98.2 % untuk bar njukkan rod warna perak beterfens warna hitam
dengan pesongan sisa 88.8 %. Oleh itu, bar rod jenis ini (warna perak dengan
gandinganskru panjang) adalah lebih cekap digunakan kerana kawasan permukaan
geseran tinggi untuk ikatan sku yang panjang. Ujian lenturan rasuk pasca-tegangan
menunjukkan julat kapasiti kekuatan lenturan yang meningkat 12 % hingga 46 %.
Terdapat tiga jenis kegagalan ialah tegangan, pemampatan dan pemisahan kegagalan
ricih bergantung kepada kualiti kayu (darjah kesan semula jadi). PT-TCC memberikan
kenaikan kekuatan lenturan mengikut tahap tindakan komposit 500 mm, 100 mm dan 70
mm masing-masing adalah 68 %, 85 % dan 150 %. Persamaan empirical yang diperolehi
untuk kapasiti momen lentur untuk balak kayu Kempas pasca-tegangan pada dasarnya
bergantung pada hubungan eksperimen antara tegangan menegak dan tegangan bar.
PTTAPERP
USTAKAAN TUNKU T
UN AMINAH

viii
Persamaan empirikal menunjukkan perbezaan persamaan 3.06 kN untuk persamaan
teoretikal dan bentuk persamaan adalah PTempirical =8EI∆
eL2− 3.06. Dalam kes PT-TCC
persamaan yang dicadangkan bergantung kepada konsep modulus slip penyambung.
Tiga anggaran telah dibincangkan bergantung kepada modulus slip. Kaedah rekabentuk
gamma menunjukkan bahawa ujian modulus slip memberikan anggaran yang tepat
dalam kes reka bentuk kekuatan lenturan PT-TCC.
PTTAPERP
USTAKAAN TUNKU T
UN AMINAH

ix
TABLE OF CONTENTS
TITLE ii
DECLARATION iii
ACKNOWLEDGEMENT iv
ABSTRACT v
CONTENTS ix
LIST OF TABLES xiv
CHAPTER 1 INTRODUCTION 1
1.1 Introduction 1
1.2 Problem statement 5
1.3 Research objectives 6
1.4 Scope of work 7
1.5 Significance of the research 7
1.6 Thesis organization 8
CHAPTER 2 LITERATURE REVIEW 10
2.1 Introduction 9
2.2 Theoretical investigation of post-tensioning 10
2.3 Advantages of the pre-stressing system 11
2.4 Timber as construction material 12
2.5 Kempas timber according to MS 544 12
2.6 Influence of timber properties on structural application 13
2.7 Early attempts of pre-stressing timber 14
2.8 Timber beams pre-stressing method 15
2.8.1 Post-tensioning of glulam timber with steel tendons 16
2.8.2 Prestressed glulam timbers reinforced with steel bars 18
2.8.3 Post-tensioning glulam timber beams with basalt FRP
tendons 21
2.8.4 Application of a new system of self-tensioning 23
PTTAPERP
USTAKAAN TUNKU T
UN AMINAH

x
2.9 The post-tensioned timber beam behaviour 25
2.10 Post-tensioned timber elements according to
structural function 27
2.10.1 Post-tensioned timber beams and frames for gravity Loads 27
2.10.2 Bridge deck MTC stress laminated deck 28
2.11 The losses of timber pre-stressing force (long-term behaviour) 31
2.12 Examples of structures with unbonded post-tensioned timber 33
2.13 Timber concrete composite 36
2.14 Connections for composite concrete systems 39
2.15 Design methods of timber concrete composite elements 41
2.15.1 Exact method 42
2.15.2 Approximate method 42
2.15.3 Design procedure of timber concrete composite the EC5 43
2.16 Summary 45
CHAPTER 3 EXPERIMENTAL PROGRA MME 47
3.1 Introduction 47
3.2 Breakdown of experimental phases 47
3.3 Detail of the specimens 51
3.4 Material selections 53
3.4.1 Timber beams 53
3.4.2 Post-tensioning threaded rod bar 55
3.4.3 Concrete 56
3.5 Four point bending test 58
3.6 Preliminary post-tensioning method on small specimens 60
3.7 Post-tensioning by pre-stressing jack (PT-J) 65
3.8 Post-tensioning solution by forced-bending jacking 68
3.9 Post-tensioning by forced-bending method (the process) 72
3.10 Pushout test 76
3.11 Experimental Program for (Phase B and C) 79
3.12 TCC specimens’ detail 79
PTTAPERP
USTAKAAN TUNKU T
UN AMINAH

xi
3.13 Post-tensioned TCC specimen 82
3.14 Experimental program for phase D experimental analysis 85
3.15 Summary 86
CHAPTER 4 POST-TENSIONING METHOD (PHASE A) 87
4.1 Introduction 87
4.2 Material properties 87
4.2.1 Timber tests (bending and compression parallel to grain) 87
4.2.2 Threaded rod bar tests 91
4.3 Post-tensioning method and solution (Phase A) 92
4.3.1 The maximum safe cambering during posttensioningprocess 92
4.3.2 Post-tensioned method PT jacking 94
4.3.3 Post-tensioned method forced bending 95
4.4 Inference of post-tensioning force 97
4.5 The Post-tensioning method su mmary 102
CHAPTER 5 BENDING PERFORMANCE OF PT AND TCC BEAM 103
5.1 Introduction 103
5.2 Material properties 103
5.3 Push out connection test results of strength and stiffness 103
5.4 Bending performance of post-tensioned timber 107
5.4.1 The bending strength similarity groups 110
5.4.2 The post-tensioning methods groups 113
5.4.3 The type of rod bar groups 114
5.5 Behaviour of the timber beam only and PT beam 116
5.6 Bending performance of TCC 118
5.7 Bending performance of post-tensioning TCC beams 121
5.8 Summary of bending performance beams 127
CHAPTER 6 MOMENT STRENGTH CAPACITY PREDICTION 134
6.1 Introduction 129
6.2 Theoretical prediction of post-tensioning force 129
PTTAPERP
USTAKAAN TUNKU T
UN AMINAH

xii
6.3 Experimental estimation for PT beams 130
6.4 Proposed empirical formula to predict moment strength 135
6.5 Proposed empirical formula to predict moment strength 139
6.6 Summary 144
CHAPTER 7 CONCLUSION 145
7.1 Post-tensioning method (objective 1) 145
7.2 Bending performance of the PT timber beam and the TCC 145
7.3 Moment strength capacity prediction of PT timber beam 146
7.4 Research contribution 147
7.5 Recommendations for future research 147
REFERENCES 148
APPENDICES
157
PTTAPERP
USTAKAAN TUNKU T
UN AMINAH

xiii
LIST OF TABLES
Table 3.1: The supplementary tests for the timber 55
Table 3.2: The Kempas timber density and moisture
content
57
Table 3.3: Mix proportion for 1 m3 concrete mix design
(DOE ) for characteristic compressive
strength at 35 MPa
59
Table 3.4: The compressive strength of cubes at age 7
and 28 days
59
Table 3.5: The prepared specimens for timber beam
and reinforced beam
65
Table 3.6: 3-Points bending results (single section
specimens)
66
Table 3.7: The dimensions detail of the screw 74
Table 3.8: Screw size detail 78
Table 3.9: Detail of TCC for bending test 82
Table3.10: Schematic drawing of specimen for timber
beam and TCC beams
83
Table 3.11: Specimen for timber beams and TCC beams 84
Table 3.12: Detail of PT-TCC specimens for bending
test
85
Table 4.1: The experimental results of collapse load at
4 point bending test, corresponding bending
moment, bending stress, and modulus of
elasticity
91
Table 4.2: The experimental results of compressive
stress
93
Table 4.3: The experimental results of tensile yield and
ultimate strength for the black and silver rod
94
PTTAPERP
USTAKAAN TUNKU T
UN AMINAH

xiv
bars
Table 4.4: Theoretical calculation data for equivalent
post-tensioning force to bending
96
Table 4.5: The total theoretical stress in the
compression zone and its components.
97
Table 4.6: Residual deflection for timber in case of
post-tensioning jack device
98
Table 4.7: Residual deflection for bending jacking
process at end of beams using long nuts
coupling
99
Table 4.8: Post-tensioning force estimation 1st Method
(rod bar deformation) from the experiment.
101
Table 4.9: Post-tensioning force estimation 2nd
and
3rd
Method (bending force equivalent) and
theoretical estimation.
103
Table 4.10: The PT force estimation in 3 methods error
% (PT method-PT rod strain)
104
Table 5.1: Fmax, slip modules of service limit state (ks)
and slip modules of ultimate limit state (ku)
for screws
107
Table5.2: The summary of preliminary test results 109
Table 5.3: The results of the 4-point bending test of
post-tensioning for all tested specimens
113
Table 5.4: 1st group maximum bending moment and
(IF.B.M)
114
Table 5.5: 2nd group maximum bending moment and
(IF.B.M)
115
Table 5.6: 3rd group maximum bending moment and
(IF.B.M)
115
Table 5.7: Maximum bending moment and (IF.B.M)
for B.J. method
116
PTTAPERP
USTAKAAN TUNKU T
UN AMINAH

xv
Table 5.8: Maximum bending moment and (IF.B.M)
for P.J. method
117
Table 5.9: Four point bending tests for post-tensioned
beam timber using the silver rod bar
119
Table 5.10: 4-point bending tests for post-tensioned
beam timber using the black rod bar
120
Table 5.11: Data analysis for the behaviour of the timber
beam and the post-tensioned beam.
121
Table 5.12: Maximum load and horizontal and vertical
displacement of TCC specimen with 3 and
10 screw connectors
122
Table 5.13: The behaviour of failure sequences
according to bending moment-deflection
curves for 10 screws
124
Table 5.14: The behaviour of failure sequences
according to bending moment-deflection
curves for 3 & 10 screws
125
Table 5.15: The behaviour of failure sequences
according to bending moment-deflection
curves for 3 screws
128
Table 5.16: The behaviour of failure sequences
according to bending moment-deflection
curves for 10 screws
130
Table 5.17: Maximum load for Timber, TCC specimen
(with 3 and 10 screws) and displacement.
131
Table 6.1: The theoretical post-tensioning force
estimation for experimental specimens
134
Table 6.2: The theoretical post-tensioning force
estimation for experimental specimens
137
Table 6.3: The experimental bending moment due to
post-tensioning force
138
PTTAPERP
USTAKAAN TUNKU T
UN AMINAH

xvi
Table 6.4: The theoretical post-tensioning force
estimation and experimental post-tensioning
force
140
Table 6.5: The theoretical post-tensioning force
estimation for experimental specimens
141
Table 6.6: The theoretical post-tensioning force
estimation for experimental specimens
142
Table 6.7: The bending stress estimation Method1,
bending stiffness EI and bending stress σm2
144
Table 6.8: The equivalents slip modulus according to
Method 2
145
Table 6.9: The bending stress estimation Method2,
bending stiffness EI and bending stress σm2
145
Table 6.10: The bending stress estimation method 3 146
Table 6.11: The bending stress estimation comparison
between the methods 1, 2, 3
147
PTTAPERP
USTAKAAN TUNKU T
UN AMINAH

xvii
LIST OF FIGURES
Figure1.1: Construction of unbonded post-tensioned
timber frame
3
Figure 1.2: Layout of post-tensioned timber frame 4
Figure 2.1: Stress profiles from post-tensioning and
load application
10
Figure 2.2: The sufficient bond between the steel
tendon and the timber
17
Figure 2.3: a) Typical post-tensioning arrangement of B
Series beams; b) Application and
monitoring of post-tension force
18
Figure 2.4: The cross section types: T series:
unreinforced beams, simply strengthened
beams with upper and lower steel bar, 10
mm in diameter; R series: strengthened
beams with an upper steel bar, 10 mm in
diameter; and P series: a lower prestressed
bar, 10 mm in diameter.
19
Figure 2.5: The mechanical tensioning device for
applying the pretension to bar
20
Figure 2.6: Detail of the attachment to steel bar end in
the mechanical tensioning device for
applying the pretension to bar
20
Figure 2.7: Diagram of initial beam preparation for R,
U and B series
22
Figure 2.8: The sufficient bond between the FRP
tendon and the timber
23
Figure 2.9: Self-tensioning devices at the supports of
the structural element
24
Figure 2.10: 3D-Prototype of the mechanical device 25
PTTAPERP
USTAKAAN TUNKU T
UN AMINAH

xviii
Figure 2.11: a) Typical tensile failure of unreinforced
glulam timber; b)Typical compressive/shear
failure of post-tensioned glulam timber
26
Figure 2.12: Post-tensioned LVL timber box beam with
a draped tendon
28
Figure 2.13: a) LNL Deck b) TNL Deck 29
Figure 2.14: Cross-section of a typical LSL deck 30
Figure 2.15: Cross-section of LVL hollow core post-
tensioned slab-on-girder bridge
31
Figure 2.16: a) Bridge for pedestrians in Murau. Austria
b) The Swiss Centre for Global Dialogue,
with post-tensioned timber beams
34
Figure 2.17: Buildings with post-tensioned timber walls
(a): Visualisation of the Nelson
Marlborough Institute of Technology
building (b): The Carterton Events Center
35
Figure 2.18: Buildings with post-tensioned timber
frames a): The Te Ara Hihiko building b):
The Merritt building (McGar,) c):
Connection of the St Elmo Courts
(Chapman,) d): The ETH House of Natural
Resources on the campus site of ETH in
Zurich
36
Figure 2.19: The concept of composite action 38
Figure 2.20: Symmetrical push-out test of TCC 39
Figure 2.21: A nail 40
Figure2.22: Lag screws 41
Figure 2.23: Cross-section (left) and stress distribution
(right) of a composite beam with partial
shear connection
45
Figure 3.1: Experimental program flow chart 48
PTTAPERP
USTAKAAN TUNKU T
UN AMINAH

xix
Figure 3.2: Phase A detail 49
Figure 3.3: Phase B detail 49
Figure 3.4: Phase C detail 50
Figure 3.5: Phase D detail 50
Figure 3.6: Details of cross section types: (a) Timber
beam, (b) Post-tensioned Timber beam
51
Figure 3.7: Post-tensioned timber beam by using end
plate and screw (Phase 2)
52
Figure 3.8: (a) Post-tensioned timber concrete
composite floor cross section (b) cross
section x-x (Phase 3)
52
Figure 3.9: (a) Kempas timber beam type (b) groove
timber beam used in posttensioned
specimens
54
Figure 3.10: (a) black rod bar with double hex nut (b)
silver rod bar with long coupling length
56
Figure 3.11: Tensile tests of rod bars (a) black rod bar
(b) silver rod bar
56
Figure 3.12: (a) Cubes test (b) Slump test 58
Figure 3.13: (a) Experiment set-up for 4 point bending
test EN 408:1995. (b) Schematic diagram
for 4 point bending test
59
Figure 3.14: Solid Timber Beam 60
Figure 3.15: Threaded steel rod 61
Figure 3.16: Fabricated angle steel C Channel Used for
Beams’ specimens
61
Figure 3.17: Hollow steel supports (a) front view (b) side
view (c) set-up
61
Figure 3.18: Preparing the Specimens to be stressed 62
Figure 3.19: The pair of C channel with upper plate to
fix the end of beams
65
PTTAPERP
USTAKAAN TUNKU T
UN AMINAH

xx
Figure 3.20: The chair part which used at the end of
beam to transfer load from jack to end plate
of beam
66
Figure 3.21: The total components of post-tensioning
system
66
Figure 3.22: The dial gauge position in total system of
post-tensioning
67
Figure 3.23: (a) Deflection due post-tensioning force and
bending force. (b) bending moment diagram
for post-tensioning force and bending force
69
Figure 3.24: Post-tensioning force components 70
Figure 3.25: Flow chart for post-tensioning force 71
Figure 3.26: End plate used transfer load to beam and
screw for fixing plate on timber
72
Figure 3.27: The process of post-tensioning by bending
using universal testing machine
73
Figure 3.28: Fixing the threaded rod bar using nuts 74
Figure 3.29: Dials gauge using to record deflection and
deformation at rod bar
74
Figure 3.30: The process steps of post-tensioning by
bending a,b and c.
75
Figure 3.31: (a) Experiment set-up for push out test (b)
Push out test specimen plan view for single
timber
77
Figure 3.32: Loading regime as per (EN 26891) test
regime protocol
78
Figure 3.33: The arrangement of screw connector of PT-
TCC specimen 70 mm screw spacing
schematic drawing
82
Figure 3.34: Timber beam with screw connectors during
the post-tensioning process
83
PTTAPERP
USTAKAAN TUNKU T
UN AMINAH

xxi
Figure 3.35: Timber beam with screw connectors after
the post-tensioning process
83
Figure 3.36: Timber beam with screws top concrete
formwork
84
Figure 3.37: The concrete pouring of the PT-TCC
specimens
84
Figure 3.38: The PT-TCC specimens after pouring the
concrete
85
Figure 4.1: Four point bending test results for 5
specimens
89
Figure 4.2: Specimen failure type (tensile failure) under
4 point bending test (a) Tb1 and (b) Tb2
89
Figure 4.3: Compression failure types (a) split plus
shear failure (b) split failure
90
Figure 4.4: Black rod bar and silver rod bar test data 91
Figure 4.5: Correlation between deflection and residual
deflection for two types of rod bar (silver
colour with long coupling nut and black
colour with double hex nut)
95
Figure 4.6: Long coupling length nuts coupling to fix
ends
96
Figure 4.7: Correlation between deflection and residual
deflection for the silver rod bar, using the
coupling nut
97
Figure 4.8: Timber beam mid span vertical deflection
against strain comparison for specimen1
and 2
98
Figure 4.9: Experimental point load corresponding to
deflection at range (2-4 mm) for four
samples
99
Figure 4.10: PT estimation in three methods (rod strain. 101
PTTAPERP
USTAKAAN TUNKU T
UN AMINAH

xxii
bending test. theoretical)
Figure 5.1: Screw specimen during the test (left) and
after the test (right)
104
Figure 5.2: Condition of the screw after concrete is
removed
105
Figure 5.3: Failure types (a) tensile failure PT-B (3.84
mm) (b) compression failure PT-B (2.66
mm) (c) shear failure PT-S (2.86 mm)
108
Figure 5.4: Deflection and bending force for timber
beam for T1= 32. 46 kN and PT –S
(2.32mm)
109
Figure 5.5: Failure type is shear failure PT=2.105mm
(black rod). (universal testing machine
data).
109
Figure 5.6: The increasing factor of bending moment
(IF.B.M) for the groups of similar strength
112
Figure 5.7: Forced bending jacking method specimens’
results (IF.B.M).
113
Figure 5.8: Pre-stressing jacking method specimens’
results (IF.B.M).
114
Figure 5.9: Silver rod bar specimens’ results
(IF.B.M).(the left sample using double hex
nuts and right specimens using coupling
nuts)
115
Figure 5.10: Black rod bar specimens’ results (IF.B.M). 116
Figure 5.11: TCC specimen with 10 screws (a) during
the test (b) after the test
119
Figure 5.12: TCC1 specimen with 10 screws after the
test
119
Figure 5.13: TCC bending moment-deflection curves 120
Figure 5.14 Concrete cracks propagating from the 122
PTTAPERP
USTAKAAN TUNKU T
UN AMINAH

xxiii
bottom face near load application PT-TCC
(2.98 mm)
Figure 5.15: Concrete cracks propagating from the
bottom face near the load application then
developing to sudden failure due to timber
tensile crack propagation PT-TCC (2.15
mm)
122
Figure 5.16: Screws condition after test PT-TCC (2.15
mm) 100 mm spacing
123
Figure 5.17: Screws condition after test PT-TCC (2.98
mm) 70 mm spacing
123
Figure 5.18: The drop points of PT-TCC bending
moment-deflection curves for 3 screw
124
Figure 5.19: The drop points of PT-TCC bending
moment-deflection curves 10 screws
125
Figure 5.20: A comparison between PT-TCC and TCC
curves for 3 and 10 screws
126
Figure 6.1: Rod bar strain against timber beam mid
span deflection during the post-tensioning
process (specimen 1)
134
Figure 6.2: Rod bar strain against timber beam mid
span deflection during the post-tensioning
process (specimen 2)
135
Figure 6.3: Timber beam mid span vertical deflection
against the rod bar deformation, comparison
for specimens 1 & 2.
135
Figure 6.4: Rod bar modify strain against timber beam
mid span deflection
137
Figure 6.5: Comparison between the PT timber bending
moment calculated experimentally and
empirically using eq.12
142
PTTAPERP
USTAKAAN TUNKU T
UN AMINAH

xxiv
Figure 6.6: Comparison between the methods 1, 2, 3 of
of estimation bending stress
147
PTTAPERP
USTAKAAN TUNKU T
UN AMINAH
xxv
LIST OF APPENDICES
APPENDIX TITLE
A Calculation of Young's modulus of timber
B G35 concrete material requirement calculation
C Determination of strength and stiffness of shear connector
D Determination of degree of composite action
E Design of timber concrete composite (TCC)
F Guide line for moment capacity for PT beams
G Proposed method of PT-TCC bending stress estimation
PTTAPERP
USTAKAAN TUNKU T
UN AMINAH

xxvi
LIST OF SYMBOLS AND ABBREVIATIONS
T Kempas timber beam
PT Post-tensioned
TCC Timber Concrete Composite
PT-TCC Post-tensioned timber concrete composite T-section beam
ULS Ultimate Limit State
SLS Serviceability Limit State
S Silver color threaded rod bar
B Black color threaded rod bar
PT-PJ Post-tensioned timber beam using pre-stressing jacking method
PT-BJ Post-tensioned timber beam using bending jacking method
LVL Laminated veneer lumber
MOE Modulus of elasticity
GLT Glued Laminated Timber
γ-method Gamma method (design method)
V0.4,mod Modified initial slip
Fm Estimated peak load for push out test
DOE Concrete trial mix concrete design
EI Full composite action is calculated from gamma method and for non-
composite action from Equation(EI = EItimber + EIconcrete)
Fmax Max load
LVDT Linear Variable Differential Transducer
Γ Is partial factor for material properties, also accounting for modal
uncertainties and dimensional variations
B Breadth of beam
H Depth of the beam
Z Section modulus of beam about the y-y axis
fv.k Characteristic shear strength
fc.90.k Characteristic bearing strength
PTTAPERP
USTAKAAN TUNKU T
UN AMINAH

148
8 REFERENCES
American Society for Testing and Materials (2015). Deformed and Plain Billet-Steel
Bars for Concrete Reinforcement. (ASTM A615/A615M-15a)
Amlan K Sengupta & Devdas Menon (2012), “Prestressed Concrete Structures”
Indian Institute of Technology Madras. Phd thesis.pp.17
Aydin, S., Yardimci, M. Y., and Ramyar, K. (2007). Mechanical properties of four
timber species co mmonly used in Turkey. Turkish Journal of Engineering and
Environmental Sciences, 31(1), pp.19-27.
Azlan, H. M., Ahmad, Z., Ibrahim, A., and Hassan, R. (2013). Behaviour of kempas
timber beam strengthened with CFRP and steel plates under bending. In 2013 IEEE
Business Engineering and Industrial Applications Colloquium (BEIAC). pp. 483-488.
Bondy, K. B. (2012). Two-way post-tensioned slabs with bonded tendons. PTI J,
8(2), pp.43-48.
Bohannan, B. (1962). Prestressed wood members. Forest Products Journal, 12(2),
pp. 596-602.
Brady, J. F., Harte, A. M., and Arima, T. (2008). Prestressed FRP flexural
strengthening of softwood glue-laminated timber beams. 10th World conference on
timber engineering (WCTE). Galway Ireland: National University of Ireland Galway.
pp. 2-5.
British DOE (department of environment) method (1988). Design of normal concrete
mixes. chiswick highway London: BSI, 389.
British Standard (2009). Testing hardened concrete. Making and curing specimens
for strength tests. (BS EN 12390-2)
British Standards Institution. (2010). Timber Structures: Structural Timber and
Glued Laminated Timber: Determination of Some Physical and Mechanical
Properties. (BS EN 408 2010).
British Standards Institution (2005). Timber Structures - Glued Laminated Timber
And Glued Solid Timber – Requirements. BS EN 14080.
Brokāns, A. (2013). The effect of timber properties on the behaviour of bending
elements under loading. Annual 19th International Scientific Conference
Proceedings, (2), pp. 128.
Buchanan, A., Palermo, A., Carradine, D., and Pampanin, S. (2011). Post-tensioned
timber frame buildings. Structural Engineer, 89(17), pp.24-30.
PTTAPERP
USTAKAAN TUNKU T
UN AMINAH
149
Conzett, J., and Mostafavi, M. (2006). Structure as space: engineering and
architecture in the works of Jürg Conzett and his partners. London.Architectural
Association.
Cvetković, R., and Stojić, D. (2003). Design methods of a timber-concrete T-cross-
section. Facta universitatis-series: Architecture and Civil Engineering, 2(5), pp.329-
338.
Davies, M., and Fragiacomo, M. (2008). Long Term Behaviour of Laminated
Veneer Lumber Members Prestressed with Unbonded Tendons.
De Luca, V., and Marano, C. (2012). Prestressed glulam timbers reinforced with
steel bars. Construction and Building Materials, 30, pp.206-217.
Devereux, C. P., Holden, T. J., Buchanan, A. H., and Pampanin, S. (2011). NMIT
arts and media building-damage mitigation using post-tensioned timber walls.
Proceedings of the Ninth Pacific Conference on Earthquake Engineering. Auckland,
New Zealand. Building an Earthquake-Resilient Society.
Deam, B. L., Fragiacomo, M., and Gross, L. S. (2008). Experimental behavior of
prestressed LVL-concrete composite beams. Journal of structural engineering,
134(5), 801-809.
Dias, A. M. P. G. (2005). Mechanical behaviour of timber-concrete connections
(Doctoral dissertation, PhD Thesis, Delft University of Technology, The
Netherlands).
EN, B. (2012). 408: 2010+ A1: 2012. Timber structures. Structural timber and glued
laminated timber. Determination of some physical and mechanical properties.
London: BSI.
EN 1992-1-2 (2004). Eurocode 2: Design of Concrete Structures - Part 1-2. 1st ed.
Brussels: BSI.
EN 1995-1-2 (2004) (English): Eurocode 5: Design of timber structures - Part 1-2:
General - Structural fire design [Authority: The European Union Per Regulation
305/2011.
European Co mmittee for Standardization (CEN) Timber Structures - Joints Made
with Mechanical Fasteners - General Principles for the Determination of Strength
and Deformation Characteristics. (CEN - EN 26891)
Estévez-Cimadevila, J., Suárez-Riestra, F., Otero-Chans, D., and Martín-Gutiérrez,
E. (2018). Experimental Analysis of Pretensioned CLT-Glulam T-Section Beams.
Advances in Materials Science and Engineering. Volume 2018, pp.2
PTTAPERP
USTAKAAN TUNKU T
UN AMINAH

150
Fragiacomo, M., and Lukaszewska, E. (2011). Development of prefabricated timber–
concrete composite floor systems. Proceedings of the Institution of Civil Engineers-
Structures and Buildings, 164(2), pp.117-129.
Frangi A & Fontana M (2003). Elasto-plastic model for timber–concrete composite
beams with ductile connection. IABSE Structural Engineering International 13(1):
pp.47–57.
Gasparini, D. (2006). The Prestressing of Structures: 21 Historical Review. In
Proceedings of the Second International Congress on Construction History, (2) pp.
1221-1232.
Gilfillan, J. R., Gilbert, S. G., and Patrick, G. R. H. (2003). The use of FRP
composites in enhancing the structural behavior of timber beams. Journal of
reinforced plastics and composites, 22(15), pp.1373-1388.
Granello, G., Giorgini, S., Palermo, A., Carradine, D., Pampanin, S., and Finch, R.
(2017). Long-term behavior of LVL posttensioned timber beams. Journal of
Structural Engineering, 143(12), pp. 158.
Granello, G., Leyder, C., Palermo, A., Frangi, A., and Pampanin, S. (2018). Design
approach to predict post-tensioning losses in post-tensioned timber frames. Journal
of Structural Engineering, 144(8), pp.115.
He, G., Xie, L., Wang, X. A., Yi, J., Peng, L., Chen, Z. A and Crocetti, R. (2016).
Shear behavior study on timber-concrete composite structures with bolts.
BioResources, 11(4), 9205-9218.
ISO the International Organization for Standardization (1975) Wood Determination
of density for physical and mechanical tests. (ISO 3131:1975 en)
Keenan, E., and Pinkerton, J. (1992). Some aspects of empowerment: A case study
of work with disadvantaged youth. SociaL work wíth groups, 14(3-4), 109-124.
Lantos, G. (1964). Reinforced and post-tensioned glue laminated beams under
development at TRADA laboratories. Civil Engineering (London), 59(690),pp. 86-
87.
Lukaszewska, E., Johnsson, H., and Fragiacomo, M. (2008). Performance of
connections for prefabricated timber–concrete composite floors. Materials and
structures, 41(9), pp.1533-1550.
Malaysian Standard: (2003). Code of practice for structural use of timber : part 2 :
permissible stress design of solid timber (MS 544: Part 2)
Malaysian Standard: (2001). Code of practice for structural use of timber - Part 3:
Permissible stress design of glued laminated timber. (MS 544: Part 3)
PTTAPERP
USTAKAAN TUNKU T
UN AMINAH

151
Malaysian Standard: (2006). Solid Timber Determination Of Moisture Content. (MS
837:2006)
Manaridis, A. (2010). Evaluation of timber-concrete composite floors. Lund
University: Master thesis.
McConnell, E., McPolin, D., and Taylor, S. (2014). Post-tensioning of glulam
timber with steel tendons. Construction and Building Materials, 73, pp.426-433.
McConnell, E., McPolin, D., and Taylor, S. (2015). Post-tensioning glulam timber
beams with basalt FRP tendons. Proceedings of the Institution of Civil Engineers-
Construction Materials, 168(5), 232-240.
Namrum, K. (2007). The Strength Of Glulam Beam Made-Up Of Weaker Species As
Inner Layers And Harder Species As Outer Layers. Universiti Te kNologi Malaysia,
unpublished.
Negro, J., Brunner, M., and Lehmann, M. (2008). Prestressing of Timber,Bonding of
Timber. Core document of the cost action E34. Vienna: University of Natural
Resourses and Applied Life Sciences.
Oliva, M. G., and Dimakis, A. (1988). Behavior of stress-laminated timber highway
bridge. Journal of Structural Engineering, 114(8), pp.1850-1869.
Otero-Chans, D., Estévez-Cimadevila, J., Martín-Gutiérrez, E., and Pérez-Valcárcel,
J. (2016). Application of a new system of self-tensioning to the design of large-span
wood floor framings. Journal of Structural Engineering, 142(6), pp.12.
Palermo, A., Giorgini, S., Stefano, P., and Buchanan, A. H. (2011). Potential of
longitudinal post-tensioning for short-to-medium span timber bridges. Structural
Engineering International, 21(3), pp.349-355.
Palermo, A., Pampanin, S., Carradine, D., Buchanan, A. H., Dallago, B. A.,
Dibenedetto, C. and Ronca, P. (2010). Enhanced performance of longitudinally post-
tensioned long-span LVL beams. WCTE 2010, Riva del Grada Italy. The wood
division society. pp. 1-10.
Palermo, A., Pampanin, S., Buchanan, A., and Newcombe, M. (2005). Seismic
design of multi-storey buildings using laminated veneer lumber (LVL). NZSEE
Conference. Canterbury University.
Priestley, M. N., Sritharan, S., Conley, J. R., and Pampanin, S. (1999). Preliminary
results and conclusions from the PRESSS five-story precast concrete test building.
PCI journal, 44(6), pp.42-67.
Quenneville, P., and Van Dalen, K. (1996). Parameters affecting stress losses in
stress-laminated timber bridge decks. Proceedings of the International Wood
PTTAPERP
USTAKAAN TUNKU T
UN AMINAH

152
Engineering Conference, New Orleans, Louisiana. Lousiana State University,, USA.
pp.2283.
Ritter, M. A., Geske, E. A., Mason, L., McCutcheon, W. J., Moody, R. C., and
Wacker, J. (1990). Performance of stress-laminated bridges. Wood Design Focus,
1(3), pp.12-16.
Sarti, F., Palermo, A., and Pampanin, S. (2012). Simplified design procedures for
post-tensioned seismic resistant timber walls. Proceedings of the 15th World
Conference on Earthquake Engineering, Lisbon, Portugal.
Sarisley Jr, E. F., and Accorsi, M. L. (1990). Prestress level in stress-laminated
timber bridges. Journal of Structural Engineering, 116(11), pp.3003-3019.
Steinberg, E., Selle, R., and Faust, T. (2003). Connectors for timber–lightweight
concrete composite structures. Journal of structural engineering, 129(11), pp.1538-
1545.
Taylor, R. J. (1988). Field applications of prestressed laminated wood bridge decks.
Canadian Journal of Civil Engineering, 15(3), pp.477-485.
Triantafillou, T. C., and Deskovic, N. (1992). Prestressed FRP sheets as external
reinforcement of wood members. Journal of Structural Engineering, 118(5),
pp.1270-1284.
Van Beerschoten, W., Palermo, A., and Carradine, D. (2012). Gravity design of
post-tensioned timber frames for multi-storey buildings. Structures Congress 2012,
pp. 1733-1744.
Van Beerschoten, W. A. (2013). Structural performance of post-tensioned timber
frames under gravity loading. Canterbury university. Ph.D. thesis.
Wanninger, F. (2015). Post-tensioned timber frame structures. ETH Zurich: Ph.D.
Thesis.
Yeboah, D., Taylor, S., McPolin, D., and Gilfillan, R. (2013). Pull-out behaviour of
axially loaded Basalt Fibre Reinforced Polymer (BFRP) rods bonded perpendicular
to the grain of glulam elements. Construction and Building Materials, 38, pp.962-
969.
Yeoh, D. (2010). Behaviour and design of timber-concrete composite floor system.
Canterbury university. Ph.D. thesis.
PTTAPERP
USTAKAAN TUNKU T
UN AMINAH

153
APPENDIX A
Calculation of Young's modulus of timber
The result of specimen Timber (T) had been used as an example to show the
calculation of Young's modulus of timber and the test arrangement is depicted on the
Figure below.
a=315 mm, L=950 mm, I= bh3/12 =2.43 x 106 mm4 Emg=
𝐸𝑚.𝑔 =3a𝑙2 −4𝑎3
2𝑏ℎ3(2𝑤2−𝑤1
𝐹2−𝐹1−
6𝑎
5𝐺𝑏ℎ)
Where M bending moment. P maximum point load. Z section modulus=
54000 mm3. b width of cross section= 40 mm . h height of cross section = 90 mm .
a distance between support and applied point load= 320 mm. Em.g = global modulus
of elasticity F2-F1 = increment of load on the regression line with correlation
coefficient of 0.99 ( N)
W2-W1 = the increment of deflection corresponding to (F2-F1) ( mm) G = shear
modulus = 650 N/ mm2 according to BS EN 408 2010 clause 10.3 L= length of test
sample =950 mm.
PTTAPERP
USTAKAAN TUNKU T
UN AMINAH
154
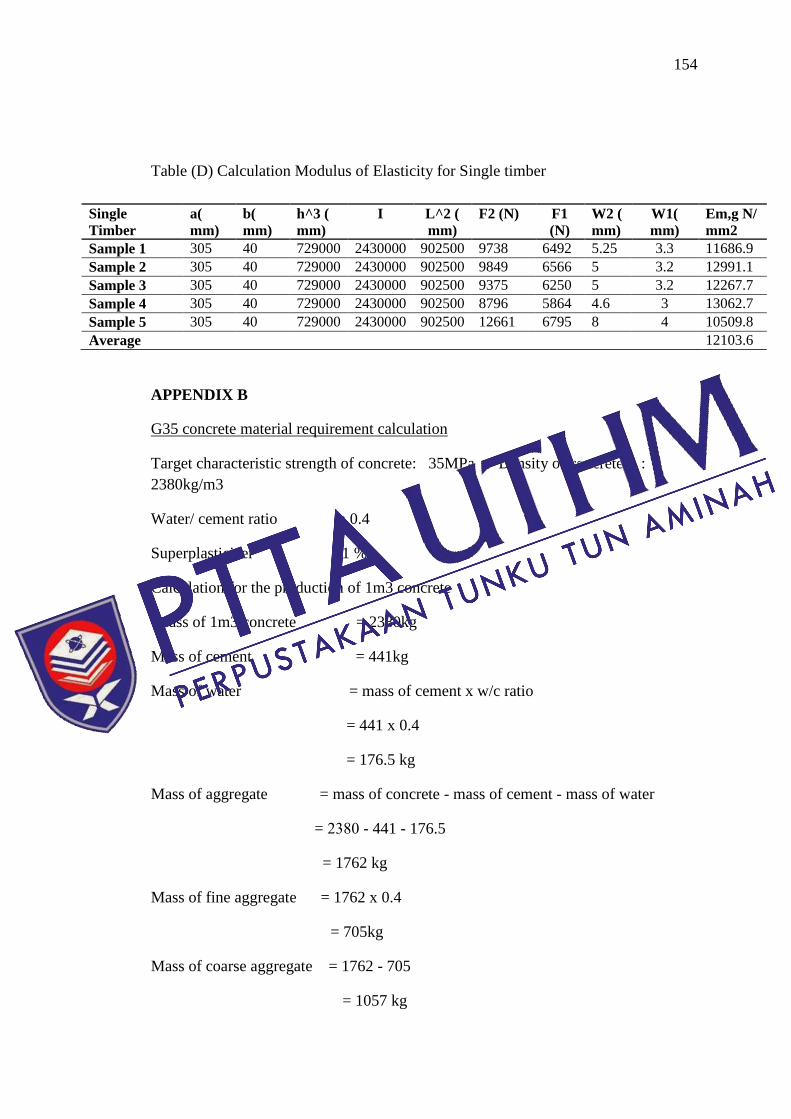
Table (D) Calculation Modulus of Elasticity for Single timber
APPENDIX B
G35 concrete material requirement calculation
Target characteristic strength of concrete: 35MPa Density of concrete :
2380kg/m3
Water/ cement ratio : 0.4
Superplasticizer : 1 %
Calculation for the production of 1m3 concrete
Mass of 1m3 concrete = 2380kg
Mass of cement = 441kg
Mass of water = mass of cement x w/c ratio
= 441 x 0.4
= 176.5 kg
Mass of aggregate = mass of concrete - mass of cement - mass of water
= 2380 - 441 - 176.5
= 1762 kg
Mass of fine aggregate = 1762 x 0.4
= 705kg
Mass of coarse aggregate = 1762 - 705
= 1057 kg
Single
Timber
a(
mm)
b(
mm)
h^3 (
mm)
I L^2 (
mm)
F2 (N) F1
(N)
W2 (
mm)
W1(
mm)
Em,g N/
mm2
Sample 1 305 40 729000 2430000 902500 9738 6492 5.25 3.3 11686.9
Sample 2 305 40 729000 2430000 902500 9849 6566 5 3.2 12991.1
Sample 3 305 40 729000 2430000 902500 9375 6250 5 3.2 12267.7
Sample 4 305 40 729000 2430000 902500 8796 5864 4.6 3 13062.7
Sample 5 305 40 729000 2430000 902500 12661 6795 8 4 10509.8
Average 12103.6
PTTAPERP
USTAKAAN TUNKU T
UN AMINAH

155
Volume of concrete needed = Volume of [Specimen for Test A + Test B + 6 cubes]
= (8.32 + 62.4 + 20.25) x 106 = 0.091 mm
3
Batching of concrete with volume of 0.091m3
Mass of cement required = 441 x 0.091 = 40.13kg
Mass of Fine aggregate required = 705 x 0.091 = 64.15kg
Mass of Coarse aggregate required = 1057 x 0.091 = 96.18kg
Mass of water required = 176 x 0.091 = 16.016kg
10 % extra mass of the material provided considering loss due to wastage,
Mass of cement = 40.13 x 1.1 = 44.14kg
Mass of Fine aggregate = 64.15 x 1.1 = 70.56kg
Mass of coarse aggregate = 96.18 x 1.1 = 105.79kg
Mass of water = 16.016 x 1.1 = 17.62kg
Table (A) Concrete mix design (DOE) for 1 m3
Cement Fine aggregate Coarse
aggregate
Water
441 kg 705 kg 1057 kg 176 kg
441/441= 1 705/441=1.59 1057/441=2.39 176/441=0.4
APPENDIX C
Determination of strength and stiffness of shear connector Strength of
screw connector for single Timber
For 2 screw connectors, Strength = Fmax = 13.42 kN;
For 1 screw connector, Strength = (1/2) x (13.42) = 6.71 kN.
Stiffness of screw connector for single Timber
SLS - Serviceability Limit State (Ks)
0.4 Fmax = 0.4 x 13.42 = 5.37 kN; ∆0.4Fmax = 1.75 mm.
∆0.4Fmax mean the displacement at 40 % from Fmax
Ks = 0.4 Fmax
∆0.4Fmax = 3.11 kN/ mm
PTTAPERP
USTAKAAN TUNKU T
UN AMINAH

156
ULS - Ultimate Limit State (Ku)
0.6 Fmax = 0.6 x 13.42 = 8.05 kN; ∆0.6Fmax = 3.66 mm.
∆0.6Fmax mean the displacement at 60 % from Fmax
𝐾𝑢 =0.6 Fmax
∆0.6Fmax = 2.737 kN/ mm
APPENDIX D
Calculation the spacing design for single Kampas timber beam with
length 1.2 m
The design procedure of TCC deck was adopted from (CEN,1995).The workflow for
design TCC deck as adopted in Figure 5.5. Flow diagram of the design process for
prefabricated TCC
Design of timber concrete
composite (TCC)
Short-term verifications:
Find EIef = E1I1 + E2 I2 + γ1E1A1a12 + γ2E2A2a2
2 From Figure 5.4, K(from
test) or Kequivalent=K max (1-e-nβ
)α
+ 2 (new Equation)
Bending and tension in timber: σ2(x)
ft,0,d +
σm,2(x)
fm,d ≤ 1
Shear in timber: τd,max = 1.5 Vd
A2 ≤ fvd
Timber strength demand , σ2(x) = E2A2 M(x)
EIef , σ m,2(x) = 0.5
E2h2 M(x)
EIef
σc,tot=|−σ1 − σm,1| upper stress ≤ fcd , σc,tot=|−σ1 + σm,1| lower stress ≤ fct (ok)
Concrete strength demand, σ1(x) = γ1 E1a1 M(x)
EIef , σ m,1(x) = 0.5
E1h1 M(x)
EIef
PTTAPERP
USTAKAAN TUNKU T
UN AMINAH

157
The process that used to determine the shear connectors spacing is the trial and error
this due to the variables in design Equations is a dependent variables. For that it will
start with low load and check the connector capacity then increase the load to
estimate the highest load before connection failure. Here the calculation present the
last load before failure.
The span length used is 1.2 m, the concrete width is 0.12 m , 0.04 is the timber
width and 0.09 m is depth of timber and 0.065 m is depth of concrete
E1 = 34 GPa ,E2 = 12.103 GPa
E1= Young's modulus of Elasticity of the concrete
E2= Young's modulus of Elasticity of the timber
Ku =2.737 kN/ mm, fetched from screw type push out test result
The shear strength in screws= 6.71 KN
The load calculation
W = 1.35 G+ 1.5 Q
G= dead load = 6.21 kN/m
Q= Live load= 0.36 kN/m
W= 8.92 kN/m
M= W*L2 /8 = 1.60 kN.m
Vd = WL/2 = 5.35 kN
A1= area of concrete = 65* 120= 7800 mm2, A2= area of timber = 3600 mm
2
Ass
um
e
the spacing S=100 mm
γ1 = 1
1+π2E1A1sef/Kl2
γ1 = 1
1+3.142∗34000 ∗7800∗100/(2740∗1200∗1200) = 0.015
γ2= 1
Ku (Screw)
kN/ mm
Ks(Screw)
kN/ mm
Max load for single
Screw (Rm) KN
Max load (Rm)
KN for Screw
2.737 3.11 6.71 13.42
Connection strength demand, F(x=0)= γ1 E1A1 a1 Smin
EIef Vmax ≤ Fd
PTTAPERP
USTAKAAN TUNKU T
UN AMINAH

158
a1 distance
𝑎1 =γ2E2A2H
γ1E1A1+ γ2E2A2
𝑎1 =1∗12103.6∗3600∗77.5
0.015∗34000∗7800 + 1∗12103.6∗3600 = 71.26 mm
𝑎2 =γ1E1A1H
γ1E1A1+ γ2E2A2
0.015∗34000∗7800∗77.5
0.015∗34000∗7800 + 1∗12103.6∗3600 = 6.238 mm
EIef = E1I1 + E2 I2 + γ1E1A1a12 + γ2E2A2a2
2
= 34000*18308333.33+12103.6*48600000+0.015*34000*7800*71.26 ^2
+1*12103.6*3600*6.238 ^2
= 1.415E+11 N/ mm2
Fn = 4.129 kN less than shear strength of screw = 6.71 kN, it is OK
Fn= Shear strength from Equation of design cod
The spacing S = 100 which was assumed it OK
However, took this value S=100 for TCC with 1200 mm length
APPENDIX E
TCC design according to EC5 for timber beam 1.2 m
The length of span is 1.2 m, 0.12 m width of concrete with 0.065 m depth, the length
of timber 1.2 m , the cross section of unite timber 0.04 width of timber and 0.09 m
depth of timber.
L=1.2 m, h1(concrete)=0.065 m, h2(timber)=0.09 m, width (w) for concrete = 0.12m,
w for timber=0.04 m
Imposed load = 3 kN/m2
Permanent load (self-weight) = 0.21 kN/m
Permanent uniform load = 6 kN/m
Total permanent load, G = 0.21 + 6 = 6.21 kN/m
Total imposed load, Q = 3× 0.12 = 0.36 kN/m
ULS short-term load combinations,
for uniformly distributed load, w = 1.35G + 1.5Q = 8.93 kN/m
design bending moment, Md = wL2/8 = 1.61 kNm
design shear force, Vd = wL/2 = 5.36 kN
PTTAPERP
USTAKAAN TUNKU T
UN AMINAH

159
Design data for connector:
The connection slip moduli and strength were determined by experimental push-out
test
for screw of 68.7 (L) × 5.47(d) where L and d as the length and diameter in mm,
respectively.
For definition of connection spacing):
Connection slip modulus for ULS, Ku = 2.74 kN/ mm
Connection slip modulus for SLS, Ks = 3.11 kN/ mm
Characteristic strength of connection, Fk = 6.71 kN
Maximum spacing of connection, smax = 100 mm
Minimum spacing of connection, smin = 100 mm
Effective spacing of connection, seff = 0.75smin + 0.25smax = 100 mm
Timber Strength Capacity for Kempas timber
Young’s modulus of Kempas, E2= 12103.6 MPa; mean value of timber bending
stress fm =86.5 N/ mm2 , γm=1.3 is partial factor for material properties Kempas
;and kmod =0.8 is modification factor for medium term load duration. Pm timber
density 850 kg/m3 , (CEN,1995)
Timber bending charachteristic calculation:
fk = 60 N/ mm2 (Kempas timber D60 according MS 544: part 3, 2001)
All the factors used to determine the tensile, compressive, shear stresses are adopted
according BS EN 384:2016+A1:2018
Timber design bending strength, fm,d= kmod ×fm,k/γm=0.8×(60) /1.3= 36.92 N/
mm2
Timber characteristic tensile strength ft,0,k = 0.6x fmk = 0.6x (60) = 36
Timber design tensile strength, ft,0,d= kmod ×ft,0,k/γm=0.8×36/1.3= 22.15 N/ mm2
Timber shear characteristic strength, fv,k = 4.8 N/ mm2
(If fm.k ≤ 60 , the fv.k= 3+
0.03* fm.k = 4.8 N/ mm2
Timber shear design strength, fv,d=kmod ×fv,k/γm=0.8× 4.8/1.3 =2.95 N/ mm2
Timber compression parallel to grain characteristic strength fc,0,k = 4.3x fmk0.5
=4.3*600.5
= 33.31 N/ mm2
PTTAPERP
USTAKAAN TUNKU T
UN AMINAH

160
Timber compression parallel to grain design strength,fc,0,d=kmod×fc,0,k/γm =0.8×33.31
/1.3 =20.5 N/ mm2
Concrete Strength Capacity for grade 35
Young’s modulus of concrete, E1=31494 MPa
Concrete characteristic compressive strength, fck = 35 N/ mm2
Concrete design compressive strength, fcd =fck /γc=35/1.5 =23.33 N/ mm2
Concrete characteristic tensile strength, fctk= 2.2 N/ mm2 (EN 1992-1-1:2004,
Table 3.1 section 3.1.3)
Concrete design tensile strength, fctd=fctk/γc=2.2/1.5=1.47 N/ mm2
where γc= 1.5 is partial factor for concrete at ultimate limit state(Eurocode, 2 Part 1–
1).
Connection Strength Capacity for Screw
Characteristic strength of connection, Fk=6.71 kN
Design strength of connection, Fd=kmod ×Fk/γm=0.8×6.71 /1.3=4.13 kN
where γm=1.3 is partial factor for material properties TCC and kmod =0.8 is
modification factor for permenant load duration and moisture content in Service
Class 1 (Eurocode5, Part 1–1)
Verifications for Ultimate Limit State in the Short Term
This verification is carried out for the load condition with uniformly distributed
imposed and permanent loads; w=1.35G+1.5Q= 8.93 kN/m.
Bending Stiffness Properties for Ultimate Limit State Short-Term Verifications are as
follows. Concrete ga mma coefficient,
Area of concrete (A1)= 7800 mm2
Area of Timber (A2)= 3600 mm2
E1 = 31.494 GPa ,E2 = 12.103 GPa
E1= Young's modulus of Elasticity of the concrete
E2= Young's modulus of Elasticity of the timber
PTTAPERP
USTAKAAN TUNKU T
UN AMINAH
161
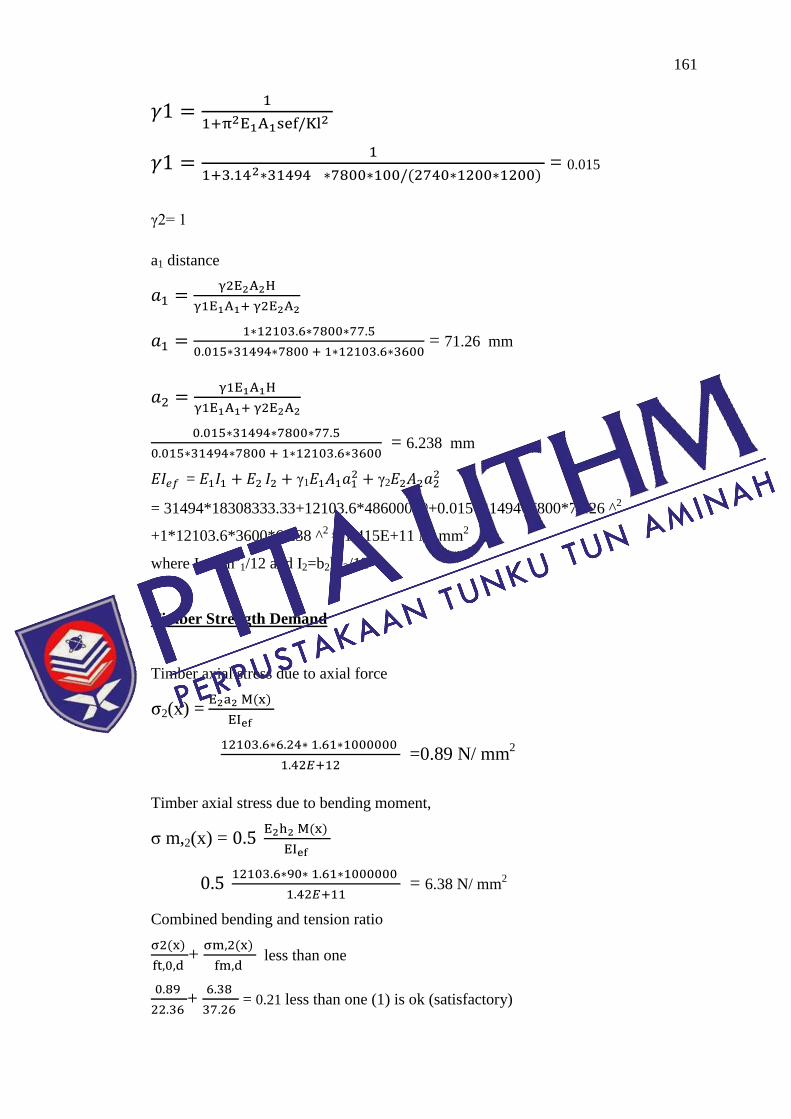
𝛾1 =1
1+π2E1A1sef/Kl2
𝛾1 =1
1+3.142∗31494 ∗7800∗100/(2740∗1200∗1200) = 0.015
γ2= 1
a1 distance
𝑎1 =γ2E2A2H
γ1E1A1+ γ2E2A2
𝑎1 =1∗12103.6∗7800∗77.5
0.015∗31494∗7800 + 1∗12103.6∗3600 = 71.26 mm
𝑎2 =γ1E1A1H
γ1E1A1+ γ2E2A2
0.015∗31494∗7800∗77.5
0.015∗31494∗7800 + 1∗12103.6∗3600 = 6.238 mm
𝐸𝐼𝑒𝑓 = 𝐸1𝐼1 + 𝐸2 𝐼2 + γ1𝐸1𝐴1𝑎12 + γ2𝐸2𝐴2𝑎2
2
= 31494*18308333.33+12103.6*48600000+0.015*31494*7800*71.26 ^2
+1*12103.6*3600*6.238 ^2
= 1.415E+11 N/ mm2
where I1=b1h3
1/12 and I2=b2h32/12
Timber Strength Demand
Timber axial stress due to axial force
σ2(x) = E2a2 M(x)
EIef
12103.6∗6.24∗ 1.61∗1000000
1.42𝐸+12 =0.89 N/ mm
2
Timber axial stress due to bending moment,
σ m,2(x) = 0.5 E2h2 M(x)
EIef
0.5 12103.6∗90∗ 1.61∗1000000
1.42𝐸+11 = 6.38 N/ mm
2
Combined bending and tension ratio
σ2(x)
ft,0,d +
σm,2(x)
fm,d less than one
0.89
22.36 +
6.38
37.26 = 0.21 less than one (1) is ok (satisfactory)
PTTAPERP
USTAKAAN TUNKU T
UN AMINAH

162
Timber shear stress, with the simplified and conservative assumption that only the timber
part resists shear:
𝜏𝑑𝑚𝑎𝑥 = 1.5Vd
A2 = 1.5 ∗
5.36∗1000
3600 =2.23 N/ mm
2 less than fvd =2.46 N/ mm
2
(Ok)
Concrete Strength Demand
Concrete axial stress due to axial force,
σ1(x) = γ1 E1a1 M(x)
EIef =
0.015∗31494∗71.26 ∗1.61∗1000000
1.41𝐸+11= 0.41 N/ mm
2
Concrete axial stress due to bending moment
σ m,1(x) = 0.5 E1h1 M(x)
EIef = 0.5
31494∗ 65∗1.61∗1000000
1.41𝐸+11 = 12.01 N/ mm
2
Concrete total upper fibre stress
σc,tot=|−σ1 − σm,1|= |−0.41 − 12.01| =12.42 N/ mm2 upper stress ≤ fcd (23.33)
ok
Concrete total lower fibre stress
σc,tot=|−σ1 + σm,1|= |−0.41 + 12.01|= 11.61 N/ mm2 lower stress tension tensile
stress ≥ fct =1.46 not ok require tension reinforcement at bottom of concrete.
Connection Strength Demand
Shear force in connection at maximum shear,
F(x=0)= γ1 E1A1 a1 smin
EIef Vmax =
0.015∗31494∗7800 ∗71.1∗100
1.40𝐸+11 ∗ 5.36 *1000
= 4.12 less than 4.13 it is ok
The ultimate limit state force is (ULS) = 8.93 KN/m = 10.716 kN
APPENDIX F
Guidelines for moment capacity for post-tensioned timber beam
1- The timber beam bending capacity is calculated experimentally with COV %
not exceeding 10 % (part one).
PTTAPERP
USTAKAAN TUNKU T
UN AMINAH

163
2- Identify the experimental correlation between the mid-span vertical deflection
and the rod bar deformation in the term strain = coefficient x vertical
deflection, 𝜖 = coefficient x Δ.
3- Estimate the post-tensioning force through (PT= Ex 𝜖x A) and replace strain
𝜖 by relation in the above point (2).
4- Determine the bending moment resulting from the post-tensioning process
PT= Ex (coefficient x Δ ) x A x e (part two).
5- The total estimated bending moment is the sum of the two parts (1 and 4).
6- The total estimated bending moment can also be expressed by the Equation
PT = ((8EI x∆)/ (e×L^2 )) + coefficient. This coefficient is calculated by the
next point.
7- The coefficient is equal to the average value of difference between the
theoretical PT value (8EI x∆)/ (e×L^2 ) and the experimental PT value, under
the condition that (this average x 100/bending average value) is less than 10
%
APPENDIX G
Proposed empirical formula to predict moment strength in PT-TCC beams
A- Method 2
The control value present TCC10 from 4 point bending test data find 0.6Fmax
and corresponding relative horizontal slip between timber and concrete o.6H.
Then calculate the factor 𝑓𝑇𝐶𝐶
𝑓𝑇𝐶𝐶 =0.6 𝐹𝑚𝑎𝑥
0.6 𝐻 =
26.43
1.4 = 18.88 For TCC10 specimen (control value)
In same manner calculate the factor for example the PT-TCC2.15 specimen
𝑓𝑃𝑇−𝑇𝐶𝐶 2.15 =0.6 𝐹𝑚𝑎𝑥
0.6 𝐻 =
33.44
1.19 = 28.13 For PT-TCC2.15 specimen
The second step is to calculate the ratio for between 𝑓𝑃𝑇−𝑇𝐶𝐶 2.15 and 𝑓𝑇𝐶𝐶 and called
𝐹 factor
𝐹 =𝑓𝑃𝑇−𝑇𝐶𝐶
𝑓𝑇𝐶𝐶 =
28.13
18.88 = 1.49
Then Ku equivalent is equal
PTTAPERP
USTAKAAN TUNKU T
UN AMINAH

164
𝑘𝑢𝑒𝑞𝑢𝑖𝑣𝑎𝑙𝑒𝑛𝑡 = 𝑅𝑥𝑘𝑢𝑝𝑢𝑠ℎ𝑜𝑢𝑡−𝑡𝑒𝑠𝑡 = 1.49 x 2.74 = 4.09 kN/ mm
This value is used instead of normal Ku resulting from pushout test in the design of
TCC to estimate bending stress for PT-TCC.
B- Method 3
The centroid of T-section Y is calculated by
Y= ∑ 𝐴𝑖𝑌𝑖
∑ 𝐴𝑖 =
120𝑥65𝑥 (90+65
2)+90𝑥40𝑥(
90
2)
120𝑥65+90𝑥40 = 98.03 mm from bottom web
The moment area for T-section Ix is calculated by
Itotal = ∑ 𝐼𝑖
Itotal = 𝐼1 + 𝐼2 + 𝐼3 (𝐼𝑧 + 𝐴3𝑑) = = 120𝑋(155−98.03)3
3 +
120𝑋(98.03−90)3
3 +
40𝑋903
12 +
40𝑋90𝑋(98.03 −90
2) = 19970592 mm4
Z = 𝐼
𝑌 =
19970592
𝑌98.03 = 203726.8 mm3
PTTAPERP
USTAKAAN TUNKU T
UN AMINAH

165
List of publications
• Wissam, M., Yeoh, D., Jalal, M., Abd Ghafar, D., and Heng Boon, K.
(2019). Kempas Timber Un-Bonded Post-Tensioning Solution New
Approach. International Journal of Civil Engineering and Technology, 10(3).
• Wissm,M., Yeoh, D.,Jalal.,M, Abd Ghafar, D., and Heng Boon, K.,
Behaviour of Post-Tensioned Kempas Timber Beam with Two Tendon Types
,The 2nd Global Congress on Construction, Material and Structural
Engineering GCoMSE 2019
• Jalal, M., Wissam,M., Abd Ghafar, D., Yeoh, D., and Heng Boon, K. (2019).
Experimental Tests of Nail and Screw Connectors for Timber Concrete
Composite Deck.
• Jalal,M, Abd Ghafar, D., Yeoh, D., Wissam.,M, and Heng Boon, K.,
Vibration Behaviour of Natural Timber and Timber Concrete Composite
Deck System ,The 2nd Global Congress on Construction, Material and
Structural Engineering GCoMSE 2019.
PTTAPERP
USTAKAAN TUNKU T
UN AMINAH