the effect of antenatal care on professional assistance at delivery
TRANSCRIPT
The DHS Working Papers series is an unreviewed and unedited prepublication series of papers reporting on research in progress based on Demographic and Health Surveys (DHS) data. This research was supported by the East-West Center. Additional support was provided by the United States Agency for International Development (USAID) through the MEASURE DHS project (#GPO-C-00-03-00002-00). The views expressed are those of the authors and do not necessarily reflect the views of USAID, the United States Government, or the organizations with which the authors are affiliated.
MEASURE DHS assists countries worldwide in the collection and use of data to monitor and evaluate population, health, and nutrition programs. Additional information about the MEASURE DHS project can be obtained by contacting ORC Macro, Demographic and Health Research Division, 11785 Beltsville Drive, Suite 300, Calverton, MD 20705 (telephone: 301-572-0200; fax: 301-572-0999; e-mail: [email protected]; internet: www.measuredhs.com).

The Effect of Antenatal Care on Professional Assistance at Delivery in Rural India
Vinod Mishra1,2 and Robert D. Retherford2
March 2006
Institutional affiliations: 1ORC Macro, Calverton, MD; 2East-West Center, Honolulu, HI
Corresponding author: Vinod Mishra, Demographic and Health Research Division, ORC Macro,11785 Beltsville Drive, Suite 300, Calverton, MD 20705. Phone: 301-572-0220, Fax: 301-572-0999, Email: [email protected]

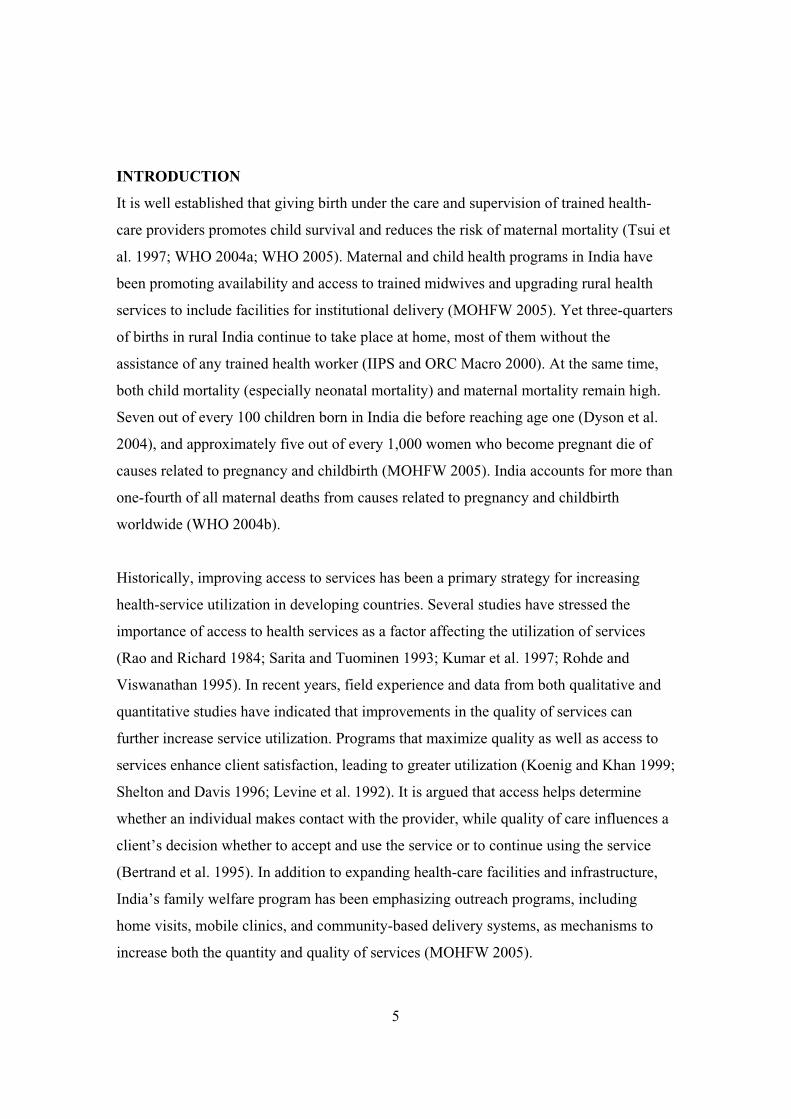
ABSTRACT
Delivering births in a medical institution or at home with professional medical assistance
has been shown to promote safe motherhood and child survival. Yet three-quarters of
births in rural India continue to take place at home, most of them without the assistance
of any trained health worker. This study examines the role of antenatal care (ANC) in
promoting professional assistance at delivery, using data from India’s 1992-93 and 1998-
99 National Family Health Surveys (NFHS-1 and NFHS-2). We estimate the effect of
number of antenatal care visits (0, 1-2, 3+) on professional assistance at delivery (no
assistance, professional assistance at home, delivery in a medical institution), using
multinomial logistic regression, controlling for demographic, geographic, and
socioeconomic factors, pregnancy complications, and two measures of access to health
facilities. The results indicate that, after controlling for other variables (including ANC),
pregnancy complications and access to health facilities do not have much effect on
assistance at delivery. By contrast, ANC has a large effect on assistance at delivery, even
after all other variables are controlled. The effect of ANC on professional assistance at
delivery is larger in South India than in North India, and predicted percentages receiving
professional assistance are higher in South India than in North India. A policy implication
is that increased antenatal care coverage can be an effective means of increasing
professional assistance at delivery, especially delivery in a medical institution.
KEY WORDS: safe motherhood, antenatal care, skilled assistance at delivery,
reproductive health, women
iii

ACKNOWLEDGEMENTS
The authors thank Alfredo Fort and Fred Arnold for their comments. They also thank
Gayle Yamashita, Sally Dai, and Shane Khan for programming and research assistance.
An earlier version of this paper was presented at the 2004 annual meeting of the
American Public Health Association in Washington, DC.
iv
INTRODUCTION
It is well established that giving birth under the care and supervision of trained health-
care providers promotes child survival and reduces the risk of maternal mortality (Tsui et
al. 1997; WHO 2004a; WHO 2005). Maternal and child health programs in India have
been promoting availability and access to trained midwives and upgrading rural health
services to include facilities for institutional delivery (MOHFW 2005). Yet three-quarters
of births in rural India continue to take place at home, most of them without the
assistance of any trained health worker (IIPS and ORC Macro 2000). At the same time,
both child mortality (especially neonatal mortality) and maternal mortality remain high.
Seven out of every 100 children born in India die before reaching age one (Dyson et al.
2004), and approximately five out of every 1,000 women who become pregnant die of
causes related to pregnancy and childbirth (MOHFW 2005). India accounts for more than
one-fourth of all maternal deaths from causes related to pregnancy and childbirth
worldwide (WHO 2004b).
Historically, improving access to services has been a primary strategy for increasing
health-service utilization in developing countries. Several studies have stressed the
importance of access to health services as a factor affecting the utilization of services
(Rao and Richard 1984; Sarita and Tuominen 1993; Kumar et al. 1997; Rohde and
Viswanathan 1995). In recent years, field experience and data from both qualitative and
quantitative studies have indicated that improvements in the quality of services can
further increase service utilization. Programs that maximize quality as well as access to
services enhance client satisfaction, leading to greater utilization (Koenig and Khan 1999;
Shelton and Davis 1996; Levine et al. 1992). It is argued that access helps determine
whether an individual makes contact with the provider, while quality of care influences a
client’s decision whether to accept and use the service or to continue using the service
(Bertrand et al. 1995). In addition to expanding health-care facilities and infrastructure,
India’s family welfare program has been emphasizing outreach programs, including
home visits, mobile clinics, and community-based delivery systems, as mechanisms to
increase both the quantity and quality of services (MOHFW 2005).
5
Utilization of health services is affected not only by access but also by demand for
services, which is determined largely by socioeconomic factors, personal health beliefs,
and perceptions of illness. A number of studies have assessed the role of socioeconomic
and demographic factors in influencing demand for and utilization of maternal and child
health services (Kanitkar and Sinha 1989; Elo 1992; Swenson et al. 1993; Abdalla 1993;
Govindasamy 1994; Khan et al. 1994; Barlow and Diop 1995; Ahmed and Mosley 1997;
Regmi and Manandhar 1997; Govindasamy and Ramesh 1997; Das et al. 2001). Of
course, availability and quality of services can also influence demand for services.
In this paper, we examine factors associated with the likelihood of receiving professional
assistance at delivery for rural Indian women. More specifically, we examine the role of
antenatal care (ANC) in promoting professional assistance at delivery. An earlier study in
four Indian states observed that women who received any antenatal care were
significantly more likely to deliver in a medical institution (Sugathan et al. 2001). The
present study builds on this previous research to include professional assistance for non-
institutional deliveries, and expands its coverage to India as a whole and the North and
South regions separately, using data from the 1992-93 and 1998-99 National Family
Health Surveys (NFHS-1 and NFHS-2).
Antenatal care is hypothesized to have a positive effect on the likelihood of receiving
professional assistance at delivery, inasmuch as women receiving antenatal care come in
contact with health-care providers who are likely to encourage them to seek professional
assistance at delivery or to give birth in a medical facility. A complicating factor is that
women with pregnancy complications are more likely than other pregnant women both to
receive antenatal check-ups and to receive professional medical assistance at delivery
because of the pregnancy complication. The study examines the association between ANC
and professional assistance at delivery after adjusting for the potential confounding effect of
pregnancy complications.
6

DATA AND METHODS
Data are from India’s first and second National Family Health Surveys— NFHS-1
(conducted in 1992–93) and NFHS-2 (conducted in 1998–99). Both surveys were part of
the Demographic and Health Surveys (DHS) that have been conducted worldwide in
many developing countries since the 1980s. NFHS-1 comprises 88,562 households and
89,777 ever-married women, and NFHS-2 comprises 91,196 households and 89,199 ever-
married women. Details of sample design are contained in the basic survey reports for
NFHS-1 and NFHS-2 (IIPS 1995; IIPS and ORC Macro 2000).
The units of analysis in our study are births to rural women that took place during the
three-year period immediately preceding survey interview. The analysis is confined to
rural women partly because the vast majority (about 70 percent) of India’s population
lives in rural areas, and partly because our health-care-access variables are meaningful
only in a rural context. The analysis for rural India (all states) is based on 29,069 births
that occurred during the three-year period before NFHS-1 and 25,499 births that occurred
during the three-year period before NFHS-2. In order to capture some of India’s
demographic diversity, we also examine births to rural women in two subsets of states,
one set from North India (Bihar, Uttar Pradesh, Rajasthan, and Madhya Pradesh) and one
set from South India (Andhra Pradesh, Goa, Karnataka, Kerala, and Tamil Nadu).
The method of analysis is multinomial logistic regression (m-logit for short). The
response variable is a three-category variable representing professional assistance at
delivery (no assistance, professional assistance at home, institutional delivery).
Professional assistance for home delivery includes assistance by a doctor, nurse/midwife,
auxiliary nurse midwife (ANM), lady health visitor (LHV), or other health professional.
The principal predictor variable is number of antenatal care (ANC) visits (none, 1-2, 3+).
Other predictor variables of particular interest (because they are important variables from
the point of view of the health system) are pregnancy complications (none,
mild/moderate, severe) and two health-care-access variables—availability of a hospital
within 5 km (no, yes) and whether the mother’s village is accessible by means of an all-
weather road (no, yes). Additional control variables are mother’s age at childbirth in
7

years (<20, 20-24, 25-29, 30-49), birth order (1, 2, 3, 4+), religion of household head
(Hindu, Muslim, other), caste/tribe of household head (scheduled caste/scheduled tribe,
other), geographic region (north, central and west, east and northeast, south—not
included in the models when the North and South groups of states are examined
separately), mother’s education (illiterate, literate but not completed middle school,
middle complete or higher), mother’s current work status (not working, working),
mother’s media exposure (low, high), and household standard of living (low, medium,
high).
Some of the predictor variables require further explanation. In the categorization of
mother’s education, “middle complete” is defined as eight or more completed years of
education, and “less than middle complete” does not include illiterate. Scheduled castes
and scheduled tribes are castes and tribes identified by the Government of India as
socially and economically backward and in need of special protection from social
injustice and exploitation.1 Regarding media exposure, NFHS-1 asked questions about
exposure to radio (at least once a week), television (at least once a week), and cinema (at
least once a month), and NFHS-2 asked not only about these three media but also about
reading newspapers and magazines (at least once a week). In our analysis, low media
exposure is defined as positive responses on none or one of these four types of exposure,
and high media exposure is defined as positive responses on two, three, or four types.
Information on pregnancy complications was collected only in NFHS-2. Mild or
moderate complications include: night blindness, blurred vision, swelling of the legs,
body, or face, excessive fatigue, or anemia; and severe complications include any vaginal
bleeding or convulsions not from fever. Standard of living is defined in terms of an index
of ownership of various household goods, with index values grouped into high, medium,
1In NFHS-1, respondents were asked to report their caste/tribe, and their answers were compared with the official government list of scheduled castes/tribes before coding the response as scheduled caste, scheduled tribe, or “other.” In NFHS-2, there was no checking against the official government list. Instead, respondents were first asked the name of their caste/tribe, if any. Then, if they belonged to a caste/tribe, they were asked whether the caste/tribe was a scheduled caste, a scheduled tribe, an “other backward class,” or none of these. Because of these differences in the way the questions were asked, the caste/tribe variable is not precisely comparable between the two surveys.
8
and low standard of living.2 The categories of the remaining predictor variables are self-
explanatory.
Human subjects informed consent
The analysis presented in this study is based on further analysis of existing survey data
with all identifying information removed. The survey obtained informed consent from all
respondents before asking questions.
2In NFHS-1, the standard of living index (SLI) was calculated by adding the following scores: house type: 4 for pucca (high-quality construction materials throughout), 2 for semi-pucca, 0 for kachha (low-quality construction materials throughout); toilet facility: 4 for own flush toilet, 2 for public or shared flush toilet or own pit toilet, 1 for shared or public pit toilet, 0 for no facility or other facility; source of lighting: 2 for electricity, 1 for kerosene, gas, or oil, 0 for other source of lighting; main fuel for cooking: 2 for electricity, liquid petroleum gas, or biogas, 1 for coal, charcoal, or kerosene, 0 for other fuel; source of drinking water: 2 for pipe, hand pump, or well in residence/yard/plot, 1 for public tap, hand pump, or well, 0 for other water source; separate room for cooking: 1 for yes, 0 for no; ownership of agricultural land: 4 for 5 acres or more, 3 for 2.0–4.9 acres, 2 for less than 2 acres or acreage not known, 0 for no agricultural land; ownership of irrigated land: 2 if household owns at least some irrigated land, 0 if no irrigated land; ownership of livestock: 2 if own livestock, 0 if not own livestock; durable goods ownership: 4 each for a car or tractor, 3 each for a scooter/motorcycle or refrigerator, 2.5 for a television, 2 each for a bicycle, electric fan, radio/transistor, sewing machine, water pump, bullock cart, or thresher, 1 for a clock/watch. Index scores range from 0–10 for low SLI to 10.5–20 for medium SLI and 20.5–55 for high SLI.
In NFHS-2, the standard of living index was calculated by adding the following scores: house type: 4 for pucca, 2 for semi-pucca, 0 for kachha; toilet facility: 4 for own flush toilet, 2 for public or shared flush toilet or own pit toilet, 1 for shared or public pit toilet, 0 for no facility; source of lighting: 2 for electricity, 1 for kerosene, gas, or oil, 0 for other source of lighting; main fuel for cooking: 2 for electricity, liquid petroleum gas, or biogas, 1 for coal, charcoal, or kerosene, 0 for other fuel; source of drinking water: 2 for pipe, hand pump, or well in residence/yard/plot, 1 for public tap, hand pump, or well, 0 for other water source; separate room for cooking: 1 for yes, 0 for no; ownership of house: 2 for yes, 0 for no; ownership of agricultural land: 4 for 5 acres or more, 3 for 2.0–4.9 acres, 2 for less than 2 acres or acreage not known, 0 for no agricultural land; ownership of irrigated land: 2 if household owns at least some irrigated land, 0 for no irrigated land; ownership of livestock: 2 if own livestock, 0 if not own livestock; durable goods ownership: 4 each for a car or tractor, 3 each for a moped/scooter/motorcycle, telephone, refrigerator, or color television, 2 each for a bicycle, electric fan, radio/transistor, sewing machine, black and white television, water pump, bullock cart, or thresher, 1 each for a mattress, pressure cooker, chair, cot/bed, table, or clock/watch. Index scores range from 0–14 for low SLI to 15–24 for medium SLI to 25–67 for high SLI.
Because the standard of living index is calculated slightly differently in NFHS-1 and NFHS-2, comparisons on this index between NFHS-1 and NFHS-2 are not exact.
9
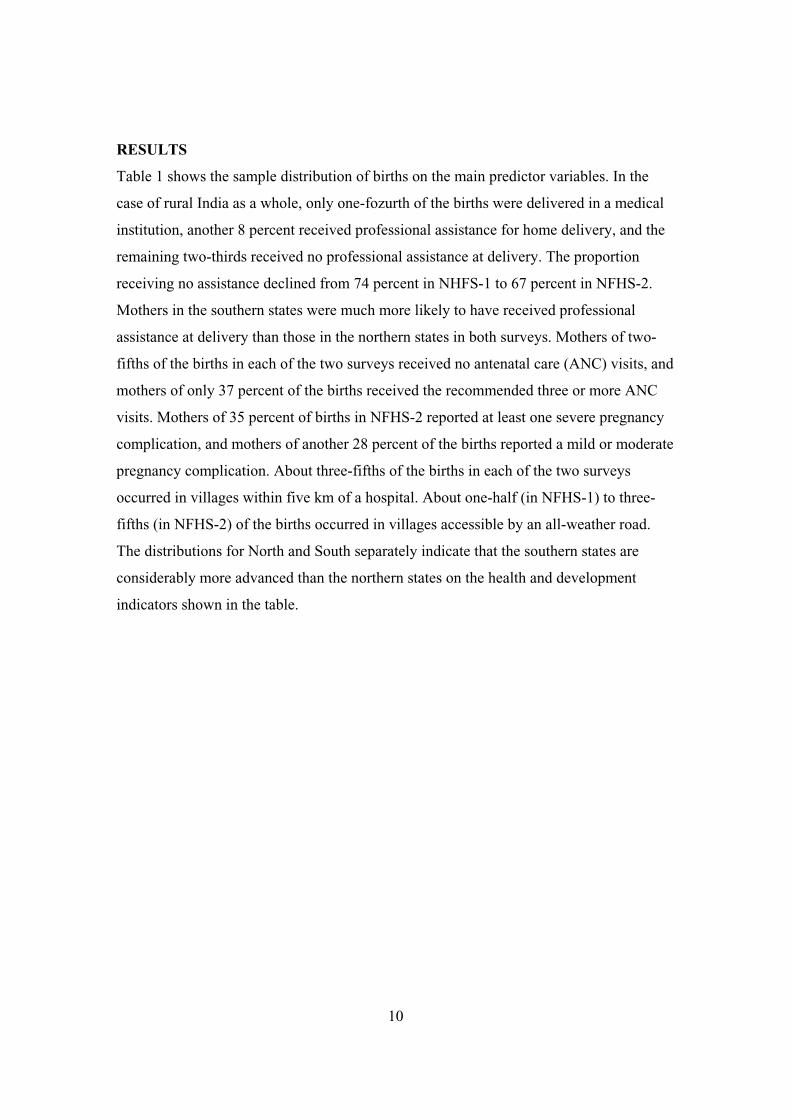
RESULTS
Table 1 shows the sample distribution of births on the main predictor variables. In the
case of rural India as a whole, only one-fozurth of the births were delivered in a medical
institution, another 8 percent received professional assistance for home delivery, and the
remaining two-thirds received no professional assistance at delivery. The proportion
receiving no assistance declined from 74 percent in NHFS-1 to 67 percent in NFHS-2.
Mothers in the southern states were much more likely to have received professional
assistance at delivery than those in the northern states in both surveys. Mothers of two-
fifths of the births in each of the two surveys received no antenatal care (ANC) visits, and
mothers of only 37 percent of the births received the recommended three or more ANC
visits. Mothers of 35 percent of births in NFHS-2 reported at least one severe pregnancy
complication, and mothers of another 28 percent of the births reported a mild or moderate
pregnancy complication. About three-fifths of the births in each of the two surveys
occurred in villages within five km of a hospital. About one-half (in NFHS-1) to three-
fifths (in NFHS-2) of the births occurred in villages accessible by an all-weather road.
The distributions for North and South separately indicate that the southern states are
considerably more advanced than the northern states on the health and development
indicators shown in the table.
10
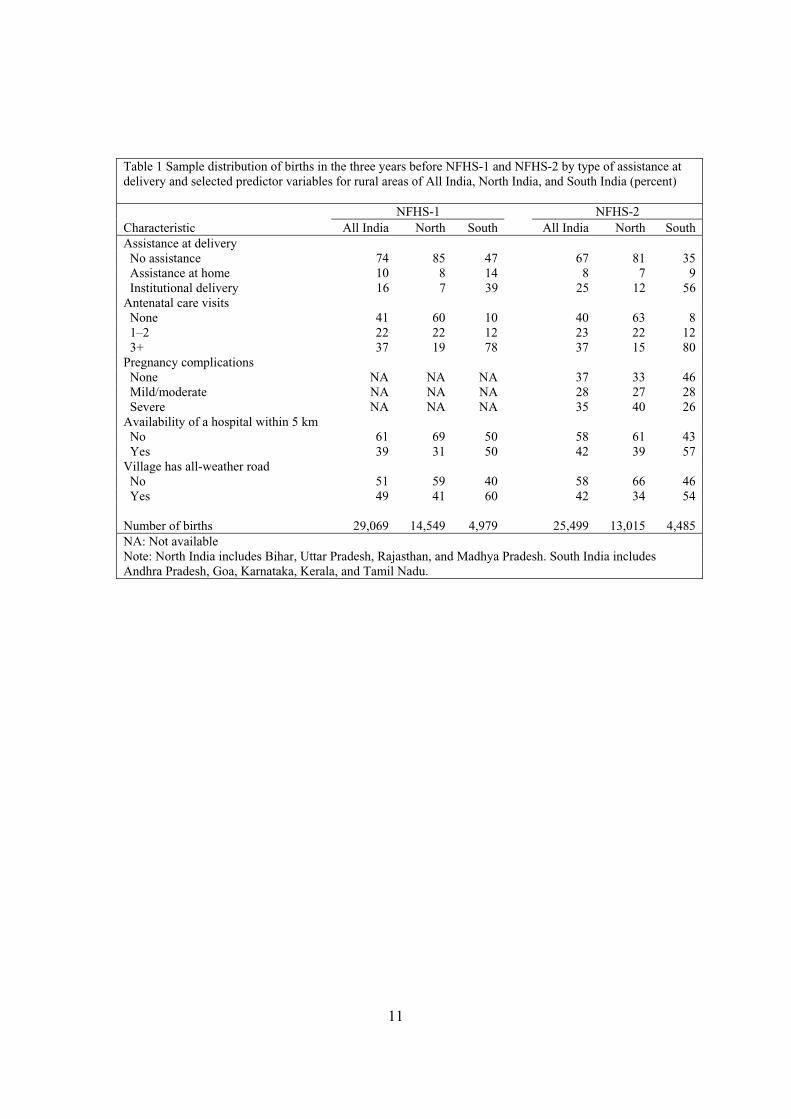
Table 1 Sample distribution of births in the three years before NFHS-1 and NFHS-2 by type of assistance at delivery and selected predictor variables for rural areas of All India, North India, and South India (percent)
NFHS-1 NFHS-2 Characteristic All India North South All India North South Assistance at delivery No assistance 74 85 47 67 81 35 Assistance at home 10 8 14 8 7 9 Institutional delivery 16 7 39 25 12 56 Antenatal care visits None 41 60 10 40 63 8 1–2 22 22 12 23 22 12 3+ 37 19 78 37 15 80Pregnancy complications None NA NA NA 37 33 46 Mild/moderate NA NA NA 28 27 28 Severe NA NA NA 35 40 26Availability of a hospital within 5 km No 61 69 50 58 61 43 Yes 39 31 50 42 39 57Village has all-weather road No 51 59 40 58 66 46 Yes 49 41 60 42 34 54
Number of births 29,069 14,549 4,979 25,499 13,015 4,485 NA: Not available Note: North India includes Bihar, Uttar Pradesh, Rajasthan, and Madhya Pradesh. South India includes Andhra Pradesh, Goa, Karnataka, Kerala, and Tamil Nadu.
11

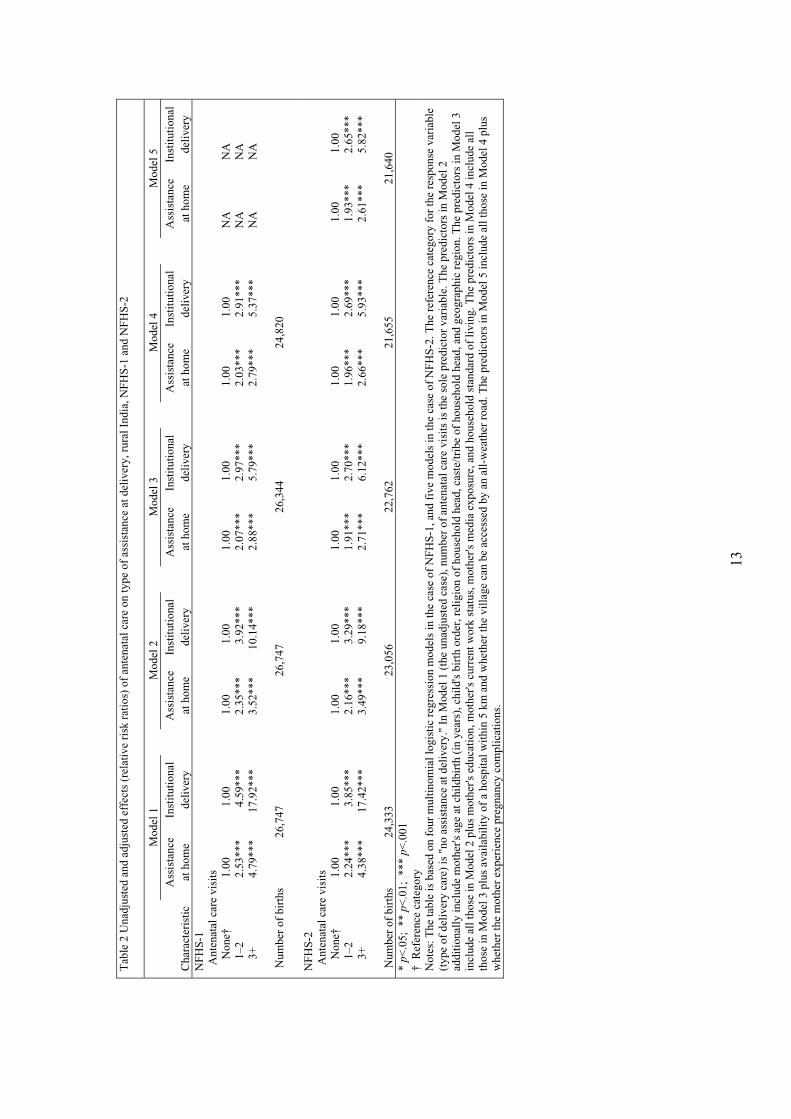
Table 2 shows unadjusted and adjusted effects of antenatal care on assistance at delivery
for rural India as a whole. Effects are measured by relative risk ratios (RRRs) calculated
for each survey separately from the fitted m-logit regression underlying each of the five
models. “Unadjusted” means that effects are estimated without controlling for other
variables, and “adjusted” means that effects are estimated with controls for other
variables. Control variables are introduced simply by adding them to the set of predictor
variables. In the unadjusted case, ANC is the only predictor variable.
In the context of Table 2, relative risks may be denoted as P1/P3 and P2/P3, where P1
denotes the predicted probability of delivery assistance at home, P2 denotes the predicted
probability of institutional delivery, and P3 denotes the predicted probability of no
assistance. “Predicted” means predicted from a fitted m-logit model. “No assistance” is
designated (arbitrarily) as the reference category of the delivery assistance variable. In
each of the five models shown in Table 2, the column labeled “assistance at home” shows
RRRs based on values of P1/P3, and the column labeled “institutional delivery” shows
RRRs based on values of P2/P3. In Model 1 for “assistance at home” for NFHS-2, the
RRR of 2.24 is the ratio of the estimated value of P1/P3 for 1-2 ANC visits to the
estimated value of P1/P3 for no ANC visits, and the RRR of 4.38 is the ratio of the
estimated value of P1/P3 for 3+ ANC visits to the estimated value of P1/P3 for no ANC
visits. The RRRs shown in the other columns have a similar interpretation, except that
P2/P3 replaces P1/P3 in the case of columns pertaining to institutional delivery.
The relative risks P1/P3 and P2/P3 are sometimes referred to as “improper odds”
(Retherford and Choe 1993). The adjective “improper” applies when the response
variable has three or more categories, as in Table 2. In this case, the numerator and
denominator of the relative risk do not add to one, as they do when the response variable
has only two categories (in which case the m-logit model reduces to the ordinary logit
model). This “improper” aspect of relative risks makes RRRs somewhat difficult to
interpret. Consider again the RRR of 2.24 in the first column of Table 2. Because this
RRR is greater than one, it suggests that P1, the probability of professional delivery
assistance at home, is higher in the case of 1-2 ANC visits than in the case of no ANC
12
Tab
le 2
Una
djus
ted
and
adju
sted
eff
ects
(re
lativ
e ri
sk r
atio
s) o
f an
tena
tal c
are
on ty
pe o
f as
sist
ance
at d
eliv
ery,
rur
al I
ndia
, NFH
S-1
and
NFH
S-2
Mod
el 1
M
odel
2
Mod
el 3
M
odel
4
Mod
el 5
A
ssis
tanc
eIn
stitu
tiona
l A
ssis
tanc
eIn
stitu
tiona
l A
ssis
tanc
eIn
stitu
tiona
l A
ssis
tanc
eIn
stitu
tiona
l A
ssis
tanc
eIn
stitu
tiona
lC
hara
cter
istic
at
hom
e de
liver
y at
hom
e de
liver
y at
hom
e de
liver
y at
hom
e de
liver
y at
hom
e de
liver
y N
FHS
-1
Ant
enat
al c
are
visi
ts
N
one†
1.
00
1.00
1.00
1.00
1.00
1.00
1.00
1.00
NA
NA
1
–2
2.53
***
4.59
***
2.35
***
3.92
***
2.07
***
2.97
***
2.03
***
2.91
***
NA
NA
3
+
4.79
***
17.9
2***
3.52
***
10.1
4***
2.88
***
5.79
***
2.79
***
5.37
***
NA
NA
Num
ber
of b
irth
s
26,
747
26,7
4726
,344
24,8
20
NFH
S
-2 A
nten
atal
car
e vi
sits
Non
e†
1.00
1.
001.
001.
001.
001.
001.
001.
001.
001.
00
1–2
2.
24 **
* 3.
85**
*2.
16**
*3.
29**
*1.
91**
*2.
70**
*1.
96**
*2.
69**
*1.
93**
*2.
65**
*
3+
4.
38 **
* 17
.42*
**3.
49**
*9.
18**
*2.
71**
*6.
12**
*2.
66**
*5.
93**
*2.
61**
*5.
82**
*
Num
ber
of b
irth
s
24,
333
23,0
5622
,762
21,6
5521
,640
*p<
.05;
**
p<.0
1; *
** p
<.00
1†
Ref
eren
ce c
ateg
ory
Not
es: T
he ta
ble
is b
ased
on
four
mul
tinom
ial l
ogis
tic r
egre
ssio
n m
odel
s in
the
case
of
NFH
S-1,
and
fiv
e m
odel
s in
the
case
of N
FHS-
2. T
he r
efer
ence
cat
egor
y fo
r th
e re
spon
se v
aria
ble
(typ
e of
del
iver
y ca
re)
is "
no a
ssis
tanc
e at
del
iver
y."
In M
odel
1 (
the
unad
just
ed c
ase)
, num
ber
of a
nten
atal
car
e vi
sits
is th
e so
le p
redi
ctor
var
iabl
e. T
he p
redi
ctor
s in
Mod
el 2
ad
ditio
nally
incl
ude
mot
her's
age
at c
hild
birt
h (i
n ye
ars)
, chi
ld's
bir
th o
rder
, rel
igio
n of
hou
seho
ld h
ead,
cas
te/tr
ibe
of h
ouse
hold
hea
d, a
nd g
eogr
aphi
c re
gion
. The
pre
dict
ors
in M
odel
3
incl
ude
all t
hose
in M
odel
2 p
lus
mot
her's
edu
catio
n, m
othe
r's c
urre
nt w
ork
stat
us, m
othe
r's m
edia
exp
osur
e, a
nd h
ouse
hold
sta
ndar
d of
livi
ng. T
he p
redi
ctor
s in
Mod
el 4
incl
ude
all
thos
e in
Mod
el 3
plu
s av
aila
bilit
y of
a h
ospi
tal w
ithin
5 k
m a
nd w
heth
er th
e vi
llage
can
be
acce
ssed
by
an a
ll-w
eath
er r
oad.
The
pre
dict
ors
in M
odel
5 in
clud
e al
l tho
se in
Mod
el 4
plu
s w
heth
er th
e m
othe
r ex
peri
ence
pre
gnan
cy c
ompl
icat
ions
.
13

visits. But this is not necessarily the case, because P1 can decrease even when P1/P3
increases. This can occur if both P1 and P3 decrease as the number of ANC visits
increases, and the proportionate decrease in P3 exceeds the proportionate decrease in P1.
This movement in opposite directions is not possible in ordinary logit regression, where
the relative risk simplifies to the (proper) odds P/(1-P), because in this case it is not
possible for both numerator and denominator to decrease simultaneously; i.e., if P/(1-P)
increases, P must increase and (1-P) must decrease.
Because of this ambiguity in the interpretation of RRRs, we also present values of P1, P2,
and P3 as an alternative way of presenting the m-logit results. These predicted
probabilities are presented in the form of predicted percentages born with no assistance,
assistance at home, or institutional delivery, as shown in Figure 1 for two of the models
in Table 2. When calculating the predicted percentages, it is necessary to assign values to
any predictor variables other than ANC that are included in the m-logit regression,
because the predicted percentages are affected by the values of the other predictors.
Typically the other predictors are held constant at their mean values in the subsample of
births for which the m-logit regression is run, and that is what is done here. Both modes
of presentation of results—RRRs and predicted percentages—are useful. In this regard, it
should be noted that RRRs have the advantage of not depending on the values of the
other predictor variables.
14

Fig
ure
1 A
dju
sted
eff
ects
of
ante
nat
al c
are
on
typ
e o
f as
sist
ance
at
del
iver
y in
ru
ral I
nd
ia, N
FH
S-1
an
d
NF
HS
-2
7
1113
7
1111
8
16
23
12
23
35
0510152025303540
None
1-2
3+
None
1-2
3+
None
1-2
3+
None
1-2
3+
Nu
mb
er o
f A
NC
vis
its
Inst
itu
tio
nal
del
iver
y
NF
HS
-1N
FH
S-2
Ass
ista
nce
at
ho
me
NF
HS
-1N
FH
S-2
Predicted percentage
Sou
rce:
Der
ived
from
Mod
el 4
for
NF
HS
-1 a
nd M
odel
5 fo
r N
FH
S-2
in T
able
2 u
sing
the
PR
ED
ICT
com
man
d in
ST
AT
A.
15
The RRRs shown in Table 2 are rather similar for NFHS-1 and NFHS-2, so the
discussion here is limited to NFHS-2. Model 1 shows unadjusted effects of ANC on
delivery assistance. RRRs rise substantially for both home assistance and institutional
delivery as the number of ANC visits increases, but more so for institutional delivery
than for home assistance. The RRR is especially high in the case of institutional delivery
for 3+ ANC visits.
Models 2-5 progressively add controls, as explained in detail in the footnote to Table 2.
The addition of controls reduces the RRRs for assistance at home, but not greatly so. The
reduction is greater in the case of institutional delivery. In Models 4 and 5, it is
noteworthy that the addition of the two health-care-access variables (availability of a
hospital within 5 km and accessibility of the village by an all-weather road) and the
pregnancy-complication variable makes little difference in the RRRs once controls have
been introduced for the demographic, geographic, and socioeconomic factors. The
unimportance of the controls for health-care accessibility suggests that India’s network of
health services is extensive enough that access to ANC and delivery services is not a
major problem. The unimportance of pregnancy complications indicates that this variable
is not confounding the relationship between ANC and professional assistance at delivery,
at least not to any significant extent. (Confounding is possible because pregnancy
complications are a common cause of both ANC and professional assistance at delivery.)
Figure 1 shows the alternative way of presenting the m-logit results, in terms of predicted
percentages receiving no assistance, assistance at home, or institutional delivery by
number of ANC visits. This is done only for the full models, namely Model 4 for NFHS-
1 and Model 5 for NFHS-2. The predicted percentage receiving assistance at home
increases much less dramatically than does the RRR as the number of ANC visits
increases. This is especially true in NFHS-2, where the RRR increases from 1.93 to 2.61
between 1-2 and 3+ ANC visits, whereas P2, the predicted percentage receiving
assistance at home, remains constant at 11 percent for both 1-2 and 3+ ANC visits. In the
case of institutional delivery, both the RRR and the predicted percentage receiving
institutional delivery increase dramatically as the number of ANC visits increases.
16
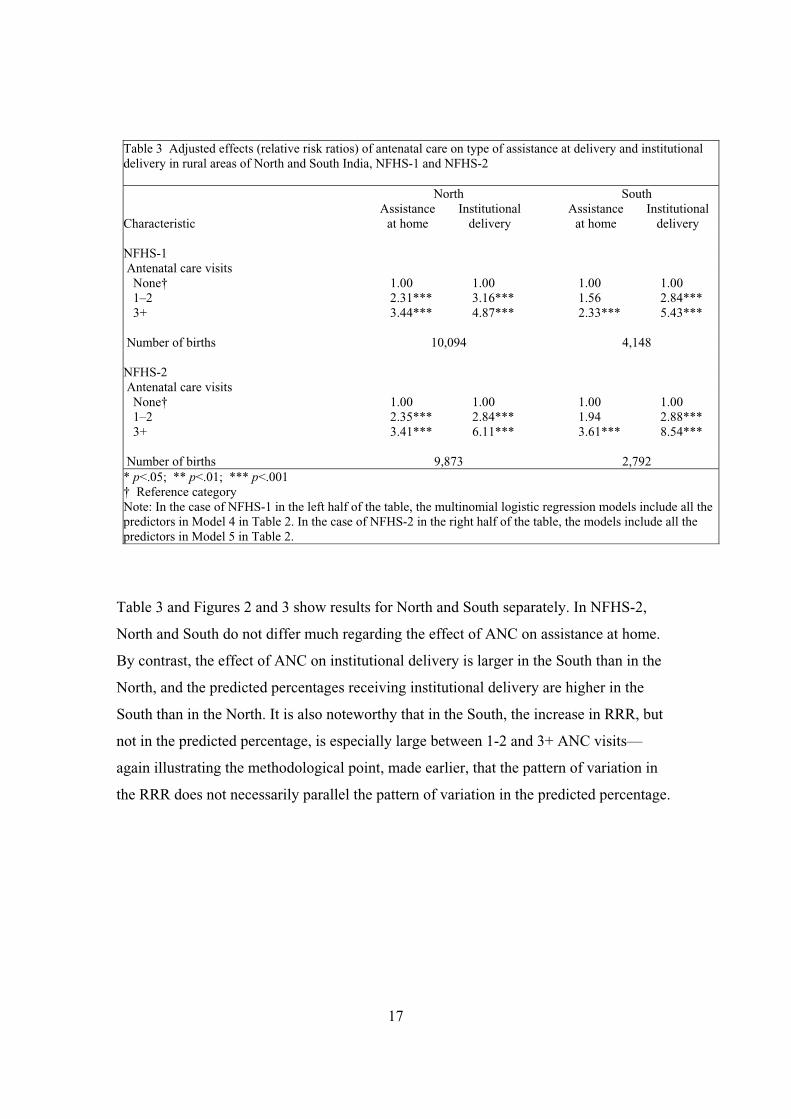
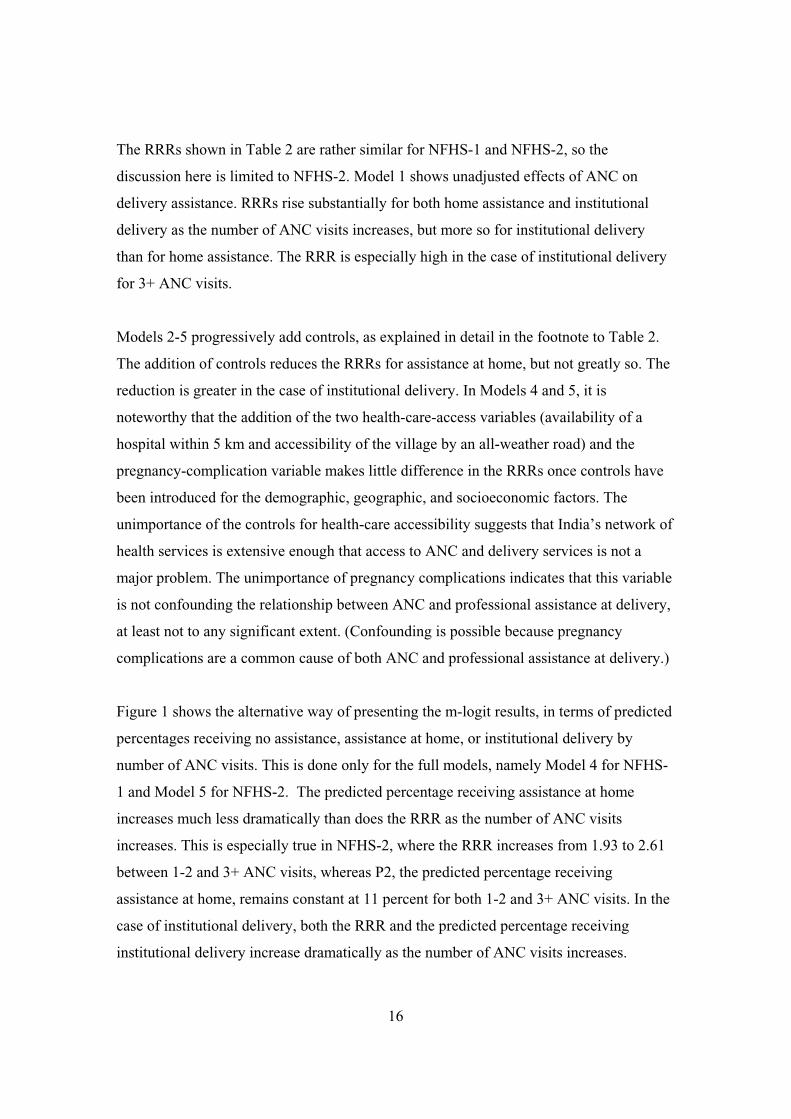
Table 3 Adjusted effects (relative risk ratios) of antenatal care on type of assistance at delivery and institutional delivery in rural areas of North and South India, NFHS-1 and NFHS-2
North South Assistance Institutional Assistance Institutional
Characteristic at home delivery at home delivery
NFHS-1 Antenatal care visits None† 1.00 1.00 1.00 1.00 1–2 2.31*** 3.16*** 1.56 2.84*** 3+ 3.44*** 4.87*** 2.33*** 5.43***
Number of births 10,094 4,148
NFHS-2 Antenatal care visits None† 1.00 1.00 1.00 1.00 1–2 2.35*** 2.84*** 1.94 2.88*** 3+ 3.41*** 6.11*** 3.61*** 8.54***
Number of births 9,873 2,792 * p<.05; ** p<.01; *** p<.001 † Reference category Note: In the case of NFHS-1 in the left half of the table, the multinomial logistic regression models include all the predictors in Model 4 in Table 2. In the case of NFHS-2 in the right half of the table, the models include all the predictors in Model 5 in Table 2.
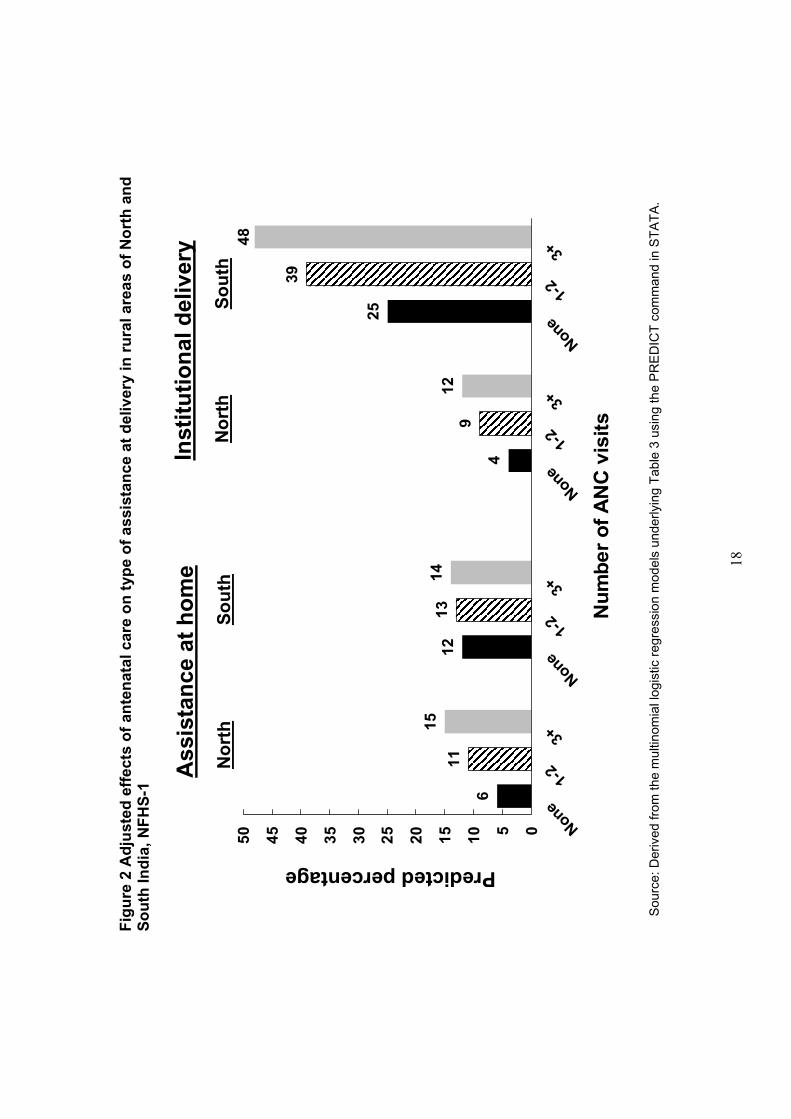
Table 3 and Figures 2 and 3 show results for North and South separately. In NFHS-2,
North and South do not differ much regarding the effect of ANC on assistance at home.
By contrast, the effect of ANC on institutional delivery is larger in the South than in the
North, and the predicted percentages receiving institutional delivery are higher in the
South than in the North. It is also noteworthy that in the South, the increase in RRR, but
not in the predicted percentage, is especially large between 1-2 and 3+ ANC visits—
again illustrating the methodological point, made earlier, that the pattern of variation in
the RRR does not necessarily parallel the pattern of variation in the predicted percentage.
17
Fig
ure
2 A
dju
sted
eff
ects
of
ante
nat
al c
are
on
typ
e o
f as
sist
ance
at
del
iver
y in
ru
ral a
reas
of
No
rth
an
d
So
uth
Ind
ia, N
FH
S-1 6
11
1512
1314
4
912
25
39
48
05101520253035404550
None
1-2
3+
None
1-2
3+
None
1-2
3+
None
1-2
3+
Nu
mb
er o
f A
NC
vis
its
Inst
itu
tio
nal
del
iver
y
No
rth
So
uth
Ass
ista
nce
at
ho
me
No
rth
So
uth
Predicted percentage
Sou
rce:
Der
ived
from
the
mul
tinom
ial l
ogis
tic r
egre
ssio
n m
odel
s un
derly
ing
Tab
le 3
usi
ng th
e P
RE
DIC
T c
omm
and
in S
TA
TA
.
18

Fig
ure
3 A
dju
sted
eff
ects
of
ante
nat
al c
are
on
typ
e o
f as
sist
ance
at
del
iver
y in
ru
ral a
reas
of
No
rth
an
d
So
uth
Ind
ia, N
FH
S-2 6
1012
79
107
15
2529
45
62
010203040506070
None
1-2
3+
None
1-2
3+
None
1-2
3+
None
1-2
3+
Nu
mb
er o
f A
NC
vis
its
Inst
itu
tio
nal
del
iver
y
No
rth
So
uth
Ass
ista
nce
at
ho
me
No
rth
So
uth
Predicted percentage
Sou
rce:
Der
ived
from
the
mul
tinom
ial l
ogis
tic r
egre
ssio
n m
odel
s un
derly
ing
Tab
le 3
usi
ng th
e P
RE
DIC
T c
omm
and
in S
TA
TA
.
19
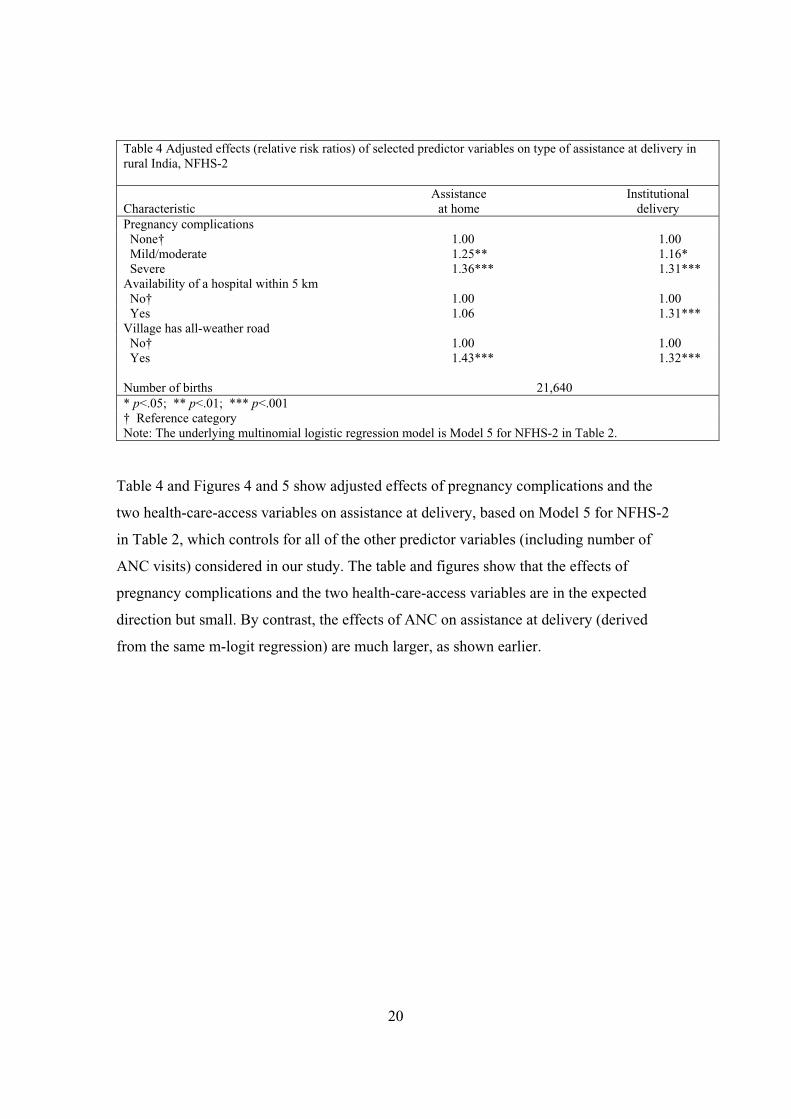
Table 4 Adjusted effects (relative risk ratios) of selected predictor variables on type of assistance at delivery in rural India, NFHS-2
Assistance Institutional Characteristic at home deliveryPregnancy complications None† 1.00 1.00 Mild/moderate 1.25** 1.16* Severe 1.36*** 1.31*** Availability of a hospital within 5 km No† 1.00 1.00 Yes 1.06 1.31*** Village has all-weather road No† 1.00 1.00 Yes 1.43*** 1.32***
Number of births 21,640 * p<.05; ** p<.01; *** p<.001 † Reference category Note: The underlying multinomial logistic regression model is Model 5 for NFHS-2 in Table 2.
Table 4 and Figures 4 and 5 show adjusted effects of pregnancy complications and the
two health-care-access variables on assistance at delivery, based on Model 5 for NFHS-2
in Table 2, which controls for all of the other predictor variables (including number of
ANC visits) considered in our study. The table and figures show that the effects of
pregnancy complications and the two health-care-access variables are in the expected
direction but small. By contrast, the effects of ANC on assistance at delivery (derived
from the same m-logit regression) are much larger, as shown earlier.
20

Fig
ure
4 A
dju
sted
eff
ects
of
pre
gn
ancy
co
mp
licat
ion
s o
n t
ype
of
assi
stan
ce a
t d
eliv
ery,
NF
HS
-2
89
10
2325
26
051015202530
No
ne
Mil
d o
rm
od
erat
eS
ever
eN
on
eM
ild
or
mo
der
ate
Sev
ere
Pre
gn
ancy
co
mp
licat
ion
s
Inst
itu
tio
nal
del
iver
yA
ssis
tan
ce a
t h
om
e
Predicted percentage Sou
rce:
Mul
tinom
ial l
ogis
tic r
egre
ssio
n m
odel
und
erly
ing
Tab
le 4
usi
ng th
e P
RE
DIC
T c
omm
and
in S
TA
TA
.
21

Fig
ure
5 A
dju
sted
eff
ects
of
hea
lth
-car
e-ac
cess
var
iab
les
on
typ
e o
f as
sist
ance
at
del
iver
y, N
FH
S-2
99
810
23
27
2426
051015202530
No
Yes
No
Yes
No
Yes
No
Yes
Inst
itu
tio
nal
del
iver
y
Ho
spit
al <
5 km
All-
wea
ther
ro
ad
Ass
ista
nce
at
ho
me
Ho
spit
al <
5 km
All-
wea
ther
ro
adPredicted percentage
Sou
rce:
Mul
tinom
ial l
ogis
tic r
egre
ssio
n m
odel
und
erly
ing
Tab
le 4
usi
ng th
e P
RE
DIC
T c
omm
and
in S
TA
TA
.
22

CONCLUSION
The analysis indicates that antenatal care has a large effect on type of professional
assistance at delivery. The effect on assistance at home is comparatively small, and the
effect on institutional delivery is comparatively large, even after controlling for a large
number of demographic, geographic, socioeconomic, and health-care-access variables.
The effect of ANC on institutional delivery is larger in the South than in the North, and
the predicted percentages receiving institutional delivery are higher in the South than in
the North. With other variables controlled, the effects of pregnancy complications and
health-care-access variables on assistance at delivery are in the expected direction but
small. By contrast, the effects of ANC on assistance at delivery are large.
Overall, the analysis indicates that improvements in antenatal care coverage are an
effective means for increasing professional assistance at delivery, and especially for
increasing institutional delivery. Since three out of four deliveries in rural India still occur
at home, most without any professional assistance, efforts to train birth attendants,
increase the availability of trained midwives, and promote home visits by paramedics for
antenatal care need further strengthening.
23
REFERENCES
Abdalla, G.M. (1993). Determinants of maternal and child health services utilization in
Egypt. In CDC 23rd Annual Seminar on Population and Development Issues in
the Middle East, Africa and Asia, compiled by Cairo Demographic Centre, Cairo,
Egypt.
Ahmed, S. & Mosley, W.H. (1997). Simultaneity in maternal-child health care utilization
and contraceptive use: evidence from developing countries. Hopkins Population
Center Papers on Population, WP 97 03. Baltimore, Maryland: Department of
Population Dynamics, School of Public Health, Johns Hopkins University.
Barlow, R. & Diop, F. (1995). Increasing the utilization of cost-effective health services
through changes in demand. Health Policy and Planning 10(3): 284 95.
Bertrand, J.T., Hardee, K., Magnani, R.J., & Angle, M.A. (1995). Access, quality of care
and medical barriers in family planning programs. International Family Planning
Perspectives 21(2): 64 9.
Das, N. P., Mishra, V.K., & Saha, P.K. (2001). Does Community Access Affect the Use of
Health and Family Welfare Services in Rural India? National Family Health
Survey Subject Reports No. 18. Mumbai: International Institute for Population
Sciences; and Honolulu: East-West Center.
Dyson, T., Cassen, R., & Visaria, L. eds. (2004). Twenty-First Century India:
Population, Economy, Human Development, and the Environment. New York:
Oxford University Press.
Elo, I.T. (1992). Utilization of maternal health-care services in Peru: the role of women's
education. Health Transition Review 2(1): 49 69.
Govindasamy, P. (1994). Poverty, women’s education and utilization of health services in
Egypt. In Women, Poverty and Demographic Change. Liege, Belgium:
International Union for the Scientific Study of Population (IUSSP).
Govindasamy, P. & Ramesh, B.M. (1997). Maternal Education and the Utilization of
Maternal and Child Health Services in India. National Family Health Survey
24

Subject Reports, No. 5. Mumbai: International Institute for Population Sciences;
and Calverton: Macro International, Demographic and Health Surveys (DHS).
International Institute for Population Sciences (IIPS). (1995). National Family Health
Survey (MCH and Family Planning), India 1992–93. Bombay: IIPS.
International Institute for Population Sciences (IIPS) and ORC Macro. (2000). National
Family Health Survey (NFHS-2), 1998 99: India. Mumbai: IIPS.
Kanitkar, T. & Sinha, R.K. (1989). Antenatal care services in five states of India. In S.N.
Singh, M.K. Premi, P.S. Bhatia, & Ashish Bose (eds.), Population Transition in
India, Vol. 2. Delhi: B.R. Publishing. Pp. 201 11.
Khan, Z., Soomro, G.Y., & Soomro, S. (1994). Mother's education and utilization of
health care services in Pakistan. Pakistan Development Review 33(4 Pt 2):
1155 66.
Koenig, M.A. & Khan, M.E. (1999). Improving Quality of Care in India’s Family
Welfare Programme: The Challenge Ahead. New York: The Population Council.
Kumar, R., Singh, M.M., & Kaur, M. (1997). Impact of health centre availability on
utilization of maternity care and pregnancy outcome in a rural area of Haryana.
Journal of the Indian Medical Association 95(8): 448 50.
Levine, R.E., Cross, H.E., Chhabra, S., & Viswanathan, H. (1992). Quality of health and
family planning services in rural Uttar Pradesh: the client's views. Demography
India 21(2): 247 65.
Ministry of Health and Family Welfare (MOHFW). (2005). Annual Report, 2003-2004.
New Delhi: MOHFW, Government of India.
Rao, P.S. & Richard, J. (1984). Socio-economic and demographic correlates of medical
care and health practices. Journal of Biosocial Science 16(3): 343 55.
Regmi, G.P. & Manandhar, M. (1997). Patterns and determinants of health care
utilization. In Insights on Family Health Issues in Nepal, compiled by Family
Health Division, Department of Health Services, Ministry of Health, Nepal, and
25
Demographic and Health Surveys (DHS), Macro International, Calverton,
Maryland. Pp. 27 48.
Retherford, R.D. & Choe, M.K. (1993). Statistical Models for Causal Analysis. New
York: John Wiley and Sons, Inc.
Rohde, J. & Viswanathan, H. (1995). The Rural Private Practitioner. New York: Oxford
University Press.
Sarita, P.T. & Tuominen, R. (1993). Use of health care services in two rural communities
in Tanzania. Community Dentistry and Oral Epidemiology 21(3): 133 5.
Shelton, J.D. & Davis, S.S. (1996). Some priorities in maximizing access to and quality
of contraceptive services. Advances in Contraception 12(3): 233 7.
Sugathan, K.S., Mishra, V., & Retherford, R.D. (2001). Promoting Institutional
Deliveries in Rural India: The Role of Antenatal-Care Services. National Family
Health Survey Subject Reports, No. 20. Mumbai: International Institute for
Population Sciences, and Honolulu: East-West Center.
Swenson, I.E., Thang, N.M., Nham, V.Q., & Tieu, P.X. (1993). Factors related to the
utilization of prenatal care in Vietnam. Journal of Tropical Medicine and Hygiene
96(2): 76 85.
Tsui, A.O., Wasserheit, J.N., & Haaga, J.G. (1997). Reproductive Health in Developing
Countries: Expanding Dimensions, Building Solutions. Washington, D.C.:
National Academy Press.
World Health Organization (WHO). (2004a). Making Pregnancy Safer: The Critical role
of the Skilled Attendant: A Joint Statement by WHO, ICM and FIGO. Geneva:
WHO.
World Health Organization (WHO). (2004b). Maternal Mortality in 2000: Estimates
developed by WHO, UNICEF and UNFPA. Geneva: WHO.
World Health Organization (WHO). (2005). World Health Report 2005: Make Every
Mother and Child Count. Geneva: WHO.
26