the effect of asset liability management on the …
TRANSCRIPT

THE EFFECT OF ASSET LIABILITY MANAGEMENT ON THE
LIQUIDITY RISK OF COMMERCIAL BANKS IN KENYA
BY
ANTHONY MUCHANGI GUTHUA
D63/73463/2012
A RESEARCH PROJECT SUBMITTED IN PARTIAL
FULFILLMENT OF THE REQUIREMENTS FOR THE AWARD OF
THE DEGREE OF MASTER OF SCIENCE IN FINANCE,
UNIVERSITY OF NAIROBI
OCTOBER, 2013

ii
DECLARATION
This research project is my original work and has not been submitted before any other
academic institution for any award.
Signature___________________________ Date________________
Anthony Muchangi Guthua
This project has been submitted for examination with my approval as the research project
supervisor.
Signature___________________________ Date________________
Mr. Herick Ondigo
Lecturer
Department of Finance and Accounting
School of Business, University of Nairobi

iii
DEDICATION
With special affection and admiration, I dedicate this research project to my wife Mary
and my son Dan.

iv
ACKNOWEDGEMENTS
I foremost give thanks to God for his grace to complete this project work. I would like to
acknowledge for their contributions and support in the process.
I wish to acknowledge all lecturers and facilitators of the school of business for the
various roles each one of them played towards the successful completion of this project.
Special thanks go to my supervisor Mr. Herick Ondigo for the extensive, useful and
intellectual comments and directions towards the success of this work.
My gratitude also goes to the staff of various bank institutions for furnishing me with
relevant data, without which nothing meaningful could have been achieved.
Special thanks go to my wife Mary for her inspirational advice and support during the
Master of Science in Finance course. And to my father, mother and all my siblings, I say
God bless you all for your prayers and support.
Thank you all and God richly bless you.

v
ABSTRACT
Liquidity is an important determinant of financial distress. The objective of liquidity
management thus is to ensure that banks are able to meet in full all their financial
obligations as they fall due. Banks liquidity is directly affected by asset liability
management decisions in the management of the balance sheet of commercial banks.
Asset liability management involves the management of the total balance sheet dynamics
and it involves quantification of risks and conscious decision making with regard to asset
liability structure in order to maximize the interest earnings within the framework of
perceived risks. The main objective of asset liability management is not to eradicate or
eliminate risk, but to manage it in a way that the volatility of net interest income is
minimized in the short run and economic value of the bank is protected in the long run.
The objective of the study was to investigate the effect of Asset liability management on
the liquidity risk on the commercial banks in Kenya.
The study adopted a descriptive design in its methodology and the researcher chose to
study on commercial banks due to availability of needed data and convenience. All the 43
commercial banks in Kenya were targeted for this study. Secondary data was obtained
from annual Central bank of Kenya Banks supervision reports as well as banks annual
and published financial reports while primary data was also collected by questionnaire
method to supplement the secondary data. Out of the 43 questionnaires issued, 35
questionnaires were returned fully completed representing 81.3%, while 8 questionnaires
were not returned representing 18.6% of the total questionnaires distributed to the
respondents. SPSS version 20.0 was used for data analysis. The test for significance was
t-test and computing the correlation coefficient (r), coefficient of determination and
analysis of variance (ANOVA).
The results of the regression analysis shows that there is a significant positive
relationship between independent variables (return on equity, capital adequacy, loan to
deposit ratio, return on assets, total assets, asset liability management policies, liquidity

vi
stress testing and contingency funding plan) and the dependent variable i.e. liquidity risk
of commercial banks). The findings of the analysis conclude that independent variables
have an effect on the liquidity risk of commercial banks in Kenya.
The research gives the following recommendations for policy: Commercial banks need to
place greater emphasis on developing an integrated view of risks facing the banks; Asset
liability committees and risk managers should implement robust and comprehensive
balance sheet management approaches; management should also ensure there are
effective liquidity management strategies. Lastly, this research study forms the basis for
further research to be extended to other financial institutions that were relevant to the
study such as Microfinance institutions (MFIs) but were not covered. A further research
could also be carried out on the role of Asset liability committee with a view to coming
up with recommendation to strengthen its role in the management bank risks. Lastly, a
research could be carried on the factors that influence liquidity levels of commercial
banks in Kenya.

vii
TABLE OF CONTENTS
DECLARATION ........................................................................................................................... ii
DEDICATION .............................................................................................................................. iii
ACKNOWEDGEMENTS ............................................................................................................ iv
ABSTRACT .................................................................................................................................... v
TABLE OF CONTENTS ............................................................................................................ vii
LIST OF TABLES ......................................................................................................................... x
LIST OF ABBREVIATIONS ...................................................................................................... xi
CHAPTER ONE: INTRODUCTION .......................................................................................... 1
1.1 Background of the Study ..................................................................................................... 1
1.1.1 Asset Liability Management ........................................................................................ 2
1.1.2 Liquidity Risk .............................................................................................................. 3
1.1.3 Effect of Asset Liability Management on Liquidity Risk ............................................ 5
1.1.4 Commercial Banks in Kenya ....................................................................................... 6
1.2 Research Problem ................................................................................................................ 8
1.3 Objective of the Study ......................................................................................................... 9
1.4 Value of the Study ............................................................................................................... 9
CHAPTER TWO: LITERATURE REVIEW ........................................................................... 11
2.1 Introduction ........................................................................................................................ 11
2.2 Theoretical Review ............................................................................................................ 11
2.2.1 Redington's Theory of Immunization ........................................................................ 11
2.2.2 Efficient Frontiers and Asset Allocation Theory ....................................................... 13
2.2.3 The Commercial Loan Theory or Real Bills Doctrine ............................................... 13
2.2.4 The Liability Management Theory ............................................................................ 14
2.3 Asset Liability Management Core Functions ..................................................................... 15

viii
2.4 Asset Liability Committee Composition and Roles ........................................................... 17
2.5 Review of Empirical Studies ............................................................................................. 18
2.6 Summary of Literature Review .......................................................................................... 20
CHAPTER THREE: RESEARCH METHODOLOGY .......................................................... 22
3.1 Introduction ........................................................................................................................ 22
3.2 Research Design................................................................................................................. 22
3.3 Population .......................................................................................................................... 22
3.4 Data Collection .................................................................................................................. 22
3.4.1 Data Validity and Reliability ..................................................................................... 23
3.5 Data Analysis ..................................................................................................................... 23
3.5.1 Analytical Model ....................................................................................................... 23
CHAPTER FOUR: DATA ANALYSIS, RESULTS AND DISCUSSION .............................. 25
4.1 Introduction ........................................................................................................................ 25
4.2 Research Findings .............................................................................................................. 25
4.5.1 Response Rate ............................................................................................................ 25
4.2.2 Highest Level of Education........................................................................................ 26
4.2.3 Work Experience ....................................................................................................... 26
4.2.4 Length of Bank operation .......................................................................................... 27
4.2.5 Asset Liability Management ...................................................................................... 27
4.2.6 Asset Liability Committee ......................................................................................... 29
4.2.7 Liquidity Stress Testing ............................................................................................. 30
4.2.8 Contingency Funding Plans ....................................................................................... 31
4.2.9 Secondary Data Results ............................................................................................. 33
4.3 Interpretation of Findings .................................................................................................. 36
CHAPTER FIVE: SUMMARY, CONCLUSION AND RECOMMENDATIONS ............... 40

ix
5.1 Introduction ........................................................................................................................ 40
5.2 Summary ............................................................................................................................ 40
5.3 Conclusion ......................................................................................................................... 41
5.4 Recommendations for Policy ............................................................................................. 42
5.5 Limitations of the Study ..................................................................................................... 43
5.6 Suggestions for Future Research........................................................................................ 44
REFERENCES ............................................................................................................................. 45
APPENDICES .............................................................................................................................. 48
Appendix i Questionnaire ..................................................................................................... 48
Appendix ii List of Commercial Banks in Kenya as at 31/12/2012 ...................................... 52
Appendix iii YEAR 2012 Secondary Data Variables ......................................................... 54
Appendix iv YEAR 2011 Secondary Data Variables ............................................................. 56

x
LIST OF TABLES
Table 4.1: Response Rate
Table 4.2: Level of Education
Table 4.3: Work Experience of Respondents
Table 4.4: Length of Bank Operation
Table 4.5: Department Responsible for Asset Liability Management Function
Table 4.6: Asset Liability Management Function
Table 4.7: Asset Liability Committee Function
Table 4.8: ALM Correlation Model
Table 4.9: Liquidity Stress Testing
Table 4.10: Liquidity Stress Testing Correlation Model
Table 4.11: Contingency Funding Plans
Table 4.12: Contingency Funding Funds Correlation Model
Table 4.13: Secondary Data Regression Model
Table 4.14: Variables Correlation Model
Table 4.15: Variables Coefficients

xi
LIST OF ABBREVIATIONS
ANOVA –Analysis of Variance
ALM -Asset Liability Management
ALCO -Asset Liability Committee
BCBS -Basel Committee on Bank Supervision
BIS -Bank for International Settlements
CFP -Contingency Funding Plan
CAR -Capital Adequacy Ratio
CBK -Central Bank of Kenya
LTD -Loan to Deposit ratio
MFIs -Micro Finance Institutions
ROA -Return on Assets
ROE -Return on Equity

1
CHAPTER ONE: INTRODUCTION
1.1 Background of the Study
Over the years, banks remained and will continue to be an important institution for any
economy as they play the most fundamental role in the payments system. In most
developing countries, commercial banks are the most dominant financial institutions,
with the capital market institutions playing a minimal role. Of the main functions of
commercial banks is the availing of funds (monetary) to its customers. For a bank to be in
a position to do so, it must be in a healthy liquidity position (Litter et al, 2004).
In a traditional financial intermediation framework, banks provide liquidity to the whole
economy. This is done through balance sheet intermediation by creating a duration
mismatch between their assets and liabilities. This transformation exists because banks
are supposed to be better at pooling, selecting and monitoring loans and borrowers than
their depositors, and are therefore able to reduce the information asymmetry on credit
markets. In so doing, banks intermediations ease the credit constraints affecting non-
financial agents.
The market turmoil that began in mid-2007 highlighted the crucial importance of market
liquidity to the banking sector. The tightening of liquidity in certain structured products
and interbank markets, as well as an increased likelihood of off-balance sheet
commitments coming onto banks‟ balance sheets led to severe funding liquidity strains
for some banks and called for central bank intervention in some cases. In response to the
market events, the Basel Committee original mandate was expanded and the working
group on liquidity risk (management and supervisory challenges) made initial
observations on the strengths and weaknesses of liquidity risk management in times of
difficulty (BIS, 2008).
These observations, together with those provided by the review of national liquidity
regimes, formed the basis of the report, which was submitted to the Basel Committee in

2
December 2007. Originally, Basel II guidelines did not focus on liquidity risk
management and the spotlight was on architecting a framework for regulatory oversight
of banking capital adequacy to ensure efficient usage and management of capital. Just at
the onset of the crisis in 2008, the Basel Committee started focusing on liquidity risk
management.
1.1.1 Asset Liability Management
Baum (1996) defines Asset Liability management (ALM) as the practice of managing a
business so that decisions and actions taken with respects to assets and liabilities are
coordinated in order to ensure effective utilization of company‟s resources to increase its
profitability. ALM is conducted primarily at an overview, balance sheet level
(Choundhry, 2011). Thus, ALM involves the management of the total balance sheet
dynamics and it involves quantification of risks and conscious decision making with
regard to asset liability structure in order to maximize the interest earnings within the
framework of perceived risks. The main objective of ALM is not to eradicate or eliminate
risk, but to manage it in a way that the volatility of net interest income is minimized in
the short run and economic value of the bank is protected in the long run. The ALM
function involves controlling the volatility of net income, net interest margin, capital
adequacy, liquidity risk and ensuring an appropriate balance between growth and risk.
The whole subject of assets liabilities management is an area of banking that has
undergone drastic change. Strong capital does not guarantee liquidity in all situations,
there can be panics and sudden increase in the demand for liquidity (Paul, 2009).
However, it is the job of the central banks to help in those circumstances. A strong capital
base in the banking system and in all its components is likely to limit future liquidity
shocks management, this is a provoking idea for the management of the financial
institutions to think about and act. However, how and when to act are the questions which
led to asset liability management; a management tool to monitor and manage various
aspects of risks associated with the balance sheet management, including the
management of exposure of the financial institutions.

3
The Asset liability management in the recent years has become a tool of integrated
analysis of assets and liabilities so to value not only the interest rate risk but the liquidity
risk, solvency risk, firm strategies and asset allocation as well. The landscape of asset
liability management for the financial sector is ever changing and the scope of asset
liability management activities has widened. Banking institutions have adopted Asset
liability management strategies to address key risks such as; interest rate risks, liquidity
risk and foreign exchange risk. A sound ALM process integrates strategic, profitability,
and net worth planning with risk management. This process often includes an Asset
Liability Committee (ALCO), which has the central purpose of attaining goals
established by the short and long-term strategic plans without taking on undue risk.
Asset liability management practice is concerned with managing interest rate and
liquidity risks and this is the ALM desk within the treasury department. Interest rate risk
exists in two strands. The first strand is that the risk of changes in asset liability value due
to changes in interest rates. Such changes impacts the cash flows of assets and liabilities,
or rather their present value, because financial instruments are valued with reference to
market interest rates. The second strand is associated with optionality, which arises with
products such as early redeemable loans. The other type of risk managed by ALM is the
liquidity risk, which refers to the liquidity of markets and the ease with which assets can
be translated to cash (Choundhry, 2011).
1.1.2 Liquidity Risk
Basel Committee on Banking Supervision defines liquidity as the ability of a bank to
fund increases in assets and meet obligations as they fall due, without incurring
unacceptable losses. The fundamental role of banks in the maturity transformation of
short-term deposits into long-term loans makes banks inherently vulnerable to liquidity
risk both of an institution – specific nature and that which affects markets as a whole.
Liquidity risk arises from maturity mismatches where liabilities have a shorter tenor than
assets. A sudden rise in the borrowers‟ demands above the expected level can lead to
shortages of cash or liquid marketable assets (Oldfield and Santamero, 1997).

4
According to Wellink (2008), "The extreme liquidity conditions and resulting difficulties
that persist today are vivid illustrations of the critical importance of market liquidity to
the banking sector, these events emphasized the links between market and funding
liquidity, the interrelationship between funding liquidity risk and credit risk, and the fact
that liquidity is a key determinant of banking sector soundness."
The main role of banks in the financial market is to create liquidity and transform risk
(Berger, & Bowman, 2009). Banks use short-term debt to invest in long-term assets
(Diamond and Dybvig, 1983). This function creates liquidity risk and therefore a bank
unable to roll over maturing debt can fail despite of being solvent. Majority of recent
bank liquidity crises in developed economies were caused by increased uncertainty over a
bank‟s solvency and played out primarily in wholesale funding markets (Huang &
Ratnovski. 2011).
Liquidity is a significant determinant of financial distress, because without liquidity a
bank cannot meet the deposit withdrawals and satisfy customer loans. The objective of
liquidity management thus is to ensure that banks are able to meet in full all their
financial obligations as they fall due. In December 2006, the Basel Committee on
Banking Supervision established the working group on Liquidity to review liquidity
supervision practices in member countries. The working group's mandate was to take
stock of liquidity supervision across member countries. This included an evaluation of
the type of approaches and tools used by supervisors to evaluate liquidity risk and banks'
management of liquidity risks arising from financial market developments.
The new Basel III accord aims to address liquidity risk in banks through the Liquidity
coverage ratio (a liquidity requirement) and the Net stable funding ratio (a restriction on
maturity mismatch that limits the volume of refinancing coming due each period. (Basel
Committee 2010). Basel III has introduced new banks requirement both on the capital
and on the liquidity risk. These changes will have big impact on banks, because they are
required to hold a level of capital and liquidity higher than in the past, this will inevitably

5
have also an impact on the liquidity creation function performed by banks (Horvàt, et al,
2012).
1.1.3 Effect of Asset Liability Management on Liquidity Risk
Asset liability management plays a critical role in weaving together the distinct business
lines in a bank. The management of both the liquidity and balance sheet are crucial to the
existence of a financial institution and sustenance of its day to day operations. It is also
essential for seamless growth of the balance sheet in a profitable way. Typically, the
Asset liability management function seeks to generate daily gaps on short-term ladders
and ensures that cumulative gaps operate within pre-set limits. However, managing
liquidity gaps alone is not adequate. A well-managed liquidity function will include
liquidity contingency plan, liquid asset buffers and setting liquidity policies and limits in
tune with level of risk that the management believes is acceptable and manageable
(Oracle White Paper, 2011).
In recent times, even large multinational financial institutions were in a deep liquidity
crisis and in dire need of external intervention for survival. The practical importance of
asset liability management and liquidity management had been somewhat
underestimated. Even managers of large institutions, regulators, and observers glimpsed
how well reputed firms and trusted institutions folded up and were not able to find a way
out of the deep liquidity crisis (Oracle white paper, 2011). This resulted in regulators
attributing high importance to new measures and practices needed to ensure a sound
liquidity management system. Regulators have enhanced and in some geographies
revamped the regulatory oversight on asset liability management and liquidity
management (Oracle white paper, 2011).
Over the past couple of decades, the financial system has evolved a more effective
approach of liquidity management. Due to financial innovation, commercial banks have
moved from an “originate to hold” model to an “originate to distribute” model. Banks
now rely more on financial markets for their funding. This has allowed the alleviating of
borrowing constraints in the economy, as growth in lending could be partially

6
disconnected from growth in bank deposits. But financial institutions were probably
overconfident in their Asset liability management techniques, which became increasingly
sophisticated. In times of stress, it appears more difficult than anticipated for financial
institutions to adjust their Asset liability management quickly. Therefore, there is
probably a limit to the optimization of asset liability management, and this is a message
for the future (Jean, 2008).
Through correct Asset liability management -liquidity, profitability and solvency of
banks can be ensured and at the same time banks can manage and reduce risks such as
credit risk, liquidity risk, interest rate risk, currency risk etc. The liabilities of a bank have
distinct categories of varying cost, depending upon the tenor and the maturity pattern.
Likewise, the assets comprise different categories with varying yield rates depending
upon the maturity and risk factors. Therefore, the major aim of Asset liability
management is the matching of the liabilities and assets in terms of maturity, cost and
yield rates. The maturity mismatches and disproportionate changes in the levels of asset
and liabilities case both liquidity risk and interest rate risk.
1.1.4 Commercial Banks in Kenya
In Kenya, there are 43 licensed Commercial banks. The regulation of banks is the
responsibility of the Central Bank of Kenya. The Banking Supervision department carries
out the function of supervising banks to ensure the following; liquidity, solvency, and
proper functioning of a stable market based banking system. Further to this, audited
performance of the banking sector is measured in terms of capital adequacy, asset quality,
liquidity, and earnings based on the Central Bank internal rating system. Under section 19
of the Banking Act in Kenya, an institution shall maintain a minimum holding of liquid
assets as the Central Bank may from time to time determine. Currently an institution is
required to maintain a statutory minimum of 20% of its deposit liabilities with the Central
Bank.

7
According to the Central Bank of Kenya, liquid assets comprise of notes and coins (local
and foreign), balances with the Central Bank of Kenya, balances with domestic
commercial banks, balances with banks abroad, balances with financial institutions,
balances with mortgage finance companies, balances with building societies, treasury
bills, treasury bonds, certificates of deposits or government bearer bonds, foreign
currency, and bearer certificates of deposit.
Central Bank of Kenya, Liquidity Regulations Supplement (2002), state that the purpose
of the regulation among others is to; ensure that each institution meets the minimum
liquidity requirements, guide institutions in the formulation of liquidity risk management
strategies, policies, procedures, management information systems, internal controls and
contingency plans for unexpected distress situations, protect deposit funds, promote a
stable and efficient banking system, and endear confidence in the financial sector. The
bank‟s supervisory department continues to adopt and implement effective and sound
supervisory methods in order to minimize the risk inherent in the banking system. The
funding gap for commercial banks is managed through a stable funding base along with
detailed forecasting.
According to the Bank supervision annual report (CBK, 2011), in the twelve months to
December 2011, the banking sector‟s average liquidity ratio was above the statutory
minimum requirement of 20 percent, with all banks meeting the liquidity threshold.
Liquidity ratio stood at 37.0 percent as at December 2011 compared to 44.5 percent
registered in 2010. The reduced liquidity ratio is attributable to increased loans and
advances in 2011 as indicated by the increase in gross loans to gross deposits ratio from
74 percent in 2010 to 80 percent in 2011. The Central Bank of Kenya however,
emphasizes that it is the responsibility of every board of directors of institutions to
develop and document liquidity risk management strategy and relevant policies (CBK,
2002).

8
1.2 Research Problem
Banks liquidity is directly affected by asset liability management decisions. Managers
should always analyze the impact that any ALM decision will have on the liquidity
position of the bank. Liquidity risk depends on asset liability management variables such
as ALM policy, contingency funding plans, maturity gap analysis, stress testing and asset
liability committee activities. Liquidity is affected by ALM decisions in some ways: Any
alterations in the maturity structure of the assets and liabilities can change the cash
requirements and flows; Savings or borrowing promotions or change the ALM mix could
have a detrimental effect on liquidity if not monitored closely while changes in interest
rates could impact liquidity. If savings rates go down, customers might withdraw their
capital and cause a liquidity shortfall. Higher interest rates on loans make it difficult for
some clients to meet interest payments, causing a liquidity shortage.
The problem with banks liquidity is that when banks get it wrong, there can be drastic
consequences for the economy. A key issue to ensure advancement has to be how to
make sure banks successfully balance their liquidity risk in order to be stable and still
supply the economy with adequate liquidity. Public policy makers will aim to continue
strong national economic growth while keeping low unemployment and inflation. Banks
themselves have a motive to ensure stability and also boast earnings. The sheer size and
complexity of the modern economy increases the importance of this topic and this is all
the more reason it needs to be carefully considered (Vossen 2010). Funding liquidity risk
has played a key role in all historical banking crises.
Preceding studies have demonstrated the need for further research in liquidity risk.
Gareth (2008) suggested a further research on liquidity risk management by concluding
that asset liability committee (ALCO) is also responsible for a bank‟s liquidity risk
management. Vossen (2010) concluded that Banks must change how to balance their
liquidity risk and their role as liquidity providers, restructuring liquidity management. He
further suggested future research noting that „„as banks and regulators change policies
there will be a need to evaluate such policies before crisis strikes in an attempt to prevent

9
or limit the intensity of crises. Empirical analyses of the regulators actions and their
effects are future research possibilities.‟‟
In Kenya, empirical evidence on the application of both the traditional and contemporary
techniques of assets liability management in the risk management process and in
particular liquidity risks by financial institutions is scanty. However, a recent research on
Kenyan banks by Citi Research (2012) suggests that „„there is a concern on the widening
liquidity gap due to the duration mismatch between their funding and asset risks. Kamau
(2013) suggested that the findings of his study forms basis for future research extending
frontiers of liquidity level in financial markets.
This research study addressed the following research question: What is the effect of Asset
liability management on the liquidity risk of commercial banks in Kenya?
1.3 Objective of the Study
The objective was to determine the effect of asset liability management on the liquidity
risk of commercial banks in Kenya.
1.4 Value of the Study
This research study is significant because it deals with an issue Kenyan banks are facing
and will continue to confront in the future. In the present scenario, Asset liability
management is important for the banking industry due to deregulation of interest rate
regime. It helps to assess the risks and manage the risks by taking appropriate actions. So,
to understand the Asset liability management process and various strategies that are
helpful for the banks to manage the liquidity risk, this topic is selected. Therefore, it
would be beneficial for me to develop my knowledge regarding the Asset liability
management process, functions and its effect on the liquidity risk in Commercial banks.
Second, policy makers such as the Central Bank of Kenya and academicians recognize
that liquidity is central in the dynamics of a financial crisis, and also that measurement of

10
liquidity is critical in evaluating and regulating systemic risk. The liquidity coverage ratio
proposed Basel III, for instance, calls for banks to maintain a sufficient buffer of liquid
assets to cover outflows over the next thirty days. This research study therefore, might
contribute to the existing body of knowledge in the area of Asset liability management in
general and its role in liquidity risk management.
Finally, and yet significantly, the research study might contribute and form the basis for
further research into the application of innovative Asset liability management strategies
in liquidity risks by similar industry players.

11
CHAPTER TWO: LITERATURE REVIEW
2.1 Introduction
This chapter highlights the literature relating to the research topic. This section dealt with
the review of theories relating to Asset liability management and liquidity risk; general
literature review; review of empirical studies and finally gave a conclusion from the
literature review indicating the gaps the research is addressing and the original
contribution it will make to the field in general.
2.2 Theoretical Review
Diverse ideas and theories guiding this research will be discussed below. These theories
are going to be; The Redington‟s theory of immunization; Efficient frontiers and asset
allocation theory; The Commercial Loan Theory and the Liability Management Theory.
These theories are aimed to show the link between Asset liability management and
liquidity risk.
2.2.1 Redington's Theory of Immunization
Redington's theory of immunization, which incredibly is now over 40 years old, is an
excellent example of an asset liability management model and as a practical model to
date; it has had very little competition. The notion of equating the mean term of assets
with the mean term of liabilities has been used for many years by a number of insurance
companies worldwide. More recently, the notion of convexity has given immunization a
new lease on life.
Immunization and the process of asset liability matching have a history that dates back to
the winter of 1951. One morning, Redington, an English actuary decided that it was
simply too cold to get up and work in the garden so he remained in bed and created the
concept immunization. His work was presented to the Institute of Actuaries in February,
1952, in London in a paper titled „„Review of the Principles of life- office valuations.‟‟ In
this paper he addressed the following question: „„is the actuary‟s certification of the

12
solvency of a life insurance company dependent on a certain level of interest rates being
maintained, or can the actuary give a more absolute certification of solvency?‟‟ In an
effort to answer this question, Redington provided the definitions to two phrases,
„„matching‟‟ and „„immunization.‟‟
Matching is defined as „„the distribution of the term of assets in relation to the term of the
liabilities in such a way as to reduce the possibility of loss arising from a change in
interest rates‟‟ (Redington, 1952). Immunization is the process of making investments in
a manner which will protect the existing business from a change in the interest rates. In
his paper, Redington concluded that the results of the actuary can be absolute under
certain circumstances, with the primary condition being that the duration of the payments
going out of the company be equal to the duration of the cash being received by the
company. It was his opinion that if this criterion be met, the assets and liabilities would
then be equally affected by changes in the market interest rate.
Duration was introduced by Macaulay back in 1938 and still remains a critical tool for
Asset Liability Management. Despite its wide usage immunization has some very
pertinent limitations. For a perfectly immunized portfolio, the following are the
conditions;
Present value of Assets = Present value of Liability
Duration of Assets = Duration of Liability
Convexity of Assets > Convexity of Liabilities
According to Cain and Treussard (2007), immunization is the act of establishing a
position such that the value of the position is insensitive to small changes in some
specified parameter and this normally enables strategic managers to meet their target
profit. The term is most commonly used to describe a liability and supporting portfolio
such that the net or surplus market value of the position is immune to small changes in
interest rates. This term could readily be applied to any business where its profits or
values have been protected from changes in the price of an input or output.

13
2.2.2 Efficient Frontiers and Asset Allocation Theory
The ideas underlying some of the most advanced Asset liability management theories of
today were established over 40 years ago with the concepts of risk-reward trade-offs and
efficient frontiers. At the time, the financial world simply was not ready for the concept
of efficient frontiers, or rather; the computer power available at the time just had not
reached the stage where the ideas could be put into practice. The efficient frontier model
is an example of a very broadly based asset liability model.
The work of Markowitz (1952), called “Portfolio Selection”, proposed that the investor
should take into account the impact of a risky security on not only a portfolios expected
return but also its variability of return. He suggested that primary function of portfolio
management is to identify an asset allocation strategy that provides the highest expected
(mean) return for a given level of risk that is acceptable to the investor. Markowitz paper
introduced the concept of the efficient frontier, which represents the set of optimal
combinations of risky assets for each level of risk. In the absence of borrowing, rational
and risk-averse investors will want to select a strategy that is on the efficient frontier.
Under the Markowitz model, given riskless lending and borrowing rates and all investors
working with the same set of inputs, all investors will prefer a single portfolio of risky
assets. This is referred to as the optimal portfolio.
2.2.3 The Commercial Loan Theory or Real Bills Doctrine
This theory originated in England during the 18th century. It is also referred to as the
„„real bills doctrine‟‟ and is of English origin. Historically, liquidity management focused
on assets and was closely tied to credit policies. Prior to 1930, the commercial loan
theory encouraged banks to make only short-term, self-liquidating loan facilities. Such
loans closely matched the maturity of bank deposits and enabled banks to meet deposit
withdrawals with funds from maturing loans. Logical basis of the theory Commercial
bank deposits are near demand liabilities and should have short term self-liquidating
obligations (Emmanuel, 1997).

14
Bankers long ago recognized the advantage of making self-liquidating loans (otherwise
known as real bills, or claims on real resources) in order to resolve the liquidity-earnings
problems. A loan was considered self-liquidating if it was secured by goods in the
process of production or by finished goods in transit to their final destination for resale.
The loan could be repaid after the goods were sold. Loans of this type could ensure the
banks continuous liquidity and earn profits. This meant that, liquidity and earnings were
simultaneously gained. However, no loan is truly automatically self-liquidating, because
there may not be a ready market for the goods produced. Therefore, Banks that limit
themselves to making self-liquidating loans are considered to subscribe to the
commercial loan theory of bank management. This practice led to the development of
commercial bills doctrine or commercial loan theory (Emmanuel, 1997).
The commercial loan theory, suffers from the fallacy of composition. Such a system can
keep one bank liquid, but if all other banks follow this procedure, then the overall
liquidity needs will not be met during times of financial crisis. Thus, a credit facility
secured by goods cannot be repaid if the goods can„t be sold off, or if the customer takes
a loan to buy the goods. The banking system is no more liquid or less liquid than it was
before the transaction. In the absence of central bank as lender of last resort and that
stands ready to supply needed liquidity to the system as a whole, the real bills doctrine is
incomplete. Although commercial loans continue to be an important component of banks
asset mix, development of other uses of their funds has caused the operating methods of
modern banks to change significantly („„Bank Theories‟‟, 2009).
2.2.4 The Liability Management Theory
Since the early 1960s, the loan portfolios of commercial banks have been affected by the
emergence of a new theory, which became known as the liability-management theory.
This is one of the important liquidity management theories and says that there is no need
to follow old liquidity norms like maintaining liquid assets, liquid investments etc.
Lately, banks have focused on liabilities side of the balance sheet. According to this
theory, banks can satisfy liquidity needs by borrowing in the money and capital markets.

15
The fundamental contribution of this theory was to consider both sides of a bank‟s
balance sheet as sources of liquidity (Emmanuel, 1997).
Today, banks use both assets and liabilities to meet liquidity needs. Available sources of
liquidity are identified and compared to expected needs by a bank‟s Asset and liability
management committee (ALCO). Key considerations include maintaining high asset
quality and a strong capital base that both reduces liquidity needs and improves a bank‟s
access to funds at low cost. There is a short-run trade-off between liquidity and
profitability. In the long-run, if management is successful in managing liquidity, then,
long-term earnings will exceed other banks earnings, as will the capital and overall
liquidity (Koch and McDonald, 2003).
2.3 Asset Liability Management Core Functions
Banks are a vital part of the economy and the essence of banking is asset liability
management (Choudhry, 2011). Broadly, Asset liability management essentially
comprises of managing the liquidity risk and market risks in an effective and efficient
manner. The Asset liability management function commonly derives its charter from the
Asset liability committee (ALCO) framework, which sets out the scope of the Asset
liability management function, the risk kinds that come under its purview and the
acceptable levels of risk appetite. Though the primary aim of Asset liability management
is managing balance sheet risks, the Asset liability management function progressively
tends to aim on balancing profitability while managing risks. This in the process pro-
actively seeks to guard the bottom-line and even maximize profitability.
According to Oracle White Paper (2011), the core functions of Asset liability
management consists of managing maturity gaps and mismatches while managing
interest rate risk within the overall mandate prescribed by ALCO. The five key
responsibilities and some usual activities initiated by the Asset liability management team
are highlighted below.

16
First, is managing structural gaps. In a financial institution with a mature Asset Liability
management function, this is arguably the most critically and continuously monitored
aspect, since the Asset Liability management Managers seeks to manage the structural
gaps in the Balance Sheet. While liquidity management focuses typically on short-term
time ladders, the structural gap management shifts the focus on time ladders more than a
year. This aspect of Asset Liability management stresses the importance of balancing
maturities as well as cash flows on each side of balance sheet (i.e. deposits and loans) It
strategizes dynamically on balancing the gaps, issuing timely guidelines to adjust focus
on „right‟ product types and tenors, and actively involve Asset liability committee in this
process (Oracle White Paper, 2011),
Second is management of static gap. Asset Liability management function takes into
consideration assets maturing in short, medium and long time ladders and seeks to
balance it vis-à-vis liabilities maturing across short, medium and long term ladders. The
gaps reports typically point to funding gaps and excess funds at different points in time.
The challenge with the Asset Liability management function is that the gaps are
dynamically evolving and need continuous monitoring as the balance sheet changes every
day (Oracle White Paper, 2011).
Third is the Duration. Duration is considered as a measure of interest rate sensitivity. The
Macaulay‟s duration is traditionally accepted as a good measure of „length‟ of portfolio
or a measure of center of gravity of discounted cash-flows over life of an asset or
liability. It is a common practice to measure duration of portfolio for different product
types as well as on an overall portfolio level and useful to simulate how duration of
portfolio will be affected by future events (Oracle White Paper, 2011). According to
Fabozzi (2003), Macaulay duration measures the „„weighted average time-to-maturity of
the bond‟s cash flow.‟‟ The weightings are the present values of cash flow.
Fourth is the dynamic gap management. It is normal practice to rely on dynamic gap
reports to simulate future gap positions for assumed business volumes and exercise of
17
options (e.g., prepayments). In addition to proposed new volumes, prepayment
transactions and assumed deposit roll-overs, the ALM manager would like to include a
proposed hedge transaction (Oracle White Paper, 2011).
The second last function is long-term assets / long-term liabilities ratio management.
Asset liability management practitioners prefer to focus on the ratio of assets and
liabilities exceeding one year and often want to set acceptable limits around this. Where
there are operational limits, the ALCO meetings will usually monitor the ratio. The
institution constantly endeavors to stay within a comfortable level around this set limit.
This along with liquidity gaps help to bring in any imbalances and help maintain a
structurally sound balance sheet by focusing on both sides (Oracle White Paper, 2011).
Lastly is the function of managing liquidity. Typically, the asset liability management
function seeks to generate daily gaps on short-term maturity ladders and ensures that
cumulative gaps operate within the already pre-set limits. However, managing liquidity
gaps alone is not adequate. A well-managed liquidity function will include a contingency
plan, capital and liquid asset buffers and setting of liquidity policies in tune with level of
risk that the management believes is acceptable and manageable (Oracle White Paper,
2011).
2.4 Asset Liability Committee Composition and Roles
The CBK prudential guideline on liquidity risk management stipulates that, in order to
effectively monitor its liquidity risk, an institution is supposed to establish an Asset
Liability Committee (ALCO) with the following four key roles: First, management of the
overall liquidity of the institution; Second, ALCO must report directly to the Board and
in the case of a foreign incorporated bank, report to the senior management of the
institution in the country; Third, ALCO must facilitate, coordinate, communicate and
control balance sheet planning with regards to risks inherent in managing liquidity and
convergences in interest rates; and; Fourth, ALCO is responsible for ensuring that a
bank‟s operations lies within the parameters set by its Board of Directors.

18
In determining the composition, size and various roles of the ALCO, the Board is
required to consider the size of the institution, the risks inherent in the institution‟s
operations and the organizational complexity. However, the ALCO is not responsible for
formulating the in-house liquidity risk management policy.
In most banks, ALCO meets at pre-determined intervals and the agenda is usually pre-
determined and for reporting purposes. In order to ensure that ALCO meetings are
effective, the ALCO pack (comprehensive in many cases) is distributed in advance and
reviewed during the meeting. The ALCO function is critical to Asset Liability
management function and serves as the reviewing and approving authority for several key
decisions including balance sheet structure, gap analysis, liquidity and capital adequacy
ratios and above all pro-active management of Balance Sheet (Oracle White Paper,
2011).
2.5 Review of Empirical Studies
Odhiambo (2006) did a survey of liability management practices in commercial banks in
Kenya and found that regular and systematic appraisal of asset liability management
policies was a common practice among most banks. Most banks also indicated that their
Asset liability management systems were governed by guidelines set by the management
board which is a cross functional outfit covering all the major functions in the bank this
showed that Asset liability management is a highly strategic issue in most banks,
regardless of their size, extensively utilized most of the conventional hedging
instruments.
Muhammed (2007) did a survey of liquidity management approaches and their effect on
profitability of commercial banks in Kenya. The researcher findings reveal that the most
popular theory with bankers is Commercial loan theory; the next is Asset liability
management theory. The evidence of use of shiftability and anticipated income theory is
weak. However, there was one bank that employed a hybrid strategy i.e. anticipated and
commercial loan theory.

19
Gareth (2008) in a case study of GBS Mutual Bank on interest rate management
concludes his thesis by summarizing the practicality of the various interest rate risk
hedging alternatives available to the GBS Mutual Bank. He noted that, implementing a
particular strategy or instrument depends, on its asset and liability committee‟s (ALCO)
decision. He suggested a further research on liquidity risk management by concluding
that since the Asset liability committee is also responsible for a bank‟s liquidity risk
management. The study could be extended to include this risk-type. Thus the lack of
liquidity can become a restraint on its profitability which is often referred to as the
„tension‟ between profitability and liquidity.
Rauch et al. (2010) study the determinants of liquidity risk and attempt to identify the
determinants of liquidity creation. Their results highlight that the most important
determinants are macroeconomic variables and monetary policy, while not showing a
significant relationship between liquidity creation and bank specific variables such as size
and performance.
Vossen, (2010), in a study on Bank liquidity management noted that banks face two
central issues concerning liquidity. Banks are responsible for managing liquidity creation
and liquidity risk. He concluded that banks must change how to balance their liquidity
risk and their role as liquidity providers by restructuring their liquidity management
strategies. Liquidity risk exposes banks to financial challenges. Banks attempt to control
liquidity risk factors by balancing cash inflows and outflows and some even hold
liquidity cushions for strategic purposes. Being exposed to too much liquidity risk expose
banks to challenges such as; run away investors, runs by depositors, ratings downgrades,
and tougher financing. These consequences are what banks wish to avoid and why they
implement policies to protect themselves from liquidity risk.
Bonfim & Kim (2011) in a study on European and North American banks in the 2002-
2009 period illustrate how banks manage liquidity risk. The authors also identify the
determinants of liquidity risk. The results highlight that the type of relationship between

20
liquidity risk and size, performance and the ratio between loans and deposits depends on
the type of liquidity risk measure used. Bank size generally has a positive impact on bank
liquidity, while the performance measure has an ambiguous relationship with liquidity
risk.
Horvath et al. (2012) in a study on Czech banks, show how capital impact on bank
liquidity creation. Authors highlight that, for smaller banks, Basel III might lead to
banks‟ reduced liquidity creation by introducing tighter capital requirements and
symmetrically greater liquidity creation might hamper banks solvency. This means that,
enhanced liquidity creation can have some detrimental consequences. The results
underline that there is a trade-off between the benefits of financial stability introduced by
the capital requirements and those of greater liquidity creation. Accordingly, they
sustained that banks that create less liquidity on the market have also a lower exposure to
liquidity risk.
Kamau (2013), study on factors influencing liquidity level of Commercial Banks in
Kisumu City, Kenya concludes that variations in liquidity level are caused by both
internal and external factors. Internal factors found significant in determining liquidity
level of commercial banks in Kisumu are contingency planning, profitability, banks
major obligations and management policies. The author suggested that the findings of his
study forms basis for future research extending frontiers of liquidity level in financial
markets.
2.6 Summary of Literature Review
From the literature review a research gap was identified in the empirical studies. The
importance of this research study was attempting to answer the research question „‟what
is the effect of Asset liability management on the liquidity risk of commercial banks in
Kenya.‟‟ The landscape of the financial services industry is becoming increasingly
competitive, coupled with rising costs of intermediation due to higher capital
requirements and deposit insurance, financial institutions face loss of spread income. In

21
the last few years, papers by the Basel Committee on Banking supervision and the
International Institute of Finance have set high hurdles in terms of principles and
recommendations. Instead of waiting to be told what to do by the regulators, banks
should be ready to demonstrate that their senior management has a clear understanding of
and a genuine involvement with their firm‟s liquidity risk management. Regulators are
very likely to place greater emphasis on local liquidity risk positions.
Liquidity risk management is entering a new and much more demanding era. Banks
should review their liquidity risk policies, contingency funding plan and their mismatch
guidelines. To achieve this, Asset and liability committees are set to play a pivotal role.
Their challenge will be to build a comprehensive, joined up perspective of their
institutions‟ asset and liability risk. ALCOs will need to ensure that fundamental
challenges are addressed. So going forward, banks will need to place greater emphasis on
developing an integrated view of risk across all the risk types. The emerging economic
landscape presents huge challenges for Asset and liability management. The most recent
financial turmoil has placed greater emphasis on liquidity management with tighter
regulations and reporting requirements. Treasury and risk managers and Asset liability
committees (ALCO‟s) need a robust and comprehensive balance sheet management
solution to meet these evolving needs (PWC, 2006).

22
CHAPTER THREE: RESEARCH METHODOLOGY
3.1 Introduction
The chapter of the research outlines the overall research methodology that was used in
the study. This includes the research design, population, data collection, data validity and
reliability and data analysis.
3.2 Research Design
A research design is a plan, structure and strategy of investigation so conceived as to
obtain answers to research questions or problems. A descriptive design will be used in the
study. Descriptive research design is a type of research method that is used when a
researcher wants to get information on the current status of a person or an object. It is
used to describe what is in existence in respect to conditions or variables that are found in
a given situation. In this research, descriptive research will be used to determine the
statistical association between the relationship of ALM variables and liquidity risk.
3.3 Population
The population of a research applies to the collection of all possible individuals, objects
or measurements of interest (Mason et al, 1999). The identification of the population of
the research question helps in narrowing down to the specific objective that is the subject
matter of the research. For the purpose of this research, the study population comprised
all the 43 commercial banks in Kenya as at 31/12/2012 (Appendix ii). Therefore, a census
was used. The justification of this population was because this is a regulatory requirement
by banks and bank institutions were easily accessible.
3.4 Data Collection
The study made use of secondary sources of data obtained from published sources such
as the Central Bank of Kenya annual surveys and Banks supervision reports. The
secondary data was supplemented with primary data collected through a questionnaire
administered on a drop and pick basis. Before the actual data is collected, the researcher

23
drafted a Questionnaire (appendix i) that was later sent to the banks. The researcher made
an initial visit to the banks for familiarization as well as seeks consent for the study.
3.4.1 Data Validity and Reliability
To ensure validity and reliability of the data to be collected, formulated questionnaires
were pre-tested to establish their validity before they are administered to the respondents.
The questionnaires were structured to enhance the research objective. Further, the
researcher discussed in details the contents and the structure of the questionnaire with the
supervisor before going to the field to ensure validity.
3.5 Data Analysis
The data collected was analyzed using the computer software known as Statistical
Package for Service Solution (SPSS) version 20.0. Descriptive, correlations and
regression analysis is applied to study and compare the effect of independent variables on
the dependent variable. The questionnaire data obtained was checked for accuracy and
completeness of recording of the responses, coded and checked for coding errors and
omissions. SPSS was used in investigating, measuring and comparing the specific issues
about the effect of Asset liability management on the liquidity risk. Quantitative analysis
techniques such frequencies and cross tabulations were used to analyze the data.
3.5.1 Analytical Model
Liquidity risk was the dependent variable while Asset liability management components
were the independent variables of the research study. The researcher used t-test as a test
of significance since the sample size is large and greater than 30. The researcher
computed correlation coefficient (r), coefficient of determination (r2) and analysis of
variance (ANOVA) using the regression model below.

24
Y = α + β1X1+ β2X2+ β3X3+ β4X4+ β5X5+ β6X6+ β7X7+ β8X8 + ℮
Where;
Y denotes the dependent variable (Liquidity risk) –This is measured as a ratio by dividing
net liquid assets to total short term liabilities.
α is the value of the intercept.
βi is the coefficient of the explanatory x variables.
℮ is the error term assumed to have zero mean and independent across time period.
X1 is the return on equity (ROE) – It is measured by dividing earnings available for
common stockholders to common stock equity.
X2 is the capital adequacy ratio (CAR) – This is a measure of the financial strength of a
bank, expressed as a ratio of its capital to its assets. This is given by dividing total capital
by the total risk weighted assets.
X3 is the Loan to deposit ratio (LTD) – This ratio measures the gross loans to gross
deposits ratio. It is the amount of a bank's loans divided by the amount of its deposits at
any given time.
X4 is the Return on assets (ROA) - This is the bank asset utilization ratio and is measured
by dividing the operating income by the total assets.
X5 is the size of the bank. This is measured as the natural log of total assets.
X6 is the presence and importance of ALM and liquidity management policies.
X7 is the presence and importance of liquidity stress testing.
X8 is the presence and importance of contingency funding plans.

25
CHAPTER FOUR: DATA ANALYSIS, RESULTS AND DISCUSSION
4.1 Introduction
This chapter presents the analysis of study findings of the investigation on the effect of
asset liability management on the liquidity risk of commercial banks. In the study
variables which were included are; return on equity, capital adequacy, loan to deposit
ratio, return on assets, total assets, ALM policies, liquidity stress testing and contingency
funding plan. This chapter analyses the variables involved in the study and estimates of
the model presented in the previous chapter.
4.2 Research Findings
4.5.1 Response Rate
The response rate of the respondents who participated in the survey is as shown in table
4.1 below. Out of the 43 questionnaires which were issued, 35 questionnaires were
returned fully completed representing 81.4%, while 8 questionnaires were not returned
representing 18.6% of the total questionnaires distributed to the respondents. It can be
inferred that the response rate was good. According to Mugenda and Mugenda (2003), a
response rate of 70% and over is excellent for analysis and reporting on the opinion of the
entire population.
Table 4.1: Response Rate
Rate
(n = 43)
Response Rate F %
Filled Questionnaires 35 81.4
Unreturned questionnaires 8 18.6
43 100
Source: Research findings

26
4.2.2 Highest Level of Education
Table 4.2 below indicate that (6.0%) respondents who participated in the study were
college graduates, 51.4% indicated they were undergraduates and 42.6% indicated they
were post graduates. This shows that majority of the respondents were undergraduates.
Table 4.2: Level of Education
Education level
(n = 35)
Education level F %
Diploma 2 6.0
Undergraduate 18 51.4
Postgraduate 15 42.6
35 100
Source: Research findings
4.2.3 Work Experience
Results of the study indicate that 22.8% of the respondents had worked between 1-2
years 28.4%, 25.6% and 14.2% of the respondents had worked for a period between 3-
5, 6-8 and 9-11 years respectively, while 9.0% of the respondents had a work experience
of over 12 years as indicated on table 4.3.
Table 4.3: Work Experience of Respondents
Years of Service
(n = 35)
Work Experience F %
1-2 years 8 22.8
3-5 years 10 28.4
6-8 years 9 25.6
9-11years 5 14.2
27
12+years 3 9.0
35 100
Source: Research findings
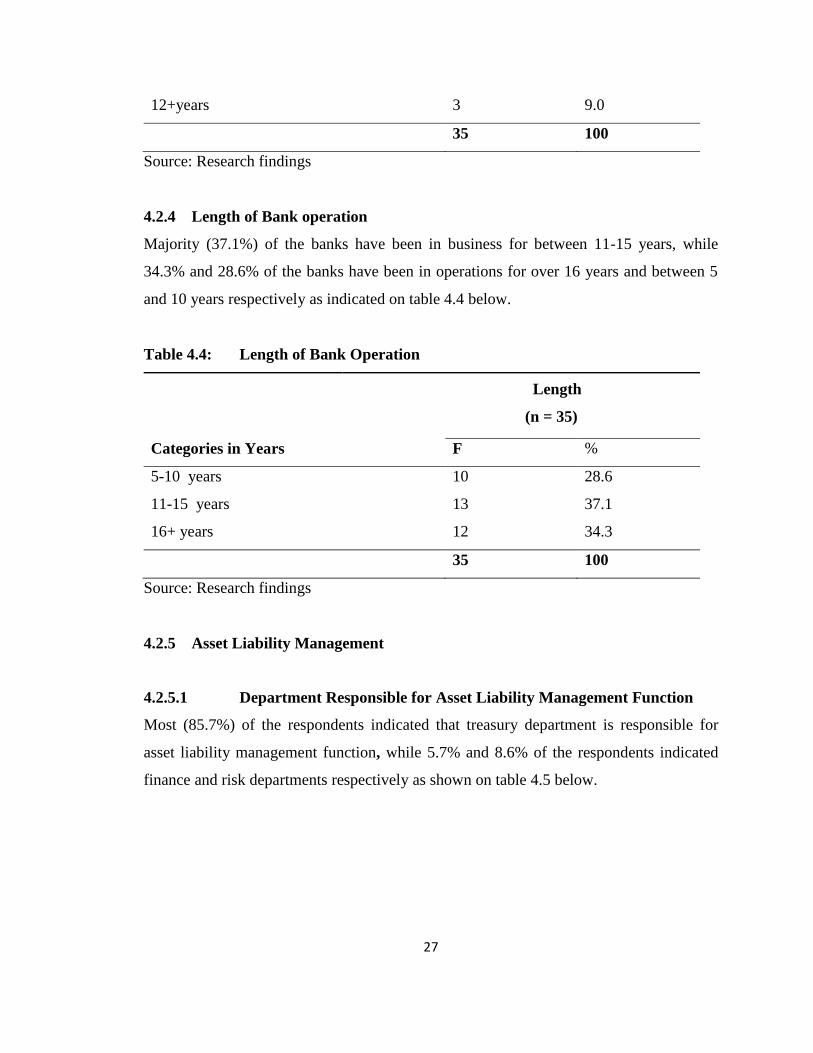
4.2.4 Length of Bank operation
Majority (37.1%) of the banks have been in business for between 11-15 years, while
34.3% and 28.6% of the banks have been in operations for over 16 years and between 5
and 10 years respectively as indicated on table 4.4 below.
Table 4.4: Length of Bank Operation
Length
(n = 35)
Categories in Years F %
5-10 years 10 28.6
11-15 years 13 37.1
16+ years 12 34.3
35 100
Source: Research findings
4.2.5 Asset Liability Management
4.2.5.1 Department Responsible for Asset Liability Management Function
Most (85.7%) of the respondents indicated that treasury department is responsible for
asset liability management function, while 5.7% and 8.6% of the respondents indicated
finance and risk departments respectively as shown on table 4.5 below.

28
Table 4.5: Department Responsible for Asset Liability Management Function
Response
(n = 35)
Departments F %
Treasury 30 85.7
Finance 2 5.7
Risk 3 8.6
35 100
Source: Research findings
4.2.5.2 Asset Liability Management Function
The study shows the views of respondents on the role of asset liability management
function. Majority (33.3%), (38.9%), (42.2%) and (55.6%) of the respondents strongly
agreed and agreed respectively that asset liability management function involves
managing both assets and liabilities, maturity gaps and mismatches, structural, static and
dynamic gaps liquidity risk and market risks as shown on table 4.6 below.
Table 4.6: Asset Liability Management Function
(n = 35)
Statements SA A N SD D
% % % % %
Managing both assets and liabilities 33.3 26.7 10 15.1 14.9
Managing liquidity risk and market risks 38.9 24.4 16.7 4.7 5.3
Managing maturity gaps and mismatches 42.2 27.8 15 7.6 7.4
Managing structural, static and dynamic
gaps
23.3 55.6 11.1 4.4 5.6
Source: Research findings

29
4.2.6 Asset Liability Committee
According to the study majority (40.0%), (45.6%), (34.4%), and (41.1%) of the
respondents strongly agreed and agreed respectively that management of liquidity of the
bank, facilitates, coordinates, communicates and control risk planning, ensures bank‟s
risk lies within parameters set by the board and undertakes maturity analysis of assets and
liabilities to identify liquidity gaps as shown in table 4.7.
Table 4.7: Asset Liability Committee Function
(n = 35)
Statements SA A N SD D
% % % % %
Management of overall liquidity of the bank 33.3 40.0 11 10.2 0.5
Facilitates, coordinates, communicates and
control balance sheet risk planning
45.6 28.9 0.5 11.2 9.8
Ensures bank‟s risk lies within parameters
set by the Board
27.8 34.4 10 0.5 16.7
Undertakes regular maturity analysis of
assets and liabilities to identify liquidity gaps
16.7 41.1 22.2 16.4 3.6
Source: Research findings
Relationship between Asset Liability Management Policies, Asset Liability
Committee and Liquidity Risk of Commercial Banks
Results on table 4.8 below shows the correlations between asset liability management
policies and liquidity risk management of commercial banks, while holding the
correlation coefficient (r) value at between plus and minus one (-1.00 and +1.0). The
study used the significance level of alpha = .05 (95%), Degrees of freedom (df) of 7, and
two-tailed test.

30
Based on the study, correlation coefficient (r) was .833 and the coefficient of
determination (r2) was .693 indicating that 69% of the liquidity risk of commercial banks
can be predicted by asset liability management policies. Since the correlation of .693 is
positive it can be concluded that the correlation is statistically significant, hence there is a
positive relationship between liquidity risks of commercial banks and asset liability
management policies.
Table 4.8: ALM Correlation Model
R R Square df Sig
.833a .693 7 .028
Source: Research findings
4.2.7 Liquidity Stress Testing
Table 4.9 below indicated the majority (42.8%), (36.1%), (33.3%) and (33.3%) of the
respondents agreed that liquidity stress testing: involves macro variables, capital controls
and withdrawal of funding; consists of prepayments obligations, bid-ask spreads and
collateral demands; involves cash flow timing and magnitude, liquidity gap relative to
tolerance, profitability and solvency; and provides insight in the liquidity risks of the
bank under different situations.
Table 4.9: Liquidity Stress Testing
(n = 35)
Statement SA A N SD D
% % % % %
Involves macro variables, capital controls
and withdrawal of funding
27.2 42.8 11 10 9
Consists of prepayments obligations, bid-
ask spreads and collateral demands
30.6 36.1 11 8.3 14

31
Involves cash flow timing and magnitude,
liquidity gap relative to tolerance,
profitability and solvency
25.0 33.3 8.3 14 19
provides insight in the liquidity risks of the
bank under different situations
30.5 33.3 11.1 8.3 17
Source: Research findings
Relationship between Liquidity Stress Testing and Liquidity Risk of Commercial
Banks
Table 4.10 below show the study results based on correlation coefficient (r) value at
between plus and minus one (-1.00 and +1.0); significance level (Alpha = .05 or 95%),
Degrees of freedom (df) of 6 and two-tailed test. Results of the analysis showed:
correlation coefficient (r) of .761 and the coefficient of determination (r2) of .579
indicating that 58% of the liquidity risk of commercial banks can be predicted by
liquidity stress testing. Since the correlation of .579 is positive it can be concluded that
the correlation is statistically significant, hence there is a positive relationship between
liquidity stress testing and liquidity risk of commercial banks.
Table 4.10: Liquidity Stress Testing Correlation Model
R R Square df Sig
.761a .579 6 .026
Source: Research findings
4.2.8 Contingency Funding Plans
Majority (38.3%), (53.3%), (50.0%) (47.8%), (33.7%), (43.1%) and (49.9%) of the
respondents strongly agreed and agreed respectively that: CFP process provides
additional insight into the bank‟s liquidity strengths and weaknesses; CFP scenario
analysis may identify an undesirable liquidity position before a crisis begins; CFP
primarily addresses low-probability and high-impact events, the severity and duration of

32
negative liquidity events; CFP provide a plan for responding to various and increasing
levels of a bank‟s liquidity stress; CFP designate management responsibilities, crisis
communication methods and channel, and reporting requirements; CFP identifies a menu
of contingent liquidity sources that a bank can use under various liquidity adverse
situations; and CFP describe steps to be taken to ensure bank‟s sufficiency of sources of
liquidity to fund operating requirements and meet the bank‟s commitments.
Table 4.11: Contingency Funding Plans
(n =35)
SA A N SD D
Contingency Funding Plans % % % % %
CFP process provides additional insight into the
bank‟s liquidity strengths and weaknesses
38.9 33.3 11.1 0.6 11.1
CFP scenario analysis may identify an
undesirable liquidity position before a crisis
begins
53.3 16.7 20 7.2 2.8
CFP primarily addresses low-probability and
high-impact events, the severity and duration of
negative liquidity events
50.0 27.8 0.6 0.6 11.1
CFP provide a plan for responding to various
and increasing levels of a bank‟s liquidity stress
12.2 47.8 17.8 11.2 10.0
CFP designate management responsibilities,
crisis communication methods and channel, and
reporting requirements
33.7 21.1 18.2 13.6 13.4
CFP identifies a menu of contingent liquidity
sources that a bank can use under various
liquidity adverse situations
43.1 19.8 17.6 11.5 8.0

33
CFP describe steps to be taken to ensure bank‟s
sufficiency of sources of liquidity to fund
operating requirements and meet the bank‟s
commitments
49.9 30.0 11.0 7.0 1.1
Source: Research findings
Relationship between Contingency Funding Plans and Liquidity Risk
Table 4.12 below show results of study analysis based on correlation coefficient (r) value
at between plus and minus one (-1.00 and +1.0); significance level = .05. (95%), degrees
of freedom (df) of 6, and two-tailed test. The results of the study showed, correlation
coefficient (r) = .684 and the coefficient of determination (r2) = .467 indicating that .47%
of the liquidity risk of commercial can be predicted by contingency funding plans. Since
the correlation of .467 is positive it can be concluded that the there is a positive
relationship between contingency funding plans and liquidity risk of commercial banks.
Table 4.12: Contingency Funding Plans Correlation Model
R R Square df sig
1 .684a .467 6 .041
Source: Research findings
4.2.9 Secondary Data Results
Relationship between Return on Equity, Capital Adequacy Ratio, Return on Assets,
Loan to Deposit Ratio, Total Assets and Liquidity Risk
The findings of the analysis is based on the significance level (alpha) of 0.05 (95%),
degrees of freedom (df) of 5, and two-tailed test indicated: Return on Equity (r2 = 0..401;
t=2.011); Capital Adequacy Ratio (r2=.346; t=2.009); Loans to Deposits Ratio (r2=.577;
t=2.006); Return on Assets (r2=.452; t=2.004) and Total Assets (r2=.769; t=2.008).

34
The result on table 4.13 below show a positive coefficient of determination (r2) indicating
that: liquidity risk is influenced by return on equity, capital adequacy ratio, loans to
deposits ratio, return on assets and total assets. In addition, the computed t-values: Return
on Equity (t=2.011); Capital Adequacy Ratio (t=2.009); Loans to Deposits, Ratio
(t=2.006); Return on Assets (t=2.004); Total Assets (t=2.008) are smaller than the critical
t-value of (2.057) and higher than the significance threshold of 1.96 (0.05). This then
indicate that there is a significant relationship between liquidity risk and return on equity,
capital adequacy ratio, loans to deposits ratio, return on assets and total assets.
Table 4.13: Secondary Data Correlation Model
Model r r2 df t Sig
Return on Equity .634 a .401
a 5 2.011 .013
Capital Adequacy Ratio .589 a .346
a 5 2.009 .010
Loans to Deposits Ratio .760 a .577
a 5 2.006 .039
Return on Assets .673 a .452
a 5 2.004 .027
Total Assets .877 a .769 5 2.008 .048
Source: Research findings
Regression between Independent and Dependent Variables
Results of the study on table 4.14 and 4.15 based on the significance level (alpha) of 0.05
(95%), degrees of freedom (df) of 5, and two-tailed test, shows the degree of the
relationship between the effect of asset liability management on the liquidity risk of
commercial banks as per the regression model, Y = α + β1X1+ β2X2+ β3X3+ β4X4+ β5X5+
β6X6+ β7X7+ β8X8 + ℮
The results of the study indicate: correlation coefficient (r), =.761; (r2) =.579; computed
t-value (t=2.06) which is smaller than the critical (t-value = 2.57) and greater than the
(alpha=0.05 or 1.965); while the p-value = 0.129 is larger than the significance level of
0.05. From the results it can be concluded that there is a significant relationship between

35
independent variables (return on equity, capital adequacy, loan to deposit ratio, return on
assets, total assets, ALM policies, liquidity stress testing and contingency funding plan)
and the dependent variable (liquidity risk of commercial banks). Hence return on equity,
capital adequacy, loan to deposit ratio return on assets total assets, ALM policies,
liquidity stress testing and contingency funding plans affect liquidity risk of commercial
banks.
Table 4.14: Variables Regression Model
Model R R Square df P-Value Sig.
1 .761a .579 5 .129
a .049
a
Source: Research findings
Table 4.15: Variables Coefficients
Variables B Beta t Sig.
(Constant) 1.640 7.752 .000
Return on Equity 0.129 0.074 0.440 0.062
Capital Adequacy 0.164 0.155 0.902 0.72
Loan to Deposit ratio 0.086 0.209 1.213 0.003
Return on Assets 0.051 0.127 0.696 0.040
Total Assets 0.346 -0.015 0.088 0.031
ALM policies 0.051 0.127 0.696 0.040
Liquidity Stress Testing 0.346 -0.015 -0.068 0.031
Contingency Funding Plans 1.237 0.082 0.494 0.024
Source: Research findings

36
4.3 Interpretation of Findings
4.3.1 Asset Liability Management
The results of the analysis shows that majority (33.3%), (38.9%), (42.2%) and (55.6%) of
the respondents strongly agreed and agreed respectively that asset liability management
function involves managing both assets and liabilities, maturity gaps and mismatches,
structural ,static and dynamic gaps liquidity risk and market risks. While most (40.0%),
(45.6%), (34.4%) , (41.1%) of the respondents strongly agreed and agreed respectively
that asset liability management consists of facilitating, coordinating, communicating and
controlling risk planning undertakes maturity analysis of assets and liabilities to identify
liquidity gaps and ensures that the bank‟s risk lies within parameters set by the board.
On the relationship between asset liability management policies and liquidity risk of
commercial banks, the results showed that there is a positive relationship between
liquidity risks of commercial banks and asset liability management policies as evidenced
by positive correlation coefficient (r) of .833 and the coefficient of determination (r2) of
.693 indicating that 69% of the liquidity risk of commercial banks can be predicted by
asset liability management policies. The study is in line with the views of Choudhry
(2011) who observed that Asset liability management essentially comprises of managing
the liquidity risk and market risks in an effective and efficient manner.
4.3.2 Liquidity Stress Testing
Majority (42.8%), (36.1%), (33.3%) and (33.3%) of the respondents agreed that liquidity
stress testing involves macro variables, capital controls and withdrawal of funding;
consists of prepayments obligations, bid-ask spreads and collateral demands; involves
cash flow timing and magnitude, liquidity gap relative to tolerance, profitability and
solvency; and provides insight in the liquidity risks of the bank under different situations.
On the other hand the results of the correlation analysis showed a positive relationship
between liquidity stress testing and liquidity risk of commercial banks as shown by

37
correlation coefficient (r) of .761 and the coefficient of determination (r2) of .579
indicating that 58% of the liquidity risk of commercial banks can be predicted by
liquidity stress testing. The findings of the study concurs with Vossen (2010) finding in
which the author observes that banks must change how to balance their liquidity risk and
their role as liquidity providers by restructuring their liquidity management strategies
which include liquidity stress testing which is an important instrument of asset liquidity
risk management.
4.3.3 Contingency Funding Plans
The findings of the study showed that majority (38.3%), (53.3%), (50.0%), (47.8%),
(33.7%), (43.1%) and (49.9%) of the respondents strongly agreed and agreed respectively
that: CFP process provides additional insight into the bank‟s liquidity strengths and
weaknesses; identify undesirable liquidity position before a crisis begins; addresses low-
probability and high-impact events, the severity and duration of negative liquidity events;
provide a plan for responding to various and increasing levels of a bank‟s liquidity stress;
designate management responsibilities, crisis communication methods and channel, and
reporting requirements; identifies a menu of contingent liquidity sources that a bank can
use under various liquidity adverse situations and describe steps to be taken to ensure
bank‟s sufficiency of sources of liquidity to fund operating requirements and meet the
bank‟s commitments.
The correlation analysis results also showed that there is a positive relationship between
contingency funding plans and liquidity risk of commercial as indicated by the results of
(r = .684); (r2 = .467) indicating that .47% of the liquidity risk of commercial can be
predicted by contingency funding plans. The study confirms the findings of Kamau
(2013), who established that variations in liquidity level are caused by both internal and
external factors which include the absence or presence of contingency planning necessary
for managing liquidity risk.

38
4.3.4 Relationship between Return on Equity, Capital Adequacy Ratio, Return on
Assets, Loan to Deposit Ratio, Total Assets and Liquidity Risk
The result of the regression analysis indicated that there is a significant positive
relationship between liquidity risk and return on equity, capital adequacy ratio, loans to
deposits ratio, return on assets and total assets. This is evidenced by positive coefficient
of determination (r2 = 0.401); Capital Adequacy Ratio (r2=.346); Loans to Deposits
Ratio (r2=.577); Return on Assets (r2=.452); Total Assets (r2=.769). In addition, the
computed t-values: Return on Equity (t=2.011); Capital Adequacy Ratio (t=2.009); Loans
to Deposits Ratio (t=2.006); Return on Assets (t=2.004); Total Assets (t=2.008) are
smaller than the critical t-value of (2.057) and higher than the significance threshold of
1.96 (0.05). The findings are in line with the views of Bonfim and Kim (2011) who
noted that the type of relationship between liquidity risk and size, performance and the
ratio between loans and deposits depends on the type of liquidity risk measure used,
however this study did not focus on the specific measures that banks use in the
management of liquidity risk.
4.3.5 Relationship between Independent and Dependent Variables
The results of the regression analysis shows that there is a significant relationship
between independent variables (return on equity, capital adequacy, loan to deposit ratio
return on assets total assets, ALM policies, liquidity stress testing and contingency
funding plan) and the dependent variable (liquidity risk of commercial banks), hence
return on equity, capital adequacy, loan to deposit ratio return on assets total assets, ALM
policies, liquidity stress testing and contingency funding plans affect liquidity risk of
commercial banks. This is derived from of the analysis which indicated that: correlation
coefficient (r), =.761; (r2) =.579; computed t-value (t=2.06) which is smaller than the
critical (t-value = 2.57) and greater than the (alpha=0.05 or 1.965); while the p-value =
0.129 is larger than the significance level of 0.05. The findings of this study confirms the
findings of Kamau (2013) who established that variations in liquidity level are caused by

39
both internal and external factors which include contingency planning, profitability,
banks obligations and management policies.

40
CHAPTER FIVE: SUMMARY, CONCLUSION AND
RECOMMENDATIONS
5.1 Introduction
This chapter introduces the summary from the data analysis; conclusion and
recommendations for the policy. It also highlights limitations of the study and finally
gives suggestions for future research studies.
5.2 Summary
The study established the existence of a positive relationship between liquidity risks of
commercial banks and asset liability management policies since most banks have asset
liability management committee who undertake regular and systematic appraisal of asset
liability management policies across the banks operational areas. Asset liability
management committee involves managing assets and liabilities, maturity gaps and
mismatches, structural, static and dynamic gaps liquidity risk and market risks. In
addition asset liability management consists of facilitating; coordinating, communicating
and controlling risk planning undertakes maturity analysis of assets and liabilities to
identify liquidity gaps and ensures that the bank‟s risk lies within parameters set by the
board
The study found out that there is a positive relationship between liquidity stress testing
and liquidity risk of commercial banks as liquidity stress testing involves macro
variables, capital controls and withdrawal of funding; consists of prepayments
obligations, bid-ask spreads and collateral demands; involves cash flow timing and
magnitude, liquidity gap relative to tolerance, profitability and solvency; and provides
insight in the liquidity risks of the bank under different situations.
It was established from the results that there is a positive relationship between
contingency funding plans and liquidity risk of commercial as the CFP process
provides insight into the bank‟s liquidity strengths and weaknesses; identify undesirable

41
liquidity position before a crisis begins; addresses low-probability and high-impact
events, the severity and duration of negative liquidity events; provide a plan for
responding to various and increasing levels of a bank‟s liquidity stress; designate
management responsibilities, crisis communication methods and channel, and reporting
requirements; identifies a menu of contingent liquidity sources that a bank can use under
various liquidity adverse situations and describe steps to be taken to ensure bank‟s
sufficiency of sources of liquidity to fund operating requirements and meet the bank‟s
commitments.
The study established that liquidity risk can result into experiencing adverse operational
and financial problems such as decline in investor confidence, panic withdrawals and
daily operation problems hence banks attempt to control liquidity risk factors such as
return on equity, capital adequacy ratio, loans to deposits ratio, return on assets and total
assets of commercial banks by balancing cash inflows and outflows hence the existence
of positive relationship between liquidity and liquidity risk factors. It also found out that
there is a significant positive relationship between -return on equity, capital adequacy,
loan to deposit ratio, return on assets total assets, ALM policies, liquidity stress testing
and contingency funding plan and liquidity risk of commercial banks. Hence -return on
equity, capital adequacy, loan to deposit ratio, return on assets, total assets, ALM
policies, liquidity stress testing and contingency funding plans affect liquidity risk.
5.3 Conclusion
Asset liability management function has a key role in managing asset liquidity risk and
among other consists of facilitating; coordinating, communicating and controlling risk
planning undertakes maturity analysis of assets and liabilities to identify liquidity gaps
and ensures that the bank‟s risk lies within parameters set by the board. Liquidity stress
testing involves macro variables, capital controls and withdrawal of funding; consists of
prepayments obligations, bid-ask spreads and collateral demands; involves cash flow
timing and magnitude, liquidity gap relative to tolerance, profitability and solvency; and
provides insight in the liquidity risks of the bank under different situations.

42
Contingency funding plans process provides insight into the bank‟s liquidity strengths
and weaknesses; identify undesirable liquidity position before a crisis begins; addresses
low-probability and high-impact events, the severity and duration of negative liquidity
events; provide a plan for responding to various and increasing levels of a bank‟s
liquidity stress; designate management responsibilities, crisis communication methods
and channel, and reporting requirements; identifies a menu of contingent liquidity sources
that a bank can use under various liquidity adverse situations and describe steps to be
taken to ensure bank‟s sufficiency of sources of liquidity to fund operating requirements
and meet the bank‟s commitments.
Banks‟ liquidity needs depend significantly on the balance sheet structure, product mix,
and cash flow profiles of both on and off balance-sheet obligations which without
efficient management can result into banks experiencing adverse operational and
financial problems such as decline in investor confidence, panic withdrawals and daily
operation problems. Hence, banks attempt to control liquidity risk factors such as return
on equity, capital adequacy ratio, loans to deposits ratio, return on assets and total assets
of commercial banks by balancing cash inflows and outflows hence the existence of
positive relationship between liquidity risk and liquidity risk factors.
5.4 Recommendations for Policy
There is need for commercial banks to place greater emphasis on developing an
integrated view of risk across all the risk types and the banks operational areas while
ensuring that the Asset management committee introduces and implements tighter
regulations and reporting requirements with tighter capital requirements and
symmetrically greater liquidity creation.
There is need for bank treasuries, risk managers and asset liability committees (ALCO‟s)
to implement a robust and comprehensive balance sheet management solution to meet the
evolving financial needs of the bank while taking into consideration the emerging
liquidity risks arising from the banks business expansion and technology.

43
There is need for the bank management and staff to take cognizance of the fact that
management of liquidity risks must not be left to the Asset liquidity management
committee but is for all the participants in the organization. However, the management
and board of directors must take the lead and continuously develop proactive policies and
communicate the same consistently so as to ensure that every employee and manager
buys into the process of asset liquidity management.
There is need for the bank to regularly train its employees on the various balance sheet
risks and how they can be managed especially in the changing business environment in
which the organization strives to be competitive in the marketplace and at the same
ensure that its profitable from its business operations. Employee training must be laced
with efficient planning and monitoring process so as to ensure that both the risk
management objectives and those of the overall organization are met.
Management needs to continuously develop, implement proactive, efficient and
effective liquidity management strategy that allows the institution to monitor and
measure expected daily gross liquidity inflows and outflows, manage and mobilize
collateral when necessary to obtain intraday credit, identify and prioritize time-specific
and other critical obligations in order to meet them when expected; settle other less
critical obligations as soon as possible and control credit to customers when necessary.
5.5 Limitations of the Study
There was some reluctance was experienced from some bank staff in the provision of
documents containing bank statement and other relevant information with regards to the
study for fear of being reprimanded by their superiors in the organizations who are
responsible for issues related to the bank risk management. However, the researcher
assured the respondents of the confidentiality of the documents that they provide and
sought authority from management to undertake research in the bank.

44
Due to finance and time constraints, the research was limited to only commercial banks
in Kenya. Therefore, to generalize the results for a larger group, the study should have
involved a larger area of study, may be in other sectors of the economy or in other areas
of the country.
Lastly, there was the challenge of accessing past bank record due to poor record keeping
hence there was scant information that could be accessed in terms of published financial
statements, however the researcher used other relevant documentation to collect the
required information despite the fact that it took longer than anticipated.
5.6 Suggestions for Future Research
This research study was limited to data collected from banks, however there are many
other financial institutions and providers who were relevant to the study such as
Microfinance institutions (MFIs) but were not covered. Since the study tested only the
banking institutions, other financial institutions should be studied in order to compare the
results.
The role of Asset liability committees has grown in importance in the management of
balance sheet, liquidity risks and in the implementation of liquidity risk management
strategies. Hence, there is need for further research on the role of this important
committee with a view to coming up with recommendation to strengthen the committee‟s
role in the bank institutions.
Further research study can be conducted on the factors that influence the liquidity levels
of commercial banks in Kenya. Future research should be conducted based on categories
of demographic characteristics such as bank ownership (public, private and foreign) and/
or size of the bank among others.

45
REFERENCES
Basel Committee on Banking Supervision. (2008). Principles for Sound Liquidity Risk
Management and Supervision. Retrieved from
http://www.bis.org/publ/bcbs144.pdf
Basel Committee on Banking Supervision. (2013). Basel III: The Liquidity Coverage
Ratio and Liqudity risk monitoring tools. Retrieved from
http://www.bis.org/publ/bcbs238.htm
Bank for International Settlements (BIS). (1998) “Enhancing Transparency
Regarding the Authorities‟ Foreign Currency Liquidity Position”, Report of
Working Group. http://www.bis.org
Bonfim D. & Kim M. (2011). Liquidity Risk in Banking: is there herding? Retrieved
from http://www.greta.it/credit/credit2011/PAPERS/Posters/29/2_Bonfim.pdf
Central Bank of Kenya. Prudential guidelines for institutions licensed under the Banking
Act. Retrieved from http://www.centralbank.go.ke
Central Bank of Kenya (2010), Liquidity Regulations Supplement 72, Kenya. Retrieved
from http://www.centralbank.go.ke
Emmanuel, N.R, (1997), Commercial Banking in an Era of Deregulation, Greenwood
Publishing Group, 3rd
Ed.
Fabozzi F.J. and Atsuo K., (1999), Asset and Liability Management. S. Chand and
company: Delhi.
Fabozzi, F. J., & Konishi, A. (1996). The handbook of asset-liability management: State
of the art, investment strategies, risk controls and regulatory requirements.
Chicago: Irwin.
Financial Services Authority (FSA), (2009) “The Turner Review- A Regulatory Response
to the Global Banking Crisis.”
Fiscal Policy Research Institute, Thailand. (February 2010), Regulation and Supervision
for Sound Liquidity Management for Banks. Korean Institute of Finance.
Horvàt R., Seidler J. & Weill L. (2012). Bank‟s Capital and Liquidity Creation: Granger
Causality Evidence. Working Paper Series n. 5, Czech National Bank.

46
Institute of International Finance (IIF). (2007) “Principles of Liquidity Risk
Management”. Retrieved from www.iif.com/download.php
International Monetary Fund (IMF). (2009) “Lessons of the Financial Crisis for Future
Regulation of Financial Institutions and Markets and for Liquidity Management”.
Jean, P.R. (2008), What happened to liquidity? A central banker‟s perspective. Deputy
governor of the Banque de France. Retrieved from http://www.banque-
france.fr/en/banque-de- france/press-releases-and-speeches/speeches.html
Loo, M. A, (2007). „‟A survey of liquidity management approaches and their effect on
profitability of commercial banks in Kenya.‟‟ Retrieved from
http://erepository.uonbi.ac.ke:8080/xmlui/handle/123456789/23005
Ndichu, P.K, (2013). „„Factors Influencing Liquidity Level of Commercial Banks in
Kisumu City, Kenya‟‟. Research paper, Author. Retrieved from
http://icbr.net/pub/full_pdf/icbr.net- 0205.66.pdf
Oracle financial services. (2011). Asset Liability Management: An Overview, An Oracle
White Paper.
Oracle financial services (2011). Practices and Emerging Trends in Asset liability
management and Liquidity risk, An Oracle White Paper. Oracle financial
services
Rauch C., Steffen F., Hackethal A., & Tyrrel M. (2010) Saving Banks, Liquidity Creation
and Monetary Policy. Retrieved from: http://www.wiwi.uni-
frankfurt.de/fileadmin/user_upload/dateien_abteilungen/abt_fin/Dokuene/PDFs/A
llgemeine_Dokumente/Schwerpunkte/Dezentrale_Verbundstrukturen_im_Banken
markt/Determi nants_of_Bank_Liquidity_Creation.pdf
Redington, F.M. (1952). Review of the Principles of Life –office Valuations, Journal of
the Institute of Actuaries. Vol. 18, Pg. 286 -340.
Richard, B., and Shyam, V. (2006), Liquidity risk management. Global Perspectives
on challenges and opportunities. Retrieved from
http://www.pwc.com/gx/en/banking- capital-markets/pdf/liquidity.pdf
Ritter L.S., Silber W.L. and Udell G. F. (2004), Principles of Money, Banking, and
Financial Markets. Massachusetts. Addison Wesley.

47
Rosen D. and Zenios S., (2006) Handbook of Asset and Liability Management,
Handbooks in Finance, North-Holland.
Ryan, B; Scapens, R.W, and Theobald,M. (2002); Research Method and Methodology in
Finance and Banking, 2nd
Edition.
Sergio, M.F and Fabozzi F.J. (2006) the mathematics of financial modeling & investment
–The Frank J. Fabozzi Series. John Wiley & Sons, Inc., Hoboken, New Jersey.
Shedden, A.D., (1977) A Practical Approach to Applying Immunization Theory, TFA.
Vol. 35. P. 313.
Shiu, Elias S. (1987) Immunization – the matching of Assets and Liabilities, Actuarial
Science. J.B. MacNeill & G.J. Umphrey (eds.), D. Reibold Publishing Co.,
Dordrecht. Pg. 145 - 156.
SOA (2003) Society of Actuaries Professional Actuarial Specialty Guide: Asset-Liability
Management Retrieved from http://www.soa.org/library/professional-actuarial-
specialty- guides/professional-actuarial-specialty
guides/2003/september/spg0308alm.pdf
Timothy, W. K, and MacDonald, S. S, (2003), Liquidity planning and managing cash
assets. Bank Management, 5th
Ed.
Vossen B. (2010), A study on Bank Liquidity Management. Author. University at Albany,
State University of New York.
Williamson, G.A. (January 2008), Interest Rate Risk Management: A Case Study of GBS
Mutual Bank. Author.

48
APPENDICES
Appendix i Questionnaire
PART I: Background Information
1. Name of the bank
……………………………………………………………
2. What is your highest level of education?
Diploma [ ] Undergraduate [ ]
Post Graduate [ ]
3. How long have you been working in the banking industry?
1-2 Years [ ] 3-5 Years [ ] 6-8 Years [ ] 9-11 Years [ ]
12 and above [ ]
4. How long has your bank been operating in Kenya
5- 10 years [ ] 11 -15 years [ ] 15+ years [ ]
PART 2: Asset Liability Management (ALM)
5. Which department is responsible for the Asset liability management in your bank?
Treasury Finance Risk
6. Please tick the numeric value corresponding to your personal opinion for each
statement
Statement
Str
on
gly
agre
e
Agre
e
Neu
tral
dis
agre
e
Str
on
gly
dis
agre
e
Asset liability management comprises of managing effectively
both the assets and liabilities sides of the bank balance sheet

49
Asset liability management comprises of managing liquidity
risk and market risks in an effective manner
Asset liability management consists of managing maturity
gaps and mismatches
Asset liability management involves managing structural ,
static and dynamic gap
PART 3: Asset Liability Committee (ALCO)
7. Please tick the numeric value corresponding to your personal opinion for each
statement
Statement
Str
on
gly
agre
e
Agre
e
Neu
tral
dis
agre
e
Str
on
gly
dis
agre
e
ALCO is responsible for the management of the overall
liquidity of the bank
ALCO facilitates, coordinates, communicates and control
balance sheet planning with regards to risks inherent in
managing liquidity and convergences in interest rates
ALCO is responsible for ensuring that the bank‟s operations
risk lies within the parameters set by its Board of Directors.
ALCO regularly undertakes maturity analysis of Assets and
Liabilities to identify liquidity gaps
PART 4: Liquidity Stress Testing
8. Please tick the numeric value corresponding to your personal opinion for each
statement

50
Statement
Str
on
gly
agre
e
Agre
e
Neu
tral
Dis
agre
e
Str
on
gly
dis
agre
e
Stressed testing inputs involve macro variables, capital
controls and withdrawal of funding
Stress testing include prepayments obligations, bid-ask spreads
and collateral demands
Stress testing final metric include Cash flow timing and
magnitude, Liquidity gap relative to tolerance, Profitability
and Solvency
Liquidity stress test provides insight in the liquidity risks of the
bank under different situations
PART 5: Contingency Funding Plans (CFP)
9. Please tick the numeric value corresponding to your personal opinion for each
statement
Statement
Str
on
gly
agre
e
Agre
e
Neu
tral
Dis
agre
e
Str
on
gly
dis
agre
e
CFP process provides additional insight into the bank‟s
liquidity strengths and weaknesses
CFP scenario analysis may identify an undesirable liquidity
position before a crisis begins
CFP primarily addresses low-probability and high-impact
events, the severity and duration of negative liquidity events
CFP provide a plan for responding to various and increasing
levels of a bank‟s liquidity stress

51
CFP designate management responsibilities, crisis
communication methods and channels, and reporting
requirements
CFP identifies a menu of contingent liquidity sources that a
bank can use under various liquidity adverse situations
CFP describe steps that should be taken to ensure that the
bank‟s sources of liquidity are sufficient to fund scheduled
operating requirements and meet the bank‟s commitments with
minimal costs and disruption
Thank you for your cooperation

52
Appendix ii List of Commercial Banks in Kenya as at 31/12/2012
1 ABC Bank (Kenya)
2 Bank of Africa
3 Bank of India
4 Bank of Baroda
5 Barclays Bank
6 CFCStanbic Bank
7 Chase Bank (Kenya)
8 Charterhouse Bank ltd
9 Citibank N.A.
10 Commercial Bank of Africa
11 Consolidated Bank of Kenya
12 Cooperative Bank of Kenya
13 Credit Bank
14 Development Bank of Kenya
15 Diamond Trust Bank
16 Dubai Bank Kenya
17 Eco Bank
18 Equatorial Commercial Bank
19 Equity Bank
20 Family Bank
21 Fidelity Bank
22 Fina Bank (Kenya)
23 First Community Bank
24 Giro Commercial Bank
25 Guardian Bank
26 Gulf African Bank
27 Habib Bank AG Zurich
28 Habib Bank

53
29 Imperial Bank Kenya
30 Investment & Mortgages Bank
31 Jamii Bora Bank
32 Kenya Commercial Bank
33 K-Rep Bank
34 Middle East Bank Kenya
35 National Bank of Kenya
36 National Industrial Credit Bank
37 Oriental Commercial Bank
38 Paramount Universal Bank
39 Prime Bank (Kenya)
40 Standard Chartered Bank
41 Trans National Bank Kenya
42 United Bank for Africa
43 Victoria Commercial Bank
Source: Central Bank of Kenya

54
Appendix iii YEAR 2012 Secondary Data Variables
X1 X2 X3 X4 X5
No. Name of the Bank Return
on
Equity
(ROE)
Capital
Adequacy
Ratio
(CAR)
Loan to
Deposit
ratio
(LTD)
Return
on Assets
(ROA)
Total
assets (m)
1 Kenya Commercial Bank Ltd 29.80% 21.30% 83.68% 5.20% 304,112
2 Equity Bank Ltd 37.60% 19.90% 87.26% 7.40% 215,829
3 Cooperative Bank of Kenya Ltd 33.10% 20.30% 73.39% 4.80% 199,663
4 Barclays Bank of Kenya Ltd 44.00% 22.70% 75.56% 7.00% 185,102
5 Standard Chartered Bank (K) Ltd. 37.60% 16.30% 80.20% 5.90% 195,493
6 CFC Stanbic Bank Ltd 26.00% 20.50% 87.46% 3.50% 133,378
7 Citibank N.A. 41.70% 41.10% 53.01% 10.40% 69,580
8 NIC Bank Ltd 28.60% 15.60% 85.69% 4.20% 101,772
9 Diamond Trust Bank Ltd 31.40% 17.70% 82.66% 4.90% 94,512
10 I&M Bank Ltd 28.50% 17.00% 84.36% 5.20% 91,520
11 Commercial Bank of Africa Ltd 34.30% 15.50% 53.13% 4.00% 100,456
12 National Bank of Kenya Ltd 11.00% 27.30% 50.45% 1.70% 67,155
13 Bank of Baroda Ltd 28.90% 22.60% 66.75% 3.60% 46,138
14 Chase Bank Ltd 25.80% 12.30% 80.22% 2.70% 49,105
15 Family Bank Ltd 17.40% 21.90% 72.55% 2.70% 30,985
16 Ecobank Kenya Ltd -76.70% 22.70% 65.04% -4.80% 31,771
17 Bank of India 14.90% 39.50% 54.78% 2.40% 24,877
18 Prime Bank Ltd 27.80% 17.00% 57.61% 2.70% 43,463
19 Imperial Bank Ltd 42.00% 18.20% 73.84% 5.50% 34,590
20 Bank of Africa (K) Ltd 12.70% 10.30% 85.14% 1.30% 48,958
21 Victoria Commercial Bank Ltd 24.10% 24.50% 69.98% 4.80% 10,323
22 Trans-National Bank Ltd 17.60% 37.90% 64.87% 3.70% 8,801
23 Giro Commercial Bank Ltd 11.70% 28.20% 52.97% 1.70% 12,280

55
24 African Banking Corporation Ltd 26.40% 13.60% 64.18% 2.90% 19,071
25 Fina Bank Ltd 13.90% 14.70% 63.59% 2.00% 17,150
26 Gulf African Bank (K) Ltd 23.90% 13.80% 80.45% 2.80% 13,562
27 Habib AG Zurich 26.90% 55.70% 0.00% 4.20% 9,702
28 K-Rep Bank Ltd 20.10% 20.50% 104.59% 3.20% 9,546
29 Development Bank of Kenya Ltd 6.30% 20.90% 99.70% 0.80% 13,417
30 Jamii Bora Bank Ltd 2.50% 82.80% 107.91% 1.50% 3,480
31 Habib Bank Ltd 33.80% 41.00% 0.00% 6.50% 7,014
32 Guardian Commercial Bank Ltd 18.30% 17.30% 0.00% 1.90% 11,745
33 UBA Bank (K) Ltd -32.60% 72.40% 0.00% -13.60% 2,924
34 Credit Bank Ltd 6.90% 30.30% 0.00% 1.30% 6,407
35 Consolidated Bank of Kenya Ltd 11.20% 11.40% 75.62% 1.00% 18,001
36 Oriental Commercial Bank 8.20% 28.90% 71.85% 1.80% 6,220
37 Fidelity Commercial Bank Ltd 8.60% 17.50% 63.07% 0.90% 11,772
38 Paramount Universal Bank Ltd 7.90% 46.30% 0.00% 1.20% 7,255
39 Middle East Bank (K) Ltd 4.20% 39.40% 80.50% 0.80% 5,870
40 First Community Bank Ltd 27.30% 15.80% 0.00% 290.00% 9,959
41 Dubai Bank Ltd -3.30% 45.20% 0.00% -1.20% 2,584
42 Equatorial Commercial Bank Ltd -90.80% 45.20% 58.15% -4.60% 14,109
43 Charterhouse Bank Ltd 0.00% 5.70% - 0.00% -
Source: Central Bank of Kenya

56
Appendix iv YEAR 2011 Secondary Data Variables
X1 X2 X3 X4 X5
No. Name of the Bank Return
on
Equity
(ROE)
Capital
Adequacy
Ratio
(CAR)
Loan to
Deposit
ratio
(LTD)
Return
on
Assets
(ROA)
Total
assets (m)
1 Kenya Commercial Bank Ltd 31.18% 19.90% 85.57% 4.98% 282,494
2 Equity Bank Ltd 34.53% 15.36% 87.45% 6.84% 176,911
3 Cooperative Bank of Kenya Ltd 29.41% 16.04% 76.67% 3.68% 167,305
4 Barclays Bank of Kenya Ltd 41.11% 24.10% 79.76% 7.18% 167,305
5 Standard Chartered Bank (K) Ltd 40.11% 12.31% 78.56% 5.03% 164,182
6 CFC Stanbic Bank Ltd 30.82% 12.59% 86.44% 2.23% 140,087
7 Citibank N.A. 31.77% 30.87% 61.14% 6.43% 74,646
8 NIC Bank Ltd 33.95% 14.98% 83.90% 4.57% 73,581
9 Diamond Trust Bank Ltd 31.34% 14.21% 85.23% 4.19% 77,453
10 I&M Bank Ltd 32.17% 18.12% 82.15% 5.80% 76,903
11 Commercial Bank of Africa Ltd 30.04% 13.86% 58.85% 3.58% 83,283
12 National Bank of Kenya Ltd 23.37% 27.93% 49.48% 3.56% 68,665
13 Bank of Baroda Ltd 33.96% 20.47% 63.26% 4.57% 36,701
14 Chase Bank Ltd 28.62% 11.35% 73.08% 2.33% 36,513
15 Family Bank Ltd 15.72% 16.18% 76.16% 2.01% 26,002
16 Ecobank Kenya Ltd 7.03% 14.86% 68.70% 0.45% 27,210
17 Bank of India 28.87% 45.42% 39.13% 4.18% 23,352
18 Prime Bank Ltd 28.88% 16.51% 63.71% 3.07% 35,185
19 Imperial Bank Ltd 44.28% 20.14% 83.59% 6.37% 25,618
20 Bank of Africa (K) Ltd 11.87% 12.68% 90.22% 1.43% 38,734
21 Victoria Commercial Bank Ltd 26.32% 21.39% 69.58% 4.31% 7,645
22 Trans-National Bank Ltd 16.92% 46.16% 62.62% 4.05% 7,287
23 Giro Commercial Bank Ltd 20.90% 22.53% 63.16% 2.79% 11,846

57
24 African Banking Corporation Ltd 30.28% 16.85% 67.56% 4.12% 12,507
25 Fina Bank Ltd 20.22% 16.29% 58.71% 2.12% 14,630
26 Gulf African Bank (K) Ltd 11.78% 13.53% 68.48% 1.20% 12,915
27 Habib AG Zurich 19.82% 36.23% 0.00% 2.91% 8,722
28 K-Rep Bank Ltd 19.23% 19.18% 104.78% 2.75% 9,319
29 Development Bank of Kenya Ltd 10.08% 24.68% 141.50% 1.37% 11,523
30 Jamii Bora Bank Ltd -2.43% 110.19% 76.84% -1.79% 2,070
31 Habib Bank Ltd 25.51% 33.01% 0.00% 4.62% 5,861
32 Guardian Commercial Bank Ltd 15.94% 18.23% 0.00% 1.92% 8,836
33 UBA Bank (K) Ltd -25.19% 69.49% 0.00% -5.72% 3,206
34 Credit Bank Ltd 5.35% 29.40% 0.00% 0.95% 5,394
35 Consolidated Bank of Kenya Ltd 17.18% 10.93% 76.58% 1.61% 15,318
36 Oriental Commercial Bank 14.93% 34.03% 75.77% 3.83% 5,030
37 Fidelity Commercial Bank Ltd 29.64% 13.95% 68.98% 2.79% 10,789
38 Paramount Universal Bank Ltd 11.00% 52.80% 0.00% 2.39% 4,727
39 Middle East Bank (K) Ltd 8.40% 42.76% 94.86% 1.99% 4,639
40 First Community Bank Ltd 13.34% 14.19% 0.00% 1.28% 8,740
41 Dubai Bank Ltd 2.92% 35.65% 0.00% 0.90% 2,316
42 Equatorial Commercial Bank Ltd 5.91% 13.02% 67.47% 0.55% 12,927
43 Charterhouse Bank Ltd 0.00% 0.00% - 0.00% -
Source: Central Bank of Kenya