the effect of boronizing on hardness, wear and …
TRANSCRIPT

THE EFFECT OF BORONIZING ON HARDNESS, WEAR AND CORROSION
PROPERTIES OF AISI 1018 AND AISI 316L STEELS
A Thesis Submitted to the College of
Graduate and Postdoctoral Studies
In Partial Fulfillment of the Requirements
For the Degree of Master of Science
In the Department of Mechanical Engineering
University of Saskatchewan
Saskatoon
By
Chao Peng
© Copyright Chao Peng, April 2020. All rights reserved.

i
PERMISSION TO USE
In presenting this thesis in partial fulfillment of the requirements for a postgraduate degree
from the University of Saskatchewan, I agree that the Libraries of this University may make it
freely available for inspection. I further agree that permission for copying of this thesis in any
manner, in whole or in part, for scholarly purposes may be granted by the professor who
supervised my thesis work or, in their absence, by the College of Graduate and Postdoctoral
Studies (CGPS), Head of the Department or the Dean of the College in which my thesis work
was done. It is understood that any copying or publication or use of this thesis or parts thereof
for financial gain shall not be allowed without my written permission. It is also understood that
due recognition shall be given to me and to the University of Saskatchewan in any scholarly
use which may be made of any material in my thesis.
Requests for permission to copy or to make other use of material in this thesis in whole or part
should be addressed to:
Head of the Department of Mechanical
Engineering University of Saskatchewan
57 Campus Drive, Saskatoon, Saskatchewan
S7N 5A9 Canada
OR
Dean
College of Graduate and Postdoctoral Studies
University of Saskatchewan
116 Thorvaldson Building, 110 Science Place
Saskatoon, Saskatchewan S7N 5C9 Canada

ii
ABSTRACT
Steels are widely used in potash processing, but they show unsatisfactory performance under
severe corrosion and wear conditions. Boronizing heat treatment is a good method to improve
surface properties of steels used in potash processing. However, there is dearth of information
on research works in the open literature focusing on the effect of boronizing on corrosion of
steels used in potash processing plants.
In the present study, AISI 1018 and AISI 316L steels were case-boronized at temperatures of
850 °C, 900 °C and 950 °C for 4 h, 6 h and 8 h. The effect of boronizing conditions on boride
layer thickness, hardness and boride phase evolution were investigated using hardness, surface
roughness and thickness measurements, X-ray diffraction, optical microscopy and scanning
electron microscopy. The wear, general corrosion and erosion-corrosion resistance of the
boronized steels were evaluated using a pin-on-disc wear test apparatus, electrochemical
corrosion measurements, and a flow loop apparatus, respectively.
It was found that boronizing provided significant improvement in surface hardness and wear
resistance for both AISI 1018 and AISI 316L steels. It was also found that the boride layer
formed on the surface of AISI 1018 steel worked as a protective layer to reduce its corrosion
rate in both saturated KCl and saturated raw potash solutions. However, boronizing did reduce
the corrosion resistance of AISI 316L steel in both solutions, probably due to increase in
porosity observed in the boride layer formed on it. The results of erosion-corrosion experiments
showed that boronizing was effective in improving the erosion-corrosion resistance of AISI
1018 steel in saturated potash-silica sand slurry.

iii
AKNOWLEDGMENTS
I would like to express my deepest gratitude to my supervisor, Professor Ikechukwuka N.A.
Oguocha, who accepted me as his student and motivated me during my M.Sc. program at the
University of Saskatchewan. I will always be thankful for his support, patience, advice and
instruction during my graduate program.
I would like to appreciate my committee members Professor Akindele G. Odeshi and Professor
Richard Evitts for their valuable advice. I would like to thank Mr. Zhao Nan Fang and Mr.
Robert Peace for their help, training and patience.
I am very thankful with Dr. Glyn Kennell for his professional advice on my research topic and
patience with me. I am very thankful with Dr. Jianfeng Zhu for XRD (X-ray diffraction)
training at the Saskatchewan Structural Science Center (SSSC). I am grateful to my colleagues
Raheem Elemuren, Felipe Morais Fernandes Serafim, Gang Li and Regan Gerspacher for their
support and advice both for my study and life.
I highly appreciate the financial support granted by the International Minerals Innovation
Institute (IMII) and the University of Saskatchewan.
Finally, I would like to thank my parents for all their love, support and advice during my life.
iv
TABLE OF CONTENTS
PERMISSION TO USE .............................................................................................................. i
ABSTRACT ............................................................................................................................... ii
AKNOWLEDGMENTS .......................................................................................................... iii
TABLE OF CONTENTS .......................................................................................................... iv
LIST OF TABLES ................................................................................................................. viii
LIST OF FIGURES ................................................................................................................... x
NOMENCLATURE ................................................................................................................. xv
CHAPTER 1 INTRODUCTION ............................................................................................... 1
1.1 Background .................................................................................................................. 1
1.2 Objectives .................................................................................................................... 2
1.3 Contributions................................................................................................................ 3
1.4 Thesis Organization ..................................................................................................... 3
CHAPTER 2 LITERATURE REVIEW..................................................................................... 4
2.1 Background .................................................................................................................. 4
2.1.1 Corrosion........................................................................................................... 4
2.1.2 Friction and wear resistance.............................................................................. 5
2.1.3 Erosion-corrosion .............................................................................................. 6
2.1.4 Potash and mineral industry .............................................................................. 6
2.2 Materials ...................................................................................................................... 8
2.2.1 Low carbon steel ............................................................................................... 8
2.2.2 Stainless steel .................................................................................................... 8
2.3 Boronizing.................................................................................................................... 9
2.3.1 Introduction of boronizing ................................................................................ 9
2.3.2 Boronizing techniques .................................................................................... 12
2.3.3 Growth of boride layers .................................................................................. 12
2.3.4 Effect of alloying elements ............................................................................. 15
2.3.5 Properties of Boride Layers ............................................................................ 17

v
2.3.5.1 Hardness of boride layers..................................................................... 17
2.3.5.2 Corrosion characteristics of boride layers............................................ 17
2.3.5.3 Friction and wear characteristics of boride layers ............................... 18
2.3.5.4 Other properties of boride layers ......................................................... 19
2.4 Structural Characterization of Boride Layers ............................................................ 19
2.4.1 X-ray diffraction (XRD) ................................................................................. 19
2.4.2 Scanning electron microscopy (SEM) ............................................................ 20
2.5 Corrosion and Wear Properties Determination ......................................................... 21
2.5.1 Potentiodynamic polarization ......................................................................... 21
2.5.2 Friction and wear resistance............................................................................ 22
2.5.3 Erosion-corrosion test ..................................................................................... 23
2.6 Summary .................................................................................................................... 23
CHAPTER 3 MATERIALS AND EXPERIMENTAL METHODS ........................................ 25
3.1 Materials .................................................................................................................... 25
3.2 Boronizing Treatment ................................................................................................ 27
3.3 Surface Morphology and Dimension Change ............................................................ 29
3.4 Microstructural Analysis ............................................................................................ 30
3.5 Microhardness Test .................................................................................................... 33
3.6 Statistical Analysis ..................................................................................................... 34
3.7 Wear Test .................................................................................................................... 35
3.8 Electrochemical Corrosion Test ................................................................................. 37
3.9 Erosion-corrosion Test ............................................................................................... 40
CHAPTER 4 RESULTS AND DISCUSSION ........................................................................ 44
4.1. Effect of Boronizing on Sample Dimension ............................................................. 44
4.1.1. AISI 1018 steel ............................................................................................... 44
4.1.2 AISI 316L steel ............................................................................................... 46
4.2 Effect of Boronizing Parameters on Boride Layer Thickness ................................... 47
4.2.1 AISI 1018 Steel ............................................................................................... 47

vi
4.2.2 AISI 316L Steel ............................................................................................... 50
4.2.3 AISI 1018 low carbon steel elbow .................................................................. 53
4.3 Effect of Boronizing on the Hardness of AISI 1018 and AISI 316L Steels ............... 54
4.3.1 AISI 1018 low carbon steel ............................................................................. 54
4.3.2 AISI 316L stainless steel ................................................................................. 55
4.3.3 AISI 1018 steel elbow ..................................................................................... 57
4.4 Topographical Evaluation of AISI 1018 Steel Surfaces ............................................. 57
4.5 XRD Analysis of Boronized Samples ........................................................................ 60
4.5.1 AISI 1018 steel ................................................................................................ 60
4.5.2 AISI 316L steel ............................................................................................... 62
4.6 Statistical Analysis ..................................................................................................... 64
4.6.1 Development of models for boride layer thickness and hardness of AISI 1018
steel. ......................................................................................................................... 64
4.6.2 Development of models for boride layer thickness and hardness of AISI 316L
steel. ......................................................................................................................... 67
4.6.3 Optimization of Parameters for AISI 1018 and AISI 316L ............................ 70
4.7 Effect of Boronizing on Dry Wear Properties of AISI 1018 and AISI 316L Steels ... 72
4.7.1 AISI 1018 steel ................................................................................................ 72
4.7.2 AISI 316L steel ............................................................................................... 76
4.8 Effect of Boronizing on Corrosion Properties of AISI 1018 and AISI 316L Steels .. 81
4.8.1 AISI 1018 steel ................................................................................................ 81
4.8.2 AISI 316L stainless steel ................................................................................. 84
4.9 Erosion-Corrosion of As-received and Boronized AISI 1018 Steel Elbows ............. 89
CHAPTER 5 SUMMARY, CONCLUSIONS AND RECOMMENDATIONS FOR FUTURE
WORK ..................................................................................................................................... 95
5.1 Summary and Conclusions ........................................................................................ 95
5.2 Future work ................................................................................................................ 96
REFERENCES ........................................................................................................................ 98

vii
Appendix ................................................................................................................................ 107

viii
LIST OF TABLES
Table 2.1. Properties of FeB and Fe2B [28]. ............................................................................ 11
Table 3.1. Chemical composition of AISI 1018 steel (in wt.%). 25
Table 3.2. Chemical composition of AISI 316L steel (in wt.%). ............................................. 25
Table 3.3. Chemical composition of Ekabor2 boronizing powder (in wt.%). ......................... 26
Table 3.4. Chemical composition of the silica sand particles used for erosion corrosion test. 27
Table 3.5. Chemical composition of the untreated raw potash used in the erosion corrosion test.
.................................................................................................................................................. 27
Table 3.6. Chemical composition of the etchant used for AISI 316L steel. ............................ 31
Table 3.7. Values of elastic modulus, Poisson’s ratio and radius of test sample and wear
counterpart. .............................................................................................................................. 36
Table 3.8. Hertzian contact stress under different conditions. ................................................. 36
Table 3.9. Relationship between loop flow velocity and pump frequency. ............................. 41
Table 3.10. The erosion-corrosion test parameters. ................................................................. 42
Table 4.1. Change in diameter obtained for AISI 1018 samples after boronizing at different
temperatures for various lengths of time. ................................................................................ 45
Table 4.2. Change in diameter obtained for AISI 316L samples after boronizing at different
temperatures for various lengths of time. ................................................................................ 47
Table 4.3. Values of surface roughness parameters obtained for AISI 1018 samples. ............. 59
Table 4.4. Values of parameters obtained for the model of AISI 1018 boride layer thickness.
.................................................................................................................................................. 65
Table 4.5. Analysis of variance of the effect of boronizing time and temperature on the boride
layer thickness of AISI 1018. ................................................................................................... 65
Table 4.6. Values of parameters in the model for boride layer hardness of AISI 1018. .......... 66
Table 4.7. Analysis of variance on the effect of boronizing time and temperature on the boride
layer hardness for AISI 1018. .................................................................................................. 67
Table 4.8. Values of fit parameters obtained for the model of AISI 316L boride layer thickness.
.................................................................................................................................................. 68

ix
Table 4.9. Analysis of variance on the effect of boronizing time and temperature on boride layer
thickness for AISI 316L. .......................................................................................................... 68
Table 4.10. Values of parameters in the model for boride layer hardness of AISI 316L steel. 69
Table 4.11. Analysis of variance on the effect of boronizing time and temperature on the boride
layer hardness for AISI 316L ................................................................................................... 69
Table 4.12. Calculated values of 𝑑𝐻𝑉𝑑𝑇 under different boronizing conditions. ................ 71
Table 4.13. Electrochemical corrosion parameters obtained for as-received and boronized AISI
1018 steel in different solutions. .............................................................................................. 83
Table 4.14. Electrochemical corrosion parameters obtained for as-received and boronized AISI
316L steel in different solutions at room temperature. ............................................................ 87
x
LIST OF FIGURES
Figure 2.1. Schematic diagram for solution mining (adapted from [15]). ................................. 7
Figure 2.2. Common stainless steels. ......................................................................................... 9
Figure 2.3. Fe-B binary phase diagram [26]. ........................................................................... 10
Figure 2.4. Schematic presentation of the mechanism of formation of boronized layer on the
steel surface[32]. ...................................................................................................................... 13
Figure 2.5. Schematic diagram to illustrate growth process of two boride layers under
conditions of diffusion control. [5] .......................................................................................... 15
Figure 2.6. Schematic representations of X-ray diffraction (XRD)[56]. ................................. 20
Figure 2.7. Schematic diagram of reciprocating wear test apparatus. ..................................... 23
Figure 3.1. (a) Cylindrical, (b) disc and (c) 90 elbow samples used in this study. ................ 26
Figure 3.2. Schematic diagram of boronizing treatment setup. ............................................... 28
Figure 3.3. A typical AISI 1018 90 elbow sample covered by stainless steel foil. ................ 29
Figure 3.4. Photograph of NANOVEA PS 50 profilometer used in this research................... 30
Figure 3.5. Photograph of the inverted optical microscope used in this study. ....................... 31
Figure 3.6. JEOL JSM 5900LV scanning electron microscope............................................... 32
Figure 3.7. Rigaku Ultima IV X-Ray diffractometer. .............................................................. 33
Figure 3.8. Mitutoyo microhardness testing machine. ............................................................. 34
Figure 3.9. UMT Multi-specimen test system with a wear test setup...................................... 37
Figure 3.10. A schematic diagram of the corrosion test setup for potentiodynamic polarization
scanning with sponge. .............................................................................................................. 38
Figure 3.11. The ParaCell™ Electrochemical Cell setup. ....................................................... 39
Figure 3.12. Erosion-corrosion loop setup for testing steel elbows. ........................................ 41
Figure 4.1. Picture of AISI 1018 samples: (a) as-received and (b) boronized at 900 ℃ for 4 h.
.................................................................................................................................................. 45
Figure 4. 2. Photographs AISI 316L sample before and after boronizing treatment (a) as-
received, (b) boronized AIS at 900 ℃ for 4 h, (c) boronized at 950 ℃ for 4 h and (d) boronized
at 950 ℃ for 8 h. ...................................................................................................................... 46

xi
Figure 4.3 Typical optical micrographs obtained for etched surfaces of untreated and boronized
samples of AISI 1018 steel: (a) as-received, (b) boronized at 850 ℃ for 4 h, (c) boronized at
850 ℃ for 6 h, (d) boronized at 850℃ for 8 h (e) boronized at 900 ℃ for 4 h, (f) boronized at
900 ℃ for 6 h, (g), boronized at 900℃ for 8 h, (h) boronized at 950 ℃ for 4 h, (i) boronized
at 950 ℃ for 6 h and (j) boronized at 950 ℃ for 8h. ............................................................... 49
Figure 4.4. Average thickness of surface boride layer formed on AISI 1018 steel under different
boronizing conditions............................................................................................................... 50
Figure 4.5 Typical optical micrographs obtained for etched surfaces of untreated and boronized
samples of AISI 316L steel: (a) as-received, (b) boronized at 850 ℃ for 4 h, (c) boronized at
850 ℃ for 6 h, (d) boronized at 850℃ for 8 h (e) boronized at 900 ℃ for 4 h, (f) boronized at
900 ℃ for 6 h, (g), boronized at 900℃ for 8 h, (h) boronized at 950 ℃ for 4 h, (i) boronized
at 950 ℃ for 6 h and (j) boronized at 950 ℃ for 8h. ............................................................... 52
Figure 4.6. Average boride layer thickness obtained for AISI 316L steel under different
boronizing conditions............................................................................................................... 53
Figure 4.7. Optical micrographs showing boronized layer at the internal surface of AISI 1018
elbow (a) middle part (b) ending part. ..................................................................................... 53
Figure 4.8. Average boride layer thickness obtained for AISI 1018 elbow and cylindrical steel
specimens. ................................................................................................................................ 54
Figure 4.9. Vickers hardness of as-received and boronized AISI 1018 steel. .......................... 55
Figure 4.10. Hardness obtained for as-received and boronized specimens of AISI 316L steel.
.................................................................................................................................................. 56
Figure 4.11. Hardness obtained for as-received, normalized and boronized AISI 1018 elbows.
.................................................................................................................................................. 57
Figure 4.12. Surface roughness of (a) as-received AISI 1018 steel polished with colloidal
diamond of 1 μm (b) AISI 1018 steel boronized at 900 °C for 4 h polished with colloidal
diamond of 1 μm (c) as-received AISI 1018 steel polished with 1200 grit paper (d) AISI 1018
steel boronized at 900 °C for 4 h polished with 1200 grit paper.............................................. 58
Figure 4.13. XRD pattern obtained for as-received AISI 1018. .............................................. 60

xii
Figure 4.14. XRD pattern obtained for AISI 1018 boronized sample (850 ℃, 4h). ............... 61
Figure 4.15. XRD pattern obtained for AISI 1018 boronized sample (850 ℃, 8h). ............... 61
Figure 4.16. XRD pattern obtained for AISI 1018 boronized sample (950 ℃, 4h). ............... 62
Figure 4.17. XRD pattern obtained for as-received AISI 316 steel. ........................................ 63
Figure 4.18. XRD patterns obtained for samples of AISI 316 steel boronized under different
condition. ................................................................................................................................. 63
Figure 4.19. Coefficients of friction obtained for as-received and boronized samples of AISI
1018 steel. ................................................................................................................................ 73
Figure 4.20. Wear rates obtained for as-received and boronized samples of AISI 1018 steel
under different test loads. ......................................................................................................... 74
Figure 4.21. Surface topography of the wear trace on (a) as-received and (b) boronized AISI
1018. Test load = 10 N. ............................................................................................................ 74
Figure 4.22. SEM micrographs obtained for worn surfaces of (a) as-received AISI 1018, (b)
boronized AISI 1018, (c) enlarged view of (a), and (d) enlarged view of (b). All tests were
performed at room temperature using a 10 N load. ................................................................. 75
Figure 4.23. SEM micrographs obtained for worn surfaces of (a) as-received AISI 1018, (b)
boronized AISI 1018, (c) enlarged view of (a), and (d) enlarged view of (b). All tests were
performed at room temperature using a 30 N load. ................................................................. 76
Figure 4.24. Coefficients of friction obtained for as-received and boronized samples of AISI
316L steel. ................................................................................................................................ 77
Figure 4.25. Wear rates obtained for as-received and boronized samples of AISI 316L steel
using different test loads. ......................................................................................................... 78
Figure 4.26. Surface topography of the wear trace created on (a) as-received and (b) boronized
AISI 316L steel. Test load = 10 N............................................................................................ 78
Figure 4.27. SEM micrographs obtained for worn surfaces of (a) as-received AISI 316L, (b)
boronized AISI 316L, (c) enlarged view of (a), and (d) enlarged view of (b). All tests were
performed at room temperature using a 10 N load. ................................................................. 79
Figure 4.28. SEM micrographs obtained for worn surfaces of (a) as-received AISI 316L, (b)

xiii
boronized AISI 316L, (c) enlarged view of (a), and (d) enlarged view of (b). All tests were
performed at room temperature using a 30 N load. ................................................................. 80
Figure 4.29. Potentiodynamic polarization plots obtained for as-received and boronized
samples of AISI 1018 steel in saturated KCl solution at room temperature. ........................... 81
Figure 4.30. Potentiodynamic polarization plots obtained for as-received and boronized
samples of AISI 1018 steel in saturated raw potash solution at room temperature. ................ 82
Figure 4.31. Corrosion rates obtained for as-received and boronized AISI 1018 samples in
different solutions at room temperature. .................................................................................. 83
Figure 4.32. SEM images obtained for as-received and boronized samples of AISI 1018 steel
before and after testing in saturated raw potash solution. (a) as-received AISI 1018 before
testing, (b) as-received AISI 1018 after testing, (c) boronized AISI 1018 before testing and (d)
boronized AISI 1018 after testing. ........................................................................................... 84
Figure 4.33. Potentiodynamic polarization plots obtained for as-received and boronized
samples of AISI 316L steel in saturated KCl solution. ............................................................ 85
Figure 4.34. Potentiodynamic polarization plots obtained for as-received and boronized
samples of AISI 316L steel in saturated raw potash solution. ................................................. 85
Figure 4.35. Corrosion rates obtained for as-received and boronized AISI 316L samples in
different solutions at room temperature. .................................................................................. 87
Figure 4.36. SEM images obtained for as-received and boronized samples of AISI 316L steel
before and after potentiodynamic polarization in saturated raw potash solution. (a) as-received
AISI 316L before testing, (b) as-received AISI 316L after testing, (c) boronized AISI 316L
before testing and (d) boronized AISI 316L after testing. ....................................................... 88
Figure 4.37. Variation of erosion-corrosion rate of as-received and boronized AISI 1018 elbows
with flow velocity and solid concentration. ............................................................................. 89
Figure 4.38. Variation of pure erosion rate of as-received and boronized AISI 1018 elbows with
flow velocity and solid concentration. ..................................................................................... 90
Figure 4.39. SEM micrographs obtained from the middle region of as-received and boronized
AISI 1018 steel elbows subjected to erosion-corrosion in potash-sand particle slurry flowing at
xiv
2.5 m/s. (a) 10 wt.% sand loading, as-received, (b) 50 wt.% sand loading, as-received, (c) 10
wt.% sand loading, boronized, and (d) 50 wt.% sand loading, boronized. .............................. 92
Figure 4.40. SEM micrographs obtained from the middle region of as-received and boronized
AISI 1018 steel elbows subjected to erosion-corrosion in potash-sand particle slurry flowing at
4.0 m/s. (a) 10 wt.% sand loading, as-received, (b) 50 wt.% sand loading, as-received, (c) 10
wt.% sand loading, boronized, and (d) 50 wt.% sand loading, boronized. .............................. 93
Figure 4.41. SEM micrographs obtained from the middle regions of as-received and boronized
AISI 1018 steel elbows subjected to pure erosion in a slurry containing 10 wt.% sand
particles.(a) 2.5 m/s (as-received), (b) 4 m/s (as-received), (c) 2.5 m/s (boronized), and (d) 4
m/s (boronized). ....................................................................................................................... 94

xv
NOMENCLATURE
AISI American Iron and Steel Institute
CR Corrosion rate (mm/year)
Ecorr Corrosion potential (V)
EDS Energy Dispersive X-ray Spectroscopy
EW Equivalent weight (g/mol)
HV Vicker’s hardness
HV1 Vicker’s hardness measured with a load of 1 kg
icorr Corrosion current density (A/cm2)
OCP Open circuit potential (V)
Rp Polarization resistance (Ώ)
SBF Simulated Body Fluid Solution
SCE The saturated calomel electrode
SCFH Standard cubic feet per hour
SEM Scanning Electron Microscopy
SSSC Saskatchewan Structural Science Center
XRD X-ray Diffraction
1
CHAPTER 1
INTRODUCTION
1.1 Background
Plain carbon and low alloy steels are versatile in their application and are widely used due to
their good mechanical properties, availability and relatively low cost. However, when used in
corrosive and wear environments such as those in potash and other mineral processing
industries, these steels suffer extensive degradation which can lead to equipment failure, and
product leakage. Surface modification treatment is an important way to improve wear,
oxidation and corrosion resistance of plain carbon and alloyed steels. Commonly used surface
modification treatments include hard facing, plating, thermal spraying, chemical vapor
deposition (CVD), physical vapor decomposition (PVD), carburizing, boronizing and nitriding.
Boronizing is a thermochemical surface treatment in which boron (B) atoms diffuse into a metal
substrate and form a very hard boride surface layer. It has proven to be a very effective surface
hardening process in industrial practice for several years [1]. Metals suitable for boronizing
treatment include, carbon steels, cast irons, low alloy steels, high alloy steels, tool steels,
stainless steels, cobalt alloys and nickel alloys. Two boride phases are formed when plain
carbon steels are boronized, namely: Fe2B with 8.8 wt% B and FeB with 16.1 wt% B [2]. The
formation of saw tooth-like Fe2B is most desired in industrial applications because it is less
brittle than FeB [3] and allows for sequent heat treatment of the substrate steel without altering
its properties. When alloy steels are boronized, some of the alloying elements such as
chromium (Cr) and nickel (Ni) can form different borides with boron [4]. The amount of boride
phases that form during boronizing treatment of steels depends on process parameters such as
temperature, chemical composition of the steel and boronizing compound, boronizing method,
and exposure time at the treatment temperature [5][6]. Compared with plating or coating,

2
boronizing has two unique advantages: (i) there are no problems associated with bonding
failure or surface layer delamination, and (ii) there is no significant change in the size of the
workpiece. Besides, it has additional advantages of high wear resistance and high-temperature
stability.
Although several studies have been conducted on dry/lubricated wear and electrochemical
corrosion of boronized plain carbon, low alloy and stainless steels [7][8], there is dearth of
information on the erosion-corrosion behavior of boronized carbon steel elbows in potash
slurry environment. Erosion-corrosion is a major factor in the failure of pipelines in oil, gas,
and mineral processing industries [9]. Furthermore, there is little information on the corrosion
behavior of boronized carbon and stainless steels in saturated potash brine.
1.2 Objectives
The main goal of this study was to improve the dry wear, corrosion and erosion-corrosion
resistance of AISI 1018 low carbon steel and AISI 316L austenitic stainless steel. To realize
this goal, the following specific objectives were pursued:
1. Determine the effect of boronizing treatment temperature and time on the thickness and
hardness of the boride layer on AISI 1018 and AISI 316L steels.
2. Identify the chemical composition of boride layer and surface morphology of boronized
samples and select the optimal process parameters for the best performance of boronizing.
3. Determine the effect of boronizing treatment on the wear, corrosion and erosion-corrosion
resistance of AISI 1018 and AISI 316L steels.
In order to conduct the above study, a facility was designed and constructed for boronizing
plain carbon, low alloy and stainless steels.
3
1.3 Contributions
There are two main contributions of my M.Sc. research. Mathematical models were developed
to predict the thickness of boride layer and surface hardness of boronized AISI 1018 and AISI
316L steels. With these models, it was possible to select the optimal boronizing parameters to
achieve the desired boride thickness and hardness. It was demonstrated in this study that case-
boronizing process can be used to increase the hardness of the internal surface of AISI 1018
low carbon steel elbows with a view to improving their resistance to erosion-corrosion in
potash slurry environment.
1.4 Thesis Organization
Chapter 1 covers motivation and objectives of the present research work and the organization
of this thesis. Chapter 2 contains a comprehensive review of boronizing heat treatment. The
chemical nature of the obtainable boride layers, their properties and practical application are
discussed. In Chapter 3, the experimental materials and techniques used in this research are
presented. In Chapter 4 results obtained from experiments carried out in Chapter 3 are
presented and discussed. Chapter 5 contains the conclusions drawn from analyses of
experimental results and suggestions for future work.
4
CHAPTER 2
LITERATURE REVIEW
The literature review chapter begins by explaining the practical problem faced in application
of potash related industry. Next, the different surface modification methods used in industry
and lab are described. Then, the concept and processing of boronizing is introduced. Finally,
this chapter ends with different characterization techniques used for polymer reinforced
composites for electronic packaging applications.
2.1 Background
The materials used in practical application especially working with oil, mine, potash these
kinds of high corrosive substrates, always suffer from the attack of corrosion, wear and erosion-
corrosion.
2.1.1 Corrosion
Corrosion is a natural electrochemical process during which a metal reacts with its environment
to return to its natural lowest energy state. Thus, for example, iron has a natural tendency to
combine with other substances like water or oxygen to form rust. Rust consists of a hydrated
iron oxide, similar in chemical composition to the original iron ore.
Corrosion occurs at a rate determined by the equilibrium between electrochemical anodic and
cathodic reactions. The anodic reaction releases ions into to electrolyte and the anode (always
metal) is oxidized. The cathodic reaction absorbs electrons released in the anodic reaction in a
reduction reaction which depends on the environment. When these two reactions are in
equilibrium, the flow of electrons from each reaction is balanced and no net electron flow
occurs, the corrosion rate is determined.
5
There are different forms of corrosion: uniform corrosion, galvanic corrosion, crevice corrosion,
pitting corrosion, stress corrosion cracking, hydrogen damage, intergranular corrosion,
dealloying and erosion-corrosion. Uniform attack is the most common form of corrosion. It
refers the corrosion evenly distributed on the surface or big areas of the materials. Galvanic
corrosion is the corrosion that happens between two connected metals with different corrosion
potential exposed to corrosive environment or immersed into corrosive solution. Crevice
corrosion is an intense localized corrosion happened in crevice or other shielded areas on
materials in corrosive environment. Pitting corrosion is an extremely localized form of
corrosion and results in holes on the surface of materials with limited weight lost and is hard
to detect. Stress corrosion cracking refers to cracking caused by the simultaneous presence of
tensile stress especially the residual stress from welding, and a specific corrosive medium[10].
Hydrogen damage is creation of internal defects like blistering, shatter cracks and fakes or fish-
eyes to increase porosity of materials. Intergranular corrosion is the localized attack at and
adjacent to grain boundaries with relatively little corrosion of the whole grain. Dealloying, also
termed selective leaching, is the removal of one element from a solid alloy by the corrosion
attack, like the zinc removed from brass. Erosion corrosion is an accelerated material
degradation due to the combined action of erosion and corrosion. It occurs when where motion
of the corrosive fluid occurs.
2.1.2 Friction and wear resistance
Wear is one of the major causes of failure of structural components, especially in moving parts.
Friction and wear are not intrinsic material properties but are characteristics of the engineering
system (tribo-system). Friction is the resistance to motion and arises from interactions of solids
at the contact surface [11]. Friction and wear are serious causes of energy dissipation and
material degradation. Economic losses because of wear can generally be reduced by optimizing
plant organization and proper design, production, mounting, and servicing of appliances[12].
There are different forms of wear. These include: adhesive wear, abrasive wear, surface fatigue,

6
fretting wear, erosive wear and corrosion and oxidation wear. Abrasive wear, most important
type of wear for the industrial machine parts, is important as it may cause rapid failure in the
system.
2.1.3 Erosion-corrosion
Erosion corrosion is an accelerated material degradation due to the combined action of erosion
and corrosion. It occurs when where motion of the corrosive fluid occurs. Erosion corrosion
consists of two parts, namely: (i) mechanical erosion of the material or protective (or passive)
oxide layer on its surface and (ii) the enhanced corrosion of the material if the corrosion rate
of the material depends on the thickness of the oxide layer.
Erosion-corrosion is usually observed in tanks, tubes, where fluids flow is a common
occurrence. Depending upon the flow rate of the corrosive fluid, the intensity of corrosion can
be high or low. The transportation of petroleum, gas or potash products is often accompanied
by solid particles or gas bubbles promote erosion-corrosion of pipelines. During the erosion-
corrosion process, the corrosive products formed on the pipeline surface in the form of oxide
film is removed by the mechanical action of the erosive particles or gas bubbles, especially
where there is turbulence in fluid flow. Removal of the oxide film particles by the mechanical
action subjects accelerates the rate of material removal due to corrosion [13]. The economic
loss associated with erosion-corrosion problems can be very high due to erosion-corrosion
failure and attendant high maintenance costs [9].
2.1.4 Potash and mineral industry
Potash is a naturally occurring mineral deposit that was formed millions of years ago by the
evaporation of seas. The majority of the world’s potash supply is found in Canada, with other
deposits also found in Belarus, Brazil, Chile, China, Germany, Israel, Jordan, Laos, Russia,
Spain, United Kingdom and the United States. Saskatchewan has the world’s largest reserves
of potash. [14] Potash is mostly used as fertilizer after proper treatment.

7
There are two types of potash mining methods: conventional mining and solution mining.
Conventional mining is developed in areas where the potash formation is close to 1000 m below
the surface. A large shaft is used to transport employees underground, lower mining equipment
and also transport large pieces of potash raw ores to the mill. Solution mining is applied in
areas where the potash is very deep in the ground (1500 m to 2400 m) resulting in the high cost
and high risk both for safety of employees and mining equipment by conventional mining [15].
In solution mining, water is injected into the potash formation to dissolve the potash and the
potash brine so generated is pumped up to the surface for further processing which is shown in
Figure 2.1. To remove the potash from solution, both mechanical and pond crystallization
methods can be used. Since the desired potash is dissolved into solution and brought to the
ground, there is no need for the industry to send employees underground. However, in solution
mining, the heated water is very corrosive for the pipe after dissolving potash with rocks and
sands.
Figure 2.1. Schematic diagram for solution mining (adapted from [15]).

8
2.2 Materials
2.2.1 Low carbon steel
Low carbon steel or mild steel is the most commonly used steel grade in engineering structures
due to their low price and their acceptable properties for many application requirements. This
type of steel contains at most 0.3 wt.% carbon. It contains alloying elements such as manganese
to enhance mechanical strength [16]. Low carbon steels are desirable for construction due to
their good weldability and machinability. They also have good malleability and can easily be
formed by mechanical processes such as rolling, forging, drawing, etc. One of the major
drawbacks to the use of low carbon steels in many applications is their high susceptibility to
corrosion damage. They exhibit poor resistance to erosion-corrosion damage.
2.2.2 Stainless steel
Stainless steel is an iron-based alloy that contains a minimum of about 12 wt.% Cr, which is
added to impart corrosion resistance by the formation of protective chromium oxide film on
the surface [17]. The formation of the adherent, protective and impervious chromium oxide
layer accounts for the high corrosion resistance of stainless steels in many environments [18].
Other alloying additions to stainless steels include nickel, manganese, molybdenum, etc. The
stable phase in a stainless steel and its properties (corrosion and mechanical) depends on the
content of the alloy addition. Fig. 2.2 shows common grades of stainless steels. As a result of
their combination of high resistance to corrosion and relatively good strength, stainless steels
are widely used in the chemical, petrochemical and nuclear power plants [19]. Stainless steels
are also used to make biomedical implants and prostheses [20]. However, some stainless steels
have poor resistance to wear or tribological damage, which can limit their application in some
engineering systems [21].

9
Figure 2.2. Common stainless steels.
2.3 Boronizing
2.3.1 Introduction of boronizing
Boronizing or boriding is one of the thermochemical processes that has been developed to
improve the wear resistance of steels and has found significant application in mineral and
chemical processing plants. This process can be applied to wide range of materials, like ferrous,
non-ferrous, cermet et al. However, steels containing aluminum should not be boronized, e.g.
nitriding steel (34CrA1Ni7 - material no.1.8550) due to the high porosity of the boride layer.
Also, steels with Si content about 1 wt.% are an inappropriate substrate for thick boride zones.
As both these metals will be pushed back by the boron diffusing into the surface to settle below
the Fe2B phase in the diffusion zone producing ferrite there. The hard boride zone will be
anchored to a zone even softer than the substrate and if a high load is applied on this kind of
structure, the brittle hard boride layer will be pressed into the very soft intermediate causing
the failure of workpieces [22]. One of the remarkable advantages of boronizing is filling out
10
the gap between the conventional method and advanced technology can only be achieved in
lab. It offers a low-cost procedure for producing high-quality products with enhanced wear
resistance. The operational cost of boronizing is lower than that of other thermo-chemical
treatments such as carburizing, nitriding, and nitrocarburizing[23].
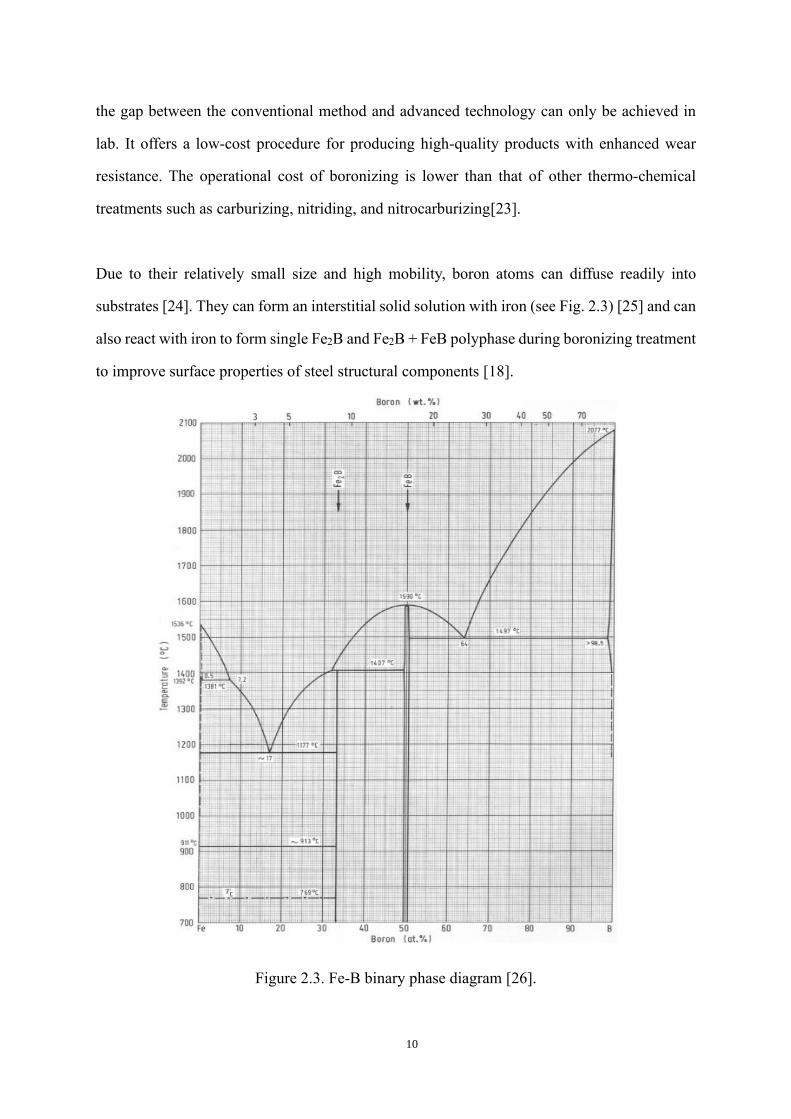
Due to their relatively small size and high mobility, boron atoms can diffuse readily into
substrates [24]. They can form an interstitial solid solution with iron (see Fig. 2.3) [25] and can
also react with iron to form single Fe2B and Fe2B + FeB polyphase during boronizing treatment
to improve surface properties of steel structural components [18].
Figure 2.3. Fe-B binary phase diagram [26].

11
The boron-rich FeB phase has an orthorhombic crystal structure while monophasic Fe2B has a
body central tetragonal structure with 8.83 wt.% boron. FeB is more brittle compared to Fe2B
phase, and the fracture toughness of the Fe2B phase is approximately four times greater than
of the FeB phase[24][27]. Therefore, Fe2B phase is more desirable than the FeB phase. In
boronized surface coating of steels. Crack formation is generally observed at the FeB/Fe2B
interface due to the significant difference in their coefficient of thermal expansion (αFeB = 23 x
10-6/℃ and αFe2B = 7.85 x 10⁻⁶/℃). Table 2.1 shows the differences in properties of FeB phase
and Fe2B phase.
Table 2.1. Properties of FeB and Fe2B [28].
Property FeB Fe2B
Microhardness 1900 – 2100 HV 1400 - 1800 HV
Modulus of elasticity 590 GPa 285 - 295 GPa
Density 6.75 g/cm3 7.43 g/cm3
Composition Containing 16.23 wt% B Containing 8.83 wt% B
Crystallography details
Orthorhombic crystal
structure with 4 iron and 4
boron atoms per unit cell
Body- centered tetragonal
structure with 8 iron and 4
boron atoms per unit cell
Lattice parameters a = 4.053 Å, b = 5.495 Å
and c = 2.946 Å a = 5.078 Å and c = 4.249 Å
Coefficient of thermal
expansion (α) 23 x 10-6 / ℃ 7.85 x 10- 6 /℃
Melting point 1550 ℃ 1390℃

12
2.3.2 Boronizing techniques
Boronizing can be done using several different techniques, which include pack boronizing,
molten salt boronizing, gas boronizing, paste boronizing, and plasma boronizing [7][29][30].
Each of these boronizing methods has its own drawbacks. In gaseous boronizing for example,
boron sources such as BCl3, BBr3 and BF3 with H2 or Ar gases are used. It requires very fine
control of the moisture in the gaseous atmosphere and the boron source gas is costly, poisonous,
and explosive [31]. Plasma boronizing also uses gaseous boron sources and suffers the same
drawbacks as gaseous boronizing processes. The formation of pores in the boride layer (high
porosity) is another problem associated with plasma boronizing process [32]. In liquid
boronizing, the sample is dipped into a melted salt bath which consists of borax, boric acid and
ferro silica and held at that temperature for the required amount of time. The formation of a
firmly adherent salt layer on the surface occurs, which is difficult to remove, thereby limiting
its application in the industry[33]. In solid boronizing, the sample is placed in a leak proof box
with enough powder mixture and at high temperatures for a relatively long duration. Solid
boronizing, especially paste and pack boronizing using Ekabor series powder, has the
advantages of low cost, high safety, easy to clean, and easy to operate.
2.3.3 Growth of boride layers
Boronizing is a thermo-chemical treatment that it involves high-temperature chemical reactions.
On the condition that boron diffuses and grows parabolically, the variation of boride layer
thickness with time can be described using equation (2.1) [34].
𝑥2 = 𝐾𝑡 . . . . . . . . . (2.1)
where x is the depth of the boride layer (mm), t is the boriding time (s), and K is the growth
rate constant (mm2/s) that depends on the diffusing specie (in this case boron atom) and the
diffusion coefficient (mm2/s). The relationship between rate constant K and temperature can be
13
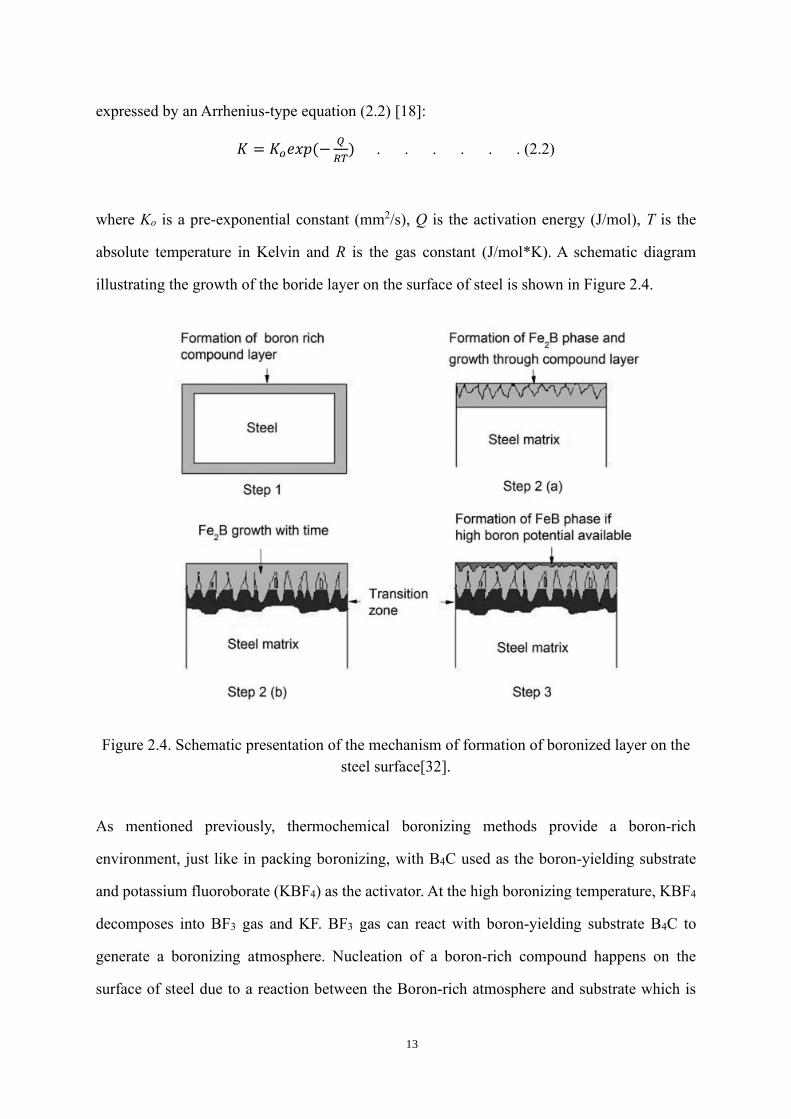
expressed by an Arrhenius-type equation (2.2) [18]:
𝐾 = 𝐾𝑜𝑒𝑥𝑝(−𝑄
𝑅𝑇) . . . . . . (2.2)
where Ko is a pre-exponential constant (mm2/s), Q is the activation energy (J/mol), T is the
absolute temperature in Kelvin and R is the gas constant (J/mol*K). A schematic diagram
illustrating the growth of the boride layer on the surface of steel is shown in Figure 2.4.
Figure 2.4. Schematic presentation of the mechanism of formation of boronized layer on the
steel surface[32].
As mentioned previously, thermochemical boronizing methods provide a boron-rich
environment, just like in packing boronizing, with B4C used as the boron-yielding substrate
and potassium fluoroborate (KBF4) as the activator. At the high boronizing temperature, KBF4
decomposes into BF3 gas and KF. BF3 gas can react with boron-yielding substrate B4C to
generate a boronizing atmosphere. Nucleation of a boron-rich compound happens on the
surface of steel due to a reaction between the Boron-rich atmosphere and substrate which is

14
also a function of boronizing temperature and time. The chemical composition is also
determined by the concentration of free boron in this boron-rich compound layer. This step is
similar to the formation of ‘‘transition zone’’. The nucleation of the Fe2B phase occurs near the
surface region of boron-rich compound layer and then the compound layer is used for the
growth of Fe2B layer.
Fe2B phase forms before FeB phase. Once the boron potential reaches around 9 wt.% on the
surface of the substrate, the formation and growth of the Fe2B layer starts[33]. The growth of
the Fe2B layer is perpendicular to the steel surface and follows the diffusion axis. [32][35] And
the growth of boride layer depends on the availability of boron potential, temperature and
duration. When a large amount of Fe2B phase covers the steel surface, they contact with each
other and cause the generation of high-stress areas, which also promote the boride layer to grow
inside the steel by producing columnar morphology.
Other alloying elements in the substrate always have poor solubility in iron boride layer, so
that they would be pushed back from the steel surface back into the steel. Due to this reason,
the transition zone between surface boride layer and substrate matrix is usually generated.
With increasing boronizing time if the boron potential remains at around 16 wt.%, the
nucleation of FeB phase occurs near the outer surface region of Fe2B. The FeB phase grows at
the same time as the Fe2B phase. The process can be described with equations (2.3) to (2.5)
[33]:
KBF4 → KF(s)+BF3(g) . . . . .. . . (2.3)
2 Fe+ 1
13 BF3(g)+
3
13 B4C (s) → Fe2B(s)+
3
52 CF4(g)+
9
52 C(s) . . . (2.4)
B4C (s)+ Fe2B(s) → 4B[Fe2B]+C(s) . . . . . . (2.5)
Under diffusion control, FeB and Fe2B phases thicken at the interface 2 (see Figure 2.5)
according to the following reactions:

15
Bdiffuse+ Fe2B →2 FeB . . . . . . . (2.6)
Fediffuse+FeB →Fe2B . . . . . . . (2.7)
During the diffusional growth, diffusion across the layer bulks is the rate-determining step [5].
The interface is undersaturated with boron atoms and the reactions are very rapid, their rates
exceed the diffusion rate of boron atoms across Fe2B layer and reacting with Fe. Also, because
the FeB layer is compact and will not allow BF3 gas to penetrate. As a result, no more boron
atoms can diffuse to interface 3 to form iron boride with the substrate; almost all of the boron
atoms are consumed at interface 2.
Figure 2.5. Schematic diagram to illustrate growth process of two boride layers under
conditions of diffusion control. [5]
2.3.4 Effect of alloying elements
Besides boronizing temperature and time, alloying elements in the substrate can also have a
significant effect on the growth and the chemical composition of the boride layers [36].
Generally, the presence of alloying elements inhibits the diffusivity of boron atoms resulting in
a thinner and biphasic boride layer. Carbon, silicon and aluminum are not soluble in the iron
boride layer. They are pushed from the surface by diffusing boron and displaced ahead of the
boride layer into the substrate. This process results in the formation of iron-silico-borides
between the Fe2B layer and matrix [32][37][34]. High amount of aluminum is also reported to

16
make the boride layer-matrix interface smoother [38]. In addition, vanadium is also reported to
have the ability to reduce the active boron diffusivity by entering the iron boride lattice and
lead to a substantial decrease in the boride layer thickness [6]. The presence of chromium
reduces boride layer thickness and flattens out the characteristic tooth-shaped morphology
[34][39][6]. The good solubility of chromium in the iron boride phase leads to the replacement
from iron to chromium and forms (Fe, Cr)B and (Fe, Cr)2B on the surface. The similar atomic
radius of Cr (0.166 nm) compared with that of iron (0.155 nm) is also one of the reasons why
Cr can dissolve in the Fe sub-lattice of borides [35]. And this observation was confirmed by
energy dispersive X-ray spectroscopy (EDS) analysis in another study [20]. Also, Cr also
promotes the formation of FeB phase on the outer surface and leads to an increase in the
microhardness of the boride layer [35][40][37]. Nickel can also reduce boride layer thickness
and flatten out the tooth-shaped morphology by producing a high surface tension at the
bride/substrate interface [19][38]. Nickel is found to concentrate beneath the boride coating,
enter the Fe2B phase and finally precipitate out of the boride layer with the form of Ni3B and
other kinds of nickel boride[41]. In fact, the atomic radius of Ni is slightly larger than that of
Fe. As such, it is then expected that Ni will dissolve in the Fe sublattice of the borides and form
solid solutions such as (Fe, Ni)B and (Fe, Ni)2B [42]. As for manganese, the preferential entry
of manganese into the boride layer by is by substituting for iron in the Fe2B and FeB was
confirmed [41]. But compared with the effect of chromium, manganese only has marginal
influence [43]. It was reported in a previous study that increasing Mn content prevented crack
formation at the interface of FeB and Fe2B phases, which was attributed to the similarities of
Fe and Mn both in atomic and crystal structure[44].

17
2.3.5 Properties of Boride Layers
2.3.5.1 Hardness of boride layers
One notable advantage of boronizing is that it provides a thick, compact layer with very high
surface hardness. Mohammed [45] boronized AISI 1018 with three different chemical
compositions of the boronizing media at 850 ℃, and he reported significant improvement in
microhardness; the hardness increased from 151 HV for the as-received sample to 1800 HV
for boronized samples. Genel et al. studied the effect of boronizing using Ekabor1 powders on
the hardness of AISI W1 steel and observed the hardness of the boride layer formed on the
surface of the steel substrate to be higher than 1500 HV [25]. Gunes et al. applied plasma paste
boronizing (PPB) by using 100% borax paste to AISI 8620, 5100 and 440C steels. The lowest
hardness value (1730 HV0.05) was found for the boride layer that was deposited on 8620 steel
at 700 °C while the highest hardness value (1968 HV0.05) was recorded for the boride layer
on 440C steel boronized at 800 °C [31]. Pala et al. reported that the hardness of X210Cr12
increased to 1350 ± 180 HVN and 1520 ± 220 HVN after 5 h and 12 h boronizing treatments,
respectively [3]. Ozbek et al. boronized AISI 316L steel and obtained a hard boride layer on
the surface of the steel with a hardness value of over 1500 VHN [20].
2.3.5.2 Corrosion characteristics of boride layers
The corrosion behavior of boronized steel was studied by a number of investigators. Wang et
al. [46] investigated the corrosion behavior of boronized 65Mn (equivalent to AISI 1066 alloy
spring steel) in two acidic media; hydrochloric acid solution (10% mole fraction) and the weak
acidic medium consisting of fertilizer-containing soil. After 168 h exposure in the hydrochloric
acid solution, the weight loss of the boronized steel was determined to be 27.9% of the weight
loss of the lonnealing-status sample. The surface of the boronizing-status sample is only
sporadically distributed with small corrosion pits, while the surface of the lonnealing-status
sample is distributed with a large number of large corrosion pits with a depth of hundreds of
18
microns which indicated the effect of boride layer on increasing corrosion resistance. Mejía-
Caballero et al. [47] also compared the corrosion resistance of the boronized AISI 1018 and
AISI 304 steels with non-boronized ones in 1M HCl solution by polarization resistance and
EIS method. The boronized samples exhibited better corrosion resistance than the as-received
steels. This is the case for both varieties of steels investigated in the study. Mejía-Caballero et
al. [47] also stated that the pitting corrosion occurred in the untreated samples while both
pitting and crevice corrosion occurred in the boronized steel specimens. Tsipas et al. [48]
studied the corrosion behavior of AISI 1020 steel and concluded that boride layers on the
surface provided substantial corrosion protection of the steel in naphthenic acid corrosion, both
in liquid and in vapor phase. Lin et al. [49] investigated the effect of boronizing treatment on
P110 oil casing tube steel to study whether boronizing can be effective for corrosion and wear
protection in the oil industry. Based on the results of electrochemical potential measurements,
they concluded that boronizing treatment increased the corrosion resistance of P110 steel in
simulated oilfield water. However, the research conducted by Mejía-Caballero et al. [50]
reported that boronizing treatment resulted in a decrease in the corrosion resistance of AISI
316L in simulated body fluid solution (SBF) due to the porosity of the boride layer.
2.3.5.3 Friction and wear characteristics of boride layers
The wear behavior of boronized steel has been studied by a number of investigators. Basir et
al. [51] reported that boronizing treatment increases the wear resistance of 316 stainless steel
and increasing the boronizing temperature using the shot blasting process improves its wear
resistance greatly when tested using the pin-on-disc abrasion test. Cárdenas et al. [35] stated
that sliding wear resistance for the boronized AISI H13 and D2 steels was 13 times greater than
that of the unboronized steel. Besides, the mechanism of wear also changes; the wear
mechanism for unboronized samples was reported to be cracking and spalling while it was
plastic sliding wear for boronized samples for AISI H13 steel, and plastic deformation, cracking
and abrasion for D2 steel. Xu et al. [52] observed that the boride layer provides excellent wear

19
resistance and a lower coefficient of friction within the load range 50 - 130 N for a sliding
speed of 0.785 m/s in N80 tube steel due to high hardness and low welding tendency of boride
layers. Atik et al.[53] carburized and boronized SAE 1010, SAE 1040, D2 and AISI 304
stainless steel and observed that boronized steels exhibited higher hardness and better abrasive
wear resistance compared to carburized steel. However, they also reported that wear
performance of the boronized steels was not directly related to the thicknesses of the boride
layer and surface hardness.
2.3.5.4 Other properties of boride layers
Boride layers have been reported to improve oxidation resistance compared to the substrates.
Khenifer et al. [54] studied the effect of boronizing on the high-temperature oxidation
resistance of AISI 316L stainless steel. They reported that the oxidation kinetics of boronized
and untreated 316L stainless steel at high temperature (850-1000 °C) obeyed a parabolic law
and the improvement of hot oxidation resistance is obtained by forming a layer of oxides and
more compact (less porous) products on boronized surface. Suwattananont et al. [55] reported
that boronizing had a positive effect on high-temperature oxidation resistance of AISI 1018 due
to the formation of amorphous B2O3 on the boron coating, which inhibited the formation of
iron-oxide oxide and iron borates on the surface.
2.4 Structural Characterization of Boride Layers
In this section, different structural characterization methods for boride layers developed on the
surface of steels are presented and discussed.
2.4.1 X-ray diffraction (XRD)
XRD is a non-destructive analytical technique used for phase identification of a crystalline
material and can provide information about unit cell dimensions. The analyzed material is
20
usually in powder form. In the XRD equipment, high-energy electrons generated by a heated
filament accelerate towards the target and dislodge inner shell electrons of the targets. Then the
X-ray is obtained when high speed electrons collide with a metal target or undergo a change in
momentum. The generated X-ray is directed onto the sample surface and diffraction peaks are
generated when the geometry satisfies the Bragg’s Law. An X-ray detector is used to capture
the reflected X-ray signals and the diffraction patterns. The schematic of an X-ray diffraction
device is shown in Figure 2.6.
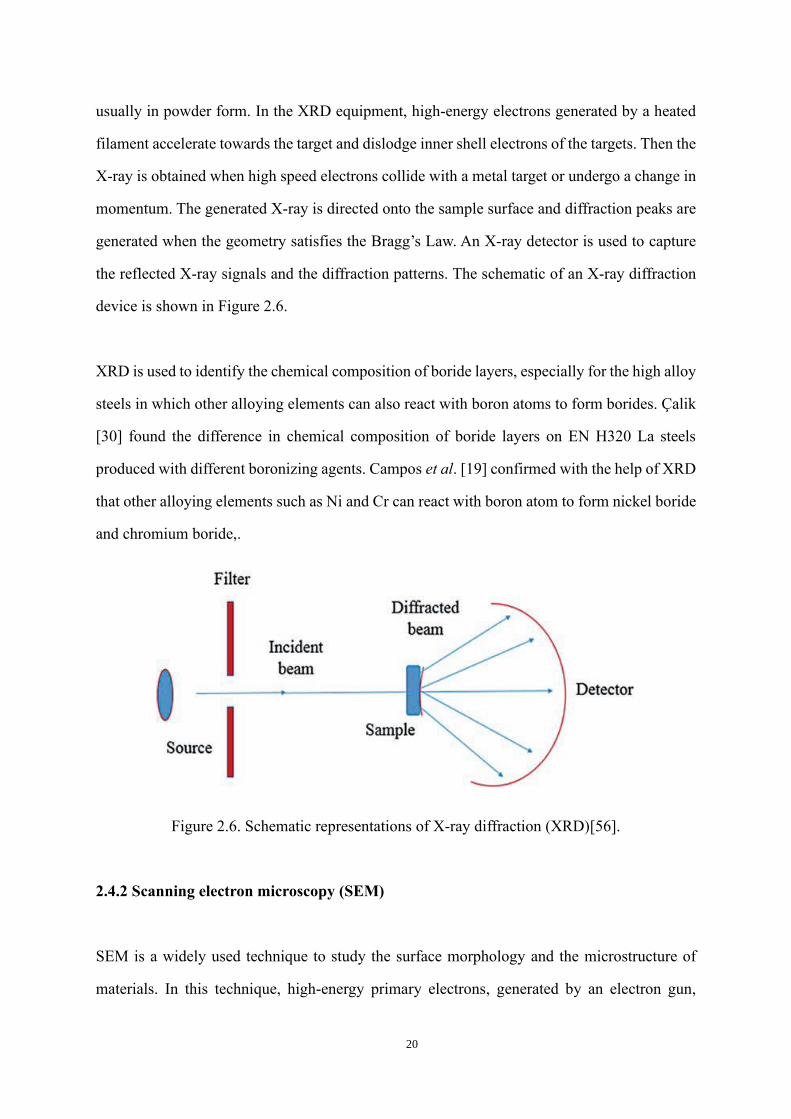
XRD is used to identify the chemical composition of boride layers, especially for the high alloy
steels in which other alloying elements can also react with boron atoms to form borides. Çalik
[30] found the difference in chemical composition of boride layers on EN H320 La steels
produced with different boronizing agents. Campos et al. [19] confirmed with the help of XRD
that other alloying elements such as Ni and Cr can react with boron atom to form nickel boride
and chromium boride,.
Figure 2.6. Schematic representations of X-ray diffraction (XRD)[56].
2.4.2 Scanning electron microscopy (SEM)
SEM is a widely used technique to study the surface morphology and the microstructure of
materials. In this technique, high-energy primary electrons, generated by an electron gun,

21
interact with the materials in a high vacuum environment. Different types of detectors can be
used to collect back-scattered electrons or secondary electrons to produce the image of the
surface of materials. SEM analysis has been used to trace wear caused by reciprocating wear
testing in order to understand the mechanism of wear in as-received materials and boronized
materials. [57][58][35][49]. It was used to investigate the exposed surface of materials after
corrosion testing to determine the mechanism of corrosion damage of materials with and
without boride surface coating [59][60][61]. With a higher resolution and a higher depth of
focus, compared to optical microscope, SEM can provide more detailed information about the
corrosion and wear mechanisms. For instance, Li et al. [57] analyzed the SEM images of worn
surface and cross-section for boronized and as-received steel samples. The authors observed
that the lamellar film is rare, there are many spalled pits filled with wear debris on the surface
at high load and the cracks on the friction surface initiate in the contact areas of friction pairs.
Cárdenas et al. [35] studied AISI H13 tool steel and obtained that the wear condition is
characterized by the presence of zones of partial failure and zones with complete degradation
of the boride layer and the as-received worn surface shows a much more serious wear damages
by analyzing the SEM images of worn surface. An et al. [61] used SEM to investigate the
corrosion region of boronized AISI 8620 samples and find that the surface of non-boronized
sample was covered by a rough, incompact corrosion product film while that of boronized
sample was still covered by boride layer after immersion in oil field water and H2S saturated
oil field water.
2.5 Corrosion and Wear Properties Determination
2.5.1 Potentiodynamic polarization
Potentiodynamic polarization is a commonly used electrochemical technique to evaluate
corrosion properties of materials. In a potentiodynamic experiment, the driving force (i.e., the
potential) for anodic or cathodic reactions (depending on the nature of the scan) is controlled,
and the net change in the reaction rate (i.e., current) is determined. The potentiostat measures

22
the current which must be applied to the system in order to achieve the desired increase in
driving force, known as the applied current. As a result, at the open circuit potential (potential
at which the total anodic current is equivalent to the total cathodic current) the measured
applied current will be zero.
In a potentiodynamic polarization experiment, a working electrode, a counter electrode, a
reference electrode and electrolyte are needed. The saturated calomel electrode (SCE) and the
silver-silver chloride reference electrode are commonly used as reference electrodes. The Tafel
slopes obtained from the extrapolation can be used with the polarization resistance to obtain
corrosion current density, corrosion potential, slope of anodic branch and slope of cathodic
branch and calculate the corrosion rate [62].
2.5.2 Friction and wear resistance
Friction is measured by the relative movement of surfaces in contact with each other when
under an applied load. When the relative movement happens between two surfaces, dynamic
friction is obtained. Friction behavior strongly depends on the condition of the test, such as the
normal force, pin tip radius, ambient temperature, relative humidity and presence of lubricating
agent [63].
The coefficient of friction is the ratio of the force hindering the relative movement between
two surfaces and the applied normal force. Wear is a measure of the deformation and volume
change of the materials in dynamic contact with another material. The degree of wear damage
can be characterized by wear rate. Wear rate is the rate of material removal or dimensional
change due to wear per unit distance or time of exposure parameter, for example, quantity
removed (mass, volume, thickness) in unit distance of sliding or unit time which can be
characterized using equation (2.8) [63].
Wear rate=wear volume
total distance of sliding . . . . . . . (2.8)
23
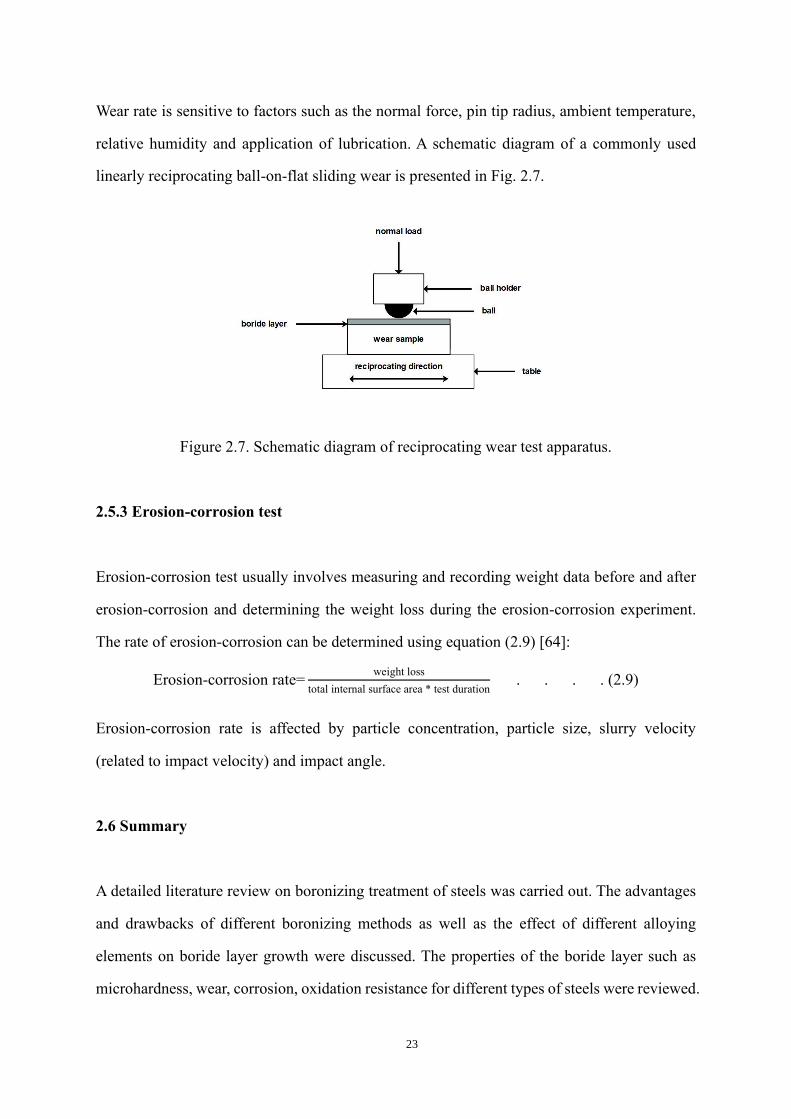
Wear rate is sensitive to factors such as the normal force, pin tip radius, ambient temperature,
relative humidity and application of lubrication. A schematic diagram of a commonly used
linearly reciprocating ball-on-flat sliding wear is presented in Fig. 2.7.
Figure 2.7. Schematic diagram of reciprocating wear test apparatus.
2.5.3 Erosion-corrosion test
Erosion-corrosion test usually involves measuring and recording weight data before and after
erosion-corrosion and determining the weight loss during the erosion-corrosion experiment.
The rate of erosion-corrosion can be determined using equation (2.9) [64]:
Erosion-corrosion rate=weight loss
total internal surface area * test duration . . . . (2.9)
Erosion-corrosion rate is affected by particle concentration, particle size, slurry velocity
(related to impact velocity) and impact angle.
2.6 Summary
A detailed literature review on boronizing treatment of steels was carried out. The advantages
and drawbacks of different boronizing methods as well as the effect of different alloying
elements on boride layer growth were discussed. The properties of the boride layer such as
microhardness, wear, corrosion, oxidation resistance for different types of steels were reviewed.

24
The reason for high brittleness and low resistance of boronized steels to spalling, especially for
high alloy steels, were clarified. Reducing the brittleness of boronized steels without
significantly reducing the surface hardness, wear and corrosion resistance is desirable. The
erosion-corrosion behavior of boronized steel must be investigated to determine the suitability
of boronizing treatment for application in the mineral processing industries where slurries
containing solid particles are forced to flow through pipes. Currently, not much work has been
done on boronizing steel for improved resistance to erosion-corrosion in potash industries.
Hence, an important aspect of the present research is to develop a uniform, monophasic boride
layer on AISI 1018 low carbon steel and AISI 316L stainless steel to get higher surface hardness,
better resistance of wear, corrosion and erosion-corrosion for application in potash processing
plants.

25
CHAPTER 3
MATERIALS AND EXPERIMENTAL METHODS
The materials and experimental procedures used/developed in this research work in order to
achieve the research objectives are described in this chapter.
3.1 Materials
The materials used for this study were AISI 1018 carbon steel and AISI 316L austenitic
stainless steel. The typical chemical compositions of AISI 1018 and AISI 316L steels are shown
in the Tables 3.1 and 3.2, respectively. Cylindrical specimens, measuring 9.5 mm in diameter
and 10 mm long, were cut from the as-received alloys for surface roughness measurement,
surface hardness measurement, corrosion tests and metallographic analysis (see Fig. 3.1(a)).
Discs measuring 31.75 mm in diameter and 5 mm thick were also cut from the as-received
steels for sliding wear tests (see Fig. 3.1(b)). AISI 1018 steel 90 elbows purchased from APEX
Distribution Inc. (Calgary, AB, Canada) were used for erosion-corrosion tests (Fig. 3.1c).
Table 3.1. Chemical composition of AISI 1018 steel (in wt.%).
Element Mn C S P Fe
Amount 0.60 – 0.90 0.15 – 0.20 0.05 (max) 0.04 (max) Bal.
Table 3.2. Chemical composition of AISI 316L steel (in wt.%).
Element C Mn Si P S Cr Mo Ni N Fe
Amount 0.03 2.00 0.75 0.045 0.03 16-18 2-3 10-14 0.10 Bal.
The Ekabor2 boronizing powder used for surface treatment of the investigated steels was

26
supplied by Avion Manufacturing Company Inc. (Brunswick, OH, US). The chemical
composition of the powder is provided Table 3.3. The slurry used for erosion-corrosion test
consisted of silica sand particles and untreated raw potash. The silica particles were obtained
from Brock White, Saskatoon, while the untreated raw potash was supplied by Nutrien™,
Saskatoon. The chemical compositions of silica sand particles and raw potash are provided
Tables 3.4 and 3.5, respectively.
Figure 3.1. (a) Cylindrical, (b) disc and (c) 90 elbow samples used in this study.
Table 3.3. Chemical composition of Ekabor2 boronizing powder (in wt.%).
Compound Potassium boron
fluoride, KBF4
Boron carbide,
B4C
Silicon carbide,
SiC
Amount 5 5 90

27
Table 3.4. Chemical composition of the silica sand particles used for erosion corrosion test.
Compound SiO2 Al2O3 Fe CaO MgO Na2O TiO2
Amount (wt.%) 93.2 –
93.6
3.60 –
4.60
0.30 –
0.35
0.25 –
0.65
0.08 –
0.15
0.75 –
0.85
0.1
max
Table 3.5. Chemical composition of the untreated raw potash used in the erosion corrosion test.
Compound Potassium chloride,
KCl
Sodium chloride,
NaCl Insolubles
Amount (wt.%) 95.6 3.2 1.2
3.2 Boronizing Treatment
Fig. 3.2 shows the setup that was designed and constructed for boronizing heat treatment of
samples. It consists of a box furnace, an argon gas cylinder and a flowmeter. The argon gas
cylinder is connected to a Thermo Scientific™ (Waltham, MA, US) BlueM box furnace
(BF51732C-1 1200 ℃) via the PG-1000 Series Acrylic flowmeter provided by Matheson Tri-
Gas, Inc. (Montgomeryville, PA, US) and tubing. The furnace provided the high temperature
for boronizing treatment, while the argon provided an inert atmosphere to prevent oxidation of
the test metal during boronizing. The argon flow rate during the initial purging of the furnace
was set at 10 standard cubic feet per hour (SCFH) and reduced to 3 SCFH during boronizing
heat treatment. The initial purge lasted for 20 min.
Before boronizing, the top and bottom surfaces specimens used for hardness and wear tests
were ground with silicon carbide papers (180 grit, 320 grit, 500 grit and 800 grit size) and fine
polished with colloidal diamond of 9 μm, 3 μm, and 1 μm, in that sequence. The surfaces were
subsequently cleaned in acetone using an ultrasonic cleaner and then dried using a hair dryer.
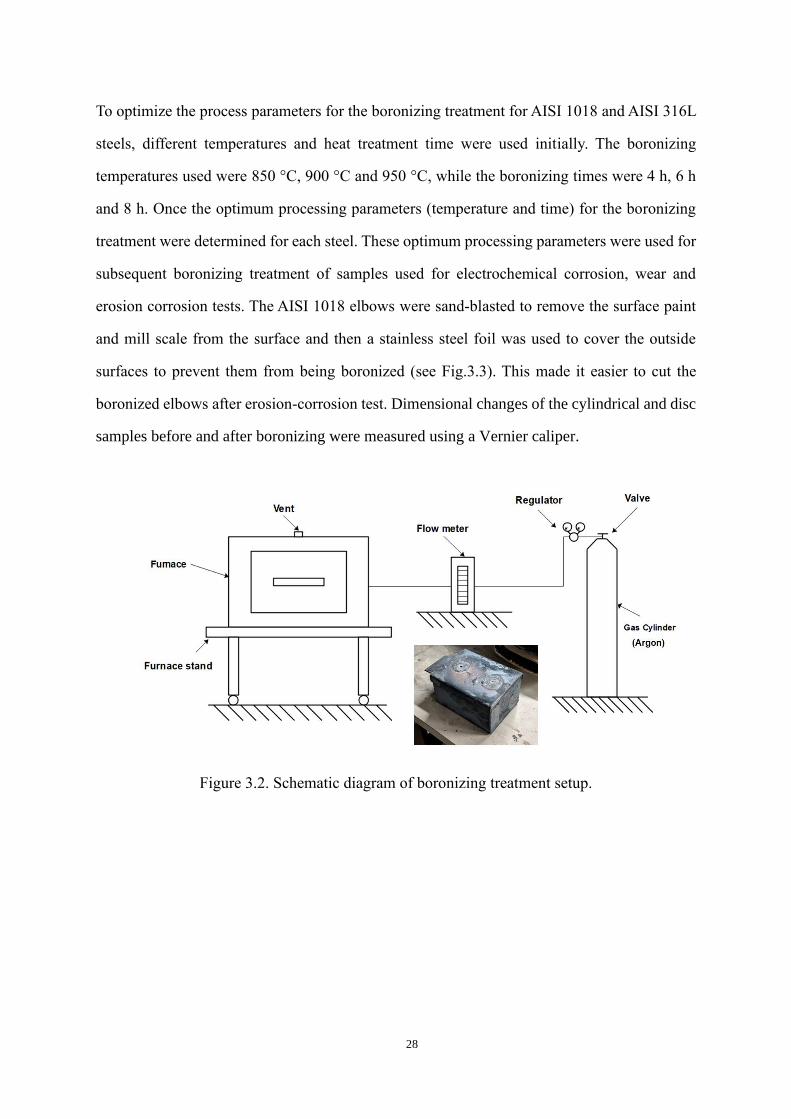
28
To optimize the process parameters for the boronizing treatment for AISI 1018 and AISI 316L
steels, different temperatures and heat treatment time were used initially. The boronizing
temperatures used were 850 °C, 900 °C and 950 °C, while the boronizing times were 4 h, 6 h
and 8 h. Once the optimum processing parameters (temperature and time) for the boronizing
treatment were determined for each steel. These optimum processing parameters were used for
subsequent boronizing treatment of samples used for electrochemical corrosion, wear and
erosion corrosion tests. The AISI 1018 elbows were sand-blasted to remove the surface paint
and mill scale from the surface and then a stainless steel foil was used to cover the outside
surfaces to prevent them from being boronized (see Fig.3.3). This made it easier to cut the
boronized elbows after erosion-corrosion test. Dimensional changes of the cylindrical and disc
samples before and after boronizing were measured using a Vernier caliper.
Figure 3.2. Schematic diagram of boronizing treatment setup.
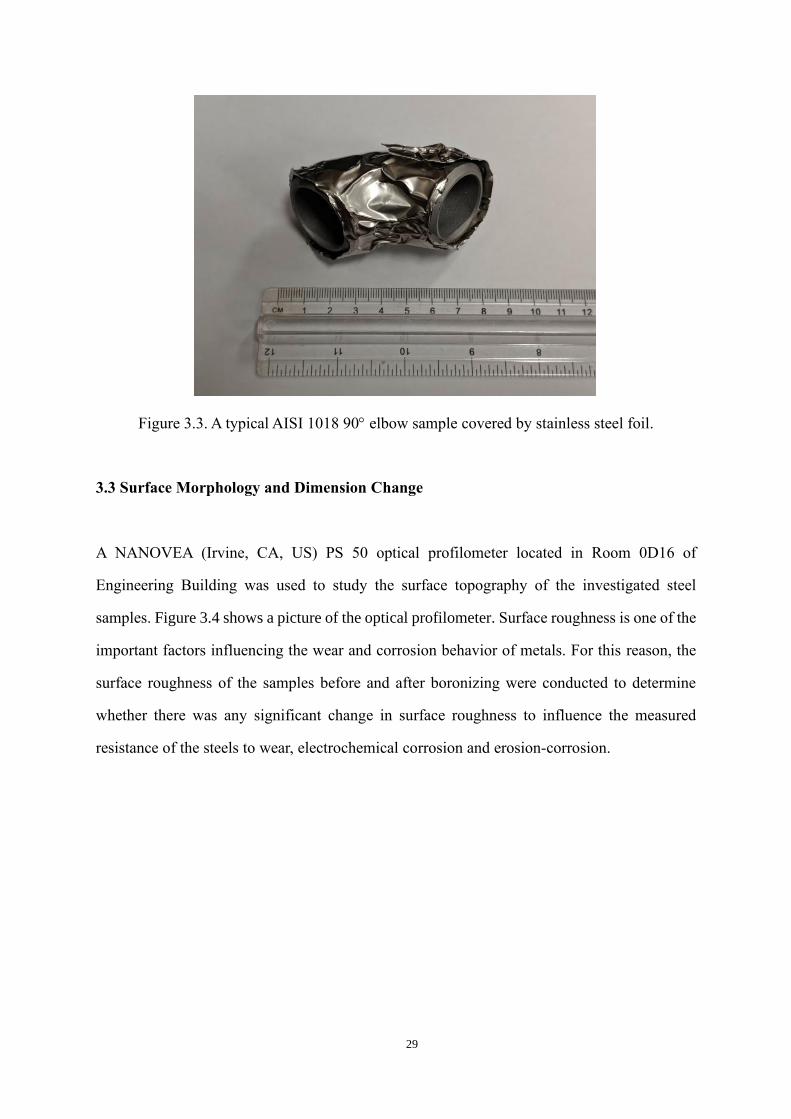
29
Figure 3.3. A typical AISI 1018 90 elbow sample covered by stainless steel foil.
3.3 Surface Morphology and Dimension Change
A NANOVEA (Irvine, CA, US) PS 50 optical profilometer located in Room 0D16 of
Engineering Building was used to study the surface topography of the investigated steel
samples. Figure 3.4 shows a picture of the optical profilometer. Surface roughness is one of the
important factors influencing the wear and corrosion behavior of metals. For this reason, the
surface roughness of the samples before and after boronizing were conducted to determine
whether there was any significant change in surface roughness to influence the measured
resistance of the steels to wear, electrochemical corrosion and erosion-corrosion.

30
Figure 3.4. Photograph of NANOVEA PS 50 profilometer used in this research.
3.4 Microstructural Analysis
The microstructures of the untreated samples and boronized samples were characterized using
optical microscope and scanning electron microscope (SEM). X-ray diffraction (XRD) was
conducted on boronized samples to determine their phase composition. Samples used for wear,
corrosion and erosion-corrosion tests were also examined using SEM after the tests to
determine the damage mechanisms during wear and erosion tests.
Samples for optical microscopic investigations were cut and cold mounted before grinding,
polishing and etching. After cold mounting, specimens were ground with silicon carbide papers
(180 grit, 320 grit, 500 grit and 800 grit size) and fine polished with colloidal diamond of 9 μm,
3 μm, and 1 μm, in that sequence. The surfaces were subsequently cleaned in acetone using an
ultrasonic cleaner and then dried using a hair dryer. The etchant used for AISI 1018 was 2%
Nital solution (contains 2 vol.% nitric acid and 98 vol.% ethanol). The composition of the
etchant used for the AISI 316L alloy is presented in Table 3.6. Samples were immersed in the
etchants for 30 s. The optical microscope was used to establish the presence of boride layers in

31
boronized samples. The thicknesses of boride layers after the boronizing heat treatments under
different boronizing conditions were measured from the optical micrographs using an image
analysis software. The optical microscope used was a Nikon (Shinagawa, Tokyo, Japan)
Eclipse MA100 inverted metallographic microscope equipped with PAXcamTM 3 Camera (see
Fig. 3.5). Measurement of boride layers was conducted on micrographs taken at a
magnification of X500 for AISI carbon 1018 steel and a magnification of X1000 for the AISI
316L stainless steel by using the ‘measure’ function in PAX-it software. The reported thickness
values are the average distances between the surface of sample and the tips of boride layers.
Table 3.6. Chemical composition of the etchant used for AISI 316L steel.
Chemical FeCl3 CuCl2 Ethanol Hydrochloric acid Nitric acid
Amount 4.2 g 1.2 g 61 mL 61 mL 3 mL
Figure 3.5. Photograph of the inverted optical microscope used in this study.
The surfaces of as-received (reference) and boronized samples used for wear and
electrochemical corrosion tests were examined before and after each test using a JEOL
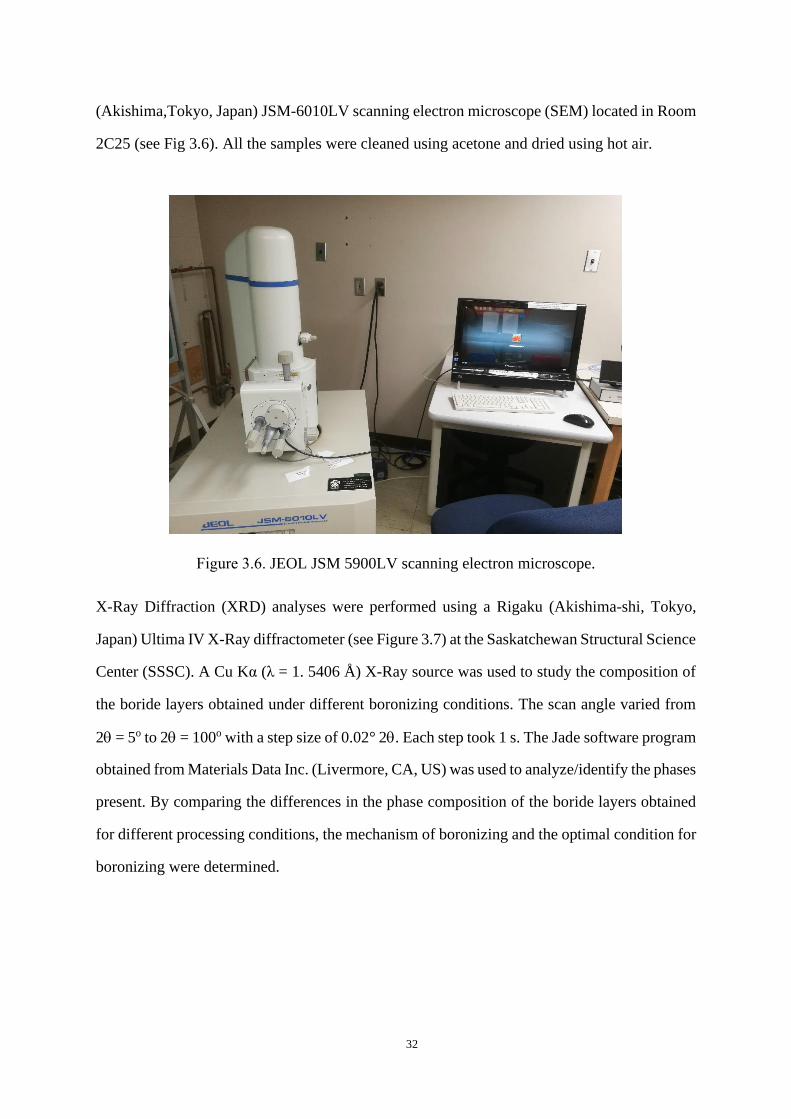
32
(Akishima,Tokyo, Japan) JSM-6010LV scanning electron microscope (SEM) located in Room
2C25 (see Fig 3.6). All the samples were cleaned using acetone and dried using hot air.
Figure 3.6. JEOL JSM 5900LV scanning electron microscope.
X-Ray Diffraction (XRD) analyses were performed using a Rigaku (Akishima-shi, Tokyo,
Japan) Ultima IV X-Ray diffractometer (see Figure 3.7) at the Saskatchewan Structural Science
Center (SSSC). A Cu Kα (λ = 1. 5406 Å) X-Ray source was used to study the composition of
the boride layers obtained under different boronizing conditions. The scan angle varied from
2 = 5o to 2 = 100o with a step size of 0.02° 2. Each step took 1 s. The Jade software program
obtained from Materials Data Inc. (Livermore, CA, US) was used to analyze/identify the phases
present. By comparing the differences in the phase composition of the boride layers obtained
for different processing conditions, the mechanism of boronizing and the optimal condition for
boronizing were determined.

33
Figure 3.7. Rigaku Ultima IV X-Ray diffractometer.
3.5 Microhardness Test
Vickers microhardness measurements were carried out on the as-received and boronized
samples using a Mitutoyo (Kawasaki, Kanagawa, Japan) MVK-H1 microhardness tester (see
Fig. 3.8). According to ASTM E92-17, the samples were subjected to a load of 1000 gf (1 kg)
for 10 s. Any indent without a good diamond shape was ignored. After 10 s, the lengths of the
resulting diagonals (d1 and d2) were obtained and used to calculate the surface hardness value
by using the formula:
𝐻𝑉 = 1854.4 ×𝐹
𝑑2 (3.1)
where 𝑑 = 0.5 × (𝑑1 + 𝑑2). The unit of F is gf and the unit of d is µm. The hardness values
reported in this study are the averages of 18 hardness measurements taken from the both sides
of two cylinder samples.

34
Figure 3.8. Mitutoyo microhardness testing machine.
3.6 Statistical Analysis
Multiple linear regression model was used to determine the effects of boronizing temperature
and boronizing duration on the boride layer thickness and surface hardness. Boride layer
thickness and surface hardness are two dependent variables while boronizing duration and
temperature are two independent variables. This analysis was performed using IBM SPSS
Statistics 25 software with backward elimination method. Since boride layer thickness strongly
depends on diffusion process which can be described by Fick’s first law, the simulation model
and statistical analysis would be explained in Chapter 4. As for surface hardness analysis,
which has no relationship with diffusion, the following model was used to establish the
relationship between boronizing parameters and surface hardness after boronizing:
𝐻𝑉 = 𝑎 + 𝑏𝑡 + 𝑐𝑇 + 𝑑𝑡2 + 𝑒𝑇2 + 𝑓𝑡𝑇 + 𝜀 (3.2)
where HV = Vicker’s hardness, t boronizing time (s), T = temperature (K) and a, b, c, d, e, and
f = unknown parameters, and = error term.

35
Equation 3.2 is a complete regression equation containing all the variables and would be
transformed into a reduced model using the backward elimination method [65]. The variables
are checked one at a time and the least significant is dropped from the model at each stage. The
procedure is terminated when all of the variables remaining in the equation provide a
significant contribution to the prediction of the dependent variable (surface hardness). The F
test was used to test if the regression coefficients of the predictor variables were all zero. The t
test was used to test if the remaining regression coefficient were significant or not. A partial F-
test was computed for each of the independent variables still in the equation to determine
whether to accept or remove that variable.
3.7 Wear Test
The dry wear resistance of as-received and boronized specimens of AISI 1018 and AISI 316L
steels were evaluated using a CETR (Billerica, MA, US) Multi-Specimen Test System (UMT-
2). A photograph of this equipment, which is a ball-on-disk test system setup, is provided in
Fig 4. The test specimen was a disk measuring 1.25 inches (31.75 mm) in diameter and 5 mm
thick. A ball-on-disk test configuration was used with a 5/16 inch (8 mm) diameter AISI 440C
stainless steel ball sourced from McMASTER CARR (Princeton, NJ, US). A linear
reciprocating motion was used, with the displacement length maintained at a constant value of
10 mm. Each test lasted for 1hour while the wear speed was set to 50 mm/s. Three different
loads (10 N, 20 N, 30 N) were used and all tests were performed in dry condition at room
temperature (~ 23 C) and a relative humidity of 85%. The initial contact stress between the
ball and the disk at each applied load was estimated by using equations (3.3) and (3.4) [66].
The pertinent properties of the ball and test materials are presented in Table 3.7, while the
estimated stresses are summarized in Table 3.8.
1
𝐸∗=
1
2(
1−𝑣12
𝐸1+
1−𝑣22
𝐸2) (3.3)
(𝜎𝑐)𝑚𝑎𝑥 = 0.4(𝐸∗
2
𝑅2)1
3 (3.4)

36
where E1 and E2 are the elastic moduli of the test sample and counterface, respectively; v1 and
v2 are the Poisson’s ratios of the sample and counterface, respectively; and R is the radius of
the counterface (m).
Table 3.7. Values of elastic modulus, Poisson’s ratio and radius of test sample and wear
counterpart.
Alloy 𝐸 (GPa) 𝑣 𝑅 (mm)
AISI 1018 205 0.29
AISI 316L 193 0.27
AISI 440C 200 0.283 8
Table 3.8. Hertzian contact stress under different conditions.
Load 10 N 20 N 30 N
AISI 1018 1770.9 MPa 2231.2 MPa 2554.1 MPa
AISI 316L 1719 MPa 2165.9 MPa 2479.3 MPa
The wear rate of the test samples was obtained using equation (3.5).
Wear rate= volume loss
sliding distance (3.5)
The volume loss was measured using a NANOVEA PS 50 optical profilometer (see Fig. 3.9).
The sliding distance was calculated as the product of wear speed (50 mm/s) and test duration
(1 h = 3600 s) to be 180 m.

37
Figure 3.9. UMT Multi-specimen test system with a wear test setup.
3.8 Electrochemical Corrosion Test
The electrochemical corrosion tests were carried out G102 − 89 [67] using a Gamry Interface
1000 Potentiostat/Galvanostat system (Gamry Instruments, Warminster, PA, US). The purpose
of electrochemical corrosion tests was to determine the corrosion rate of samples and the effect
of boronizing on the resistance of corrosion.
The test solutions used were saturated potassium chloride solution and saturated raw potash
solution. They were maintained at room temperature (~ 23 C) and a pH of approximately 7
for all tests. Before each potentiodynamic scan, the open circuit potential (OCP) was
determined after 1-h exposure to ensure stability and reduce fluctuations in potential. Then the
potentiodynamic scanning was conducted between an initial potential of -0.2 V relative to the
OCP and a final potential of 0.2 V relative to the OCP. The scan rate was 0.1667 mV per second.
As cold mounting, grinding and polishing would remove the surface boride layer, a new design
of electrochemical cell had was used. A sponge was used for absorbing test solution and
providing corrosion environment for the test specimens. Before testing, the sponge was cleaned

38
with deionized water and dried using hot air. It was then allowed to absorb enough test solution
with some extra test solution kept at the bottom of the vessel. A graphite electrode was used as
the counter electrode while a saturated calomel electrode (SCE) was used as the reference
electrode. The cylindrical specimens used were 9.5 mm in diameter and 10 mm long while the
exposure area to sponge of each sample was 0.7088 cm2. A metal bar was used to ensure good
contact between the surface of the sample and sponge. A conductive copper tape was used to
connect the metal bar and the sample to avoid applying too much load that would make the
edge of the sample to be pushed into the sponge. The detailed setup for corrosion test is
presented in Fig.3.10. However, with several testing, the results were abnormal. The possible
reason for it was the exposure areas were greater than expected and the infiltration phenomenon
of electrolyte on the edge of samples extended the contact area and also promoted the
generation of crevice corrosion. In addition, the rust attached on the sponge and greatly
changed the corrosion environment.
Figure 3.10. A schematic diagram of the corrosion test setup for potentiodynamic polarization
scanning with sponge.
A ParaCell™ Electrochemical Cell Kit (Gamry Instruments, Warminster, PA, US) was used to
ascertain whether the sponge corrosion design worked well and produced reliable results. The

39
ParaCell™ Electrochemical Cell setup is presented in Fig. 3.11. A graphite rod was used as
counter electrode, while the test sample served as the working electrode. State the size of
sample used with the ParaCell device. An O-ring was used to prevent leaking on the electrode
during the corrosion experiment. Before any corrosion test, a leak check was carried out after
assembling. A small amount of dye was added to the distilled water that was used to fill the
cell. After filling, the cell was placed on a white paper or towel and left for a while. A leak may
not leave the paper or towels damp but will leave behind the color of the dye. A 1 cm2 sample
mask was used on test samples to limit the exposure area during the corrosion and to reduce
the effect of the crevice corrosion near the O-ring. A saturated calomel electrode (SCE) was
used as the reference electrode in this design. A funnel was used for adding testing solution
into the cell after assembling.
Figure 3.11. The ParaCell™ Electrochemical Cell setup.
Data analysis was carried out with the Gamry Echem Analyst and a Python program developed
by Li [68] to determine corrosion parameters such as corrosion current density (icorr),
polarization resistance (Rp), corrosion rate (CR) and Tafel constants (a and c). The corrosion
rate was calculated from corrosion current density (icorr) using the formula:

40
𝑗 = 𝑗𝑜 × {𝑒𝑥𝑝 [𝛼𝑎×𝑧×𝐹
𝑅×𝑇(𝐸 − 𝐸𝑒𝑞)] − 𝑒𝑥𝑝 [−
𝛼𝑐×𝑧×𝐹
𝑅×𝑇(𝐸 − 𝐸𝑒𝑞)]} (3.6)
where j = electrode current density (A/m2), jo = exchange current density (A/m2), E = electrode
potential (V), Eeq = equilibrium potential (V), T = temperature (K), z = number of electrons
involved in the electrode reaction, F = 96485.332 (C/mol), R = 8.314 (J/(K*mol)), αa = anodic
charge transfer coefficient, αc = cathodic charge transfer coefficient
𝑗𝑐𝑜𝑟𝑟 =𝛽𝑎×𝛽𝑐
2.3×𝑅𝑝×(𝛽𝑎+𝛽𝑐) (3.7)
where jcorr = corrosion current density (A/cm2), Rp = the polarization resistance (Ω/cm2), βa =
the anodic Tafel slope (V/decade), βc = the cathodic Tafel slope (V/decade)
𝐶𝑅 = 𝐾1 ×𝑗𝑐𝑜𝑟𝑟
𝜌×𝐴× 𝐸𝑊 (3.8)
where CR = corrosion rate in mm per year, K1 = 3272 (mm/(A*cm*year)), jcorr = corrosion
current density (μA/cm2), A = contact area (cm2), ρ = density (g/cm3), EW = equivalent
weight.
3.9 Erosion-corrosion Test
The purpose of erosion-corrosion test is to determine the effect of boronizing on the resistance
of carbon steel elbows to erosion-corrosion. A flow loop was used for erosion-corrosion testing.
A schematic diagram of the flow loop is presented in Fig.3.12. It contained a Verderflex
(Castleford, United Kingdom) Dura 55 peristaltic hose pump, 4 tested elbows in 4 corners, a
Blacoh (Riverside, CA, US) pulsation dampener, a pressure gauge, a slurry tank, the other tank
for calibration and a heat exchanger. The pump moves the slurry in certain flow velocity, the
pulsation dampener keeps the flow velocity stable and reduce the shock of system. The heat
exchanger keeps the temperature of slurry at 30±0.5 oC. Before starting the test, the flow loop
was calibrated to determine the relationship between the flow velocity in the loop and the
working frequency of the pump. The calibration was done with pure saturated potash slurry

41
without any sand. The data obtained are presented in Table 3.9.
Figure 3.12. Erosion-corrosion loop setup for testing steel elbows.
Table 3.9. Relationship between loop flow velocity and pump frequency.
Flow velocity
(m/s) Pump speed (Hz)
0.5 11.0
1.0 20.3
1.5 29.7
2.0 39.0
2.5 48.4
3.0 57.7
3.5 67.1
4.0 76.4
4.5 85.7
5.0 95.1

42
The slurry used in erosion-corrosion test was made up of saturated potash brine and silica sand
of which the total weight was 28 kg for every test. As shown in Fig. 3.12, four elbows which
were all boronized or untreated were installed at the four corners of the loop. Flow velocity and
sand weight were two erosion-corrosion parameters varied in this study. The experiments
were divided into six groups (see Table 3.10). Two different flow velocities (2.5 m/s and 4 m/s)
and three different sand concentrations (10 wt.%, 30 wt.% and 50 wt.%) were used and all tests
were performed at 30 ± 0.50 C. The flow velocity of 2.5 m/s was chosen as the low flow
velocity because it was close to the flow velocity used in potash mineral industry and also
prevented recrystallization of potash in the loop. 4 m/s was chosen as the high flow velocity
because the highest working frequency provided by peristaltic pump was 80 Hz and too high
flow velocity would cause leaking and system shocking. To ensure the reproducibility of data,
each test condition was repeated at least twice.
Table 3.10. The erosion-corrosion test parameters.
Flow velocity (m/s) Sand concentration (wt%)
2.5 10 wt% 30 wt% 50 wt%
4 10 wt% 30 wt% 50 wt%
The erosion-corrosion rate was calculated by equation:
𝑇 =𝑎𝑣𝑒𝑟𝑎𝑔𝑒 𝑤𝑒𝑖𝑔ℎ𝑡 𝑙𝑜𝑠𝑠 (𝑔)
𝑡𝑜𝑡𝑎𝑙 𝑖𝑛𝑡𝑒𝑟𝑛𝑎𝑙 𝑠𝑢𝑟𝑓𝑎𝑐𝑒 𝑎𝑟𝑒𝑎 × 𝑑𝑢𝑟𝑎𝑡𝑖𝑜𝑛 (ℎ) (3.9)
where the total internal surface area of elbow used in experiments is 0.005 𝑚2.
The average weight loss was the average of the weight difference between the initial weight of
elbows and the final weight of elbows after testing of four elbows. The weight of elbows before
and after testing was measured using an OHAUS (Parsippany, NJ, US) Adventurer® electronic
weighing balance with an accuracy of ± 0.1mg. After erosion-corrosion testing, all the elbows

43
were uninstalled from the loop, immersed in diluted Detergent 8® cleaning solution obtained
from ALCONOX Inc. (White Plains, NY, US) for 30 s and cleaned by soft brush to remove all
the rust and sand particle attached on the internal and surface of elbows. Then the elbows were
rinsed with acetone and dried using a Powerfist (Saskatoon, SK, CA) 8259210 heat gun. After
obtaining the average weight loss for each test condition, the No. 4 elbow in each condition
were taken to machine shop to cut and the internal wear surface was examined in the SEM and
NANOVEA PS 50 optical profilometer. The reason for choosing No.4 elbow was that the
weight loss data of that location was the most stable and received the least gravity effect.
44
CHAPTER 4
RESULTS AND DISCUSSION
The data obtained from the experiment investigations described in Chapter 3 are presented,
analyzed and discussed in this chapter, which contains three main parts. The first part focuses
on the results of boronizing treatment of the two alloys investigated. The second part focuses
on changes in physical and mechanical properties of the surfaces of the alloys as a result of
boronizing treatment. The last part focuses on the changes in electrochemical corrosion
properties, wear and erosion-corrosion resistance of the alloys due to boronizing heat treatment.
4.1. Effect of Boronizing on Sample Dimension
4.1.1. AISI 1018 steel
Typical optical images of AISI 1018 steel samples before and after boronizing treatment at 900
oC for 4 h are presented in Figure 4.1. The change in the diameter of AISI 1018 specimens
boronized under different conditions are summarized in Table 4.1. As can be seen in Fig. 4.1,
the surface of the steel became somewhat darker as a result of the boronizing treatment but
there is no evidence of spalling. The data in Table 4.1 show that there is very little change in
the diameter of specimens boronized at the test three temperatures (850 °C, 900 °C and 950 °C).

45
Figure 4.1. Picture of AISI 1018 samples: (a) as-received and (b) boronized at 900 ℃ for 4 h.
Table 4.1. Change in diameter obtained for AISI 1018 samples after boronizing at different
temperatures for various lengths of time.
Group Before
(mm) After (mm) Change (mm)
% change in
dimension
850℃, 4h 9.504 9.530 0.026 0.27 %
850℃, 6h 9.500 9.522 0.022 0.23 %
850℃, 8h 9.500 9.540 0.04 0.42 %
900℃, 4h 9.492 9.528 0.036 0.38 %
900℃, 6h 9.494 9.522 0.028 0.29 %
900℃, 8h 9.500 9.538 0.038 0.40 %
950℃, 4h 9.500 9.532 0.032 0.34 %
950℃, 6h 9.498 9.554 0.056 0.59 %
950℃, 8h 9.490 9.546 0.056 0.59 %

46
4.1.2 AISI 316L steel
Figure 4.2 shows optical images of AISI 316L samples before and after boronizing under
different conditions, while Table 4.2 shows changes in diameter of AISI 316L samples due to
boronizing. It can be seen from Fig. 4.2 that the color of the boronized samples changed (from
the as-received silvery color to different shades of gray color after boronizing). A close look at
Fig. 4.2 (c) and (d) shows evidence of peeling off or spalling of the boride layer. The peeling
off may be attributed to the difference between the thermal expansion coefficients of FeB phase
(23 x 10-6 K-1) and Fe2B phase (7.9 x 10⁻⁶ K-1) which caused substantial residual tensile stress
at the interface between the boride phases (i.e. FeB/Fe2B interface) [37]. Table 4.2 shows that
there is no significant dimensional change between as-received and boronized samples of AISI
316L.
Figure 4. 2. Photographs AISI 316L sample before and after boronizing treatment (a) as-
received, (b) boronized AIS at 900 ℃ for 4 h, (c) boronized at 950 ℃ for 4 h and (d)
boronized at 950 ℃ for 8 h.

47
Table 4.2. Change in diameter obtained for AISI 316L samples after boronizing at different
temperatures for various lengths of time.
Group Before
(mm) After (mm) Change (mm)
% change in
dimension
850℃, 4h 9.506 9.518 0.012 0.13 %
850℃, 6h 9.506 9.520 0.014 0.15 %
850℃, 8h 9.510 9.522 0.012 0.13 %
900℃, 4h 9.506 9.526 0.020 0.21 %
900℃, 6h 9.504 9.530 0.026 0.27 %
900℃, 8h 9.504 9.530 0.026 0.27 %
950℃, 4h 9.504 9.538 0.034 0.36 %
950℃, 6h 9.506 9.540 0.034 0.35 %
950℃, 8h 9.506 9.460 -0.046 - 0.48 %
4.2 Effect of Boronizing Parameters on Boride Layer Thickness
4.2.1 AISI 1018 Steel
The SEM micrograph of polished and etched surface of as-received AISI 1018 steel is shown
in Fig.4.3(a), while SEM micrographs of AISI 1018 samples boronized under different
boronizing conditions are shown in Fig.4.3(b) to Fig. 4.3(j). As can be seen in Fig. 4.3, the
surface layers of boronized samples have different microstructures in terms of phases present
and grain morphology when compared to the as-received. The boride layers exhibit a sawtooth-
like morphology. This can be attributed to the dependence of the mobility of boron atoms on
the crystallographic direction in the anisotropic crystals of the boride layers. The growth of
boride layer along the [002] crystallographic direction in both FeB and Fe2B phases is in more
than the other directions and then the layers grows in one direction preferably and makes such
kind of structure [69]. The Fe2B phase accounts for the majority of the boride layer with a saw–
tooth morphology interlocking with the steel substrate, which makes the removal of the Fe2B
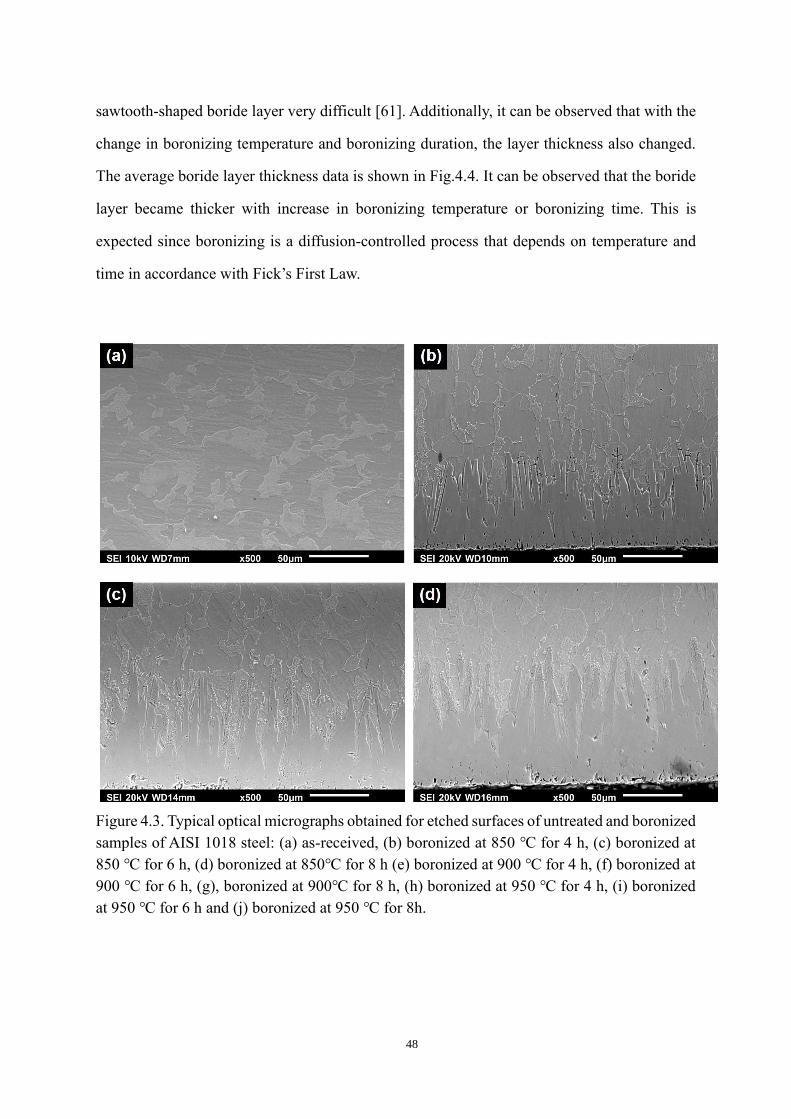
48
sawtooth-shaped boride layer very difficult [61]. Additionally, it can be observed that with the
change in boronizing temperature and boronizing duration, the layer thickness also changed.
The average boride layer thickness data is shown in Fig.4.4. It can be observed that the boride
layer became thicker with increase in boronizing temperature or boronizing time. This is
expected since boronizing is a diffusion-controlled process that depends on temperature and
time in accordance with Fick’s First Law.
Figure 4.3. Typical optical micrographs obtained for etched surfaces of untreated and boronized
samples of AISI 1018 steel: (a) as-received, (b) boronized at 850 ℃ for 4 h, (c) boronized at
850 ℃ for 6 h, (d) boronized at 850℃ for 8 h (e) boronized at 900 ℃ for 4 h, (f) boronized at
900 ℃ for 6 h, (g), boronized at 900℃ for 8 h, (h) boronized at 950 ℃ for 4 h, (i) boronized
at 950 ℃ for 6 h and (j) boronized at 950 ℃ for 8h.

49
Figure 4.3 continued.

50
Figure 4.4. Average thickness of surface boride layer formed on AISI 1018 steel under
different boronizing conditions.
4.2.2 AISI 316L Steel
The SEM micrographs of the etched surface of as-received AISI 316L steel is shown in Fig.4.5
(a) while the optical micrographs of boronized samples under different boronizing conditions
are presented in Fig.4.5 (b) to Fig.4.5 (j). As it can be seen in Fig.4.5, the boride layer also
formed on the surface of the AISI 316L austenitic stainless steel specimens, but its
microstructural morphology is different from the one observed in boride layer that formed on
the surface of the boronized AISI 1018 steel. In boronized stainless steel samples, the interface
between the substrate and boride layer is flat, unlike in AISI 1018 steel in which sawtooth-like
morphology was observed. The difference is due to the presence of chromium in the stainless
steel, which increased the hardness in the boride layer. The alloying elements act as a diffusion
barrier for the boron atoms, thereby increasing the boron concentration at the surface of the
sample and inducing the formation of the FeB phase in ferrous alloys.

51
Figure 4.5. Typical optical micrographs obtained for etched surfaces of as-received AISI 316L
steel and boronized samples (a) as-received (b) boronized, 850℃,4h (c)boronized, 850℃,6h
(d) boronized, 850℃,8h (e) boronized, 900℃,4h (f) boronized, 900℃, 6h (g) boronized,
900℃,8h (h) boronized, 950℃,4h (i) boronized, 950℃, 6h (j) boronized, 950℃, 8h.

52
Figure 4.5 continued.
Whereas only one layer is observed in the optical micrograph of the boride surface layer of the
AISI 1018 steel, two layers with different colors were observed on the boride layers of the
boronized AISI 316L stainless steel. Some cracks were presented in the boride layers of the
stainless steel boronized at 950 ℃. The images show some parts of the boride layer disappeared
at some location, which affected the thickness of the boride layer. And the locations where
crack always appeared were very close to the interface between two layers with different colors.
Pala et al. [3] Goeuriot et al. [39] and Krelling [70] also reported the same phenomenon in their
research investigations.
The data for the average boride layer thickness is presented in Fig.4.6. It can be observed that
the boride layer became thicker as the boronizing temperature and time were increased. As
mentioned earlier, boronizing is a diffusion-controlled process that obeys Fick’s law of

53
diffusion. Thus, the thickness of the boride layer is expected to increase with an increase in
boronizing temperature and time
Figure 4.6. Average boride layer thickness obtained for AISI 316L steel under different
boronizing conditions.
4.2.3 AISI 1018 low carbon steel elbow
The Fig.4.7 shows optical micrographs of cross-sections of AISI 1018 elbows taken at different
locations. It can be seen that a boride layer formed on the surface of the steel elbow. So the
effort to boronize the inner surfaces of AISI 1018 steel elbows was successful.
Figure 4.7. Optical micrographs showing boronized layer at the internal surface of AISI 1018
elbow (a) middle part (b) ending part.
The average thicknesses the boronized surface layers on the surface of the elbows are compared

54
with those recorded for cylindrical samples are compared in Fig. 4.8. It was observed in Fig.4.7
that the boride layer on the inner wall of the elbow has the same microstructure as that on the
surface of the cylindrical specimens and the thickness of the boride layers are comparable. The
small difference in layer thickness may be due to the surface roughness difference between
elbow samples (surface finish using sandblasting) and cylindrical samples (finely polished
surface).
Figure 4.8. Average boride layer thickness obtained for AISI 1018 elbow and cylindrical steel
specimens.
4.3 Effect of Boronizing on the Hardness of AISI 1018 and AISI 316L Steels
4.3.1 AISI 1018 low carbon steel
Figure 4.9 shows the hardness of AISI 1018 steel samples boronized under different test
conditions. Note here that HV1 (Y-axis) indicates that the Vickers hardness values were
obtained using a 1 kg load. The hardness of the steel increased from 317 HV for the
unboronized (as-received) sample up to 1834 HV for boronized specimens, which is roughly a
600% improvement in hardness. The hardness obtained for the boronized specimens depended
on boronizing temperature and time. In general, it decreased with increasing boronizing
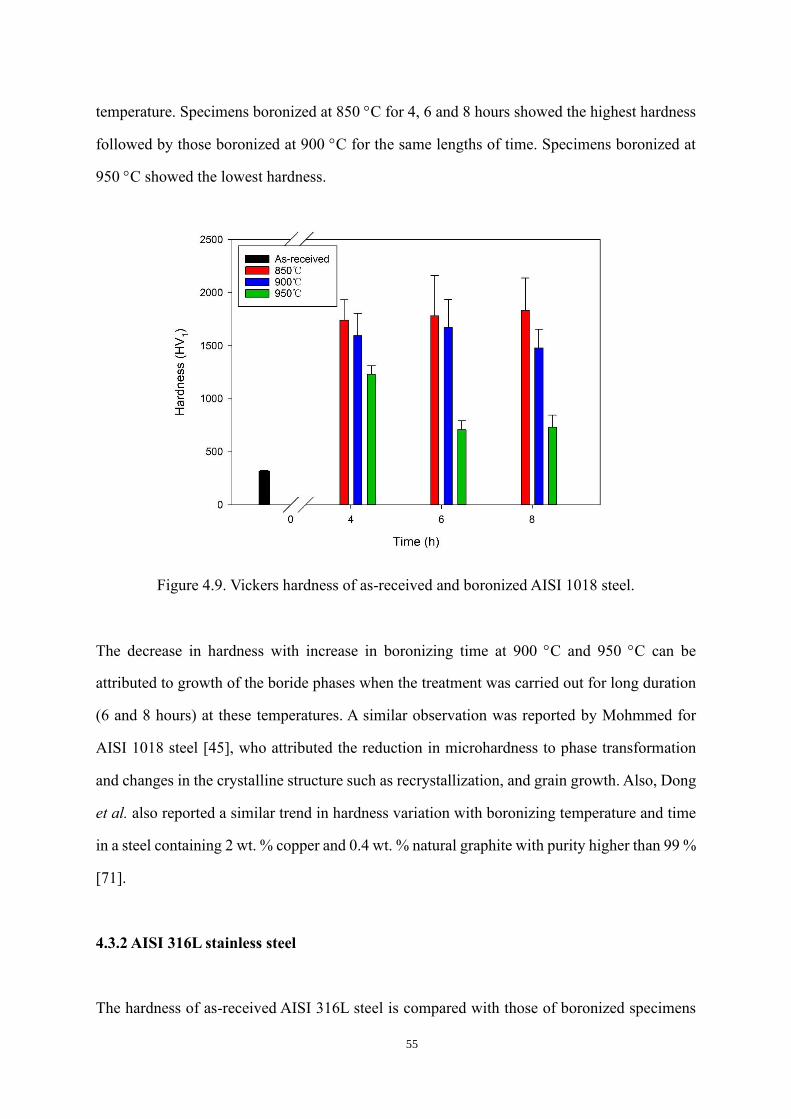
55
temperature. Specimens boronized at 850 C for 4, 6 and 8 hours showed the highest hardness
followed by those boronized at 900 C for the same lengths of time. Specimens boronized at
950 C showed the lowest hardness.
Figure 4.9. Vickers hardness of as-received and boronized AISI 1018 steel.
The decrease in hardness with increase in boronizing time at 900 C and 950 C can be
attributed to growth of the boride phases when the treatment was carried out for long duration
(6 and 8 hours) at these temperatures. A similar observation was reported by Mohmmed for
AISI 1018 steel [45], who attributed the reduction in microhardness to phase transformation
and changes in the crystalline structure such as recrystallization, and grain growth. Also, Dong
et al. also reported a similar trend in hardness variation with boronizing temperature and time
in a steel containing 2 wt. % copper and 0.4 wt. % natural graphite with purity higher than 99 %
[71].
4.3.2 AISI 316L stainless steel
The hardness of as-received AISI 316L steel is compared with those of boronized specimens

56
in Fig.4.10. The hardness of the as-received specimen is approximately 336 HV, while those of
boronized samples range between 1289 and 2340 HV depending on the boronizing condition
(temperature and time). It can be observed from Fig.4.10 that the microhardness values of all
boronized specimens are much higher than that of the as-received, the increase in hardness
ranging from 283% to around 610%. When boronized at 850 °C, the microhardness of the
boride layer increased as the boronizing time was increased from 4 h to 8h. When boronized at
900 °C, the hardness of the boride layer increased as the boronizing time was increased from 4
h to 6 h, but decreased as boronizing time increased to 8 h. When boronized at 950 °C, the
hardness of the boride layer remained relatively unchanged as boronizing time increased from
4 h to 6 h but reduced with further increase in boronizing time to 8h. For an exposure time of
4 h, the hardness of AISI 316L increased as the temperature was increased from 850 C to
950 °C. The observed decrease in hardness with an increase in exposure time (from 6h to 8h)
and temperature (from 900℃ to 950℃) can be attributed to the peeling off problem mentioned
previously in Section 4.1. The FeB phase has higher hardness than Fe2B phase. Since the FeB
phase is the outer layer and the Fe2B phase is the inner layer, during peeling off the FeB phase
was removed from the surface of the boronized samples leading to the observed decrease in
surface microhardness value.
Figure 4.10. Hardness obtained for as-received and boronized specimens of AISI 316L steel.
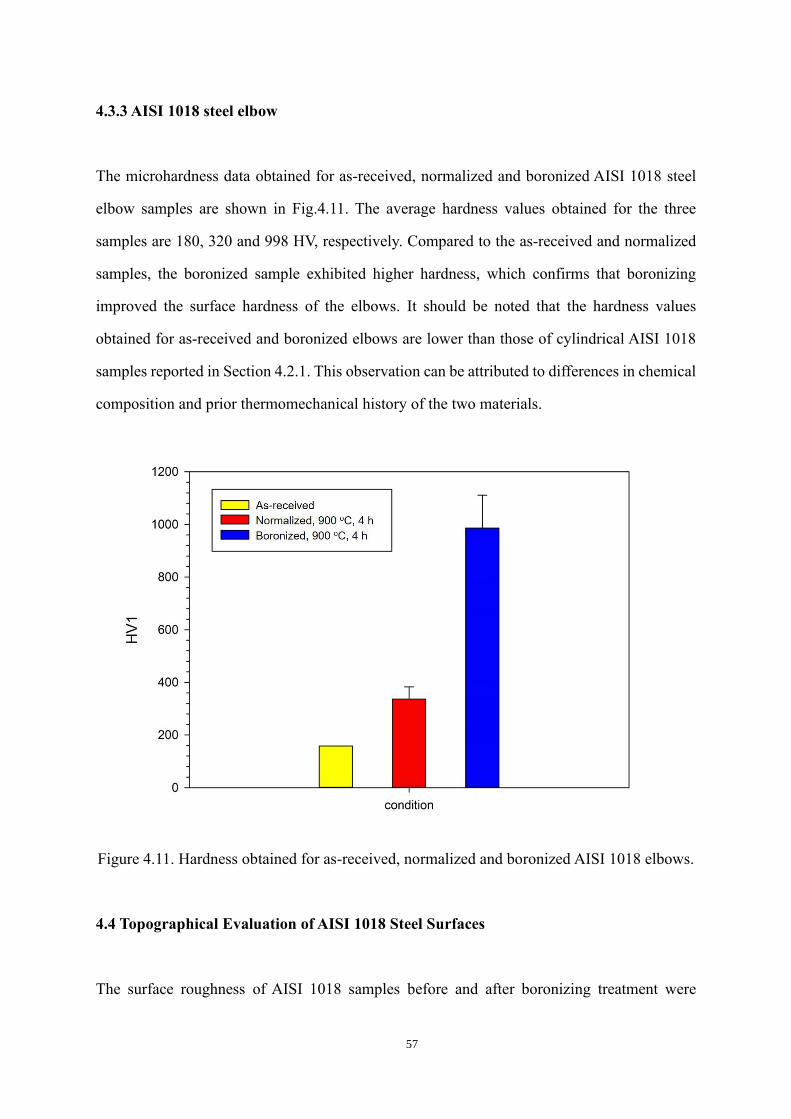
57
4.3.3 AISI 1018 steel elbow
The microhardness data obtained for as-received, normalized and boronized AISI 1018 steel
elbow samples are shown in Fig.4.11. The average hardness values obtained for the three
samples are 180, 320 and 998 HV, respectively. Compared to the as-received and normalized
samples, the boronized sample exhibited higher hardness, which confirms that boronizing
improved the surface hardness of the elbows. It should be noted that the hardness values
obtained for as-received and boronized elbows are lower than those of cylindrical AISI 1018
samples reported in Section 4.2.1. This observation can be attributed to differences in chemical
composition and prior thermomechanical history of the two materials.
Figure 4.11. Hardness obtained for as-received, normalized and boronized AISI 1018 elbows.
4.4 Topographical Evaluation of AISI 1018 Steel Surfaces
The surface roughness of AISI 1018 samples before and after boronizing treatment were
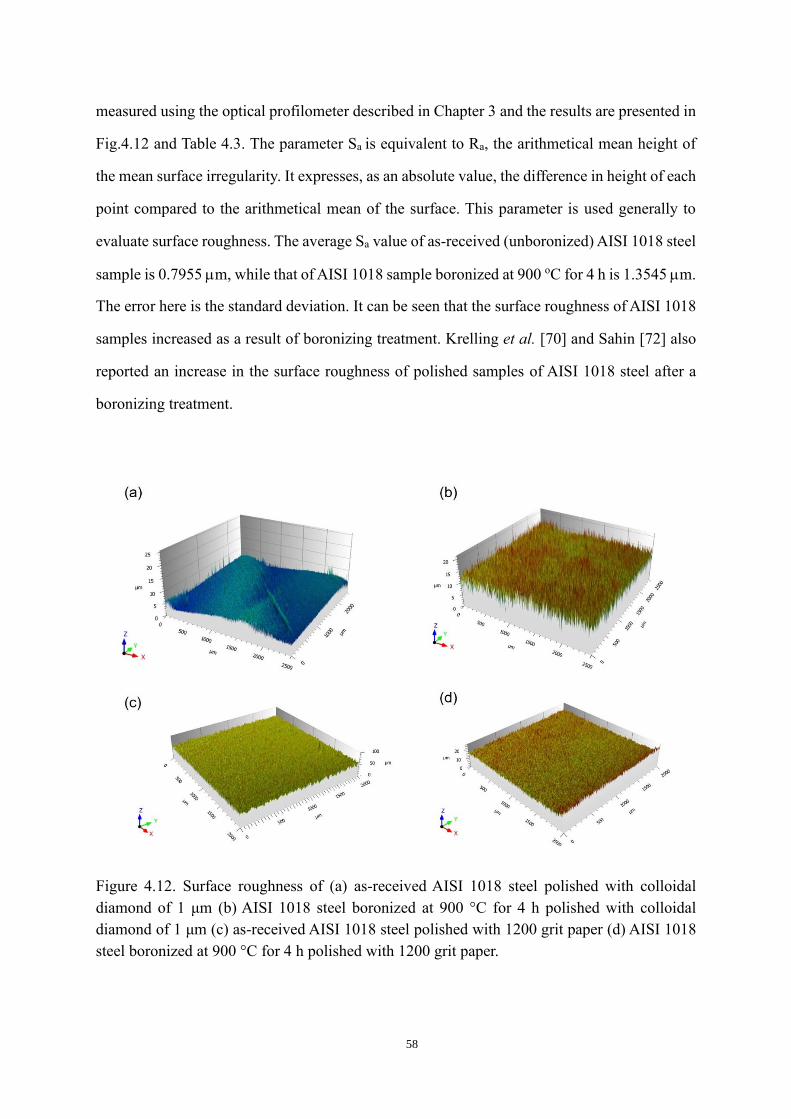
58
measured using the optical profilometer described in Chapter 3 and the results are presented in
Fig.4.12 and Table 4.3. The parameter Sa is equivalent to Ra, the arithmetical mean height of
the mean surface irregularity. It expresses, as an absolute value, the difference in height of each
point compared to the arithmetical mean of the surface. This parameter is used generally to
evaluate surface roughness. The average Sa value of as-received (unboronized) AISI 1018 steel
sample is 0.7955 m, while that of AISI 1018 sample boronized at 900 oC for 4 h is 1.3545 m.
The error here is the standard deviation. It can be seen that the surface roughness of AISI 1018
samples increased as a result of boronizing treatment. Krelling et al. [70] and Sahin [72] also
reported an increase in the surface roughness of polished samples of AISI 1018 steel after a
boronizing treatment.
Figure 4.12. Surface roughness of (a) as-received AISI 1018 steel polished with colloidal
diamond of 1 μm (b) AISI 1018 steel boronized at 900 °C for 4 h polished with colloidal
diamond of 1 μm (c) as-received AISI 1018 steel polished with 1200 grit paper (d) AISI 1018
steel boronized at 900 °C for 4 h polished with 1200 grit paper.

59
Table 4.3. Values of surface roughness parameters obtained for AISI 1018 samples.
Sq (m) Ssk Sku Sp (m) Sv (m) Sz (m) Sa (m)
AR (1
μm)
0.930 ±
0.046
0.029 ±
0.036
2.976 ±
0.153
20.388 ±
2.104
5.293 ±
0.042
25.680 ±
2.146
0.764 ±
0.032
B (1 μm) 1.706 ±
0.011
0.038 ±
0.004
3.341 ±
0.290
10.772 ±
0.565
10.772 ±
0.281
21.543 ±
0.284
1.343 ±
0.025
AR
(1200
grit)
5.20 +
0.15
0.033 ±
0.02
3.20 ±
0.11
49.80 ±
2.55
51.00 ±
1.20
100.80 ±
1.35
4.20 ±
0.10
B (1200
grit)
1.50 ±
0.01
0.30 ±
0.01
4.80 ±
0.15
11.00 ±
1.80
15.60 ±
0.55
26.60 ±
1.25
1.10 ±
0.07
AR = As-received and B = Boronized
The increase in the roughness obtained after boronizing is attributed to the formation of Fe2B
crystals with different orientations on the surface of the steel sample [9]. Formation of Fe2B
also causes a volume change, which may not be uniform across the steel surface thereby leading
to contortion of the surface.
However, the decrease was observed in the samples with rough surface after boronizing (only
grinded with 1200 gits sandpaper), the surface morphology obtained is shown in Fig.4.12 (c)
and Fig.4.12 (d). Krelling et al. [73] also noticed the similar result in boronized AISI 1020 steel.
This phenomenon can be attributed to the fact that the reaction of iron with boron to form Fe2B
causes a volume change, leading to the formation crystals with different orientations and the
Fe2B crystals filled in the valleys on the surface generated during grinding.

60
4.5 XRD Analysis of Boronized Samples
4.5.1 AISI 1018 steel
X-ray diffraction (XRD) patterns obtained for as-received and boronized samples of AISI 1018
steel are shown in Figs. 4.13 to 4.16. It can be seen from Fig. 4.14 that FeB and Fe2B phases
are present in the boride layer of samples boronized at 850 ℃ for 4 h. For the other boronizing
conditions, especially at longer boronizing time or higher temperature, the boride layer consists
only of the Fe2B phase. Mejía-Caballero [47] and Pallegar [74] reported similar results for
boronized AISI 1018 plain carbon steel. The possible reason for the difference in chemical
composition under different conditions is that carbon does a negative influence on the diffusion
of boron atoms. Carbon is not soluble in the iron boride layer, and would be pushed from the
surface into the substrate to form the transition zone [32]. With higher temperature and
boronizing time, the boron atoms have higher energy to push all carbon into substrate and no
more FeB phase would appear with sufficient boron to supply.
Figure 4.13. XRD pattern obtained for as-received AISI 1018.
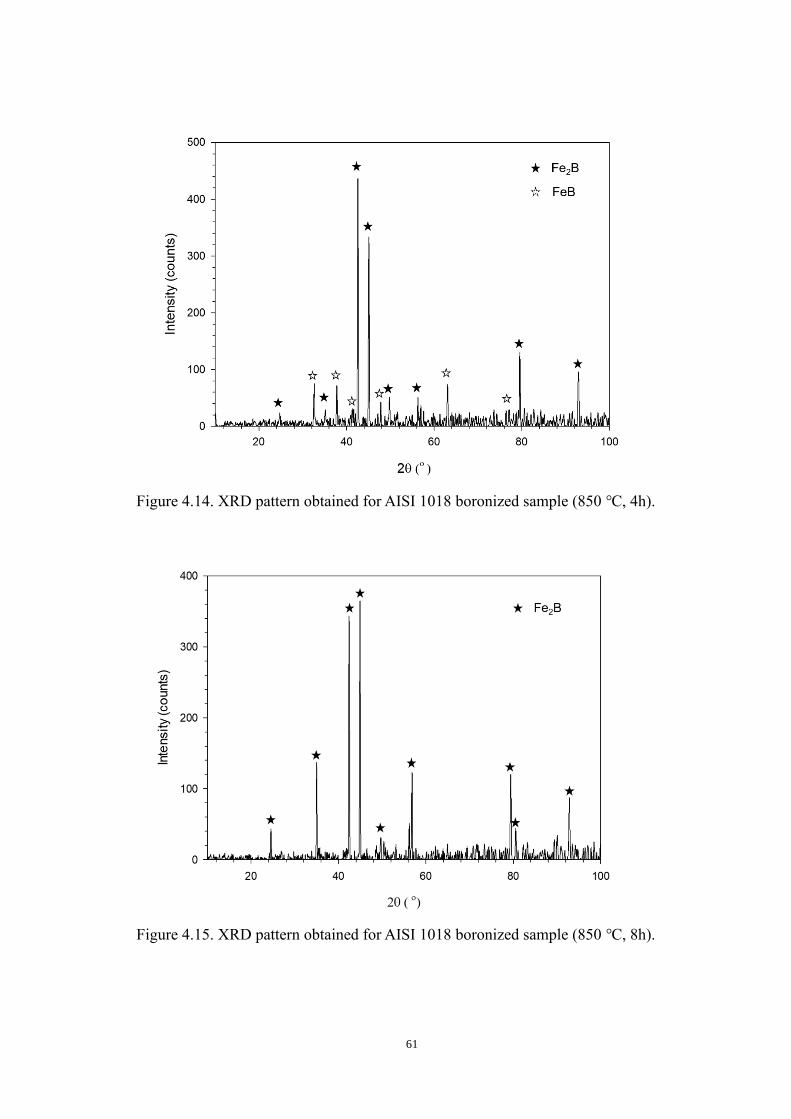
61
Figure 4.14. XRD pattern obtained for AISI 1018 boronized sample (850 ℃, 4h).
Figure 4.15. XRD pattern obtained for AISI 1018 boronized sample (850 ℃, 8h).

62
Figure 4.16. XRD pattern obtained for AISI 1018 boronized sample (950 ℃, 4h).
4.5.2 AISI 316L steel
X-ray diffraction (XRD) patterns obtained for as-received and boronized AISI 316L steel
samples are shown in Fig.4.17 and Fig 4.18, respectively. Unlike what was observed for AISI
1018 steel, the XRD patterns obtained for AISI 316L under different boronizing conditions
showed the presence of borides other than iron borides (FeB and Fe2B). The two principal
alloying elements in AISI 316L stainless steel, Cr and Ni, reacted with boron to form additional
borides such as CrB, Cr2B, NiB, Ni2B and Ni3B. Chromium can modify the structure and the
properties of boride layer. The solubility of chromium in the Fe2B phase causes the replacement
of iron by chromium to form (Fe, Cr) B and (Fe, Cr) 2B on the surface. The diffusion of Cr and
Ni leads to a decrease in the thickness of the boride layer but increases the smoothness of boride
layer/substrate interface. The presence of chromium also promotes the formation of FeB phase,
onto the Fe2B phase. [35]

63
Figure 4.17. XRD pattern obtained for as-received AISI 316 steel.
Figure 4.18. XRD patterns obtained for samples of AISI 316 steel boronized under different
condition.
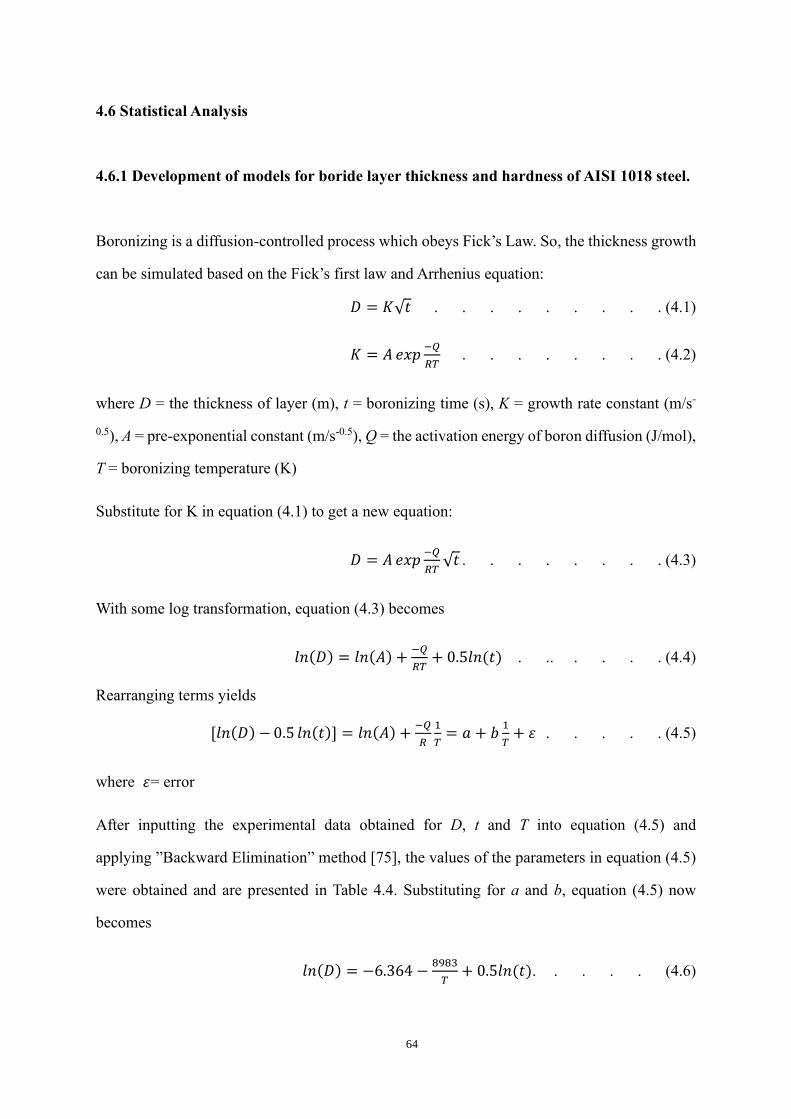
64
4.6 Statistical Analysis
4.6.1 Development of models for boride layer thickness and hardness of AISI 1018 steel.
Boronizing is a diffusion-controlled process which obeys Fick’s Law. So, the thickness growth
can be simulated based on the Fick’s first law and Arrhenius equation:
𝐷 = 𝐾√𝑡 . . . . . . . . . (4.1)
𝐾 = 𝐴 𝑒𝑥𝑝−𝑄
𝑅𝑇 . . . . . . . . (4.2)
where D = the thickness of layer (m), t = boronizing time (s), K = growth rate constant (m/s-
0.5), A = pre-exponential constant (m/s-0.5), Q = the activation energy of boron diffusion (J/mol),
T = boronizing temperature (K)
Substitute for K in equation (4.1) to get a new equation:
𝐷 = 𝐴 𝑒𝑥𝑝−𝑄
𝑅𝑇√𝑡 . . . . . . . . (4.3)
With some log transformation, equation (4.3) becomes
𝑙𝑛(𝐷) = 𝑙𝑛(𝐴) +−𝑄
𝑅𝑇+ 0.5𝑙𝑛(𝑡) . .. . . . . (4.4)
Rearranging terms yields
[𝑙𝑛(𝐷) − 0.5 𝑙𝑛(𝑡)] = 𝑙𝑛(𝐴) +−𝑄
𝑅
1
𝑇= 𝑎 + 𝑏
1
𝑇+ 𝜀 . . . . . (4.5)
where 𝜀= error
After inputting the experimental data obtained for D, t and T into equation (4.5) and
applying ”Backward Elimination” method [75], the values of the parameters in equation (4.5)
were obtained and are presented in Table 4.4. Substituting for a and b, equation (4.5) now
becomes
𝑙𝑛(𝐷) = −6.364 −8983
𝑇+ 0.5𝑙𝑛(𝑡). . . . . (4.6)

65
Table 4.4 also shows the adjusted R squared of equation (4.6) to be equal to 0.95. This is an
indication of a very good fitness for the model. The analysis of variance (ANOVA) data
presented in Table 4.5 also shows that the p value is 0, which indicates that the effect of
boronizing time and temperature on boride layer thickness is significant.
Table 4.4. Values of parameters obtained for the model of AISI 1018 boride layer thickness.
Parameters Unstandardized
B
Coefficients
Std. Error
Standardized
Coefficients
Beta
t Sig. (p-
value)
Constant -6.364 0.618 - -10.302 0.000
1/T -8983.125 723.414 -0.978 -12.418 0.000
Model R R2 Adjusted R2 Std. Error of the
Estimate
0.978 0.957 0.950 0.0645
Table 4.5. Analysis of variance of the effect of boronizing time and temperature on the boride
layer thickness of AISI 1018.
Model Sum of
Squares Df
Mean
Square F
Sig. (p-
value)
Regression 0.642 1 0.642 154.199 0.000
Residual 0.029 7 0.004
Total 0.671 8
The following model was used for fitting the hardness data obtained for boronized AISI 1018
steel specimens:
𝐻𝑉 = 𝑎 + 𝑏𝑡 + 𝑐𝑇 + 𝑑𝑡2 + 𝑒𝑇2 + 𝑓𝑡𝑇 + 𝜀 . . . . (4.7)
where HV = Vickers hardness, t = boronizing time (s), and T = boronizing temperature (K).
After inputting the experimental data HV, t and T into equation (4.7) and applying ”Backward
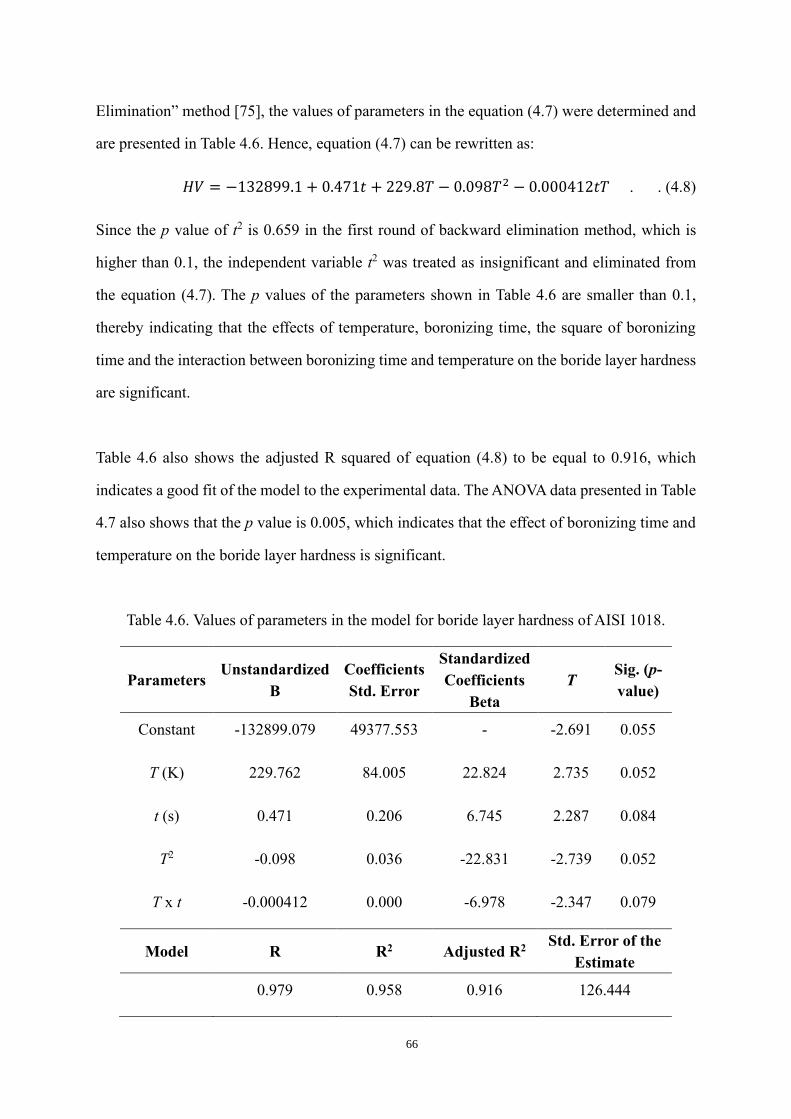
66
Elimination” method [75], the values of parameters in the equation (4.7) were determined and
are presented in Table 4.6. Hence, equation (4.7) can be rewritten as:
𝐻𝑉 = −132899.1 + 0.471𝑡 + 229.8𝑇 − 0.098𝑇2 − 0.000412𝑡𝑇 . . (4.8)
Since the p value of t2 is 0.659 in the first round of backward elimination method, which is
higher than 0.1, the independent variable t2 was treated as insignificant and eliminated from
the equation (4.7). The p values of the parameters shown in Table 4.6 are smaller than 0.1,
thereby indicating that the effects of temperature, boronizing time, the square of boronizing
time and the interaction between boronizing time and temperature on the boride layer hardness
are significant.
Table 4.6 also shows the adjusted R squared of equation (4.8) to be equal to 0.916, which
indicates a good fit of the model to the experimental data. The ANOVA data presented in Table
4.7 also shows that the p value is 0.005, which indicates that the effect of boronizing time and
temperature on the boride layer hardness is significant.
Table 4.6. Values of parameters in the model for boride layer hardness of AISI 1018.
Parameters Unstandardized
B
Coefficients
Std. Error
Standardized
Coefficients
Beta
T Sig. (p-
value)
Constant -132899.079 49377.553 - -2.691 0.055
T (K) 229.762 84.005 22.824 2.735 0.052
t (s) 0.471 0.206 6.745 2.287 0.084
T2 -0.098 0.036 -22.831 -2.739 0.052
T x t -0.000412 0.000 -6.978 -2.347 0.079
Model R R2 Adjusted R2 Std. Error of the
Estimate
0.979 0.958 0.916 126.444
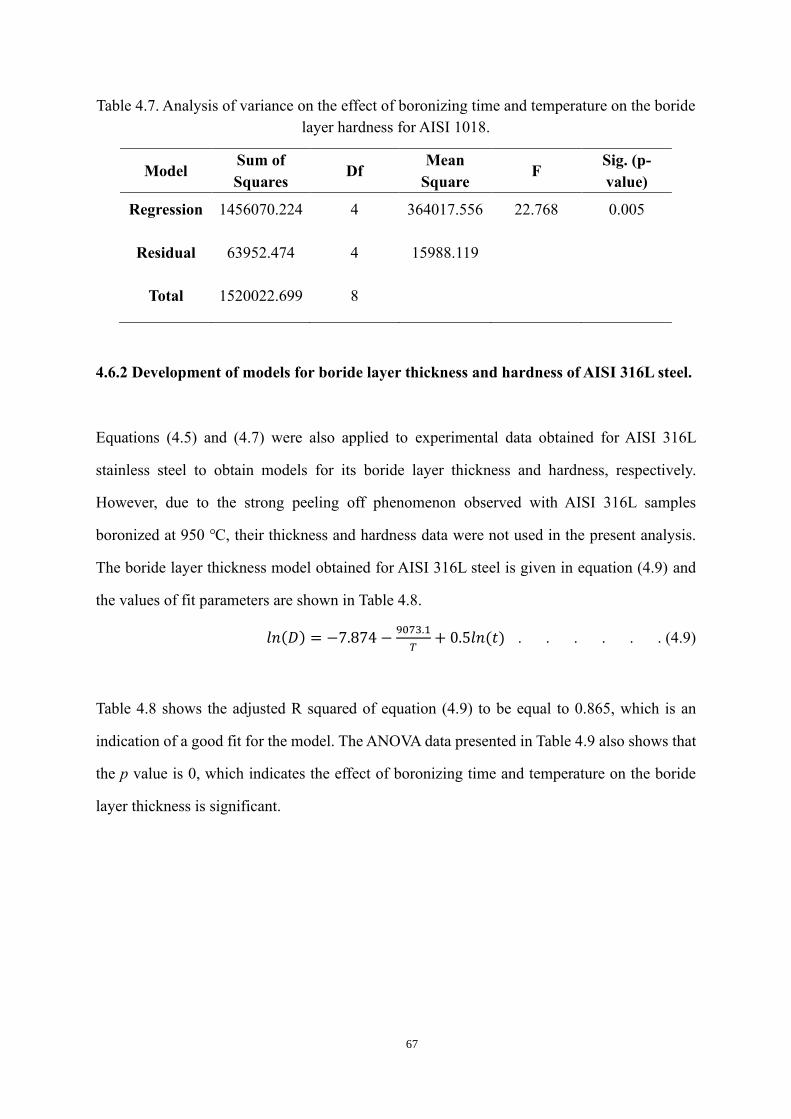
67
Table 4.7. Analysis of variance on the effect of boronizing time and temperature on the boride
layer hardness for AISI 1018.
Model Sum of
Squares Df
Mean
Square F
Sig. (p-
value)
Regression 1456070.224 4 364017.556 22.768 0.005
Residual 63952.474 4 15988.119
Total 1520022.699 8
4.6.2 Development of models for boride layer thickness and hardness of AISI 316L steel.
Equations (4.5) and (4.7) were also applied to experimental data obtained for AISI 316L
stainless steel to obtain models for its boride layer thickness and hardness, respectively.
However, due to the strong peeling off phenomenon observed with AISI 316L samples
boronized at 950 ℃, their thickness and hardness data were not used in the present analysis.
The boride layer thickness model obtained for AISI 316L steel is given in equation (4.9) and
the values of fit parameters are shown in Table 4.8.
𝑙𝑛(𝐷) = −7.874 −9073.1
𝑇+ 0.5𝑙𝑛(𝑡) . . . . . . (4.9)
Table 4.8 shows the adjusted R squared of equation (4.9) to be equal to 0.865, which is an
indication of a good fit for the model. The ANOVA data presented in Table 4.9 also shows that
the p value is 0, which indicates the effect of boronizing time and temperature on the boride
layer thickness is significant.

68
Table 4.8. Values of fit parameters obtained for the model of AISI 316L boride layer
thickness.
Parameters Unstandardized
B
Coefficients
Std. Error
Standardized
Coefficients
Beta
t Sig. (p-
value)
Constant -7.874 1.074 - -7.332 0.000
1/T -9073.056 1257.482 -0.939 -7.215 0.000
Model R R2 Adjusted R2 Std. Error of the
Estimate
0.939 0.881 0.865 0.112
Table 4.9. Analysis of variance on the effect of boronizing time and temperature on boride
layer thickness for AISI 316L.
Model Sum of
Squares Df
Mean
Square F
Sig. (p-
value)
Regression 0.655 1 0.655 52.060 0.000
Residual 0.088 7 0.013
Total 0.743 8
The boride layer hardness model obtained for AISI 316L steel is given in equation (4.10) and
the values of fit parameters are shown in Table 4.10.
𝐻𝑉 = −24402.874 + 0.869𝑡 + 22.217𝑇 − 0.001𝑡𝑇 . . . (4.10)
Since the p value of t2 term of equation (4.7) is 0.458 and that of T2 is 0.477 in the first and
second round of backward elimination method which is high than 0.1, these two independent
variables were treated as insignificant and eliminated from the equation (4.10). The p values of
the parameters shown in Table 4.10 are smaller than 0.1, thereby indicating that the effects of
temperature, boronizing time and the interaction between boronizing time and temperature on
the boride layer hardness are significant.
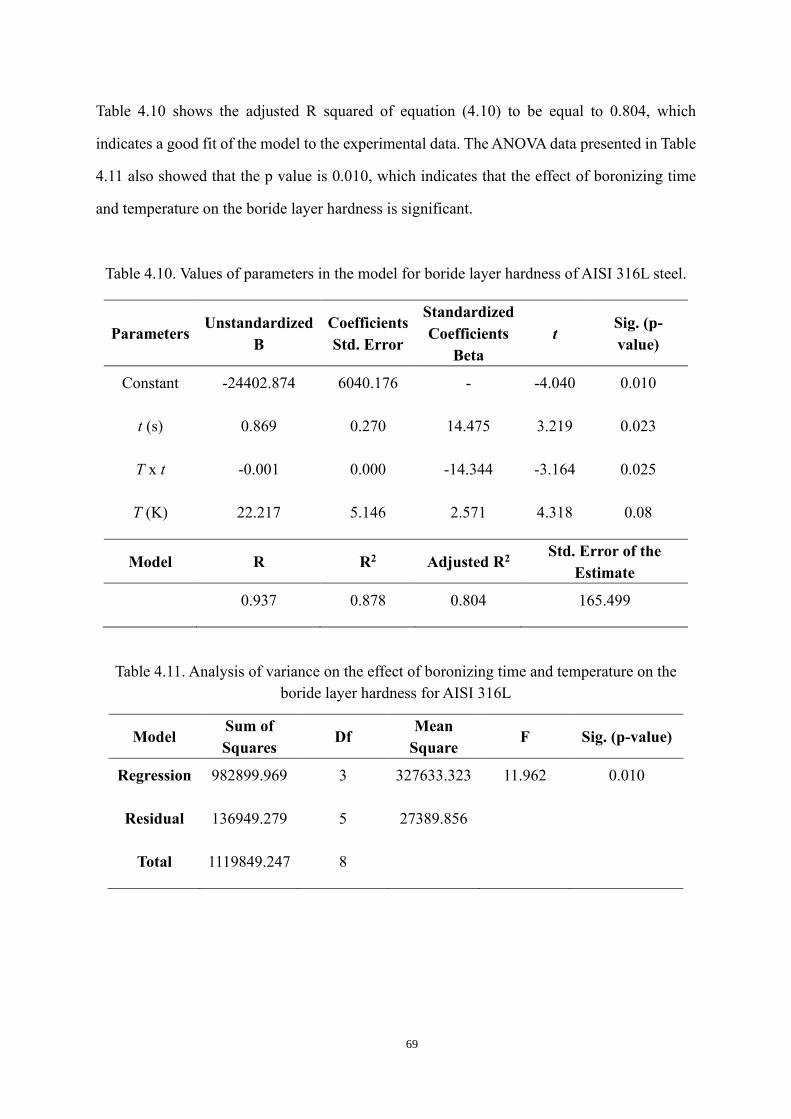
69
Table 4.10 shows the adjusted R squared of equation (4.10) to be equal to 0.804, which
indicates a good fit of the model to the experimental data. The ANOVA data presented in Table
4.11 also showed that the p value is 0.010, which indicates that the effect of boronizing time
and temperature on the boride layer hardness is significant.
Table 4.10. Values of parameters in the model for boride layer hardness of AISI 316L steel.
Parameters Unstandardized
B
Coefficients
Std. Error
Standardized
Coefficients
Beta
t Sig. (p-
value)
Constant -24402.874 6040.176 - -4.040 0.010
t (s) 0.869 0.270 14.475 3.219 0.023
T x t -0.001 0.000 -14.344 -3.164 0.025
T (K) 22.217 5.146 2.571 4.318 0.08
Model R R2 Adjusted R2 Std. Error of the
Estimate
0.937 0.878 0.804 165.499
Table 4.11. Analysis of variance on the effect of boronizing time and temperature on the
boride layer hardness for AISI 316L
Model Sum of
Squares Df
Mean
Square F Sig. (p-value)
Regression 982899.969 3 327633.323 11.962 0.010
Residual 136949.279 5 27389.856
Total 1119849.247 8

70
4.6.3 Optimization of Parameters for AISI 1018 and AISI 316L
The models obtained from previous sections are summarized as follows:
AISI 1018 Steel:
Thickness: 𝑙𝑛(𝐷) = −6.364 −8983.125
𝑇+ 0.5𝑙𝑛(𝑡) . . . . . . . (4.6)
Hardness:𝐻𝑉 = −132899.079 + 0.417𝑡 + 229.762𝑇 − 0.098𝑇2 − 0.000412𝑡𝑇 . (4.8)
AISI 316L Steel:
Thickness:𝑙𝑛(𝐷) = −7.874 −9073.056
𝑇+ 0.5 ∗ 𝑙𝑛(𝑡) . . . . . . . (4.9)
Hardness: 𝐻𝑉 = −24402.874 + 0.869 ∗ 𝑡 + 22.217 ∗ 𝑇 − 0.001 ∗ 𝑡 ∗ 𝑇 . (4.10)
To ensure better corrosion resistance and wear resistance, high surface hardness and large
boride layer thickness are needed. The boronizing time ranged from 4 h to 8 h and the
temperature ranged from 850 ℃ to 950 ℃ for AISI 1018 steel. Increasing boronizing time or
boronizing temperature leads to a thicker boride layer. Differentiating the equation for hardness
(i.e. equation (4.8)) with respect to time and temperature, respectively, gives:
𝑑(𝐻𝑉)
𝑑𝑡= 0.417 − 0.000412𝑇 . . . . . . (4.11)
𝑑(𝐻𝑉)
𝑑𝑇= 229.762 − 0.196𝑇 − 0.000412𝑡 . . . . . (4.12)
The values of 𝑑(𝐻𝑉)
𝑑𝑡 obtained for 850 oC (1123 K), 900 oC (1173 K) and 950 oC (1223 K) are
-0.0457, -0.0663 and -0.0869, respectively. Since all the values are negative (i.e. below zero),
it indicates that boride layer hardness will decrease with increase in boronizing time for a given
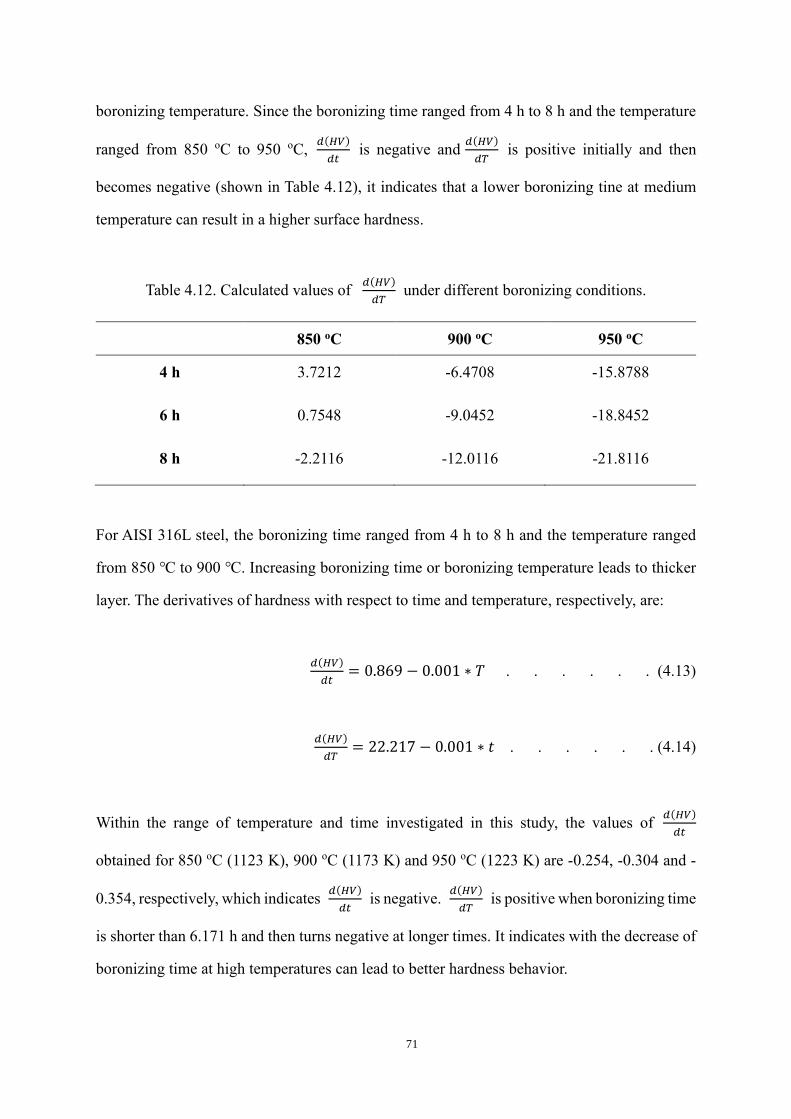
71
boronizing temperature. Since the boronizing time ranged from 4 h to 8 h and the temperature
ranged from 850 oC to 950 oC, 𝑑(𝐻𝑉)
𝑑𝑡 is negative and
𝑑(𝐻𝑉)
𝑑𝑇 is positive initially and then
becomes negative (shown in Table 4.12), it indicates that a lower boronizing tine at medium
temperature can result in a higher surface hardness.
Table 4.12. Calculated values of 𝑑(𝐻𝑉)
𝑑𝑇 under different boronizing conditions.
850 oC 900 oC 950 oC
4 h 3.7212 -6.4708 -15.8788
6 h 0.7548 -9.0452 -18.8452
8 h -2.2116 -12.0116 -21.8116
For AISI 316L steel, the boronizing time ranged from 4 h to 8 h and the temperature ranged
from 850 ℃ to 900 ℃. Increasing boronizing time or boronizing temperature leads to thicker
layer. The derivatives of hardness with respect to time and temperature, respectively, are:
𝑑(𝐻𝑉)
𝑑𝑡= 0.869 − 0.001 ∗ 𝑇 . . . . . . (4.13)
𝑑(𝐻𝑉)
𝑑𝑇= 22.217 − 0.001 ∗ 𝑡 . . . . . . (4.14)
Within the range of temperature and time investigated in this study, the values of 𝑑(𝐻𝑉)
𝑑𝑡
obtained for 850 oC (1123 K), 900 oC (1173 K) and 950 oC (1223 K) are -0.254, -0.304 and -
0.354, respectively, which indicates 𝑑(𝐻𝑉)
𝑑𝑡 is negative.
𝑑(𝐻𝑉)
𝑑𝑇 is positive when boronizing time
is shorter than 6.171 h and then turns negative at longer times. It indicates with the decrease of
boronizing time at high temperatures can lead to better hardness behavior.

72
From the analysis of equations of layer thickness and hardness both for AISI 1018 and AISI
316L steels, boronizing treatment at 900 ℃ for 4 h was found to be the optimal boronizing
condition for both steels. Fichtl [22] also reported that the maximum temperature advised for
hard metals is around 900 ℃ (1173 K) and concluded that the combination of high temperatures
with short treatment time should be preferred to low temperatures with long boronizing time.
He et al. [58] suggested that a high temperature is essential for boronizing for two reasons: (1)
the formation of vacancies in the matrix and (2) promotion of boron atoms to overcome the
energy barrier for diffusion. Kiratli et al. [76] suggested the best boronizing conditions for
steels are 900 – 1000 ℃ temperatures and 4 – 6 h of boronizing time for solid boronizing
method.
4.7 Effect of Boronizing on Dry Wear Properties of AISI 1018 and AISI 316L Steels
4.7.1 AISI 1018 steel
Figure 4.19 shows the friction coefficients obtained for as-received and boronized AISI 1018
steel specimens which were tested using loads of 10, 20 and 30 N under dry sliding condition.
The boronizing treatment was carried out at 900 C for 4 h. The coefficient of friction (COF)
of as-received steel ranges from 0.743 to 1.153, while that of the boronized steel ranges from
0.699 to 1.037. As can be seen from Fig.4.19, the coefficient of friction for both materials
decreases with increasing test load. The boronized steel exhibits lower coefficient of friction
than the non-boronized steel. The decrease in the value of COF with increasing load can be
attributed to the formation of oxide layer on the surface which results from high temperature
due to increase in applied load [7]. Krelling et. al. [73] suggested that increased embedment of
abrasive particles in the contact region due to the high load led to the particles covering the
surface of the wear track leading to a decrease in the COF of the investigated materials. As for
the boronized samples, less abrasive particles were generated during wear so the reduction in
COF with increasing load was lower compared with untreated one.

73
Figure 4.19. Coefficients of friction obtained for as-received and boronized samples of AISI
1018 steel.
The dry wear rates obtained for as-received and boronized specimens of AISI 1018 steel using
different loads are compared in Fig 4.20. The wear rate of boronized specimens is much lower
than that of as-received specimens under the same applied load. In order to determine the type
of wear mechanisms, surfaces of the worn samples were examined using an optical
profilometer and a scanning electron microscope (SEM). Fig 4.21 shows the surface
topographies obtained for as-received and boronized sample using the profilometer. The wear
trace on as-received sample is wider than that on boronized sample. The depth of the wear trace
of the as-received sample is also larger (147.6 m) than that on boronized sample (69.477 m).
There are two reasons for the decreased wear rate obtained for boronized samples: (1) high
surface hardness and (2) lower friction between sample surface and wear counterpart.

74
Figure 4.20. Wear rates obtained for as-received and boronized samples of AISI 1018 steel
under different test loads.
Figure 4.21. Surface topography of the wear trace on (a) as-received and (b) boronized AISI
1018. Test load = 10 N.
Figure 4.22 shows the SEM images of worn surfaces of as-received and boronized samples of
AISI 1018 after testing with a load of 10 N. It is clear that the wear scars are deeper and wider
in the as-received sample compared with the boronized sample. A few plastically deformed

75
regions, spalls and some abrasive scouring can be observed on the worn surface of as-received
sample. This suggests the dominant wear mechanism for untreated AISI 1018 steel is adhesive
wear with slight abrasive wear. Microploughing can be observed on the worn surface of
boronized samples at low load, which suggests that the main wear mechanism for boronized
samples at low load is abrasive wear. Carrera-Espinoza et al. [77] reported that borided sample
exhibited a higher wear resistance than the unborided sample. Atik et al. [53] found that AISI
1010 steel and AISI 1040 steel had better wear strength after boronizing. Selçuk et al. [43]
reported that the borided AISI 1020 steels were extremely resistant to sliding wear.
Figure 4.22. SEM micrographs obtained for worn surfaces of (a) as-received AISI 1018, (b)
boronized AISI 1018, (c) enlarged view of (a), and (d) enlarged view of (b). All tests were
performed at room temperature using a 10 N load.
Figure 4.23 shows the SEM images of worn surfaces of as-received and boronized samples of
AISI 1018 steel tested using a load of 30 N. It can be seen that the wear scars are bigger than

76
those obtained using 10 N. At 30 N load, boronized sample still shows less severe wear damage
compared with untreated sample. The wear mechanism at 30 N is still similar to that at 10 N
for both as-received and boronized samples.
Figure 4.23. SEM micrographs obtained for worn surfaces of (a) as-received AISI 1018, (b)
boronized AISI 1018, (c) enlarged view of (a), and (d) enlarged view of (b). All tests were
performed at room temperature using a 30 N load.
4.7.2 AISI 316L steel
Figure 4.24 shows the friction coefficients obtained for as-received and boronized AISI 316L
steel specimens which were tested using loads of 10, 20 and 30 N under dry sliding wear
condition. As in the case of AISI 1018, the boronizing treatment was carried out at 900 C for
4 h. The coefficient of friction (COF) of as-received steel ranges from 0.658 to 1.054, while
that of the boronized steel ranges from 0.647 to 0.916. As can be seen from the figure, the

77
coefficient of friction for both materials decreases with increasing test load. The boronized steel
exhibits lower coefficients of friction than the non-boronized steel. The reason for the
difference between COF of un-boronized and boronized samples of AISI 316L is similar to that
for AISI 1018 steel.
Figure 4.24. Coefficients of friction obtained for as-received and boronized samples of AISI
316L steel.
The variation in wear rate with test load of as-received and boronized specimens of AISI 316L
steel is shown in Fig 4.25. For both boronized and unboronized specimens, wear rate increased
with increasing test load. However, the wear rate of boronized specimens is much lower than
that of as-received specimens at each test load. Hernández-Sánchez et. al. [2] and Li et. al. [57]
got the same conclusion and reported that a lubricating film was generated during wear of AISI
316L and H3BO3 was detected in the lubricating film. The boron-rich surface phase (FeB) is
heated during sliding wear and boron reacts with oxygen to form boron oxide (B2O3) film on
the exposed surface. This boron oxide film may react with the moisture in the environment to
form a thin H3BO3 film which is considered as a solid lubricant.

78
Figure 4.26 shows the surface topographies obtained for worn as-received and boronized
samples of AISI 316L steel using the optical profilometer mentioned previously. The wear trace
on the as-received sample is wider than that on the boronized sample. The depth of the wear
trace of the as-received sample is also larger (194.147 m) than that on the boronized sample
(82.481 m).
Figure 4.25. Wear rates obtained for as-received and boronized samples of AISI 316L steel
using different test loads.
Figure 4.26. Surface topography of the wear trace created on (a) as-received and (b)
boronized AISI 316L steel. Test load = 10 N.

79
Figure 4.27 shows SEM micrographs obtained for worn surfaces of as-received and boronized
samples of AISI 316L. The test load used was 10 N. It can be seen that the wear scars are deeper
and wider in as-received samples than in boronized samples. The SEM images of as-received
samples show typical characteristics of adhesive wear such as plastic deformation, some light
spots indicating the presence of transferred materials, cracks and abrasion grooves. As for
boronized samples, no crack, plastic deformation or wear debris is observed, only the presence
of slight abrasive grooving is confirmed. The main wear mechanism of boronized AISI 316L
is abrasive wear.
Figure 4.27. SEM micrographs obtained for worn surfaces of (a) as-received AISI 316L, (b)
boronized AISI 316L, (c) enlarged view of (a), and (d) enlarged view of (b). All tests were
performed at room temperature using a 10 N load.
Figure 4.28 shows the SEM images of worn surfaces of as-received and boronized samples of
AISI 316L steel tested using a load of 30 N. At this load, more cracks and wear debris can be

80
observed on the worn surface of the as-received samples compared to when the wear test was
conducted using 10 N (Fig. 4.27). The wear mechanism for the as-received samples is a
combination of adhesive wear and abrasive wear. For the boronized samples, breach of the
boride layer occurred when tested with a 30 N load. As can be seen from Fig. 4.28(d), the
counterface ball wore through the boride layer into the substrate material. Evidence of the
presence of wear debris can also be seen in Fig. 4.28(d). The breach of the boride layer at 30
N load may be due to the fact that the FeB layer on the outer surface of boronized AISI 316L
stainless steel is prone to peeling off. Although the load is only 30 N, the contact area between
wear counterpart and samples is limited leading to high pressure indeed which is shown in
Chapter 3.7.
Figure 4.28. SEM micrographs obtained for worn surfaces of (a) as-received AISI 316L, (b)
boronized AISI 316L, (c) enlarged view of (a), and (d) enlarged view of (b). All tests were
performed at room temperature using a 30 N load.

81
4.8 Effect of Boronizing on Corrosion Properties of AISI 1018 and AISI 316L Steels
4.8.1 AISI 1018 steel
Figures 4.29 and 4.30 show respectively the potentiodynamic polarization plots obtained for
boronized and unboronized (as-received) AISI 1018 steel specimens in saturated KCl and
saturated raw potash solutions at room temperature. The polarization curves show that
boronizing treatment caused the corrosion potential (Ecorr) of the as-received steel tested in both
solutions to be shifted to a more noble corrosion potential. For example, the corrosion potential
of the as-received AISI 1018 steel in saturated KCl shifted from -0.6473 VSCE to -0.5819 VSCE
after boronizing at 900 C for 4 h. For samples tested in saturated raw potash solution, Ecorr of
unboronized AISI steel shifted from -0.7249 VSCE to -0.6789 VSCE after boronizing. These
results indicate that boronized samples are more corrosion resistant than the unboronized
samples.
Figure 4.29. Potentiodynamic polarization plots obtained for as-received and boronized
samples of AISI 1018 steel in saturated KCl solution at room temperature.
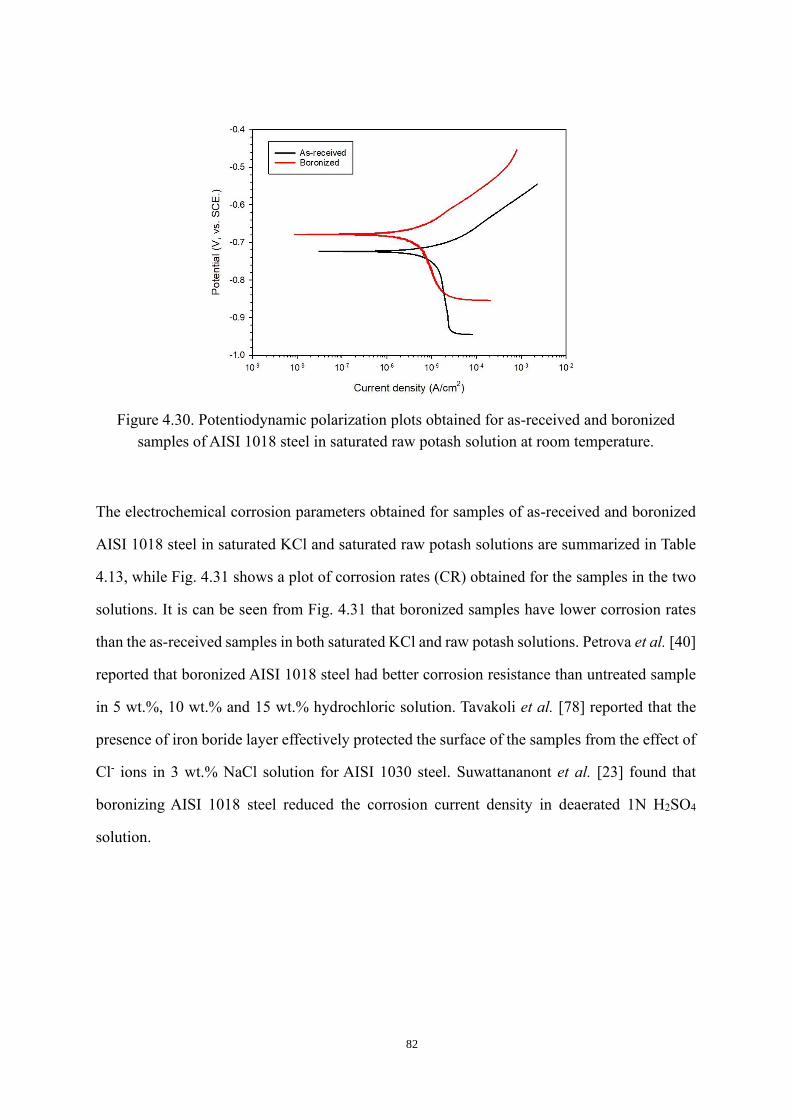
82
Figure 4.30. Potentiodynamic polarization plots obtained for as-received and boronized
samples of AISI 1018 steel in saturated raw potash solution at room temperature.
The electrochemical corrosion parameters obtained for samples of as-received and boronized
AISI 1018 steel in saturated KCl and saturated raw potash solutions are summarized in Table
4.13, while Fig. 4.31 shows a plot of corrosion rates (CR) obtained for the samples in the two
solutions. It is can be seen from Fig. 4.31 that boronized samples have lower corrosion rates
than the as-received samples in both saturated KCl and raw potash solutions. Petrova et al. [40]
reported that boronized AISI 1018 steel had better corrosion resistance than untreated sample
in 5 wt.%, 10 wt.% and 15 wt.% hydrochloric solution. Tavakoli et al. [78] reported that the
presence of iron boride layer effectively protected the surface of the samples from the effect of
Cl- ions in 3 wt.% NaCl solution for AISI 1030 steel. Suwattananont et al. [23] found that
boronizing AISI 1018 steel reduced the corrosion current density in deaerated 1N H2SO4
solution.

83
Figure 4.31. Corrosion rates obtained for as-received and boronized AISI 1018 samples in
different solutions at room temperature.
Table 4.13. Electrochemical corrosion parameters obtained for as-received and boronized
AISI 1018 steel in different solutions.
Condition Ecorr
(V)
icorr
(A/cm2)
Rp
(Ώ)
βa (mV
dec-1)
βc (mV
dec-1)
CR
(mm/year)
As-received,
KCl -0.647 8.17*10-6 3324.8 0.062 -0.805 9.40*10-2
Boronized,
KCl -0.582 4.27*10-6 6857.6 0.088 -0.262 4.91*10-2
As-received,
raw potash -0.725 1.79*10-5 1985.8 0.081 -1.522 2.05*10-1
Boronized, raw
potash -0.679 6.00*10-6 4932.6 0.092 -0.396 6.90*10-2
SEM images of surfaces of as-received and boronized samples of AISI 1018 steel before and
after potentiodynamic polarization test in saturated raw potash brine are presented in Fig. 4.32.

84
For the as-received samples, corrosion pits can be observed on the surface after corrosion test,
while no corrosion pit is observed on the surface of the boronized sample after the polarization
test. This shows that the boride layer in AISI 1018 steel works as an effective protective layer
that improves corrosion resistance to corrosion. Suwattananont et al. [23] got the similar
surface of boronized AISI 1018 after corrosion test.
Figure 4.32. SEM images obtained for as-received and boronized samples of AISI 1018 steel
before and after testing in saturated raw potash solution. (a) as-received AISI 1018 before
testing, (b) as-received AISI 1018 after testing, (c) boronized AISI 1018 before testing and (d)
boronized AISI 1018 after testing.
4.8.2 AISI 316L stainless steel
Figures 4.33 and 4.34 show respectively the potentiodynamic polarization plots obtained for
as-received and boronized samples of AISI 316L steel in saturated KCl and saturated raw
potash solutions at room temperature. It can be seen from the polarization curves that
boronizing treatment did not have the same effect on the corrosion resistance of AISI 316L
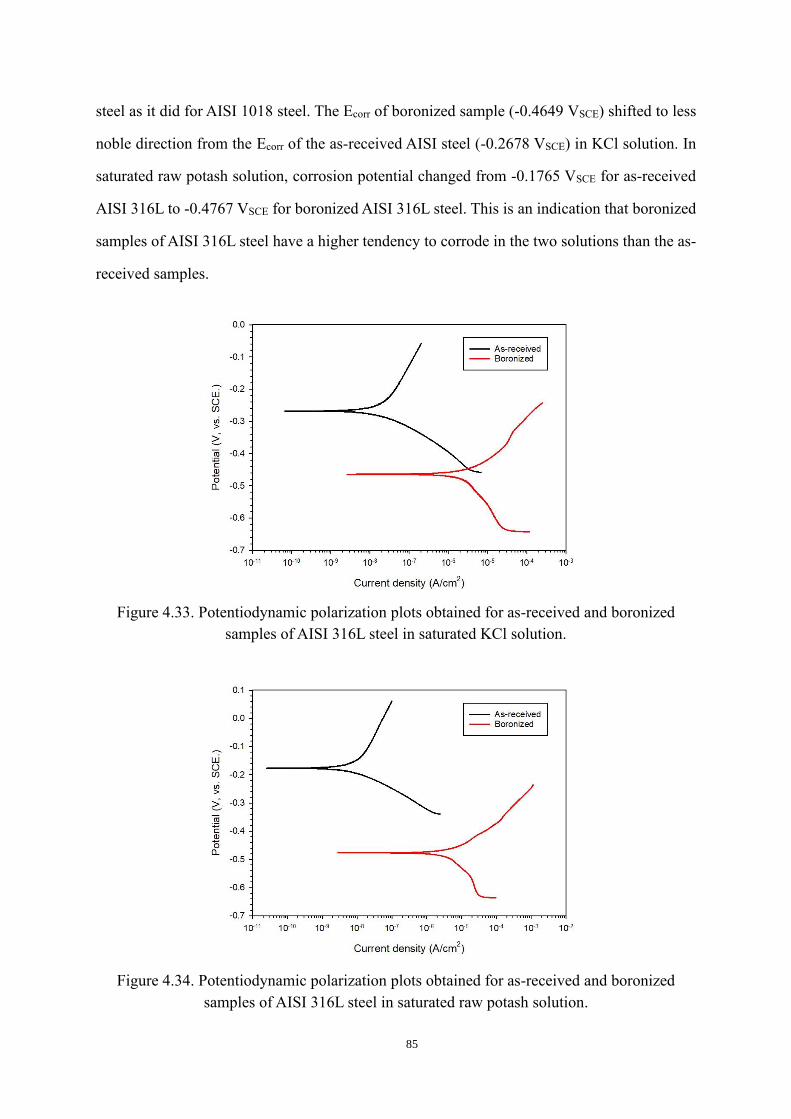
85
steel as it did for AISI 1018 steel. The Ecorr of boronized sample (-0.4649 VSCE) shifted to less
noble direction from the Ecorr of the as-received AISI steel (-0.2678 VSCE) in KCl solution. In
saturated raw potash solution, corrosion potential changed from -0.1765 VSCE for as-received
AISI 316L to -0.4767 VSCE for boronized AISI 316L steel. This is an indication that boronized
samples of AISI 316L steel have a higher tendency to corrode in the two solutions than the as-
received samples.
Figure 4.33. Potentiodynamic polarization plots obtained for as-received and boronized
samples of AISI 316L steel in saturated KCl solution.
Figure 4.34. Potentiodynamic polarization plots obtained for as-received and boronized
samples of AISI 316L steel in saturated raw potash solution.

86
The electrochemical corrosion parameters obtained for samples of as-received and boronized
AISI 316L steel in saturated KCl and saturated raw potash solutions are summarized in Table
4.14, while Fig. 4.35 shows a plot of corrosion rates (CR) obtained for the samples in the two
solutions. It is can be seen from Fig. 4.35 that boronized samples have higher corrosion rate
than the as-received samples in both saturated KCl and raw potash solutions. The high
corrosion rate observed in boronized samples indicates that boronizing is not a good method to
enhance the corrosion properties AISI 316L austenitic stainless steel. Stainless steels derive
their corrosion resistance from high chromium content. Chromium forms a tenacious
chromium oxide (Cr2O3) layer on the surface of stainless steels, which protects them from
corrosion attack. However, as shown in Section 4.4, during boronizing some of the alloying
elements contained in AISI 316L such as Cr and Ni reacted with boron to form the
corresponding borides such as CrB, Cr2B, NiB, Ni2B and Ni3B. This lowers the amount of
chromium available in solid solution to keep the steel “stainless” in a corrosive environment.
Besides, the boride layer in AISI 316L stainless steel has two iron boride phases (FeB and Fe2B)
with different mechanical and physical properties. Although the boride layer is usually compact,
it has some pits or pores on the surface. The FeB phase is also prone to spalling, thereby
exposing the inner region of sample to the electrolyte. During the corrosion in both KCl and
raw potash solutions, aggressive chloride ions penetrated the boride layer through these surface
defects, causing the exposed areas to experience anodic dissolution extending laterally along
the interface between the boride layer and the steel substrate. The boronized samples suffered
from crevice corrosion and galvanic corrosion between FeB and Fe2B layer leading to higher
corrosion rate [47][4][61].

87
Figure 4.35. Corrosion rates obtained for as-received and boronized AISI 316L samples in
different solutions at room temperature.
Table 4.14. Electrochemical corrosion parameters obtained for as-received and boronized
AISI 316L steel in different solutions at room temperature.
Condition Ecorr
(V)
icorr
(A/cm2)
Rp
(Ώ)
βa (mV
dec-1)
βc (mV
dec-1)
CR
(mm/year)
As-received,
KCl -0.268 2.25*10-8 1.01*106 0.217 -0.076 2.27*10-4
Boronized,
KCl -0.465 5.68*10-6 6.64*103 0.124 -0.301 5.72*10-2
As-received,
raw potash -0.177 1.06*10-8 2.35*106 0.238 -0.076 1.07*10-4
Boronized, raw
potash -0.477 5.93*10-6 3.66*103 0.084 -0.176 5.97*10-2

88
Figure 4.36 shows the SEM images obtained for untreated and boronized samples of AISI 316L
steel before and after potentiodynamic polarization test in saturated raw potash solution. It can
be seen from Fig. 4.36(b) that there is no corrosion pits or corrosion-induced defects on the
surface of as-received sample after polarization test. For boronized sample (Fig. 4.36(d)), some
craters appear on the surface after electrochemical corrosion test. The occurrence of surface
defects like pits can lead to the pitting corrosion, crevice corrosion and galvanic corrosion
which are the possible mechanism for worse corrosion resistance of boronized AISI 316L steel.
Mejía-Caballero et al. [50] also reported the presence of pits and even some cracks on the
surface of boronized AISI 316L steel after 10 days of immersion in simulated body fluid
solution (SBFS). Kayali et al. [79] provided the similar SEM image of boronized AISI 316L
sample after the 1 hour immersion in body fluid solution (SBFS).
Figure 4.36. SEM images obtained for as-received and boronized samples of AISI 316L steel
before and after potentiodynamic polarization in saturated raw potash solution. (a) as-received
AISI 316L before testing, (b) as-received AISI 316L after testing, (c) boronized AISI 316L
before testing and (d) boronized AISI 316L after testing.

89
4.9 Erosion-Corrosion of As-received and Boronized AISI 1018 Steel Elbows
After 48-hour exposure to erosion-corrosion in saturated raw potash slurry containing sand
particles, the weight loss of each elbow was determined. The erosion-corrosion rate (ER) was
calculated using equation (4.15).
𝐸𝑅 =𝑎𝑣𝑒𝑟𝑎𝑔𝑒 𝑤𝑒𝑖𝑔ℎ𝑡 𝑙𝑜𝑠𝑠
𝑡𝑜𝑡𝑎𝑙 𝑖𝑛𝑡𝑒𝑟𝑛𝑎𝑙 𝑠𝑢𝑟𝑓𝑎𝑐𝑒 𝑎𝑟𝑒𝑎∗𝑑𝑢𝑟𝑎𝑡𝑖𝑜𝑛 . . . . . . . (4.15)
The erosion-corrosion rates of the as-received and boronized AISI 1018 elbows are presented
in Fig 4.37. It is seen that with the higher particle concentration or higher flow rate, the erosion
rate increased both for as-received and boronized samples. The higher impact momentum of
the particles on the internal surface of elbows at higher hydrodynamic intensity (velocity and
particle concentration) is considered as the reason for this observation.
Figure 4.37. Variation of erosion-corrosion rate of as-received and boronized AISI 1018
elbows with flow velocity and solid concentration.
It can be observed that boronized elbows have lower erosion-corrosion rate compared to the
unboronized elbows at high sand particle concentration, but higher erosion-corrosion rate for

90
low sand concentration (10 wt%). To find a possible reason for this behaviour, pure erosion
experiment was done for the test conditions 2.5 m/s, 10 wt% and 4 m/s, 10 wt%. The tank was
sealed perfectly and nitrogen gas was introduced into the tank to purge the oxygen in the
solution and reduce corrosion to a negligible level. The pure erosion rates obtained for these
two conditions are shown in Fig 4.38.
Figure 4.38. Variation of pure erosion rate of as-received and boronized AISI 1018 elbows
with flow velocity and solid concentration.
From Fig. 4.38, it is concluded that the boride layer on the internal surface of the elbows shows
similar behavior as in the sliding wear test. It provided a remarkable improvement in resistance
to erosive wear. A plausible reason for the observed low erosion-corrosion resistance at low
particle concentration is the synergy effect between erosion and corrosion, which is the
combination of the change in erosion contribution due to corrosion and the change in corrosion
contribution due to erosion. Since the test samples were 90 ° elbows, most of the sand particles
in the solution impacted the surface of the elbows at an angle ranging from 20o to 80o, which
indicates the erosion damage is ductile erosion in which the elbow material is removed by
either a cutting mechanism or an extrusion mechanism [80]. Particle flux could be introduced
to explain the reason, which is the number of particles crossing an imaginary unit area from

91
one side, and it depends on the velocity and concentration of particles. Under high particle
fluxes, the oxide film that usually forms on the surface of the elbow does not have enough time
to form and provide protection to the substrate; the material removal mechanism is mainly by
pure erosion of the metal. However, under low particle fluxes, the oxide has sufficient time to
form and stabilize. In the meantime, it is hard for impacting particles without sufficient energy
to damage the oxide film, and corrosion becomes the major mechanism for material wastage.
As such, at low particle concentration, corrosion is the dominant material wastage mechanism
and can be enhanced by erosion.
Fig 4.39 shows the SEM images of the internal surfaces of as-received and boronized elbow
after exposure to erosion-corrosion at a flow velocity of 2.5 m/s and 10 wt.% and 50 wt.%
particle concentration. At 10 wt.% particle concentration, horse-shoe shaped craters with sharp
lips appear on the surface of untreated samples (Fig. 4.39a), which indicates cutting by sand
particles. For the boronized elbows under the same test condition (Fig. 4.39c), the surface is
rougher than that of as-received samples. It is the crater that makes the inner surface rougher,
and the craters are generated due to erosion corrosion. At 50 wt.% sand concentration, deep
pores, strong cracks and corrosion products are found on the surface of nonboronized elbows
(Fig. 4.39b). In boronized elbows (Fig. 4.39d), the worn surfaces are characterized by deep pits,
cracks and broken particles (within the pits).

92
Figure 4.39. SEM micrographs obtained from the middle region of as-received and boronized
AISI 1018 steel elbows subjected to erosion-corrosion in potash-sand particle slurry flowing
at 2.5 m/s. (a) 10 wt.% sand loading, as-received, (b) 50 wt.% sand loading, as-received, (c)
10 wt.% sand loading, boronized, and (d) 50 wt.% sand loading, boronized.
Figure 4.40 shows SEM micrographs obtained for internal surfaces of as-received and
boronized AISI 108 steel elbows after exposure to erosion-corrosion at a flow velocity of 4 m/s
and 10 wt.% and 50 wt.% particle concentration. At 10 wt.% particle concentration, the worn
surface of the unboronized elbow (Fig. 4.40a) is smoother that what was obtained for a flow
velocity of 2.5 m/s (see Fig. 4.39a). The worn surfaces of the boronized elbows (Fig. 4.40c)
contain deep cavities with some broken particles. The cavities may have resulted from brittle
failure of the boride layer due to impingement of high velocity sand particles. At 50 wt.% sand
particle concentration, shallow horse-shoe shaped scars decorate the worn surfaces of the as-
received elbows (Fig. 4.40b). The worn surfaces of the boronized elbows at 50 wt.% sand
concentration are smoother and contain shallower cavities than at 10 wt.% sand concentration.

93
Figure 4.40. SEM micrographs obtained from the middle region of as-received and boronized
AISI 1018 steel elbows subjected to erosion-corrosion in potash-sand particle slurry flowing at
4.0 m/s. (a) 10 wt.% sand loading, as-received, (b) 50 wt.% sand loading, as-received, (c) 10
wt.% sand loading, boronized, and (d) 50 wt.% sand loading, boronized.
Figure 4.41 shows the SEM images obtained from the internal surfaces of as-received and
boronized elbows after exposure to pure erosion in a slurry containing 10 wt.% sand particles
at 2.5 m/s and 4 m/se. Under 2.5 m/s flow velocity test condition, there is significantly less
erosive damage on the surface of unboronized elbow (Fig. 4.41a) than was obtained at the same
speed in the erosion-corrosion test (Fig. 4.39a). Only little surface cracks are found. For the
boronized elbow (Fig. 4.41c), only small surface lacerations can be seen in comparison with
large cavities seen in Fig. 4.39c when boronized elbows were subjected to erosion-corrosion at
the same speed and sand particle concentration. Under 4 m/s flow velocity conditions, the wear
surfaces of both unboronized (Fig. 4.41b) and boronized (Fig. 4.41d) elbows appear polished,
with no big craters or cavities as were obtained in the erosion-corrosion test (see Figs 4.39b
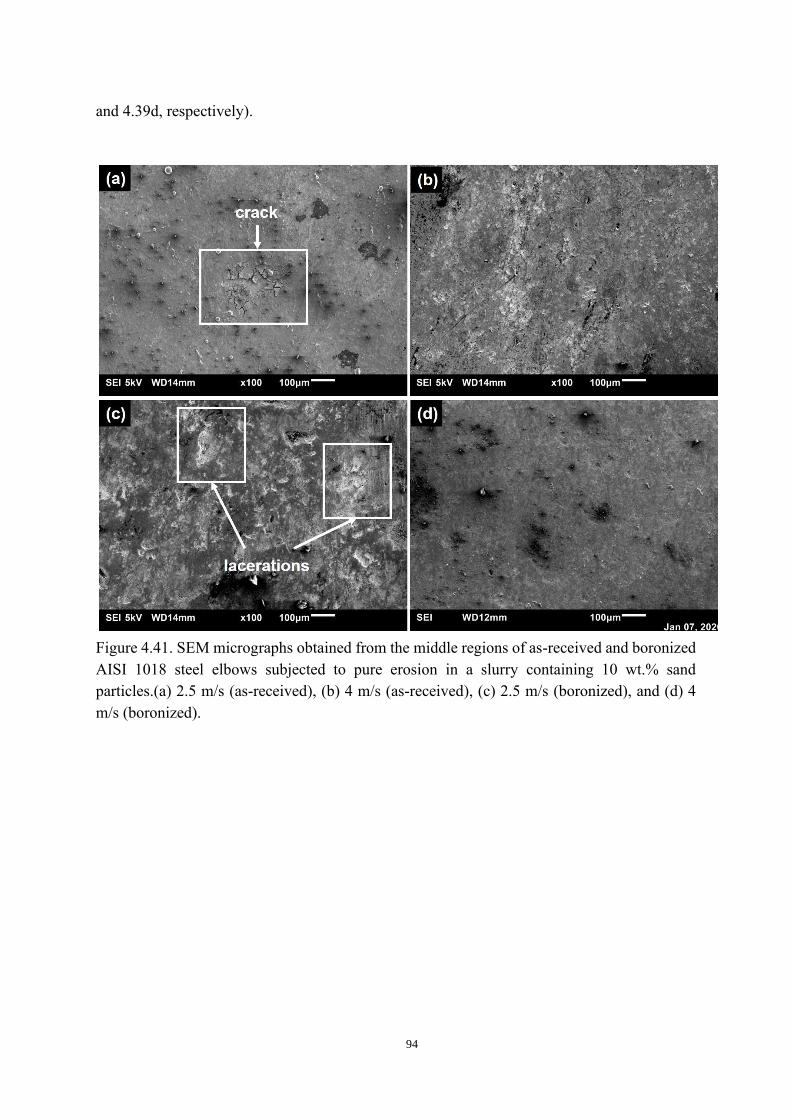
94
and 4.39d, respectively).
Figure 4.41. SEM micrographs obtained from the middle regions of as-received and boronized
AISI 1018 steel elbows subjected to pure erosion in a slurry containing 10 wt.% sand
particles.(a) 2.5 m/s (as-received), (b) 4 m/s (as-received), (c) 2.5 m/s (boronized), and (d) 4
m/s (boronized).

95
CHAPTER 5
SUMMARY, CONCLUSIONS AND RECOMMENDATIONS FOR FUTURE WORK
5.1 Summary and Conclusions
The effects of boronizing treatment on the wear, corrosion, erosion-corrosion behavior of AISI
1018 low carbon steel and AISI 316L austenitic stainless steel were investigated. The
boronizing heat treatment involved exposing surfaces of flat specimens and inside walls of 90°
elbows to Ekabor2 boronizing powder at elevated temperatures in an inert atmosphere. The as-
received and boronized specimens of the two steels were characterized using optical
microscope, optical profilometer, scanning electron microscope, and X-ray diffraction. Their
hardness, wear, corrosion, and erosion-corrosion properties were determined. The following
conclusions are drawn from this research:
1. The dimensions of AISI 1018 and AISI 316L steel specimens studied were practically
unaffected by boronizing under the test conditions used in this study.
2. The boride layer that formed on the surface of AISI 316L steel consisted of iron borides
(FeB and Fe2B), chromium borides (CrB and Cr2B) and nickel borides (NiB, Ni2B and
Ni3B) under all the boronizing conditions used in this study. On the other hand, FeB and
Fe2B formed on the surface of AISI 1018 steel when boronized at 850 °C for 4 h. When
boronized at 900 °C and 950 °C for 4 h, 6 h and 8 h, only the Fe2B phase formed.
3. The thickness and hardness of boride layers developed on AISI 1018 and AISI 316L steels
varied with boronizing temperature and time. The optimum thickness and hardness values
were obtained for both steels at 900 °C for 4 h.
4. Boronizing significantly improved the dry wear resistance of AISI 1018 and AISI 316L

96
steels.
5. The formation of the boride layer improved the corrosion resistance of AISI 1018 steel in
saturated KCl and saturated raw potash solutions by serving as an effective protective layer.
However, it decreased that of AISI 316L due to the high porosity of the boride layer.
6. Boronizing treatment improved the resistance of AISI 1018 steel elbows to erosion-
corrosion in saturated raw potash slurry containing sand particles, especially high particle
concentration and high flow velocity.
7. From these research findings, it is proposed that boronizing treatment be considered a
potentially useful method for corrosion and sliding protection of carbon steel used in potash
processing plants.
5.2 Future work
In the present study, it has been established shown that boronizing can improve the resistance
to wear only in dry conditions. Since wear in the most service environments occur in humid
environments or aqueous solutions, it is important to investigate wet test behavior of the
boronized steels. The chemical compositions of the corrosion products observed in this study
are still unknown. Therefore, the following future works are recommended:
1. Conduct wear tests in lubricated conditions to provide an understanding of both the wear
behavior and wear mechanism for the boronized surfaces in wet environments.
2. Conduct energy-dispersive X-ray spectroscopy (EDS) or use any other suitable analytical
tools to study the chemical composition of the corrosion products formed on boride layers.

97
3. Use electrochemical impedance spectroscopy (EIS) method to describe the corrosion
process in the boride layers and describe the influence of porosity of the boride layer on its
corrosion resistance.
4. Conduct pure erosion experiments also under the high sand concentration (50 wt%)
condition and compare with erosion-corrosion to confirm the synergy effect and the main
mechanism under this condition.

98
REFERENCES
[1] G. Stergioudis, “Formation of boride layers on steel substrates,” Cryst. Res. Technol.,
vol. 41, no. 10, pp. 1002–1004, 2006.
[2] E. Hernández-Sánchez, J. Velázquez, J. Castrejón-Flores, A. Chino-Ulloa, I. Torres
Avila, R. Carrera-Espinoza, J. Yescas-Hernández, and C. Orozco-Alvarez,
“Tribological behavior of borided AISI 316L steel with reduced friction coefficient
and enhanced wear resistance,” Materials Transactions., vol. 60, no. 1, pp. 156–164,
2019.
[3] Z. Pala, R. Mušálek, J. Kyncl, P. Harcuba, J. Stráský, K. Kolařík, N. Ganev, and J.
Matějíček, “Effect of boriding time on microstructure and residual stresses in borided
highly alloyed X210CR12 steel,” Key Eng. Mater., vol. 606, no. March, pp. 27–30,
2014.
[4] I. Campos, M. Palomar, A. Amador, R. Ganem, and J. Martinez, “Evaluation of the
corrosion resistance of iron boride coatings obtained by paste boriding process,” Surf.
Coatings Technol., vol. 201, no. 6, pp. 2438–2442, 2006.
[5] V. I. Dybkov, V. R. Sidorko, L. V. Goncharuk, V. G. Khoruzha, and A. V. Samelyuk,
“Microstructure, growth kinetics, and abrasive wear resistance of boride layers on Fe-
30% Cr alloy,” Powder Metall. Met. Ceram., vol. 51, no. 9–10, pp. 518–530, 2013.
[6] C. Li, B. Shen, G. Li, and C. Yang, “Effect of boronizing temperature and time on
microstructure and abrasion wear resistance of Cr12Mn2V2 high chromium cast iron,”
Surf. Coatings Technol., vol. 202, no. 24, pp. 5882–5886, 2008.
[7] U. Bozali, M. Yasar, M. Cetin, V. Veli Cay, and A. Gunen, “Investigation on wear
mechanisms of boronized AISI 4140 steel,” J. Balk. Tribol. Assoc., vol. 23, no. 1, pp.
1–15, 2017.

99
[8] M. Peruzzo, F. L. Serafini, M. F. C. Ordoñez, R. M. Souza, and M. C. M. Farias,
“Reciprocating sliding wear of the sintered 316L stainless steel with boron additions,”
Wear, vol. 423, no. September 2018, pp. 108–118, 2019.
[9] G. Al-Marahleh and S. M. Fayyad, “Solving Erosion and Corrosion Problems in
Jordanian-Potash Company,” Journal of Environment and Earth Science, vol. 3, no. 1,
pp. 139–152, 2013.
[10] M. G. Fontana, “Eight Forms of Corrosion,” corrosion-doctors.org, 1967. [Online].
Available: https://corrosion-doctors.org/Corrosion-History/Eight.htm. Accessed 1st
May 2020.
[11] M. Amra, K. Ranjbar, and S. A. Hosseini, “Microstructure and wear performance of
Al5083/CeO2/SiC mono and hybrid surface composites fabricated by friction stir
processing,” Trans. Nonferrous Met. Soc. China (English Ed)., vol. 28, no. 5, pp. 866–
878, 2018.
[12] K. H. Z. Gahr, Ed., “Chapter 1 Introduction,” in Microstructure and Wear of
Materials, vol. 10, Elsevier, New York, 1987, pp. 1–7.
[13] M. Matsumura, Y. Oka, H. Hiura, and M. Yano, “The role of passivating film in
austenitic stainless steel,” ISIJ Int., vol. 31, no. 2, pp. 168–176, 1991.
[14] Canpotex. Limited, “Where is potash located?,” Canpotex.com, 2020. [Online].
Available: https://www.canpotex.com/our-potash/where-potash-located. Accessed 1st
May 2020.
[15] Westernpotash.Corp, “Saskatchewan potash - Western potash,” Western Potash.com,
2018. [Online]. Available: https://www.westernpotash.com/about-potash/prairie-
potash. Accessed 1st May 2020.
[16] totalmateria.com, “Classification of Carbon and Low-Alloy Steels,” Key to Metals AG,
2001. [Online]. Available: http://www.totalmateria.com/articles/Art62.htm. Accessed
1st May 2020.

100
[17] J.R. Davis, “Introduction to Stainless Steels,” in Alloy Dig. Sourceb. Stainl. Steels, p.
1, ASM international, 2000.
[18] O. Ozdemir, M. A. Omar, M. Usta, S. Zeytin, C. Bindal, and A. H. Ucisik, “An
investigation on boriding kinetics of AISI 316 stainless steel,” Vacuum, vol. 83, no. 1,
pp. 175-179, 2008.
[19] I. Campos, M. Palomar-Pardavé, A. Amador, C. VillaVelázquez, and J. Hadad,
“Corrosion behavior of boride layers evaluated by the EIS technique,” Appl. Surf. Sci.,
vol. 253, no. 23, pp. 9061-9066, 2007.
[20] I. Özbek, B. A. Konduk, C. Bindal, and A. H. Ucisik, “Characterization of borided
AISI 316L stainless steel implant,” Vacuum, vol. 65, no. 3-4, pp. 521-525, 2002.
[21] A. Jourani and S. Bouvier, “Friction and wear mechanisms of 316L stainless steel in
dry sliding contact: Effect of abrasive particle size,” Tribol. Trans., vol. 58, no. 1, pp.
131–139, 2015.
[22] W. Fichtl, “Boronizing and its practical applications,” Mater. Des., vol. 2, no. 6, pp.
276-286, 1981.
[23] J. L. an. Suwattananont, N. R. S. Petrova, R. S., Zunino and D. . Schmidt III, “Surface
treatment with boron for corrosion protection,” Tri-Service Corros. Conf., Orlando,
FL, pp. 1-11, November 2005.
[24] F. A. P. Fernandes, S. C. Heck, L.C. Casteletti, C. K . N. de Oliveira, A. Lombardi-
Neto, and G. E. Totten “Pack and salt bath diffusion treatments on steels", Heat
Treat. Prog., vol. 9, no. 5, September, pp. 49-52, 2009.
[25] K. Genel, I. Ozbek, and C. Bindal, “Kinetics of boriding of AISI W1 steel,” Mater.
Sci. Eng. A, vol. 347, no. 1-2, pp. 311-314, 2003.
[26] O. K. von Goldbeck, “Iron-Boron Fe-B,” in IRON-Binary Phase Diagrams, Berlin,
Heidelberg: Springer Berlin Heidelberg, 1982, pp. 15-18.

101
[27] B. V. Babushkin and B. Z. Polyakov, “Residual stresses in steel after boriding from
melts,” Met. Sci. Heat Treat., vol. 15, no. 7, pp. 577–580, 1973.
[28] A. Sinha, "Boriding (Boronizing)," in Heat Treating (Section: Surface Hardening of
Steel), vol. 4. ASM Handbook, 1999, pp. 437–447.
[29] K. Kostyk, “Development of innovative method of steel surface hardening by a
combined chemical-thermal treatment,” EUREKA Phys. Eng., vol. 6, no. 6, pp. 46–52,
2016.
[30] A. Çalik, “Effect of powder particle size on the mechanical properties of boronized en
H320 la steel sheets,” ISIJ Int., vol. 53, no. 1, pp. 160–164, 2013.
[31] I. Gunes, S. Ulker, and S. Taktak, “Plasma paste boronizing of AISI 8620, 52100 and
440C steels,” Mater. Des., vol. 32, no. 4, pp. 2380–2386, 2011.
[32] A. A. Joshi and S. S. Hosmani, “Pack-boronizing of AISI 4140 steel: Boronizing
mechanism and the role of container design,” Mater. Manuf. Process., vol. 29, no. 9,
pp. 1062–1072, 2014.
[33] T. W. Spence and M. M. Makhlouf, “Characterization of the operative mechanism in
potassium fluoborate activated pack boriding of steels,” J. Mater. Process. Technol.,
vol. 168, no. 1, pp. 127–136, 2005.
[34] I. Gunes, “Kinetics of borided gear steels,” Sadhana - Acad. Proc. Eng. Sci., vol. 38,
no. 3, pp. 527–541, 2013.
[35] E. E. V. Cárdenas, R. Lewis, A. Pérez, J. Ponce, F. Pinal, M. Domínguez, and E.
Arreola, “Characterization and wear performance of boride phases over tool steel
substrates,” Adv. Mech. Eng., vol. 8, no. 2, pp. 1–10, 2016.
[36] M. Carbucicchio and G. Palombarini, “Effects of alloying elements on the growth of
iron boride coatings,” J. Mater. Sci. Lett., vol. 6, no. 10, pp. 1147–1149, 1987.
[37] G. Rodríguez-Castro, I. Campos-Silva, E. Chávez-Gutiérrez, J. Martínez-Trinidad, E.
102
Hernández-Sánchez, and A. Torres-Hernández, “Mechanical properties of FeB and
Fe2B layers estimated by Berkovich nanoindentation on tool borided steel,” Surf.
Coatings Technol., vol. 215, pp. 291–299, 2013.
[38] G. Ç. Efe, M. Ipek, I. Özbek, and C. Bindal, “Kinetics of borided 31CrMoV9 and
34CrAlNi7 steels,” Mater. Charact., vol. 59, no. 1, pp. 23–31, 2008.
[39] P. Goeuriot, F. Thevenot, and J. H. Driver, “Surface treatment of steels: Borudif, a new
boriding process,” Thin Solid Films, vol. 78, no. 1, pp. 67–76, 1981.
[40] R. S. Petrova and N. Suwattananont, “Surface modification of ferrous alloys with
boron,” J. Electron. Mater., vol. 34, no. 5, pp. 575–582, 2005.
[41] D. N. Tsipas and J. Rus, “Boronizing of alloy steels,” J. Mater. Sci. Lett., vol. 6, no. 1,
pp. 118–120, 1987.
[42] S. Taktak, “Some mechanical properties of borided AISI H13 and 304 steels,” Mater.
Des., vol. 28, no. 6, pp. 1836–1843, 2007.
[43] B. Selçuk, R. Ipek, M. B. Karamiş, and V. Kuzucu, “An investigation on surface
properties of treated low carbon and alloyed steels (bonding and carburizing),” J.
Mater. Process. Technol., vol. 103, no. 2, pp. 310–317, 2000.
[44] A. Calik, Y. Gencer, M. Tarakci, K. O. Gunduz, and A. E. Gulec, “Boriding of
equiatomic Fe-Mn binary alloy,” Acta Phys. Pol. A, vol. 123, no. 2, pp. 449–452,
2013.
[45] J. H. Mohmmed, “Wear rate and hardness of boride low carbon steel,” Engineering
Journal., vol. 21, no. 10, pp. 90–99, 2015.
[46] H. Wang, Y. Zhao, X. Yuan, K. Chen, and R. Xu, “Effects of boronizing treatment on
corrosion resistance of 65Mn steel in two acid mediums,” Phys. Procedia, vol. 50, no.
1, pp. 124–130, 2013.
[47] I. Mejía-Caballero, J. Martínez-Trinidad, M. Palomar-Pardavé, M. Romero-Romo, H.

103
Herrera-Hernández, O. Herrera-Soria, and I. Campos Silva, “Electrochemical
evaluation of corrosion on borided and non-borided steels immersed in 1 M HCl
Solution,” J. Mater. Eng. Perform., vol. 23, no. 8, pp. 2809–2818, 2014.
[48] D. N. Tsipas, H. Noguera, and J. Rus, “Corrosion behaviour of boronized low carbon
steel,” Mater. Chem. Phys., vol. 18, no. 3, pp. 295–303, 1987.
[49] N. Lin, P. Zhou, H. Zhou, J. Guo, H. Zhang, J. Zou, Y. Ma, P. Han, and B. Tang,
“Pack boronizing of P110 oil casing tube steel to combat wear and corrosion,” Int. J.
Electrochem. Sci., vol. 10, no. 3, pp. 2694–2706, 2015.
[50] I. Mejía-Caballero, M. Palomar-Pardavé, J. Martínez Trinidad, M. Romero-Romo, R.
Pérez Pasten-Borja, L. Lartundo-Rojas, C. López-García, and I. Campos-Silva,
“Corrosion behavior of AISI 316L borided and non-borided steels immersed in a
simulated body fluid solution,” Surf. Coatings Technol., vol. 280, pp. 384–395, 2015.
[51] M. H. Mohamad Basir, B. Abdullah, and S. K. Alias, “Wear Properties of Paste
Boronized 316 Stainless Steel Before and After Shot Blasting Process,” Sci. Res. J.,
vol. 11, no. 2, p. 75, 2014.
[52] D. Xu, X. Xu, Z. Su, J. An, and Y. Lu, “Mechanical properties, wear, and corrosion of
boronized N80 tube steel,” Mater. Sci., vol. 48, no. 1, pp. 106–112, 2012.
[53] E. Atik, U. Yunker, and C. Meriç, “The effects of conventional heat treatment and
boronizing on abrasive wear and corrosion of SAE 1010, SAE 1040, D2 and 304
steels,” Tribol. Int., vol. 36, no. 3, pp. 155–161, 2003.
[54] M. Khenifer, O. Allaoui, and M. B. Taouti, “Effect of boronizing on the oxidation
resistance of 316L stainless steel,” Acta Phys. Pol. A, vol. 132, no. 3, pp. 518–520,
2017.
[55] N. Suwattananont and R. S. Petrova, “Oxidation kinetics of boronized low carbon steel
AISI 1018,” Oxid. Met., vol. 70, no. 5–6, pp. 307–315, 2008.

104
[56] R. N. Bharagava and P. Chowdhary, Emerging and Eco-Friendly Approaches for
Waste Management, Springer Singapore, July 2018. Web.
[57] K. Li, Z. Huang, Y. Jian, T. Min, X. Lou, and S. Wang, “Friction and wear behavior of
single-phase Fe2B bulk under dry sliding condition,” Tribol. Trans., vol. 61, no. 3, pp.
513–521, 2018.
[58] X. He, H. Xiao, M. Fevzi Ozaydin, K. Balzuweit, and H. Liang, “Low-temperature
boriding of high-carbon steel,” Surf. Coatings Technol., vol. 263, pp. 21–26, 2015.
[59] Z. G. Su, X. Tian, J. An, Y. Lu, Y. L. Yang, and S. J. Sun, “Investigation on
boronizing of N80 tube steel,” ISIJ Int., vol. 49, no. 11, pp. 1776–1783, 2009.
[60] G. K. Kariofillis, G. E. Kiourtsidis, and D. N. Tsipas, “Corrosion behavior of borided
AISI H13 hot work steel,” Surf. Coatings Technol., vol. 201, no. 1–2, pp. 19–24, 2006.
[61] J. An, Z. G. Su, X. X. Gao, Y. L. Yang, and S. J. Sun, “Corrosion characteristics of
boronized AISI 8620 steel in oil field water containing H2S,” Prot. Met. Phys. Chem.
Surfaces, vol. 48, no. 4, pp. 487–494, 2012.
[62] American Society for Testing and Materials, “ASTM G3-14: Standard Practice for
Conventions Applicable to Electrochemical Measurements,” ASTM Stand.,
Reapproved 2010, pp. 1–9, 2012.
[63] American Society for Testing and Materials, “ASTM G133-05: Standard Test Method
for Linearly Reciprocating Ball-on-Flat Sliding Wear,” Annu. B. Stand., Reapproved
2016, pp. 1–9, 2016.
[64] American Society for Testing and Materials, “ASTM G119-09: Guide for Determining
Synergism Between Wear and Corrosion,” Annu. B. ASTM Stand., Reapproved 2016,
pp. 1–6, 2016.
[65] I. H. Witten, E. Frank, M. A. Hall, and C. J. Pal, “Data transformations,” in Data
Mining, Elsevier, 2017, pp. 285–334.

105
[66] X. Zhu, “Tutorial on Hertz contact stress,” Opti 521, pp. 1–8, 2012.
[67] American Society for Testing and Materials, “ASTM G102-89: Standard Practice for
from Electrochemical Measurements,” ASTM, Reapproved 2015, pp. 1–7, 2015.
[68] G. Li, R. Evitts, M. Boulfiza, and A. D. S. Li, “A customized Python module for
interactive curve fitting on potentiodynamic scan data,” Aug. 2018.
[69] S. C. Singhal, “A hard diffusion boride coating for ferrous materials,” Thin Solid
Films, vol. 45, no. 2, pp. 321–329,1977.
[70] A. P. Krelling, J. C. G. Milan, and C. E. De Costa, “Tribological behaviour of borided
H13 steel with different boriding agents,” Surf. Eng., vol. 31, no. 8, pp. 581–587,
2015.
[71] X. Dong, J. Hu, Z. Huang, H. Wang, R. Gao, and Z. Guo, “Microstructure and
properties of boronizing layer of Fe-based powder metallurgy compacts prepared by
boronizing and sintering simultaneously,” Sci. Sinter., vol. 41, no. 2, pp. 199–207,
2009.
[72] S. Şahin, “Effects of boronizing process on the surface roughness and dimensions of
AISI 1020, AISI 1040 and AISI 2714,” J. Mater. Process. Technol., vol. 209, no. 4,
pp. 1736–1741, 2009.
[73] A. P. Krelling, C. E. da Costa, J. C. G. Milan, and E. A. S. Almeida, “Micro-abrasive
wear mechanisms of borided AISI 1020 steel,” Tribol. Int., vol. 111, November 2016,
pp. 234–242, 2017.
[74] K. K. Pallegar, “Electrochemical corrosion testing of boronized and unboronized
steels,” M.Sc. Thesis 2005, Newark, NJ. New Jersey Institute of Technology. p. 80,
2006.
[75] E. Grechanovsky, “Stepwise regression procedures: Overview, problems, results, and
suggestions,” Ann. N. Y. Acad. Sci., vol. 491, no. 1, pp. 197–232, 1987.
106
[76] N. Kiratli and F. Findik, “Research on wear characteristics of AISI 1035 steel
boronized at various parameters,” Ind. Lubr. Tribol., vol. 63, no. 2, pp. 127–133, 2011.
[77] R. Carrera-Espinoza, U. Figueroa-López, J. Martínez-Trinidad, I. Campos-Silva, E.
Hernández-Sánchez, and A. Motallebzadeh, “Tribological behavior of borided AISI
1018 steel under linear reciprocating sliding conditions,” Wear, vol. 362–363, pp. 1–7,
2016.
[78] H. Tavakoli and S. M. Mousavi Khoie, “An electrochemical study of the corrosion
resistance of boride coating obtained by thermo-reactive diffusion,” Mater. Chem.
Phys., vol. 124, no. 2–3, pp. 1134–1138, 2010.
[79] Y. Kayali, A. Büyüksaçiş, and Y. Yalçin, “Corrosion and wear behaviors of boronized
AISI 316L stainless steel,” Met. Mater. Int., vol. 19, no. 5, pp. 1053–1061, 2013.
[80] R. G. Wellman, “Methods for studying erosion–corrosion,” Tribocorrosion Passiv.
Met. Coatings, pp. 239–264, 2011.
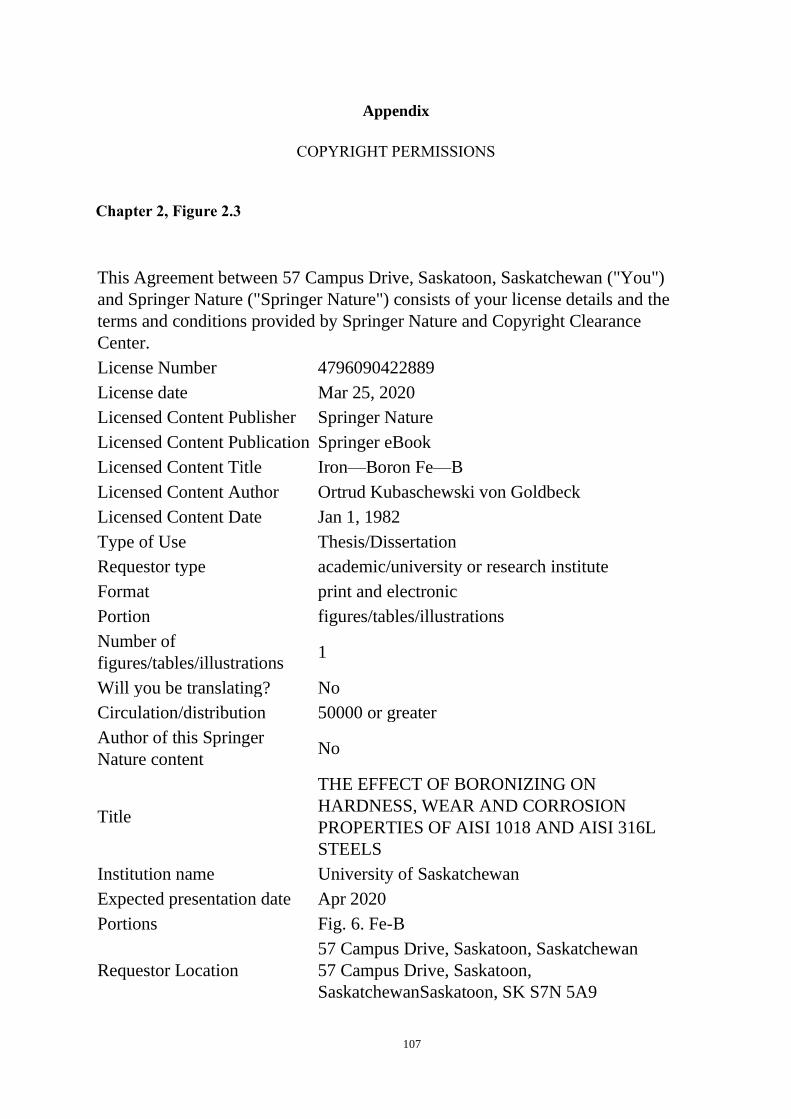
107
Appendix
COPYRIGHT PERMISSIONS
Chapter 2, Figure 2.3
This Agreement between 57 Campus Drive, Saskatoon, Saskatchewan ("You")
and Springer Nature ("Springer Nature") consists of your license details and the
terms and conditions provided by Springer Nature and Copyright Clearance
Center.
License Number 4796090422889
License date Mar 25, 2020
Licensed Content Publisher Springer Nature
Licensed Content Publication Springer eBook
Licensed Content Title Iron—Boron Fe—B
Licensed Content Author Ortrud Kubaschewski von Goldbeck
Licensed Content Date Jan 1, 1982
Type of Use Thesis/Dissertation
Requestor type academic/university or research institute
Format print and electronic
Portion figures/tables/illustrations
Number of
figures/tables/illustrations 1
Will you be translating? No
Circulation/distribution 50000 or greater
Author of this Springer
Nature content No
Title
THE EFFECT OF BORONIZING ON
HARDNESS, WEAR AND CORROSION
PROPERTIES OF AISI 1018 AND AISI 316L
STEELS
Institution name University of Saskatchewan
Expected presentation date Apr 2020
Portions Fig. 6. Fe-B
Requestor Location
57 Campus Drive, Saskatoon, Saskatchewan
57 Campus Drive, Saskatoon,
SaskatchewanSaskatoon, SK S7N 5A9

108
Canada
Attn: 57 Campus Drive, Saskatoon, Saskatchewan
Total 0.00 CAD
Terms and Conditions
Springer Nature Customer Service Centre GmbH
Terms and Conditions
This agreement sets out the terms and conditions of the licence (the Licence) between you
and Springer Nature Customer Service Centre GmbH (the Licensor). By clicking 'accept'
and completing the transaction for the material (Licensed Material), you also confirm your
acceptance of these terms and conditions.
1. Grant of License
1. The Licensor grants you a personal, non-exclusive, non-transferable, world-
wide licence to reproduce the Licensed Material for the purpose specified in
your order only. Licences are granted for the specific use requested in the
order and for no other use, subject to the conditions below.
2. The Licensor warrants that it has, to the best of its knowledge, the rights to
license reuse of the Licensed Material. However, you should ensure that the
material you are requesting is original to the Licensor and does not carry the
copyright of another entity (as credited in the published version).
3. If the credit line on any part of the material you have requested indicates that it
was reprinted or adapted with permission from another source, then you
should also seek permission from that source to reuse the material.
2. Scope of Licence
1. You may only use the Licensed Content in the manner and to the extent
permitted by these Ts&Cs and any applicable laws.
2. A separate licence may be required for any additional use of the Licensed
Material, e.g. where a licence has been purchased for print only use, separate
permission must be obtained for electronic re-use. Similarly, a licence is only
valid in the language selected and does not apply for editions in other
languages unless additional translation rights have been granted separately in
the licence. Any content owned by third parties are expressly excluded from
the licence.

109
3. Similarly, rights for additional components such as custom editions and
derivatives require additional permission and may be subject to an additional
fee. Please apply
to [email protected]/bookpermissions@springernature.
com for these rights.
4. Where permission has been granted free of charge for material in print,
permission may also be granted for any electronic version of that work,
provided that the material is incidental to your work as a whole and that the
electronic version is essentially equivalent to, or substitutes for, the print
version.
5. An alternative scope of licence may apply to signatories of the STM
Permissions Guidelines, as amended from time to time.
• Duration of Licence
1. A licence for is valid from the date of purchase ('Licence Date') at the end of the
relevant period in the below table:
Scope of Licence Duration of Licence
Post on a website 12 months
Presentations 12 months
Books and journals Lifetime of the edition in the language purchased
• Acknowledgement
1. The Licensor's permission must be acknowledged next to the Licenced Material in
print. In electronic form, this acknowledgement must be visible at the same time as
the figures/tables/illustrations or abstract, and must be hyperlinked to the
journal/book's homepage. Our required acknowledgement format is in the Appendix
below.
• Restrictions on use
1. Use of the Licensed Material may be permitted for incidental promotional use and
minor editing privileges e.g. minor adaptations of single figures, changes of format,
colour and/or style where the adaptation is credited as set out in Appendix 1 below.

110
Any other changes including but not limited to, cropping, adapting, omitting material
that affect the meaning, intention or moral rights of the author are strictly prohibited.
2. You must not use any Licensed Material as part of any design or trademark.
3. Licensed Material may be used in Open Access Publications (OAP) before
publication by Springer Nature, but any Licensed Material must be removed from
OAP sites prior to final publication.
• Ownership of Rights
1. Licensed Material remains the property of either Licensor or the relevant third party
and any rights not explicitly granted herein are expressly reserved.
• Warranty
IN NO EVENT SHALL LICENSOR BE LIABLE TO YOU OR ANY OTHER PARTY OR
ANY OTHER PERSON OR FOR ANY SPECIAL, CONSEQUENTIAL, INCIDENTAL OR
INDIRECT DAMAGES, HOWEVER CAUSED, ARISING OUT OF OR IN CONNECTION
WITH THE DOWNLOADING, VIEWING OR USE OF THE MATERIALS REGARDLESS
OF THE FORM OF ACTION, WHETHER FOR BREACH OF CONTRACT, BREACH OF
WARRANTY, TORT, NEGLIGENCE, INFRINGEMENT OR OTHERWISE (INCLUDING,
WITHOUT LIMITATION, DAMAGES BASED ON LOSS OF PROFITS, DATA, FILES,
USE, BUSINESS OPPORTUNITY OR CLAIMS OF THIRD PARTIES), AND
WHETHER OR NOT THE PARTY HAS BEEN ADVISED OF THE POSSIBILITY OF
SUCH DAMAGES. THIS LIMITATION SHALL APPLY NOTWITHSTANDING ANY
FAILURE OF ESSENTIAL PURPOSE OF ANY LIMITED REMEDY PROVIDED HEREIN.
• Limitations
1. BOOKS ONLY:Where 'reuse in a dissertation/thesis' has been selected the
following terms apply: Print rights of the final author's accepted manuscript (for
clarity, NOT the published version) for up to 100 copies, electronic rights for use only
on a personal website or institutional repository as defined by the Sherpa guideline
(www.sherpa.ac.uk/romeo/).
• Termination and Cancellation
111
1. Licences will expire after the period shown in Clause 3 (above).
2. Licensee reserves the right to terminate the Licence in the event that payment is not
received in full or if there has been a breach of this agreement by you.
Appendix 1 — Acknowledgements:
For Journal Content:
Reprinted by permission from [the Licensor]: [Journal Publisher (e.g.
Nature/Springer/Palgrave)] [JOURNAL NAME] [REFERENCE
CITATION (Article name, Author(s) Name), [COPYRIGHT] (year of publication)
For Advance Online Publication papers:
Reprinted by permission from [the Licensor]: [Journal Publisher (e.g.
Nature/Springer/Palgrave)] [JOURNAL NAME] [REFERENCE
CITATION (Article name, Author(s) Name), [COPYRIGHT] (year of publication),
advance online publication, day month year (doi: 10.1038/sj.[JOURNAL ACRONYM].)
For Adaptations/Translations:
Adapted/Translated by permission from [the Licensor]: [Journal Publisher (e.g.
Nature/Springer/Palgrave)] [JOURNAL NAME] [REFERENCE
CITATION (Article name, Author(s) Name), [COPYRIGHT] (year of publication)
Note: For any republication from the British Journal of Cancer, the following
credit line style applies:
Reprinted/adapted/translated by permission from [the Licensor]: on behalf of Cancer
Research UK: : [Journal Publisher (e.g. Nature/Springer/Palgrave)] [JOURNAL
NAME] [REFERENCE CITATION (Article name, Author(s) Name),
[COPYRIGHT] (year of publication)
For Advance Online Publication papers:

112
Reprinted by permission from The [the Licensor]: on behalf of Cancer Research UK:
[Journal Publisher (e.g. Nature/Springer/Palgrave)] [JOURNAL NAME]
[REFERENCE CITATION (Article name, Author(s) Name), [COPYRIGHT] (year
of publication), advance online publication, day month year (doi:
10.1038/sj.[JOURNAL ACRONYM])
For Book content:
Reprinted/adapted by permission from [the Licensor]: [Book Publisher (e.g. Palgrave
Macmillan, Springer etc) [Book Title] by [Book author(s)] [COPYRIGHT] (year of
publication)
Other Conditions:
Version 1.2
Questions? [email protected] or +1-855-239-3415 (toll free in the US) or +1-
978-646-2777.
Chapter 2, Figure 2.4
SPRINGER NATURE LICENSE
TERMS AND CONDITIONS
Mar 30, 2020
This Agreement between 57 Campus Drive, Saskatoon, Saskatchewan ("You") and Springer
Nature ("Springer Nature") consists of your license details and the terms and conditions
provided by Springer Nature and Copyright Clearance Center.
License Number
4796030838342
License date

113
Mar 25, 2020
Licensed Content Publisher
Springer Nature
Licensed Content Publication
Powder Metallurgy and Metal Ceramics
Licensed Content Title
Microstructure, Growth Kinetics, and Abrasive Wear Resistance of Boride Layers on Fe–
30% Cr Alloy
Licensed Content Author
V. I. Dybkov et al
Licensed Content Date
Feb 24, 2013
Type of Use
Thesis/Dissertation
Requestor type
academic/university or research institute
Format
print and electronic
Portion
figures/tables/illustrations
Number of figures/tables/illustrations
1
Will you be translating?

114
no
Circulation/distribution
50000 or greater
Author of this Springer Nature content
no
Title
THE EFFECT OF BORONIZING ON HARDNESS, WEAR AND CORROSION
PROPERTIES OF AISI 1018 AND AISI 316L STEELS
Institution name
University of Saskatchewan
Expected presentation date
Apr 2020
Portions
Figure 11
Requestor Location
57 Campus Drive, Saskatoon, Saskatchewan
57 Campus Drive, Saskatoon, Saskatchewan
Saskatoon, SK S7N 5A9
Canada
Attn: 57 Campus Drive, Saskatoon, Saskatchewan
Total
0.00 CAD

115
Chapter 2, Figure 2.5
Chapter 2, Figure 2.6
This Agreement between 57 Campus Drive, Saskatoon, Saskatchewan ("You")
and Springer Nature ("Springer Nature") consists of your license details and the
terms and conditions provided by Springer Nature and Copyright Clearance
Center.
License Number 4796090607696
License date Mar 25, 2020
Licensed Content Publisher Springer Nature
Licensed Content Publication Springer eBook
Licensed Content Title
Nanoparticles: An Emerging Weapon for
Mitigation/Removal of Various Environmental
Pollutants for Environmental Safety
Licensed Content Author Gaurav Hitkari, Sandhya Singh, Gajanan Pandey
Licensed Content Date Jan 1, 2019
Type of Use Thesis/Dissertation
Requestor type academic/university or research institute
Format print and electronic
Portion figures/tables/illustrations
Number of
figures/tables/illustrations 1
Will you be translating? no
Circulation/distribution 50000 or greater
Author of this Springer
Nature content no

116
Title
THE EFFECT OF BORONIZING ON
HARDNESS, WEAR AND CORROSION
PROPERTIES OF AISI 1018 AND AISI 316L
STEELS
Institution name University of Saskatchewan
Expected presentation date Apr 2020
Portions Fig. 16.5 Schematic representations of X-ray
diffraction (XRD)
Requestor Location
57 Campus Drive, Saskatoon, Saskatchewan
57 Campus Drive, Saskatoon, Saskatchewan
Saskatoon, SK S7N 5A9
Canada
Attn: 57 Campus Drive, Saskatoon, Saskatchewan
Total 0.00 CAD