the effect of brine on the electrical properties of
TRANSCRIPT

The Effect of Brine on the Electrical Propertiesof Methane HydrateR. Lu1 , L. A. Stern2 , W. L. Du Frane1 , J. C. Pinkston2, J. J. Roberts1, and S. Constable3
1Lawrence Livermore National Laboratory, Livermore, CA, USA, 2U.S. Geological Survey, Menlo Park, CA, USA, 3ScrippsInstitution of Oceanography, La Jolla, CA, USA
Abstract Gas hydrates possess lower electrical conductivity (inverse of resistivity) than either seawateror ice, but higher than clastic silts and sands, such that electromagnetic methods can be employed to helpidentify their natural formation in marine and permafrost environments. Controlled laboratory studies offera means to isolate and quantify the effects of changing individual components within gas‐hydrate‐bearingsystems, in turn yielding insight into the behavior of natural systems. Here we investigate the electricalproperties of polycrystalline methane hydrate with ≥25% gas‐filled porosity and in mixture with brine.Initially, pure methane hydrate was synthesized from H2O ice and CH4 gas while undergoing electricalimpedance measurement, then partially dissociated to assess the effects of pure pore water accumulationon electrical conductivity. Methane hydrate + brine mixtures were then formed by either adding NaCl(0.25–2.5 wt %) to high‐purity ice or by using frozen seawater as a reactant. Conductivity was obtained fromimpedance measurements made in situ throughout synthesis while temperature cycled between +15 °C and−25 °C. Several possible conduction mechanisms were subsequently determined using equivalent circuitmodeling. Samples with low NaCl concentration show a doping/impurity effect and a log linear conductivityresponse as a function of temperature. For higher salt content samples, conductivity increasesexponentially with temperature and the log linear relationship no longer holds; instead, we observe phasechanges within the samples that follow NaCl–H2O–CH4 phase equilibrium predictions. Final samples werequenched in liquid nitrogen and imaged by cryogenic scanning electron microscopy (cryo‐SEM) to assessgrain‐scale characteristics.
1. Introduction
Gas hydrates, also called clathrate hydrates, are ice‐like substances with encaged gas molecules (Sloan,1998). Most naturally occurring gas hydrate contains methane and typically forms under conditions withabundant free or dissolved gas, elevated pressures, and cool temperatures, as may occur in certain marineand permafrost regions worldwide (Kvenvolden, 2000; Maslin et al., 2010). Nearly 99% of the world'smethane hydrate forms in sediments of deep marine continental margins, typically at water depths greaterthan 300–500 m (Kvenvolden, 2000; Mclver, 1981; Ruppel, 2015). Methane hydrate can also form in shal-lower deposits or even directly on the seafloor where methane seeps into the ocean (Ruppel & Kessler,2017). There is keen interest in methane hydrate as a potential energy source as well as its role in the globalcarbon cycle and for geohazard concerns (Archer, 2007; Boswell & Collett, 2011; Ruppel & Kessler, 2017).Many deposits have already been characterized, but there are still uncertainties in the exact volume of thesereservoirs (Collett et al., 2015).
Seismic imaging and well logging are current geophysical methods for identifying gas hydrate deposit loca-tions around the world (Liang et al., 2017; Trehu et al., 2004). Seismic imaging can be facilitated by the exis-tence of a bottom‐simulating reflector (BSR) along the edge of the methane hydrate and free gas phaseboundary in marine sediments (Hornbach et al., 2003). However, there are cases where BSRs do not coincidewith gas hydrate layers, with some layers situated well above or below the BSRs (Majumdar et al., 2016;Shedd et al., 2012). Furthermore, seismic imaging of BSRs reveals little about gas hydrate concentrationand there are cases where gas hydrates with lower saturations are known to exist, but exhibit no BSR signa-ture due to a lack of sharp discontinuity in the seismic velocity profile (Chong et al., 2016; Sloan &Koh, 2007;Weitemeyer et al., 2011; Wood et al., 2002). Well logging or coring provides a more accurate assessment ofsaturation with depth, but is expensive and provides only a single location inferring the presence of gashydrates (Lee & Collett, 2011).
©2019. American Geophysical Union.All Rights Reserved.
RESEARCH ARTICLE10.1029/2019JB018364
Key Points:• Electrical properties of a
multicomponent methane hydratesystem synthesized from a mixtureof ice, NaCl, and CH4 gas wereexamined
• Electrical conductivity of samplesincreases nonlinearly withincreasing salt content fortemperatures above −15 °C
• No secondary NaCl‐bearing phaseswere detected in samples with <1.0wt % salt due to possibleincorporation into the hydratestructure
Supporting Information:• Supporting Information S1
Correspondence to:L. A. Stern and W. L. Du Frane,[email protected];[email protected]
Citation:Lu, R., Stern, L. A., Du Frane, W. L.,Pinkston, J. C., Roberts, J. J., &Constable, S. (2019). The effect of brineon the electrical properties of methanehydrate. Journal of GeophysicalResearch: Solid Earth, 124,10,877–10,892. https://doi.org/10.1029/2019JB018364
Received 11 JUL 2019Accepted 25 SEP 2019Accepted article online 16 OCT 2019Published online 6 NOV 2019
LU ET AL. 10,877

An alternative geophysical method involving electromagnetic (EM) remote sensing techniques can provide acomplementary solution to seismic imaging for determining concentration and geometric distribution of gashydrates in subseafloor structures (Attias et al., 2016; Weitemeyer et al., 2006). Controlled‐source electro-magnetic (CSEM) surveying methods are sensitive enough to detect the higher resistivity of gas hydrate rela-tive to pore fluids in sediments (Constable et al., 2016). The resistivities measured from CSEM methods canbe converted to hydrate saturation via Archie's equation and 3‐D inversion for conductivity models (Archie,1942; Attias et al., 2018). However, the derived hydrate saturation values may not be accurate due to uncer-tainty in the estimation of the parameters of Archie's equation (Cook&Waite, 2018). Developing amore fun-damental understanding of the petrophysical relations between methane hydrate and brine salinity shouldtherefore help to better correlate resistivity data with methane hydrate saturations, and in turn improvereliability of existing and new models. Well log measurements also utilize resistivity for detection of gashydrate and may benefit from the results of this study.
Although physical properties of methane hydrate have been studied extensively via lab‐synthesized samples(Sloan & Koh, 2007, and references therein), there are only a limited number of investigations of their elec-trical properties: gas hydrate in pore spaces of glass beads (Spangenberg & Kulenkampff, 2006); gas hydratewith quartz sand (Du Frane et al., 2015; Ren et al., 2010); gas hydrate with sand, silt, and clay (Lee et al.,2010); and pure polycrystalline methane hydrate (Du Frane et al., 2011). When resistivity relations areapplied to Archie's and other mixing law models, one can determine hydrate saturation levels based on elec-trical characteristics (Cai et al., 2017). These previous studies are useful for simulating conditions of naturalgas hydrates or creating simplified systems for modeling purposes.
The presence of brine in porous media has been shown to affect both gas hydrate formation (You et al., 2015)and its electrical conductivity (Li et al., 2012). Li et al. (2012) demonstrated that salinity, temperature, andhydrate saturation level can potentially influence the electrical response by several orders of magnitude.Although their results provide important insights and trends, they used a single alternating current fre-quency which does not fully isolate the specific sample response from contributions of the electrode polar-ization. Hence, additional information can be gleaned from further investigation using impedancespectroscopy over a broad range of frequencies. For example, impedance spectroscopy can help reveal var-iations in electrical behavior, conductionmechanisms/pathways, composition distributions, and other inter-nal changes in a material system just by varying current frequencies (Roberts, 2002; Roberts & Tyburczy,1999). Gas hydrate/sediment mixtures are dielectrics with electrical behavior that is strongly dependenton temperature (Du Frane et al., 2015), and obtaining quantitative information on the subtleties that contributeto the overall electrical response of gas hydrate mixtures is crucial for understanding more complex systems.
To date, there is little‐to‐no published work investigating the electrical properties of pure methane hydrate incontact with seawater salts/NaCl and in the absence of sediments. Our motivation here is twofold: (1) to iso-late and quantify the effects on electrical properties of methane hydrate when adding known quantities ofsalts to the bulk system in a controlled manner and (2) to better understand the influence of salts as botha potential impurity (or doping agent) within the hydrate grains themselves and in the development of inter-granular pore fluid (brine). Toward these ends, we first synthesized pure methane hydrate (0 wt % NaCl) andmeasured electrical conductivity to ensure consistency with previous (Du Frane et al., 2011, 2015) results. Wethen measured the same sample after inducing partial dissociation at +5 °C via depressurization, to monitorconductivity changes caused by generating pure H2O pore liquid within the specimen. We next measured elec-trical conductivity of methane hydrate with total NaCl bulk concentrations ranging from 0.25 to 2.5 wt %, bysynthesizing samples from three‐component mixtures of pure ice + salt + methane gas in a manner allowinguniform distribution of NaCl throughout the sample. Lastly, we synthesized and measured methane hydrateprepared from frozen synthetic seawater (3.5 wt % salts) + methane gas. Impedance spectroscopy with frequen-cies between 0.5 and 300 kHz were measured and analyzed for all samples between +15 °C and −25 °C. Theresults allowed correlation of pore fluid fractions with bulk sample conductivity, which in turn can be approxi-mated using petrophysical mixing models. Gas hydrates occur in nature both above and below 0 °C, and inves-tigating both the high‐ and low‐temperature regimes allows us to better assess the physical and chemicalconstituents and changes that occur in each sample as a function of temperature. Hydrate grain‐scale character-istics including grain size, intergranular porosity, grain morphology, contacts, and distribution of phases werealso evaluated on final, quenched samples by cryogenic scanning electron microscopy.
10.1029/2019JB018364Journal of Geophysical Research: Solid Earth
LU ET AL. 10,878

2. Materials and Methods2.1. Sample Preparation
For sample preparation, triple‐distilled water frozen to gas‐free ice chunks were crushed and sieved to 180–250 μm to form granular “seed ice” (method described by Stern et al., 1996, 2004). One sample was preparedfrom pure H2O seed ice (sample NH0, with no added NaCl), whereas most were prepared from seed icemixed with salt. For salt‐added samples, sodium chloride (NaCl) crystals >99.9% purity (VWRInternational) were powdered by mortar and pestle, then sieved to <75 μm. The goal was to uniformly dis-tribute the smaller salt crystals throughout the ice by positioning them along ice grain boundaries and in icegrain junctions, such that they would dissolve during sample synthesis to form a well‐distributed brine net-work around methane hydrate grains or clusters of grains. The powdered NaCl was initially cooled below−50 °C to prevent any premature reaction with the ice, then thoroughly mixed with the granular ice usinga spatula in a conventional −25 °C freezer. Samples were prepared with varying proportions of ice and NaClas listed in Table 1. One additional sample was prepared using seed ice made from synthetic seawater inplace of triple‐distilled water. Synthetic seawater was purchased from High‐Purity Standards, Inc. (ISO cer-tified) with 3.5 wt % as total salts and 2.7 wt % as NaCl. The seawater was flash‐frozen as droplets in liquidnitrogen to maintain uniform salinity both within and amongst all grains, then crushed and sieved to<250 μm.
The granular ice + salt reactants were then poured into insulating FEP plastic tubing (50.8‐mm diameter ×~90 mm tall), compacted to 10‐mm thickness, sandwiched between two same‐diameter silver electrodes,sealed in a custom high‐pressure vessel, and attached to the synthesis apparatus such that the cell was fullyimmersed in a−25 °C d‐Limonene fluid bath (Du Frane et al., 2011, Figure 1). Initial porosity for all sampleswas ~36 vol % (Table S1 in the supporting information). Samples were then ready to be synthesized whilesimultaneously collecting in situ impedance (Z) spectroscopy measurements.
To begin synthesis, sample pore space was briefly evacuated and then flooded with chilled, high‐pressuremethane (CH4) gas at ~20 MPa and −25°C, placing the reactants deep within the methane hydrate stabilityfield. Temperature of the surrounding fluid bath was then heated to +15 °C at ~11 °C/hr and held for ~15 hrfor the first cycle (then 12‐hr holds for subsequent cycles) with isochoric CH4 pressures increasing to ~28MPa. During this time most of the ice grains react along their surfaces to formmethane hydrate as they passthrough the ice point, as demonstrated in Stern et al. (1996, 2004). To ensure full reaction, including dissolu-tion of the NaCl, samples were subjected to repeated temperature cycling between +15 °C and approxi-mately −25 °C (total 30–35 hr per cycle). During the high‐temperature portions of synthesis, the ice, salt,andmethanemixtures react to form amulticomponent systemwhere the resultingmethane hydrate coexistswith an NaCl‐bearing fluid phase (“brine”). Upon cooling below 0 °C and down to −24 °C, the compositionof the brine evolves with time and temperature as first ice and then hydrohalite (NaCl·2H2O) begin crystal-lizing in accordance with NaCl‐H2O phase equilibria (Figure 1; see also McCarthy et al., 2007, Figure 3).Hence, during each thermal cycle, samples pass through multiple phase boundaries in the CH4‐H2O‐NaClphase diagram (Figure 1, shaded green region).
Each sample underwent a minimum of six thermal cycles and until electrical impedance stopped changingsignificantly between cycles (<5% impedance change on log‐scale), to ensure that the sample had stabilizedand that methane hydrate synthesis in the mixed‐phase system was complete. A final incremental heatingstep, referred to here as “step‐dwell,” involved a 1‐hr hold at each target temperature to allow thermal equi-libration of the sample before performing an impedance frequency sweep to calculate electrical conductivity.Each full run lasted approximately 300–400 hr. Electrical conductivity of samples at temperatures below−20°C was obtained during the normal cooling cycle of the freezer, which slows to a rate below 1 °C/hr as itapproaches a minimum temperature.
To obtain methane hydrate with in situ pore water rather than brine, we briefly destabilized the fully synthe-sized pure methane hydrate sample (Sample NH0) by depressurizing across the phase stability boundarywhile holding external temperature at +5 °C and allowing the sample to partially dissociate to water +gas (Figure 2a). This method was chosen to destabilize the disk‐shaped sample as homogeneously as possibleand to promote uniform accumulation of dissociated water, by minimizing heat flow gradient effects thataccompany dissociation by external thermal ramping. Pressure was slowly released from 20 to 5 MPa,
10.1029/2019JB018364Journal of Geophysical Research: Solid Earth
LU ET AL. 10,879

allowing sufficient time for sample equilibration following isochoric cooling effects. Pressure was thenreduced again to ~3.8 MPa, ~0.6 MPa below the equilibrium boundary, to induce partial dissociation andin situ production of pore water. After pressure rebounded from the dissociation process and impedanceapproached a new plateau, the NH0 sample was quenched in liquid nitrogen for cryo‐SEM analysis ofpore water distribution within the sample (Figure 2b).
Porosity of final, as‐synthesized samples ranged from approximately 25 to 27 vol %, with increasing porositytrending with increasing NaCl content. Sample NH0 (pure methane hydrate), prior to dissociation, con-tained ~25 vol % of methane gas‐filled intergranular porosity, as calculated from the measured mass ofthe reactant ice and the expected volumetric increase (~17% from Kuustraa & Hammershaimb, 1983) uponits restructuring to a structure I clathrate hydrate lattice (see Table S2 for porosity calculations). All NaCl‐bearing samples contained higher porosities, ranging upward of 27 vol %, caused by additional volume
changes associated with a portion of the reactant ice melting to dissolvethe added NaCl rather than expanding to form hydrate, plus the elimi-nated volume of the powdered NaCl(s) itself during dissolution (TableS2). Run SH3.5 is expected to continue this trend and contain even higherporosity, but is not quantified here. We note that the calculated porositiesare the minimum possible and assume full NaCl‐saturation of the brine.Porosity may be higher if the brine is not fully saturated throughoutthe sample.
2.2. Electrical Characterization
Impedance spectroscopy measurements (0.5–300 kHz) were collected on aGwINSTEK LCR 6300 (Inductance, Capacitance, and Resistance) meterfor each run. The instrument and experimental setup were tested for elec-trical leakage using a Teflon blank and various parallel resistor‐capacitor(RC) circuits. This was done to verify no significant electrical leakageoccurred during runs with methane hydrate samples. At an interface, phy-sical properties (such as compositional or crystallographic) may changeprecipitously and cause heterogeneous charge distributions (polariza-tions) that reduce the overall electrical conductivity of a system(Barsoukov & Macdonald, 2005). Collecting impedance spectra over alarge range of frequencies was necessary to isolate the electrical conductiv-ity of the bulk samples from systemic contributions such as polarizationfrom the electrode‐sample interface which is common in dielectric mate-rials, e.g. gas hydrates (Roberts & Tyburczy, 1994, 1999).
Previous conductivity studies (Du Frane et al., 2011, 2015) on methanehydrate demonstrated that the impedance used to calculate electrical con-ductivity can be reliably measured at the frequency associated with thesmallest phase angle (phase shift between the input voltage and measuredcurrent) since pure methane hydrate exhibits capacitive behavior due to its
Table 1Sample Conditions of Methane Hydrate Initially Prepared with Added NaCl (NH‐series) and from Seawater (SH) During Synthesis
Starting seed ice(wt %)
Starting salt concentration(wt %)
No. of synthesiscycles
Step‐dwell overall heating rate(°C/hr)
CH4 pressure range(MPa)
Temperature range(°C)
NH0a 100 0 6 2.7 18.1–23.5 −18 to +15NH0.25 99.75 0.25 9 1.3 19.1–26.6 −25 to +15NH1.0 99.0 1.0 8 2.9 18.9–25.4 −25 to +15NH1.75 98.25 1.75 10 2.5 19.0–26.7 −25 to +15NH2.5 97.5 2.5 11 2.5 19.7–28.0 −25 to +15SH3.5b 96.5 3.5 9 0.9 21.5–29.8 −23 to +15
aNH0 is pure methane hydrate but underwent partial dissociation after the step‐dwell measurement. bSH3.5 (Methane hydrate synthesized from frozenseawater) was prepared differently than samples NH0‐NH2.5 as described in experimental methodology.
Figure 1. Phase diagram of the ternary system CH4‐H2O‐NaCl (green lines)modified from De Roo et al. (1983). Experimental isochoric pressure‐temperature conditions for all samples during heating/cooling cycles fallwithin the shaded green region. The solidus and liquidus of the samplemixture systems are marked as blue dotted ovals. The red lines and textindicate the binary system CH4‐H2O without NaCl, although the presenceof NaCl can alter the location of the phase stability boundary (e.g., Cha et al.,2016). For NaCl‐H2O binary system, see Figure 3 in McCarthy et al. (2007).
10.1029/2019JB018364Journal of Geophysical Research: Solid Earth
LU ET AL. 10,880
dielectric nature. However, when introducing NaCl into the system, the samples may possess either
dielectric or conductor‐like properties depending on the temperature and the phases (liquid/solid) present.
Hence, more rigorous equivalent circuit modeling (ECM) is required to fit the impedance spectroscopy
measurements. Using the resistance (R) values from the ECM fits proved more reliable for the calculation of
the electrical conductivity instead of identifying one specific frequency (at the smallest phase angle)
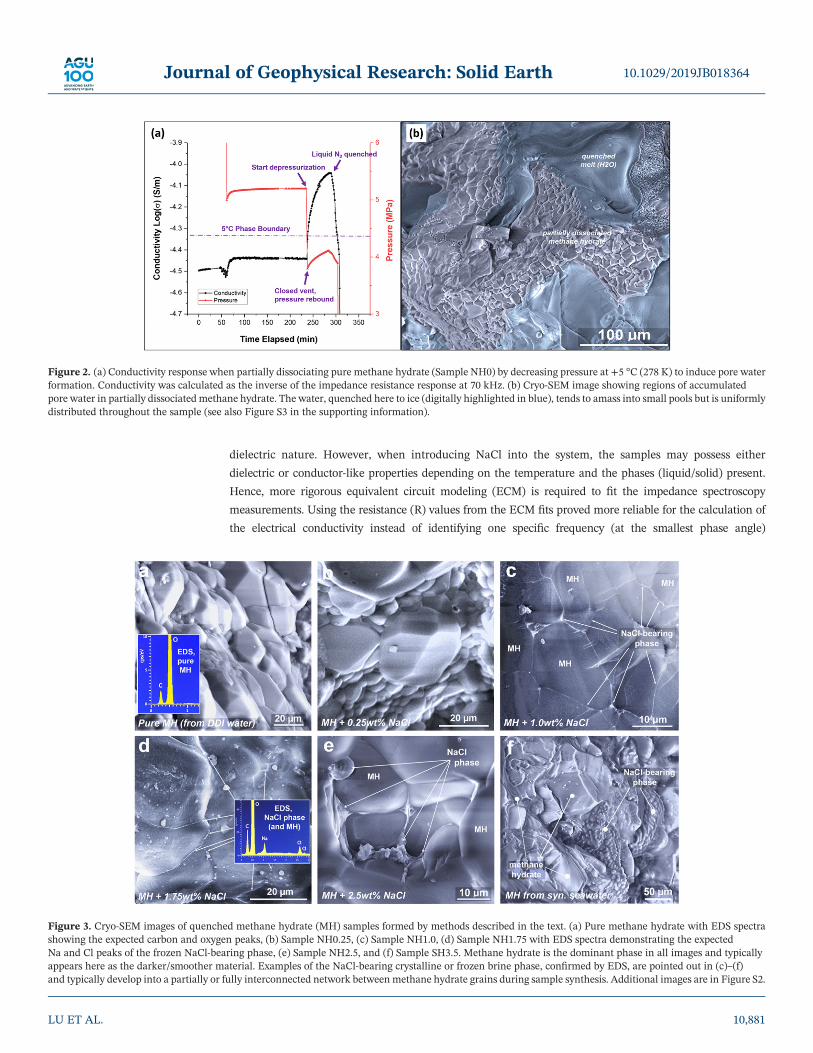
Figure 3. Cryo‐SEM images of quenched methane hydrate (MH) samples formed by methods described in the text. (a) Pure methane hydrate with EDS spectrashowing the expected carbon and oxygen peaks, (b) Sample NH0.25, (c) Sample NH1.0, (d) Sample NH1.75 with EDS spectra demonstrating the expectedNa and Cl peaks of the frozen NaCl‐bearing phase, (e) Sample NH2.5, and (f) Sample SH3.5. Methane hydrate is the dominant phase in all images and typicallyappears here as the darker/smoother material. Examples of the NaCl‐bearing crystalline or frozen brine phase, confirmed by EDS, are pointed out in (c)–(f)and typically develop into a partially or fully interconnected network betweenmethane hydrate grains during sample synthesis. Additional images are in Figure S2.
Figure 2. (a) Conductivity response when partially dissociating pure methane hydrate (Sample NH0) by decreasing pressure at +5 °C (278 K) to induce pore waterformation. Conductivity was calculated as the inverse of the impedance resistance response at 70 kHz. (b) Cryo‐SEM image showing regions of accumulatedpore water in partially dissociated methane hydrate. The water, quenched here to ice (digitally highlighted in blue), tends to amass into small pools but is uniformlydistributed throughout the sample (see also Figure S3 in the supporting information).
10.1029/2019JB018364Journal of Geophysical Research: Solid Earth
LU ET AL. 10,881

associated with an impedance value. ECM fitting was performed on EIS Spectrum Analyzer software(Bondarenko & Ragoisha, 2005). Conditions for fits are based on 3,000 iterations using the Powell algorithmand an unweighted (complex nonlinear least squares) function.
Following synthesis and final impedance measurement, samples were recovered for analysis of phase distri-bution and grain‐scale characteristics using a scanning electron microscope equipped with a cryogenic stage(cryo‐SEM) similar to that described by Stern et al. (2004). The pressure vessel containing the sample wasfirst quenched with liquid nitrogen while methane gas pressure was slowly released, and the methanehydrate sample was then extracted, measured, and stored in liquid nitrogen prior to SEM analysis. Thecryo‐SEM setup involves a specialty preparation chamber and imaging stage (Gatan Alto1000) attacheddirectly to a Tescan variable‐pressure SEM (Figure 1b in Lu et al. (2018)). Small sections of samples were firstcleaved under vacuum in the cryo‐preparation chamber to obtain fresh surfaces uncontaminated by watercondensation, then transferred directly to the imaging stage. Imaging was conducted at <−185 °C, 10–15 kV, under low‐vacuum mode of ~20 Pa.
3. Results3.1. Cryogenic Scanning Electron Microscopy
Cryo‐SEM examination of sample NH0 (methane hydrate sample that was partially dissociated; Figure 3a)and sample NH0.25 (with the lowest added NaCl content in the study; Figure 3b) shows uniform develop-ment of polycrystallinemethane hydrate grains typically ranging between 5 and 80 μm, and sometimes larger(>100 μm) where they border open pores. Energy dispersive X‐ray spectroscopy (EDS) spot measurements onmethane hydrate clearly show the carbon elemental peak in addition to the oxygen peak (Figure 3a, inset), dif-ferentiating methane hydrate from ice. Neither the elemental Na or Cl signals were present in EDS spectra ofsample NH0.25, or were simply below the limit of detection. For higher salt content samples, the observed fro-zen brine (primarily compositions of microcrystalline ice + hydrohalite ± halite) becomes evident as thin rimssurrounding methane hydrate grains and develops into increasingly interconnected networks with increasingsalt content (Figures 3c–3e). This is in agreementwith the tendency of gas hydrates to exclude impurities duringcrystal formation (Hesse &Harrison, 1981). However, crystal habit development of themethane hydrate grainsvisually deteriorates with increasing NaCl content, with higher NaCl‐bearing samples exhibiting significantlypoorer development of well‐defined isometric structures (compare Figures 3a and 3b to 3d and 3e; see alsoFigure S1). In any case, theNaCl‐bearing phase can be visually and chemically differentiated from themethanehydrate grains by both SEM and EDS (compare Figure 3a inset with 3d inset). Additional cryo‐SEM imagesshowing the NaCl‐bearing phase distribution in samples are provided in Figure S2.
Sample SH3.5 formed from flash‐frozen seawater (Figure 3f) exhibits considerably different grain‐scale char-acteristics compared to samples formed from ice grains premixed with salt. Here there are few areas thatshow thin or distinct borders of frozen brine around pure methane hydrate; instead, broader regions orsometimes branching or dendritic formations of NaCl‐bearing frozen material formed throughout the sam-ple, confirmed by EDS. In other regions bordering on open cavities, the frozen NaCl phase developed abotryoidal appearance (Figure 3f). Methane hydrate grains in the seawater sample were also found to be sig-nificantly more rounded compared to those from samples with no or low salt content (Figure S1).
Cryo‐SEM imaging of pure methane hydrate after partial dissociation (NH0) revealed development of theliquid water by‐product, quenched in place prior to imaging, forming loosely interconnected accumulationsdistributed throughout the sample (Figure 2b; see also Figure S3). On the basis of numerous images, we esti-mate that the sample contained approximately 15 ± 5 vol % dissociated water when the test was terminatedand sample quenched (Figure 2a). Methane hydrate grains in this example show a general reduction in grainsize compared with undissociated samples (compare Figures 2b and 3a), with grains exhibiting rounding orreceding of crystal facets as they destabilize to form pore liquid.
3.2. Impedance Spectroscopy
During hydrate synthesis, sample NH0 and NH0.25 show impedance responses that are frequency depen-dent (Figures S4a and 4a, respectively) throughout the full temperature range. For samples with higherNaCl content (NH1.0 or NH1.75), there is a much larger impedance spread for different frequencies at thelower temperature regions (<0 °C), typical of a dielectric‐like material. In contrast, at higher temperatures
10.1029/2019JB018364Journal of Geophysical Research: Solid Earth
LU ET AL. 10,882

for samples NH1.0/1.75, the spread in impedance response is narrower with much less frequencydependence, typical of a conductor‐like material (Figures S4b and 4b). However, this impedancefrequency spread‐temperature relationship no longer holds true for methane hydrate samples (NH2.5 andSH3.5) with the highest salt contents (Figures S4c and 4c). Both samples appear to exhibit electricalbehaviors similar to a conductor‐like medium for all temperatures above >−24 °C.
In order to further examine the electrical contributions fromdifferent specific frequencies, complex Z‐spectra(Cole‐Cole plots) that compare imaginary impedance versus real impedance are plotted for each methanehydrate sample (Figure 5). The higher‐frequency region (>10 kHz) is typically attributed to electrical
Figure 4. Impedance at various frequencies measured during synthesis temperature cycling for several samples.(a) NH0.25, (b) NH1.75, and (c) SH3.5. A slow step‐dwell heating cycle is included at the end of each plot; see text forfurther description. See Figure S4 for similar plots of samples NH0, NH1.0, and NH2.5.
10.1029/2019JB018364Journal of Geophysical Research: Solid Earth
LU ET AL. 10,883

properties of the bulk hydrate sample while the lower frequencies (<10 kHz) are likely associated withelectrode polarization (double‐layer capacitance) at the hydrate sample‐electrode interface, which iscommon for a dielectric material (methane hydrate) in contact with a conductor such as a silver foilelectrode (Du Frane et al., 2011). This is because low electrical frequencies (<10 kHz) can be obstructed bythe electrode polarization resulting in electrical resistance values significantly higher than that of the bulkhydrate sample alone. Methane hydrate samples with added salt exhibit more dramatic changes in theirspectra curves with relative changes in temperature, which can be attributed to differences in dielectricrelaxation times (Das & Bhattacharyya, 2011). The time‐dependent responses in phase and amplitudechanges can reveal how electrons interact with the electrode‐sample surface. At higher temperatures, theimpedance contribution from electrode polarization diminishes (smaller imaginary and real ohmicresistance) and this is especially true for methane hydrate samples with high salt contents (Figures 5c–5f).
3.3. Equivalent Circuit Modeling
To understand how the conductive pathway is changing as a function of salt content and temperature, equiva-lent circuit models (ECM) for methane hydrate samples at various temperatures and salt contents wereobtained (Figure 6). These ECMs are the simplest models required to adequately fit each complex Z‐spectra(Figure 5) with less than 5% error in the fitted resistance (R) values for the high frequency region(>10 kHz), representative of the bulk sample. The ECMs verify that different conduction mechanisms existfor methane hydrate at different salt contents and temperatures. For pure methane hydrate (sample NH0)at relatively cool temperatures, two resistor‐capacitor circuits in series reflect two interfaces that electronsmust pass through, denoted “RC+RC” (Figure 6a). One RC circuit represents the bulk hydrate sample andthe other corresponds to the electrode‐sample interface. This ECM is consistent with the model for puremethane hydrate samples from previous reports (Du Frane et al., 2011). However, at higher temperatures(Figure 6b), ECM fitting required replacing one of the capacitors with a constant phase element (CPE) dueto the low‐frequency second arc in the Z‐complex spectra becoming less than 90°. This circuit model isdenoted “RCPE+RC.” The CPE in a circuit typically indicates a system experienced microstructural and/ormorphology changes that caused nonuniformities in the current distribution (Rodriquez Presa et al., 2001;Shoar Abouzari et al., 2009). Due to these physical/compositional changes, the use of simple ideal resistorand capacitor elements is no longer adequate in the fits for modeling these systems. We see that with increas-ingly higher temperatures and salt contents, both capacitors in the ECMs become CPEs, denoted “RCPE
Figure 5. Complex Z‐spectra comparing imaginary impedance versus real impedance for variable frequencies (0.5–300 kHz) of all samples as a function oftemperature. Each point in each temperature plot represents a specific frequency. (Highest frequency on the left side of the x axis and lowest frequency on theright side.) Samples (a) NH0, (b) NH0.25, (c) NH1.0, (d) NH1.75, (e) NH2.5, and (f) SH3.5 are plotted. Some plots (a–d) are cropped to show high‐frequency(>10 kHz) regions associated with bulk sample conductivity. Plots (e) and (f) show the full frequency range measured.
10.1029/2019JB018364Journal of Geophysical Research: Solid Earth
LU ET AL. 10,884

+RCPE” (Figure 6c). Eventually, at sufficiently high temperatures and salt contents (Figure 6d), a new resistorelementwas added in series into the ECMs to achieve a betterfit, denoted “R+RCPE+RCPE.”For the seawater‐hydrate sample (Figure 6e), a small amount of electrode polarization can be resolved for our measuredfrequency range at the electrode‐sample interface and only resistance but no capacitance is observed in thebulk hydrate sample itself. The ECM for this system is simply “R+RCPE.”
3.4. Electrical Conductivity
Knowing the complex Z‐spectra and obtaining R‐values from the ECM fits, the sample conductivity (inverseof resistivity) for each salt and temperature condition was calculated. In general, there is a clear trend inwhich higher temperature and salt content in the hydrate samples correspond to higher electrical conductiv-ity (Figure 7). To better understand these results, different geometric markers are used to depict the five pos-sible ECMs. For samples NH1.0, NH1.75, and NH2.5 at sufficiently high temperatures, the conductionmechanisms can be modeled with the R+RCPE+RCPE circuit whereas the others lack this third resistorcomponent. The seawater‐hydrate sample exhibited the highest conductivity, as expected, due to havingthe highest salt content. Conductivity of the partially dissociated (PD) pure methane hydrate is also plottedto compare the effects of pure H2O pore water versus brine. The conductivity of sample NH0 increased by afactor of 2.5 times from 3.5 to 8.9 × 10⁻⁵ S/m after the generation of pore water but the ECM remains thesame (Figure 7).
Conductivity data are typically fit to an Arrhenius expression when they exhibit an exponential temperaturedependence, suggesting that the material possesses thermally activated charge carrier transport properties(Bloom & Heymann, 1947; Yoshino et al., 2012). The Arrhenius relation for conductivity as a function oftemperature is expressed as
σ Tð Þ ¼ σ0e−EaRTð Þ (1)
where σ0 is a preexponential constant (S/m), Ea is the activation energy (kJ/mol), R is the gas constant(8.314 J/mol/K), and T is the temperature (K). The preexponential term in equation (1) can be derivedas the linear slope in each plot in Figure 7 to get a specific activation energy (Ea) (see equations S1–S3 inthe supporting information). Activation volume was not carefully measured, but pressures up to ~20 MPahave little effect on electrical conductivity of hydrate bearing samples (Du Frane et al., 2015), and can there-fore be assumed to be small. This allows us to effectively determine activation energy from fitting electrical
Figure 6. Equivalent circuit models for various NaCl content and temperatures. Example of simulated fits for the five possible equivalent circuit models. Models forsample (a) NH0 at +3 °C, (b) NH0 at +15 °C, (c) NH1.0 at +4 °C, (d) NH2.5 at +8 °C, and (e) SH3.5 at +4 °C. These are the simplest equivalent circuit modelsrequired to obtain acceptable fits with <5% error in the fitted resistance (R) values. The frequency rangemodeled is illustrated as thin line plots. Actual experimentaldata are the circular dot plots.
10.1029/2019JB018364Journal of Geophysical Research: Solid Earth
LU ET AL. 10,885

conductivity measured on the NH0 and N0.25 samples despite isochoric pressure variations duringtemperature cycling. Pure methane hydrate (sample NH0) was calculated to have an activation energy of33.5 kJ/mol, which is similar to other reports at 30.6 kJ/mol (Du Frane et al., 2011). For sample NH0.25with a minute amount of salt added, the activation energy is still roughly the same as sample NH0 at 36.6kJ/mol, but is an order of magnitude more conductive. However, for higher salt content samples,temperature and conductivity no longer have a log linear relationship across the full temperature range.Significantly higher activation energies (illustrated by the steeper slopes) are observed at both the highertemperature (>0 °C) and lower temperature (<−24 °C) regions (Figure 7). The sharp changes in the logconductivity behavior implies these samples (or parts of the samples) were undergoing phase changes,which has been previously observed in ice and other materials (Buehler et al., 2007; Presnall et al., 1972).
4. Discussion
The electrical properties of methane hydrate mixture systems were found consistent with the general conceptthat higher total salt content leads to higher electrical conductivity due to the increase of ionic charge carriers.However, grain‐scale‐level uniformity of salt distribution throughout the samples remains uncertain, as doeswhether local salinity inhomogeneity might affect electrical properties. NaCl‐bearing phases along methanehydrate grain boundaries are shown to be partially interconnected in at least some sections of samples, andgrain junctions possessing higher concentrations of NaCl are suggested from SEM and EDS analysis(Figures S2c–S2h). During the initial stages of hydrate formation, the synthesis process will consume someor most H2O to formmethane hydrate, but some H2O is diverted into dissolving NaCl salt. Upon further melt-ing and freezing cycles, more H2O is converted to methane hydrate, resulting in progressively higher brinesalinity in localized pockets (Chaouachi et al., 2015; Chen & Espinoza, 2018). It is possible that some regionsof high salt concentration will migrate to regions of low salt concentration until an equilibrium state isreached where the brine is near or fully saturated, and where no more methane hydrate will be synthesizedfrom the fluid phase. The eventual stabilization (typically after the third cycle) and repeatability of impe-dance measurements in any one sample suggests that an equilibrium or near‐equilibrium is indeed reachedin all samples prior to the final step‐dwell measurement (Figure 4). However, we cannot rule out that at leastsome local regions may not be interconnected along hydrate grain boundaries, leading to possible heteroge-neous salinity in samples. Chen et al. (2018) were able to prove their samples were inhomogeneous in salinityby using micro‐CT to observe the migration of brine (NaBr and KI) and quantitatively measure the salinitychanges in different regions during methane hydrate synthesis. Moreover, our own documentation of NaCl‐bearing crystalline development in certain regions of samples (e.g., Figures 3c–3e and S2b–S2h) supports
Figure 7. Conductivity log plot as a function of temperature for all methane hydrate samples. Each data point is fittedwith an equivalent circuit model and markers are shown as different geometric symbols. Point PD shows the partiallydissociated methane hydrate sample after generating pore water within it. The conduction pathways appear to change as afunction of sample composition and corresponding conductivity values. Pure methane hydrate (NH0) has the lowestconductivity while methane hydrate synthesized from frozen seawater (SH3.5) has the highest conductivity for the entiretemperature range measured. Conductivity of hydrate samples with added NaCl (NH0.25–NH2.5) plots in between thesetwo extremes.
10.1029/2019JB018364Journal of Geophysical Research: Solid Earth
LU ET AL. 10,886

this hypothesis. Hence, adding more salt may increase the formation of more brine networks and local brinesalinity, resulting in greater increases in conductivity. We observe this effect as exponential increases inconductivity when we compare all “NH” samples at +5 °C and +15 °C (Figures 8a and 8b).
The residual fluid phase is expected to become increasingly concentrated in NaCl as ice starts to crystallize.Since the body of the pressure vessel transmits heating or cooling from the perimeter of the sample inward,the samplemay experience a thermal gradient where brine at the center of the sample will melt or freeze last,respectively. Therefore, the center of the sample may have a relatively higher salinity when the sample iscooled below the hydrohalite solidus. This is evident when the heating and cooling rates of the samplesare compared. Salt crystal precipitation during cooling is typically a slower process than dissolution by heat-
ing. Because of this kinetic difference, we observed hysteresis in all sam-ples except the pure methane hydrate with no salt added (sample NH0;Figure 9). To this end, our reported conductivity values are accurate basedon a step‐dwell heating method where both thermal and chemical equili-brium were more likely to have been reached.
Based on molecular modeling studies of gas hydrate, nonpolar guest spe-cies such as methane may not possess guest‐host hydrogen bonds, nor dothey have the same Bjerrum intrinsic defects as ice (Alavi et al., 2009).This may explain the higher resistivity of methane hydrate relative to ice(Du Frane et al., 2011). Like ice, when low levels of salt impurities exist(sample NH0 and NH0.25), the ionic charge carriers (extrinsic defects)are transported by thermally activated solid‐state diffusion mechanisms(Barnes & Wolff, 2004; Du Frane et al., 2011; Kulessa, 2007). This isreflected in their log linear conductivity behavior relative to temperatureindicating there is no significant phase change affecting conductivity(Figures 7 and 9). While this could suggest that the small NaCl fractionadded is simply positioned at the interstitial grain boundaries and notforming enough brine to be well‐connected (sample NH0.25), a betterexplanation that, supported by additional evidence discussed below, maybe that the small NaCl fraction is incorporated into the methane hydrate
Figure 8. Conductivity plot as a function of bulk NaCl content for (a) +15 °C, (b) +5 °C, (c) −5 °C, and (d) −15 °C.An exponential increase in conductivity is observed for methane hydrate samples with NaCl added. +5 °C to −5 °C arerelevant temperature conditions of natural hydrate deposits.
Figure 9. Log‐conductivity plot of all runs for both step‐dwell heating(solid line) and natural freezer cooling (dotted line) measurements.A hysteresis is observed for all samples except pure methane hydrate withno salt added (sample NH0).
10.1029/2019JB018364Journal of Geophysical Research: Solid Earth
LU ET AL. 10,887

structure itself as an impurity or doping agent. With increasing salt content at the bulk‐sample level, a per-colation threshold is then crossed (>0.25 wt % NaCl) and sufficient salt ions begin to interact with the dipoleof the H2O molecules in the methane hydrate lattice, destabilizing them, and forming a conductive brinenetwork (Sylva et al., 2016). The existence of an interconnected liquid phase changes the primary pathwayfor electric current (no longer solely solid‐state hopping mechanisms) as observed from the nonlinear logconductivity behavior of samples with higher salt contents (Figures 7 and 9).
At increasing temperatures above the liquidus, conductivity begins to sharply increase for higher salt contentsamples (NH1.0–SH3.5). One possible explanation involves an increase in pore water that could form frompartial dissociation of the methane hydrate phase. Since localized regions of these samples may have satu-rated levels of brine (23 wt%NaCl), it is possible that the ~19 °C phase stability temperature for puremethanehydrate can drop down to ~13 °C at ~20‐MPa conditions (Cha et al., 2016; Jager & Sloan, 2001; Hu et al.,2017). Hence, the higher temperature regions are possibly unstable for localized regions of methane hydratewith high‐salinity brine. As observed in the partially dissociated pure methane hydrate sample (NH0), gen-erating pore liquid can cause a substantial increase in conductivity (Figure 2a). Several simple petrophysicaltwo‐phase mixing models (Archie's law and other derivatives) also suggest brine melt fractions can poten-tially reach up to 10 vol % at +15 °C for sample NH2.5 (Table S3) (Archie, 1942; Hermance, 1979).Furthermore, the additional pore water generated fromhydrate dissociationmay dissolve neighboring excessNaCl(s), which could increase the concentration of ionic carriers (increased salinity) in the liquid brine phasethat dictates the conductivity of the system (Resistivity of NaCl Water Solutions, 2009).
Between the liquidus and solidus, ice, halite, hydrohalite, and brine can all coexist but in varying proportionsdepending on temperature and salinity. As temperature approaches the liquidus from below, the brine‐to‐hydrohalite ratio will increase as more hydrohalite melts incongruently into halite and saturated brine.The amount and/or distribution of hydrohalite may be insufficient, however, to produce enough brine toaffect conductivity significantly. This is a possible explanation for the relatively small changes in the logconductivity observed in the temperature regime between the liquidus and solidus (Figure 7).
When the temperature drops to the solidus, the last remaining volume of liquid (brine) will “freeze” into asolid eutectic mixture of ice and hydrohalite (Figures S2g, S2h, and S2i) and causes the log conductivity of allNaCl‐bearing samples to drop to roughly the same level (−24 °C in Figure 7). The hydrohalite solidus in aNaCl‐H2O system is typically −21 °C, but due to kinetics and sample temperature lag inside the vessel,we do not observe this phenomenon until the bath temperature reaches −24 °C (De Roo et al., 1983;Grimm et al., 2008; Light et al., 2009). At this point, all conduction mechanisms will be purely by hoppingof charge carriers in a solid‐state mixture composed of ice, hydrohalite, methane hydrate, and any undis-solved halite (Figure 1). Similar sharp changes in conductivity have been observed in NaCl‐H2O mixtureswhere brine channels form into coexisting ice + hydrohalite at the eutectic (Grimm et al., 2008). Also, likeice, methane hydrate might not completely exclude salt ions from its crystal lattice, particularly during late‐stage synthesis under the closed‐system conditions here, and instead low concentrations (~ppm) may besoluble in the lattice, increasing the conductivity of the system (Buehler et al., 2007; Conde et al., 2017;Petrenko & Whitworth, 1999). Du Frane et al. were able to model and show that impurities from the sandact as dopants and contribute to the conductivity of methane hydrate mixtures proportional to the volumefraction of the sand added up to 45 vol % sand (Du Frane et al., 2015, section S1 and equation S5). Similarly,it is possible some amount of NaCl can be incorporated into the methane hydrate lattice as charge carriers,regardless of the overall NaCl concentration added. Thus, all hydrate samples with NaCl exhibit similar con-ductivities below the solidus when there is no liquid brine to obscure the doping effect (−24 °C in Figure 7).Also, since hydrohalite has a lower conductivity (<10−4 S/m) than doped methane hydrate (>10−4 S/m), thedoped methane hydrate becomes the dominant conduction pathway and this may well explain why the mini-mum conductivity is at the level of sample NH0.25 and not sample NH0 or lower levels (Grimm et al., 2008).
Equivalent circuit models can provide insight into the conditions that cause conduction mechanisms toundergo significant change, which is not always exhibited in the activation energy or the absolute magnitudeof the conductivity. In the ECM for samples NH1.0, NH1.75, and NH2.5, the high‐temperature regime isdetermined to have the conduction circuit model “R+RCPE+RCPE.” The unpaired third resistor elementin series may potentially exist in all NaCl samples but is negligible contributor to the bulk sample resistance.This third resistor element has a small value and becomes resolvable only when the bulk conductivity is high
10.1029/2019JB018364Journal of Geophysical Research: Solid Earth
LU ET AL. 10,888

enough (>10−2 S/m)or vice versa, bulk resistivity is low enough (<102Ω/m). If this third resistor element repre-sents brine and is “in series” instead of “in parallel” based on the ECM, this may indicate the brine network isnot 100% interconnected between the two silver electrodes, as originally suspected. It is possible that charge car-riers need to travel through both a liquid and a solid phase in order to move through the sample. On the otherhand, sample SH3.5 with an ECM of “R+RCPE” was prepared via flash‐freezing using liquid N2 (Figure 6e).Perhaps thismethod creates greater salt uniformity at the grain‐scale level, which allows a fully interconnectedbrine network to form. Although the dielectric response of sample SH3.5 is not fully resolved in the frequencyrangemeasured, the highly conductive system can still be accuratelymodeled as a bulk resistor with negligiblecapacitance. TheECMsuggests the only capacitance detected is frompolarization at the electrode‐sample inter-face, similar to a Randles cell, “R+RCPE” (Barsoukov &Macdonald, 2005). Therefore, these different spectralbehaviors between samples NH2.5 and SH3.5 indicate electrical properties of methane hydrate are stronglydependent not only on salinity, but also salt distributions.
In summary, we see three conduction regimes: (1) at the lowest test temperatures below the solidus or at thelowest salinity, conduction is primarily by solid state diffusion of ionic defects in methane hydrate with noliquid. (2) Between the solidus and liquidus, where a connected saturated brine network forms for higher‐salinity samples and coexists with hydrohalite and ice, conduction depends greatly on the brine‐hydrohaliteratio but not significantly on temperature. (3) Above the liquidus, upon final melting of ice and hydrohalite,conduction is governed by the salinity (dissolved solute concentration) and volume of the brine network. Innatural marine environments, gas hydrate‐bearing systems form above the liquidus and hence conductivitywill be dominated by pore liquids (brine). Regardless, with the many kinetic factors to consider in thesecomplicated mixed‐phase systems, reaching thermodynamic and chemical equilibrium in the laboratory—by controlling time, temperature, and composition—is extremely important for obtaining accurate mea-surements that are relevant to the full range of conditions where gas hydrates can form in nature.
5. Conclusions
We measured the electrical properties of methane hydrate coexisting with brine and excess CH4 gas over awide range of temperatures, including those relevant to gas hydrate occurrences in nature, and quantifiedthe effect of NaCl on bulk‐sample conductivity. Impedance and electrical conductivity for mixtures contain-ing methane hydrate and NaCl‐bearing brine were found to be most sensitive to the connectivity, overallconcentration of ionic solutes (salinity) and melt fraction that occurs at higher temperatures. The distribu-tion of the fluid phase becomes less important, however, once connected.
The effect of adding NaCl when synthesizingmethane hydrate is profound. Adding NaCl influences the crys-tal habit development, causing highly rounded and irregular morphologies with increasing NaCl concentra-tion. In regard to electrical properties, accumulation of ~15 ± 5 vol % pure H2O pore water within samples at+5 °C increases conductivity by approximately half a log scale relative to pure methane hydrate, whereasNaCl‐brine elicits an exponential increase in conductivity with increasing concentrations of solute. At thegeologically relevant temperature of +5 °C, the addition of 2.5 wt % NaCl increases conductivity by over2 orders of magnitude relative to pure methane hydrate. Methane hydrate synthesized from seawater(SH3.5, with 2.7 wt % NaCl and 0.8 wt % as other salts) exhibits even higher conductivities at +5 °C, suggest-ing that similar effects on conductivity are produced by other ionic compounds as well. At salt concentrationslow enough to prevent a well‐connected brine phase from forming, the presence of salt still exerts significantinfluence on electrical conductivity. Adding 0.25 wt % NaCl to the initial ice reactant was found to effectivelydope the resulting methane hydrate, and increased conductivity by ~1 order of magnitude compared withpure methane hydrate over the measured temperature range. Furthermore, all NaCl‐bearing samples testedhere are presumed to contain doped methane hydrate upon late‐stage synthesis, based on low‐temperature(<−24 °C) impedance measurements of all NaCl‐bearing samples converging to the doped‐hydrate valueafter final freezing or crystallization of coexisting brine. ECM provided valuable information in combinationwith phase equilibria and impedance spectroscopy that confirmed brine as the conduction pathway in sam-ples with high salt content and at high temperatures, while cryo‐SEM verified the connected nature of thebrine and the apparent formation of hydrohalite within it upon cooling to subsolidus temperatures.
These findings highlight what are likely only a few of the effects that salts may impart on the formation andconductivity of methane hydrate in nature. Phase changes within the brine component that accompany each
10.1029/2019JB018364Journal of Geophysical Research: Solid Earth
LU ET AL. 10,889

thermal cycling event during sample synthesis here—including repeated formation and eventualmelting/dissolution of ice, hydrohalite, and halite—complicate the role of temperature dependence on bulksample conductivity. The evolution and connectivity of gas‐filled pore space during synthesis may result inadditional effects, although presumably minimal due to the electrically insulating properties of gas itself atthe test conditions here. Nonetheless, we show that conductivity of the bulk samples is predominantly influ-enced by salinity changes and the presence of pore liquid, and these results can in turn benefit gas hydratesaturation models.
Other characterization techniques such as micro‐computed tomography (μCT) can give additional insightsinto wetting angle behaviors by revealing hydrate pore sizes and fluid volumes. Further coupling of impe-dance spectroscopy with imaging capabilities of μCT may help in correlating bulk conductivity with the for-mation of methane hydrate and the evolution of brine channels, as well as changes in localized salinity as afunction of temperature and time. These combined techniques, for instance, may enable better understand-ing of variables that destabilize or limit gas hydrate growth in natural environments containing free‐phasemethane gas, such as those proximal to gas chimneys where water‐limited or salt‐limited multiphase envir-onments exist (Liu & Flemings, 2007).
Lastly, we note that our experimental results are obtained under closed‐system conditions where salt con-centration remains constant at the bulk sample level, but that may reach highly or fully saturated levelsin the coexisting brine as hydrate synthesis nears completion.While such high‐salinity brines may not neces-sarily form in more open systems with greater flux of seawater, particularly over geologic time scales, weshow that simple petrophysical mixing models such as Archie's law can still help infer pore water fractionseven in methane hydrate samples with little‐to‐no salt impurities (Table S3). Electromagnetic remote sen-sing studies in the field can also benefit from the salinity‐conductivity insights gained from this work toaid interpretation of field data. For instance, while the role of brine might be very different in an open systemdominated by seawater than for our closed systemmeasurements, we have shown that the presence of NaClwill increase the electrical conductivity of hydrate by about an order of magnitude over pure methanehydrate, to a conductivity represented by NH0.25. This is similar to the effect observed by Du Frane et al.(2015) associated with impurities derived from natural sand grains, which also increased conductivity byabout an order of magnitude. The use of Archie's law for the interpretation of well logs and field CSEMresults requires the inclusion of hydrate conductivity for high hydrate saturations, where the role of seawaterin the pore space is diminished. Such high concentrations have been observed by Matsumoto et al. (2017),with well logs peaking at about 2,000 Ω/m resistivity (5 × 10⁻⁴‐S/m conductivity) in fairly good agreementwith our measurements for methane hydrate formed in the presence of NaCl. The relationship between thecoexisting fluid phase and conductivity is applicable to both closed and open systems as long as salinity, pres-sure, and temperatures are known. For natural gas‐hydrate bearing formations with additional componentsand/or sediment fractions to account for, more complex mixing models to accurately infer gas hydrate con-centration will be required.
ReferencesAlavi, S., Susilo, R., & Ripmeester, J. A. (2009). Linking microscopic guest properties to macroscopic observables in clathrate hydrates:
Guest‐host hydrogen bonding. Journal of Chemical Physics, 130(17), 174501. https://doi.org/10.1063/1.3124187
Archer, D. (2007). Methane hydrate stability and anthropogenic climate change. Biogeosciences, 4(4), 521–544. https://doi.org/10.5194/bg‐4‐521‐2007
Archie, G. E. (1942). The electrical resistivity log as an aid in determining some reservoir characteristics. Transactions of AIME, 146, 54–67.
Attias, E., Weitemeyer, K., Holz, S., Naif, S., Minshull, T. A., Best, A. I., et al. (2018). High‐resolution resistivity imaging of marine gashydrate structures by combined inversion of CSEM towed and ocean‐bottom receiver data. Geophysical Journal International, 214(3),1701–1714. https://doi.org/10.1093/gji/ggy227
Attias, E., Weitemeyer, K., Minshull, T. A., Best, A. I., Sinha, M., Jegen‐Kulcsar, M., et al. (2016). Controlled‐source electromagnetic andseismic delineation of subseafloor fluid flow structures in a gas hydrate province, offshore Norway. Geophysical Journal International,206(2), 1093–1110. https://doi.org/10.1093/gji/ggw188
Barnes, P. R. F., & Wolff, E. W. (2004). Distribution of soluble impurities in cold glacial ice. Journal of Glaciology, 50(170), 311–324. https://doi.org/10.3189/172756504781829918
Barsoukov, E., & Macdonald, J. R. (2005). Physical and Electrochemical Models. In Impedance Spectroscopy: Theory, Experiment, andApplications (2nd ed., chap. 2.2, pp. 80–129). Hoboken, NJ: John Wiley & Sons Inc.
Bloom, H., & Heymann, E. (1947). The electrical conductivity and the activation energy of ionic migration of molten salts and their mix-tures. Proceedings of the Royal Society of London Series A‐Mathematical and Physical Sciences, 188(1014), 392–414. https://doi.org/10.1098/rspa.1947.0016
10.1029/2019JB018364Journal of Geophysical Research: Solid Earth
LU ET AL. 10,890
AcknowledgmentsSupport for this work was provided byU.S. Department of Energy contractDE‐FE0028972 and InteragencyAgreement DE‐FE0026382 between theUSGS Gas Hydrate Project andDOE/NETL. Prepared by LLNL undercontract DE‐AC52‐07NA27344. IMrelease number: LLNL‐JRNL‐777845.Any use of trade, firm, or productnames is for descriptive purposes onlyand does not imply endorsement by theU.S. Government. The authors wish tothank P. Kannberg (SIO), W. Waite(USGS), D. Lockner (USGS), A. Cook(OSU), and an anonymous reviewer forthe constructive comments on themanuscript. Raw data for this researchwork are available on the Open SourceFramework repository DOI:10.17605/OSF.IO/MJQ6P

Bondarenko, A. S., & Ragoisha, G. A. (2005). In A. L. Pomerantsev (Ed.), Progress in Chemometrics Research (pp. 89–102, Version 16.07.2013(the program is available online at). New York: Nova Science Publishers. http://www.abc.chemistry.bsu.by/vi/analyser/
Boswell, R., & Collett, T. S. (2011). Current perspectives on gas hydrate resources. Energy & Environmental Science, 4(4), 1206–1215. https://doi.org/10.1039/c0ee00203h
Buehler, M. G., Chin, K. B., Seshadri, S., Keymeulen, D., Anderson, R. C., & McCann, T. A. (2007). Electrical properties probe measureswater/ice content of martian soils using impedance spectroscopy, paper presented at 2007 IEEE Aerospace Conference, Big Sky, MT,Mar 03‐10.
Cai, J., Wei, W., Hu, X., & Wood, D. A. (2017). Electrical conductivity models in saturated porous media: A review. Earth‐Science Reviews,171, 419–433.
Cha, M. J., Hu, Y., & Sum, A. K. (2016). Methane hydrate phase equilibria for systems containing NaCl, KCl, and NH4Cl. Fluid PhaseEquilibria, 413, 2–9. https://doi.org/10.1016/j.fluid.2015.08.010
Chaouachi, M., Falenty, A., Sell, K., Enzmann, F., Kersten, M., Haberthur, D., & Kuhs, W. F. (2015). Microstructural evolution of gashydrates in sedimentary matrices observed with synchrotron X‐ray computed tomographic microscopy. Geochemistry, Geophysics,Geosystems, 16, 1711–1722. https://doi.org/10.1002/2015GC005811
Chen, X., Espinoza, N., Tisato, N., & Flemings, P. B. (2018). X‐ray micro‐CT observation of methane hydrate growth and dissociation insandy sediments, Abstract H41K‐2231 presented at 2018 Fall Meeting, AGU, Washington, D.C., 13 Dec.
Chen, X. Y., & Espinoza, D. N. (2018). Ostwald ripening changes the pore habit and spatial variability of clathrate hydrate. Fuel, 214,614–622. https://doi.org/10.1016/j.fuel.2017.11.065
Chong, Z. R., Yang, S. H. B., Babu, P., Linga, P., & Li, X. S. (2016). Review of natural gas hydrates as an energy resource: Prospects andchallenges. Applied Energy, 162, 1633–1652. https://doi.org/10.1016/j.apenergy.2014.12.061
Collett, T., Bahk, J. J., Baker, R., Boswell, R., Divins, D., Frye, M., et al. (2015). Methane Hydrates in Nature‐Current Knowledge andChallenges. Journal of Chemical and Engineering Data, 60(2), 319–329. https://doi.org/10.1021/je500604h
Conde, M. M., Rovere, M., & Gallo, P. (2017). Spontaneous NaCl‐doped ice at seawater conditions: focus on the mechanisms of ioninclusion. Physical Chemistry Chemical Physics, 19(14), 9566–9574. https://doi.org/10.1039/C7CP00665A
Constable, S., Kannberg, P. K., & Weitemeyer, K. (2016). Vulcan: A deep‐towed CSEM receiver. Geochemistry, Geophysics, Geosystems, 17,1042–1064. https://doi.org/10.1002/2015GC006174
Cook, A. E., & Waite, W. F. (2018). Archie's Saturation Exponent for Natural Gas Hydrate in Coarse‐Grained Reservoirs. Journal ofGeophysical Research: Solid Earth, 123, 2069–2089. https://doi.org/10.1002/2017JB015138
Das, S., & Bhattacharyya, A. J. (2011). Dielectric Relaxation Spectroscopy for Evaluation of the Influence of Solvent Dynamics on IonTransport in Succinonitrile‐Salt Plastic Crystalline Electrolytes. Journal of Physical Chemistry B, 115, 2148–2154.
De Roo, J. L., Peters, C. J., Lichtenthaler, R. N., & Diepen, G. A. M. (1983). Occurrence of methane hydrate in saturated and unsaturatedsolutions of sodium‐chloride and water in dependence of temperature and pressure. AICHE Journal, 29(4), 651–657. https://doi.org/10.1002/aic.690290420
Du Frane, W. L., Stern, L. A., Constable, S., Weitemeyer, K. A., Smith, M. M., & Roberts, J. J. (2015). Electrical properties of methanehydrate plus sediment mixtures. Journal of Geophysical Research: Solid Earth, 120, 4773–4783. https://doi.org/10.1002/2015JB011940
Du Frane, W. L., Stern, L. A., Weitemeyer, K. A., Constable, S., Pinkston, J. C., & Roberts, J. J. (2011). Electrical properties of polycrystallinemethane hydrate. Geophysical Research Letters, 38, L09313. https://doi.org/10.1029/2011GL047243
Grimm, R. E., Stillman, D. E., Dec, S. F., & Bullock, M. A. (2008). Low‐frequency electrical properties of polycrystalline saline ice and salthydrates. Journal of Physical Chemistry B, 112, 15,382–15,390.
Hermance, J. F. (1979). The electrical conductivity of materials containing partial melt: A smiple model for Archie's law. GeophysicalResearch Letters, 6(7), 613–616.
Hesse, R., & Harrison, W. E. (1981). Gas hydrates (clathrates) causing pore‐water freshening and oxygen isotope fractionation in deep‐water sedimentary sections of terrigenous continental margins. Earth and Planetary Science Letters, 55, 453–462. https://doi.org/10.1016/0012‐821X(81)90172‐2
Hornbach, M. J., Holbrook, W. S., Gorman, A. R., Hackwith, K. L., Lizarralde, D., & Pecher, I. (2003). Direct seismic detection of methanehydrate on the Blake Ridge. Geophysics, 68(1), 92–100. https://doi.org/10.1190/1.1543196
Hu, Y., Lee, B. R., & Sum, A. K. (2017). Phase equilibrium data of methane hydrates in mixed brine solutions. Journal of Natural Gas Scienceand Engineering, 46, 750–755. https://doi.org/10.1016/j.jngse.2017.08.004
Jager, M. D., & Sloan, E. D. (2001). The effect of pressure on methane hydration in pure water and sodium chloride solutions. Fluid PhaseEquilibria, 185(1‐2), 89–99. https://doi.org/10.1016/s0378‐3812(01)00459‐9
Kulessa, B. (2007). A critical review of the low‐frequency electrical properties of ice sheets and glaciers. Journal of Environmental andEngineering Geophysics, 12(1), 23–36. https://doi.org/10.2113/jeeg12.1.23
Kuustraa, V. A., & Hammershaimb, E. C. (1983). Handbook of Gas Hydrate Properties and Occurrence (U.S. Dept of Energy Publication)DOE/MC/19239‐1546. Washington, DC: Lewin and Associates, Inc.
Kvenvolden, K. A. (2000). Gas hydrate and humans. Gas Hydrates: Challenges for the Future, 912, 17–22. https://doi.org/10.1111/j.1749‐6632.2000.tb06755.x
Lee, J. Y., Santamarina, J. C., & Ruppel, C. (2010). Parametric study of the physical properties of hydrate‐bearing sand, silt, and claysediments: 1. Electromagnetic properties. Journal of Geophysical Research, 115, B11104. https://doi.org/10.1029/2009JB006669
Lee, M. W., & Collett, T. S. (2011). In‐situ gas hydrate hydrate saturation estimated from various well logs at the Mount Elbert Gas HydrateStratigraphic Test Well, Alaska North Slope. Marine and Petroleum Geology, 28(2), 439–449. https://doi.org/10.1016/j.marpetgeo.2009.06.007
Li, F. G., Sun, C. Y., Li, S. L., Chen, G. J., Guo, X. Q., Yang, L. Y., et al. (2012). Experimental Studies on the Evolvement of ElectricalResistivity during Methane Hydrate Formation in Sediments. Energy & Fuels, 26(10), 6210–6217. https://doi.org/10.1021/ef301257z
Liang, J. Q., Zhang, Z. J., Su, P. B., Sha, Z. B., & Yang, S. X. (2017). Evaluation of gas hydrate‐bearing sediments below the conventionalbottom‐simulating reflection on the northern slope of the South China Sea. Interpretation‐a Journal of Subsurface Characterization, 5(3),SM61–SM74. https://doi.org/10.1190/int‐2016‐0219.1
Light, B., Brandt, R. E., & Warren, S. G. (2009). Hydrohalite in cold sea ice: Laboratory observations of single crystals, surface accumula-tions, and migration rates under a temperature gradient with application to Snowball earth. Journal of Geophysical Research, 114,C07018. https://doi.org/10.1029/2008JC005211
Liu, X., & Flemings, P. B. (2007). Dynamic multiphase flow model of hydrate formation in marine sediments. Journal of GeophysicalResearch, 112, B03101. https://doi.org/10.1029/2005JB004227
10.1029/2019JB018364Journal of Geophysical Research: Solid Earth
LU ET AL. 10,891

Lu, R., Stern, L. A., Du Frane, W. L., Pinkston, J. C., & Constable, S. (2018). Electrical Conductivity of Methane Hydrate with Pore Fluids:New Results from the Lab. Fire in the Ice, 18, 7–11.
Majumdar, U., Cook, A. E., Shedd, W., & Frye, M. (2016). The connection between natural gas hydrate and bottom‐simulating reflectors.Geophysical Research Letters, 43, 7044–7051. https://doi.org/10.1002/2016GL069443
Maslin, M., Owen, M., Betts, R., Day, S., Dunkley Jones, T., & Ridgwell, A. (2010). Gas hydrates: past and future geohazard? PhilosophicalTransactions of the Royal Society A‐Mathematical Physical and Engineering Sciences, 368(1919), 2369–2393. https://doi.org/10.1098/rsta.2010.0065
Matsumoto, R., Tanahashi, M., Kakuwa, Y., Snyder, G. L., Ohkawa, S., Tomaru, H., & Morita, S. (2017). Recovery of thick deposits ofmassive gas hydrates from gas chimney structures, eastern margin of Japan Sea: Japan Sea Shallow Gas Hydrate Project. Fire in the Ice,17(1), 1–6.
McCarthy, C., Cooper, R. F., Kirby, S. H., Rieck, K. D., & Stern, L. A. (2007). Solidification and microstructures of binary ice‐I/hydrateeutectic aggregates. American Mineralogist, 92, 1550–1560.
McIver, R. D. (1981). Gas hydrates. In R. F. M. J. C. Olson (Ed.), Long‐term energy resources (pp. 713–726). Boston: Pitman.Petrenko, V. F., & Whitworth, R. W. (1999). Physics of Ice. Oxford: Oxford University Press.Presnall, D. C., Simmons, C. L., & Porath, H. (1972). Changes in electrical conductivity of a synthetic basalt during melting. Journal of
Geophysical Research, 77(29), 5665–5672. https://doi.org/10.1029/JB077i029p05665Ren, S. R., Liu, Y. J., Liu, Y. X., & Zhang, W. D. (2010). Acoustic velocity and electrical resistance of hydrate bearing sediments. Journal of
Petroleum Science and Engineering, 70(1‐2), 52–56. https://doi.org/10.1016/j.petrol.2009.09.001Resistivity of NaCl Water Solutions (2009). Schlumberger Log Interpretation Charts 2009 edition, page 8. http://pages.geo.wvu.edu/~tcarr/
pttc/schlumberger_chartbook.pdfRoberts, J. J. (2002). Electrical properties of microporous rock as a function of saturation and temperature. Journal of Applied Physics, 91(3),
1687–1694. https://doi.org/10.1063/1.1430544Roberts, J. J., & Tyburczy, J. A. (1994). Frequency‐dependent electrical properties of minerals and partial melts. Surveys in Geophysics,
15(2), 239–262. https://doi.org/10.1007/bf00689861Roberts, J. J., & Tyburczy, J. A. (1999). Partial‐melt electrical conductivity: Influence of melt composition. Journal of Geophysical Research,
104(B4), 7055–7065. https://doi.org/10.1029/1998JB900111Rodriquez Presa, M. J., Tucceri, R. I., Florit, M. I., & Posadas, D. (2001). Constant phase element behavior in the poly(o‐toluidine)
impedance response. Journal of Electroanalytical Chemistry, 502(1‐2), 82–90.Ruppel, C. D. (2015). Permafrost‐Associated gas hydrate: Is it really approximately 1% of the global system? Journal of Chemical and
Engineering Data, 2015(60), 429–436. https://doi.org/10.1021/je500770mRuppel, C. D., & Kessler, J. D. (2017). The interaction of climate change and methane hydrates. Reviews of Geophysics, 55, 126–168. https://
doi.org/10.1002/2016RG000534Shedd, W., Boswell, R., Frye, M., Godfriaux, P., & Kramer, K. (2012). Occurrence and nature of “bottom simulating reflectors” in the
northern Gulf of Mexico. Marine and Petroleum Geology, 34, 31–40.Shoar Abouzari, M. R., Berkemeier, F., Schmitz, G., & Wilmer, D. (2009). On the physical interpretation of constant phase elements. Solid
State Ionics, 180(14‐16), 922–927. https://doi.org/10.1016/j.ssi.2009.04.002Sloan, E. D. (1998). Gas hydrates: Review of physical/chemical properties. Energy & Fuels, 12(2), 191–196. https://doi.org/10.1021/
ef970164+Sloan, E. D., & Koh, C. A. (2007). Clathrate Hydrates of Natural Gases (3rd ed., Vol. 119, pp. 1–701). Boca Raton, FL: Taylor & Francis
Group.Spangenberg, E., & Kulenkampff, J. (2006). Influence of methane hydrate content on electrical sediment properties. Geophysical Research
Letters, 33, L24315. https://doi.org/10.1029/2006GL028188Stern, L. A., Kirby, S. H., Circone, S., & Durham, W. B. (2004). Scanning electron microscopy investigations of laboratory‐grown gas
clathrate hydrates formed from melting ice, and comparison to natural hydrates. American Mineralogist, 89(8‐9), 1162–1175.Stern, L. A., Kirby, S. H., & Durham, W. B. (1996). Peculiarities of methane clathrate hydrate formation and solid‐state deformation,
including possible superheating of water ice. Science, 273(5283), 1843–1848. https://doi.org/10.1126/science.273.5283.1843Sylva, T. Y., Kinoshita, C. K., & Masutani, S. M. (2016). Inhibiting effects of transition metal salts on methane hydrate stability.
Chemical Engineering Science, 155, 10–15.Trehu, A. M., Long, P. E., Torres, M. E., Bohrmann, G., Rack, F. R., Collett, T. S., et al. (2004). Three‐dimensional distribution of gas hydrate
beneath southern Hydrate Ridge: constraints from ODP Leg 204. Earth and Planetary Science Letters, 222(3‐4), 845–862. https://doi.org/10.1016/j.epsl.2004.03.035
Weitemeyer, K. A., Constable, S., & Trehu, A. M. (2011). A marine electromagnetic survey to detect gas hydrate at Hydrate Ridge, Oregon.Geophysical Journal International, 187(1), 45–62. https://doi.org/10.1111/j.1365‐246X.2011.05105.x
Weitemeyer, K. A., Constable, S. C., Key, K. W., & Behrens, J. P. (2006). First results from a marine controlled‐source electromagneticsurvey to detect gas hydrates offshore Oregon. Geophysical Research Letters, 33, L03304. https://doi.org/10.1029/2005GL024896
Wood, W. T., Gettrust, J. F., Chapman, N. R., Spence, G. D., & Hyndman, R. D. (2002). Decreased stability of methane hydrates in marinesediments owing to phase‐boundary roughness. Nature, 420(6916), 656–660. https://doi.org/10.1038/nature01263
Yoshino, T., Shimojuku, A., Shan, S., Guo, X. Z., Yamazaki, D., Ito, E., et al. (2012). Effect of temperature, pressure and iron content on theelectrical conductivity of olivine and its high‐pressure polymorphs. Journal of Geophysical Research, 117, B08205. https://doi.org/10.1029/2011JB008774
You, K. H., Kneafsey, T. J., Flemings, P. B., Polito, P., & Bryant, S. L. (2015). Salinity‐buffered methane hydrate formation and dissociationin gas‐rich systems. Journal of Geophysical Research: Solid Earth, 120, 643–661. https://doi.org/10.1002/2014JB011190
10.1029/2019JB018364Journal of Geophysical Research: Solid Earth
LU ET AL. 10,892