the effect of discount frequency and depth on consumer ...mela/bio/papers/alba_et_al_1999.pdf ·...
TRANSCRIPT

The Effect of Discount Frequency andDepth on Consumer Price Judgments
JOSEPH W. ALBACARL F. MELATERENCE A. SHIMPJOEL E. URBANY*
The intensity of price discounting by retailers and manufacturers raises importantquestions about consumer price judgments. In the extreme, discounting can takethe form of frequent but shallow discounts or deep but infrequent discounts. Theresearch reported here explores the effects of these strategies on consumerestimation of price levels for competing stores and brands. In an initial experimentin which subjects made brand choices over time, a depth effect was observedthat contrasted with the frequency effect found in previous research. Subsequentexperiments identified the conditions under which depth (vs. frequency) charac-teristics of price data dominate consumers' price-estimation judgments. Fre-quency information is more infiuential when sets of interstore or interbrandcomparative prices exhibit complex and overiapping distributions (hence creatingprocessing difficulty); in contrast, a depth bias occurs when prices have a simpler,dichotomous distribution. These results place pragmatically meaningful limita-tions on the influence of frequency information and illustrate the importance ofcontext in determining consumer price judgments in a promotional environment.
Price is a salient attribute for nearly all consumers invirtually every product category. Basic economics
teaches how changes in price can affect preferences forcompeting alternatives. Economics is a somewhat less use-ful paradigm for understanding the psychological aspects ofprices and price changes. Consumer research is much moreinstructive in this regard, especially as it concerns consumerreactions to a specific price or price change for a particularbrand (Monroe 1973, 1990). However, as Blattberg, Bri-esch, and Fox (1995) note, neither discipline is very infor-mative regarding either the competitive or consumer impli-cations of more complex pricing contexts in which ashopper must form a global impression of an alternative'sprice on the basis of frequently changing prices. The failure
'Joseph W. Alba is Distinguished Professor of Marketing, University ofFlorida, Gainesville, FL 32611-7155. Carl F. Mela is associate professor ofbusiness administration. Duke University, Durham, NC 27708-0120.Terence A. Shimp is a Distinguished Foundation Fellow and professor ofmarketing. University of South Carolina, Columbia, SC 29208. Joel E.Urbany is professor of marketing. University of Notre Dame, Notre Dame,IN 46556-0388. Order of authorship was alphabetically determined. Cor-respondence: Joe Urbany, College of Business Administration, Universityof Notre Dame, Notre Dame, IN 46556-0388; telephone: 219-631-6762;fax: 219-631-5255; e-mail: [email protected]. The authors acknowl-edge the helpful input of the editor, associate editor, the reviewers, and DonLehmann. In addition, the authors thank participants in seminars at DukeUniversity, Yale University, the Universities of Notre Dame, South Caro-lina, and Connecticut, and the 1997 University of Illinois pricing camp.
to address this context is important because consumers, inan effort to reduce complexity, often employ heuristics toarrive at a judgment and then apply that judgment even afterits factual foundation has eroded.
Consider two scenarios in which a price assessment po-tentially could be based on multiple price points. The firstscenario involves price judgments about competing retailstores. Consumers can compare prices at the stores on asmany items as are carried in common by the competitors.Given such a daunting task, consumers are likely to examineonly a subset of the possible information and even mayrefrain from processing the subset fully. Retailers, aware ofthese propensities, attempt to shape consumer perceptionsthrough a variety of methods, including the use of advertis-ing to either communicate the size of their competitive priceadvantage on a small set of salient comparison objects orconvey a fairly consistent price advantage across a majorityof comparison objects. In marketing parlance, these tacticsare known as high-low pricing and everyday low pricing,respectively. Alba et al. (1994) examined a situation inwhich two competing stores adopted these different pricingpolicies. One store was less expensive than the other ontwo-thirds of the items. The competitor store had, by com-parison, an advantage on the remaining third but by anamount that was, on average, twice as large as its disadvan-tage on other items. Thus, the stores had equivalent totalbasket prices. Alba et al.'s (1994) results showed that sub-
99© 1999 by JOURNAL OF CONSUMER RESEARCH. Inc. • Vol. 26 • September 1999
All rights i seiA'ed. 0093-5301/2000/2602-0001 $03.00

100 JOURNAL OF CONSUMER RESEARCH
jects judged the store with frequent, shallow discounts ashaving a lower total basket price.
The second complex data scenario, which is the focus ofthe present research, involves the task of forming pricejudgments about only one or two items but on the basis oflongitudinal data (cf. Jacobson and Obermiller 1990). Sucha situation may arise when a consumer uses a single brandcarried at two stores to determine which store has lowerprices or which of two brands is less expensive, on average,at a particular store. As in the first scenario, consumerjudgments regarding comparative store prices may be influ-enced by the relative frequency with which the stores dis-count a particular brand or, alternatively, by the depth of thediscounts at each store. Under the assumption that process-ing is difficult because prices are observed over time, thedefault expectation in this context would again be a fre-quency effect (cf. Alba et al. 1994; Pelham, Sumarta, andMyaskovsky 1994); that is, the brand with a large number ofsmall discounts would be perceived as having a loweraverage price than the brand with a few, deep discounts.
Yet, previous research that has explicitly analyzed pur-chase behaviors in a brands-over-time context suggests astronger role of discount size in consumer purchase deci-sions. Meyer and Assuncao (1990) found that subjects over-bought when pricing distributions were bimodal (i.e., of-fered more deep discounts) but bought appropriately whenpricing distributions were uniform over time. Similarly,Krishna (1994) found that overstocking was more commonwith larger discounts. More recently, Jedidi, Mela, andGupta (1999) found that deep discounts, more than frequentdiscounts, affect brand choice and purchase quantity. How-ever, none of these studies explicitly examined the effects ofprice-discount distributions on consumers' price judgments.
RESEARCH OBJECTIVESAs suggested above, our initial objective was to ascertain
whether the Alba et al. frequency effect is manifested in thebrands-across-time context.' Accordingly, we first con-ducted a pilot study to test whether frequency or depth cuesare more salient in consumers' estimates of average brandprices. We employed a buying-game task that requiredsubjects to view prices sequentially over several time peri-ods, and it was found that the frequency effect described byAlba et al. does not generalize; in fact, a contrasting deptheffect was obtained. Our consequent goal was to provide atheoretical account of the depth effect and identify theconditions under which a depth (vs. frequency) effect islikely to prevail. We do so in a series of studies that aredescribed following a discussion of the pilot study.
PILOT STUDYWe examined consumer perceptions of pricing in the
context of a buying game that incorporated three brands
having different schedules of regular and discount pricesover time. Mimicking the buying-game context used byKrishna (1991, 1994) and Meyer and Assuncao (1990; seealso Kahn and Louie 1990), this game required subjects tominimize their prices paid and inventory costs incurred overmultiple brand purchases within a single product category(shampoo). Subjects were presented with successivemonthly prices for three brands in the category and on eachoccasion were required to decide whether to make a pur-chase and, if so, what quantity of each brand to purchase. Incontrast to previous buying-game studies, our central inter-est was in subjects' game-ending judgments about brandprices rather than the intervening purchase behavior.
Method
Subjects and Design. Twenty-eight MBA students par-ticipated. Subjects were presented with sequential monthlyprices for three brands during a period of 36 game months.This design feature created a single, three-level within-subjects factor. Although the brands' promotion patternsdiffered with respect to the frequency and depth of theirdiscounts, all three brands had identical average prices. Theconstant brand was priced at $2.39 each month throughoutthe 36 months of the game. The frequency brand was pricedat $2.49 for 18 months but was on sale at $2.29 in the other18. The depth brand was priced regularly at $2.49 for 33periods but was discounted on three occasions to $ 1.29. Forconvenience, we refer to this pricing structure as "6X"inasmuch as the depth brand's discounts were six timeslarger than the discounts of the frequency brand (converse-ly, the frequency brand was on sale six times more oftenthan the depth brand). The discounts were distributed uni-formly throughout the 36 months such that the frequencybrand had exactly three sales randomly distributed through-out each six-period interval, and the depth brand had onesale every 12 periods. The depth brand's last discount didnot appear in the final five periods in order to avoid apotential recency effect.
Materials. The experimental materials consisted ofboth a questionnaire booklet and a computerized slide ishowthat presented the buying-game stimuli. The first page of thebooklet overviewed the experiment by instructing subjectsthat they would be participating in a buying game for agrocery product and that the names of three actual brandswould be disguised with the labels A, B, and C. The nextpage presented fictitious Consumer Reports ratings for thethree shampoo brands. These ratings served to enhance taskrealism.
The booklet subsequently presented a work sheet to beused by subjects for tracking their inventory levels duringeach of the 36 successive purchase periods in the game. Oneach of these periods, a slide presented subjects with thethree shampoo brands and their respective prices.^ Subse-
'Because the Alba et al. research is cited repeatedly, we have removedthe year of publication to facilitate exposition.
frequency (depth) brand always appeared in the left-most (right-most) of three columns, whereas the constant price brand always appeared

DISCOUNT FREQUENCY AND DEPTH 101
quent to observing each slide, subjects used their worksheets to indicate which brand(s) they selected (if any) onthat purchase occasion, how many shampoo bottles theypurchased (if any) during that occasion, and their resultinginventory. At the completion of the simulation, subjectsanswered a series of questions that constituted the depen-dent measures.
The 36 pricing slides were preceded by five instructionalslides. These slides first described the task incentive—namely, that the two subjects with the lowest combinedpurchase and inventory costs would win prizes (logo coffeemugs). The introductory slides next provided instructionsregarding how to calculate the inventory to be recorded onthe inventory worksheet (i.e., current inventory = pastinventory + current purchases - current consumption).Subjects were instructed that consumption equaled one bot-tle per month.
Procedure. After reading the cover page of the booklet,subjects were given 1.5 minutes to examine the ConsumerReports data. They then answered initial brand-qualityquestions. Instructions for the buying game followed. Thegame then began, and each month's prices were presentedon the screen for 20-30 seconds—30 seconds in the firsttwo periods to give subjects a chance to learn the use of theworksheet and 20 seconds thereafter.
Buying-Game Task. Subjects were instructed to assumethat they consumed one bottle of shampoo per month andwere given the objective of minimizing their total purchasecost over the 36-month period. They were informed thattotal purchase cost included both the shampoo's purchaseprice and a $.10 per bottle cost for each bottle inventoriedbut not consumed. On presentation of the three brands'prices in each period, subjects decided (i) whether to buy,subject to a constraint that they must consume one bottle perperiod; (ii) what brand to buy; and (iii) what quantity of thatbrand to buy. Once the brand choice and quantity decisionswere made, subjects used the worksheet to calculate endinginventory and waited until the next month's prices were,revealed to proceed. This process was repeated for each ofthe 36 periods.
Measures. In light of our objective to assess frequencyand depth effects a la Alba et al., our dependent variablesfocus on several dimensions of subjects' beliefs about thebrands' prices at the end of the simulation. Following thefinal purchase period, subjects provided retrospective esti-mates of each brand's average price, sale price, regularprice, and promotional frequency. Unrelated to this study,subjects also provided estimates for each brand of perceivedquality and pricing fairness.
Results and DiscussionA repeated-measures ANOVA was used in analyzing
subjects' price-related ratings for all three brands. The effect
in the middle of the brand set. Subsequent experiments determined thatcounterbalancing the order of brand presentation did not influence results.
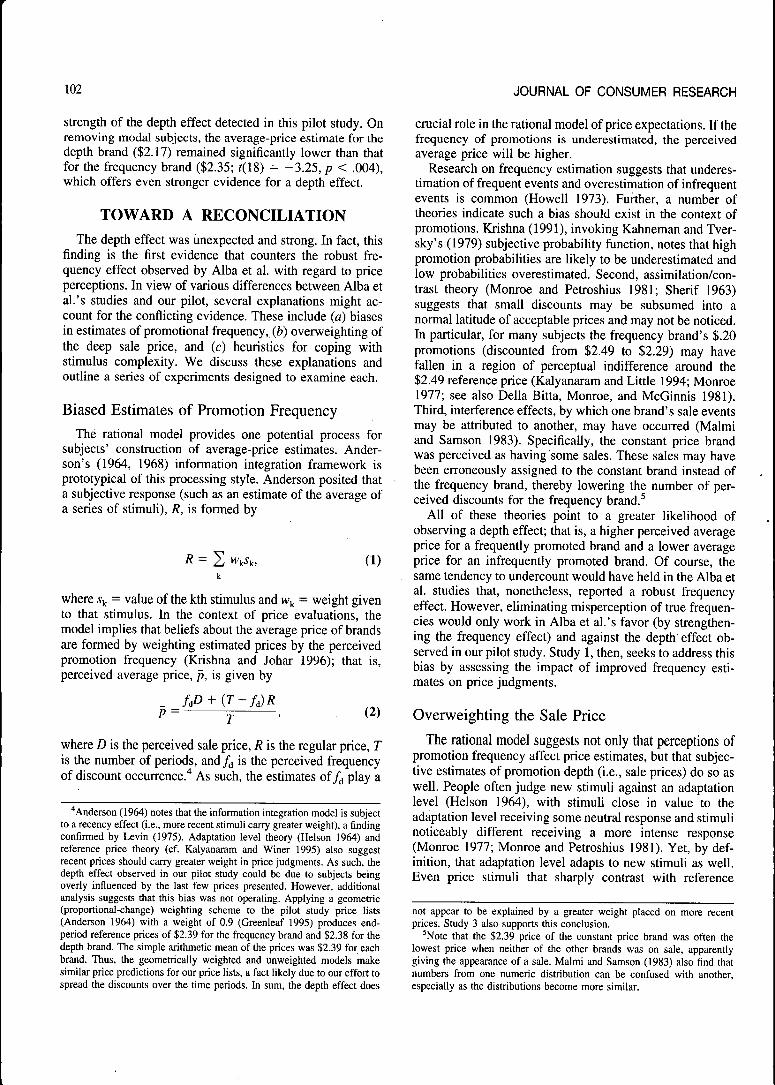
TABLE 1
PILOT STUDY AND STUDY 1 RESULTS
A. Pilot study:Average price:
ActualEstimated
Promo frequency:ActualEstimated
B. Study 1:Average price:
ActualEstimated
No flagFlag
Promo frequency:ActualEstimated
No flagFlag
Pricing pattern
Constantprice
2.392.36
.006.48
2.39
2.392.40
.00
4.382.18
Frequency
2.392.33
18.009.33
2.39
2.352.37
18.00
6.1413.05
Depth
2.392.18
3.004.22
2.39
2.242,31
3.00
3.193.68
p-value(brand)
.002
.002
.000
.000°
"Both the main effect of flag (F(1, 41) = 3.93, p = .054) and the flag-by-pattem interaction (F(2, 40) = 8.77, p < .01) were significant with regard totheir effect on estimated promotion frequency.
of pricing patterri (i.e., constant, frequency, and depth) wassignificant both for the average-price estimate (F(2, 26)= 7.72, p < .01) and perceived promotion frequency (F(2,25) = 8.24, p < .01). The means for each brand are reportedin Table 1, part A. In contrast to Alba et al.'s findings, theaverage-price estimate for the depth brand was significantlylower than that for the frequency brand (?(27) = 3.45, /?< .01) and for the constant brand (f(27) = 4.00, p < .0\)?
It is noteworthy that a follow-up analysis revealed that fornearly one-third of our subjects (9 of 28) the average-priceestimates for the frequency and depth brands were arithmet-ically fiawed. That is, these nine subjects' estimates of abrand's average price actually equaled the brand's regularor discounted price, which of course represent infeasibleaverages insofar as during the 36-month buying game thefrequency and depth brands' prices varied between regularand sale prices. Because these subjects apparently used themode, rather than the arithmetic mean, to estimate averageprices, we label them "modals." Importantly, the inclusionof modal responses in the full analysis actually favored afrequency effect because they typically led to high estimates(i.e., $2.4-9) of the depth brand's average price. Thus, as asource of error variance, these subjects suppressed the
'These conclusions are confirmed when controiling for experiment-wiseerror via the Tukey procedure (Keppel 1982, pp. 155-157). In the pilotstudy, the Tukey minimum significant difference—that is, the smallestdifference in the mean prices between brands that would be significant witha constant experiment-wise alpha of .05—is $.095. This supports the deptheffect, as the depth brand is $.15 lower than the frequency brand and $.18lower than the constant price brand. In subsequent studies involvingmultiple brand comparisons, the Tukey test provided similar confirmation.
102 JOURNAL OF CONSUMER RESEARCH
strength of the depth effect detected in this pilot study. Onremoving modal subjects, the average-price estimate for thedepth brand ($2.17) remained significantly lower than thatfor the frequency brand ($2.35; r(18) = -3.25, p < .004),which offers even stronger evidence for a depth effect.
TOWARD A RECONCILIATION
The depth effect was unexpected and strong. In fact, thisfinding is the first evidence that counters the robust fre-quency effect observed by Alba et al. with regard to priceperceptions. In view of various differences between Alba etal.'s studies and our pilot, several explanations might ac-count for the conflicting evidence. These include (a) biasesin estimates of promotional frequency, (b) overweighting ofthe deep sale price, and (c) heuristics for coping withstimulus complexity. We discuss these explanations andoutline a series of experiments designed to examine each.
Biased Estimates of Promotion Frequency
The rational model provides one potential process forsubjects' construction of average-price estimates. Ander-son's (1964, 1968) information integration framework isprototypical of this processing style. Anderson posited thata subjective response (such as an estimate of the average ofa series of stimuli), R, is formed by
(1)
where Sy. = value of the kth stimulus and w^ = weight givento that stimulus. In the context of price evaluations, themodel implies that beliefs about the average price of brandsare formed by weighting estimated prices by the perceivedpromotion frequency (Krishna and Johar 1996); that is,perceived average price, p, is given by
_P-
where D is the perceived sale price, R is the regular price, Tis the number of periods, and/^ is the perceived frequencyof discount occurrence."* As such, the estimates of/^ play a
Anderson (1964) notes that the information integration model is subjectto a recency effect (i.e., more recent stimuli carry greater weight), a findingconfirmed by Levin (1975). Adaptation level theory (Helson 1964) andreference price theory (cf. Kalyanaram and Winer 1995) also suggestrecent prices should carry greater weight in price judgments. As such, thedepth effect observed in our pilot study could be due to subjects beingoverly influenced by the last few prices presented. However, additionalanalysis suggests that this bias was not operating. Applying a geometric(proportional-change) weighting scheme to the pilot study price lists(Anderson 1964) with a weight of 0.9 (Greenleaf 1995) produces end-period reference prices of $2.39 for the frequency brand and $2.38 for thedepth brand. The simple arithmetic mean of the prices was $2.39 for eachbrand. Thus, the geometrically weighted and unweighted models makesimilar price predictions for our price lists, a fact likely due to our effort tospread the discounts over the time periods. In sum, the depth effect does
crucial role in the rational model of price expectations. If thefrequency of promotions is underestimated, the perceivedaverage price will be higher.
Research on frequency estimation suggests that underes-timation of frequent events and overestimation of infrequentevents is common (Howell 1973). Further, a number oftheories indicate such a bias should exist in the context ofpromotions. Krishna (1991), invoking Kahneman and Tver-sky's (1979) subjective probability function, notes that highpromotion probabilities are likely to be underestimated andlow probabilities overestimated. Second, assimilation/con-trast theory (Monroe and Petroshius 1981; Sherif 1963)suggests that small discounts may be subsumed into anormal latitude of acceptable prices and may not be noticed.In particular, for many subjects the frequency brand's $.20promotions (discounted from $2.49 to $2.29) may havefallen in a region of perceptual indifference around the$2.49 reference price (Kalyanaram and Little 1994; Monroe1977; see also Delia Bitta, Monroe, and McGinnis 1981).Third, interference effects, by which one brand's sale eventsmay be attributed to another, may have occurred (Malmiand Samson 1983). Specifically, the constant price brandwas perceived as having some sales. These sales may havebeen erroneously assigned to the constant brand instead ofthe frequency brand, thereby lowering the number of per-ceived discounts for the frequency brand.^
All of these theories point to a greater likelihood ofobserving a depth effect; that is, a higher perceived averageprice for a frequently promoted brand and a lower averageprice for an infrequently promoted brand. Of course, thesame tendency to undercount would have held in the Alba etal. studies that, nonetheless, reported a robust frequencyeffect. However, eliminating misperception of true frequen-cies would only work in Alba et al.'s favor (by strengthen-ing the frequency effect) and against the depth effect ob-served in our pilot study. Study 1, then, seeks to address thisbias by assessing the impact of improved frequency esti-mates on price judgments.
Overweighting the Sale Price
The rational model suggests not only that perceptions ofpromotion frequency affect price estimates, but that subjec-tive estimates of promotion depth (i.e., sale prices) do so aswell. People often judge new stimuli against an adaptationlevel (Helson 1964), with stimuli close in value to theadaptation level receiving some neutral response and stimulinoticeably different receiving a more intense response(Monroe 1977; Monroe and Petroshius 1981). Yet, by def-inition, that adaptation level adapts to new stimuli as well.Even price stimuli that sharply contrast with reference
not appear to be explained by a greater weight placed on more recentprices. Study 3 also supports this conclusion.
^Note that the $2.39 price of the constant price brand was often thelowest price when neither of the other brands was on sale, apparentlygiving the appearance of a sale. Malmi and Samson (1983) also find thatnumbers from one numeric distribution can be confused with another,especially as the distributions become more similar.

DISCOUNT FREQUENCY AND DEPTH 103
prices still lead to a shift in those reference points (Sherif1963; Urbany, Bearden, and Weilbaker 1988). Anderson(1968) found, in fact, that outliers were systematically over-weighted by subjects in estimating numeric averages (seealso Spencer 1961, 1963). Accordingly, the depth brand'sdeep discounts may exert a disproportionate amount ofinfluence on price judgments.
Vividness/Availability. This evidence would suggestthat extreme prices in our pilot study may have beenweighted by something other than (or in addition to) thefrequency of appearance. One possibility is that the depthbrand sale price is overweighted because it is highly avail-able in memory at the time of price estimation due to theintense impression created by its extremity on observation(Tversky and Kahneman 1973a). In contrast, the larger pricedifferences in Alba et al. were not as extreme, and baseprice points varied significantly. Study 2 examines thisexplanation by substantially raising the depth brand's saleprice to a level closer to its regular price and therebyreducing its extremity.
The experimental task used for our pilot study providesanother potential reason why the depth brand's sale pricesmay be more available in memory, relative to the Alba et al.task. When subjects made brand choices in the pilot study,they may have been especially attentive to the specificprices they were paying for each brand (particularly becausemost stocked up on the depth brand when it went on sale).^As such, the deep discounts, which were chosen by mostsubjects, may have been especially memorable. Conversely,subjects may have been less likely to attend to nonsaleprices. Accordingly, study 3 tests these propositions byadapting our brands-over-time pricing stimuli to a paper-and-pencil task (Alba et al.) that obviates purchase andtherefore precludes subjects from giving special attention toprices paid.
Stimulus Complexity
The pilot study used a dichotomous price distribution.That is, the frequency and depth brands were always pricedat either a single regular or a single discount price (consis-tent with the context of brand-to-brand price comparisonsacross time). Conversely (and consistent with the context ofstore-to-store price comparisons across categories), the dis-tribution in the Alba et al. studies was nondichotomous andmore complex, with price differences between stores on 60different items varying from very small ($.O3-$.O5) to rel-atively large ($.18-$.2O). In addition, the 60-item price listin Alba et al. had widely varying base prices; that is, someitems were priced at less than $1, and others were priced atmore than $3. In contrast, our pilot study presented a singlebase price ($2.49) for both the frequency and depth brands.
This variation in stimulus complexity may explain whyAlba et al. observed a frequency effect and why we ob-served a depth effect in the pilot study. Pelham et al. (1994)
•"We wish to thank a reviewer for suggesting this possibility.
showed that individuals are especially likely to rely on thenumerosity (frequency) heuristic when cognitive resourcesare strained. The brands-over-time context, by definition,presents a relatively simple, dichotomous price distributionconsisting of only two price points for each brand thatappear repetitively. In contrast. Alba et al.'s stimuli posed afar more taxing challenge to their subjects' cognitive abil-ities. It therefore is possible that the nondichotomous pricedistribution in Alba et al.'s study prompts reliance on afrequency heuristic in order to reduce the cognitive de-mands of comparing complex pricing patterns. With simplerprice data, however, depth information is more easily per-ceived and processed, and the frequency heuristic is lesslikely to be invoked.
Anchor and Adjust. A depth effect for dichotomousprices (and not for nondichotomous prices) would be espe-cially likely if subjects follow an anchor-and-adjust strategyin estimating average prices, as Krishna and Johar (1996)suggest. A subject invoking this heuristic first imputes a saleprice and then adjusts upward toward the regular price inorder to obtain an overall mean price judgment. This heu-ristic produces a bias because adjustment is often insuffi-cient. When prices have a dichotomous distribution, eachbrand's sale price is quite clear, particularly the sale price ofa brand regularly using very large discounts. To determinewhether distributional complexity moderates depth/fre-quency effects, studies 4 and 5 manipulate the dichotomous/nondichotomous nature of the price distributions.
Research Questions. In sum, the specific questions thatthe research program addresses are the following:
1. Does a frequency effect occur in a brands-across-time context? (pilot study)
2. Is the depth effect reversed by correcting biasedestimates of promotion frequency (i.e., by increas-ing attention to the frequency brand's promotions)?(study. 1)
3. Is the depth effect reversed by reducing the extrem-ity of the depth brand's sale price? (study 2)
4. Is the depth effect reversed by switching from apurchase task to a perceptual task? (study 3)
5. Is the depth effect reversed when the price stimuliare made more complex? (study 4)
6. Does stimulus complexity (dichotomous vs. nondi-chotomous prices) moderate frequency and deptheffects? (study 5)
STUDY 1
The goal of study 1 was to determine whether the deptheffect observed in the pilot study could be attributed tobiased estimates of promotional frequency. This was ac-complished by repeating the buying game in the pilot studywhile more clearly demarcating the regular and discount
104 JOURNAL OF CONSUMER RESEARCH
prices of the competing brands. For half of the subjects, adiscounted price in any period was signaled by a salemarker, or flag—a procedure akin to the use of shelf-talkersin retail environments (cf. Inman, McAlister, and Hoyer1990). Flags accompanying discounts were used to heightenthe accuracy of subjects' promotion-frequency estimates bydrawing attention to the frequency brand's promotions andthereby potentially reducing the tendency to misassign pro-motions to the constant price brand.
Method
Subjects and Design. Forty-three undergraduates par-ticipated in study 1. The study used a 2 X 3 mixed designwith the same three-level, within-subjects factor from thepilot study (pricing patterns: constant, frequency, and depth)and an additional between-subjects factor (discount flags:present or absent).
Materials and Procedure. The materials used in thebuying game differed from the pilot study in two ways.First, in the flagged condition, the word "sale" appearedeach time the frequency or depth brands were discounted.Second, the Consumer Reports ratings used in the pilotstudy were replaced by scanned images of shampoo bottles(both front and back sides of the bottle) to achieve greaterecological validity. To eliminate potential brand-based ef-fects, all brand-identifying text was removed from the pack-age labels and replaced with Brand A, Brand B, and BrandC. In addition, price-related claims were removed from thelabels to prevent the package text from influencing priceestimates. The bottle images for the three brands were fullycounterbalanced across the constant-, frequency-, anddepth-brand price manipulations. Subjects were told thatpackage information was provided to familiarize them withthe brands in the simulation. They received 1.5 minutes toreview the package information and then were asked to ratethe quality of the three brands on 10-point scales (1 = verylow quality). All remaining aspects of the buying game wereidentical to the pilot study. On completion of the buyinggame, subjects again provided estimates of each brand'saverage price, sale price, regular price, and promotionalfrequency.
Results and Discussion
Table 1, part B, presents the mean estimates of averageprice and promotion frequency for each brand in both theflagged and nonflagged conditions. Because the objective ofthis experiment was to assess whether increasing the accu-racy of the frequency estimates mitigates the price advan-tage of the depth brand, we flrst consider the estimates ofpromotion frequency. Pricing pattern (F(2, 40) = 25.86, p< .01), flag presence (F(l, 41) = 3.93, p < .06), and theirinteraction (F(2, 40) = 8.77, p < .01) all significantlyinfluenced subjects' promotion-f'requency estimates. In thenonflagged condition, as in the pilot study, subjects substan-tially underestimated the 18 promotional events for the
frequency brand (6.14 compared to 18 actual) and overes-timated the number of constant price brand promotions(4.38 compared to 0 actual)^ but were reasonably accuratein their estimates for the depth brand (3.19 compared to 3actual). The presence of flags led to a large improvement inthe accuracy of subjects' estimates of the frequency brand'sdiscounts (13.05), although underestimation of frequencywas still observed. The flags also substantially increasedestimation accuracy of the number of sales offered by theconstant price brand (2.18). Assessment of the number ofdiscounts offered by the depth brand remained relativelyaccurate (3.68).
Although the flags greatly increased the accuracy of salefrequency estimates, they had no signiflcant effect on aver-age-price estimates. The main effect of flag (F(l, 41)= 2.19,;? > .10) and the flag-by-pricing pattern interaction(F(2, 40) < 1) failed to reach significance. The depth effectwas still obtained, as the main effect of pricing pattern wassignificant (f(2, 40) = 10.83, p < .01). Summing over theflag/no flag manipulation, contrasts indicate that the meansfor each brand (constant-price brand = $2.39, frequencybrand = $2.36, depth brand = $2.27) are each significantlydifferent from the others (all r's(42) > 2.68, p < .01). It isnoteworthy that, as in the pilot study, a relatively highpercentage of subjects (12 of 43) used the modal price astheir estimate of a brand's average price that, as notedpreviously, is arithmetically infeasible. Excluding thesesubjects from the analysis, we once again found that themain effect of flag (F(l, 29) = 2.35, p > .10) and theflag-by-pricing pattern interaction (F(2, 28) < 1) were notsigniflcant. The depth effect remained, as the effect ofdiscount pattern was significant (F(2, 28) = 14.47, p < .01).The means for the constant, frequency, and depth brandswere $2.39, $2.36, and $2.23, respectively.
Consistent with the pilot study, the results suggest thatinfrequent but deep discounts in the brands-across-timecontext lead to lower average-price estimates than do fre-quent but small discounts. Given the interactive effects ofpricing pattern and flagging on promotion frequency butonly a main effect of pricing pattern on the average-pricemeasure (independent of flagging), it is apparent that vari-ation in perceived promotion frequency cannot fully ac-count for the depth effect observed in the pilot study andnow in study 1. Thus, we can rule out frequency misper-ceptions as the sole underlying cause of the depth effect. Wenext investigated an explanation suggested by previous re-search regarding information integration, namely, that adepth effect occurs because consumers overweigh saleprices.
'As noted earlier, the fact that subjects perceived the constant pricebrand as having some price discounts may have been due to encoding andretrieving occasions on which the constant brand ($2.39) was less expen-sive than the regular price ($2.49) of the other brands. Although suchconfusion is not unexpected (Kalwani and Yim 1992; Malmi and Samson1983), we attempt to minimize it in the next experiment.
DISCOUNT FREQUENCY AND DEPTH 105
STUDY 2
As indicated previously, outlying stimuli such as deepdiscounts can have an extreme influence on pricing evalu-ations (Anderson 1968; Helson 1964; Monroe 1977; Mon-roe and Petroshius 1981; Spencer 1961, 1963). Therefore,reducing the extremity of such information should reducethe influence of outliers and possibly eliminate or reversethe depth effect. Accordingly, study 2 employed the buyinggame used in study 1 but reduced the extremity of the depthevent so that it paralleled the magnitude advantage adoptedin the Alba et al. studies. It is important to note that Alba etal. obtained consistent and strong evidence for a frequency(vs. depth) effect using the exact same magnitude advantagethat we use in the present study.
Method
Subjects and Design. Thirty-nine undergraduates par-ticipated in a study involving pricing pattern (constant,frequency, and depth patterns) as a single, three-level with-in-subjects factor. (No sale flags were included.)
Materials. The primary change in study 2 involvedincreasing the number of deals for the depth brand andreducing the magnitude of those deals. In both the pilotstudy and study 1, the depth brand had been discounted by$1.20 three times during the 36 periods. In the current study,the depth brand was discounted by $.30 on 12 occasions,and the frequency brand was discounted by $.15 on 24occasions. Thus, the depth brand in this study had half thenumber of sales as the frequency brand, but its discountswere twice the magnitude. The depth brand's discountswere therefore reduced from six times (6X) the frequencybrand's discount magnitude to twice (2X) its magnitude,with a corresponding increase in the number of depth branddiscounts. This pattern (2X) replicates the relative depth/frequency magnitude-of-discount structure used by Alba etal. The depth brand's discounts were again uniformly dis-tributed across the 36 months and had an average priceequaling that of the constant and frequency brands ($2.39).
Procedure and Measures. We employed the same buy-ing-game procedure used in the previous studies. Subjects,on completion of the game, again provided estimates ofeach brand's average price, sale price, regular price, andpromotional frequency.
Results and Discussion
The effect of pricing pattern on the average-price esti-mate was again significant (F(2, 37) = 25.46,/? < .01). Theaverage-price estimates were $2.35 and $2.31 for the fre-quency and depth brands, respectively (r(38) = 2.67, p= .01), thus evidencing a depth effect. Similar to the resultsof the pilot study and study 1, the average price for theconstant price brand was estimated at $2.41, which wassignificantly higher than the estimated prices for both thefrequency (/(38) = 7.23, p < .01) and depth brands (f(38)
= 5.03, p < .01). After removing four (of 39) modalsubjects, the depth effect remained significant (F(2, 33)= 23.94, p < .01; constant brand mean = $2.41, frequencybrand mean = $2.35, depth brand mean = $2.29).
Promotion frequency estimates were reasonably consis-tent with the earlier studies. That is, subjects accuratelyrecognized the larger promotion frequency for the depthbrand (12.87 vs. 12 actual), underestimated promotion fre-quency for the frequency brand (6.46 vs. 24 actual), andperceived the constant price brand to be on sale occasionally(3.31 vs. 0 actual).*
Whereas Alba et al.'s studies revealed a consistent andstrong frequency effect, we again produced a depth effect.Insofar as both Alba et al. and we assigned the identical(2X) magnitude advantage to the depth brand (vis-tl-vis thefrequency brand), we can conclude from study 2 that thedepth effect cannot be explained completely by the size ofmagnitude advantage per se. Moreover, the results continueto suggest that the depth effect is a reliable finding.
Inasmuch as all of the experiments presented thus farhave involved the buying-game task, we cannot at this pointrule out the possibility that the depth brand's sale pricesreceived extra weight in the average-price calculus becauseprices paid in the task were more available in memory. Inaddition, although we have no definitive explanation for themodal response problem, it appears that some subjects sim-ply misinterpreted the average-price question. A small fol-low-up study revealed that some subjects apparently be-lieved that our average-price question asked for a normal ormost frequent price (both of which are infeasible as aver-ages).^ Study 3 addresses both concerns.
STUDY 3
In this study, we shift from the buying-game exercise toa paper-and-pencil task comparable to that employed byAlba et al. The intention is to eliminate unique attention tosale prices motivated by purchase incentives. We addition-ally supplement the average-price measure from our previ-
*Again, the perceived promotion frequency for the frequency brand mayhave been so low because its small discounts were subsumed into theregular price variation across brands. However, note that the perceptionthat the depth brand had more sales than the frequency brand in study 2could explain the depth effect. A follow-up study indicated, however, thatpromotion frequency estimates are not the critical explanatory factor. Thestudy (n = 38 undergraduates) presented only the frequency and depthbrands and used the original 6X pricing structure. Otherwise, the procedureand design were the same as study 2. Subjects continued to underestimatepromotion frequency for the frequency brand (12.71 relative to 18 actual)and to overestimate promotion frequency for the depth brand (5.18 relativeto 3 actual). In this instance, the frequency brand was perceived to havemore sales than the depth brand, yet the estimated average prices for thefrequency brand ($2.35) and the depth brand ($2.31) were identical to thoseobtained in study 2.
'The specific wording for our average-price question was, "If you tookan average across all the 36 months and you had to give one number foreach brand, what would you say was the average price for [name ofbrand]?" Our emphasis on providing a single number may have led somesubjects to believe they were to select the one number from the distributionof prices they had seen most often (as opposed to the average).

106 JOURNAL OF CONSUMER RESEARCH
ous studies with the basket-price measure used by Alba etal. to enhance comparability to their work and provideinsight into our modal subjects' behavior.
Method
Subjects and Design. Subjects were 70 undergraduateswho participated in a classroom setting. All prices werepresented simultaneously in the questionnaire booklet, andthe buying-game instructions were replaced with Alba etal.'s more incidental processing instructions. A 2 (withinsubjects) X 2 (between subjects) design was employed.Pricing pattern (frequency vs. depth patterns) representedthe two-level within-subjects factor. (We presented pricesfor only the frequency and depth brands in order to simplifythe task, eliminate interference from the constant-pricebrand, and maximize similarity to Alba et al.) The between-subjects factor was the discount ratio of the depth brandrelative to the frequency brand (2X vs. the 6X used in theearlier buying-game studies). This factor was manipulatedto determine whether the extremity of the depth cue affectsprice perceptions in the simultaneous presentation format.
Materials and Procedure. All experimental materialswere contained in a booklet distributed to subjects. The firstpage provided a general description of the study and indi-cated that the following page would present a price list fortwo competing brands of shampoo. The instructions furthernoted that subjects would have three minutes to look overprices for the two brands for a recent 36-month period, afterwhich they would be asked about the relative value of theshampoo brands. The prices were presented in a three-column format following the instructions on a page thatlisted month number. Brand A price, and Brand B price. Thefrequency and depth price patterns were counterbalancedacross columns.
Subjects were assigned randomly either to the 2X or 6Xcondition. The experimenter timed subjects' exposure to theprice list for three minutes, announcing the halfway pointand the stop time. Subjects then turned to the final pages andcompleted the measures.
Measures. The final two pages of the booklet containedmeasures of subjects' price and promotion beliefs. Subjectsresponded to two different measures of brand price esti-mates, the order of which was counterbalanced. One mea-sure was the perceived average price at each store (as in thepreceding studies), and the other was the perceived overallbasket price (as in the Alba et al. studies). The basketmeasure was worded as follows (cf. Alba et al): "On theprice lists you just saw, the total price at each store was lessthan $100 but more than $70. With this range in mind,please estimate as accurately as possible the total price forthe shampoo brand at each store over the 36-month period.In other words, assume that you bought the shampoo everymonth at the same store. How much would you have paid intotal?"
Results and Discussion
Thirty-four subjects responded first to the basket-pricemeasure, and 36 responded first to the average-price mea-sure. Because the first measure taken infiuences the second,we report only the first measure from each subject. Wefound that the 2X/6X manipulation did not affect the dif-ference in means for either the basket measure (F(2, 32)< 1) or the average-price measure (F(2, 34) = 1.37, p< .21). This result supports our earlier finding that the deptheffect is robust across discount levels. Consequently, theremaining results were pooled across this factor.
The mean basket price was $83.51 for the depth brandand $85.26 for the frequency brand (f(33) = 1.88, p < .07),again demonstrating a depth effect. The results for theaverage-price measure were not significant; the depthbrand's mean was $2.38, and the frequency brand's meanwas $2.36 (/(35) < 1). Further inspection of the average-price measure revealed a large number of subjects (14 of 36)who responded by providing the modal price. On excludingthese subjects, a significant depth effect was obtained: thedepth brand received a significantly lower average-priceestimate, $2.34, than the frequency brand, $2.38 (/(21)= 2.27, p < .02).
The presence of the basket measure provides us with ameans of assessing the appropriateness of holding outmodal subjects in the previous analysis. Remarkably, theimplied monthly average-price estimates of the 34 subjectswho answered the basket question were very similar to theaverage-price estimates provided by the nonmodal subjects:$2.32 for the depth brand ($83.51/36) and $2.37 for thefrequency brand ($85.26/36). Taken together, the data pro-vide consistent evidence of a depth effect in an experimentalcontext that paralleled Alba et al.'s paradigm.
These results rule out experimental context (buying-gamevs. simultaneous-presentation format) and its associated ef-fect on availability as an explanation for the depth effect. Italso seems unlikely that the depth effect is due to mererecency bias insofar as the price data for each period in thepresent study were presented simultaneously. Finally, thegreater involvement likely produced by the buying game inthe preceding studies cannot alone explain the depth effect;the same effect was obtained in the less-involving taskemployed in the present study.
Our third major conceptual explanation yet to be ad-dressed is the complexity of the price distribution. To thispoint, we have presented subjects with simple dichotomousprice distributions containing prices that vary for each brandonly between regular and sale prices. Pelham et al.'s (1994)findings suggest that the difficulty of processing a morecomplex price distribution may increase reliance on a fre-quency (numerosity) heuristic. Distributional complexity,the remaining potential moderator of the depth effect, isexamined in studies 4 and 5.
STUDY 4
In study 4, we examine other aspects of the price distri-bution that distinguish the current studies from Alba et al.'s.

DISCOUNT FREQUENCY AND DEPTH 107
Consider the 2X condition in study 2, in which the pricestructure was dichotomous. When the depth brand was onsale, its advantage over the frequency brand invariably was$.30; the frequency brand's advantage was always $.15when it was on sale. These price differentials were constant,easy to calculate, distinct from each other, and repeatedfrequently. In contrast, the store price differentials in Albaet al.'s price lists varied significantly. That is, the store withlarger discounts (the magnitude store) had an advantage aslarge as $.19 on some items and as small as $.03 on others.In addition, the price distributions were overlapping; that is,some of the magnitude store's price advantages weresmaller than the frequency store's. Further complicatingsubjects' task of tracking these variable price differentials inthe Alba et al. studies was the widely varying base prices foritems in their price lists, which varied from under $1 to over$3. Consequently, the frequency effect consistently ob-served by Alba et al. may have arisen due to the increasedcomplexity of the pricing distribution and subjects' corre-sponding invocation of a numerosity heuristic (Pelham et al.1994). In study 4, therefore, we introduced varying saleprices to create a nondichotomous distribution of prices. Weadditionally manipulated whether the price differentialswere overlapping.
Method
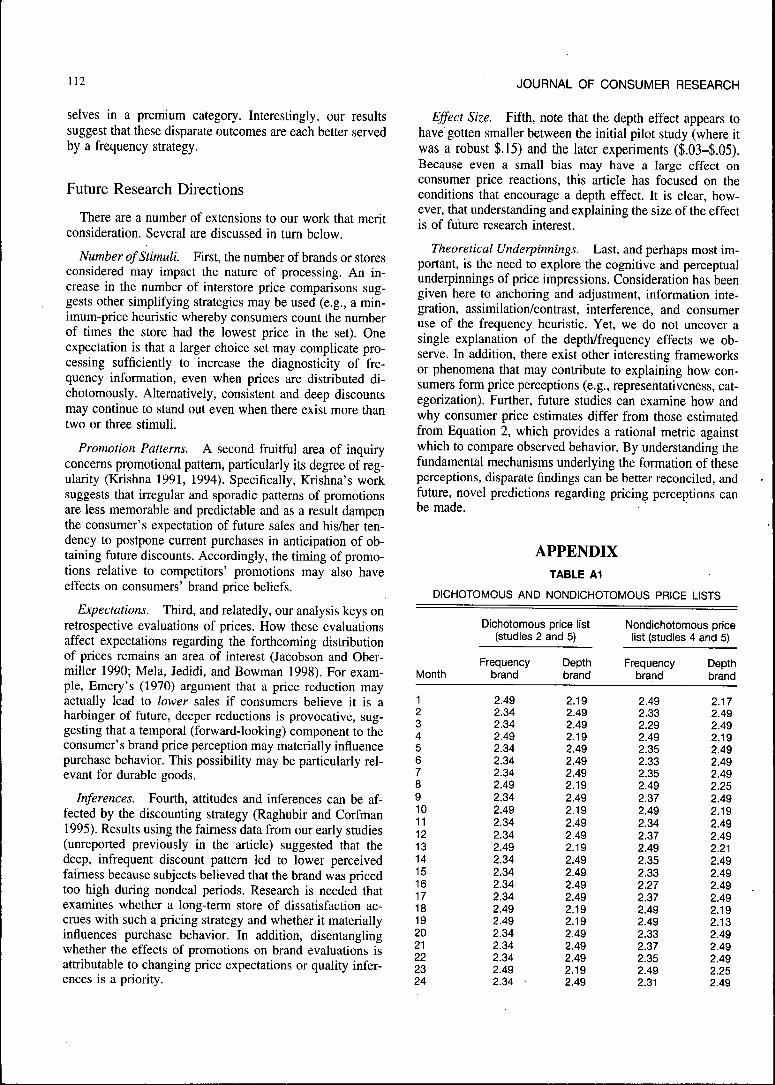
Subjects and Design. Subjects were 45 undergraduates.The experiment involved a paper-and-pencil task, as instudy 3. To create an even closer resemblance to Alba et al.,the price stirnuli were presented as prices for a singleshampoo brand available at two supermarkets that, pursuantto Alba et al., were named Clark's and Taylor's. The studyhad a 2 X 2 mixed design. Pricing pattern (frequency anddepth patterns) was again a within-subjects factor, whereasthe nature of price-list distributions (overlapping or non-overlapping) was manipulated between subjects. As in Albaet al., but in contrast to our previous studies, the twoprice-list distributions contained nondichotomous pricessuch that sale prices were variable for the frequency anddepth stores rather than constant. Using the Alba et al. pricelist as a reference point, price lists for study 4 were gener-ated as follows:
1. We retained the same pattern and order of priceadvantages conveyed in the first 36 items in theAlba et al. list. This means that the pattern offrequency-store and depth-store advantages in ourprice list is identical to Alba et al.'s first 36 items.For example, in the Alba et al. list, the frequencystore had lower prices on the second, third, fifth,and sixth items. In our price lists (see the Appen-dix), the frequency store had lower prices on theexact same items (now labeled "months"). For agiven period, we assigned a price of $2.49 to which-ever of the two stores priced the item higher.
2. In the nondichotomous price list, the frequency anddepth stores' prices were initially set using the
identical between-store price differentials for eachof the first 36 items used by Alba et al. So, which-ever store was lower priced in a given period in thelist, it was lower by the same margin as the corre-sponding store in the Alba et al. price list. Forexample, on item 1 in the Alba et al. list, thefrequency store was priced $.32 higher than themagnitude store. On item two, the frequency storewas priced $.16 lower. These differences were rep-licated in our price list.
3. The price list was then adjusted to create equaltotals by subtracting $.01 from each of the depthbrand's sale prices (its regular prices remained$2.49). This $.01 adjustment was needed becauseAlba et al. equated the prices of the stores across 60items, whereas we borrowed only the first 36. Thisslight adjustment corrected the small discrepancybetween the two stores' total prices.
This procedure resulted in a price distribution in which,as in Alba et al., the between-store price differentials wereoverlapping; that is, the frequency store had some priceadvantages that were as large as those in the depth store's.The mean price of the shampoo at each store was $2.45, andthe range of the price advantages was $.03-$. 13 for thefrequency store and $.06-$.18 for the depth store. We thencreated a second, nonoverlapping price distribution inwhich the depth store's price advantages would be moreobvious when shampoo in that store was on sale. That is,price advantages for the depth store were larger than theprice advantages for the frequency store when shampoo inthat store was lower priced. To create this nonoverlappingprice distribution, a constant $.18 was subtracted from thedepth store's sale prices in the overlapping price list, and aconstant $.09 was subtracted from the frequency store's saleprices. These modifications resulted in Nonoverlappingmean shampoo prices of $2.39 at each store. The priceadvantages ranged from $.12 to $.22 for the frequency storeand from $.24 to $.36 for the depth store. The Appendixprovides the nonoverlapping price list under the columnlabeled "Nondichotomous Price List." Note that, consistentwith Alba et al., (i) the depth advantage was 2X on average,(ii) depth and frequency stores never promoted in the sameperiod, and (iii) at least one store promoted in each of the 36periods. As before, the frequency- and depth-store pricepatterns were counterbalanced across columns.
Materials and Procedure. As in study 3, subjectswere presented with a booklet containing all the experi-mental materials. The study 4 booklet was identical tothat used in study 3 except for the insertion of a nondi-chotomous price list (either the overlapping or nonover-lapping version) and alteration of the text in reference toretail stores as opposed to brands. Study 4 followed thesame procedure as in study 3.
Measures. In light of the fact that the price lists pre-sented prices from different retail stores and assuming that
108 JOURNAL OF CONSUMER RESEARCH
consumers tend to think of retail prices more in terms ofbaskets rather than averages, we obtained only the basket-price measure in study 4. The other measures (promotionfrequency, sale price, regular price) were the same as ob-tained in earlier studies.
Results and Discussion
Initial analysis revealed that the overlapping and non-overlapping conditions produced nearly identical differ-ences in price estimates for the frequency and depth stores.Subsequent analysis accordingly was based on data col-lapsed across these conditions. For the first time in ourseries of studies, the results replicated the frequency effectreported by Alba et al. The mean basket price for 36 monthsof shampoo at the frequency store was $84.05, whereas thecorresponding mean for the depth store was $86.69 (r(44)= 1.92, p = .06). Interestingly, the frequency store's esti-mated basket-price advantage of $2.64 (for 36 periods) issmaller than the $7-$8 basket-price advantage for the fre-quency store that was typical in the Alba et al. studies (for60 items). This comparison suggests that the nonvaryingbase prices in the current studies (i.e., a constant regularshampoo price of $2.49) yielded a less complex pricingdistribution that was less taxing for subjects to process incomparison to the price differentials in Alba et al.'s studies.
From the results of our first four studies, we have ob-tained several insights into the research questions enumer-ated before study 1. In particular, frequency misestimation,depth extremity, and purchase task do not appear solelyresponsible for the depth effect. In contrast, the finding instudy 4 strongly suggests that a nondichotomous, or cogni-tively complex, price distribution is capable of inducing afrequency effect. To provide a more complete assessment ofprice distribution as the primary switch responsible forinducing a frequency or depth effect, the next study sys-tematically manipulates dichotomous versus nondichoto-mous pricing structures. Moreover, in study 5 we return tothe brands-across-time context to control for study 4's po-tential, albeit unlikely, contextual confound, namely, the useof stores instead of brands.
STUDY 5
Study 5, like the previous study, uses the general Alba etal. framework consisting of a paper-and-pencil instrument,simultaneous presentation of price lists, and subsequentmeasurement of brand price perceptions. The key differ-ences between studies 4 and 5 are that, in the latter, wepresent prices for two brands in one store over time (asopposed to prices for one brand in two stores), manipulatewhether the price distribution is dichotomous or nondi-chotomous (as opposed to including only nondichotomousprices), and obtain measures of both average and basketprices (instead of only basket prices). Given the precedingtheoretical discussion and the foregoing evidence from pre-vious studies, we hypothesize an interaction between pro-
motional strategy and price-distribution complexity on priceestimation. Specifically,
Hla: Compared to the depth brand, the frequencybrand will be perceived as being lower pricedwhen the price distribution is nondichotomous(i.e., varying sale prices).
Hlb: Compared to the depth brand, the frequencybrand will be perceived as being higher pricedwhen the price distribution is dichotomous (i.e.,nonvarying sale prices).
Method
Subjects and Design. Sixty-one undergraduates partici-pated. The study employed a 2 (within subjects) X 2 (be-tween subjects) design. Consistent with previous studies,frequency- and depth-brand pricing patterns were manipu-lated within subjects. Price distribution (dichotomous vs.nondichotomous) was a two-level, between-subjects factor.
Materials and Procedure. The experimental bookletwas essentially the same as that used in studies 3 and 4. Inparticular, prices were presented simultaneously, and sham-poo remained the focal product. The Appendix presents thetwo price distributions used in study 5. The dichotomousdistribution was identical to that used in study 2 (i.e., 2X);the nondichotomous distribution was the same as in study 4.Only the nonoverlapping version of the nondichotomousdistribution was used, in which the brands had mean pricesof $2.39 to match the dichotomous list. The regular price ofeach brand was $2.49. In the dichotomous condition, thefrequency brand offered 24 discounts of $.15; the depthbrand offered 12 discounts of $.30. In each of the four cellsthe mean price was $2.39. Iii neither price-distribution con-dition did the frequency and depth brands discount concur-rently. The procedure was identical to those used in studies3 and 4.
Measures. Following inspection of the price list, sub-jects again provided responses to questions about brandprices and promotion frequencies. Half the subjects {n= 30) answered the basket question first, whereas the otherhalf (n = 31) responded first to the average-price question.As before, we report results based on just the initial measureadministered to each subject.
Results and Discussion
Basket Measure. A repeated-measures ANOVA indi-cated an interaction between the frequency/depth and di-chotomous/nondichotomous factors (F(2, 28) = 3.74, p< .06). Consistent with the directional hypotheses, all sub-sequent contrasts are conducted with one-tailed tests. In thedichotomous condition, the mean basket prices for the fre-quency and depth brands were $84.74 and $83.50, respec-tively, but the $1.24 depth-brand advantage was only direc-tional (?(15) < 1). In the nondichotomous case, the totalperceived basket price for the frequency brand was $83.74

DISCOUNT FREQUENCY AND DEPTH 109
and for the depth brand $86.68 (?(13) = 2.46, p < .02).Results for the basket measure therefore are consistent withthe hypothesized interaction.
Average Measure. The interaction effect failed toachieve significance when all subjects were included in theanalysis (F(l, 28) < 1). However, on excluding modalresponses, a significant interaction emerged that mirroredthe result for the basket-price measure (F(l, 23) = 4.72, p< .04). In the dichotomous condition (n = 13), the meanprice of the frequency brand was perceived to be $2.39, andthe mean price of the depth brand was estimated at $2.36(/(12) = 1.31, p < .11). In the nondichotomous case (n= 12), the frequency brand's mean price was $2.34, and thedepth brand's mean price was $2.37 (/(ll) = 1.74, p < .06).These results generally comport with predictions of a fre-quency effect when prices have a nondichotomous distribu-tion (Hypothesis la) and a depth effect when the distribu-tion is dichotomous (Hypothesis lb).
Pooling across Measures. A similar and stronger con-clusion is reached when pooling across the average andbasket measures via Rosenthal's (1991) Z-test procedure.'"Basket-price estimates were divided by 36 to obtain anequivalent average-price figure. The depth effect was mar-ginally significant in the dichotomous condition (Z = 1.37,p < .09), and the frequency effect was significant in thenondichotomous condition (Z = 2.68, p < .01).
Perceived Promotion Frequency and Sale Prices as Ex-planators. In seeking to explain these robust differencesfor the two price-distribution conditions, it is useful torevisit promotion frequency in study 5 as a potential ex-planatory factor. The perceived discount frequencies of thedepth and frequency brands in study 5 are nearly identicalacross the dichotomous and nondichotomous cases. Themean number of perceived sales for the frequency brandwas 18.4 for the dichotomous case and 19.7 for the nondi-chotomous case (actual = 24). The mean perceived fre-quency for the depth brand was 13.4 in both cases (actual= 12). The interaction was not significant (F(l, 50) < 1).Thus, although the tendency to underestimate frequenciesfor the frequency brand persisted, there was no effect ofprice distribution on the promotion frequency estimates foreither brand. Consistent with study 1, these findings suggestthat the perceived promotion frequencies were not respon-sible for the reversal in brand price estimates in the dichot-omous and nondichotomous conditions.
Given that perceived promotion frequency does not differacross the price-distribution conditions, the rational infor-mation integration model (Eq. 2) points to perceptions ofregular price or sale price as potential causes of the reversal.
' " L e t s i n d e x s t u d i e s { s = 1 , . . . , N } , t h e n
Rosenthai (1991) argues the Z-test is the most robust pooling test under thewidest range of conditions. See also Mosteller and Bush (1954).
Although the cell means for perceived regular prices dovary somewhat (ranging from $2.45 to $2.49 compared toan actual of $2.49), they provide little insight into thedifferential frequency/depth effects in the two price-distri-bution conditions. However, the perceived sale prices aremore diagnostic. Study 5 evidences substantial inaccuracyin the encoding of sale price information in the nondichoto-mous condition, in which the frequency effect is obtained.The frequency brand's sale price was estimated to be $2.27(actual = $2.34), and the depth brand's sale price wasestimated at $2.23 (actual = $2.19). In contrast, subjectsshowed more accurate perceptions of sale prices in thedichotomous condition, in which the frequency and depthbrands' sale prices were estimated to be $2.33 and $2.21,respectively. These between-group differences are sup-ported by a significant brand-by-distribution interaction(F(l, 51) = 8.45, p < .01).
The accurate sale price estimates provided by subjects inthe dichotomous condition are likely the result of repeatedexposure to a single discount level for each brand. Incontrast, the less accurate estimates in the nondichotomouscondition may have been driven by declining attention orinterference. The former would be an understandable out-come of frustration from trying to maintain an accuratemnemonic record of such complicated information. An in-terference explanation is supported by prior research indi-cating that subjects may confuse the respective sources oftwo overlapping distributions (Malmi and Samson 1983).Interference suggests that subjects attributed some of thedepth brand's discounts to the frequency brand and viceversa. This outcome is consistent with subjects' reportedprice beliefs and is also compatible with Spencer's (1961)conclusion that "increased scatter leads to greater uncer-tainty in judgments" (p. 326).
The between-group differences in estimated sale pricesare interesting in light of the lack of difference in estimatedfrequency. In the case of the nondichotomous condition, theresults support Alba et al. Relative sale frequency wasperceived accurately, whereas differences in the depth of thesale were barely perceived. Consequently, estimated aver-age prices of the two brands favored the frequency brand. Inthe case of the dichotomous condition, both relative dis-count frequency and absolute discount depth were encodedmore accurately. Two explanations can account for whythese subjects favored the depth brand. First, employing therational model, relatively accurate estimation of depth com-bined with biased perception (overestimation) of absolutepromotion frequency leads arithmetically to a lower averageprice for the depth brand. However, the preceding studies donot provide strong support for a pure arithmetic explanation.Across studies, the depth effect appears to be uninfluencedby large shifts in perceived frequency. A second possibilityinvolves the ubiquitous anchoring-and-adjustment heuristic(Tversky and Kahneman 1973b). That is, subjects who hadfirm beliefs about the sale price of the brands may haveanchored on this price when generating their average price.Insufficient adjustment upward from the discount priceswould result in a lower perceived price for the depth brand.

no JOURNAL OF CONSUMER RESEARCH
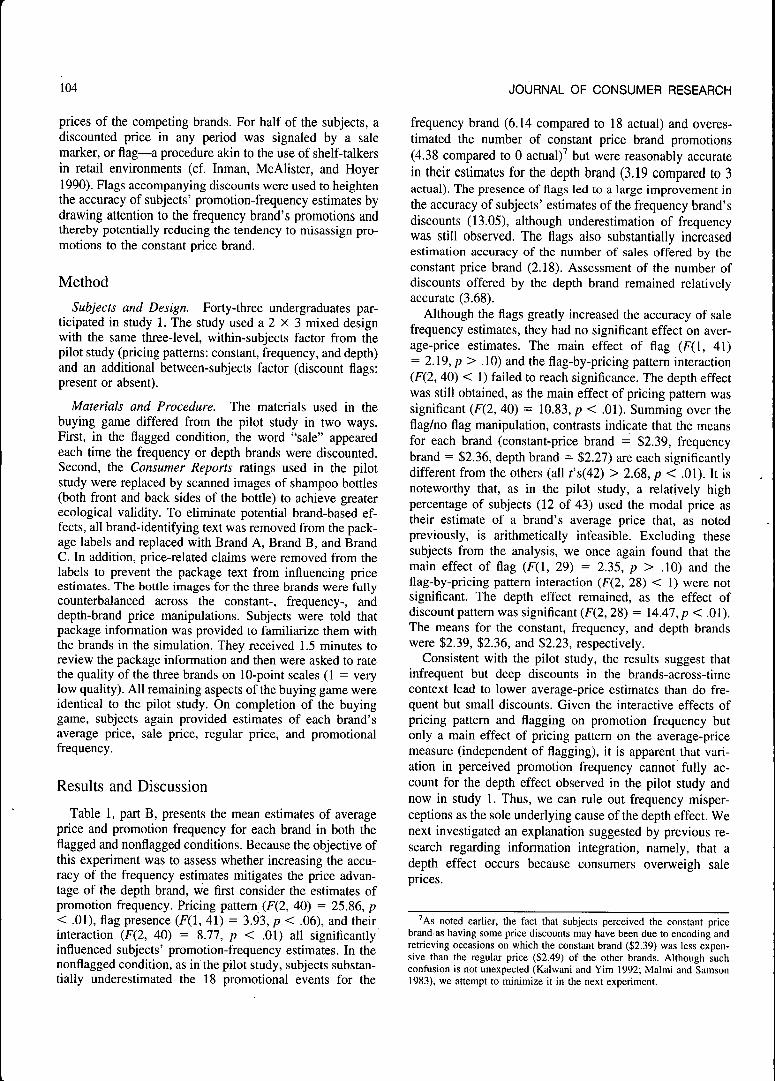
TABLE 2
SUMMARY OF RESEARCH QUESTIONS AND RESULTS
Research question Study Effect observed Answer to research question
1. Does a frequency effect occurin a brands-across-timecontext?
2. Is the depth effect reversedby correcting biasedestimates of promotionfrequency (i.e., by increasingattention to the frequencybrand's promotions)?
3. Is the depth effect reversedby reducing the extremity ofthe depth brand's sale price?
4. Is the depth effect reversedby switching from a purchasetask to a perceptuai task?
5. is the depth effect reversedwhen the price stimuli aremade more complex?
6. Does stimulus complexity(dichotomous vs.nondichotomous prices)moderate frequency anddepth effects?
Pilot study: Buying game, threebrands—frequency, constantprice, and depth pricingpatterns
Study 1: Promotion fiags versusno flags manipulated
Study 2: Depth brand discountsreduced to 2x (from 6x)
Study 3: Adapted brands-over-time price lists to the Alba etal. paper-and-pencilparadigm where brand pricesare presented simultaneouslyon a single page
Study 4: Stiil using the study 3task, changed sale prices foreach brand so that theyvaried
Study 5: Stiil using the study 3task, manipulated pricedistribution: dichotomousversus nondichotomous
Depth effect (brand with a fewvery deep discounts wasperceived to have a loweraverage price than a brandwith many smail discounts)
Depth effect occurs in bothflagged and unflaggedconditions
Depth effect
Depth effect
Frequency effect
Depth effect for dichotomousprices
Frequency effect fornondichotomous prices (seealso results pooled acrossstudies)
No; frequency effect is not justmitigated, it is reversed (thedepth cue becomesdominant) in the brands-across-time context
No; suggests that biasedestimates of promotionfrequency do not fully explainthe depth effect^
No; suggests that overweightingof extreme sale prices doesnot expiain the depth effect"
No; task motivation/attention toprices paid do not expiain thedepth effect''
Yes; more compiex pricedistribution reversed thedepth effect back to afrequency effect
Yes
*This conclusion is further supported in study 5 in which different price distributions produce similar promotion frequency estimates yet iead to different effectsof promotion frequency and depth on average-price estimates.
•This conciusion is further supported in study 3 in which the manipulation of promotional depth again failed to eliminate the depth effect.•This conclusion is further supported in study 5 in which a depth effect is again evidenced without a purchase task.
As is typically the case, direct process evidence for ananchoring-and-adjustment explanation is difficult to obtain.However, debriefing of a small number of subjects yieldedarticulations of a processing strategy that were consistentwith such an explanation. Prior evidence for the use ofminimum perceived levels in the estimation of averages hasbeen reported by Spencer (1963), who found nearly half ofall subjects use perceived minimum numbers in the calcu-lation of averages.
GENERAL DISCUSSIONIn contrast to the traditional economic view of price as a
decision variable reflecting objective budgetary sacrifice,behavioral researchers have argued that consumers mayinterpret price information in a biased manner (Emery 1970;Monroe 1973, 1990; Monroe and Krishnan 1985). Ourresearch is consistent with the latter view in finding that twodifferent discounting strategies with identical average pricesled to very different price estimations. After empiricallyexamining several possible conceptual accounts of the deptheffect (including underestimation of promotion frequencyand memory availability), we conclude that the direction of
the differences depended on the complexity of the pricedistributions. Table 2 presents a summary of this experi-mental program and the answers to our research questions.
Previous research has suggested that frequent, shallow pricedifferences lead to lower price perceptions. We conclude,however, that the findings of Alba et al. do not always gener-alize. When brand prices vacillate between a constant regularprice and single sale price, the opposite is often true; deep,infrequent discounts lead to lower perceived prices than doshallow, infrequent discounts. This result is illustrated morepowerfully by pooling across all studies. We aggregated meansand sample sizes from each of our six studies (pilot throughstudy 5) and then employed Rosenthal's (1991) Z-test to com-pare means. In combining results across different conditions inwhich the basket- and average-price measures were taken, wedivided basket-measure responses by 36 to obtain equivalentunits. Across all studies, 250 subjects (including modals) werepresented with a dichotomous price distribution, whereas 73subjects were exposed to a nondichotomous distribution. Theaverage-price estimates across all subjects are plotted in FigurelA. The results provide strong support for the brand-by-pricedistribution interaction hypothesis. Specifically, a significant

DiSCOUNT FREQUENCY AND DEPTH I I I
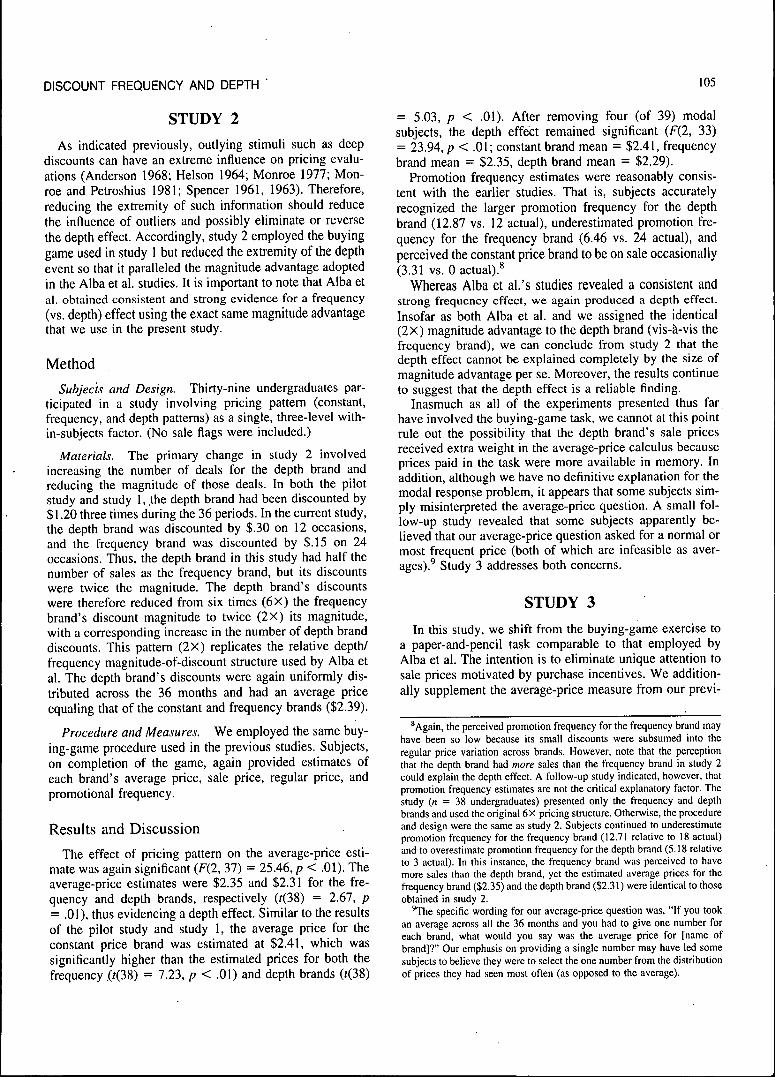
FIGURE 1
POOLED AVERAGE-PRICE ESTIMATES
A. All Subjects
$2.40
Non-Dichotomous
Dichototn)us(n=2SO)
S2.31
2.40
138
136
134
132
130
S2.36
Brand
Freq
B. Nonmodals Only
EstiinatedAvaagePrice
2.40
138
Depdi
Z36
Z34
2.32
130
$2.36
$133
$2.40
Non-Dichotomous (n=71)
Dichotomous (nFl90).
S278Brand
Freq Depth
NOTE.—To combine the basket and average measures, we divided thebasket measure by 36 periods to obtain its equivaient average price. (Thisoperation is independent of the pooiing test.)
depth effect emerges when prices are distributed dichoto-mously (i.e., when each brand has a single sale price; Z = 4.29,p < .01), whereas a significant frequency effect occurs whenthe brands' prices have a nondichotomous distribution (i.e.,each brand's sale prices are variable; Z = 2.49, p < .01). Thispattern is even stronger when modals are excluded from thesample (Fig. IB). The analysis suggests the findings are validacross studies, subjects, and measures, even accounting formeasurement error introduced by subjects who misinterpretedthe average-price question.
What would explain these effects? One possibility is thatsubjects use an anchor-and-adjust strategy when formingprice judgments in the brands-over-time context (Krishna
and Johar 1996). Using this strategy, subjects would firstformulate a sale-price judgment and then adjust upwardfrom that base price toward the regular price to arrive at ajudgment regarding a brand's average price. In the dichot-omous condition, where deep discounts are vivid and per-ceived readily, estimated prices for the depth brand arelower (vis-a-vis the frequency brand) because the anchor isitself lower. In the nondichotomous condition, discounts areless vivid because the pricing distributions are more com-plex. Moreover, when prices are nondichotomous, interfer-ence (Malmi and Samson 1983) may blur the distinctionbetween the frequency and depth brands' sale prices. As aresult, depth is less diagnostic and frequency becomes thedominant cue. This account is consistent with other para-digms and empirical results examining retrospective judg-ments of events such as the frequency heuristic outlined inAlba et al., the salience of vivid or more extreme events(Frederickson and Kahneman 1993; Taylor and Thompson1982), and the regularity and similarity of promotionalevents (Menon 1993).
We note that the foregoing explanation does not rule outother potential processes that may be invoiced by consumerswhen forming price judgments, nor is it an explanation thatmay be invoked in all contexts. For example, the simpledichotomous distribution may enable and encourage within-brand processing, which highlights depth of discounts,while the complex nondichotomous price distribution mayinstead lead to a default cross-brand processing heuristic.Our intent is not to disregard other reasonable processeswhereby consumers make these judgments, but rather tooffer one potential explanation for our findings. Clearly,more research is needed to understand how and when con-sumers process price information to arrive at price judg-ments, how those judgments are represented in memory,and how they influence purchase decisions. For example,new methodologies that tap implicit (rather than explicit)memory have recently provided some interesting insightsinto consumers' memory representations of price (Monroeand Lee 1999).
Implications
These findings hold important implications in at least twodifferent contexts: (a) when consumers form price judg-ments about stores based on relative competitive prices and{b) when consumers form price judgments about brands thatdiscount over time. Managerial action in both instances callsfor choosing between shallow, frequent price advantages ordeep, infrequent advantages. Given that managers inher-ently trade off depth and frequency, does it benefit the firmor store (image-wise) to have more, but smaller, competitiveprice advantages or fewer, yet bigger, advantages? Thedifferential price beliefs engendered by adopting these al-ternative pricing schedules are an important factor in un-derstanding which discount structure is optimal in whichcontext. Stores, for example, generally wish to create alow-price image. Conversely, brands may wish to be per-ceived as higher priced should they desire to position them-
112 JOURNAL OF CONSUMER RESEARCH
selves in a premium category. Interestingly, our resultssuggest that these disparate outcomes are each better servedby a frequency strategy.
Future Research Directions
There are a number of extensions to our work that meritconsideration. Several are discussed in turn below.
Number of Stimuli. First, the number of brands or storesconsidered may impact the nature of processing. An in-crease in the. number of interstore price comparisons sug-gests other simplifying strategies may be used (e.g., a min-imum-price heuristic whereby consumers count the numberof times the store had the lowest price in the set). Oneexpectation is that a larger choice set may complicate pro-cessing sufficiently to increase the diagnosticity of fre-quency information, even when prices are distributed di-chotomously. Alternatively, consistent and deep discountsmay continue to stand out even when there exist more thantwo or three stimuli.
Promotion Patterns. A second fruitful area of inquiryconcerns promotional pattern, particularly its degree of reg-ularity (Krishna 1991, 1994). Specifically, Krishna's worksuggests that irregular and sporadic patterns of promotionsare less memorable and predictable and as a result dampenthe consumer's expectation of future sales and his/her ten-dency to postpone current purchases in anticipation of ob-taining future discounts. Accordingly, the timing of promo-tions relative to competitors' promotions may also haveeffects on consumers' brand price beliefs.
Expectations. Third, and relatedly, our analysis keys onretrospective evaluations of prices. How these evaluationsaffect expectations regarding the forthcoming distributionof prices remains an area of interest (Jacobson and Ober-miller 1990; Mela, Jedidi, and Bowman 1998). For exam-ple, Emery's (1970) argument that a price reduction mayactually lead to lower sales if consumers believe it is aharbinger of future, deeper reductions is provocative, sug-gesting that a temporal (forward-looking) component to theconsumer's brand price perception may materially influencepurchase behavior. This possibility may be particularly rel-evant for durable goods.
Inferences. Fourth, attitudes and inferences can be af-fected by the discounting strategy (Raghubir and Corfman1995). Results using the fairness data from our early studies(unreported previously in the article) suggested that thedeep, infrequent discount pattern led to lower perceivedfairness because subjects believed that the brand was pricedtoo high during nondeal periods. Research is needed thatexamines whether a long-term store of dissatisfaction ac-crues with such a pricing strategy and whether it materiallyinfluences purchase behavior. In addition, disentanglingwhether the effects of promotions on brand evaluations isattributable to changing price expectations or quality infer-ences is a priority.
Effect Size. Fifth, note that the depth effect appears tohave gotten smaller between the initial pilot study (where itwas a robust $.15) and the later experiments ($.O3-$.O5).Because even a small bias may have a large effect onconsumer price reactions, this article has focused on theconditions that encourage a depth effect. It is clear, how-ever, that understanding and explaining the size of the effectis of future research interest.
Theoretical Underpinnings. Last, and perhaps most im-portant, is the need to explore the cognitive and perceptualunderpinnings of price impressions. Consideration has beengiven here to anchoring and adjustment, information inte-gration, assimilation/contrast, interference, and consumeruse of the frequency heuristic. Yet, we do not uncover asingle explanation of the depth/frequency effects we ob-serve. In addition, there exist other interesting frameworksor phenomena that may contribute to explaining how con-sumers form price perceptions (e.g., representativeness, cat-egorization). Further, future studies can examine how andwhy consumer price estimates differ from those estimatedfrom Equation 2, which provides a rational metric againstwhich to compare observed behavior. By understanding thefundamental mechanisms underlying the formation of theseperceptions, disparate findings can be better reconciled, andfuture, novel predictions regarding pricing perceptions canbe made.
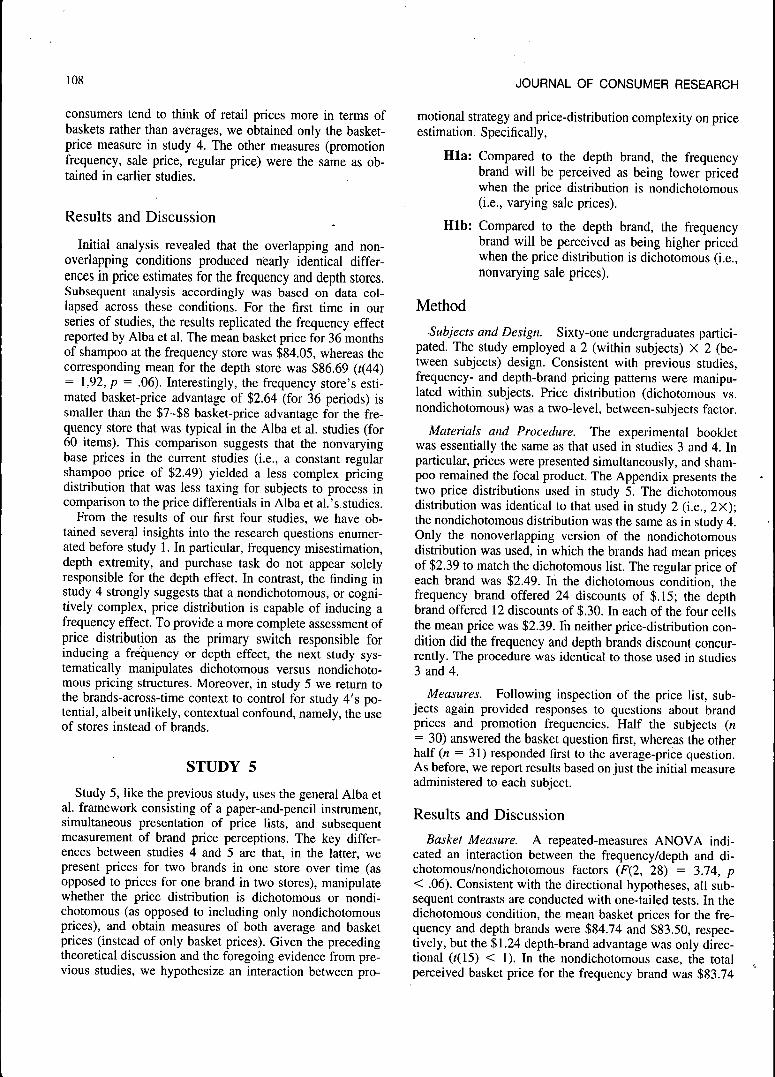
APPENDIXTABLE A1
DICHOTOMOUS AND NONDICHOTOMOUS PRICE LISTS
Month
123456789101112131415161718192021222324
Dichotomous(studies 2
Frequencybrand
2.492.342.342.492.342.342.342.492.342.492.342.342.492.342.342.342.342.492.492.342.342.342.492.34
price listand 5)
Depthbrand
2.192.492.492.192.492.492.492.192.492.192.492.492.192.492.492.492.492.192.192.492.492.492.192.49
Nondichotomous pricelist (studies -
Frequencybrand
2.492.332.292.492.352.332.352.492.372.492.342.372.492.352.332.272.372.492.492.332.372.352.492.31
4 and 5)
Depthbrand
2.172.492.492.192.492.492.492.252.492.192.492.492.212.492.492.492.492.192.132.492.492.492.252.49
DISCOUNT FREQUENCY AND DEPTH 113
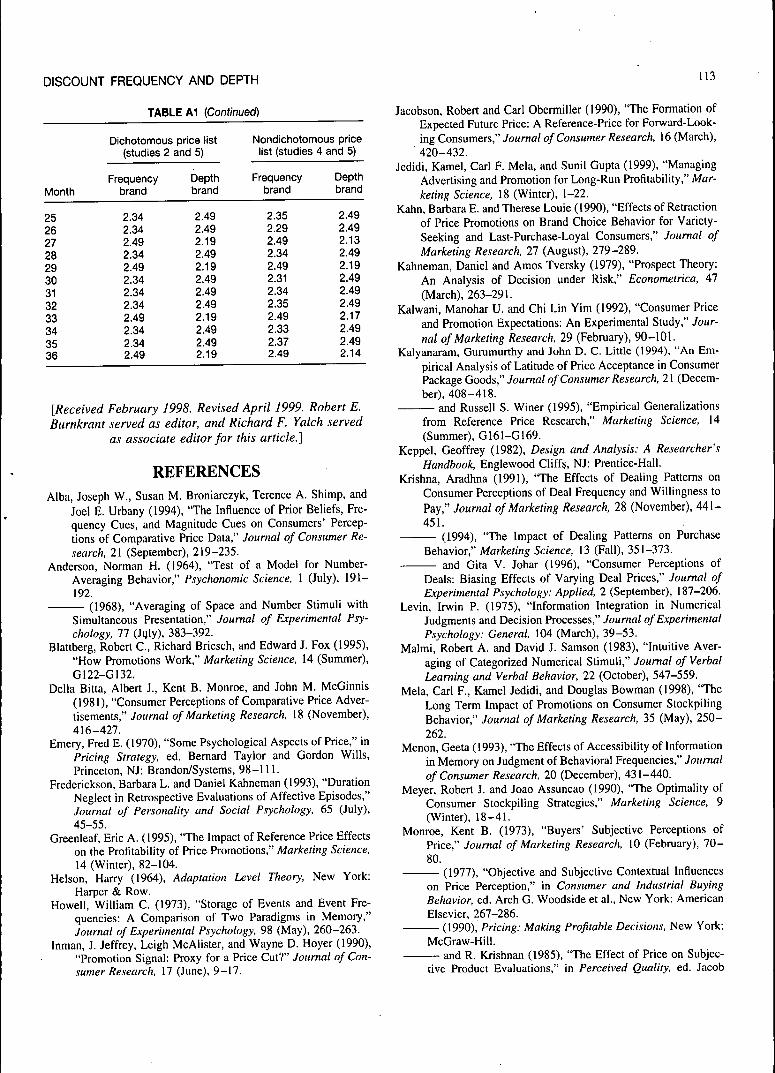
TABLE A1 (Continued)
Month
252627282930313233343536
Dichotomous prioe list(studies 2
Frequencybrand
2.342.342.492.342.492.342.342.342.492.342.342.49
and 5)
Depthbrand
2.492.492.192.492.192.492.492.492.192.492.492.19
Nondichotomous pncelist (studies
Frequencybrand
2.352.292.492.342.492.312.342.352.492.332.372.49
4 and 5)
Depthbrand
2.492.492.132.492.192.492.492.492.172.492.492.14
[Received February 1998. Revised April 1999. Robert E.Burnkrant served as editor, and Richard F. Yalch served
as associate editor for this article.]
REFERENCESAlba, Joseph W., Susan M. Broniarczyk, Terence A. Shimp, and
Joel E. Urbany (1994), "The Influence of Prior Beliefs, Fre-quency Cues, and Magnitude Cues on Consumers' Percep-tions of Comparative Price Data," Journal of Consumer Re-search, 21 (September), 219-235.
Anderson, Norman H. (1964), "Test of a Model for Number-Averaging Behavior," Psychonomic Science, 1 (July), 191-192.
(1968), "Averaging of Space and Number Stimuli withSimultaneous Presentation," Journal of Experimental Psy-chology, 11 (Jgly), 383-392.
Blattberg, Robert C , Richard Briesch, and Edward J. Fox (1995),"How Promotions Work," Marketing Science, 14 (Summer),C122-G132.
Delia Bitta, Albert J., Kent B. Monroe, and John M. McGinnis(1981), "Consumer Perceptions of Comparative Price Adver-tisements," Journal of Marketing Research, 18 (November),416-427.
Emery, Fred E. (1970), "Some Psychological Aspects of Price," inPricing Strategy, ed. Bernard Taylor and Gordon Wills,Princeton, NJ: Brandon/Systems, 98-111.
Frederickson, Barbara L. and Daniel Kahneman (1993), "DurationNeglect in Retrospective Evaluations of Affective Episodes,"Journal of Personality and Social Psychology, 65 (July),45-55.
Greenleaf, Eric A. (1995), "The Impact of Reference Price Effectson the Profitability of Price Promotions," Marketing Science,14 (Winter), 82-104.
Helson, Harry (1964), Adaptation Level Theory, New York:Harper & Row.
Howell, William C. (1973), "Storage of Events and Event Fre-quencies: A Comparison of Two Paradigms in Memory,"Journal of Experimental Psychology, 98 (May), 260-263.
Inman, J. Jeffrey, Leigh McAlister, and Wayne D. Hoyer (1990),"Promotion Signal: Proxy for a Price Cut?" Journal of Con-sumer Research, 17 (June), 9-17.
Jacobson, Robert and Carl Obermiller (1990), "The Formation ofExpected Future Price: A Reference-Price for Forward-Look-ing Consumers," Journal of Consumer Research, 16 (March),420-432.
Jedidi, Kamel, Carl F. Mela, and Sunil Gupta (1999), "ManagingAdvertising and Promotion for Long-Run Profitability," Mar-keting Science, 18 (Winter), 1-22.
Kahn, Barbara E. and Therese Louie (1990), "Effects of Retractionof Price Promotions on Brand Choice Behavior for Variety-Seeking and Last-Purchase-Loyal Consumers," Journal ofMarketing Research, 27 (August), 279-289.
Kahneman, Daniel and Amos Tversky (1979), "Prospect Theory:An Analysis of Decision under Risk," Econometrica, 47(March), 263-291.
Kalwani, Manohar U. and Chi Lin Yim (1992), "Consumer Priceand Promotion Expectations: An Experimental Study," Jour-nal of Marketing Research, 29 (February), 90-101.
Kalyanaram, Gunimurthy and John D. C. Little (1994), "An Em-pirical Analysis of Latitude of Price Acceptance in ConsumerPackage Goods," Journal of Consumer Research, 21 (Decem-ber), 408-418.
and Russell S. Winer (1995), "Empirical Generalizationsfrom Reference Price Research," Marketing Science, 14(Summer), G161-G169.
Keppel, Geoffrey (1982), Design and Analysis: A Researcher'sHandbook, Englewood Cliffs, NJ: Prentice-Hall.
Krishna, Aradhna (1991), "The Effects of Dealing Patterns onConsumer Perceptions of Deal Frequency and Willingness toPay," Journal of Marketing Research, 28 (November), 441-451.
(1994), "The Impact of Dealing Patterns on PurchaseBehavior," Marketing Science, 13 (Fall), 351-373.
and Gita V. Johar (1996), "Consumer Perceptions ofDeals: Biasing Effects of Varying Deal Prices," Journal ofExperimental Psychology: Applied, 2 (September), 187-206.
Levin, Irwin P. (1975), "Information Integration in NumericalJudgments and Decision Processes," Journal of ExperimentalPsychology: General, 104 (March), 39-53.
Malmi, Robert A. and David J. Samson (1983), "Intuitive Aver-aging of Categorized Numerical Stimuli," Journal of VerbalLearning and Verbal Behavior, 22 (October), 547-559.
Mela, Carl F., Kamel Jedidi, and Douglas Bowman (1998), "TheLong Term Impact of Promotions on Consumer StockpilingBehavior," Journal of Marketing Research, 35 (May), 250-262.
Menon, Geeta (1993), "The Effects of Accessibility of Informationin Memory on Judgment of Behavioral Frequencies," Journalof Consumer Research, 20 (December), 431-440.
Meyer, Robert J. and Joao Assuncao (1990), "The Optimality ofConsumer Stockpiling Strategies," Marketing Science, 9(Winter), 18-41.
Monroe, Kent B. (1973), "Buyers' Subjective Perceptions ofPrice," Journal of Marketing Research, 10 (February), 70 -80.
(1977), "Objective and Subjective Contextual Influenceson Price Perception," in Consumer and Industrial BuyingBehavior, ed. Arch G. Woodside et al.. New York: AmericanElsevier, 267-286.
(1990), Pricing: Making Profitable Decisions, New York:McGraw-Hill.
and R. Krishnan (1985), "The Effect of Price on Subjec-tive Product Evaluations," in Perceived Quality, ed. Jacob

114 JOURNAL OF OONSUMER RESEARCH
Jacoby and Jerry C. Olson, Lexington, MA: LexingtonBooks.
and Angela Y. Lee (1999), "Remembering vs. Knowing:Issues in Consumers' Processing of Price Information," Jour-nal of Academy of Marketing Science, 27 (Spring), 207-225.
and Susan M. Petroshius (1981), "Buyers' Perceptions ofPrice: An Update of the Evidence," in Perspectives in Con-sumer Behavior, ed. Harold H. Kassarjian and Thomas H.Robertson, Glenview, IL: Scott, Foresman.
Mosteller, Frederick M. and Robert R. Bush (1954), "SelectedQuantitative Techniques," in Handbook of Social Psychology,Vol. 1, Theory and Method, ed. Gardner Lindzey, Cambridge,MA: Addison-Wesley.
Pelham, Brett W., Tin Tin Sumarta, and Laura Myaskovsky(1994), "The Easy Path from Many to Much: The NumerosityHeuristic," Cognitive Psychology, 26 (April), 103-133.
Raghubir, Priya and Kim P. Corfman (1995), "When Do PricePromotions Signal Quality? The Effect of Dealing on Per-ceived Service Quality," in Advances in Consumer Research,Vol. 22, ed. Frank Kardes and Mita Sujan, Provo, UT: As-sociation for Consumer Research, 58-61.
Rosenthai, Robert (1991), Meta-Analytic Procedures for SocialResearch, London: Sage.
Shedf, Carolyn W. (1963), "Social Categorization as a Function ofLatitude of Acceptance and Series Range," Journal of Abnor-mal and Social Psychology, 67 (May), 148-156.
Spencer, J. (1961), "Estimating Averages," Ergonomics, 4, 317-328.
(1963), "A Further Study of Estimating Averages," Ergo-nomics, 6, 255-265.
Taylor, Shelley E. and Suzanne C. Thompson (1982), "Stalkingthe Elusive Vividness Effect," Psychological Review, 89(March), 155-182.
Tversky, Amos and Daniel Kahneman (1973a), "Availability: AHeuristic for Judging Frequency and Probable Cause," Cog-nitive Psychology, 5 (September), 207-232.
(1973b), "Judgment under Uncertainty: Heuristics andBiases," Science, 185 (September), 1124-1131.
Urbany, Joel E., William O. Bearden, and Dan C. Weilbaker(1988), "The Effect of Plausible and Exaggerated ReferencePrices on Consumer Perceptions and Price Search," Journalof Consumer Research, 15 (June), 95-110.
