the effect of energy performance regulations on energy consumption
TRANSCRIPT

ORIGINAL ARTICLE
The effect of energy performance regulations on energyconsumption
Olivia Guerra-Santin & Laure Itard
Received: 3 December 2010 /Accepted: 18 January 2012 /Published online: 8 February 2012# The Author(s) 2012. This article is published with open access at Springerlink.com
Abstract Governments have developed energy perfor-mance regulations in order to lower energy consumptionin the housing stock.Most of these regulations are basedon the thermal quality of the buildings. In the Nether-lands, the energy efficiency for new buildings isexpressed as the EPC (energy performance coefficient).Studies have indicated that energy regulations are suc-cessful in lowering the energy consumption in residen-tial buildings. However, the actual energy consumptionis usually different from the expected energy consump-tion. This paper explores the effectiveness of energyperformance regulations in lowering the energy con-sumption of dwellings built in the Netherlands after1996. The effect of the EPC and thermal characteristicson energy consumption was determined by statisticalanalyses of data on actual energy consumption. Theresults showed that energy reductions are seen in dwell-ings built after the introduction of energy performanceregulations. However, results suggest that to effectivelyreduce energy consumption, the tightening of the EPCin not enough. Policies aimed at controlling the con-struction quality and changing occupant behaviour arealso necessary to achieve further energy reductions.
Keywords Actual energy consumption . Energyperformace regulations . Housing
Introduction
Worldwide, the built environment consumes 41% ofthe energy produced in developed countries. Of all thephases in the life-cycle of buildings the user phase isthe most energy-intensive (Itard and Meijer 2008). Inrecent decades, governments all over the world haveincluded energy requirements in their building regu-lations in a bid to lower energy consumption in thehousing stock. Most of these regulations are based onthe thermal quality of the buildings and thus aim toreduce the energy spent on heating space.
Since 2003, the Energy Performance Building Direc-tive has required all EU member states to implementperformance-based energy regulations (European Com-mission, 2003 MB) to lower the energy required forheating, cooling, ventilation, lighting and domestic hotwater in buildings. In the Netherlands, energy consump-tion in new buildings has been regulated since 1975.Prior to 1995, energy efficiency regulations consistedonly of limits on transmission losses based on insulationvalues. In 1995, they were expanded to include the EPC(energy performance coefficient), a non-dimensionalfigure that expresses the energy efficiency of a buildingon the basis of the energy consumed for heating, hotwater, lighting, ventilation, humidification and cooling.The EPC is determined by dividing the calculated energy
Energy Efficiency (2012) 5:269–282DOI 10.1007/s12053-012-9147-9
O. Guerra-Santin (*)Welsh School of Architecture, Cardiff University,Cardiff, Wales, UKe-mail: [email protected]
L. ItardOTB Research Institute for the Built Environment, TU Delft,Delft, Netherlands

requirement of a building by a standardised energy per-formance, which is based on the heat-transfer surface andthe total heated area of the dwelling.
The EPC applies a correction for building size toavoid penalising larger dwellings or dwellings withlarger heat loss surfaces (e.g. corner houses or de-tached houses). It sets a limit on energy consumption,allowing designers to make trade-offs and devise asolution from many options (e.g. using more insula-tion or more energy-efficient systems). In 1996 theEPC stood at 1.4, a value that was easy to reach withcommon construction methods at the time. It wastightened to 1.2 in 1998, to 1.0 in 2000 and to 0.8 in2006. In addition to the EPC, the energy regulations inthe Netherlands apply an Rc≥2.5 m2K/W for externalwalls, roofs and ground floors and a U≤4.2 W/m2 Kfor windows, doors and window frames.
Various studies have indicated that energy regula-tions have been successful in lowering energy con-sumption in residential buildings. Leth-Petersen andTogeby (2001) found that building regulations haveplayed a key role in lowering energy consumption innew dwellings. They recorded annual energy reduc-tions of 3.5% to 4.8% depending on the type of heat-ing system, though they do stress that some of thisresult might be due to the independent effect of betterinsulation, glazing and more efficient boilers. In a Dutchstudy on the effect of EPC values in ten low-energyprojects (146 dwellings), Jeeninga et al. (2001) foundthat the energy requirement is determined primarily bythe building envelope (Rc, U value of glazing) and thetype of dwelling besides the indoor temperature. Theyfound only indicative differences (not statistically sig-nificant at p<0.05 level) for energy consumption indwellings with different EPC levels except for catego-ries 0.75 and 1.2. In yet another Dutch study, Beerepootand Beerepoot (2007) concluded that energy perfor-mance regulations have led to the utilisation of moreenergy-efficient systems.
However, other studies have shown that the actualenergy consumption is usually different from the pre-dicted energy consumption. For example, Branco et al.(2004) found that actual energy consumption was 50%higher than expected in energy-efficient multifamilydwellings in Denmark. They concluded that the differ-ence was due to the exclusion of the actual utilisationconditions and the actual system performance. Afterdiscerning a rebound effect of 15–30%, Haas et al.(1998) argued that energy savings from conservation
measures would be lower than calculated. During adwelling audit in the USA, Hirst and Goeltz (1985) alsofound that energy savings were lower than predicted.Some studies have established no relationship betweenenergy consumption and the thermal quality of build-ings (Haas et al. 1998; Sardianou 2008).
In a previous study (Guerra-Santin et al. 2009), whichused statistical analysis to determine the effect of build-ing characteristics, household characteristics and occu-pant behaviour, indicated that 42% of the variation inenergy consumption could be explained by buildingcharacteristics. Caldera et al. (2008) and Tiberiu et al.(2008) identified a relationship between energy con-sumption and certain building characteristics, includingthe shape of the dwelling and U values.
The EPC aims to reduce the overall building-relatedenergy consumption in dwellings. In NEN 5128:2001,the EPC is defined as an instrument to assess energyreduction. In this chapter, we explore the role of ener-gy performance regulations in lowering the energyconsumption for space heating in dwellings built after1996, the year in which new energy requirements wereintroduced in the Netherlands. The aims are (1) to de-termine the extent of the influence of the EPC level onreductions in energy consumption for heating; (2) todetermine whether tighter regulations could help to fur-ther reduce energy consumption for space heating; and(3) to identify scope for improvement in the regulationsin order to bring about a further reduction in energyconsumption for heating. We achieved the third aim bystudying the building characteristics (included in theEPC) that have a larger influence on energy consump-tion for space heating.
Although the EPC do not aim at predicting energyconsumption, it is necessary to assess the effectivenessof the energy performance regulations since theirtightening often imply higher investments frombuilders.
The effect of the EPC value and thermal character-istics on energy consumption was determined by statis-tical analyses of data on actual energy consumption inDutch dwellings. A household survey was carried out onhousing built after 1996. The data from the respondentswere paired with data from EPC calculation files kept bythe municipalities. Both the data and the methods arediscussed in Data and methodology section. Resultssection deals with the relationship between the actualenergy consumption and the energy performance regu-lations. Comparison of the results with a nationwide
270 Energy Efficiency (2012) 5:269–282

survey section compares the results with a larger sampleusing a database from a national household survey. Thediscussion is presented in Discussion section and theconclusions in Conclusions section.
Data and methodology
During the past 15 years, only four surveys have beenconducted to assess the effectiveness of the energyperformance regulations on the actual energy con-sumed for heating in the Netherlands. The first wascarried out by Jeeninga et al. (2001) on a sample of146 dwellings; the second by PRC and Uitzinger(2004) on a sample of 649 dwellings; the third in2008 by the authors of this paper on a sample of 313dwellings, in which we focus on this paper; and thelast one by ECN/RIGO in 2010 assessing the effect onenergy consumption of the EPC tightening from 1.0 to0.8 on a sample of 248 dwellings.
The data were drawn from two sources: a surveyamong households in two districts in the Netherlandsand EPC files from municipalities and architects’firms. The EPC files belonged to the dwellings wherethe survey was conducted, thus enabling us to matchthe response from the survey with the data on buildingcharacteristics.
The survey was carried out simultaneously in twodistricts in the Netherlands in autumn 2008. To ensurethat the dwellings in the sample fell within the time-scale of the EPC we specifically chose districts thatwere built after the EPC had been introduced. Thedistricts were also chosen because they were represen-tative of the Dutch situation in terms of dwelling type,heating system and ventilation. The sampling ensuredthe inclusion of dwellings built by a number of differ-ent architect offices and thus contractors, in order tocontrol for the influence of the construction quality onthe results of the study. The sample size was 313households. Section 4 presents the analysis of a na-tionwide survey with a much larger random sample todetermine the effect of the relatively small sample sizeand the sampling in only two districts of the OTBsurvey. The districts are described in detail below.
Districts
The chosen districts were Wateringse Veld in TheHague and Leidsche Rijn in Utrecht. Construction
started in Wateringse Veld in 1996 and was still un-derway when the survey was being conducted (www.wateringseveld.nl). Leidsche Rijn is a district inUtrecht. Construction began in 1997 and will continuetill 2025 (www.utrecht.nl).
All the dwellings in Wateringse Veld had individualcentral heating as opposed to Leidsche Rijn, where allbut four had district heating. Balanced ventilation wasbetter represented in Wateringse Veld, which also hada wider range of EPC values. Most dwellings in Leid-sche Rijn had an EPC of 1.0 or 1.2, whereas all EPCvalues were represented in Wateringse Veld. Therewere far fewer maisonettes and detached houses inthe sample than terraced houses, corner houses andflats. However, terraced and corner houses and flatsare more common in the Netherlands.
Energy consumption
The respondents were asked to report their energyconsumption from the last available annual energybill. The energy data were corrected using heatingdegree days (HDD), based on the period from October2006 to September 2007 (2,264.3 heating degree daysfor Utrecht and 2,186.9 for The Hague), since theyears of the reported energy consumption ranged from2005 to 2008. The HDD were taken from the DutchMeteorological Institute (KNMI—Koninklijk NederlandsMeteorologish Instituut) obtained from www.kwa.nl.The HDD were weighted degree days. They used abaseline temperature of 18°C.
Two types of energy for heating were used in thedistricts: heat (dwellings with district heating) and gas(dwellings with individual central heating). The ener-gy reported from gas-heated dwellings included ener-gy for space heating, water heating and cooking. Theenergy data from dwellings with district heatingincludes energy consumption for space and waterheating, but not for cooking. These households cookedwith electricity. Only gas was reported as primaryenergy. District heating is considered to have an effi-ciency of 0.95 in the Netherlands (NEN 5128: 2004).Energy for cooking and differences in system efficiencymight therefore have had a slight effect on the reportedenergy consumption. However, gas for cooking was notexpected to exceed 5% (EuroACE 2004). This studyfocused on energy consumption for heating and includedthe energy consumption for heating tap water, which alsofigures in the EPC calculation.
Energy Efficiency (2012) 5:269–282 271

EPC calculation
The EPC data were obtained frommunicipalities, wherethey are kept according to requirements in the DutchBuilding Decree, and were paired with the survey data.The EPC was not available in all cases. This was due toseveral reasons: building permission had been obtainedjust before the introduction of the EPC, the EPC fileswere missing, or the respondents did not state theiraddress. This reduced the size of the sample (Table 1).
The EPC calculation takes account of the character-istics of the dwelling, the efficiency of the installationsand standardised occupant behaviour based on an aver-age Dutch household. The EPC document contains dataon surfaces, U values, infiltration level, type of heatingsystem and type of ventilation system. The EPC calcu-lation is one of the documents required to obtain abuilding permit. The building characteristics that aredefined in the documents and used to calculate theEPC value should be the actual characteristics of thedwelling. The EPC is calculated as indicated in Table 2.
The total expected energy consumption (Qpres;tot inMegajoules) is the sum of the primary energy requiredfor space and water heating, the auxiliary energy forthe heating system, and the energy required for ven-tilators, lighting and humidification based on standarddata. The calculations for the primary energy takeaccount of the efficiency of the installation, the distri-bution losses of the system, and the efficiency ofelectricity generation. Compensation for the energyobtained with photovoltaic systems is also included.
The total heated area (Ag;verw in square meters) is thesum of the useful area of heated zones. The total heat-transfer surface of the building (Averlies in square meters)is calculated bymultiplying the heat-transfer surfaces bya correction factor determined by the type of boundary:heated space, ground floor or basement, exterior orwater, and unheated spaces.CEPC is the correction factor
for updates in methodology and has a fixed value foreach update. This factor prevents punishing large housesor houses with larger heat loss surfaces. The calculationof the EPC value is presented in more detail in Table 2.
The variables obtained from the EPC are shown inTable 3. These variables were checked for normality andoutliers with the Kolmogorov–Smirnov test, and forkurtosis and skewness. Outliers were found on heat-transfer surface, total heated area, open surface (windowsand doors) and closed surface (external walls), but theyseemed to be real values (associated with large houses).Variables were therefore converted for normality.
Methods of analysis
The relationship between the building characteristicsand the actual energy consumption was determinedwith statistical analyses performed with SPSS. Lowerenergy consumption was expected in dwellings withlower EPC values. Differences in the energy consump-tion for different EPC values section reports a one-wayANOVA test that was used to discern whether statis-tically significant reductions in energy consumptionoccurred in dwellings with lower EPC values.
As explained in EPC calculation section, the EPCcalculation takes account of the energy required for spaceand water heating, ventilators, humidification, coolingand lighting. As this research was concerned with spaceand water heating (gas and heat) we did not study theenergy required for electricity. In addition, no cooling orhumidification equipment was found in the sample.Thus, subsequent analyses focused on the expected en-ergy consumption for space and water heating (Qpres;verw
+tap; for details see Table 2). Since the building character-istics described in the EPC document are supposed to bethe actual building characteristics, the expected energyconsumption should be closely related to the actual en-ergy consumption. First, a paired-sample t test was ap-plied to determine whether the actual energyconsumption differed from the expected energy con-sumption for space and water heating. To further analysethe relationship between the EPC and the actual energyconsumption and to identify scope for improvement inthe energy regulations, Pearson product–moment corre-lation coefficients, independent-sample t tests and one-way ANOVA tests were used to investigate relationshipsbetween the actual energy consumption and the buildingcharacteristics that were used to calculate the expectedenergy consumption for space heating (Qprim;verw).
Table 1 Response rates and available data per district
District Responsefrom survey
Reportedenergy data
EPCdata
Reported energyand EPC data
LeidscheRijn
125 94 104 86
WateringseVeld
177 147 138 131
Unknown 11 7 0 0
Total 313 248 242 217
272 Energy Efficiency (2012) 5:269–282

Results
Differences in the energy consumption for differentEPC values
To determine whether houses with lower EPC valueshave significantly lower energy consumption, a one-way ANOVA test was conducted to detect any statis-tically significant differences in the energy consump-tion in dwellings with different EPC values. Cases
were categorised according to their EPC value: 00noEPC, 10[1.21–1.40], 20[1.01–1.20], 30[0.81–1.00],40[0.8]. The EPC values were not necessarily relatedto the year when the EPC was tightened, since lowerEPC values than those required by the regulationsin the year of construction were also found in thesample. The number of cases in each category islisted in Table 3. The ANOVA results revealed astatistically significant difference between the EPCcategories (p<0.001). Post-hoc analyses were then
Table 2 EPC calculation
The EPC is calculated with the following formula:
EPC ¼ Qpres;tot
330�Ag;verwz½ �þ 65�Averlies½ � � 1CEPC
(1)
where,
Qpres;tot is the value of the primary energy consumption in MJ, determined by eq. 2
Ag;verwz is the value of the useful surface of the heated zones of the building in m2
Averlies is the value of the heat-transfer surface of the building in m2
CEPC is the correction factor for changes in the methodology
The required energy (MJ) is calculated with the following formula:
Qpres;tot ¼ Qprim;verw þ Qprim;hulp;verw þ Qprim;tap þ Qprim;vent þ Qprim;vl (2)
where,
Qprim;verw is the primary energy consumption for space heating in the building
Qprim;hulp;verw is the primary auxiliary energy consumption for space heating
Qprim;tap is the primary energy consumption for water heating
Qprim;vent is the primary energy consumption for ventilators
Qprim;vl is the primary energy consumption for lighting
To determine the total heat-transfer surface of the building, the surfaces are multiplied by a reduction factor determined by the type ofspace limiting with the surface.
The primary energy consumption for space heating is calculated by dividing the energy needed for space heating by the efficiency of theinstallations. The energy needed for space heating is determined by subtracting the effective heat gain from the heat loss.
Heat loss takes account of the transmission and ventilation loss. It considers the difference between the average indoor (18°C) andaverage outdoor (5°C) temperature multiplied by the number of days in mega seconds (212 days). The considered indoor temperaturesin Celsius degrees are:
7–17 h019 (living area and 2 days in sleeping area), 16 (sleeping area 5 days)
17–23 h021 (living area and 2 days in sleeping area), 16 (sleeping area 5 days)
23–7 ha016 (living area and 2 days in sleeping area), 14 (sleeping area 5 days)
Heat gains take account of solar gains and internal heat gains. Solar gains are determined on the basis of orientation, reduction factorsfor shadows, solar entry factors and surface. Heat gains are calculated by multiplying the total heated area by 110, which is calculatedby multiplying the average heat gain (6.0 W/m2) by the value of the length of the considered period (212 days) in mega seconds.
The primary energy consumption for heating water is determined by the gross energy requirement minus the yearly input of solar energy (in thecase of a solar boiler) and divided by the efficiency of the tap water system. The gross energy requirement is calculated with the gross energyin the bathroom installations divided by the efficiency of the systems. The primary energy consumption for ventilators is determined by theenergy consumption of the ventilator divided by the efficiency of the electricity. The calculation assumes that mechanical ventilators areconstantly working. The primary energy consumption for lighting is determined by multiplying the heated area of the dwelling by a factor of22 and dividing it by the efficiency of the electricity. The factor 22 is obtained by multiplying the electricity needed for lighting 1 m2 of thesurface (6.0 kWh/m2/year) by 3.6 (which is the conversion from kWh to MJ).
Source: NEN 5128 (2001)a Thermostat setting
Energy Efficiency (2012) 5:269–282 273
performed to identify the EPC categories with differ-ences in energy consumption. ATukey test revealed thatstatistical differences existed only between dwellingswith and without an EPC category. There were nostatistically significant differences in the energy con-sumption of dwellings with different EPC values(Fig. 1).
Real and predicted energy consumption
As mentioned in Real and predicted energy consumptionsection, the EPC takes account of different thermal char-acteristics of buildings when determining the energyrequired for space heating. Lower EPC values do notindicate lower energy consumption as energy
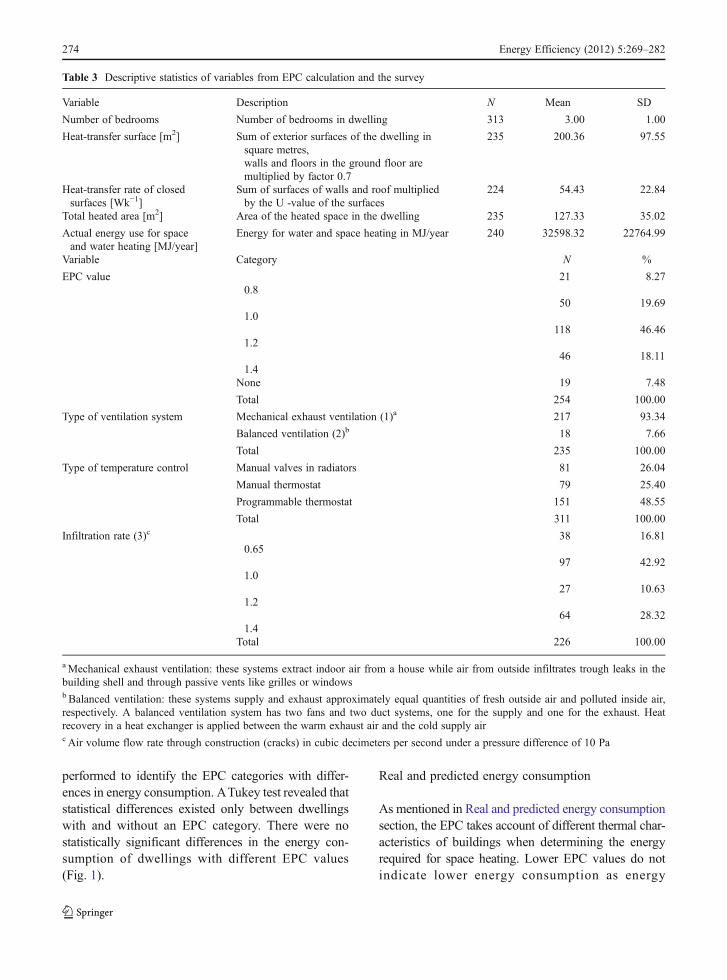
Table 3 Descriptive statistics of variables from EPC calculation and the survey
Variable Description N Mean SD
Number of bedrooms Number of bedrooms in dwelling 313 3.00 1.00
Heat-transfer surface [m2] Sum of exterior surfaces of the dwelling insquare metres,walls and floors in the ground floor aremultiplied by factor 0.7
235 200.36 97.55
Heat-transfer rate of closedsurfaces [Wk−1]
Sum of surfaces of walls and roof multipliedby the U -value of the surfaces
224 54.43 22.84
Total heated area [m2] Area of the heated space in the dwelling 235 127.33 35.02
Actual energy use for spaceand water heating [MJ/year]
Energy for water and space heating in MJ/year 240 32598.32 22764.99
Variable Category N %
EPC value0.8
21 8.27
1.050 19.69
1.2118 46.46
1.446 18.11
None 19 7.48
Total 254 100.00
Type of ventilation system Mechanical exhaust ventilation (1)a 217 93.34
Balanced ventilation (2)b 18 7.66
Total 235 100.00
Type of temperature control Manual valves in radiators 81 26.04
Manual thermostat 79 25.40
Programmable thermostat 151 48.55
Total 311 100.00
Infiltration rate (3)c
0.6538 16.81
1.097 42.92
1.227 10.63
1.464 28.32
Total 226 100.00
aMechanical exhaust ventilation: these systems extract indoor air from a house while air from outside infiltrates trough leaks in thebuilding shell and through passive vents like grilles or windowsb Balanced ventilation: these systems supply and exhaust approximately equal quantities of fresh outside air and polluted inside air,respectively. A balanced ventilation system has two fans and two duct systems, one for the supply and one for the exhaust. Heatrecovery in a heat exchanger is applied between the warm exhaust air and the cold supply airc Air volume flow rate through construction (cracks) in cubic decimeters per second under a pressure difference of 10 Pa
274 Energy Efficiency (2012) 5:269–282

consumption can varywidely within a value due to theneutralisation factor. The predicted energy con-sumption for space and water heating (Qpres;verw+tap)should be however, closely related to the actual energyconsumption since this step has no correction for build-ing size. A Pearson’s correlation test was carried out todetermine the relationship between the actual and pre-dicted energy consumption. The calculated energy con-sumption refers here to the sum of the energyrequirement for space and water heating in the EPCdocument (Qpres;verw+tap), corrected for the heating de-gree days in the period 2006–2007. A positive correla-tion was found between the actual and predicted energyconsumption (ρ00.391, p<0.001, N0185). This indi-cates that the actual energy consumption is lower indwellings with lower energy predictions (Qpres;tot).Thecorrelation was, however, of medium size.
To check the accuracy of this prediction, a paired t testwas carried out between the expected energy consump-tion (Qpres;tot0Qprim;verw+Qprim;tap) and the actual energyrequired for heating. The test revealed a statisticallysignificant difference between expected and actual ener-gy consumption (Fig. 2). Contrary to assumptions, theactual energy consumption was lower than expected.Figure 3 illustrates this by showing the difference be-tween the actual and expected energy consumption for arandom selection of cases in the sample.
Lower EPC values did not seem to be related to lowerenergy consumption. However, energy consumption didshow a medium-sized statistically significant correlationwith the expected energy consumption for heating. Asthe EPC value was calculated with the expected energyconsumption (Qpres;verw+tap), other factors in the formulacould have been affecting the relationship between the
EPC and the actual energy consumption. These differ-ences might have been attributable to the neutralisationfactor (330×Ag;verw+65×Averlies) or the inclusion of theelectricity required for ventilators and lighting and auxil-iary energy for the heating system (see Fig. 4). Analyseswere therefore carried out between (1) the total expectedenergy consumption and the actual energy consumption(Fig. 4a), and (2) between the EPC and the expectedenergy consumption (Fig. 4b).
A Spearman’s rho correlation test showed that the totalexpected energy consumption (Qpres;tot) was positivelycorrelated to the actual energy consumption (ρ00.378,p<0.001,N0185). The expected energy consumption forspace and water heating (Qpres;verw+tap) was also corre-lated to the actual energy consumption (ρ00.391,p<0.001, N0185). The correlations are very similarand thus, we conclude that the inclusion of energyconsumption for ventilators and auxiliary energy forthe heating system in the EPC does not affect the rela-tionship between the EPC value and the actual energyconsumption.
ANOVA tests were conducted to determine whetherthe normalisation factor in the EPC calculation has aneffect of the lack of correlation between EPC levelsand energy consumption.
The first ANOVA test, showed that the total expectedenergy consumption (Qpres;tot) was statistically signifi-cantly different for different EPC values. The sameresults were found for the expected energy consumptionfor space and water heating (Qpres;verw+tap) (Fig. 5).Thesecond ANOVA tests showed that the expected energyconsumption for heating (Qpres;tot and Qpres;verw+tap) nor-malised per area was statistically significantly differentfor different EPC values (Fig. 6a and b). The comparisonbetween the first and second ANOVA test indicates that
Fig. 1 Mean and 95% confidence interval for actual energyconsumption per EPC category (look for statistic)
Fig. 2 Mean and 95% confidence interval for actual energyconsumption and expected energy consumption
Energy Efficiency (2012) 5:269–282 275

the relationship between the EPC and the expectedenergy consumption was much clearer when normalisedper ‘total heated area’. Hence, the normalisation factormight have had a small effect on the relationship be-tween the actual energy consumption and the EPC
value. From this we can conclude that the normalisationfactor to correct for large areas and heat loss surfaces hasan effect on the lack of correlation between EPC valuesand actual energy use.
Finally, Fig. 6c shows that no statistically signifi-cant difference was found in the actual energy con-sumption normalised per ‘total heated area’ fordwellings with different EPC levels. The normalisa-tion factor in the EPC calculation has therefore a smallinfluence in the lack of correlation between actualenergy use and EPC levels.
Effect of thermal quality on energy consumptionin dwellings
Under the energy performance regulations, the design-er may choose from different options to achieve theexpected energy performance. The fact that energyconsumption for space and water heating is not statis-tically significant in dwellings with different EPCvalues might also be explained by trade-offs duringthe design/calculation phase (i.e. between energy-efficient systems and thermal properties). Designerscould be opting to reduce energy consumption in waysthat are, in reality, less effective. A decision was there-fore taken to investigate the relationship between build-ing characteristics and the actual energy consumption.The analyses were conducted without normalisation pertotal heated area because the effect of dwelling sizeneeded to be determined in relation to other factors.Moreover, as heated area correlated with all the othervariables, multicollinearity problems were avoided.
Medium-sized positive statistically significant cor-relations were found between energy consumption on
Fig. 4 Energy uses taken into account in the EPC and testcarried out for the analysis
Fig. 3 Actual and expectedenergy consumption perdwelling (selected cases)
276 Energy Efficiency (2012) 5:269–282

the one hand and ‘number of bedrooms’, ‘heat-transfersurface’ and ‘heat-transfer rate of the closed surface’on the other. A small positive correlation was foundbetween ‘total heated area’ and energy consumption(see Table 4 for statistics).
Analyses were performed to ascertain whether ener-gy consumption was influenced by type of heating andventilation system, and infiltration level. Independent-sample t test compared the energy consumption ofdwellings with different types of ventilation and heatingsystems. Only a statistically significant difference wasfound between the energy consumption for mechanicalventilation and balanced ventilation, though the differ-ences in the means were very small (Fig. 7). Balancedventilation was found only in few cases, and all of themcorresponded to dwellings with the lowest EPC levels
(1.0 and 0.8) suggesting a positive effect of the EPC onenergy reductions.
A one-way ANOVA test did not point to any sta-tistically significant differences in the case of dwell-ings with different levels of infiltration. (Fig. 8). Itshould be noted that these values came from the EPCcalculations and not from the actual infiltration rates inthe dwellings, since the energy performance regula-tions do not require to carry out air permeability tests.
Comparison of the results with a nationwide survey
The survey was performed in two selected districts, anda low response rate was obtained because of by thelength of the questionnaire and detail of the questions.
Fig. 5 Mean and 95%confidence interval for theactual energy consumption(in Megajoules), totalexpected energy(in Megajoules) andexpected energy forheating (in Megajoules)per EPC value
Fig. 6 Mean and 95%confidence interval for theactual energy consumption(in Megajoules per squaremeter), total expectedenergy (in Megajoules persquare meter) and expectedenergy for heating (inMegajoules per squaremeter) per EPC value
Energy Efficiency (2012) 5:269–282 277

This might have caused limitations in the results of thisanalysis. To validate the results of this study, the resultswere compared with the WoON database of the DutchMinistry of Housing from 2005 (www.vrom.nl). TheWoON database consists on a sample of 584 cases ofdwellings built after 1996 and is a random sample acrossthe Netherlands. The WoON database is similar to theOTB database, with the main exception of the EPC levelwhich is not included in the WoON sample. We canvalidate the OTB survey with the WoON survey byrepeating some statistical tests with comparable varia-bles. The larger, random WoON sample would point atinconsistencies in the OTB sample.
The relationship between different building charac-teristics and energy consumption in the WoON databasewas investigated, which ascertained the generalisationof the results derived from our survey. The variables forthe analysis are shown in Table 5.
The WoON database does not contain information onthe U values of the surfaces. However, the variables‘heat-transfer surface’, ‘total heated area’ and ‘numberof bedrooms’ showed correlations to energy consumptionvery similar to those found with our sample (Table 6).
Independent-sample t tests were carried out todetermine any differences in energy consumption
(SQRT cubic meter gas) between dwellings withdifferent ventilation systems. Only an indicativelylower energy consumption was found in houseswith balanced ventilation (t(585)01.298, not statis-tically significant). The effect of ventilation type onenergy in our survey was statistically significant butwith very small effect.
The results seem to indicate that the results of oursurvey are not too different to those obtained with alarger and random sample in the whole country; there-fore the limitations caused by the characteristics of oursample can be disregarded.
Discussion
Relationship between the energy performancecoefficient and actual energy consumption
No statistical differences in energy consumption werefound for dwellings with different EPC values (0.8, 1.0,1.2 and 1.4), though we did find statistical differences
Table 4 Pearson product–moment correlation coefficients for building-related variables in the survey
Variable Variable Statistic (r) N
(LOG) Energy use (MJ/year) Number of bedrooms 0.311* 240
Heat-transfer surface [m2] 0.366* 191
Heat-transfer rate of closed surface [Wk−1] 0.331* 180
Total heating area [m2] 0.262* 240
LOG means that the variable was transformed into a normal distribution with logarithm base 10.
*p≤0.001
Fig. 7 Mean and 95% confidence interval for energy consump-tion per ventilation type
Fig. 8 Mean and 95% confidence interval for energy consump-tion per infiltration level
278 Energy Efficiency (2012) 5:269–282

between dwellings built before and after the introduc-tion of the EPC. This indicates that a reduction onenergy consumption is seen in dwellings built after theintroduction of the regulations, but the results of the testssuggest that tighter EPC levels do not necessarily reducethe energy consumption for space heating.
Further sections in this article aimed at finding thereason for the lack of correlation between the EPC andenergy consumption (seen in Figs. 1 and 6c). Since theaim of the EPC is to realise an overall reduction in energyconsumption, the calculations also take account of theenergy required for lighting, cooling and hot water. Thisfactor does not affect the relationship between the EPCand the actual energy consumption for space heating (asseen in Fig. 5) because standardised behaviour is usedand the energy required for water, ventilation and light-ing is therefore based solely in the ‘total heated area’ ofthe dwelling. Further results showed that the normal-isation factor for dwelling size and heat loss surface hasa small effect in the correlation between EPC level andactual energy consumption.
These results are in line with those of Jeeninga et al.(2001) in the Netherlands, who found only indicative
differences (not statistically significant at p<0.05 level)in energy consumption in dwellings with different EPClevels, except for categories 0.75 and 1.2. However, asthe study was conducted in low-energy dwellings con-structed before 2000—when the EPC level was 1.0—itis conceivable that 0.75 was experimental and was there-fore more carefully implemented. In a larger sample,PRC Bouwcentrum (2004) found strong statistically sig-nificant differences between EPC categories. Althoughthe statistical analysis could not be checked and therewere concerns about the validity of the results (Itard et al.2009), it still suggested that the effect of a tighter EPC isbetter observed in a larger sample. A later analysis of thesample (Uitzinger 2004) did not, however, find anycorrelation between equivalent gas consumption andEPC. The results of a more recent research carried outby ECN and RIGO (Menkveld and Leidelmeijer 2010)on a sample of 248 dwellings with EPC levels 0.8 and1.0 are in accordance to the results of this study. Theyfound that when energy consumption is correctedfor occupant behaviour and building characteris-tics, there is a statistical significant difference be-tween houses with EPC level 1.0 and 0.8. In theOTB sample, we found that energy consumption iscorrelated to the expected energy consumption,and with thermal properties; variables that are notinfluenced by occupant behaviour. In addition, in aprevious study with the OTB database, correlationswere also found between energy consumption and oc-cupant behaviour (Guerra-Santin and Itard 2010).
Actual and expected energy consumption
A positivemedium-sized correlation was found betweenthe actual and expected energy consumption. This
Table 5 Variables from WoON survey
Variable Description N Mean SD
Number of bedrooms Number of bedrooms in the dwelling 586 4.02 1.33
Heat-transfer surface [m2] Sum of exterior surfaces of the dwelling in square metres, wallsand floors on the ground floor are multiplied by a factor 0.7
586 138.80 77.63
Total heated area [m2] Area of the heated space in the dwelling 586 130.83 74.61
Energy for water and spaceheating [MJ/year]
Actual energy used for water and space heating per year 586 1068.89 676.32
Variable Categories N %
Type of ventilation system Mechanical exhaust 476 82.2
Balanced 103 17.8
Total 586 100
Table 6 Pearson product–moment correlation coefficients forbuilding-related variables in the WoON survey
Variable Variable Statistic (r) N
(SQRT) Energyuse (MJ/year)
Number of bedrooms 0.341* 563
Heat-transfer surface [m2] 0.450* 563
Total heating area [m2] 0.270* 563
SQRT means that the variable was transformed into a normaldistribution with square root
*p≤0.001
Energy Efficiency (2012) 5:269–282 279

points to a relationship between building characteristicsand actual energy consumption; however, this correla-tion was only medium size. A closer look at the samplerevealed that the actual consumption was lower than thepredicted consumption. This difference is believed to becaused by the differences between the occupant behav-iour considered in the calculations and the actual behav-iour of the occupants in the sample. The occupantbehaviour used in the calculation (seen in Table 2)showed large differences in comparison to the actualoccupant behaviour in the sample (Guerra-Santin andItard 2010). People seem to spend far less time at home(therefore with the heating system off) than expected. Inaddition, large differences on occupant behaviour insimilar houses have a large effect on energy consump-tion in energy-efficient dwellings.
Studies have indicated that the differences betweenactual and expected energy consumption could be alsorelated to practices whereby buildings are not realisedaccording to the official EPC specifications and toHVAC services that are run very differently than as-sumed on paper. A report by Nieman (2007) showedthat 25% of dwellings in a sample of 154 fell short of theEPC requirements: the EPC was incorrectly calculatedbut the building permit was still issued. The realisationof 50% of the dwellings was not in accordance with thedata used to calculate the EPC. In a 17-year study thatmonitored the energy performances of energy-efficientbuildings, Gommans (2008) found that 40% of solarboilers functioned and only 25% of heat pumps reachedthe expected efficiency. This was essentially due torealisation faults, lack of control and lack of continuousmonitoring. Another study by Elkhuizen et al. (2006) inoffice buildings showed that better monitoring coulddeliver energy savings of up to 28%.
The only medium size correlation between theexpected and the actual energy use might be thereforerelated to the actual building being different than thedesigned building. This idea is reinforced by the findingthat the infiltration level was not found to be correlatedto energy consumption.
Relationship between building characteristicsand energy consumption
The determinants of actual energy consumption werefurther determined by statistical analyses of buildingcharacteristics. The results showed correlations betweenthe actual energy consumption for water and space
heating and the thermal properties of the building. Inour sample statistically significant differences werefound for different types of ventilation systems. Thedifferences in energy consumption for different ventila-tion types were very small. These results indicate thatthermal characteristics have a greater effect than the typeof ventilation system efficiency on energy consumption;however, only a small number of dwellings with bal-anced ventilation were found in the sample.
The comparison with the WoON database deliveredsimilar results with a slightly larger sample size and arandom distribution across the Netherlands. Both data-bases showed similar correlations between thermalcharacteristics and energy consumption.
Conclusions
The aim of this study was to explore the role of energyperformance regulations in lowering the energy con-sumption for space heating in energy-efficient dwell-ings. In addition, an analysis was carried out regardingthe reductions in energy consumption after the regu-lations had been tightened.
Although the EPC does not aim specifically toreduce energy consumption for space heating, reduc-tions in this area may be expected, since the thermalquality and the systems’ efficiency of the dwellingsare increased. That said, dwellings with lower EPCvalues do not appear to be correlated to less energyconsumption for space and water heating, even whenthe type of dwelling or the size of the dwelling is takeninto account.
The lack of correlation between EPC values andenergy consumption for heating might be due to threefactors: (1) the normalisation factor per dwelling sizemight have a small effect on the correlation betweenthe EPC and energy consumption; however, this doesnot have an effect on the relationship between theexpected and the actual energy consumption; (2) thedifferences between the building characteristics as de-scribed in the EPC calculations and the actual buildingcharacteristics (e.g. actual infiltration level); and (3)the effect of occupant behaviour on energy consump-tion. The first factor might have an effect on therelationship between the EPC value and the actualenergy consumption, while the other two have aneffect on the relationship between the expected andthe actual energy consumption.
280 Energy Efficiency (2012) 5:269–282

A lower EPC value is expected to reduce energyconsumption because it increases the energy efficiencyof buildings. When the dwellings are built according tothe regulations, those with lower EPC would have alower consumption of energy if occupancy conditionsare maintained equal in all dwellings. In this case, theenergy performance regulations would be effectivelyreducing the energy consumption in newly builtdwellings. However, the actual conditions of utilisationare not the same in all dwellings. This fact underminesthe effectiveness of the energy performance regula-tions, since the range of behaviour hinders theeffect of higher energy efficiency of dwellings.Nevertheless, the regulations have ensured thatmore energy-efficient dwellings were built aftertheir introduction.
Recommendations
The fact that actual energy consumption for water andspace heating showed a small correlation with theexpected energy consumption and the fact that nodifferences in energy consumption were found indwellings with different EPC values indicate that otherfactors besides building characteristics are having astrong effect on energy consumption. These factorsare believed to be related to actual occupant behaviourand the actual properties of the dwellings. Furtherenergy reductions could be achieved by focusing onchanges in occupant behaviour in relation to the use ofthe heating and ventilation systems. In addition, ther-mal quality seems to be more effective than heating-system efficiency in reducing energy consumption forspace heating.
The higher expected energy consumption in com-parison to the actual energy consumption suggestslarge differences between the assumed and the actualoccupant behaviour. More accurate information on theactual occupant behaviour and the identification ofbehaviour patterns to build energy-user profiles mightimprove the energy predictions in the energy perfor-mance regulations. Although accurate energy predic-tion is not the aim of the EPC, a better estimation ofthe actual energy performance and the actual energysavings expected from the introduction or tighteningof building regulations, could be achieved.
Infiltration values, insulation levels and other buildingcharacteristics might be, in reality, different from those
stated in the EPC calculation, thereby undermining theeffect of the energy performance regulations. Further re-search should be aimed at determining whether the realquality of dwellings corresponds with the characteristicsdescribed in the EPC document and at finding bettermethods to guarantee the quality of the construction work.
In previous studies, correlations were found betweenbuilding characteristics, occupant behaviour and house-hold characteristics. To gain deeper insight into the realeffect of building regulations on energy consumption, itis necessary to understand the influence of buildingcharacteristics on occupant behaviour, especially interms of the rebound effect identified in other studies(Hens et.al., 2010; Haas et al. 1998). Such an effectmight also be undermining the effectiveness of buildingregulations.
Given that a tighter EPC did not lower energy con-sumption for heating and that there are large differencesbetween the expected and the actual energy consump-tion, it might be sensible to search for more efficientmeans to further lower the energy consumption ofenergy-efficient housing. This could be achieved byensuring correct realisation and monitoring of the calcu-lated performances, by paying attention to the knowl-edge needed by contractors, by implementing aneffective building control process (Visscher et al. 2003)and by the implementation of policies directed toinfluence occupant behaviour.
Open Access This article is distributed under the terms of theCreative Commons Attribution License which permits any use,distribution, and reproduction in any medium, provided theoriginal author(s) and the source are credited.
References
Beerepoot, M., & Beerepoot, N. (2007). Government regulationsas an impetus for innovations. Evidence for energy perfor-mance regulation in the Dutch residential building sector.Energy Policy, 35, 4812–4825.
Branco, G., Lachal, B., Gallinelli, P., &Weber,W. (2004). Expectedversus observed heat consumption of a low energymultifamilycomplex in switzerland based on long-term experimental data.Energy and Building, 36, 543–555.
Caldera, M., Corgnati, S. P., & Filippi, M. (2008). Energydemand for space heating through a statistical approach:application to residential buildings. Energy & Buildings,40, 1972–1983.
Energy Efficiency (2012) 5:269–282 281

Elkhuizen, P., J.E. Scholten & E. Rooiakkers (2006). QualityControl of HVAC services: evaluation of existing instrumentsand a vision for the future [in Dutch], TNO Bouw/Halmosreport for Senter Novem.
EuroACE (2004). Towards Energy Efficient Buildings inEurope, final report June (ec.europa. eu).
Gommans, L.J. (2008). Energie prestaties van energie-efficiëntgebouwen: tussen ontwerp en werkelijkheid, TVVL maga-zine, September 2008, pp. 18–24
Guerra-Santin, O., & Itard, L. (2010). Occupants’ behaviour:determinants and effects on residential heating consumption.Building Research & Information, 38(3), 318–338.
Guerra-Santin, O., Itard, L., & Visscher, H. (2009). The effect ofoccupancy and building characteristics on energy use forspace and water heating in Dutch residential stock. Energy& Buildings, 41, 1223–1232.
Haas, R., Auer, H., & Biermayr, P. (1998). The impact ofconsumer behaviour on residential energy demandfor space heating. Energy and Buildings, 27, 195–205.
Hens, H., Parijs, W., & Deurinck, M. (2010). Energy consump-tion for heating and rebound effects. Energy and Buildings,42, 105–110.
Hirst, E., & Goeltz, R. (1985). Comparison of actual energysaving with audit predictions for homes in the north centralregion of the USA. Building and Environment, 20(1),1–6.
Itard, L., & Meijer, F. (2008). Towards a Sustainable NorthernEuropean Housing Stock: Figures, facts and future.Amsterdam: IOS.
Itard, L., A. Meijer & O. Guerra Santin (2009). Consumente-nonderzoek Lenteakkoord, OTB/TU Delft report, Delft.
Jeeninga, H., M. Uyterlinde& J. Uitzinger (2001). Energieverbruikvan energiezuinige woningen, Report ECN& IVAM, ECN-C-01-072.
Leth-Petersen, S., & Togeby, M. (2001). Demand for spaceheating in apartment blocks: measuring effect of policymeasures aiming at reducing energy consumption. EnergyEconomics, 23, 387–403.
Menkveld, M. & K. Leidelmeijer (2010). Evaluatie EPC-aanscherping woningen, ECN & RIGO, ECN-E—10-043
NEN 5128 (2004). Energy Performance of Residential functions andresidential buildings: determination method, ics 91.120.10,March.
NEN 5128 norm (2001).Nieman (2007). Eindrapportage woonkwaliteit binnenmilieu in
nieuwbouwwoning, Report Wu060315aaA4.PK, VROMInspectie Regio Oost, Arnhem.
PRC Bouwcentrum BV (2004). EPC en energieverbruik nieuw-bouwwoningen, Report Novem, Kompas Utrecht.
Sardianou, E. (2008). Estimating space heating determinants: ananalysis of Greek households. Energy and Buildings, 40,1084–1093.
Tiberiu, C., Virgone, J., & Blanco, E. (2008). Development andvalidation of regression models to predict monthly heatingdemand for residential buildings. Energy & Buildings, 40,1825–1832.
Uitzinger, J. (2004).Analyse EPC en energieverbruik bij woningen,Report IVAM/SenterNovem
Visscher, H.J., F.M. Meijer & L. Sheridan (2003). Effective andefficient building control, proceedings CIB-CTBUH Inter-national Conference on Tall Buildings, Strategies for per-formance in the aftermath of the World Trade Centre,Malaysia, 8–10 May, pp. 721–726.
282 Energy Efficiency (2012) 5:269–282