the effect of environmental factors on franchise …
TRANSCRIPT
University of New MexicoUNM Digital Repository
Health, Exercise, and Sports Sciences ETDs Education ETDs
9-12-2014
THE EFFECT OF ENVIRONMENTALFACTORS ON FRANCHISE SUCCESS INTHE NBA'S DEVELOPMENT LEAGUE: ANAPPLICATION OF ORGANIZATIONALTHEORYMargaret Keiper
Follow this and additional works at: https://digitalrepository.unm.edu/educ_hess_etds
This Dissertation is brought to you for free and open access by the Education ETDs at UNM Digital Repository. It has been accepted for inclusion inHealth, Exercise, and Sports Sciences ETDs by an authorized administrator of UNM Digital Repository. For more information, please [email protected].
Recommended CitationKeiper, Margaret. "THE EFFECT OF ENVIRONMENTAL FACTORS ON FRANCHISE SUCCESS IN THE NBA'SDEVELOPMENT LEAGUE: AN APPLICATION OF ORGANIZATIONAL THEORY." (2014).https://digitalrepository.unm.edu/educ_hess_etds/18

i
Margaret C. Keiper Candidate
Health, Exercise and Sport Sciences
Department
This dissertation is approved, and it is acceptable in quality and form for publication:
Approved by the Dissertation Committee:
Dr. John Barnes, Chairperson
Dr. James Selig
Dr. Todd Seidler
Dr. Sul Kassicieh

ii
THE EFFECT OF ENVIRONMENTAL FACTORS ON
FRANCHISE SUCCESS IN THE NBA'S DEVELOPMENT
LEAGUE: AN APPLICATION OF ORGANIZATIONAL
THEORY
by
MARGARET C. KEIPER
B.A., Mathematics, Lakeland College, 2008
B.S., Business Administration, Trine University, 2008
B.A., Marketing, Lakeland College, 2009
M.B.A, Business Administration, Lynn University, 2011
DISSERTATION
Submitted in Partial Fulfillment of the
Requirements for the Degree of
Doctor of Philosophy
Physical Education, Sports and Exercise Science
The University of New Mexico
Albuquerque, New Mexico
July, 2014

iii
DEDICATION
This dissertation is dedicated to the precious memories of Janette and Robert
Keiper. Your unconditional love, even after both of you were gone, is what kept me
dedicated to this endeavor. I am thankful for the endless encouragement both of you
showed to me in the pursuit of all my goals. You both taught me to operate with high
character, work hard at everything I do, and to appreciate the great outdoors. Despite the
infinite lessons I learned from the both of you, the thing I am most grateful for is to have
been able to call you "Mom and Dad". I am forever indebted and you are eternally in my
heart.
iv
THE EFFECT OF ENVIRONMENTAL FACTORS ON FRANCHISE
SUCCESS IN THE NBA'S DEVELOPMENT LEAGUE:
AN APPLICATION OF ORGANIZATIONAL THEORY
by
Margaret C. Keiper
B.A., MATHEMATICS, LAKELAND COLLEGE, 2008
B.A., MARKETING, LAKELAND COLLEGE, 2009
B.S., BUSINESS ADMINISTRATION, TRINE UNIVERSITY, 2008
M.B.A., LYNN UNIVERSITY, 2010
PH.D., SPORTS ADMINISTRATION, UNIVERSITY OF NEW MEXICO, 2014
ABSTRACT
In 2001 the National Basketball Association (NBA) formed its own minor league: The
National Basketball Development League (D-League). The D-League was originally
designed as a vertical extension of the NBA and to act as a farm-system for the NBA.
There has been instability in the make-up of the teams within in the D-League since the
inception of the League. Instability is a shared characteristic among all minor league
basketball operations. However, unlike its minor league counterparts, the D-League has
promise to endure long-term.
In this study, external environmental factors that are linked to competition,
demographics and structure are analyzed. Organizational theory takes into account the
role of the external environment in regards to the survival of a new firm. Factors
analyzed were: market size, per-capita income, market education, presence of other
professional sports teams, presence of NCAA Division I men’s collegiate basketball
teams, stadium location, stadium age, stadium ownership, the number of large businesses
within the market place, and business ownership model were all considered.
v
TABLE OF CONTENTS
LIST OF FIGURES………………………..………………………………….….…..viii
LIST OF TABLES………………………………………………..………………...…..ix
CHAPTER I – INTRODUCTION…………………………………….………………..1
Research Problem…………………………………………………………………3
Purpose Statement ……..…………………………………….……………………3
Justification for Research………………………………………….…………........4
Deficiencies in Evidence……………………………………….………………….6
Theoretical Framework …………………………………………….……………..7
Research Questions………………………………….…………………………...10
Hypotheses……………………………….……………………………………....11
Significance of Study and Audience …………….………………………………11
Delimitations……………………………………………………………………..12
Limitations……………………………………………………………………….13
Assumptions……………………………………………………………………...13
Definition of Terms………………………………………………………………13
CHAPTER II – LITERATURE REVIEW
The Professionalization of Basketball..….............................................................16
The D-League…………………………………………...……….………………21
Strengthening the Relationship………….……………………………….23
A Competitive Advantage……………….………………………………25
Hesitance for Expansion……..…............….…………………………….27
Implications of Growth………………….……………………………….26

vi
The Character of Minor League Basketball……………….……………..………30
Shared Characteristics……….…….…….……………………………….32
The Difference of the D-League…………………………………………36
New Firm Survival……………………………………………………………….37
Importance of the Environment…………………...……………………..40
Legitimacy…………………………………………………...…………..41
Theoretical Framework…………………………………………………….…….44
Factors That Attribute to Franchise Success…………..………………………....48
Facility Age………………………………………………………………53
Facility Location…………………………………………………………54
Facility Ownership…....………………………………………………….56
Facility Size……………………………………………………...………57
Market Population………………………………………………………..57
Per-capita Income of Market…………………………………………….58
Market Education Level……………………...…….………………….....60
Market Competition….…………………………………………………..60
Business Structure……………………………………………………….64
Large Businesses in the Market…………………………………………65
CHAPTER III – METHODOLOGY…………………………………………………67
Research Design…………………………………………………………………67
Data Source and Study Rationale………….…………………………………….68
Power Analysis…………………………………………………………..67
vii
Data Assembly…………………………………….……………………..72
Team Market……………..……………………………………….……..74
Measuring Attendance…………………………..……………………....74
Research Question 1: Market Demographics……..……………………..76
Research Question 2: Facility Characteristics……..………………...…..77
Research Question 3: Structure, Competition,& Large Business…..……79
Data Analysis…………………………………………………………………….81
Assumptions…………………………………………………….………..82
Limitations……………………………………………………………….84
CHAPTER IV - RESULTS……………………………………..…………...…………85
Data Analysis Procedures………………………………………………………..85
Research Question 1 – Market Demographics…………………………………..87
Research Question 2 – Facility Characteristics……………………………...…..90
Research Question 3 – Ownership Model, Competition, Businesses…………....93
CHAPTER V - CONCLUSION……………….……………………………………….98
Summary of the Study……………………….…………………………………..98
Implications of Results…………………………………………………………..99
Future Direction………………………………………………………………...104
REFERENCES………………………………………………………………….…….106

viii
LIST OF FIGURES
Figure 1.1. Proposed Framework…………….…………………………………………..7
Figure 1.2: Value Creation Within a Professional Sports Organization ……….……….10
Figure 2.1. Value Creation within an Organization……………………………………..45
Figure 2.2. Factors of a Sports Organizations Environment………………………...….47

ix
LIST OF TABLES
Table 2.1. Number of teams in the D-League per year…………………….…………….25
Table 2.2. Exit and Survival Rates for Minor League Basketball Teams 2010 – 2012…31
Table 2.3. Exit Rate Percentiles by year for the D-League ..…………………...………39
Table 2.4. All D-League teams, years of operation, and status as of 2012………………42
Table 2.5. Summary of Literature: Environmental Factors Affecting Success…..…...…50
Table 3.1. Predictors……………………………………………………………………..68
Table 3.2. Names and Locations of D-League Teams………………………………...…72
Table 3.3. Source of Data Table…………………………………………………………73
Table 4.1 Sample Information and year of Data Considered……………………………86
Table 4.2 Descriptive Statistics for Demographic Characteristics………………………87
Table 4.3 Diagnostics: Demographic Predictors of Attendance Capacity in the D-
League……………………………………………………………………………90
Table 4.4 Descriptive Statistics for Facility Characteristics..……………………………91
Table 4.5 Diagnostics: Facility Predictors of Attendance Capacity in the D-League...…93
Table 4.6 Descriptive Statistics for Resource Characteristics…...………………………94
Table 4.7 Diagnostics: Resource Predictors for Attendance Capacity in the D-League...97
Table 5.1 Proposed Cities for Future D-League Expansion……...…………………....103

1
CHAPTER I. INTRODUCTION
The economics and characteristics of professional sports teams have been
historically referred to as being unique compared to other industries (Cairns, Jennett, and
Sloan, 1986, p. 4). Monopolistic practices, territorial rights in predetermined markets,
depreciation of player contracts, and other factors have all been considered to be
distinctive to professional sport. However, not all of the economic characteristics of
professional sports are unique in comparison to other industries – especially the attributes
of minor league basketball. Difficulty to endure and high mortality rate are prime
examples of the shared struggles that nearly all industries face. High mortality makes
minor league basketball organizations not-so-unique to the difficulties of new firm
survival and reveals the lack of peculiarity in the economics of minor league basketball
compared to other industries.
Within the minor league basketball market place there are always numerous
leagues competing for the sports entertainment dollar. For example, in 2010-2011 there
were thirteen minor leagues in operation within the United States (Krieger, 2012). Since
the collapse of the American Basketball Association (ABA) in 1967, over 30 minor
league basketball organizations have operated– the vast majority of which are now
defunct (D. Jones, 2001, p. 3). Minor league basketball leagues typically have little to no
cooperation with each other and lack business experience, which leads to a revolving
door of teams and leagues (Janas, 2011). The difficulties minor league basketballs
organizations have experienced uphold the idea that professional sport, though unique in
some attributes, is not exempt from the complexity of new business survival. The
National Basketball Association Development League (NBA D-League) is no exception.
2
The D-League is the official minor league of the National Basketball Association
(NBA) and has been in operation since 2001. The D-League represents the vision of the
NBA to have a sustainable minor league, or farm system. The D-League is the first
league in history to be the official minor league for the NBA. Despite the affiliation with
the NBA, the D-League has faced similar struggles that other organizations and industries
encounter. Financial struggles, team relocations, and lack of league identity have all
plagued the D-League (Lombardo, 2010).
Organizations, regardless of industry, are notoriously ill-fated at surviving the
preliminary years of business (Freeman, Carrol & Hannan, 1983, p. 692). One of the
reasons that new firms fail is they do not consider factors that are initially controllable by
the organization or entrepreneur. For example, though the demographics of a market are
considered to be uncontrollable, the selection of which market to enter is initially
controllable by the organization. Conditions that are considered to be initially
controllable are referred to as being contextual conditions. Contextual conditions,
according to Stearns, Carter, Reynolds, and Williams (1995), are "distinguished from
other attributes in that founders, once committed to the condition, may have little
opportunity to change their impact on the firm" (p. 25).
Contextual conditions are composed of environmental characteristics. If an
organization is deficient in its ability to respond to the various environmental pressures or
it neglects to consider flexibility with its organizational design, it is likely that the
organization will decline and fail (G. Jones, 2010, p. 13). Market characteristics,
competition, customers, demographic, structural, and cultural pressures are all types of
forces that can directly affect the ability of an organization to survive. All of these
3
environmental forces are something that ownership should consider prior to choosing
where to locate a D-League team.
Research Problem
From 2001, the D-Leagues initial year, to the end of season in 2012, a total of 32
teams have existed in 27 different markets ("D-League Team Index", n.d.). The D-
League has struggled to maintain a consistent group of teams. Even with heightened
NBA affiliation, the D-League has only once observed two consecutive seasons where
the teams within the League remained the same. The lack of consistency has not strictly
been related to growth or expansion of the league; many teams have relocated or ceased
operation. The two seasons where the assembly of teams remained the same, 2001-2002
and 2002-2003, represent the first two years the league operated.
Since the initiation of the league, the viability of the D-League was of concern;
accurate projections for attendance, sponsorships, and coverage were all struggles
(Lombardo, 2002). Regardless of some of the struggles the D-League has faced, it is
believed that the D-League will be the first minor league basketball league to operate as a
farm system for the NBA and survive long-term (D. Jones, p. 3, 2001). The main
problem that was analyzed and evaluated was the role initially controllable environmental
factors have on the success of an NBA Development League team.
Purpose Statement
The purpose of this study is to identify the relationship between environmental
characteristics of all NBA Development League markets from 2001-2012 and the success
of a D-League team based on the average attendance capacity for the 2012 season, or last
year of operation if a team is no longer operating.
4
Justification for Research
Researchers have determined various factors that attribute to the valuation,
attendance, and market viability of professional sports teams in both major and minor
leagues. The characteristics of the facility in which a team plays, accessibility of
resources, and demographics of the city in which a team plays have all been researched as
a means to determine franchise placement, attendance figures, or franchise valuation.
All of these factors are environmentally related factors.
The population of a city has long been considered as a predictor of increased
franchise value, pricing of seating, or attendance within professional sport. All
researchers found that population is an important factor that attributes to franchise value,
attendance, or franchise placement (Alexander & Kern, 2004; Branvold, Pan, and Gabert,
1997; Davis, 2006; Humphreys and Lee 2010; Humphreys and Mondello 2008; Jones and
Ferguson 1988; Miller, 2007; Miller 2009; Rascher, 2004; Rascher, Baehr, Wolfe, and
Frohwerk, 2006; Siegfriend and Eisenberg, 1980). These studies suggest that a larger
population leads to more available resources and an increased demand for professional
sports. It is generally accepted that larger markets offer more support than smaller
markets in terms of desirable economic characteristics and resources available to a team
(Rascher, 2004). A team should want to consider more urban and populated markets as
opposed to less populated, rural markets.
Other factors that have been considered for franchise viability, value, or
attendance are related to the facility in which a team plays. Jones and Ferguson (1988)
considered the location of the stadium. Numerous studies have analyzed how the age of a
facility affects a franchise (Alexander and Kern, 2004; Baade and Sanderson, 1997;
5
Coates and Humphreys, 2005; Howard and Crompton, 2003; Humphreys and Lee, 2010;
Humphreys and Mondello 2008; Miller, 2007; Miller, 2009; Rascher, 2004; Roy 2008).
Stadium ownership has also been considered on multiple occasions (Humphreys and
Mondello 2008; Miller 2007; Miller, 2009). Lastly, it is known that the D-League looks
for arenas with seating fewer than 6,000 and a curtain system (Barrett Sports Group,
LLC, 2011).
Variables related to competition, structure, and resources have also been
examined. Several studies, (Bruggink and Zamparelli, 1999; Humphreys and Lee 2010,
Humphreys and Mondello, 2008; and Shapiro, DeSchriver, and Rascher, 2012)
researched competition within the market place as it affects professional sports
franchises. Market income as it affects professional sports organizations has also been
considered (Alexander and Kern 2004; Bruggink and Zamparelli, 1999; Humpreys and
Mondello, 2008; Miller, 2009; Rascher, et al., 2006; Shapiro et al., 2012).
Even though none of the original eight teams exist and the D- League seems to
continually be going through restructuring, there is still an extremely convincing
impression that the D-League will continue to exist long-term. The D-League’s growth
strategies have become more deliberate and the league has shown positive growth and
progress in recent years (Lombardo, 2010). League president, Dan Reed, said that every
franchise within the League is now valued at over $2 million each, but there is still
hesitation to expand the League and add new franchises (Lombardo, 2011). There is
hesitance to expand too quickly because the D-League wants to make sure the new
franchises can sustain. It is believed that the D-League will be the first minor league
basketball league to operate as a farm system for the NBA and survive long-term (D.

6
Jones, 2001, p. 3). Consequently, understanding what environmental factors attribute to
franchise success is essential for the future of the D-League and minor league basketball
as a whole.
Deficiencies in Evidence
Whereas there is a substantial amount of research on franchise valuation for major
league sports and a few studies on minor league baseball, there is minimal research on
other minor league basketball. There is not – to the researcher's understanding – any
research that has been conducted on the D-League. The lack of research on the D-
League is potentially due to the relative novelty of the league.
Because of the lack of information on the D-League, there is a gap in the
literature. This gap is important to fill because of the anticipation and future implications
that the D-League embodies. The D-League represents the future of minor league
basketball. It is possible that if the D-League is not successful, then minor league
basketball will never be viable in the United States because of the precipitous history
surrounding minor league basketball. The D-League is accomplishing the ultimate goal
that all other minor leagues wanted to accomplish: being partnered with the NBA (Pilato,
2013).
Another deficiency in the literature was in regard to the type of competition
considered and the factors that affect franchise survival or success. For major league
sports, larger markets are typically more favorable; however, minor league sports
typically look for mid-size markets or smaller markets. Also, though sport-specific
competition as a predictor of franchise success has been considered on the professional
level, there has been minimal consideration given to competition from collegiate sports. It
7
THE ORGANIZATION
Franchise Success, Measured by Attendance
THE ENVIRONMENT
Facility Characteristics
THE ENVIRONMENT
Market Demographics
THE ENVIRONMENT
Competition, Resources, and
Structure
is well understood that big-time collegiate athletics, specifically NCAA Division I Men's
Basketball and Football, often have significant sponsors, attendance, and media coverage.
Accordingly, the type of competition considered left a gap in the literature as well.
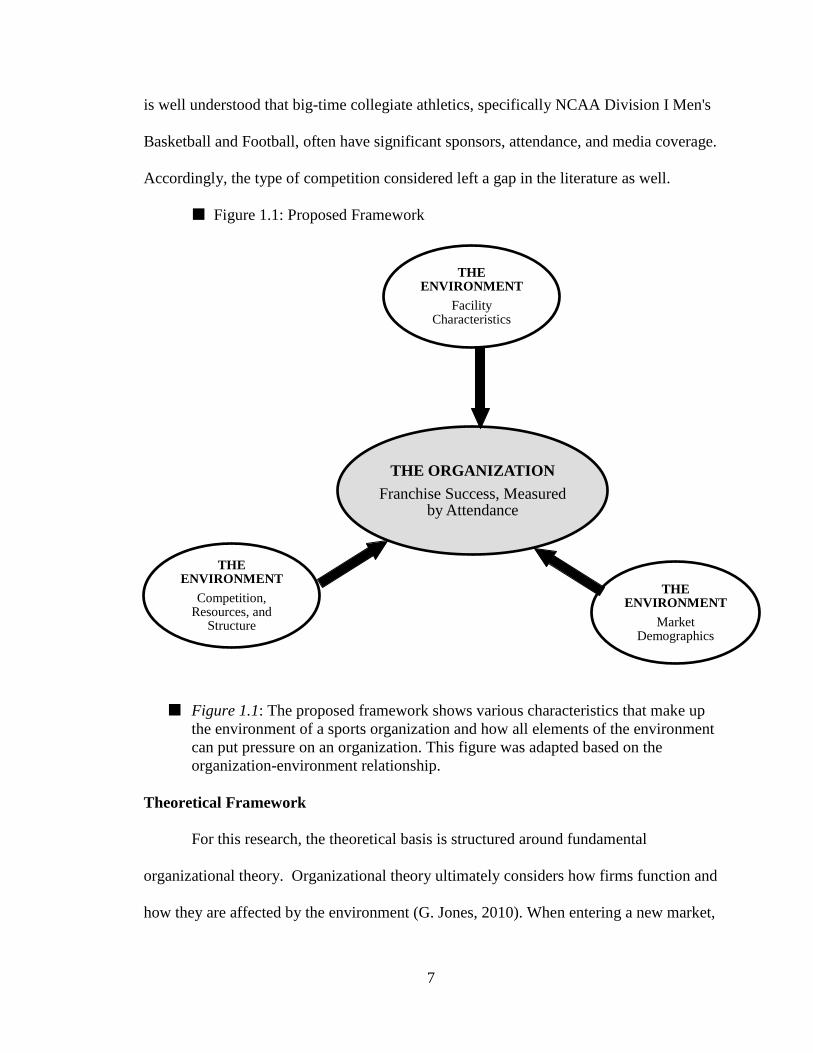
Figure 1.1: Proposed Framework
Figure 1.1: The proposed framework shows various characteristics that make up
the environment of a sports organization and how all elements of the environment
can put pressure on an organization. This figure was adapted based on the
organization-environment relationship.
Theoretical Framework
For this research, the theoretical basis is structured around fundamental
organizational theory. Organizational theory ultimately considers how firms function and
how they are affected by the environment (G. Jones, 2010). When entering a new market,
8
a D-League team must first choose a market, location, and structure that will allow for
success. Characteristics of the market, resource availability, and structure of the
organization are all initially controllable environmental factors when a new franchise is
formed.
Despite the interest by scholars of predictors determining new firm survival, there
is still a bit of uncertainty and lack of sufficient data in regards to determinants of success
and failure of new firms (Fritsch, Brixy & Falck, 2006, p. 286). It is believed that
environmental factors are the first things that must be considered when placing a firm,
because these factors can affect the success of an organization. The context within which
the organization operates is due largely to the economic pressures as well as the design of
the organization itself (Child, 1974, p. 2). Jones (2010) agreed that if an organization
lacks structure and does not consider the environment in which they operate it is likely
that the organization will not survive (p. 13). Figure 1.1 shows a breakdown of the
proposed framework used in this study.
Consumer motivation characteristics, winning percentage, and marketing
strategies – though possibly strong predictors – are not related to the theory at hand and
are subsequent to firm location, market selection, and structure. Also, the personal
characteristics of the ownership will also not be considered because of the theory being
assessed. The theoretical framework is based off the organization-environment
relationship which is a component of organizational theory.
For this research and theoretical framework, it essential to understand that it is a goal
of every organization to create value; the D-League is no different. Value creation is
critical to any for-profit firm because of how economic value is typically measured.

9
Economic value is typically measured by total revenue, and revenue is achieved by the
value outweighing the costs to create the product (Amit and Zott, 2001). Every
organization, regardless of industry, has three stages that it will experience in its efforts to
create value: input, conversion, and output (G. Jones, 2010, p. 6). Inputs for a
professional team would include raw materials, human resources, information,
knowledge, capital, and customers. The conversion process for a sports organization
would be comprised of the ability of the staff, tracking, reporting, and market research.
Outputs for a professional sports team include satisfied customers, attendance at games,
and sponsorship procurement. The environment influences all three stages of the value
creation process for any organization (G. Jones, 2010). If value creation is the process
that profit is made, and the environment influences the value creation process, then for
value creation to be maximized the environment should absolutely be examined and
understood.
It is simply not enough for an organization to have goals, skilled workers, and
high motivation. An organization must consider the constraints of the environment. An
organization must have the ability to accommodate to the environment (Child, 1974).
For example, a D-League team may have a state of the art facility with a very talented
staff and excellent funding; but if the team is located where people cannot easily access
the facility or where few people live, then it could be assumed that the team would
struggle to survive or not survive at all. The environment is one of the critical variables
in organizational theory that should be considered when a decision-maker within an
organization is making the choice of where the organization should be located (Child,
1974, p. 17). However, simply being aware of the environment is not sufficient. A firm

10
must be more specific as to what factors attribute to survival and financial viability. The
specification of precise environmental factors is imperative for the reason that every
business venture, whether new or established, needs to be aware of the particular
environmental mix that attributes to its survival (Zimmerman and Zeitz, 2002, p. 416).
Figure 1.2: Value Creation Within a Professional Sports Organization
Figure 1.2: The process of creating value within a sports organization. Value
creation is a continuous cycle which is represented by the arrows in this figure.
This figure was adapted and created from "How an Organization Creates Value"
by Gareth R. Jones, 2010, Organizational Theory, Design, and Change, 6, p. 4.
Research Questions
: To what extent do city demographics (MSA, income, and education level)
within a market have a relationship with the success, as defined by
percentage of attendance capacity, of a D-League team?
: To what extent do facility characteristics (facility age, facility location,
facility size) have a relationship with the success, as defined by percentage
Inputs
(Raw materials, people,
knowledge, etc.)
Conversion
(Ability to staff, reporting, market
research, etc.)
Outputs
(Attendance, sponsorship
procurement, etc.
11
of attendance capacity, of a D-League team?
: To what extent does the ownership model, pro and college teams within the
market, and presence of large business within the market have a
relationship with the success, as defined by percentage of attendance
capacity, of a D-League
team?
Hypotheses
: The city demographic factors: population, income, and education level
within a market will have a relationship with the success, as defined by
attendance capacity of a D-League team.
: The facility characteristics: facility age, facility location, and facility size,
will have a relationship with the success, as defined by attendance
capacity, of a D-League team.
: The ownership model, pro and college teams within the market, and presence
of large business within the market will have a relationship with the
survival of a D-League team.
Significance of Study and Audience
Research in the subject area of organizational theory, specifically environmental
factors and initially controllable factors contributing to success within a professional
sports organization, are essential to be aware of for franchise placement. A poor fit
between an organization and the environment leads to failure (G. Jones, 2010). This
study is beneficial for current and past D-League owners, cities, and league officials. It
applies components from basic organizational theory to possibly explain the relationship
12
a D-League team has with the environment in which it operates. Moreover, this study
offers recommendations on how to evaluate the placement of an NBA Development
League franchise.
Ultimately, this research will also be helpful to other leagues by informing them
of environmental factors that could attribute to increased chance of success based on
franchise location and the initially controllable environmental characteristics of the
market. This research contributes to previous explorations related to factors that
determine franchise success and survival within North American sports leagues. As a
result, by understanding if any of the competition, demographic, structural, or facility
characteristics being considered do affect team success, it may help a league as well as
potential owners to understand which markets may be ideal for housing a future
professional sports franchise.
This research also adds to the literature on new sports facilities and could benefit
individual cities and communities. Although many owners of professional sports teams
and local political and community leaders claim that professional sports facilities and
franchises have a positive economic impact on urban areas, economists have not found
any support of these claims (Coates & Humphreys, 2003, p. 335). Construction of new
sports stadiums often utilizes some form of public funding (Siegfried & Zimbalist, 2000).
Considering that the D-League has now operated 32 different franchises in 27 different
states, it is important for communities to understand the impact of a new stadium on a
team’s survival, if there is one.
Delimitations
• Data represents entire population from 2001 to 2012

13
• Data will be collected through secondary data sources
• Access to city demographic information
• Researcher worked in the D-League and is familiar with league operations
• Contact and relationship with League officials
Limitations
• May not be generalizable beyond the population being studied
• Time of the study (instability of teams)
• Attendance reporting measures (teams may inflate attendance numbers)
• Ability of theory to address the problem of firm survival
• Differences in folded teams and current teams
Assumptions
• Attendance is a viable means of predicting franchise success
• All variables can be accurately measured
• The secondary data sources are all accurate sources of data
• Data is normally distributed
• The size of the population is sufficient to detect significance if it exists
Definition of Terms
• Attendance: The percentage of total attendance capacity for the last year of
operation or 2012-2013 season, if a team is still operating. This figure will be
found by taking the total attendance for the year divided by the total possible
capacity in the given stadium for that same year, which will give the attendance
capacity. The attendance capacity will then be multiplied by 100 to calculate a
percentage of capacity for the season.

14
• Direct Competition: For the purpose of this research, it is a situation where two
firms are offering the sport product within the same market. Specifically, one of
the two firms will be the D-League team within the market, the other competitor
would be one of the following: NBA, NHL, NFL, NBA, WNBA, MLS, MiLB,
AHL, or NCAA Division I Men's Basketball team.
• Farm-system: Refers to a minor league that provides players, coaches and
officials to a parent major league sport organization.
• Franchise: Synonym for sports team or sports organization
• Initially Controllable Factors: For this study, this term refers to characteristics
that are related to the environment and are difficult to change once market entry
occurs.
• Major College Basketball: A men’s basketball team that competes as the NCAA
Division I level.
• Organizational Environment: The set of forces and conditions that operate
beyond an organization’s boundaries but affect its ability to acquire and use
resources to create value. (Jones, 2010, p. 2)
• Organizational Theory: The study of how organizations function and how they
affect and are affected by the environment in which they operate. (Jones, 2010, p.
7)
• Ownership Model: Refers to the ownership structure of the D-League teams.
Three different types of affiliation exist: direct affiliation, hybrid ownership, and
independent ownership.

15
• Franchise Success: The ability for a team to remain operating within the NBA's
Development League without an involuntary exit from the market. For this study,
success and survival is based on attendance due to the relationship between
attendance and profit generation.
• The Four Major Leagues: Refers to the four major sports leagues within the
United States: National Basketball Association (NBA), National Football
Association (NFL), National Hockey League (NHL) and Major League Baseball
(MLB)
16
CHAPTER II: REVIEW OF LITERATURE
The purpose of this chapter is to give a comprehensive review of current literature
associated with minor league basketball, environmental factors, and firm survival as it
pertains to the National Basketball Association Development League. This chapter is
subdivided into the following areas: (1) The Professionalization of Basketball; (2) The D-
League, (3) The Character of Minor League Basketball; (4) New Firm Survival; (5)
Theoretical Framework; (6) Factors That Attribute to Franchise Success.
It is important to first understand a brief history of professional basketball and
how the struggle for franchise survival is not a complication solely restricted to modern
day basketball leagues. It is also essential to grasp the nature and traits of current minor
league basketball. Basketball specific literature is followed by literature relevant to the
theoretical framework and information on new firm survival. The last section of the
literature review describes research that has been conducted regarding factors attributing
to franchise success or increased franchise value.
The Professionalization of Basketball
An instructor in Springfield, MA, Dr. James Naismith invented the game of
basketball in the fall of 1891. The original design of the game of basketball has changed
significantly over time. Naismith originally designed a game consisting of 13 rules and 9
players on each team (Shoals et al., 2010, p. 18). Rules, equipment, and style of play
have developed drastically since its origin in the late 1800's. The game Dr. Naismith
invented started out as an experiment for a physical education class and over time has
evolved into a multi-billion dollar sport in the United States (Stewart, 1998, p. 7). The
17
most compelling and significant progressions of basketball occurred when the sport
became professionalized.
Basketball was originally played in the gymnasium at the Young Men's Christian
Association (YMCA) Training School (now Springfield College) as a noon-time casual
game (Naismith and Baker, 1941, p. 60). The popularity of the game grew quickly and
was adopted by many other YMCAs around the United States in the late 1890's and early
1900's (Stewart, 1998, p. 9). Teams developed and the competition level began to
increase which led to teams buying their own equipment, paying for uniforms, traveling
to play, and paying for practice time (Stewart, 1998, p. 11). Hence, the
professionalization of basketball began and the transformation process from a make-shift
game to a multi-billion dollar business came into existence.
Between basketball's origin in 1891 and the 1930's there were various efforts to
develop a uniform professional basketball league. During the first few decades in the 20th
century there were over twenty professional basketball leagues in operation (Stewart,
1998, p. 16). None of the professional basketball leagues were able to withstand the
hardships of World War I and World War II which plagued the entire country. Either
leagues struggled financially or they were forced to give up their venues because the
venues were needed for ammunition and machinery storage (Stewart, 1998, p. 17). All of
the leagues that were developed followed in the steps of the rest of the country and
succumbed to the economic hardships that inundated the United States in the era of the
Great Depression (Shoals, et al., 2010, p.18).
Some of the original leagues included the Metropolitan League, American
Basketball League, and Midwestern Basketball Conference (Shoals, et al., 2010, p. 18).
18
A few of the leagues, such as the Midwestern Basketball Conference, had financial
backing from local factories. Even with some financial backing, professional leagues still
encountered a number of hardships and often struggled to maintain operation. However,
struggling to maintain operation was not a problem for another form of basketball that
was coming into existence. This other form of basketball was the "barnstorming circuit."
The teams in the barnstorming circuit ranged from the Harlem Globe Trotters (the
infamous ‘show’ basketball team from Harlem, though originally from Chicago) to the
group of women who were all red headed known as the All American Red Heads, and
played against the men’s teams (Shoals et. al, 2010, p. 21-25). Barnstormers were able to
organize individual games for themselves and traveled the nation, often playing more
than a hundred games a year (Shoals et. al., 2010, p. 20). Because of the lack of
organization and structure in professional basketball and the high rate at which
professional leagues entered and exited the market, the barnstorming circuit was able to
be wildly successful for a period of time prior to teams operating in unison as a league.
The first attempt to form a national league began in 1925. The American
Basketball League was the first professional league to offer written contracts. But, like
many of its counterparts, the league could not endure the Great Depression and folded in
the 1930s (Shoals et. al, 2010, p.18). The National Basketball League (NBL) was the
next true attempt at a league that would compete nationally. The NBL was formed in the
season of 1936-1937 after a group of teams which had formed the Midwest Basketball
Conference (MBC), decided to change its name to further validate the significance to the
league (Shoals et al., 2010, p. 19; Stewart, 1998). The NBL had enough economic
accomplishment to pay its players more than the average American worker. The teams

19
were backed by local factories, thereby providing monetary stability for each team
(Shoals et. al., 2010, p. 18).
The financial success of the NBL from 1938 to 1946 provided insight and a sense
of opportunity to a group of hockey arena and team owners. These owners formed their
own basketball league known as the Basketball Association of America (BAA) to fill
their empty arenas when their hockey teams were out of town (Stewart, 1998; Shoals et.
al., 2010). The NBL and BAA were some of the first truly organized leagues that
operated within professional basketball; they were also competitors.
The BAA and NBL operated simultaneously until 1949 when the two leagues
merged (Stewart, 1998; Shoals et. al., 2010). The BAA typically played in large arenas
in top-tier cities but had less talent than its competitor the NBL. The NBL had more
stable franchises, better attendance, and more talent than the BAA, but the facilities and
cities the NBL played in were smaller and undesirable (Stewart, 1998, p. 52). The strong
identification with each local community in which the NBL played made the league
successful. There was a strong sense of local pride within NBL communities (Nelson,
2009). The BAA, on the other hand, lacked the support from the communities in which
they operated but had stronger financial support. The strong financial support for the
BAA led to, in 1949, the ability of the BAA to attract the talent from the NBL. The loss
of talent within the NBL made the owners in the NBL approach the BAA to suggest a
union of the two leagues. Owners from the BAA and NBL decided if professional
basketball were to ever be successful in the United States the two leagues would need to
merge. Thus, in 1949 the NBL and BAA merged to form a new league the National
Basketball Association (NBA) (Stewart, 1998; Shoals et. al., 2010).
20
Even with the NBL and BAA merging to form the NBA, the NBA would not go
unrivaled as the sole major league until the 1970s. In 1967 the American Basketball
Association was established and began to compete with the NBA for its talent (Shoals, et.
al., 2010, p. 73). The American Basketball Association (ABA), by 1970, instituted a
unique presence in the realm of professional basketball. The ABA brought in a different
style of play, renegade marketing ideas, and a bit of instability (Shoals, et. al., 2010, p.
73). Though the ABA was a bit ambiguous, the ABA still attracted enough talent in its
league to be a competitor, and partial nuisance, to the NBA. (Shoals, et. al., 2010, p. 85).
In 1970 there was an attempt by NBA owners to merge the two leagues. However, Oscar
Robertson (NBA Players Association President) filed and won a lawsuit based on
antitrust and the basis that the NBA was monopolizing professional basketball by
suggesting a merger of the two leagues (Shoals, et. al., 2010, p. 85). In spite of the
successful lawsuit and claim of monopolization, the ABA only lasted six more years. In
1976 the ABA halted operation (Shoals et. al, 2010, p.85). Consequently, from 1976 on,
the NBA has been the only major basketball league in the United States.
While the NBA and ABA were competing with each other, another league was
also vying for a piece of the professional basketball market in the United States. The
Continental Basketball Association (CBA) was formed 2 ½ months before the NBA was
founded. In the 1960s and 1970s the CBA, despite being around since 1946 as the
Eastern Pennsylvania Basketball League, found itself competing with the ABA for
players. The CBA operated in a regional sense as opposed to nationally like the NBA
and ABA. When the ABA and NBA merged in 1976 the CBA remained in operation and
claimed to be the NBA’s minor league, though there was not a true affiliation with the

21
two leagues (Eide, 2011). The major difference in the CBA and the NBA/ABA is that
the CBA was never considered a true major league; they were always viewed as minor
league.
In 1999 the CBA was sold to an NBA veteran with little business experience.
Two years later, in 2001, the CBA was plagued with financial difficulties and filed for
bankruptcy (Waldstein, 2009, D6). Even with bankruptcy the league still reorganized
and merged with another league, the International Basketball Association (IBA).
However, the CBA did not endure. With only four teams playing, the CBA decided to go
on a hiatus and has not operated since 2009. Part of the disappearance of the CBA is
likely attributed to the formation of a new league: the National Basketball Development
League (NBDL). In 2006 the CBA was again in the midst of economic grief and found
four of its teams leaving to join the NBDL (Eide, 2011). Prior to downfall, the CBA
historically had claimed to be “The oldest professional basketball league in the world”
until its demise in the early twenty-first century (Eide, 2011).
The D-League
In 2005, Sporting News writer Sean Deveney wrote: “Hallelujah, we finally have
a real minor league for basketball” (Deveney, 2005, p. 49). Deveney was referring to the
NBA's minor league, the National Basketball Development League (NBDL). The
NBDL was formed in 2001. Four years after being formed, in 2005, the NBDL was
renamed to the NBA Development League and the nickname "D-League" was officially
adopted (Lombardo, 2005). The D-League was initially an eight-team league housed in
midsize cities in the Southeastern United States (Apostolopoulou, 2005, p. 59). From
22
inception, the initiative of the NBA was to produce a league to be a farm-system that
would act as the official minor league of the NBA.
The farm-system would operate in a way that not only players, but coaches,
officials and front office staff would use the minor league as a training method to sharpen
skills, gain experience, and eventually filter into the NBA. Apostolopoulou (2005)
described this new minor league as a "vertical extension of the NBA". Initially the NBA
used a distancing technique for the formation of the new minor league. The NBA is
headquartered in New York City, but the NBA decided to have the main offices for the
D-League in Greenville, South Carolina (Apostolopoulou, 2005, p. 59). Also, the NBA
wanted the NBDL teams to operate in markets that lacked the physical presence of an
NBA team which allowed the NBA to enter into new markets (Apostolopoulou, 2005, p.
57). The tactics employed by the NBA proved to be unsuccessful. The NBA
incorporated a mistakenly ineffective approach to marketing the league and there were
obvious adverse issues that all of the original franchises were exposed to (Muret, 2003).
The original D-League teams all faced the problem of finding a niche within their market
(Lombardo, 2010). Similar to the historical jagged path of professional basketball, the
NBA's minor league was not able to establish a position within the industry without
complication.
Originally, the D-League struggled to develop any sort of reputation other than
that of a tag-along league of the NBA’s (Scheitrum, 2012). The eight original teams
"were owned by the NBA, and they shared the same generic logo – along with the same
financial struggles" (Lombardo, 2010, para. 4). Financial struggles and the inability to
form an identity weighed down the D-League so much that at one point only six teams
23
were operating. For two consecutive seasons between 2003 and 2005 there were only six
teams in the NBA Development League. The lack of teams within the D-League could
ultimately have steered it towards the same fate as the CBA. When the CBA folded in
2009, they only had four teams in the league; without having enough teams a league
cannot realistically survive (Waldstein, 2009, p. D6). However, the NBA recognized the
issue the D-League was facing and the NBA intervened with its newly formed minor
league.
Strengthening the relationship.
In 2005, it was reported by Naples Daily News that the NBA would be increasing
its role with the NBDL. Phil Evans, the former NBDL President, confirmed that the NBA
would be playing a more critical role for the NBDL and emphasis of the link between the
two leagues had become a priority (Lombardo, 2005). From 2005 on, there were many
changes for the NBDL. League headquarters were moved to New York City, each NBA
team was assigned a NBDL team, and the name of the league was changed to emphasize
the association (Lombardo, 2005). The National Basketball Development League would,
as of 2005, be known as the NBA’s Development League or “D-League” (Lombardo,
2005). The D-League went from a league that shared the same generic logo and similar
financial struggles, to a League comprised of individual teams which were finding a
strong foothold in their respected market (Lombardo, 2010).
The major strengthening of the relationship between the NBA and the D-League
has come through individual D-League teams and their relationship with the parent NBA
team. Some of the parent NBA teams took over the basketball operations for their
respective D-League teams as opposed to simply being an affiliate which had the first
24
option for a player being called up to the League (Lombardo, 2011). Being affiliated with
a well-established professional team reinforces the permanence of a team. With some of
the NBA teams taking over the basketball operations for their given D-League teams, the
D-league has continued to advance and gain strength based on the amplified connection
with the NBA (Lombardo, 2010). As of 2012, eleven of the sixteen teams had some sort
of single-affiliation relationship with a parent NBA team (Scheitrum, 2012). The other
five D-League teams had multiple NBA teams that share affiliation.
The target market for the D-League also changed. Teams went from being
located strictly in the Southeast region of the United States to being located all over the
country in larger markets that were closer to NBA teams (Lombardo, 2011). The D-
League, as of 2013, had 17 teams entering the season, representing 13 different states.
Also, the NBA increased its ties in oversight of the D-League by not allowing individual
teams to pay the players. Players are compensated based on three separate levels of
contracts ranging from $15,000 to $25,000 a year and are funded by the NBA – not the
individual franchises (Niesen, 2013). Having the league pay the players’ salaries helps
ownership by increasing cash flow and by keeping costs down for the individual
franchises.
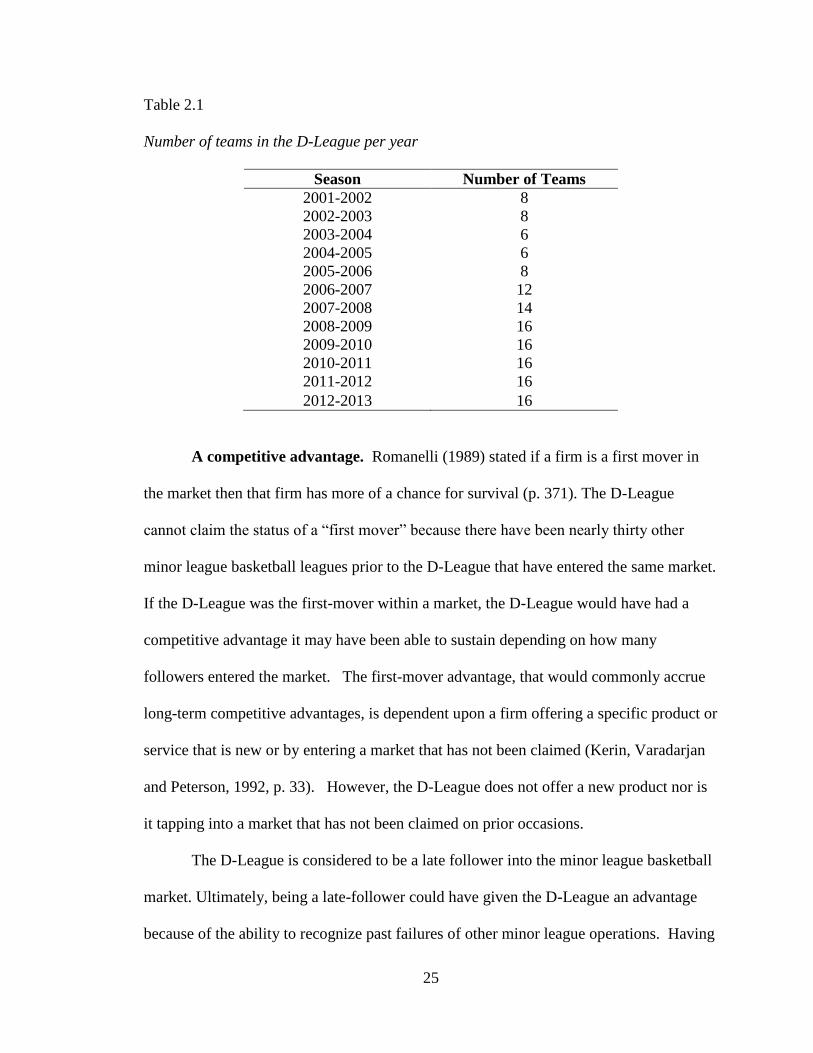
The D-League has built viability and a bit of consistency with teams operating
within the league. Table 2.1 shows the number of teams that operated per basketball
season. (The table does not include the 2013-2014 season because research was
conducted prior to the end of the playing season.) The increased affiliation with the
NBA, undoubtedly, has given the D-League a competitive advantage in the realm of
minor league basketball.
25
Table 2.1
Number of teams in the D-League per year
Season Number of Teams
2001-2002 8
2002-2003 8
2003-2004 6
2004-2005 6
2005-2006 8
2006-2007 12
2007-2008 14
2008-2009 16
2009-2010 16
2010-2011 16
2011-2012 16
2012-2013 16
A competitive advantage. Romanelli (1989) stated if a firm is a first mover in
the market then that firm has more of a chance for survival (p. 371). The D-League
cannot claim the status of a “first mover” because there have been nearly thirty other
minor league basketball leagues prior to the D-League that have entered the same market.
If the D-League was the first-mover within a market, the D-League would have had a
competitive advantage it may have been able to sustain depending on how many
followers entered the market. The first-mover advantage, that would commonly accrue
long-term competitive advantages, is dependent upon a firm offering a specific product or
service that is new or by entering a market that has not been claimed (Kerin, Varadarjan
and Peterson, 1992, p. 33). However, the D-League does not offer a new product nor is
it tapping into a market that has not been claimed on prior occasions.
The D-League is considered to be a late follower into the minor league basketball
market. Ultimately, being a late-follower could have given the D-League an advantage
because of the ability to recognize past failures of other minor league operations. Having
26
information from past failed ventures may allow for the development of a product that
better meets the needs of the consumer (Shepherd, 1999, p. 622). With all of the failure
and instability of previous minor leagues, the D-League stands a better chance at survival
if consideration is given to issues that have deterred previous minor league basketball
teams and leagues from surviving.
Regardless of the previous failures of minor league teams, the D-League still has
a competitive advantage in its relationship with the NBA. The endorsement and financial
support of the NBA helped create a strategic advantage for the D-League. The D-League
is a vertical brand extension of the NBA because it is a new product/service offered in the
same class as the NBA but considered a step-down because it is of lower price level and
quality of core brand, the NBA (Apostolopoulou, 2005, p. 57). It is believed that when
the NBA emphasized the association with the D-League, the credibility of the D-League
improved due to the previous accomplishments of the NBA. Since the invention of
basketball, there have been very few leagues that have maintained authenticity within the
marketplace. Arguably, the NBA may be considered the only league that has maintained
true legitimacy by its consistency and fiscal strength.
The D-League, even with a competitive advantage of being backed by the NBA,
is not impervious to the difficulties that have traditionally beset minor league basketball.
The same struggle for success and viability is the same trouble that plagued, and
continues to plague, minor league basketball operations. Those struggles were the reason
for the accentuation of the relationship between the D-League and NBA. As a result of
past failures, the D-League shows hesitance and caution for league expansion.

27
Hesitance for expansion. Even with the league gaining strength, like its other
minor league counterparts, the D-League has yet to show true stability with its teams.
Aside from the first two years of operation the D-League has seen teams either enter or
exit the league on a yearly basis. Also, there is still a lack of clarity for how many teams
within the D-League make a profit and what the teams are valued at (Lombardo, 2010).
The end of the 2012-2013 season marked the first time, since the D-Leagues first two
years, the League did not have a team cease operation or move.
Since its inception in 2001 the D-League has made significant shifts in expansion,
ownership, and business models (Niesen, 2013). Though the league is beginning to
resemble a true feeder system for the NBA, there is still caution in expansion of the
league as stated by current D-League president, Dan Reed (Lombardo, 2011). According
to Reed (2012) the ultimate goal is to have 30 D-League teams, though it will be a slow
process and cautionary measures are being taken (Niesen, 2013). It is believed the
deliberate caution for expansion is fueled by the high mortality rate for individual teams
within the D-League, as well as all of minor league basketball. The D-League also shares
similar struggles to that of Minor League Baseball (MiLB).
Similar to minor league basketball, the evolution of minor league baseball was
also very volatile; teams and leagues were frequently entering or exiting the market place
(Land, Davis, and Blau, 1994, p. 783). It wasn't until the 1920s that baseball
implemented a farm system for the major leagues. The actualization of a farm system
allowed the major league teams to develop players via an exclusive minor league team.
Land et al. (1994) stated that "The farm system for baseball is considered the single most
important event in the history of minor league baseball" (p. 786).
28
The D-League has evolved into a league that is starting to resemble a successful
minor league similar to the minor leagues that operate in baseball and hockey (Niesen,
2013). Though there have been a number of minor league basketball leagues that have
operated over the years, none have ever acted as a true farm system for the NBA, until
the D-League made its change in 2005. Comparing the similarities between the D-
League and minor league baseball, it is conceivable that the D-League will be able to
sustain long term. In order to endure, the league must continue to refine the
configuration and model to mimic minor league baseball. As the D-League grows, the
league must be selective with the markets that the teams enter.
Implications of growth. In 2001 – the inaugural season of the D-League – Jones
wrote a thesis on how to make minor league basketball organizations work. In reference
to the National Basketball Development League, Jones stated, “The chances for the D-
League’s survival are far greater than any other minor league (p. 18)." Jones' insight
from 2001 has proven to be quite accurate. The National Basketball Association, the
highest level of basketball in the world, endorsed, formed, and is successfully running its
own minor league. The D-League is officially operating as the NBA’s minor league
using the league as training grounds for officials, staff, and players. According to
Scheitrum (2012) over 23% of all NBA players had playing experience within the D-
League. In 2011-2012 the NBA called up 44 D-League players to an NBA roster. This
was higher than any other minor league in the United States or overseas (Niesen, 2013).
Sport Business Journal (SBJ) biannually ranks the top minor league markets
based on attendance, economic factors, and tenure within a market. In 2005, the D-
Leagues fourth year of operation, none of the SBJ top 10 minor league markets were
29
home to a D-League team. However, in the 2013 SBJ ranking, four of the top 10 cities
were home to NBA Development League (D-League) teams. It is possible that the
presence of D-League markets on SBJ's biannual ranking is an indicator of the growth of
the D-League.
The 2013-2014 season marks an all-time high for the number of teams operating
within the D-League. The D-League will enter season with 17 teams, the highest since
the inception of the league in 2001. In 2012-2013 the D-League saw overall league
attendance figures reaching well over 1,000,000 for the fourth year in a row and a three
percent increase of overall attendance, which also marked an all-time league high
(Warden, 2013). With attendance figures increasing, the D-League is gaining some
traction and starting to see value in the individual franchises and league (Lombardo,
2011). The promise to endure is further supported by the implication of increased
franchise values and claims of profitability. (Neither can be validated because the
information is not public). Team values cost $400,000 to buy into at the initiation of the
D-League; now they are "being valued at close to $4 million" according to Thompsen
(2013). More than half of the franchises claim to be profitable (Thompsen, 2013).
Regardless of recent success, long-term prosperity has been a jagged path for any
team or league in minor league basketball, including the D-League. Characteristics of
minor league basketball should be considered because of some shared similarities that the
D-League has with other minor league basketball operations. For instance, the D-League
shares many similar characteristics with one of its predecessors: the Continental
Basketball Association.
30
The Character of Minor League Basketball
Like the D-League, the CBA had successful attendance at games and financial
value. The CBA had many successful years in the 1980's and 1990's, where teams were
playing in front of crowds of over 5,000. In the 1980s, the CBA's 14 franchises "were
valued at roughly $500,000 a piece" (Eide, 2011). Also, in 1999 the CBA was purchased
for $10 million dollars, which shows the CBA had significant financial value (Eide,
2011). Despite the financial value, the CBA did not survive. Like the initial years of the
D-League, the CBA dealt with shifting platforms which lead to struggling small-town
teams (Waldstein, 2009).
The demise of the Continental Basketball Association (CBA) indicated the end of
a truly legitimate independent minor league and the loss of a league that had been around
for over fifty years (Waldstein, 2009, p. D6). However, the fall of the CBA and initiation
of the D-League did not hinder other leagues from forming and striving for possible
prosperity in minor league basketball. Since the downfall of the ABA in 1967 there have
been over 30 other minor league basketball organizations that have formed (Jones, 2001,
p. 3). In 2011-2012 alone, there were 13 minor basketball leagues operating in the
United States (Krieger, 2012). In addition, four other short-season development leagues
were categorized as professional minor leagues operating within the United States
(Krieger, 2012, p. 84).
Table 2.2 contains a breakdown of team consistency for each of the minor leagues
that operated from the 2010-2011 to the 2011-2012 season. The Independent Basketball
Association (IBA) was not included in Table 2.2 because 2011-2012 was the inaugural
season. By taking the total number of teams in a league at the beginning of a season and

31
dividing it by the number of teams that do not operate within that same league the
following season, will give a rate of exit within that league. Likewise, by taking the
number of teams still in operation at the end of the 2010-2011 season and dividing that by
the total number of teams that started the season, the rate of retention in 2010-2011 may
be calculated. The importance of the exit and retention rate is to show the precariousness
and lack of consistency within minor league basketball. The retention rates also
emphasize the low exit rate of the NBA Development League (D-League) compared to
all other minor leagues that operated in 2011-2012 (aside from the Universal Basketball
League).
Table 2.2
Exit and Survival Rates for Minor League Basketball Teams from 2010-2011 to 2011-
2012
Similar to the initial owners in the early stages of professional basketball, new
entrepreneurs continually see the potential financial gain that could be made in operating
League Teams 2010-2011 Teams Not Returning Exit Rate Retention Rate
D-League 16 2 12% 88%
PBL 8 6 75% 25%
ACPBL 8 4 50% 50%
IBL 15 6 40% 60%
UBA 23 7 30% 70%
ABA-2 60 21 35% 65%
EBA 14 7 50% 50%
WBA 6 3 50% 50%
CBL 5 3 60% 40%
TPBL 6 4 67% 33%
WCBL 6 2 33% 67%
UBL 6 0 0% 100%

32
a professional basketball team or league. The following is a brief description of some of
the commonalities the leagues shared. Illustrating the volatility in minor league
basketball is beneficial to this research because it allows for an accurate depiction of the
D-League's significance. It also demonstrates the conflicts that minor league basketball
encounters and instability within the market, which further supports the need for research
on firm success in the D-League.
Shared characteristics. Not including the D-League, there were 12 other minor
leagues operating in 2011-2012 in minor league basketball. Aside from the location and
names of the teams, the differences among the 12 leagues are nearly indistinguishable.
Despite the different names, locations, and structure of the leagues, many minor league
basketball organizations share the same ill fate: the inability to endure (Jones, 2001, p. 7).
The inability to endure in minor league basketball is believed to be explained by some of
the shared characteristics among the leagues. Ease of market entrance, low operating
costs, identity changes, and similar league visions, are all commonalities in minor league
basketball.
One of the reasons for the high number of minor league basketball leagues to be
in operation is because of the ease of ownership. Start-up costs are minimal and it seems
as though anyone with access to a gym can start a league; there is not an organized
credentialing process for minor league teams or leagues (Janas, 2011). It seems rather
uncomplicated and quite inexpensive to buy into many of the minor league basketball
organization. For example, the IBA advertises that operating costs for teams typically
range from 50k to 80k (Bradford, n.d.). The Premier Basketball League (PBL), on the
other hand, only listed the financial commitment to include "the ability to pay the $3,500
33
annual fee to the PBL"; other operating costs for the PBL are dependent upon the
ownership ("Own a Team", n.d., para. 4).
The financial commitment needed to form a minor league basketball team or
league is undoubtedly considered a barrier to market entry. Typical barriers for market
entry and exit include capital, government regulation, intellectual property, permitting,
established brand identity, investment in specialist equipment, and high fixed costs.
Based on the number of leagues and teams operating within minor league basketball,
capital investment is a weak barrier for market entry or exit (Janas, 2011).
Having two new leagues start operation in 2011-2012 further demonstrates that
there is frequent entrance into the market place of minor league basketball. The
Universal Basketball Association (UBA) and the Continental Basketball League (CBL)
were both finishing their second season in 2011-2012 (Krieger, 2012). The ease of
ownership could help to explain why the minor league basketball market place
experiences such a vast number of leagues competing. Low operating costs further help
to clarify the ease of ownership.
Low operating costs are largely due to the geographical distance of teams from
each other, salaries, and the venues that teams play in. Many of the leagues operate only
within a specific region of the United States to cut-down on travel expenses. The
Eastern Basketball Alliance (EBA) is an example of operating within a single region of
the US; the EBA operates only in Pennsylvania and surrounding states ("About the
EBA", n.d.). It is also common for leagues to not require player compensation. By
having no salary cap or requirements, the IBA is "allowing teams the opportunity to
compensate players an amount feasible to each team's overall operating budget….and
34
eliminates the instance of over promising player compensation" ("Player Compensation",
n.d., para 1). Also, most minor league basketball leagues play in high school
gymnasiums.
Another example of the ease of ownership is with the International Basketball
League (IBL). The IBL offers three different ownership models for teams: full season,
branding, and tour. A branding team plays only a partial schedule with the goal of
becoming a viable team within three years of operation. A tour team is an international
team that operates outside of North America and participates in no less than five games
per year ("Own a Team", 2013). By having three different levels of ownership it allows
potential owners to minimally financially invest in a team.
The IBL seems to take an attentive approach for ownership by offering different
levels of ownership, but it is unclear if it is truly a beneficial structuring tactic for the IBL
compared to other leagues. The American Basketball Association (ABA-2), which is not
affiliated with the original ABA that folded in 1976, seems to place emphasis on the
number of teams operating within the league. Unlike the IBL, the ABA-2 did not offer
the ability to ease into ownership, nor did any other minor leagues. The ABA-2
anticipated reaching over 100 teams by the beginning of the 2012 season and claimed the
reasoning for having so many teams "is because we have the best business model in
professional sports" (Newman, n.d., para. 1). Even with different ownership structures,
the IBL and ABA-2 both saw retention rates within their respected leagues hovering
between 60% and 65% as shown in Table 2.2. At the end of the 2011-2012 season 21 of
the original 82 teams that started the ABA-2 season did not return to the league for the

35
2012-2013 season. For the IBL, 6 of the 15 teams from the 2010-2011 season, did not
return for operation in 2011-2012.
It is important to note that if a team did not return to the league in which it
previously competed, it does not necessarily mean that the team no longer exists or that it
folded. Many of the teams switched leagues. For example, in 2011-2012 the PBL had
four teams join their league from the ABA (Krieger, 2012, p. 66). In 2011-2012, six of
the thirteen leagues, had team movement. The ACPBL, IBL, IBA, ABA, EBA, and CBL
all had teams either leave for another league or join from another league (Krieger, 2012).
The shifting of teams from one league to another, again, illustrates the inconsistent nature
of minor league basketball and exemplifies a commonality among leagues.
The changing of league identity, or complete league mergers, is another common
theme in minor league basketball. For example, the United Basketball League (UBL)
evolved from the Regional Basketball League (RBL) in 2005 and began operation in
2006. The Atlantic Coast Professional Basketball League (ACPBL) also adopted a
change in identity. The ACPBL changed its name to the American Professional
Basketball League (APBL) in 2011-2012. An example of leagues merging together is the
Premier Basketball League (PBL) merging with the Independent Basketball Association
(IBA). The two leagues combined based on the notion that it would bring strength, unity,
and more competition to minor league basketball. However, the merger did not last and
the two leagues split again in 2013 (Sharer, 2013).
Another shared trait within minor league basketball is the vision and the missions
of the leagues. The majority of the leagues emphasize community interaction, a unique
basketball experience, and the development of the players. For example, the mission of

36
the World Basketball Association is "to teach, develop, and expose basketball players to
NBA, D-League, and International Scouts while providing each community an exciting
brand of basketball and entertainment" ("The WBA Mission", n.d.). Similarly, the
Eastern Basketball Alliance "allows aspiring players the opportunity to showcase their
skills and talents in a highly competitive league, while providing affordable, quality
family entertainment ("About the EBA, n.d.).
The difference of the D-League. Many of the characteristics just mentioned are
characteristics that the D-League has been exposed to during its tenure. From the
inception of the league, the D-League was backed by the NBA, yet still shared many of
the hardships that other minor leagues face. The D-League went through an identity
change in 2005; many of the teams have ceased operation, the D-League had teams from
other leagues join the league, and the D-League originally operated within a single region
of the US. Based on the shared characteristics, it could be assumed that the D-League is,
in fact, not different from the other minor leagues in operation. However, that is not the
case; the D-League is different from the other minor leagues because of its mission,
franchise values, and affiliation with the NBA.
Compared to the IBA which anticipates an average operating cost of $50k-$80k,
the individual D-League franchises are reportedly valued at close to $4 million
(Thompsen, 2013). Though many of the other minor leagues have missions that
emphasize players moving up to the NBA, the D-League is the only league to have ever
been a true feeder system into the NBA. Also, the D-League has the financial backing
from the NBA (Jones, 2001, p. 18). All of these characteristics, though somewhat similar
to characteristics of the CBA, are significantly strengthened with the D-League.
37
Franchise values are significantly higher in the D-League than they were in the CBA.
Also, the CBA was never truly affiliated with the NBA.
It is without a doubt, that the D-League has more potential for long term success
than any minor basketball league that has ever operated. However, as shown by the
demise of the CBA, a minor league can have financial strength and strong attendance, yet
still decline. The possibility of firm failure introduces the theory that minor league
basketball is not exempt from the complexities of new firm survival. Novel
organizations, regardless of industry, are notoriously woeful at surviving the introductory
years of business (Freeman, Carroll, and Hannan, 1983, p. 692).
New Firm Survival
There is an interdependence that exists in professional sports that requires a team
to not only compete with other teams, but also co-operate with one another (Clairns,
Jennet, and Sloan, 1986, p. 4). An individual team is dependent upon other teams to
compete within a league. The idea of being reliant upon the competition for survival is
one of the uncharacteristic attributes that makes professional sports economically unique
(Clairns et al., 1986, p. 4). Consequently, if a franchise has to halt operation then the
damage is done to the entire league, not just the individual firm.
The fact that the product, if unused, is unsalvageable for future use makes sport
economics, again atypical. Considering sport consumption of the products occurs at the
same time as the last stage of production upholds the notion that sport is a very perishable
product (Clairns et al., 1986, p.11). Nevertheless, these uncommon characteristics do not
make sport solely unique or worthy of independent treatment in regards to economic

38
analysis (Clairns et al., 1986, p.4). Thus, minor league basketball is not exempt from the
hardships often faced by new firms.
Entrepreneurs and the process of doing business will vary by the line of business,
but one common factor all firms have is that the first one to three years are typically the
toughest (Gibb, 1990, p. 17). The struggle of the D-League and other minor league
basketball firms is evidence that minor league sport, despite the peculiarity of the sports
industry, is not economically distinctive. Survival in minor league basketball past its
initial three years is difficult and frequently nonexistent for teams and leagues equally.
If a business venture survives for three years it can, within reason, say they
officially passed through the valley of death (Gibb, 1990). If a firm is unable to adapt
and grow within the industry then it is likely the firm will be forced to exit the
marketplace in which it competes (Audretsch, 1991). Whereas the emphasis is put on the
first two-three years of business it is longevity that is often difficult to establish for any
new firm. According to the Small Business Administration (SBA) (2011), "49 percent of
establishments survive 5 years or more, 34 percent survive 10 years or more; and 26
percent survive 15 years or more" (SBA, 2011, p. 1). As of 2012, the longest stint a D-
League team has operated has been seven years, which reflects the turnover within the
league.
The rate in which businesses turnover and are replaced can reflect barriers for
existence within the market (Headd, Nucci & Boden, 2009 p. 1). Looking back at Table
2.2, the average rate of exit for a minor league basketball team within its league is nearly
42%. Exit rate percentiles are calculated by taking the number of firms exiting the
market in a given year as a percentage of the active firms in the market at the end of that

39
year (Lopez-Garcia and Puente, 2006, p.15). Using that same methodology, Table 2.3
shows the yearly exit rates for the D-League franchises.
Table 2.3
Exit rate percentiles by year for the D-League
Year Number of Teams Number Exiting Exit Rate Percentile
2001-2002 8 0 0%
2002-2003 8 0 0%
2003-2004 6 2 33%
2004-2005 6 1 17%
2005-2006 8 3 38%
2006-2007 12 3 25%
2007-2008 14 3 21%
2008-2009 16 0 0%
2009-2010 16 2 13%
2010-2011 16 2 13%
2011-2012 16 2 13%
Overall the D-League has experienced a total of sixteen firms either relocating
and moving or folding completely. This would give the League as a whole a survival rate
of exactly 50% for the time it has been in existence. Headd et al. (2009) reported that the
five year survival rate for firms started in the year 2000 was right at 50.7% (p. 1). The D-
League seems to be comparatively consistent with the rest of the new business survival
cycle within the United States. However, the exit rate for firms within the United States
from 1977 to 2004 remained 13% or below (Headd et al., 2009, p. 1). The D-League has
an average exit rate of 16% per year, making the League’s exit rate above the national
average yet lower than other minor league basketball leagues.
The high exit rate for the D-League is important because of the industry in which
the D-League operates. The sports industry is a multi-billion dollar industry (Kurtzman,
2011). According to Herstein and Berger (2013) "today's global sports industry is worth
40
between $480 and $620 billion" (p. 40). With the D-League showing promise to sustain
long-term and with the aspiration to grow up to 30 teams, it is imperative for the league
to understand possible factors that could attribute to the survival of a team. In doing so,
the D-League may be able to successfully sustain long-term within the profitable sports
industry.
Importance of the environment. There is still an uncertainty and lack of
sufficient data in regards to the determinants of success and failure in newly established
businesses (Fritsch, Brixy & Falck, p. 286, 2006). There are a variety of established
theories in regard to factors or contributors to new firm survival. There has long been
an interest by business scholars for predictors of new venture survival (Dahlqvist,
Davidson, and Wiklund, 2000 p. 1). One suggested predictor of new firm survival is pre-
startup planning. It has been suggested that more consideration should be given to pre-
startup planning and how it influences business survival (Castrogiovnni, 1996, p. 818).
Understanding the environment in which a firm operates is the first step a new
venture must recognize and comprehend. It is an initial step because many
environmental factors are considered contextual. Contextual meaning that once the firm
has committed to the condition, there is minimal opportunity to change the impact the
condition has on the firm (Stearns et al, 1995).
Platt (1989), Platt and Platt (1994) have all concluded that external factors
significantly influence business failure rates (As cited by Rogoff, Lee, and Suh, 2004).
New firm survival starts with the understanding of the environment in which the business
functions (Stearns, et al., 1995, p. 24). Shepherd (1999) stated a lack of understanding of
the environment can deter an organization from succeeding from the commencement of

41
business (p. 622). Shepherd (1999) and Stearns et al. (1995) both implied that one of the
initial decisions for a business should be the environment in which they choose to
operate. Even though entrepreneurial characteristics, technology, strategic tools,
planning, financial skills, and many other factors can attribute to firm failure, if a firm
does not initially comprehend the importance of the environment in which it operates the
firm is put at a significant disadvantage from its inception.
Only characteristics initially controllable will be considered for the purpose of
this research because the choice of the environment and structure of the firm are some of
the most fundamental decisions an organization will make. For example, if a D-League
team enters a market that is not a good fit for a minor league basketball team, the firm
will be at a high risk of failure based on the location and the other environmental factors
associated with the market. Even though the D-League has been in operation since 2001,
the league itself is still considerably new. Establishing legitimacy within the realm of
minor league basketball is also crucial. The notion of legitimacy is exceptionally critical
to new ventures seeking resources because legitimacy is not truly obtained unless
survival occurs (Zimmerman and Zeitz, 2002, p. 417).
Legitimacy. According to Stinchcombe (1965), a new firm does not have a
history of success nor does it have legitimacy in the eyes of the consumer (p. 152).
Stinchombe (1965), Macmillan (1983), Starr (1990) and Hunt and Aldrich (1996) all
consider legitimacy a critical factor for new ventures (As cited by Zimmermand and
Zeitz, 2002). In 1965, Stinchcombe stated: “As a general rule, a higher proportion of
new organizations fail than old” (Stinchcombe, 1965, p. 148). It has been found that
younger firms will face far more complexity than older firms due to the resources
42
available to them (Stinchcombe, 1965, p.152). Freeman, Carroll and Hannan (1983)
empirically confirmed Stinchcombe’s statements that there certainly is a liability of
newness for new organizations. New firm failure is linked to the inability of a firm to
obtain resources. The failure, Stinchcombe (1965) said, is due to a ‘liability of newness’,
low levels of legitimacy, and the dependence upon the cooperation of strangers who are
unfamiliar with the new organization. The concept of legitimacy is further supported by
the fact that, in order to survive, a firm must obtain resources from the environment
(Zimmerman & Zeitz, 2002, p. 416). A lack of legitimacy for a business can lead to the
failure of the business and the exit of the business from the marketplace. With such high
turnover and the lack of any truly strong firms within minor league basketball, it can be
assumed, historically, minor league basketball has lacked legitimacy.
The hesitation to expand the D-League stems from the lack of legitimacy within
the marketplace which is reinforced by other minor league struggles. Also, there is very
little time for a new firm to establish reliable exchange relationships because there is no
justifiable proof of success, which will limit the growth of an organization (Hannan &
Freeman, 1984). Because of the newness of the D-League, the initial teams in the league
would only have found out about their forthcoming profitability or ability to obtain
resources by market entry. When a new firm enters a market there will inevitably be an
uncertainty in understanding the potential profitability (Lopez-Garcia, 2006, p. 19). The
novelty of the D-League may explain some of the failure observed within the league.
Table 2.4 contains a list of each team that has ever operated within the D-League, their
current status, and number of years they have operated as of the end of season 2012.

43
Table 2.4
All D-League teams, years of operation, and status as of 2012
Team Years of Operation Status: Active, Defunct or Moved
Anaheim Arsenal 3 Moved – Became Springfield Armor
Arkansas RimRockers 3 Defunct
Asheville Altitude 4 Moved – Became Tulsa 66ers
Austin Toros 7 Active
Bakersfield Jam 6 Active
Canton Charge 2 Active
Colorado 14ers 3 Moved – Became Texas Legends
Columbus Riverdragons 4 Moved – Became Austin Toros
Dakota Wizards 6 Moved – Became Santa Cruz Warriors
Erie Bayhawks 4 Active
Fayetteville Patriots 5 Defunct
Florida Flame 6 Defunct
Fort Wayne Mad Ants 5 Active
Fort Worth Flyers 2 Defunct
Greenville Groove 2 Defunct
Huntsville Flight 4 Moved – Became Albuquerque Thunderbirds
Idaho Stampede 6 Active
Iowa Energy 5 Active
LA D-Fenders 5 Active
Maine Red Claws 3 Active
Mobile Revelers 2 Defunct
New Mexico Thunderbirds 6 Moved – Became Canton Charge
North Charleston Lowgators 3 Moved – Became Florida Flame
Rio Grande Valley Vipers 5 Active
Reno Bighorns 4 Active
Roanoke Dazzle 5 Defunct
Santa Cruz Warriors 1 Active
Sioux Falls Skyforce 6 Active
Springfield Armor 3 Active
Texas Legends 2 Active
Tulsa 66ers 7 Active
Utah Flash – Orem, UT 4 Defunct
To be considered a legitimate league it is a necessity for the individual teams
within the D-League to survive. For the D-League, the support of the NBA not only
adds a competitive advantage based on a strong financial backing and previous
accomplishment, but it also adds legitimacy to the D-League. Survival and legitimacy
are both fueled by the ability for a firm to obtain resources which forms the basis of value

44
creation within an organization. Value creation and the ability to obtain resources are
both directly affected by the environment of the firm. Thus, the effect of the environment
on D-League success is the theoretical basis used in this study.
Theoretical Framework
Each organization, despite industry, subsists in an unambiguous physical, cultural,
technological, and social environment in which the organization must adapt in order to
endure (Scott T., Mannion R., Davies H., and Marshall M., 2003, p. 23). Sheperd et al.
(2000) stated that a new venture will initially be more susceptible to the threats associated
with environmental uncertainty than a firm that is more established (p. 397). Considering
the D-League is relatively new in the market place, it is likely that the D-League is more
susceptible to environmental threats than another entertainment firm that is already
established – such as another professional sports team, a movie theatre, or a collegiate
basketball team within the market. All organizations, regardless of maturity, are
dependent upon exchanges with the environment and are typically dominated by the
environment in which they operate (Katz & Kahn, 1966).
When analysts initially began looking at organizations and organizational theory,
there was a tendency to underestimate the environment in which the organization
operates (Scott et al., 2003, p. 23). Organizational theory considers how firms function
and how they are affected by the environment in which they operate (Jones, 2010, p. 8).
The environment of an organization can be defined as: “The set of forces and conditions
that operate beyond the organization’s boundaries but affect its ability to acquire and use
resources to create value” (Jones, 2010, p. 2). The D-League, like any other organization,
uses environmental factors to create value within the organization. Outcomes and value
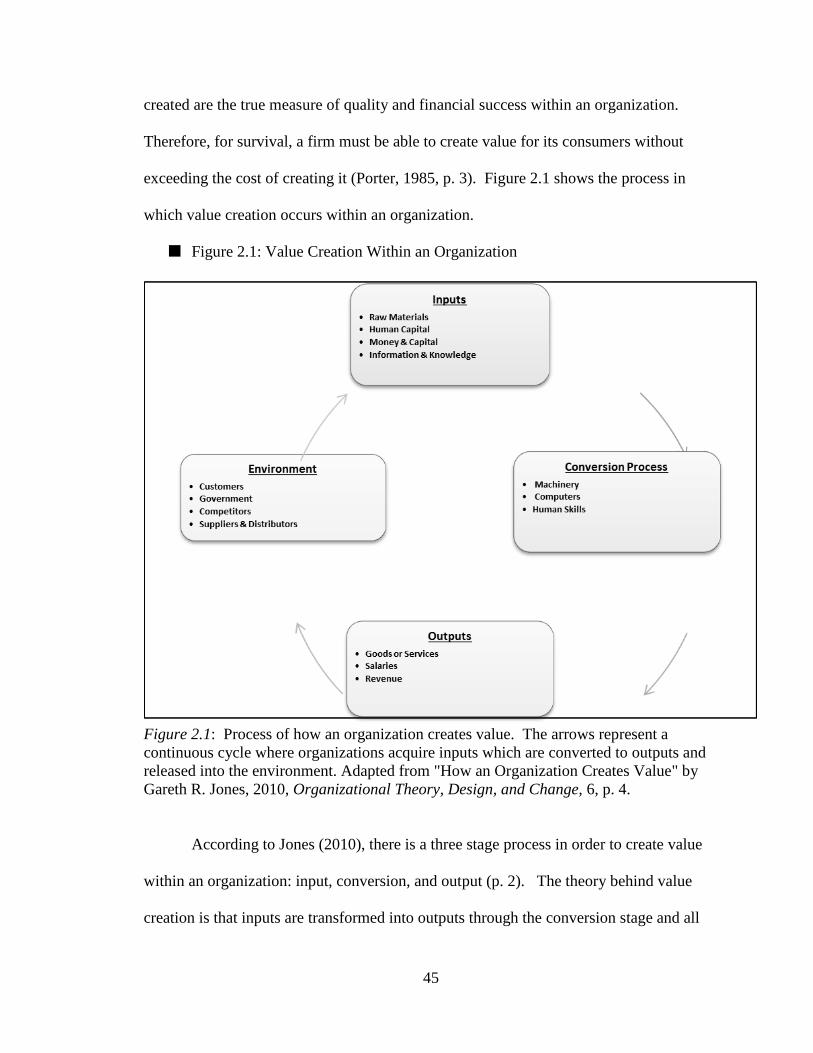
45
created are the true measure of quality and financial success within an organization.
Therefore, for survival, a firm must be able to create value for its consumers without
exceeding the cost of creating it (Porter, 1985, p. 3). Figure 2.1 shows the process in
which value creation occurs within an organization.
Figure 2.1: Value Creation Within an Organization
Figure 2.1: Process of how an organization creates value. The arrows represent a
continuous cycle where organizations acquire inputs which are converted to outputs and
released into the environment. Adapted from "How an Organization Creates Value" by
Gareth R. Jones, 2010, Organizational Theory, Design, and Change, 6, p. 4.
According to Jones (2010), there is a three stage process in order to create value
within an organization: input, conversion, and output (p. 2). The theory behind value
creation is that inputs are transformed into outputs through the conversion stage and all

46
three stages are affected by the environment in which they operate (Jones, 2010, p. 3).
One of the most influential ways the environment has an effect on the process of creating
value is in regard to resource availability and the capability of a firm to obtain those
resources. Aldrich (1979) stated that the way an environment affects an organization is
in the process of obtaining or withholding resources (p. 61). Jones (2010) concurred and
determined it is the design of an organization that determines how efficiently an
organization can acquire scarce resources (p. 11). An organization obtains value from its
inputs, and the inputs come from the environment that the firm operates in.
Inputs are resources and come in the form of raw materials, capital, human
resources, information or other means. The inputs of a D-League team come from inputs
such as staff, fans, sponsorship, and other resources. In essence the environment can
either restrict or compel the organization's growth based upon the environmental factors
present in which the organization operates (Child, 1972, p. 3). If a D-League team
cannot obtain resources then it is likely the D-League team will not create value, which
will hinder the goals of the franchise.
It is critical to understand the environment is where resources or inputs are
derived. It is generally accepted that organizations operate within two types of
environment: one environment is more general and other is more precise (Slack & Parent,
2006, p. 151; Jones, 2010, p. 60). Often the two environments are referred to as the
general environment and the specific (or task) environment. Slack and Parent (2006)
state anything outside of an organization can be studied as part of the environment that an
organization operates within (p. 151). Both types of environment, directly or indirectly,
have an impact on the operations of an organization and some general environmental
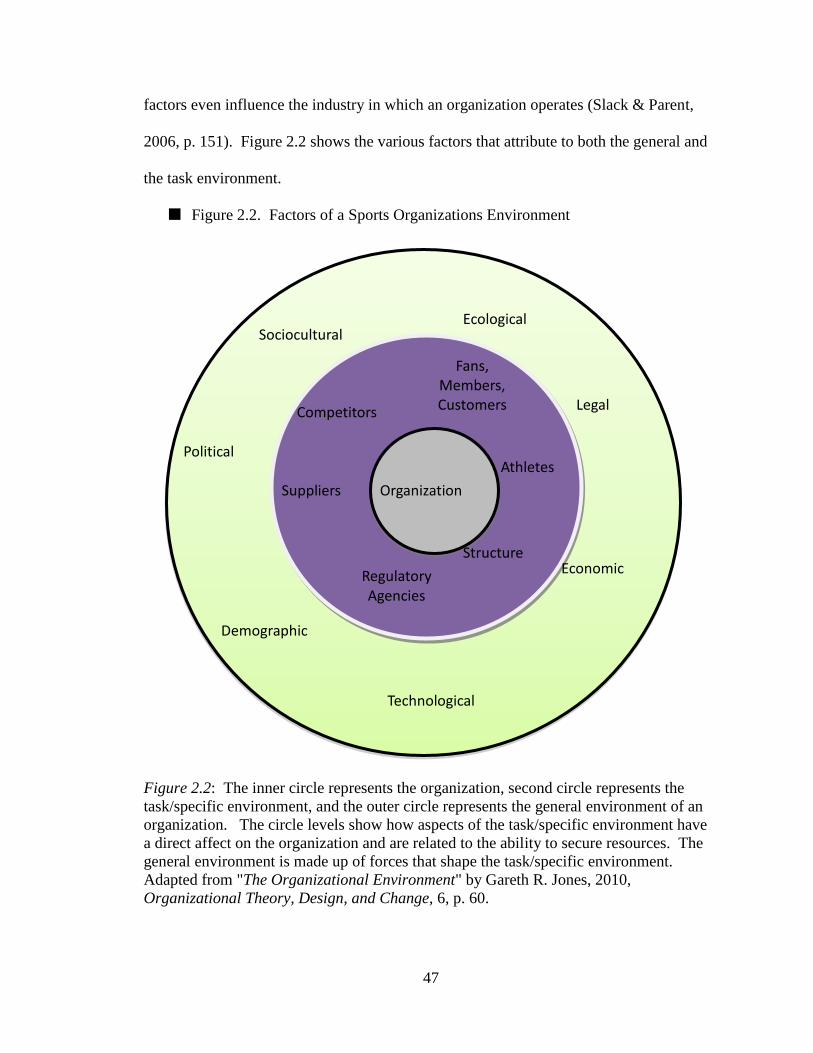
47
factors even influence the industry in which an organization operates (Slack & Parent,
2006, p. 151). Figure 2.2 shows the various factors that attribute to both the general and
the task environment.
Figure 2.2. Factors of a Sports Organizations Environment
Figure 2.2: The inner circle represents the organization, second circle represents the
task/specific environment, and the outer circle represents the general environment of an
organization. The circle levels show how aspects of the task/specific environment have
a direct affect on the organization and are related to the ability to secure resources. The
general environment is made up of forces that shape the task/specific environment.
Adapted from "The Organizational Environment" by Gareth R. Jones, 2010,
Organizational Theory, Design, and Change, 6, p. 60.
Organization
Sociocultural Ecological
Political
Technological
Demographic
Suppliers
Regulatory Agencies
Fans, Members, Customers Competitors
Athletes
Legal
Economic Structure
48
Factors That Attribute to Franchise Success
It is the goal of sports marketers to attract as many consumers as possible into
watching, attending, or purchasing their sport product – that is how value is created.
Knowing that ticket sales and game attendance is an outcome that reflects revenue and
value for professional sports teams, it is necessary for teams to identify the variables that
affect spectator attendance (Zhang, Pease, Hui, Michaud, 1995, p. 29). Game attendees
provide professional sports firms with a direct revenue stream that often equates to more
than one-third of the revenue for a team (Wakefield, 2006). Game attendees also
generate indirect revenue streams such as merchandise, parking, and concession sales
(McDonald, 2010, p. 676). Also, corporate sponsorships are more likely to renew based
on the notion that the more people that attend a game, the more views the sponsorship
gets, thus adding value to the sponsorship (McDonald, 2010, p. 676). Understanding the
best markets to accomplish the goal of obtaining and maintaining game attendees is vital
to a D-League team.
From a resource-based perspective it is understood that resources individually are
not enough to gain a competitive advantage; rather, a combination of resources must be
used (Flagestad & Hope, 2001, p. 446). Therefore, a professional sports team – minor or
major league – must give consideration to a variety of factors that can attribute to the
acquiring of various resources necessary to increase the outputs of the organization.
Again, the outputs that are important in professional sport are associated with
consumption because the sports industry is a consumer industry.

49
It is essential to note there are two types of factors that affect the attendance to
sporting events: those that are controllable and those that are not controllable (Al-Thibiti,
2004, p. 15). For example, when a D-League team initially forms and looks to enter a
market, the market they choose to enter is initially a controllable choice. The structure of
team ownership is also initially controllable. When selecting a location for a firm, the
franchise owners should take into considerations such environmental factors considered
to be uncontrollable prior to entering the market. If a sports organization does not
consider the environment, then it is possible that the environment will influence the
ability for organization to reach its goals (Parent & Slack, 2006, p 153).
The following section considers research conducted on various factors related to
franchise value, attendance, or success in professional sport. Factors considered will all
be factors that are initially controllable and related to the internal or external environment
of a team. Specifically, some of the factors will come from the general environment in
which the franchise operates and others will be derived from the task/specific
environment. The reason for the specific selection of the factors that were considered is
based on current literature and the state of the D-League. Characteristics of the facility,
demographics of the market, competition, ownership structure, and sponsorship resources
are all taken into consideration. Noteworthy is that the business structure of a D-League
team is, in this research, considered a resource because of the financial support some of
the hybrid or full-ownership models create. Table 2.5 shows a breakdown of research
that has studied initially controllable environmental factors for franchise valuation,
increased attendance, or viable markets for professional sports teams within the United
States. The reason franchise valuation, increased attendance, and the viability of

50
potential markets were all considered in the literature review is because they are all
intertwined with the prediction of success or survival of professional sports teams.
Table 2.5
Summary of Literature for Initially Controllable Environmental Factors Affecting
Success
Study and
Authors
Brief
Description
Leagues
Studied
Relevant
Findings
Alexander, D. L., & Kern, W.
(2004). The economic
determinants of professional
sports franchise value. Journal of
Sports Economics, 5(51), 51-66.
doi: 10.1177/1527002503251715
Used regression analysis
to determine if per-capita
income, population, teams
standing, regional
identity, new team,
facility newness, and new
franchise location, had an
effect on franchise value
as reported from
Financial World.
MLB
NBA
NFL
NHL
- Population had a positive
effect in MLB, NBA, and
NHL
- Newer facilities lead to higher
franchise values in all leagues
except NFL
- Regional Identity in MLB lead
to higher franchise value
- Per capita income lead to
higher franchise value
Bruggink, T. H., & Zamparelli, J.
M. (1999). Emerging markets in
baseball: An econometric model
for predicting the expansion
teams. In E. Gustafson & L.
Hadley (Eds.), Sports Economics:
Current Research (pp. 49-59).
Westport: Praeger Publishers.
Used population, growth
rate of population, per-
capita income, other
major leagues, corporate
market base, TV Share,
and distance to MLB
franchise to determine
viable markets for MLB
expansion teams.
MLB - Population was a major
indicator of market viability.
- Other pro sport competition
and distance to major league
team all affect the viability of
housing an MLB team.
Branvold, S. E., Pan, D. W., &
Gabert, T. E. (n.d.). Effects of
winning percentage and market
size on attendance in minor league
basketball. Sport Marketing
Quarterly, 6(4), 35-42.
Assessed winning
percentage and market
size through multiple
regression on attendance
in Minor League
Basketball (MiLB)
MiLB - Market size has a prominent
relationship with attendance
Davis, M. C. (2006). Called up to
the big leagues: An examination
Used model to determine
if population, income,
MiLB - Population, per capita personal
income have a positive and

51
of the factors affection the
location of minor league baseball
teams. International Journal of
Sport Finance, 1(4), 253-264.
presence of competition,
proximity to MLB team,
and CSA are determinants
of predicting if a city has
a MiLB team.
significant effect across all
levels of MiLB
- Driving time to the nearest
MLB team has a positive
effect on presence of MiLB
team.
Howard, D. R., & Crompton, J. L.
(2003). An empirical review of
the stadium novelty effect. Sport
Marketing Quarterly, 12(2), 111-
116.
Empirically considered
the impact of new
facilities on attendance
figures over time in the
four major leagues in the
US.
MLB
NFL
NBA
NHL
- Most teams will not
experience increased
attendance beyond the first
year when a new stadium is
built
Humphreys, B. R., & Lee, Y. S.
(2010). Franchise values in north
american professional sports
leagues: Evidence from the repeat
sales method.International
Journal of Sport Finance, 5(4),
280-295.
Uses regression analysis
to determine if facility
age, winning percentage,
championships won, and
population effect
franchise value over times
based on repeat sales
model.
MLB
NFL
NBA
NHL
- Market income, population,
and facility characteristics,
were all associate with
franchise quality in North
American Leagues.
Humphreys, B. R., & Mondello,
M. (2008). Determinants of
franchise values in north american
professional sports leagues:
Evidence from a hedonic price
model. International Journal of
Sport Finance, 3(2), 98-105.
Uses hedonic price
framework to determine if
population, stadium
ownership, franchise age,
competition in market,
winning percentage, and
franchise age effect the
franchise value of a team.
MLB
NFL
NBA
NHL
- The larger the MSA the more
valuable the franchise for all
leagues
- If a team owns their own
facility the franchise value
increases
- Facility age does not affect
value.
- The higher number of
competing leagues in market
the higher the franchise value
Miller, P. (2007). Private
financing and sports franchise
values: The case of major league
baseball.Journal of Sports
Economics, 8(5), 449-467. doi:
10.1177/1527002506292583
Examination of the
impact of new stadiums
and stadium ownership on
franchise values reported
by Financial World and
Forbes. Includes
population (SMSA),
winning percentage, team
tenure, stadium age, and
stadium ownership.
MLB - Per capita income do not
affect franchise value
- SMSA positively and
significantly affect franchise
value
- New stadiums increase
franchise value.
- Privately owned and privately
financed stadiums increase
franchise value

52
Miller, P. A. (2009). Facility age
and ownership in major american
team sports leagues: The effect on
team franchise
values. International Journal of
Sport Finance, 4(3), 176-191.
Uses regression analysis
to determine if facility
age, facility ownership,
years in city, winning
percentage, population,
and per-capita income
attribute to franchise
value based on Financial
World and Forbes
reported value.
NHL
NBA
NFL
- Teams in higher per-capita
income cities have higher
franchise values
- Positive and significant
relationship between a teams
tenure and franchise value
- Facility age and ownership
does not have an effect on
NBA franchise value
- NHL teams that own their
facility have higher franchise
values
- Negative and significant
relationship between facility
age and franchise value
Rascher, Daniel A., "NBA
Expansion and Relocation: A
Viability Study of Various Cities"
(2004).Kinesiology (Formerly
Exercise and Sport
Science). Paper 20.
http://repository.usfca.edu/ess/20
Used population, income,
competition, basketball
fanaticism, prices,
winning percentage, arena
quality, and corporate
depth to examine
prospective NBA
expansion or future cities.
- Household income and age of
the arena both had a positive
effect on attendance.
Rascher, D. A., Baehr, M. J.,
Wolfe, J., & Frohwerk, S. (2006).
An analysis of expansion and
relocation sites for major league
soccer.International Journal of
Sport Management,7(1), 1-12.
Used population, MSA,
population growth, male
residents, youth soccer, ,
recreation index ranking, ,
cost of living, income
level, other professional
corporate base in market,
other soccer teams, other
leagues, and Hispanic
population to examine
prospective MLS markets.
MLS - Population, higher level of 18-
34 year old males, higher
disposable income, larger
Hispanic or Latino population,
and lower cost of living
increased probability of MLS
team in market
Roy, D. P. (2008). Impact of new
minor league baseball stadiums on
game attendance. Sport Marketing
Quarterly, 17(3), 146-153.
Examined the impact of
new minor league
stadiums on annual
attendance for Minor
League Baseball
MiLB - Market for minor league
baseball expands when a new
stadium opens, novelty effect
present
53
Facility age. It has been common to hear professional sports teams declare they
need a new facility to play in so they can remain financially competitive (Miller, 2009, p.
176). There has been an array of previous research conducted in regards to new facilities
and attendance. Miller (2009) defined the age of the facility as the difference between
the season the facility first opened and the time period of the observation (p. 181).
New facilities tend to generate fan interest initially, but that interest tends to die
out. The notion of a new stadium gaining attention initially is known as "stadium novelty
affect" (Howard & Crompton, 2003, p. 111). Even though new stadiums may have a
positive impact at first, the novelty wears off and does not endure long-term. Howard
and Crompton (2003) determined that data collected indicated an increase in attendance
though it did tend to wear off after the first year (p. 115).
Miller (2009) performed a regression analysis that took into consideration the age
of the facility, team winning percentage, stadium ownership status, per capita income,
and population of metropolitan area of the team as a means to predict or estimate of
franchise value. The data Miller gathered was from the National Basketball Association
(NBA), National Football League (NFL) and the National Hockey League (NHL)
(Miller, 2009, p. 182). For the facility age, the NBA franchise values were not affected,
however the NFL and NHL franchise values were both negative and significant in both
regressions (Miller, 2009, p. 186). This means that as the age of the facility increased,
the value of the franchise decreased.
Alexander and Kern (2004) found a similar relationship between the age of the
facility and the franchise value of a team in the NHL and NBA by using an ordinary least
54
squares regression analysis. Alexander and Kern (2004) found that if a team plays in a
newer facility they will have a higher franchise value (p. 59). The "novelty effect" is also
known as the “honeymoon effect”, which was explored by Alexander and Kern (2004).
Having an increase in attendance from a new stadium being built also indicated the value
of the franchise increasing (Alexander and Kern, 2004, p. 62). Alexander and Kern
(2004) said the increase in franchise value can be attributed to the opportunity for more
revenue via naming rights and possibly additional seats or corporate seating (p. 59). The
potential to generate revenue is largely the reasoning used to justify the need for a new
stadium– not the inadequate seating capacity, sightlines, or other structural integrities. A
new stadium can generate more revenue through more advertising, added luxury seats, or
high-class catering facilities (Siegfried & Zimbalist, 2000, p. 98).
Roy (2008) considered attendance figures in minor league baseball as it attributed
to new stadiums. Roy's research is an important study to consider because he researched
other minor league sports. Roy included data from 1993-2004 and looked at 48 minor
league baseball teams. Roy’s results showed an increase in attendance for all teams that
moved into new stadiums within their market for years 2-5 (Roy, 2008, p. 151). The
increase in attendance for years 2-5 was termed ‘novelty effect’ which is synonymous to
‘honeymoon effect’ which was termed by Alexander and Kern (2004). To the contrary,
Humphreys and Mondello (2008) showed that when using a Hedonic Pricing Model to
value teams, stadium age did not have an effect on the team value (Humphreys &
Mondello, 2008, p. 16).
Facility location. According to Smallbone and North (2000), there is a strong
correlation between a firm’s location and its growth. The locality of a firm explained a

55
great deal in regards to the survival or non-survival of young firm (Smallbone & North,
2000). It is generally supported that having a facility in a downtown location can help to
invigorate the suburbanization trend that has been occurring in U.S. cities since the
1950s. A facility downtown can revitalize the atmosphere in a downtown area that is
struggling, thus adding to economic development for the city (Siegfried & Zimbalist,
2000 p. 109).
A D-League team entering into a market has the choice of selecting the
environment in which it operate and the facility in which they operate. As stated by
Zimmerman and Zeitz (2002), it is with the best interest of the new venture that the
selection of the environment and actual geographic location is the one most advantageous
to the new venture (p. 423). Chawla, Pullig and Alexander (1997) found neither industry
nor owner experience played a vital role in success of a firm; rather they determined that
location of the firm and market knowledge played a critical role in the success of firms
(Chawla et al., 1997, p. 47). The actual physical location is believed to have a direct
impact on survival because of the opportunities and abundance of resources available
within the location (Stearns et al., 1995, p. 25).
Littunen (2000), through logistic regression, found it was not necessarily the
location of the firm within a city but actual regional differences that contribute to the
success of new firms. Though regional differences will not be considered, Littunen's
conclusion may help to explain why the D-League struggled in its initial venture in the
Southeast Region of the United States. Littunen’s research did note the firm’s local
environment would affect survival during the operational phase of a new business
(Litunen, 2000, p. 68). Stearns, Carter, Reynolds and Williams (1995) concurred that the

56
location of a new firm can indeed have important implications on the performance and
survival of a new business venture (p. 23). Most importantly, it was found the
accessibility to a facility for fans have a positive effect on attendance for professional
sports events (Hansen & Gauthier, 1989, p. 18).
Facility ownership. The next factor that has been looked at previously by
scholars concerns the ownership of the facility in which a team plays. It is believed that
if a team owns its own facility then the profits of the firm are maximized (Miller, 2009, p.
6). Profit maximization is based on the theory that if a team owns its own facility then
they have more control over other revenue streams coming in. Concessions, parking,
tickets, and other events would all be profit for the individual team as opposed to having
to pay part of the revenue to an outside ownership source. A team owning its own
facility would realize higher franchise value because it can capitalize on the facility
(Miller, 2008, p. 19). Also, to revisit the issue of the D-League not having substantial
media coverage, facility ownership may be a significant predictor in this study.
Humphreys and Mondello (2008) also found that teams who own their own
facilities see an increase in franchise value as opposed to teams that do not own their own
facility (p. 4). Their findings coincided with Miller’s findings from 2009, which support
that same theory (Miller, 2009, p. 186). Miller (2009) found that if a National Hockey
League (NHL) team or National Football League (NFL) team owned their own facility
then the franchise value of the team did indeed increase. In fact, if an NHL team owned
the facility in which it played, Miller found that the franchise value would increase 20.5%
higher. However, findings were not statistically significant in regards to the NBA (Miller,
2009, p. 187 & 189).

57
Facility Size. Attendance is, no doubt, a major source of revenue for all sports
teams. However, more seating in an arena does not necessarily mean more attendance.
In a 2007 report done by the city of Baltimore looked at building a new arena, one of the
leagues included in the report was the D-League. The report indicated that the D-league,
when targeting a new market to enter, looks for arenas with a capacity of less than 10,000
(KPMG LLP, 2007, p. 44). However, in 2011, a report from Richmond, Virginia,
concluded that the D-League looks for arenas that seat 6,000 people or less with the
ability to tarp off sections (Barrett Sports Group, 2011). The change of recommended
seating capacity for a D-League team over time may indicate the D-Leagues gaining a
better understanding in arena size that is more favorable for franchise success. Having
operated over 30 teams in over 30 different markets, it seems logical to consider facility
size as a potential predictor of franchise success in the NBA's D-League.
Market population. It may be a truism that it is ultimately the fan who
determines the fate of a team or a league (Mason, 1999, p. 409). The idea the consumer
(fan) could be the determining factor in the survival of a firm gives valid reason to
consider the demographics of a market. Nearly all researchers that have considered
franchise valuation or predicting franchise success within professional sport have
considered the population within a city.
Populations of the market, as well as data on personal income in the market, are
considered when the placement of a minor league baseball team or prediction for success
is being determined (Davis, 2006, p. 4). Branvold, Pan, and Gabbert (1997) found
market size was a prominent indicator of increased attendance in Minor League Baseball

58
(MiLB) (p. 13). Davis (2006) also found the higher the population in the metropolitan
statistical area the more likely it was that a city would have an MiLB franchise.
Market size is also linked to franchise value. The sales price of professional
teams was positively and significantly related to the size of the metropolitan area in
which the team resides (Humphreys and Mondello, 2008, p. 9). Humphreys and Lee
(2010) also found the population of the market was associated with the franchise quality
in North American sports Leagues. In both of these studies the higher the population of
the area the more valuable the professional sports franchise was. Miller (2007) also
found the population of the area positively and significantly affected the franchise value
of MLB franchises.
Rasche, Baehr, Wolfe, and Frohwer (2006) found the higher a population, the
greater probability that a Major League Soccer team would be in the market. Also, based
on their study they were able to determine possible markets for expansion based on
similar characteristics to current MLS cities. Bruggink and Zamparelli (1999) concurred
in regards to a similar analysis that showed the market population helps to determine the
viability for success in a market. Stearns et al. (1995) findings contained similar results
in that the more urban a setting a firm is located in the more likely the firm is to survive
(p. 34). Conclusively, all studies that used some form of population as an indicator found
that a higher population relates to higher franchise value, higher attendance, or is more
likely to house a professional team.
Per-Capita income of the market. The D-League’s website describes the
League’s role not only as the NBA’s official minor league but also describes the League
as doing the following:
59
In fostering the league’s connection to the community, its teams, players
and staff promote health and wellness, support local needs and interests, and assist
in educational development through NBA D-League Cares programs. The NBA
D-League also advances the game of basketball as the research and development
arm of the NBA ("NBA D-League 101", 2013).
Considering the emphasis that the D-League puts on community it is reasonable
for a team to consider the demographics of a market. The target consumers for sports
can largely influence the organization (Slack & Parent, 2006, p. 152).
Over 60% of NBA season ticket holders had an annual income of over $75,000
(Ellis, Braunstein, Zhang, 2003, p. 86). Considering the NBA owns the D-League and
uses similar marketing techniques in both leagues, it seems logical to hypothesize that the
NBA fan would share similar socio-demographic background characteristics to that of a
D-League fan. Also, the median household income for Minor League Baseball (MiLB)
attendees is at $73,000 (Scarborough, 2012). Because the NBA and MiLB have similar
fan income levels, it made sense to consider market income.
Per capita income has also shown to have a positive effect on attendance or
franchise value, as supported by Davis (2006) and Humphreys & Lee (2010). Davis
(2006) used a generalized ordered logit model to conduct probabilities for viability for
minor league baseball teams based on market characteristics. Davis (2006) gave a table
with the top 10 cities with lowest probabilities to have a minor league baseball, team at
the particular level that do have a team at that level; seven of the cities listed either
currently or previously housed a D-League team (p. 17). If a city is listed as being a
'weak' market for minor league baseball it is likely that the selection of these markets for

60
minor league basketball would also be considered a weak or poor choice based on the
resources available. Perhaps market selection is a reason that the D-League has struggled
so much; strengthening the theory that certain factors must be considered prior to market
entry.
Rascher et al (2006) also found the higher disposable income within a market
indicated a higher probability of housing an MLS team. Similarly, Rascher (2004) found
the household income had a positive effect on attendance in the NBA. Miller (2007) had
opposite findings which determined that the per capita income does not affect the
franchise value for MLB teams. However, Miller (2009) found for NHL, NBA, and NFL
teams the higher per-capita income in the market the higher the franchise value of a team.
Market education level. Another demographic variable that has had an effect on
the attendance of sports fans is the education level. Market education was taken into
consideration based on the same premise as per-capita income: research shows that sports
fans or ticket holders have some sort of college education. Similarly to income as a
predictor, NBA fans largely share similar academic achievements. Over 62% of fans
have a few years of college education or have completed a college degree (Scarborough,
2012). Also, Zhang et al (1995) suggested when a team does not perform well it is likely
that a team will have an easier time maintaining the support of a more educated fan base,
than if a team had a less educated fan base (p. 37). It is more likely for a fan to be more
educated than the general population (Shank, 2005). Thus, the education level within a
market was considered as a predictor as well.
Market Competition. “When it comes to minor leagues no one really identifies
with the team, and on a cold winter night, it finds itself competing with a college or an

61
NBA team on television”(Rovell, 2001). This quote was from Dan Panaggio, a former
head coach in the now defunct Continental Basketball Association. Panaggio was
referencing the belief minor league basketball will always be in competition with the
NBA or major college teams.
For general business firm survival, Fritsch (2006) found the number of start-ups
in an industry and region did have a negative impact on new firm survival (p. 189). This
means that the more competition within the area, the lower the chance of survival.
Conversely, Davis (2006) found the existence or absence of other sports options within a
market did not have an impact on franchise value for professional sports teams (p. 5).
Humphrey & Mondello (2008) determined the number of competing professional sports
teams in the metropolitan area also affect the franchise value. They found more
professional teams in the area meant lower franchise values, thus competition reduced the
franchise value price.
According to Shepherd (1999) the nature of the market, competition within the
market, and decisions made by a firm have an impact on the survival likelihood for a new
venture (p. 621). High rates of new firm failure typically indicate a strong and powerful
level of competition within the market place (MacDonald, 1986, Sterlacchini, 1994;
Audretsch, 1995). For that reason, competition within a market place will be considered
as an indicator of new firm survival.
Romanelli (1989) agreed that if there is an untapped demand for a product or
service as well as absence of competition, then a business is more likely to survive (p.
371). Furthermore, the higher likelihood for failure, as it is linked to competition, is due
to a high density of firms competing for the same market, thus saturating the market.
62
Romanelli (1989) stated that excess competition within an industry will hinder the
survival of a new firm (p. 370). Fritch, Brixy, and Falck (2006) agreed that if
competition within a market is high, it will negatively impact a firm’s chance for survival
(p. 289).
As stated by Lopez-Garcia (2006), the degree of competition within the given
industry is an important characteristic in regards to firm survival. If a firm is to introduce
its product to a market that is saturated with a similar product, they are doing so with a
greater risk which heightens the probability of exit from the industry (Lopez-Garcia,
2006, p. 29). The knowledge of the market in which a firm enters is crucial; firms should
not enter into markets that are saturated (Bates, 1995).
If a D-League team is operating within a market with other strongly supported
sports teams, it could be concluded that the other teams within the market would be direct
competition to the D-League team. Based on that same notion, if there is an abundance
of direct competition already operating within a market and a D-League looks to enter
that market, it may be likely that it will lead to market saturation and the D-League team
will struggle. For the D-League there is substantial competition within minor league
basketball, as shown by the other twelve leagues in operation in the 2011-2012 season.
This concept of high competition helps to explain the struggle the D-League went
through in its early years of formation and is continuing to go through. Additionally,
other sports and entertainment outlets – such as movie theatres – are also competition for
the D-League as they are all vying for resources and consumers within the entertainment
marketplace.

63
Professional sports teams aren’t the only direct competition previously
considered. In Davis’ study, he included Bowl Championship Series (BCS) schools as a
dummy variable; though he found there was no effect on the likelihood of having a minor
league baseball team in the area (Davis, 2006, p. 6). One could argue the reason for not
having an effect is due to the very little overlap in seasons. Major college basketball
programs may be worth considering as direct competition for the D-League because the
D-League and NCAA Division I Men's Basketball would share not only the same sport
but same season as well. An example of a market that would potentially struggle due to
the presence of collegiate teams is Kansas City, Kansas. Kansas City has had many
major basketball leagues attempt to base their operations in Kansas City. However, with
the University of Kansas, University of Missouri, and the University of Missouri-Kansas
City all operating within a close market, it would be very difficult for a professional
basketball team to develop any kind of large fan base necessary for financial success
(Fearing, 2002, p. 10).
In their research, Davis (2006) and Humphreys and Mondello (2008) took into
consideration the number of other professional teams for the greater metropolitan area in
which a team operates, though they did not consider major NCAA Division I college
basketball programs. Bruggink and Zamparelli (1999) found that having other
professional sports teams within a market affected the viability of housing an MLB
franchise because the leagues would be competing for resources. As Neale (1964)
pointed out, sports leagues would ideally compete with each other if there were several
leagues (p. 6). However, in the United States there has historically only been one major
league operating for the four major league sports (MLB, NBA, NFL, NHL) which limits

64
interleague sporting competition (Neale, 1964, p. 6). The commercialization of college
sports has left an indistinguishable breach between college and real professional sports
(Sack & Thiel, 1985, p. 196).
Considering the popularity of NCAA Division I men's college basketball and the
fact they share the same season as the D-League, it would be worthwhile to consider
them a strong competitor for consumers and sponsorship dollars. Accordingly, it would
seem reasonable to consider Men’s Division I college basketball teams as direct
competition for the D-League. Thus, Men's NCAA Division I basketball teams, for this
study, will be considered direct competition for the D-League.
Business Structure. One of the strategic decisions a business must make is the
design of the organizational structure of the business (Flagestad et al, 2001, p. 446).
Teece, D.J., Rumelt, R., Dosi, G. & Winter (1994); Portner (1981); and Porter & Millar,
all stated that the organizational design and structure is a significant component that
relates to the success of an organization. The organizational structure of each D-League
team varies and is one of three structures: hybrid, full-scale ownership by an NBA team,
and private ownership. There is emphasis on the full-scale ownership model because it
allows for the NBA teams to control the basketball operations (Lombardo, 2011).
As of 2012, eleven of the sixteen teams have a single-affiliation relationship with
a parent NBA team; however, there is a movement for D-League teams to move into full-
scale ownership with an NBA parent club. Scheitrum (2012) stated that the D-League
transformed from being the tag-along league of the NBA to the NBA’s best friend.
Scheitrum was referring to how the League has developed and changed due to the
relationship with NBA clubs.

65
The movement for Development League teams to convert their ownership models
into hybrid or full-out ownership began to take full-effect in 2009 (Lombardo, 2011).
The trend of having NBA teams buy into D-League teams helps to build on the past while
promising a strong future (Reed, 2011). According to Davis (2006), minor league
baseball exhibits a higher level of stability for those teams that are affiliated as opposed
to the ones that are independent (Davis, 2006, p. 6). The D-League is similar because
with heightened affiliation the D-League moved into a more conventional minor league
model. However, not all teams have adopted the full-scale ownership or hybrid
ownership model. With the D-League having a number of different ownership models
and the growing trend of single team affiliates, it is important to consider the ownership
structure as a potential predictor of franchise success.
Large Businesses in the Market. Large businesses in the market allow for
professional sports teams to have the opportunity for sponsorship, premium seating, and
luxury suites. Research shows that over 80% of teams and venues have over 90% of
their luxury suites purchased by corporations, which is based on the notion that luxury
suites and premium seats are typically higher in cost than regular seats (Titlebaum,
Lawrence, Moberg, & Ramos, 2013, p. 49). Luxury seating inventories have
significantly increased in professional sports franchises between 1990 and 2000
(Titlebaum et al., 2013, p. 48). Also, corporate sponsorship has long been recognized as
a vital element to the marketing strategies for sports organizations (Cornwell, 2008;
Cunningham, Cornwell, & Coote, 2009; Fahey, Farrelly, & Quester, 2004).
Rascher et al (2006) used the number of Fortune 500 companies within an area to
determine the likelihood of housing an MLS team. It was found that the more Fortune

66
500 companies there were in the area, the smaller the likelihood that a city would house
an MLS team.
Luxury seating and premium seating are important to franchises because of the
opportunity of added revenue streams associated with them. It can be assumed that if a D-
League team has luxury suites or premiums seats to sell then they will typically be
purchased by corporations. Lawrence et al. (2009) found that a significant portion of
luxury suite customers were corporations that grossed over $50 million in annual sales. It
is imperative to understand the number of corporations that operate within a market as a
basis for having a potential resource for luxury seating and sponsorship.
67
CHAPTER III METHODOLOGY
The purpose of this chapter is to discuss the methodology used for this study. The
chapter is divided into the following subsections: Research Design, Data Source and
Study Rationale, Data Analysis, and Limitations. The researcher has taken responsible
conduct of research courses for research involving human subjects through Collaborative
Institutional Training Initiative (CITI). However, this study did not involve human
subjects and all data derived from respected secondary data sources.
This study was submitted through the University of New Mexico's (UNM)
Institutional Review Board (IRB). Because the research was considered to have minimal
risk, the study was reviewed through the expedited process. Moreover, the data that was
used consisted of existing data and is publicly available which allowed for exemption of
having to go through the entire Human Research Review Committee (HRRC). The IRB
approved the ability to conduct the research study in February of 2014.
Research Design
The purpose of this study was to identify the relationship between environmental
characteristics of all NBA Development League markets from 2001-2012 and the success
of a D-League team based on the average attendance capacity for the 2012 season or the
last season of operation if a team was defunct in 2012. Thus, a correlational research
design was used. Correlational studies are defined to be quantitative, multi-subject design
in which participants have not been assigned to treatment conditions (Thompson,
Diamond, McWilliam, Snyder, & Snyder, 2005, p. 182). Even though definitive causal
claims cannot be reached through correlational research, it can be used as a means of
prediction. Correlational methodology is ideal in this study because the possibility to

68
predict franchise success or survival within the D-League is the basis of the practical
application for this study.
Multiple regression and correlation can be used to forecast an outcome based on
previously collected data (Cohen et al, 2003, p. 3). The main goal of this study was to
see if there are relationships present with the predictors and franchise success, as denoted
by attendance, within the NBA Development League. Furthermore, it was the goal of the
study to make suggestions on future markets to expand the D-League into based on the
analysis. Multiple regression analysis was suitable because this research uses a
combination of variables to increase the accuracy of prediction of a given outcome. The
predictors, their abbreviations, and the level of at which they were analyzed are listed in
Table 3.1.
Table 3.1
Predictors
Predictor Abbreviation Level
Pro and College Teams in Area COMP Continuous
Ownership Structure of D-League Team MOD Categorical
Large Businesses in the Market BUS Continuous
Population POP Continuous
Education Level in the Market EDU Continuous
Median Household Income INC Continuous
Age of the facility AGE Continuous
Location of the facility LOC Continuous
Facility Size SIZE Continuous
Data Source and Study Rational
Correlational research provides a natural view of what is being researched
because the researcher is not influencing what happens; instead, the researcher is
measuring variables that should not be biased by the researcher (Fields, 2010, p. 12).

69
Secondary sources were the best available sources for this study because most of the data
would have been impossible to collect if it weren't for secondary data sources. Also, the
breadth of the data available for analyzing was an advantage to using secondary sources
because of the magnitude in which some of the data was collected. For example,
demographic information from the US Census Bureau was collected on a large, national
scale; which would not have been possible for the researcher to do. By using secondary
data sources it improved the ecological validity of the study because the data sources
were not influenced by the researcher. Ecological validity allows for the research to be
applied to real-world circumstances (Fields, 2010, p. 785).
There are disadvantages to using secondary data sources. The main disadvantage
of using secondary data sources in this study was that the researcher could not control the
selection, quality, or method of collection. Without having control of these factors it was
impossible to validate all sources (Sorensen et al., 1996). However, it is still important
that the methodology used can be interpreted consistently across different situations
(Field, 2010). The notion of consistency of a measure and the ability for a measure to be
replicated is known as reliability. For this study, reliability refers to the ability for this
research to relate to different professional sports leagues. By using factors affecting
franchise success in the NHL, NFL, NBA, MLB, MLS, and MiLB it helped to improve
the reliability of the study.
Johnson and Turner (2003) point out that one of the main types of data collection
is to use secondary data, which is also known as 'existing' or 'available' data (p. 319).
Though secondary data is not collected by the researcher first hand there is much strength
to using archived research data. Using existing data is very useful when exploring or

70
confirming a theory. Also, archived research data, such as that from the Census Bureau,
is often to be considered to be very reliable and have a high measurement of validity
(Johson and Turner, 2003, p. 317). Sorensen, Sabroe, and Olsen (1996) agree that
secondary data also reduces the likelihood of bias due to recall non-response.
For US Census measures, it is understood that all survey and census estimates
include some degree of error because often they are based on a sample of the population
rather than the full population (US Department of Commerce, 2010, p. A-11). One way
that the U.S. Census Bureau measures the reliability of their surveys is through
calculating standard errors to provide an indication of the extent of the variation due to
sampling. The US Census Bureau, for all of its surveying, acknowledges that all data is
subject to sampling and nonsampling error (US Census Bureau, 2013). The Census
Bureau states that "precautionary steps were taken in all phases of the collection,
processing, and tabulation of the data in an effort to minimize the effects of nonsampling
and sampling errors" (US Census Bureau, 2013).
According to Sorensen et al. (1996) when using secondary data sources there are
typically two types of problems that can occur:
1) Errors in the data set may reflect incorrect data entry or lack of entry of
available information, and 2) the original source of information may be correctly
entered into the data source but may not reflect the true condition or characteristic
of the subject (p. 439).
Despite the inevitable inability to identify all possible cases in the universe, the
US Census Bureau data is still the best available data for US demographic and economic
information. The US Census Bureau is considered to be the leading source of quality
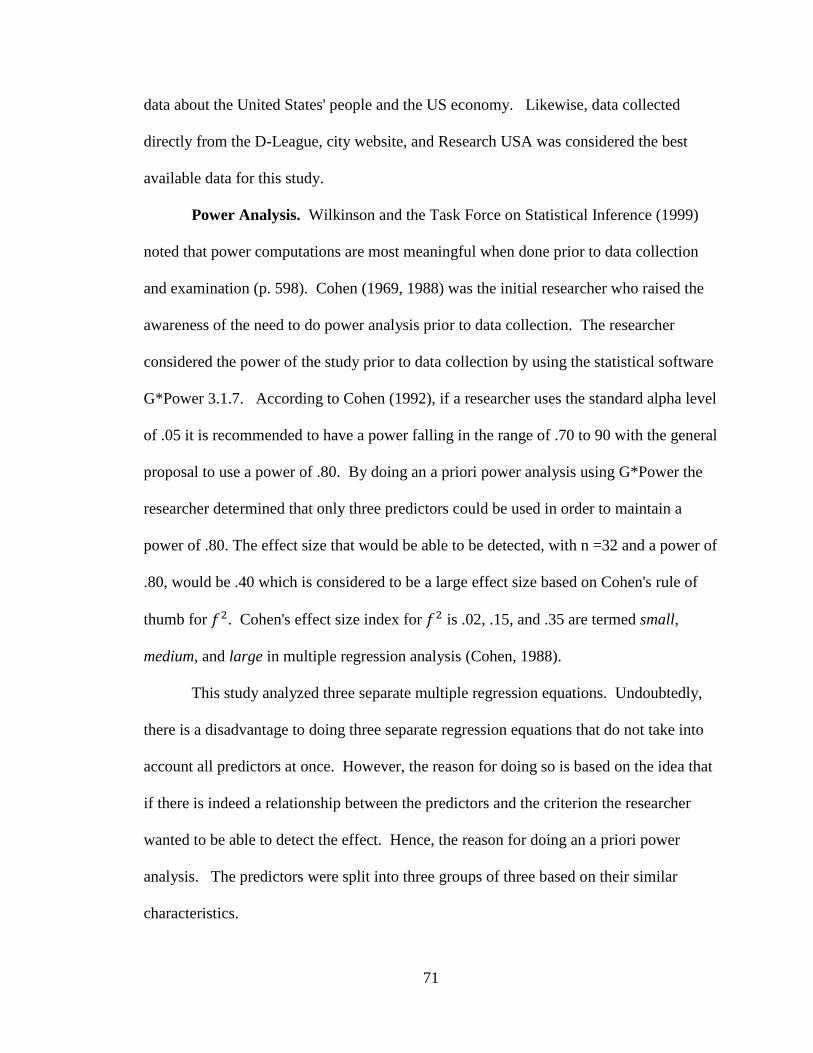
71
data about the United States' people and the US economy. Likewise, data collected
directly from the D-League, city website, and Research USA was considered the best
available data for this study.
Power Analysis. Wilkinson and the Task Force on Statistical Inference (1999)
noted that power computations are most meaningful when done prior to data collection
and examination (p. 598). Cohen (1969, 1988) was the initial researcher who raised the
awareness of the need to do power analysis prior to data collection. The researcher
considered the power of the study prior to data collection by using the statistical software
G*Power 3.1.7. According to Cohen (1992), if a researcher uses the standard alpha level
of .05 it is recommended to have a power falling in the range of .70 to 90 with the general
proposal to use a power of .80. By doing an a priori power analysis using G*Power the
researcher determined that only three predictors could be used in order to maintain a
power of .80. The effect size that would be able to be detected, with n =32 and a power of
.80, would be .40 which is considered to be a large effect size based on Cohen's rule of
thumb for . Cohen's effect size index for is .02, .15, and .35 are termed small,
medium, and large in multiple regression analysis (Cohen, 1988).
This study analyzed three separate multiple regression equations. Undoubtedly,
there is a disadvantage to doing three separate regression equations that do not take into
account all predictors at once. However, the reason for doing so is based on the idea that
if there is indeed a relationship between the predictors and the criterion the researcher
wanted to be able to detect the effect. Hence, the reason for doing an a priori power
analysis. The predictors were split into three groups of three based on their similar
characteristics.

72
All facility characteristics were grouped together in one regression equation.
Similarly, all of the demographic characteristics of the market were grouped together in
another regression equation. Competition, large business access, and business structure
were grouped together. It is believed that all pertinent predictors were analyzed, based on
the literature and theoretical framework.
Data Assembly. This study included all teams, both active and defunct, from the
NBA Development League teams for this study. In order to obtain information on past
and present teams, the Development League Website was used as well as the D-League
Digest; the website is an affiliate of Entertainment Sports and Programming Network
(ESPN). Table 3.2 is a list of all of the teams and their locations.
Table 3.2
Names and Locations of D-League Teams
ACTIVE DEFUNCT
Canton Charge – Canton, OH Utah Flash – Orem, UT
Erie Bayhawks – Erie PA New Mexico Thunderbirds – Albuquerque, NM
Fort Wayne Mad Ants – Fort Wayne, IN Anaheim Arsenal – Anaheim, CA
Iowa Energy – De Moines, IA Arkansas RimRockers – Little Rock, AR
Maine Red Claws – Portland, ME Asheville Altitude – Asheville, NC
Sioux Falls Skyforce – Sioux Falls, SD North Charleston Lowgators – Charleston, SC
Springfield Armor – Springfield, MA Colorado 14ers – Broomfield, CO
Austin Toros – Cedar Park, TX Columbus Riverdragons – Columbus, GA
Bakersfield Jam – Bakersfield, CA Dakota Wizards – Bismark, ND
Idaho Stampede – Boise, ID Fayetteville Patriots – Fayetteville, NC
LA D-Fenders – El Segundo, CA Florida Flame – Fort Myers, FL
Reno Bighorns – Reno, NV Fort Worth Flyers – Fort Worth, TX
Rio Grande Valley Vipers – Hidalgo, TX Greenville Groove – Greenville, SC
Santa Cruz Warriors – Santa Cruz, CA Huntsville Flight – Huntsville, AL
Texas Legends – Frisco, TX Mobile Revelers – Mobile, AL
Tulsa 66ers – Tulsa, OK Roanoke Dazzle – Roanoke, VA
Data assembly for this study occurred in March of 2014. The data were gathered
by the researcher through various government, state, facility, and NBA sources. As the

73
data was assembled, it was entered into an Excel spreadsheet and then entered into SPSS.
Upon completion of data assembly, the researcher analyzed the data using SPSS version
17.0. The source of data table is shown in Table 3.3.
Table 3.3
Source of Data Table
Predictor Abbreviation Level
Pro and College Teams in Area CMP Categorical
Business Structure of D-League Team STR Categorical
Large Businesses in the Market BUS Continuous
Population POP Continuous
Education Level in the Market EDU Continuous
Median Household Income INC Continuous
Age of the facility AGE Continuous
Location of the facility LOC Continuous
Facility Ownership OWN Categorical
Research Questions
: To what extent do city demographics (MSA, income, and education level)
within a market have a relationship with the success, as defined by
percentage of attendance capacity, of a D-League team?
: To what extent do facility characteristics (facility age, facility location,
facility size) have a relationship with the success, as defined by percentage
of attendance capacity, of a D-League team?
: To what extent does the ownership model, pro and college teams within the
market, and presence of large business within the market have a
relationship with the success, as defined by percentage of attendance
capacity, of a D-League
team?

74
Team Market. In order to go into the specifications of each variable, it must first
be understood what is meant by the market in which a team operates. For the purpose of
this study a 'market' was considered the city or census designated place (CDP) as defined
by the US Census Burea. The definition of a CDP, from the US Census Bureau is
"Unincorporated community, concentration of population, housing, and commercial
structures, identifiable by name, but not within an incorporated place" (Ratcliffe, 2010).
Using the CDP or the city allowed for considering only the city or town where the
franchise played as opposed to the metropolitan statistical area (MSA). Some teams,
though having a city identity, were not located within the city in which they identified.
For example, the Austin Toros play in Cedar Park though identify with Austin. The
researcher believed the CDP or city demographics better represented the demographics of
the area as opposed to the MSA because an MSA would potentially include many other
outlying towns and would not give a representation of what the true potential target
market for the team would be. The researcher used the US Bureau of Census' definition
for city or CDP for all variables that were linked to the market.
Measuring Attendance. The first variable that will be defined in this study is the
criterion, or dependent variable. For the purpose of this study, attendance will be used as
the dependent variable (criterion) and will synonymously be referred to as measuring
success for a D-League team. Though longevity and profitability could be viable options
for predicting success, the researcher felt the attendance was the most accurate depiction
of success in minor league sports. Attendance is related to the aggregate of gate revenue,
team related merchandise, and corporate sponsorship in professional sport leagues.
Another major source of revenue is media and television (Mason, 1999, p. 402). Because

75
the D-League is not extensively covered by media sources, game attendance weighs
heavily on revenue generation for a team.
The reason for the emphasis on attendance and not on team tenure or franchise
value was that the D-League is relatively new and the tenure of a team may not be a
viable measure. As stated by Rogoff et al (2004), "longevity and viability are crude
measures of business success". Some businesses cease to exist based on the decision by
the owner to sell the business, resulting in a profit, while other businesses may continue
to operate long term and see minimal profits (Rogoff et al, 2004, p. 365). Also,
franchise valuation in minor league basketball is not publically reported. Even if
franchise valuation were reported by an independent source, such as Financial World, the
researcher would face the same issue as other studies in that, typically, franchise
valuation can leave a lot of room for error and inaccuracy.
The attendance measure that was used is based on the attendance figures for the
last year of operation if a team is defunct. If a team is still in operation then the 2012
season was considered. Attendance was measured by taking the sum of attendance for all
games and dividing that by the possible capacity to give a percentage of capacity for the
team. The reason for using the percentage of capacity was to account for the differing
sizes of facilities. By using a mean it takes into consideration every game from the season
allows the researcher not to ignore any scores within the data set (Fields, 2010, p. 23).
Arena capacity, or the number of seats an arena has for a D-League game, was
gathered from each individual arena's website. If the arena capacity for a basketball
game was not available online then the researcher called the box office for the given
arena to verify the capacity for a basketball game. It should be noted that it is not

76
uncommon practice for professional sports teams to block off or tarp sections of an arena
in order to create a more vibrant game-day environment. The possibility of tarping or
blocking off sections in an arena was not taken into consideration for this study, only the
maximum capacity for a basketball game.
Attendance figures were collected from various sources. The main source for
attendance reporting was the NBA D-League's website and the individual team websites.
Other sources included Sports Illustrated and city newspapers. No matter if a team
website was used or a local news paper reporting attendance was used as the data source,
it is the individual team/franchise reporting the attendance to the source. Extending the
data sources for average attendance for the season is not believed to cause any validity
issues more than what already existed with reporting attendance figures in professional
sport. It is generally accepted in sports that the reported attendance figures may be
inflated. It is not an uncommon practice for teams to consider tickets sold as opposed to
actual gate attendance. This issue, the researcher believes, does not affect the use of the
reported attendance as a means to measure franchise success in this study as attendance
capacity was the best possible measure for franchise success in the D-League.
Research Question 1: Market Demographics.
The first groups of variables analyzed, in one regression equation, were directly
related to the demographics of each market. In regard to the population of each market
the data collected was done by considering the census designated place (CDP) or the city
in which a team was located. Population was a continuous variable and reported in
thousands based on US Census data from 2010. For example, 258 would represent a
population of 258,000.
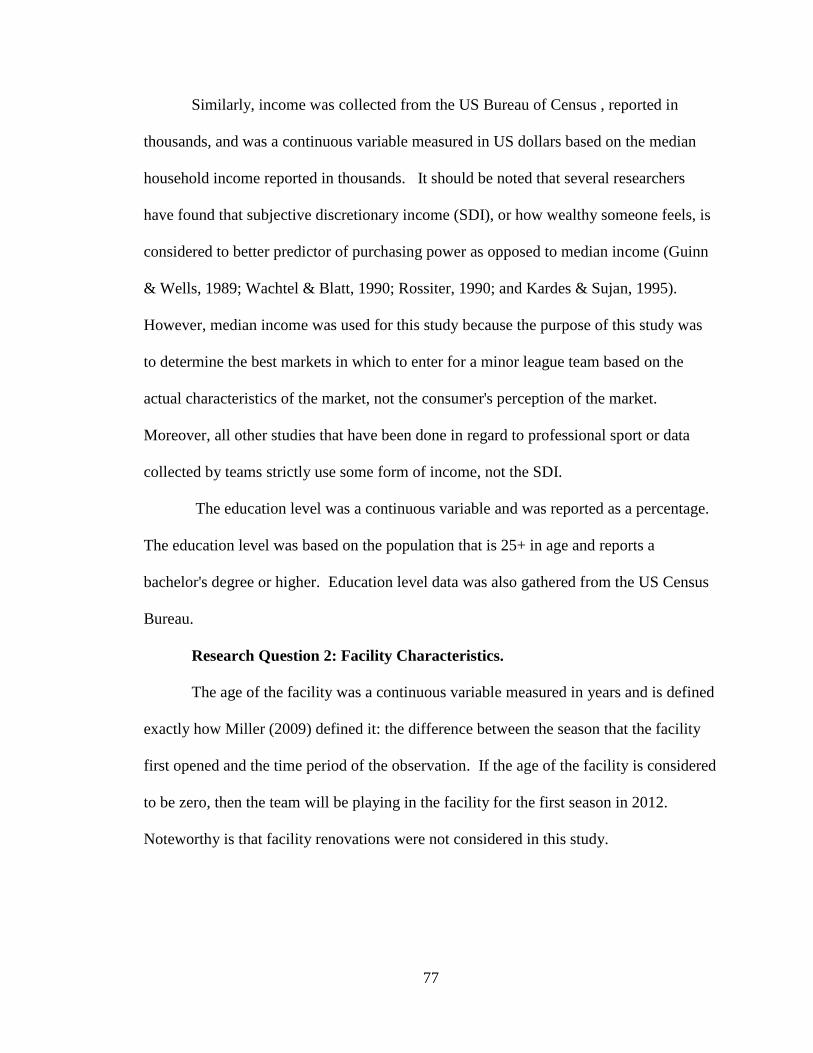
77
Similarly, income was collected from the US Bureau of Census , reported in
thousands, and was a continuous variable measured in US dollars based on the median
household income reported in thousands. It should be noted that several researchers
have found that subjective discretionary income (SDI), or how wealthy someone feels, is
considered to better predictor of purchasing power as opposed to median income (Guinn
& Wells, 1989; Wachtel & Blatt, 1990; Rossiter, 1990; and Kardes & Sujan, 1995).
However, median income was used for this study because the purpose of this study was
to determine the best markets in which to enter for a minor league team based on the
actual characteristics of the market, not the consumer's perception of the market.
Moreover, all other studies that have been done in regard to professional sport or data
collected by teams strictly use some form of income, not the SDI.
The education level was a continuous variable and was reported as a percentage.
The education level was based on the population that is 25+ in age and reports a
bachelor's degree or higher. Education level data was also gathered from the US Census
Bureau.
Research Question 2: Facility Characteristics.
The age of the facility was a continuous variable measured in years and is defined
exactly how Miller (2009) defined it: the difference between the season that the facility
first opened and the time period of the observation. If the age of the facility is considered
to be zero, then the team will be playing in the facility for the first season in 2012.
Noteworthy is that facility renovations were not considered in this study.

78
Facility capacity was a continuous variable. The facility capacity is the same
capacity that was used in calculating the average percentage of attendance. Again,
tarping or blocking off areas was not considered for this study.
Facility location was a categorical variable and dummy coded. Often a downtown
area of a city is considered a prime location for a stadium or sports team. However, the
term 'downtown' is a vague concept that is not defined by an exact geographical location
(Montello, Goodchild, Gottsegan, and Fohl, 2003). Using a categorical variable instead
of a continuous variable allowed the downtown area to be considered a region. Being
considered a region is important because downtown areas are not precise with specific
boundaries; rather downtowns have discrete boundaries that vary in degree of
interpretation (Montello, et al, 2003).
The downtown location was determined by inputting it into Google Maps.
Google Maps was used because downtown is considered a vague region or term. For
example, by inputting in "Downtown, Portland, ME", Google Maps marks a spot
considered to be downtown Portland, Maine. The arena in which the Portland team plays
was then added as the 'destination' and mileage was given. To account for the fact that
downtown areas typically span for many blocks, categories of mileage was used. There
were five categories for stadium distance to downtown: 0 – 2.4 miles from downtown,
2.5– 4.9 miles from downtown, 5.0 – 7.4 miles from downtown, 7.5 – 9.9 miles from
downtown, and over 10.0 miles from downtown. The reason the categories are divided
by factors of 2.4 was to consider the largest reported downtown area in the United States.
The largest geographical downtown in the United States is San Antonio which spans for
5.5 square miles (University of Pennsylvania, 2001; US Bureau of Census, 2000). The

79
square root of 5.5 is 2.35 and represents a distance not an area, which allows for the use
of Google Maps. Thus, using 2.4 miles as the maximum distance for a stadium to be
considered downtown allowed for the ability to capture all downtown geographical areas.
A stadium had to have been 2.4 miles or less of the downtown area as designated by
Google Maps to be considered downtown.
Facility ownership was not considered in this study because it was found that all
D-League teams played in public facilities except for one. Thus, it was not considered a
predictor of franchise success.
Research Question 3: Resources within the Market
The next predictor considered was the ownership model of each D-League team.
This variable was a categorical variable and dummy coded. Ownership model falls under
one of the three following categories: 1) direct affiliation, 2) hybrid, or 3) independent.
The distinction between the three categories of business structure is based on the
relationship with the affiliated NBA team(s). A team was considered to be independent if
they are not funded or owned by the NBA parent teams. If the parent NBA team funds
the basketball operations, they were considered to operate under the hybrid ownership
model based on the financial partnership. Finally, if an NBA team operates and owns
their own D-League team then they were considered to be a direct affiliation team. This
variable was dummy coded. The data for the predictor “ownership model” used by the
team was gathered by using the NBA Development Leagues website.
With respect to the competition, predictors of other professional sports teams and
major college basketball teams, city or state websites were used. The direct competition
within the market is based on the number of other professional sports teams combined

80
with the number of NCAA Division I Men's Basketball teams. This variable was
measured as a continuous variable. This variable is technically a discrete variable
because the range is limited and can only take on a certain value (Fields, 2010, p. 9). The
reason for a limited range is that cities typically do not have an unlimited number of
professional sports teams or universities in the area. This variable, though a continuous
variable, was represented as frequency that can take on only certain values as opposed to
a true continuous variable.
In order to be counted as another professional sports team the team must have
been one of the following leagues: National Football League (NFL), National Basketball
Association (NBA), Major League Baseball (MLB), National Hockey League (NHL),
Women's National Basketball Association (WNBA), Major League Soccer (MLS),
American Hockey League (AHL), East Coast Hockey League (ECHL), Arena Football
League (AFL) or any class of Minor League Baseball (MiLB). All other leagues or
college divisions were not considered for the purpose of this study.
The final predictor variable in this study was for financial resources within the
operating market. The number of businesses within the market that a team operates is
considered a resource for sponsorships and premium/luxury seating for a D-League team.
The number of businesses operating within the market was measured as a continuous
variable and was based on the number of firms within the market as of 2012. This data
was collected from DemographicsNow which is a comprehensive database that contains
information, including annual sales, on over 20 million businesses within the United
States. The search criteria for companies in the data base were to search for companies
that grossed over ten million dollars in annual sales as well as were headquartered in the

81
market. Though other studies used Fortune 500 companies as the definition for a large
business, most of the D-League markets operate in small to medium size cities which
often don't house Fortune 500 companies.
Data Analysis
Data were analyzed using Statistical Package for the Social Sciences version 17.0
(SPSS). The statistical procedure that was used was multiple regression to determine if
there is a statistically significant difference in any of the predictors on the criterion.
Multiple regression was used to identify if any of the predictors had an effect on the
success of a D-League franchise. This method was selected because the common
justification for using multiple regression is to study the relationship between multiple
independent variables (predictors) and a dependent variable (criterion) (Field, 2010, p.
198).
Inferential and descriptive statistics will be considered as a means of analyzing
the data. All three regression equations will be analyzed at the α = .05 level. Setting
alpha to .05 is a widely accepted standard. Multiple regression was used as a means to
assess factors that might explain any relationship between the predictors and team
attendance that may exist.
Each of the three multiple regression models are specified by:
An example of result interpretation is, all other things equal, if one of the
predictors, for example , is increased one unit then the mean level of (attendance
capacity) will change by units. In simple terms, this tells the effect of the predictors
on attendance capacity or the effect of X on Y.

82
Assumptions. Part of the regression analysis involved checking the assumptions
associated with regression analysis. To infer conclusions concerning a population, by
means of a regression analysis on a sample, several assumptions should be evaluated
(Berry, 1993). Pedhazur (1997) notes that violations of assumptions can lead to serious
biases in the research being conducted (p. 33). In order to conduct a consequential data
analysis, the researcher tested assumptions about variables in the analysis to ensure that
the results and conclusions are not heavily influenced by bias. The six assumptions, in no
particular order, tested by using SPSS were: 1) Linear relationship between independent
variables and dependent variable 2) Normal distribution of errors 3) Independent errors 4)
Homoscedasticity 5) Correct specification of variables and 6) Multicollinearity.
When using multiple regression the relationship between the dependent and
independent variables should be linear in nature (Osborne & Waters, 2002, p. 2). A
preferable way to check for linearity is to inspect and examine the residual plots (Cohen
& Cohen, 1983; Pedhazur, 1997). By looking at the residual plots it allowed the
researcher to check that the relationship between each independent variable and the
dependent variable is linear. The basis of regression is that there is a linear relationship
between the criterion and predictors; so, the assumption that the relationship between the
dependent and independent variables is linear was tested.
The next assumption considered was the distribution of the errors. Like many
statistical models, regression assumes a form of normality. Multiple regression assumes
that the residuals in the model are normally distributed with a mean of 0 (Fields, 2010, p.
221). Ultimately, if the errors are normally distributed, it means there is very little
difference between the model and the observed data. A probability-probability (p-p) plot
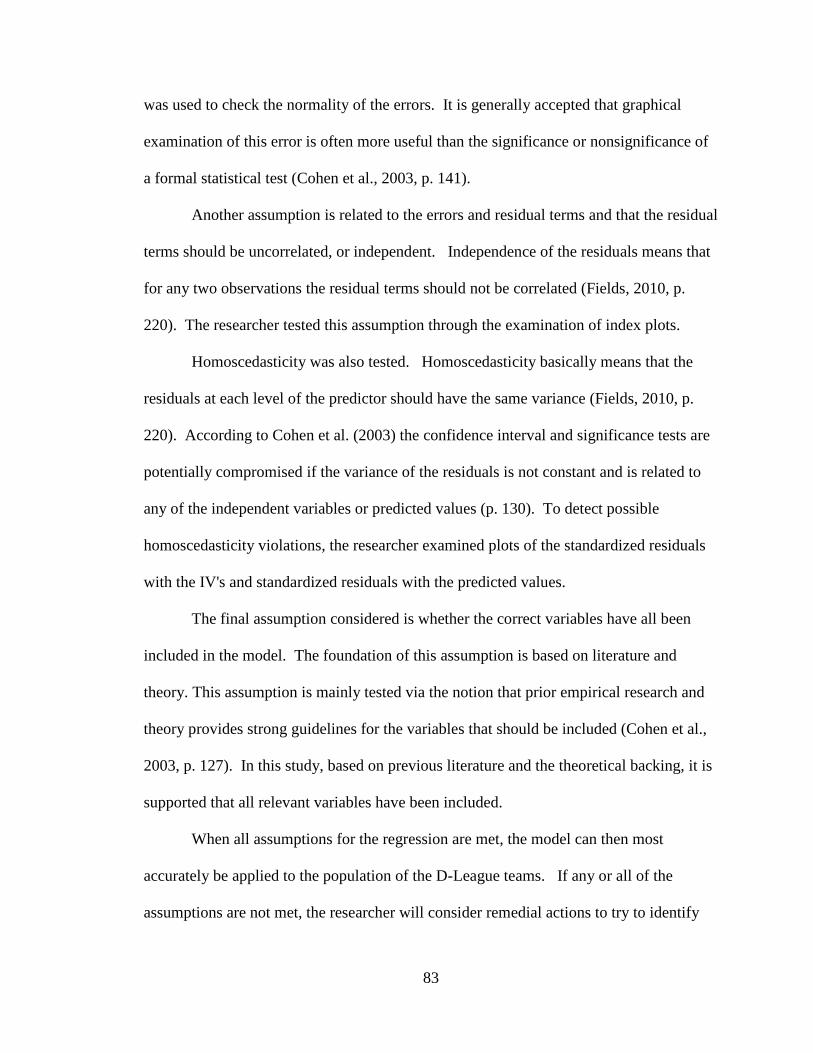
83
was used to check the normality of the errors. It is generally accepted that graphical
examination of this error is often more useful than the significance or nonsignificance of
a formal statistical test (Cohen et al., 2003, p. 141).
Another assumption is related to the errors and residual terms and that the residual
terms should be uncorrelated, or independent. Independence of the residuals means that
for any two observations the residual terms should not be correlated (Fields, 2010, p.
220). The researcher tested this assumption through the examination of index plots.
Homoscedasticity was also tested. Homoscedasticity basically means that the
residuals at each level of the predictor should have the same variance (Fields, 2010, p.
220). According to Cohen et al. (2003) the confidence interval and significance tests are
potentially compromised if the variance of the residuals is not constant and is related to
any of the independent variables or predicted values (p. 130). To detect possible
homoscedasticity violations, the researcher examined plots of the standardized residuals
with the IV's and standardized residuals with the predicted values.
The final assumption considered is whether the correct variables have all been
included in the model. The foundation of this assumption is based on literature and
theory. This assumption is mainly tested via the notion that prior empirical research and
theory provides strong guidelines for the variables that should be included (Cohen et al.,
2003, p. 127). In this study, based on previous literature and the theoretical backing, it is
supported that all relevant variables have been included.
When all assumptions for the regression are met, the model can then most
accurately be applied to the population of the D-League teams. If any or all of the
assumptions are not met, the researcher will consider remedial actions to try to identify

84
where the problems may have occurred. Again, the importance of meeting these
assumptions increased the likelihood of this research and that it is representative of the
sample. It also increased the possibility that this research is generalizable to other sports
leagues.
Limitations
The main concern of conducting this research was the limited number of teams
from which to derive data. Technically, the sample is really a census of the entire
population of teams from the inception of the D-League (2001) up until the end of the
2012-2013 season. Obviously, this will accurately represent the D-League as it will
include the entire population of NBA D-League teams for a certain point in time. Due to
the limited number of years that the league has operated, there are not many teams that
have operated, thus leaving the size of the population narrow for the purpose of using
regression analysis. The sample size, as previously mentioned, also largely affects the
ability to include all predictors into one regression equation. Thus, the results do not
consider all predictors at once, rather they are considered in groups of three, which make
it more difficult to draw conclusions about all predictors simultaneously.
Another limitation of the study was the possibility that other factors, that are
considered uncontrollable or not related to the theory at hand, attribute to franchise
survival or increased value of a team. There was often consideration given to winning
percentages and other non-environmental factors. Though these factors are not directly
related to the environment, there is still the possibility they have a relationship to the
survival and success of a team.
85
CHAPTER IV - RESULTS
This research study examined the relationship between environmental
characteristics of all NBA Development League teams that existed from 2001-2012 and
the success of each D-League team, which was defined as the average attendance
capacity attendance. This chapter begins with a data analysis procedures section which
includes all three research questions being analyzed and an overview of the
characteristics of the sample. The data analysis procedures section is followed by
individual analysis of each of the three research questions. This chapter was organized
based on the three research questions analyzed in this study designated by the following
headlines: Research Question 1 – Market Demographics; Research Question 2 – Facility
Characteristics; and Research Question 3 – Market Resources. Under each of the three
research question sections all findings related to that question and the statistical analyses
were described. Chapter IV concludes with a comprehensive summary of the data
findings as they relate to the purpose of this study.
Data Analysis Procedures
The researcher conducted a non-experimental, correlational study for this
research. Though there have been previous studies conducted on franchise valuation or
franchise success in the major leagues, there has not been any research done on franchise
success in the NBA Development League. This research was exploratory by nature and
had the goal of providing a better understanding which environmental factors, based on
previous literature, may attribute to franchise success in the NBA D-League.
The sample for this study consisted of 32 NBA Development League teams which
represented teams operating from the initiation of the League in 2001 to end of the season
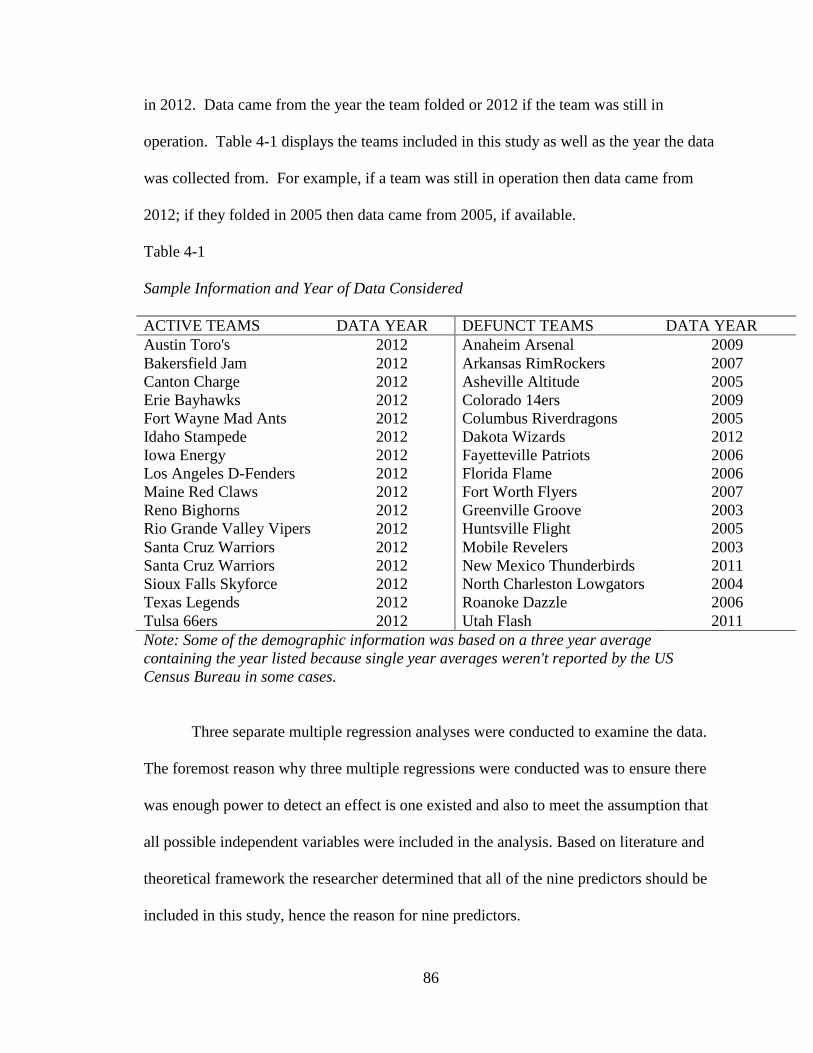
86
in 2012. Data came from the year the team folded or 2012 if the team was still in
operation. Table 4-1 displays the teams included in this study as well as the year the data
was collected from. For example, if a team was still in operation then data came from
2012; if they folded in 2005 then data came from 2005, if available.
Table 4-1
Sample Information and Year of Data Considered
ACTIVE TEAMS DATA YEAR DEFUNCT TEAMS DATA YEAR
Austin Toro's 2012 Anaheim Arsenal 2009
Bakersfield Jam 2012 Arkansas RimRockers 2007
Canton Charge 2012 Asheville Altitude 2005
Erie Bayhawks 2012 Colorado 14ers 2009
Fort Wayne Mad Ants 2012 Columbus Riverdragons 2005
Idaho Stampede 2012 Dakota Wizards 2012
Iowa Energy 2012 Fayetteville Patriots 2006
Los Angeles D-Fenders 2012 Florida Flame 2006
Maine Red Claws 2012 Fort Worth Flyers 2007
Reno Bighorns 2012 Greenville Groove 2003
Rio Grande Valley Vipers 2012 Huntsville Flight 2005
Santa Cruz Warriors 2012 Mobile Revelers 2003
Santa Cruz Warriors 2012 New Mexico Thunderbirds 2011
Sioux Falls Skyforce 2012 North Charleston Lowgators 2004
Texas Legends 2012 Roanoke Dazzle 2006
Tulsa 66ers 2012 Utah Flash 2011
Note: Some of the demographic information was based on a three year average
containing the year listed because single year averages weren't reported by the US
Census Bureau in some cases.
Three separate multiple regression analyses were conducted to examine the data.
The foremost reason why three multiple regressions were conducted was to ensure there
was enough power to detect an effect is one existed and also to meet the assumption that
all possible independent variables were included in the analysis. Based on literature and
theoretical framework the researcher determined that all of the nine predictors should be
included in this study, hence the reason for nine predictors.
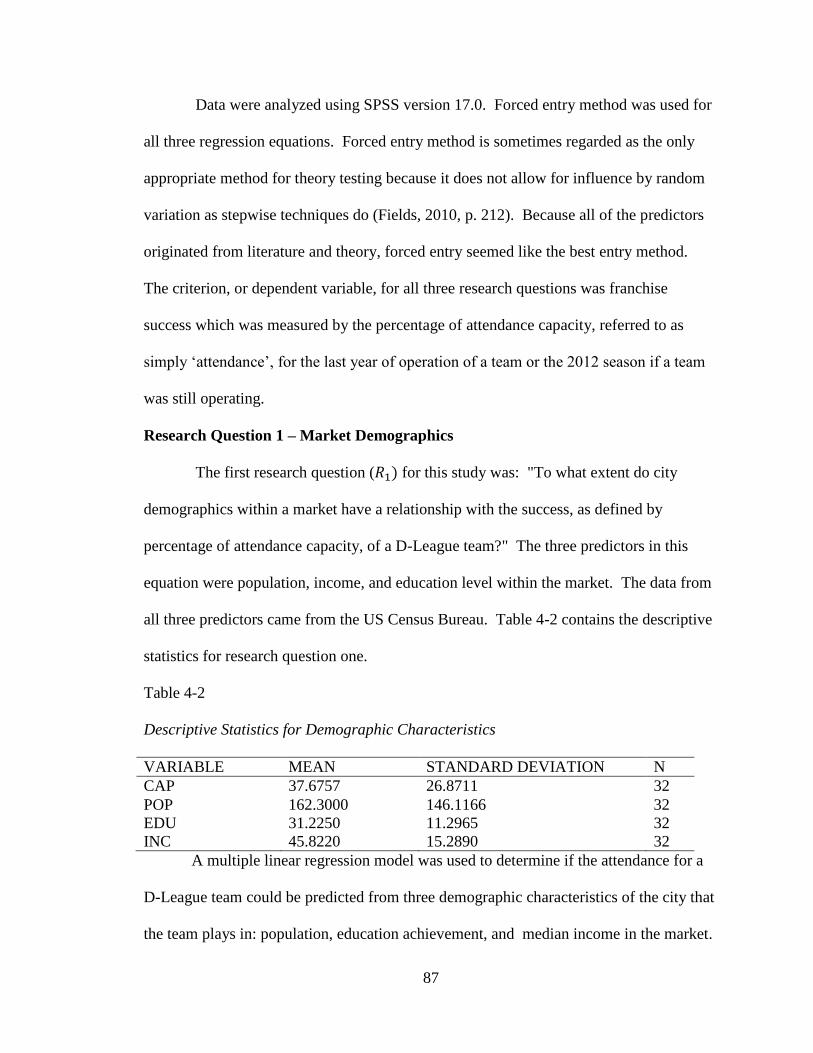
87
Data were analyzed using SPSS version 17.0. Forced entry method was used for
all three regression equations. Forced entry method is sometimes regarded as the only
appropriate method for theory testing because it does not allow for influence by random
variation as stepwise techniques do (Fields, 2010, p. 212). Because all of the predictors
originated from literature and theory, forced entry seemed like the best entry method.
The criterion, or dependent variable, for all three research questions was franchise
success which was measured by the percentage of attendance capacity, referred to as
simply ‘attendance’, for the last year of operation of a team or the 2012 season if a team
was still operating.
Research Question 1 – Market Demographics
The first research question ( for this study was: "To what extent do city
demographics within a market have a relationship with the success, as defined by
percentage of attendance capacity, of a D-League team?" The three predictors in this
equation were population, income, and education level within the market. The data from
all three predictors came from the US Census Bureau. Table 4-2 contains the descriptive
statistics for research question one.
Table 4-2
Descriptive Statistics for Demographic Characteristics
VARIABLE MEAN STANDARD DEVIATION N
CAP 37.6757 26.8711 32
POP 162.3000 146.1166 32
EDU 31.2250 11.2965 32
INC 45.8220 15.2890 32
A multiple linear regression model was used to determine if the attendance for a
D-League team could be predicted from three demographic characteristics of the city that
the team plays in: population, education achievement, and median income in the market.

88
The null hypothesis tested was that the regression coefficients, or slopes of the lines, were
equal to zero. Prior to analysis the data were screened for violation of assumptions.
The assumption of linearity was reviewed through a scatterpolot matrix which
plotted each predictor against the criterion. Reviewing the scatterplots indicated that
linearity, though not perfect, did not seem to be in serious violation for any of the
predictors. Fit lines were added for both linear and loess lines. Though all three
predictors indicated dips or jumps in the loess lines, however, none seemed to indicate a
serious violation of linearity. Further testing of linearity was done by plotting the
standardized residuals against the predicted values which indicated a slight curve which
further confirmed no significant violation of linearity was present.
To test for the normality of errors the researcher looked at the histogram and the
probability – probability (P-P) plot which showed the standardized residuals plotted
against the predicted values. The P-P plot indicated a bit of deviation from normality as
some of the data points strayed from the line. Similarly, the shape of the distribution in
the histogram indicated a bit of positive skewness. Based on the results of the P-P plot
and histogram of the residuals, the researcher concluded that there may be a violation of
normality in this model, though it is not completely clear.
The next assumption tested was homoscedasticity, or the constant variance of
errors. To test this assumption the standardized residuals were plotted against the
predicted values. The researcher determined that the data seemed to be reasonably
random and scattered. There did not appear to be a violation of homoscedasticity.
Multicollinearity was tested by looking at the variance inflation factor (VIF) and
the tolerance statistics. The VIF test for multicollinearity indicated that there was a low
89
level of multicollinearity present though not an area of concern (POP VIF = 1.132, EDU
VIF = 1.606, and INC VIF = 1.508). Similarly, the tolerance statistics did not show any
substantial problems of multicollinearity issues (Tolerance POP = .844, Tolerance EDU =
.623, and Tolerance INC = .663).
To test the hypothesis that the three city demographic characteristics of
population, education, and income within the market had a relationship with the success
of a D-League team, as defined by attendance, a forced entry multiple regression analysis
was performed. The results of the regression indicated the three predictor model of
Population ( POP), Education (EDU), and Income (INC), accounted for 37.9% of the
variance in the attendance capacity and was statistically significant, F(3, 28) = 5.164, p <
.006, = .356. The adjusted value was .287. The shrinkage between the R square
and adjusted R square indicates that if the model were derived from the population, rather
than a sample, it would account for approximately 6.9% less variance in the outcome.
There was statistical evidence that population was statistically significant. The
slope for population of the city in which the teams stadium was located (β = -.064) was
statistically significant from 0 (t = -2.168, p = .039). With every one-point increase in the
criterion, the population in a D-League team's city would decrease by -.064 points when
controlling for education and income. This interpretation means that for every one
percentage increase in attendance the population of the city decreases by 640 people
(population was entered in thousands).
Income within the market was also a significant predictor of average percentage
of attendance capacity. The slope for income of the market (β = 1.007) was statistically
significant from 0 (t = 3.078, p = .005). The slope for income can be interpreted such

90
that with every one point increase in percentage of attendance the median income level
within a D-League city will increase by 1.007 units. Practically interpreted this indicates
that for every one percentage increase in attendance the median income level within the
city will increase by $1,007, assuming population and education are held constant.
Though population and income were shown to be statistically significant
predictors of attendance, the education level within the market was not (β = -.250, t = -
.546, p = .589). Table 4-3 gives a description of the regression coefficients from the
analysis.
Table 4-3
Diagnostics: Demographic Predictors of Attendance Capacity in the D-League
Variable B SE B Sig 95% CI
CAP (Constant) 9.760 15.246 .527 [-21.469, 40.990]
POP -.064 .030 .039 [-.125, -.004]
EDU -.25 .457 .589 [-1.186, .687]
INC 1.007 .327 .005 [.337, 1.677]
.356
F 5.164
Note. N = 32. CI = Confidence Interval, SE B=Standardized Betas,
Research Question 2 – Facility Characteristics
Research question ( for this study was: "To what extent do facility
characteristics (facility age, facility location, and facility size) have a relationship with
the success, as defined by attendance, of a D-League team?" The three predictors in this
equation were facility age, facility location, and facility capacity. Table 4-4 gives the
descriptive statistics for research question 2.

91
Table 4-4
Descriptive Statistics for Facility Characteristics
VARIABLE MEAN STANDARD DEVIATION N
CAP 37.6757 26.8711 32
AGE 21.1250 22.0479 32
SIZE 7571.53 3901.738 32
LOC 3.2031 4.6800 32
A three predictor multiple regression analysis was used to develop a model for
predicting D-League attendance based on characteristics of the facility in which the team
plays. Prior to analysis the data were screened for violation of assumptions.
The assumption of linearity was reviewed through a scatterplot matrix which
plotted stadium size, age, and location against the criterion capacity of attendance.
Stadium size verses capacity appeared to have a relatively strong linear relationship.
Location of the stadium, when plotted against the capacity, showed three outliers that
seemed to be affecting the linearity of the data. The age of the stadium verse the capacity
of the attendance was less clear and a violation of linearity seemed to be present as the
loess line indicated a quadratic relationship. To further test the assumption of linearity a
scatterplot of the standardized residuals and the predicted values was used. The shape of
the data dispersion for this graph showed a funnel shaped dispersion. Similarly, the loess
line on this graph showed an almost cubic relationship. Both of these observations
indicated a violation of linearity was likely present.
The assumption of normality was tested via examination a P-P plot of the
residuals plotted against the theoretical normal distribution a histogram of the
standardized residuals. The P-P plot suggested a relatively normal distribution of the
residuals. Moreover, the histogram also indicated that the assumption of normality was
met.
92
To test for homoscedasticity the researcher evaluated the standardized residuals
plotted against the predicted values. The data in this model seemed to possibly have
heteroscedasticity because they seemed to funnel out, which means there may be a
violation of the assumption of independent errors. However, because of the lack of data
points it was difficult to tell if the data was indeed funneling out.
The VIF and tolerance statistics were both considered to identify if any of the
predictor variables highly correlated with each other. Tests for multicollinearity showed
there was no indication of concern for multicollinearity based on the VIF and tolerance
diagnostics. The VIF values were all hovering close to 1 (AGE VIF = 1.111, LOC VIF =
1.034, SIZE VIF = 1.034). Tolerance outputs also showed no problems of
multicollinearity issues (Tolerance AGE = .900, Tolerance LOC = .894, and Tolerance
SIZE = .967). The researcher concluded there was no reason to regard the model as
violating the assumption of multicollinearity.
A forced entry multiple regression was performed to test the hypothesis that the
three facility characteristics of facility age, facility size, and facility distance from
downtown, had a relationship with the success of a D-League team, as defined by average
attendance capacity. Results from the multiple regression analysis reveal the three
predictor model of facility age (AGE), facility size (SIZE), and the facilities distance
from downtown (LOC), accounted for 45.7% of the variance in the attendance capacity,
F(3, 28) =8.428, p < .001, = .475. The difference between and adjusted R square
(.418) indicated that if the model were derived from the population rather than a sample it
would account for approximately 5.7% less variance in the outcome.
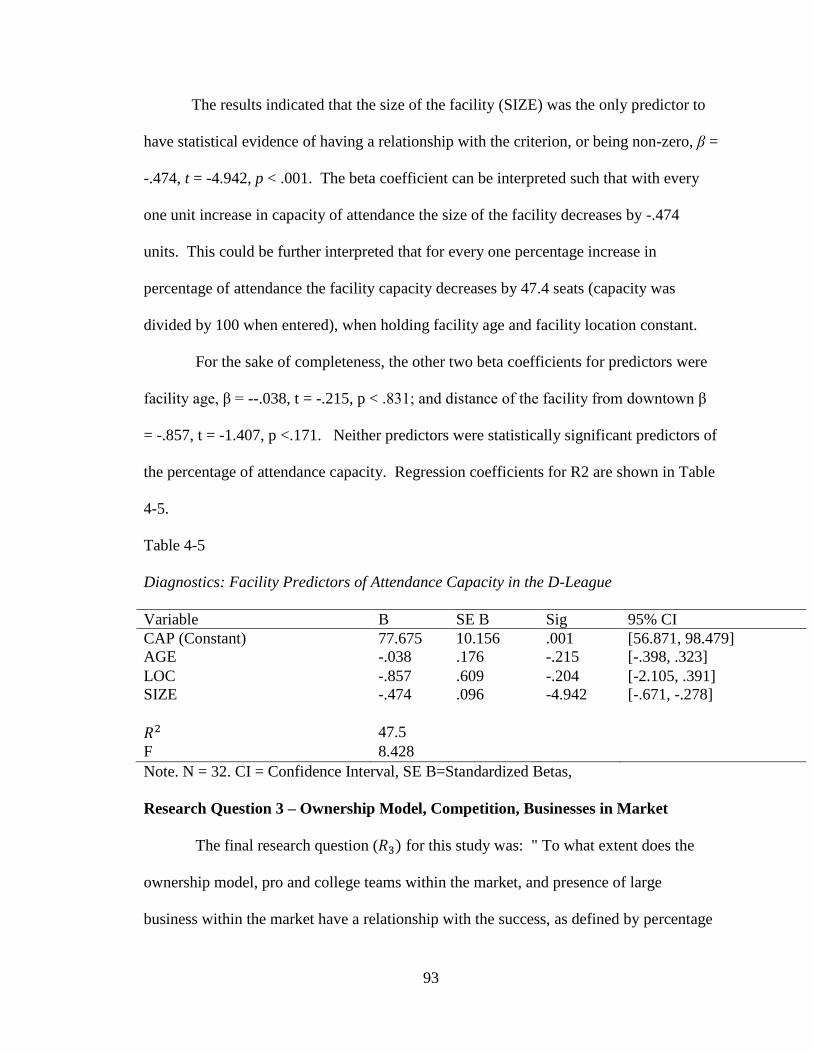
93
The results indicated that the size of the facility (SIZE) was the only predictor to
have statistical evidence of having a relationship with the criterion, or being non-zero, β =
-.474, t = -4.942, p < .001. The beta coefficient can be interpreted such that with every
one unit increase in capacity of attendance the size of the facility decreases by -.474
units. This could be further interpreted that for every one percentage increase in
percentage of attendance the facility capacity decreases by 47.4 seats (capacity was
divided by 100 when entered), when holding facility age and facility location constant.
For the sake of completeness, the other two beta coefficients for predictors were
facility age, β = --.038, t = -.215, p < .831; and distance of the facility from downtown β
= -.857, t = -1.407, p <.171. Neither predictors were statistically significant predictors of
the percentage of attendance capacity. Regression coefficients for R2 are shown in Table
4-5.
Table 4-5
Diagnostics: Facility Predictors of Attendance Capacity in the D-League
Variable B SE B Sig 95% CI
CAP (Constant) 77.675 10.156 .001 [56.871, 98.479]
AGE -.038 .176 -.215 [-.398, .323]
LOC -.857 .609 -.204 [-2.105, .391]
SIZE -.474 .096 -4.942 [-.671, -.278]
47.5
F 8.428
Note. N = 32. CI = Confidence Interval, SE B=Standardized Betas,
Research Question 3 – Ownership Model, Competition, Businesses in Market
The final research question ( for this study was: " To what extent does the
ownership model, pro and college teams within the market, and presence of large
business within the market have a relationship with the success, as defined by percentage

94
of attendance capacity, of a D-League team?" Ownership model, competition within the
market, and the presences of large businesses within the market were the three predictors
in this model. Table 4-6 is a portrayal of the descriptive statistics for research question
number three.
Table 4-6
Descriptive Statistics for Resource Characteristics
VARIABLE MEAN STANDARD DEVIATION N
CAP 37.6757 26.8711 32
COMP 2.06 1.777 32
BUS 73.97 68.206 32
Multi v. Hybrid .2188 .4201 32
Multi v. NBA .1875 .39656 32
A multiple linear regression model with three predictors was conducted to
determine if the attendance for a D-League team could be predicted from ownership
model, competition within the market, and the presence or large businesses within the
market. Ownership model was a categorical variable and was dummy coded in SPSS.
The ownership model of the team was a true nominal variable and could only take on one
of three ownership models: multiple affiliation, outright NBA team ownership, or hybrid
model. The baseline group used for the dummy coding was the multiple affiliation model
because that was the original ownership model used by all teams in the league. The
competition within the market where the team operated was a bit less clear; however, the
researcher treated this as a continuous variable even though the range of the data was
limited to values between 0 and 10. Prior to analysis the researcher tested for violation of
assumptions.
The assumption of linearity was reviewed through a scatterplot matrix which
plotted each predictor against the criterion. All of the scatterplots of the individual
95
predictors against the criterion seemed unclear if they were in violation of linearity. The
loess lines for all predictors, aside from competition, seemed relatively linear aside from
a dip in the data. The loess line for competition within the market place was a bit more
unclear as it dipped twice and may have indicated a quadratic relationship. Further
exploration of linearity through a plot of the standardized residuals and the predicted
values showed that there did not seem to be a serious violation of linearity despite a slight
dip in the line.
For normality, it is assumed that the residuals in the model are random, normally
distributed variables with a mean of zero. This assumption was tested through a P-P plot
and histogram that compared the model and the observed data. The histogram
suggested, though, not a perfect bell shape, that there was no violation of normality.
Similarly, the P-P plot, although some data points drifted from the line, did not indicate a
significant violation of normality.
Homoscedasticity was tested by looking at the standardized residuals plotted
against the predicted values. The output of the plot indicated that there was a bit of
grouping present though there was no distinct funnel shape with the data points. The
researcher determined that there did not seem to be a violation of homoscedasticity. .
The variance inflation factor and tolerance diagnostics were both considered to
test for violation of the assumption of multicollinearity. The VIF values indicated that
there was not significant multicollinearity issues (BUS VIF = 1.012, Multi v. Hybrid VIF
= 1.051, Multi v. NBA VIF = 1.129, and COMP VIF = 1.080 ). Likewise, the tolerance
statistics also suggested there was no indication of correlational issues between predictor
96
variables (BUS Tolerance = .989, Multi v. Hybrid Tolerance = .951, Multi v. NBA
Tolerance = .886, and COMP Tolerance = .926).
After the assumptions were tested, forced entry multiple regression analysis was
used to test the hypothesis that large businesses within the market place, competition
within the market place, and the ownership model of the team, had a relationship with the
success of a D-League team, as defined by percentage of attendance capacity. The
results of the multiple regression indicated the model accounted for 35.6% of the variance
in the attendance capacity, F (3, 28) = 3.728, p < .021, = .356.
The output of the multiple regression analysis specified the hybrid ownership
model and outright NBA ownership model both differed from the multiple affiliation
ownership model of a D-League team. The slope for multiple affiliation ownership
compared to the hybrid ownership model was statistically significant β = 31.204 t =
2.972, p < .006, controlling for the number of large businesses in the market and the
competition within the market. Similarly, the beta coefficient for multiple affiliation
ownership compared to the outright NBA ownership model was also statistically
significant, β = 27.423, t = 2.522, p < .018, controlling for the number of large businesses
in the market and the competition within the market.
Results also indicated that the number of businesses within the market and the
competition within the market were not statistically significant. For the sake of
completeness the outputs were, β = -.060, t = -.957, p < .347; and competition within the
market β = -.008, t = -.003, p < .997. Regression coefficients for R3 are shown in Table
4-7.
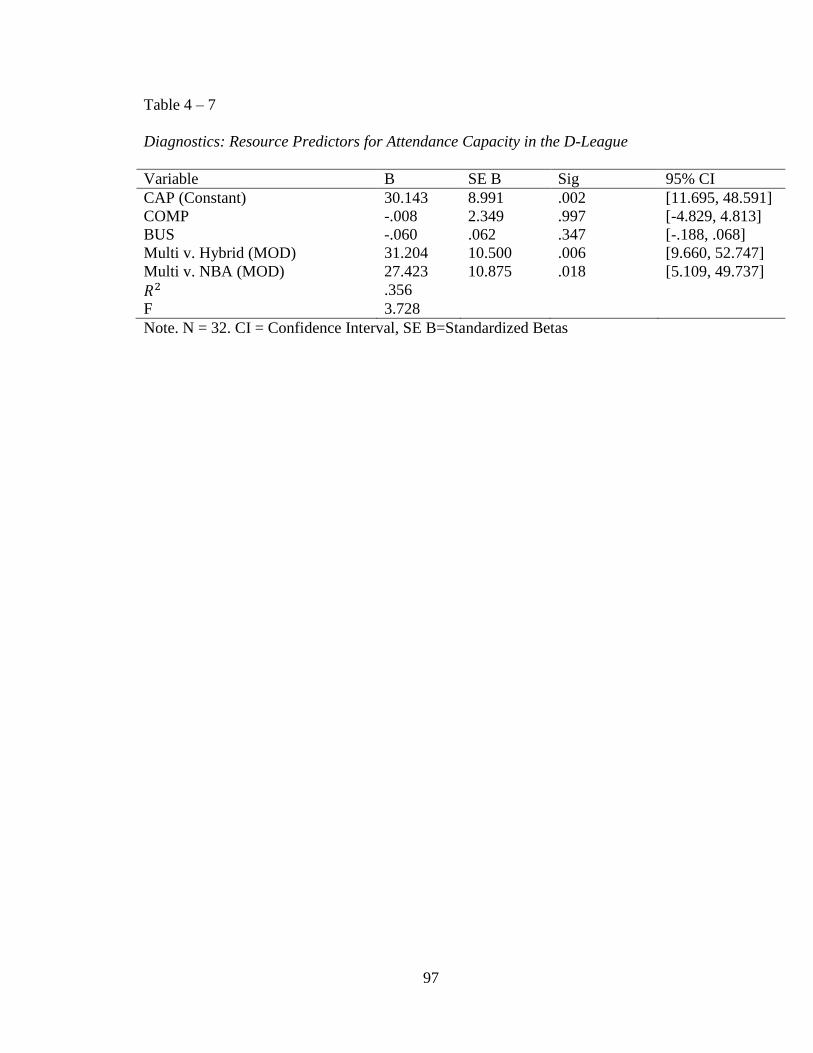
97
Table 4 – 7
Diagnostics: Resource Predictors for Attendance Capacity in the D-League
Variable B SE B Sig 95% CI
CAP (Constant) 30.143 8.991 .002 [11.695, 48.591]
COMP -.008 2.349 .997 [-4.829, 4.813]
BUS -.060 .062 .347 [-.188, .068]
Multi v. Hybrid (MOD) 31.204 10.500 .006 [9.660, 52.747]
Multi v. NBA (MOD) 27.423 10.875 .018 [5.109, 49.737]
.356
F 3.728
Note. N = 32. CI = Confidence Interval, SE B=Standardized Betas

98
CHAPTER V - CONCLUSION
This chapter presents an overall summary of the study and essential conclusions
from the data analysis in Chapter 4. This chapter begins with an overall summary of the
study and overview of the methodology. Subsequent to the summary will be implications
for action and suggested recommendations for future research.
Summary of the Study
As stated in Chapter 1, the purpose of this study was to determine if any
environmental characteristics had a relationship with the success of D-League team as
measured by capacity of attendance for the last year of operation or the 2012 season. The
theoretical framework to the study was based on basic organizational theory and
environmental characteristics of an organization. Predictors for this study were included
based on previous research studies which considered factors to predict franchise success,
franchise valuation, or attendance in professional sport. The predictors included in the
study were all contextual factors in that they are factors that cannot be easily changed
upon market entry and are typically made prior to market entry or early during market
entry. Other predictors included in the study were derived from D-League literature.
The methodology for this study utilized three separate multiple regression
equations to account for enough power in the study to detect an effect size if one existed.
The reason for not drawing a larger sample is that the researcher used the entire available
population for D-League franchises from 2001-2012. Similarly, the researcher did not
want to leave possible environmental predictors out of this initial study because of the
exploratory nature of the study and the theory. This methodology was not ideal because
not all predictors could be analyzed at once. However, the researcher believed that the

99
methodology being used was suitable because it is an investigative study and the first
study done on the NBA's Development League.
Implications of Results
The results from the three multiple regression analyses indicated that population
(POP), education level within the market (EDU), stadium size (SIZE), and team
ownership model (MOD) were all statistically significant predictors of the percentage of
attendance capacity for NBA Development League teams that have operated from 2001-
2012. It is important to note that though these predictors are statistically significant in the
individual equations there cannot be any conclusions drawn based on the predictors from
all three equations at once. The individual equations can only be interpreted based on the
group of predictors included in the individual multiple regression analysis.
For research question one it was found that size of population within the market
and education level within the market were identified as being statistically significant.
Researchers have found across many levels of professional sport there is a significant and
positive relationship between population and determining franchise placement, franchise
value, and/or attendance (Alexander & Kern, 2004; Branvold, Pan, and Gabert, 1997;
Bruggink & Zamparelli, 1999; Davis, 2006; Humphreys and Lee 2010; Humphreys and
Mondello 2008; Jones and Ferguson 1988; Miller, 2007; Miller 2009; Rascher, 2004;
Rascher, Baehr, Wolfe, and Frohwerk, 2006; Siegfriend and Eisenberg, 1980). The
finding that population was a predictor of attendance was not surprising. However, the
relationship with population is converse to what other studies have found. The
relationship between attendance and population had a negative and significant effect
across the D-league. This negative relationship was important and expected by the

100
researcher because the D-League looks to place franchises in small to mid-size markets.
On the contrary, major league teams often look for markets with larger populations which
is the reason that other research has found larger markets being predictors of increased
attendance or increased franchise value.
It was also not surprising to the researcher that median income was a statistically
significant predictor of attendance in the D-League when controlling for population and
education. Other researchers (Alexander & Kern, 2004; Davis, 2006; Humphreys & Lee,
2010; Miller, 2007; Miller, 2009; Rascher, 2004; Rascher, Baehr, Wolfe & Frohwerk) all
found income to be statistically significant predictors in their studies. In addition, the
average median household income for D-League markets was just over $45,000 per year.
This average is in sync with the demographic of NBA fans for median household income
indicated that 65% of their fans made over $40,000 (Thompson, 2014). The association
in median household income between the D-League and NBA is important because the
D-League uses similar ticket sales techniques and has the same target market as the NBA.
The finding of a statistically significant relationship with attendance and facility
size, it seemed to be in direct relation to what the D-League looks for when placing new
franchises. Small to mid-size arenas seem to be the most ideal for D-League teams. As
stated by the market analysis done by the city of Richmond, the D-League looks for
facility with approximately 6,000 seats and a curtain system (Barrett Sports Group,
2011). Furthermore, in looking at the average capacity of arenas in teams that are no
longer in operation compared to teams that are currently still operating the difference is
nearly double. Teams that are no longer in operation had an average capacity of 9438
seats compared to teams still operating averaging just 5700 seats.

101
The last regression equation indicated the ownership model of a team being
significant predictors of attendance. The results indicated that the hybrid ownership
model and the single affiliation model were both significant predictors. This finding is
not a revelation considering in 2012 that 11 of the 16 D-League teams had either a single
affiliation or hybrid affiliation. The hybrid and single affiliation models are expected to
continue to be the pattern as it increases the attention that D-League owners can place
towards the commercial side of their venture without having to worry about the
basketball operations side of owning a professional team (Lombardo, 2011). Further
indication of the hybrid and single affiliation models being the trend for D-League teams
are the New York Knicks and Detroit Pistons both acquiring D-League teams in 2014
with the plan of operating the D-League franchises under the hybrid ownership model.
For the predictors included in the study that were not found to be statistically
significant, the only one the researcher found surprising to not be a predictor of increased
attendance was competition within the market place. Even though Humphreys &
Mondello (2008) found a positive relationship between the number of leagues in a market
and higher franchise values, the researcher theorized that competition would be a crucial
factor in determining success. However, a possibility for not having a relationship may
be due to the small sample size and methodology used. It is quite possible if analysis was
done to consider teams in operation compared to teams no longer operating, the
competition within the market place may have an effect on success of a D-League team.
Another reason for competition maybe not being a significant predictor in this
study is the D-League teams have typically operated in smaller markets which leads to
less established sports teams. Unlike larger markets, the smaller markets may not
102
consistently house other sports teams; meaning other leagues, such as minor league
hockey, have the same issue as minor league basketball where teams enter and exit the
market regularly. Minor league firms are typically not as established in a market. It may
be beneficial to consider, instead of teams currently operating, but teams that have
operated in the past five years or a similar time frame. The reasoning behind recognizing
previously operating teams would allow for consideration to be given to the impact a
previously operating team may have left in the market place. Despite a team no longer
operating, a team may leave a negative stigma in the market place which could be
considered competition, or a barrier to entry, for future sports teams. As is the case of
market entry in economics, it is difficult to access which factors may affect the ease of
entrance into a market and even more difficult to measure the affect of such barriers
(Schmalensee, 1981). Thus, even though a team does operate within the same market as a
D-League team or did previously operate, the influence they have on the market could
largely vary from market to market. Also, it may be worth considering a wider variety
of leagues as competition to include any indoor football league, junior hockey, any
hockey league, and any soccer league. This study only considered the more established
leagues.
The last major implication that can be derived from this study is in reference to
the future direction of the D-League. It has been well documented one of the main goals
of the NBA D-League is for every NBA team to have a single-affiliate D-League team
(Lombardo, 2013). As of May, 2014 there were 18 D-League teams in operation. Of the
18 D-League teams operating in 2014, 15 of the teams have some type of single
affiliation ownership with a parent NBA club. With a total of 30 NBA teams in

103
operation, that leaves half of the NBA without a single affiliate D-League team. The
following is a list of NBA teams that do not have their own D-League team and a
proposed location for a potential D-League single team affiliate. The proposed locations
are based on markets that made the 2013 Top Minor League Market Rankings from
Sports Business Journal (SBJ) which have a population of 250,000 or less and are within
a four hour driving distance from the parent NBA team. The reason for considering the
SBJ list is because in the study 235 markets were considered based on attendance figures
from the five most recently completed seasons (“Top Minor League Markets: About this
Project”, 2013). Having a population of approximately 250,000 or less indicates a mid-
size city or smaller (Common Core of Data, 2014). Also, for expansion it has been
indicated that each NBA team will have a D-League team within driving distance to
alleviate logistical issues (Zillgitt, 2013).
Table 5.1 Proposed Cities for future D-League Expansion
NBA TEAM PROPOSED D-LEAGUE
LOCATION
POPULATION
(thousands)
DISTANCE FROM
NBA TEAM (miles)
Atlanta Hawks Savannah, GA 142,022 248
Charlotte Bobcats Winston-Salem, NC 234,349 79
Chicago Bulls Toledo, OH 287,208 246
Denver Nuggets Casper, WY 55,316 277
Indiana Pacers Fort Wayne, IN (Mad Ants) 254,555 120
Los Angeles Clippers Modesto, CA 201,165 61
Memphis Grizzlies Knoxville, TN 182,200 391
Milwaukee Bucks Appleton, WI 72,623 108
Minnesota Timberwolves Des Moines, IA (Energy) 203,433 243
New Orleans Pelicans Pearl, MS 25,092 189
Orlando Magic Clearwater, FL 107,685 106
Phoenix Suns San Bernardino, CA 209,924 298
Toronto Raptors Rochester, NY 210,565 169
Utah Jazz Idaho Falls, ID 136,108 214
Washington Wizards Harrisburg, PA 49,673 120
Note: Toledo and Fort Wayne both have populations slightly exceeding 250,000.
104
Future Direction
It is very obvious that the D-League is not the first sports leagues to struggle for
survival – nor will it be the last. The need for future and continuing studies on the D-
League and minor league basketball as a whole is apparent. The D-League represents the
first ever true minor league basketball system that has been endorsed by the NBA.
Studying the growth and development of a successful professional sports league, such as
the D-League, is very important as it provides insight to obstacles and successes that can
be shared among franchises. Moreover, as more professional sports leagues continue to
emerge it is pertinent, in the field of sport management and sport economics, to
understand the intricacies of franchise success and sustainability. The impact of studying
league success is vital not only to the D-League but other leagues within North America
and around the world.
One of the main future focuses should be on characteristics of franchise and
leagues that are successful outside of the four major leagues (NBA, NFL, NHL, and
MLB). Minor league sports are a very valuable and important part of the sports realm.
They offer, if structured properly, a system where players, coaches, officials, and all
employees can go through a training system for the parent major league or team. Also,
minor league sports, offer a family-friendly and affordable entertainment option for
communities. All of the D-League teams aside from one (Bakersfield Jam) play in public
facilities. If a community is considering constructing a new facility for housing a D-
League team, they need to absolutely understand what factors may help increase the
success of the facility and the team.

105
Though this study considered only environmental and economic characteristics as
predictors, it is possible that other factors could be major predictors of franchise success.
A future path of study would be to consider the entrepreneurial and staffing
characteristics of the D-League franchises. The global business environment for sport is
continually changing as it is filled with innovation and is constantly growing more
competitive. Thus, understanding entrepreneurship as it links to various aspects of sport
is important for sports organizations to grow (Ratten, 2010). Similarly, it would be
interesting to look at the entrepreneurial characteristics of D-League owners compared to
other minor league basketball owners and see if they differ. Comparing other minor
leagues to the D-League would be advantageous for leagues that are unaffiliated with the
four major leagues as they may rely more heavily on the entrepreneurial nature as
opposed to the brand extension like that of the NBA/D-League relationship.
Finally, there needs to be research that continues to explore the D-League and
characteristics linking the D-League to success. A future route of study may be to
consider the differences between D-League teams that have survived compared to teams
that have not survived. If similar theoretical framework were to be used however, the
issue of a limited sample size would still exist. Thus, other statistical methodologies
should be explored in the future or a model that considers the significant predictors from
this study could be considered.

106
References
2013 minor league markets: The rankings. (2013, August 12). Retrieved from
http://www.sportsbusinessdaily.com/Journal/Issues/2013/08/12/Research-and-
Ratings/Top-minor-league-markets.aspx
About the eba. (n.d.). Retrieved from http://www.easternbasketballalliance.com/about-
the-eastern-basketball-alliance/
Alexander, D. L., & Kern, W. (2004). The economic detemrinants of professional sports
franchises values. Journal of Sports Economics, 5(1), 51-66.
Al-Thibiti, Y. (2004). A scale development for sport fan motivation.
Amit, R., & Zott, C. (2001). Value creation in e-business.Strategic Management
Journal, 22, 493-520. doi: 10.1002/smj.187
Apostolopoulou, A. (2005). Vertical extension of sport organizations: The case of the
national basketball development league (nbdl). Sport Marketing Quarterly, 14,
57-61.
Audretsch, D. B. (1995). Innovation, growth and survival. International journal of
industrial organization, 13(4), 441-457.
Baade, R. A., & Sanderson, A. R. (1997). The employment effect of teams and sports
facilities. Sports, Jobs, and Taxes. The Economic Impact of Sports Teams and
Stadiums, 92-118.
Barret Sports Group, LLC. (2011, January 27). Arena market validation and financial
feasibility study. Retrieved from
http://www.richmondgov.com/PressSecretaryMayor/documents/RichmondReport
01-27-11-VolumeIofIII.pdf

107
Berry, W. D. (1993). Understanding regression assumptions (Vol. 92). Sage.
Bradford, B. (n.d.). Franchise info: Independent basketball association. Retrieved from
http://ibaball.net/index.php/about/franchise-info
Branvold, S. E., Pan, D. W., & Gabert, T. E. (1997). Effects of winning percentage and
market size on attendance in minor league baseball. Sports Marketing
Quarterly, 6(4), 35-42.
Bruggink, T. H., & Zamparelli, J. M. (1999). Emerging markets in baseball: An
econometric model for predicting the expansion teams. In E. Gustafson & L.
Hadley (Eds.), Sports Economics: Current Research (pp. 49-59). Westport:
Praeger Publishers.
Castrogiovanni, G. J. (1996). Pre-startup planning and the survival of new small
businesses: Theoretical linkages. Journal of management, 22(6), 801-822.
Chawla, S. K., Pullig, C., & Alexander, F. D. (1997). Critical success factors from an
organizational life cycle perspective: perceptions of small business owners from
different business environments. Journal of Business Entrepreneurship, 9(1), 47-
58.
Child, J. (1972). Organizational structure, environment and performance: the role of
strategic choice. Sociology, 6(1), 1-22.
Child, J. (1974). What determines organization The universals vs. the it-all-
depends. Organizational Dynamics, 3(1), 2-18.
Clairns, J., Jennett, N., & Sloane, P. J. (1986). The economics of professional team
sports: A survey of theory and evidence. Journal of Economic Studies, 13(1), 3-
80.

108
Cohen, J. (1988). Statistical power analysis for the behavioral sciences (2nd
ed.).
Hillsdale, NJ: Erlbaum
Cohen, J. (1992). A power primer. Psychological bulletin, 112(1), 155.
Cohen, J., Cohen, P., Aiken, L. S., & West, S. G. (2003).Applied multiple regression -
correlation analysis for the behavioral sciences. (3rd ed.). Lawrence Erlbaum
Associations, Inc.
Coates, D., & Humphreys, B. R. (2003). Professional sports facilities, franchises and
urban economic development. Public Finance and Management, 3(3), 335-357.
Cunningham, S., Cornwell, T. B., & Coote, L. V. (2009). Expressing Identity and
Shaping Image: The Relationship Between Corporate Mission and Corporate
Sponsorship. Journal of Sport Management, 23(1).
Dahlqvist, J., Davidsson, P., & Wiklund, J. (2000). Initial conditions as predictors of new
venture performance: A replication and extension of the Cooper et al.
study. Enterprise and Innovation Management Studies, 1(1), 1-17.
Davis, M. C. (2006). Called up to the big leagues: An examination of the factors affecting
the location of minor league baseball teams. International Journal of Sport
Finance, 1, 253-264.
Deveney, S. (2005, October 14). Sing the praises of a true minor league. Sporting News,
49.
D-league team index. (n.d.). Retrieved from http://www.basketball-
reference.com/nbdl/teams/
Eide, P. (2011, October 20). How isiah thomas killed the cba. Hoopsvibe, Retrieved from
109
http://www.hoopsvibe.com/features/articles/168248-how-isaiah-thomas-killed-
the-cba
Ellis, M., Braunstein, J., Zhang, J. J., Lam, E. T., & Williamson, D. (2003). Profile of
NBA full season ticket holders: sociodemographics, ticket ownership, games
consumption, and major factors affecting individual game attendance. Presented
(free communication) at.
Fahey, J., Farrelly, F., & Quester, P. (2004). Competitive advantage through sponsorship:
A conceptual model and research propositions. European journal of
Marketing, 38(8), 1013-1030.
Fearing, M. A. (2002, December 9). Kansas city professional basketball history.
Retrieved from http://www.angelfire.com/ks2/swbb/prokcbbhistory.html
Fields, A. (2010). Discovering statistics using SPSS. Sage publications.
Flagestad, A., & Hope, C. A. (2001). Strategic success in winter sports destinations: a
sustainable value creation perspective. Tourism management, 22(5), 445-461.
Freeman, J., Carroll, G. R., & Hannan, M. T. (1983). The liability of newness: Age
dependence in organizational death rates. American Sociological Review, 48(5),
692-710.
Fritsch, M., Brixy, U., & Falck, O. (2006). The effect of industry, region, and time on
new business survival- a multi-dimensional analysis. Review of Industrial
Organization, 28(1), 285-306.
Gibb, A. A. (1990). Small businesses in the uk. Informally published manuscript, Small
business Centre, Durham University Business School, United Kingdom.

110
Hannan, M. T., & Freeman, J. (1984). Structural inertial and organizational
change. American Sociological Review, 49(2), 149-164.
Hansen, H., & Gauthier, R. (1989). Factors Affecting Attendance at Professional Sport
Events. Journal of sport management, 3(1).
Headd, B., Nucci, A., & Boden, R. U.S. Census Bureau, The Business Dynamics
Statistics. (2007). What matters more exit rates or business survival rates?
Herstein, R., & Berger, R. (2013). Much more than sports: sports events as stimuli for
city re-branding. Journal of Business Strategy, 34(2), 38-44.
Howard, D. R., & Crompton, J. L. (2004). Financing sport. (2nd ed.). Fitness Information
Technology.
Humphreys, B. R., & Lee, Y. S. (2010). Franchise values in north american professional
sports leagues: Evidence from the repeat sales method. International Journal of
Sport Finance, 5, 280-295.
Humphreys, B. R., & Mondello, M. (2008). Determinants of franchise values in north
american professional sports leagues: Evidence from a hedonic price model.
Unpublished manuscript, Department of Economics, University of Alberta;
Florida State University.
Janas, M. (2011). The rocky road that is minor league basketball. The Sport Digest,
Retrieved from http://thesportdigest.com/2011/12/the-rocky-road-that-is-minor-
league-basketball/
Johnson, B., & Turner, L. A. (2003). Data collection strategies in mixed methods
research. Handbook of mixed methods in social and behavioral research, 297-
319.

111
Jones, D. L. (2002). Minor League Basketball Organizations: Making Them
Work (Masters Thesis, Rowan University).
Jones, G. (2010). Orgnaizational theory, design, and change. (6 ed.). Upper Saddle
River: Pearson Prentice Hall.
Jones, J. C. H., & Ferguson, D. G. (1988). Location and survival in the national hockey
league. The Journal of Industrial Economics, 36(4), 443-457.
Katz, Daniel, and Kahn R.L,. "Organizations and the system concept."The social
psychology of organizations 1 (1966): 14-29.
Kerin, R. A., Vardarjan, P. R., & Peterson, R. A. (1992). First-mover advantage: A
synthesis, conceptual framework, and research propositions. Journal of
Marketing, 56, 33-52.
KPMG LLP. (2007, February 28). Market and financial analysis for a proposed new
arena in downtown baltimore. Retrieved from
http://www.sbrnet.com/ProtectedPDF/appendix3.pdf
Krieger, D. (2012). The leagueology almanac 2011-2012. (pp. 61-110). United States
Kurtzman, J. (2005). Economic impact: sport tourism and the city. Journal of Sport
Tourism, 10(1), 47-71.
Land, K. C., Davis, W. R., & Blau, J. R. (1994). Organizing the boys of summer: The
evolution of US minor-league baseball, 1883-1990. American Journal of
Sociology, 781-813.
Lombardo, J. (2002). Cup's half full for new nbdl.Sports Business Journal, Retrieved
from http://m.sportsbusinessdaily.com/Journal/Issues/2002/02/20020218/This-
Weeks-Issue/Cups-Half-Full-For-New-NBDL.aspx

112
Littunen, H. (2000). Networks and local environmental characteristics in the survival of
new firms. Small Business Economics, 15(1), 59-71.
Lombardo, J. (2005). D-league: Nbdl changes name to emphasize nba affiliation. Sports
Business Journal, July(20), Retrieved from
http://www.sportsbusinessdaily.com/Daily/Issues/2005/07/Issue-205/Leagues-
Governing-Bodies/D-League-NBDL-Changes-Name-To-Emphasize-NBA-
Affiliation.aspx
Lombardo, J. (2009). Basketball decisions for d-league teams to shift to nba clubs. Sports
Business Journal, Retrieved from:
http://m.sportsbusinessdaily.com/Journal/Issues/2009/04/20090427/This-Weeks-
News/Basketball-Decisions-For-D-League-Teams-To-Shift-To-NBA-Clubs.aspx
Lombardo, J. (2009). D-league bullish on new ownership model. Sports Business
Journal, November(23), Retrieved from
http://www.sportsbusinessdaily.com/Journal/Issues/2009/11/20091123/This-
Weeks-News/D-League-Bullish-On-New-Ownership-Model.aspx
Lombardo, J. (2010). Reshaped d-league finding a foothold. Sports Business Journal,
November(15), Retrieved from
http://www.sportsbusinessdaily.com/Journal/Issues/2010/11/20101115/This-
Weeks-Issue/Reshaped-D-League-Finding-A-Foothold.aspx
Lombardo, J. (2011). D-leagues 11th season unfazed by lockouts. Sports Business
Journal,November(21), Retrieved from
http://www.sportsbusinessdaily.com/Journal/Issues/2011/11/21/Leagues-and-
Governing-Bodies/D-League.aspx

113
Lopez-Garcia, P., & Puente, S. (2006). Business demography in spain: Determinants of
firm survival. Unpublished manuscript, BancoDe Espana, Madrid, Spain.
MacDonald, J. M. (1986). Entry and exit on the competitive fringe. Southern Economic
Journal, 640-652.
Mason, D. S. (1999). What is the sports product and who buys it? The marketing of
professional sports leagues. European Journal of Marketing,33(3/4), 402-419.
McDonald, H. (2010). The Factors Influencing Churn Rates Among Season Ticket
Holders: An Empirical Analysis. Journal of sport management, 24(6).
Miller, P. (2007). Private financing and sports franchise values: The case of major league
baseball.Journal of Sports Economics, 8(5), 449-467. doi:
10.1177/1527002506292583
Miller , P. A. (2009). Facility age and ownership in major american team sports leagues:
The effect on team franchise values. International Journal of Sport Finance, 4,
176-191.
Montello, D. R., Goodchild, M. F., Gottsegen, J., & Fohl, P. (2003). Where's downtown?:
Behavioral methods for determining referents of vague spatial queries. Spatial
Cognition & Computation, 3(2-3), 185-204.
Muret, D. (2003). Nbdl thinks family. Sports Business Journal, October (20), Retrieved
from http://www.sportsbusinessdaily.com/Journal/Issues/2003/10/20031020/This-
Weeks-Issue/NBDL-Thinks-Family.aspx
Naismith, J., & Baker, W. J. (1941). Basketball it's origin and development . New York,
NY: Association Press.
114
National Center for Education Statistics, Common Core Data. (n.d.). Identification of
rural locales. Retrieved from website: http://nces.ed.gov/ccd/rural_locales.asp
Neale, W. C. (1964). The peculiar economics of professional sports: A contribution to the
theory of the firm in sporting competition and in market competition. The
Quarterly Journal of Economics, 1-14.
Nelson, M. R. (2009). The National Basketball League: A History, 1935-1949.
McFarland.
Newman, J. (n.d.). Reserve a market. Retrieved from http://www.abalive.com/reserve-a-
market/
Niesen, J. (2013, April 24). D-league evolving into true feeder system for nba. Fox Sports
Southwest, Retrieved from http://www.foxsportssouthwest.com/mobile/story/d-
league-evolving-into-true-feeder-syste?blockID=895269&tagID=11627
North, D., & Smallbone, D. (2000). The innovativeness and growth of rural SMEs during
the 1990s. Regional studies, 34(2), 145-157.
Own a team. (n.d.). Retrieved from http://thepbl.com/own-a-pbl-team/
Pedhazur, E. J., (1997). Multiple Regression in Behavioral Research (3rd ed.). Orlando,
FL:Harcourt Brace.
Pilato, G. (2013, Sep 2). Is the nba d-league a worthy investment for new, or existing
cable sports networks?. Retrieved from
http://www.ridiculousupside.com/2013/9/2/4680636/is-the-nba-d-league-a-
worthy-investment-for-sports-networks

115
Porter, Michael E., and Victor E. Millar. "How information gives you competitive
advantage." (1985).
Porter, M. E. (1981). The contributions of industrial organization to strategic
management. Academy of management review, 6(4), 609-620.
Rascher, Daniel A., "NBA Expansion and Relocation: A Viability Study of Various
Cities" (2004).Kinesiology (Formerly Exercise and Sport Science). Paper 20.
http://repository.usfca.edu/ess/20
Rascher, D. A., Baehr, M. J., Wolfe, J., & Frohwerk, S. (2006). An analysis of expansion
and relocation sites for major league soccer.International Journal of Sport
Management,7(1), 1-12.
Ratcliffe, M. US Census Bureau - Geography Division, (n.d.). Understanding "place" in
census bureau data products. Retrieved from website:
https://www.census.gov/developers/geo/understandingplace.pdf
Ratten, V. (2011). Sport-based entrepreneurship: towards a new theory of
entrepreneurship and sport management. International entrepreneurship and
management journal, 7(1), 57-69.
Rogoff, E. G., Lee, M. S., & Suh, D. C. (2004). “Who done it?” Attributions by
entrepreneurs and experts of the factors that cause and impede small business
success. Journal of Small Business Management, 42(4), 364-376.
Romanelli, E. (1989). Environments and strategies of organization start-up: effects on
early survival. Administrative Science Quarterly, 34(3), 369-387.
Rovell, D. (2001, February 8). Demise of the cba has been a long time coming. Retrieved
from http://espn.go.com/moresports/s/2001/0208/1071705.html

116
Roy, D. P. (2008). Impact of new minor league baseball stadiums on game
attendance. Sport Marketing Quarterly, 17, 146-153
Sack & Thiel, R. (1985). College~ asketbal and Role Conflict: A National
Survey.Sociology of Sport Journal, 2, 195-209.
Scarborough. (2012, April 10). Minor league baseball attracts a young, tech-oriented fan
base. Retrieved from http://dialog.scarborough.com/index.php/minor-league-
baseball-attracts-a-young-tech-oriented-fan-base/
Scheitrum, K. (2012). Reed interview, part ii: Developing a development league.
Retrieved from
http://www.nba.com.edgesuite.net/dleague/news/reed_q_and_a_developing_devel
opment_laegue_2012_06_21.html
Scheitrum, K. (2012, October 10). Go west, young men: Four reasons why the move
matters. Retrieved from
http://www.nba.com/dleague/news/go_west_young_men_four_reasons_why_sant
a_cruz_move_matters_2012_10_10.html
Schmalensee, R. (1981). Economies of scale and barriers to entry. The journal of political
economy, 1228-1238.
Scott, T., Mannion, R., Davies, H., & Marshall, M. (2003). The quantitative measurement
of organizational culture in health care: a review of the available
instruments. Health services research, 38(3), 923-945.
Shank, M. D. (2005). Sports marketing: A strategic perspective. Pearson/Prentice Hall.
117
Shapiro, S. L., DeSchriver, T., & Rascher, D. A. (2012). Factors affecting the price of
luxury suites in major North American sports facilities. Journal of Sport
Management, 26(3), 249-257.
Sharer, R. (2013, May 23). Iba, pbl to part ways. Retrieved from
http://www.pantagraph.com/sports/professional/basketball/minor/flex/iba-pbl-to-
part-ways/article_2ac5f5c8-c41c-11e2-9320-0019bb2963f4.html
Shepherd, D. A. (1999). Venture capitalists' assessment of new venture survival.
Management
Science, 45(5), 621-632.
Shoals, B. (2010). The undisputed guide to pro basketball history. (1 ed.). New York,
NY: Bloomsbury USA.
Siegfried, J., & Zimbalist, A. (2000). The economics of sports facilities and their
communities. The Journal of Economic Perspectives, 14(3), 95-114.
Slack, T., & Parent, M. M. (2006). Understanding sport organizations: The application
of organization theory. Human Kinetics.
Smallbone, D. & North D. (2000). The innovativeness and growth of rural SMEs during
the 1990s. Regional studies, 34(2), 145-157.
Small Business Advocacy. Office of Advocacy, (2011).Advocacy: the voice of small
business in government. Retrieved from website:
http://www.sba.gov/sites/default/files/sbfaq.pdf
Sorensen, H. T., Sabroe, S., & Olsen, J. (1996). A framework for evaluation of secondary
data sources for epidemiological research.International Journal of
Epidemiology, 25(2), 435-442.

118
Sterlacchini, A. (1994). Technological Opportunities, Intraindustry Spillovers And Firm
R&D Intensity: Some Evidence for Italian Manufacturing Industries.Economics of
Innovation and New Technology, 3(2), 123-138.
Stinchcombe, A.L. (2000), Social structure and organizations, in Joel A.C. Baum, Frank
Dobbin (ed.) Economics Meets Sociology in Strategic Management (Advances in
Strategic Management, Volume 17), Emerald Group Publishing Limited, pp.229-259
Stearns, T. M., Carter, N. M., Reynolds, P. D., & Williams, M. L. (1995). New firm
survival:
Industry, strategy, and location. Journal of Business Venturing, 10, 23-42.
Stewart, M. (1998). Basketball: A history of hoops. Danbury, CT: Franklin Watts.
Teece, D. J., Rumelt, R., Dosi, G., & Winter, S. (1994). Understanding corporate
coherence: Theory and evidence. Journal of Economic Behavior &
Organization, 23(1), 1-30.
Titlebaum, P., Lawrence, H., Moberg, C., & Ramos, C. (2013). Fortune 100 Companies:
Insight into Premium Seating Ownership. Sport Marketing Quarterly, 22(1).
The wba mission. (n.d.). Retrieved from http://www.wbaball.net/
Thompsen, I. (2013, January 10). Nba teams embracing d-league more than ever. Sports
Illustrated, Retrieved from
http://sportsillustrated.cnn.com/nba/news/20130110/nba-d-league-portland-trail-
blazers-nolan-smith/
Thompson, B., Diamond, K. E., McWilliam, R., Snyder, P., & Snyder, S. W. (2005).
Evaluating the quality of evidence from correlational research for evidence-based
practice. Exceptional Children, 71(2), 181-194.

119
United States Census Bureau, (2013). Definitions and explanations of terms. Retrieved
from website: http://www.census.gov/main/www/glossary.html
US Small Business Administration, (2011). Advocacy: The voice of small business
government. Retrieved from The Small Business Advocate website:
http://www.sba.gov/sites/default/files/sbfaq.pdf
Wakefield, K. L. (2007). Team sports marketing. (p. 86). Oxford, UK: Butterworth-
Heinemann.
Waldstein, D. (2009, February 8). Continental basketball association confronts an
uncertain future. New York Times. Retrieved from
http://www.nytimes.com/2009/02/09/sports/basketball/09cba.html?_r=0
Warden, S. (2013, May 1). Record year for d-league.Journal Gazette. Retrieved from
http://www.journalgazette.net/article/20130501/BLOGS17/130509961
Zhang, J. J., Pease, D. G., Hui, S. C., & Michaud, T. J. (1995). Variables affecting the
spectator decision to attend NBA games. Sport Marketing Quarterly, 4, 29-40.
Zillgitt, J. (2013, Nov 21). Nba devleopment league tips off with more teams, hope. USA
Today. Retrieved from
http://www.usatoday.com/story/sports/nba/2013/11/21/nba-development-league-
season-opens-future-expansion/3667557/
Zimmerman, M. A., & Zeitz, G. J. (2002). Beyond survival: Achieving new venture
growth by building legitimacy. The Academy of Management Review, 27(3), 414-
431.