the effect of free delivery services on partograph
TRANSCRIPT

THE EFFECT OF FREE DELIVERY SERVICES ON PARTOGRAPH
UTILIZATION AT NAIVASHA DISTRICT HOSPITAL
BY
DR. MAINA SAMMY KIGOTHO
H58/84036/2012
A DISSERTATION SUBMITTED TO UNIVERSITY OF NAIROBI IN PARTIAL
FULFILLMENT OF THE REQUIREMENT OF MASTER OF OBSTETRICS AND
GYNECOLOGY
2016

ii
DECLARATION
I declare this dissertation does not incorporate without acknowledgement, any material
previously submitted for a degree or diploma in any university and that to the best of my
knowledge, it does not contain any material previously published or written by another except
where due reference has been made in the text. It is the product of my own research
endeavors with the guidance of my supervisors.
Dr. Maina Sammy Kigotho
MMed registrar, Department of Obstetrics and Gynecology, School of Medicine
University of Nairobi
Signature: ___________________
Date: ____________________

iii
CERTIFICATE OF SUPERVISION
This is to certify that the dissertation was researched upon by Dr. Maina Sammy Kigotho
under my supervision and that this dissertation is submitted for review with my approval.
1. Prof. Patrick M. Ndavi
MBChB, MMed Obs & Gyn, MSc. Epid., FHBR, DLSHTM
Associate Professor, Department of Obstetrics and Gynecology, School of Medicine
University of Nairobi
Signature: __________________________ Date: _________________________
2. Dr. Onesmus Gachuno
MBchB, MMed Obs & Gyn, DPRM
Senior Lecturer, School of Medicine, University of Nairobi
Signature: ________________________ Date: __________________________

iv
CERTIFICATE OF AUTHENTICITY
This is to certify that this dissertation is the original work of Dr. Maina Sammy Kigotho,
registration number: H58/84036/2012, a Master of Medicine student in the Department of
Obstetrics and Gynecology, College of Health Sciences, University of Nairobi. The research
was carried out under the supervision of Prof. M. Ndavi and Dr. O. Gachuno. It has not been
presented to any other university for award of a degree.
Prof. Omondi Ogutu,
Associate Professor of Obstetrics and Gynecology,
Consultant Obstetrician and Gynecologist,
Chairman, Department of Obstetrics and Gynecology, University of Nairobi
Signature: __________________________ Date: _________________________

v
© 2015 by Dr. Maina Sammy Kigotho
All rights reserved. No part of this dissertation may be reproduced, stored in any retrieval
system or transmitted in any form or by any means, electronically, mechanically, by
photocopying or otherwise, without prior written permission of the author or University of
Nairobi-Obstetrics and Gynecology department on that behalf.

vi
DEDICATION
I dedicate this work to my family: Anne Maina, the late John Maina, Lillian Maina and
Mercy Wangechi, for their support and encouragement throughout the course of my studies.
Thank you also to my other sisters and brothers who have given strength to my revelatory
knowledge and wisdom. Without them, I would not be the person that I am and I would not
be able to reach where I am going to reach.

vii
ACKNOWLEDGEMENT
I wish to thank Partnership in Innovative Medicine Education in Kenya (PRIME-K), linked
award-strengthening Maternal, Newborn and Child Health (MNCH) for their support and
mentorship in my research.
I am also thankful to my two supervisors: Prof. Muia Ndavi and Dr. Onesmus Gachuno for
their encouragement, guidance and support during the writing up of this dissertation.
Lastly, I offer my regards and blessings to all University of Nairobi, Obstetrics and
Gynecology lecturers, who contributed greatly to my understanding of my specialization
area.

viii
TABLE OF CONTENTS
DECLARATION..................................................................................................................... II
CERTIFICATE OF SUPERVISION .................................................................................. III
DEDICATION....................................................................................................................... VI
ACKNOWLEDGEMENT ................................................................................................... VII
TABLE OF CONTENTS .................................................................................................. VIII
LIST OF FIGURES .............................................................................................................. XI
LIST OF TABLES ............................................................................................................... XII
LIST OF ABBREVIATIONS AND ACRONYMS ......................................................... XIII
DEFINITION OF KEY TERMS ...................................................................................... XIV
ABSTRACT .......................................................................................................................... XV
CHAPTER ONE ...................................................................................................................... 1
1.0 INTRODUCTION.............................................................................................................. 1
1.1 THE KENYAN MATERNAL HEALTH SITUATION .................................................................... 1
1.2 INTRODUCTION OF FREE MATERNAL HEALTH CARE IN KENYA ............................................ 3
1.3 THE PARTOGRAPH AS A QUALITY ASSESSMENT AND ASSURANCE TOOL .............................. 3
CHAPTER TWO ..................................................................................................................... 5
LITERATURE REVIEW ....................................................................................................... 5
2.0 INTRODUCTION .................................................................................................................. 5
2.1 IMPACT OF FREE MATERNAL HEALTH CARE – THE EXPERIENCE OF OTHER LOW AND
MIDDLE INCOME COUNTRIES .................................................................................................... 5
2.2 MEASURING THE QUALITY OF MATERNAL HEALTH CARE.................................................... 8
2.3 PARTOGRAPH FOR INTRAPARTUM LABOUR MONITORING ................................................. 10
2.5 OPERATIONAL FRAMEWORK ............................................................................................ 14
2.6 RESEARCH JUSTIFICATION ................................................................................................ 15
2.7 RESEARCH QUESTION ....................................................................................................... 16
2.8 NULL HYPOTHESIS ........................................................................................................... 16
2.9 GENERAL OBJECTIVE ........................................................................................................ 16

ix
2.9.1 Specific objectives. .................................................................................................. 16
CHAPTER THREE ............................................................................................................... 17
RESEARCH METHODOLOGY ......................................................................................... 17
3.1 RESEARCH DESIGN ........................................................................................................... 17
3.2 STUDY POPULATION ......................................................................................................... 17
3.3 STUDY SITE AND SETTING ................................................................................................ 18
3.4 SAMPLE SIZE AND SAMPLING PROCEDURE ........................................................................ 18
3.5 DATA COLLECTION PROCEDURES AND INSTRUMENTS ....................................................... 20
3.6 DATA ANALYSIS AND REPORTING ..................................................................................... 21
3.6 ETHICAL ISSUES ............................................................................................................... 22
3.7 STUDY LIMITATION .......................................................................................................... 23
CHAPTER FOUR .................................................................................................................. 24
RESULTS ............................................................................................................................... 24
4.0 FACILITY DELIVERIES....................................................................................................... 24
4.1 BIODATA .......................................................................................................................... 24
4.2 COMPLETENESS OF PARTOGRAPHS ................................................................................... 26
4.3 ADEQUACY OF FILLING IN PARTOGRAPHS ......................................................................... 26
4.3.1 Fetal heart rate ......................................................................................................... 26
4.3.2 Progress of labour .................................................................................................... 27
4.3.3 Maternal parameters ................................................................................................ 28
4.3.4 Neonatal parameters ................................................................................................ 29
4.3.5 Other parameters ...................................................................................................... 31
4.4 INTERVENTION CHARACTERISTICS ................................................................................... 33
4.5 OUTCOME ........................................................................................................................ 34
4.5.1 Apgar score .............................................................................................................. 35
CHAPTER FIVE ................................................................................................................... 37
DISCUSSION ......................................................................................................................... 37
5.0 FACILITY DELIVERIES....................................................................................................... 37
5.1 COMPLETION OF PARTOGRAPHS BEFORE AND AFTER INTRODUCTION OF FREE MATERNAL
HEALTH CARE ........................................................................................................................ 38
5.2 ADEQUACY OF FILLING OF PARTOGRAPH PARAMETERS .................................................... 39

x
5.3 INTERVENTION CHARACTERISTICS ................................................................................... 40
CONCLUSION ...................................................................................................................... 42
RECOMMENDATIONS ....................................................................................................... 42
REFERENCES ....................................................................................................................... 43
APPENDIX ............................................................................................................................. 49
APPENDIX I: PARTOGRAPH TOOL .......................................................................................... 49
APPENDIX II: QUESTIONNAIRE .............................................................................................. 50
APPENDIX III: DUMMY TABLE FOR RESULTS ........................................................................ 55
APPENDIX III: TIMELINE ........................................................................................................ 59
APPENDIX IV: BUDGET .......................................................................................................... 60
APPENDIX V: KNH ETHICAL APPROVAL LETTER…………………………………………61

xi
LIST OF FIGURES
Figure 1.1: Donabedian framework for assessing quality in healthcare .................................... 9
Figure 1.2: Conceptual Framework for the impact of free delivery services on partograph
utilization .............................................................................................................. 14
Figure 1.3: Operational framework for the impact of free delivery services on intrapartum
monitoring using the partograph (Source: Author,2015) ..................................... 14
Figure 5.1: Trend in delivery by skilled provider and delivery at a health center (KDHS,
2014) ..................................................................................................................... 38
Figure 5.2: Trends in Neonatal Mortality (KDHS, 2014) ........................................................ 41

xii
LIST OF TABLES
Table 1.1: Proportion of births assisted my medically trained personnel .................................. 2
Table 4.1 : Facility deliveries at Naivasha District Hospital as per the specified period ........ 24
Table 4.2 : Age distribution of mothers delivering in Naivasha District Hospital according to
delivery period ...................................................................................................... 25
Table 4.3 : Distribution of mothers delivering at Naivasha District Hospital according to
gravidity and delivery period ............................................................................... 25
Table 4.4 : Overall completeness of partographs before and after introduction of free delivery
services in Naivasha District Hospital .................................................................. 26
Table 4.5 : Adequacy of documentation of fetal heart rate in the periods before and after
introduction of free delivery services ................................................................... 27
Table 4.6 : Adequacy of documentation of progress of labour using partographs in Naivasha
District Hospital before and after introduction of free delivery services ............. 28
Table 4.7: Adequacy of documentation of maternal vital signs in the periods before and after
introduction of free maternal services .................................................................. 29
Table 4.8 : Documentation of newborn data in the periods before and after introduction of
free delivery services ............................................................................................ 30
Table 4.9 : Adequacy of filling in progress of labor in the periods before and after
introduction of free delivery services ................................................................... 32
Table 4.10 : Intervention based on partograph findings before and after introduction of free
delivery services ................................................................................................... 33
Table 4.11: Maternal delivery outcomes in the periods before and after introduction of free
delivery services ................................................................................................... 34
Table 4.12 : Documented caesarean section rates before and after introduction of free
delivery services ................................................................................................... 35
Table 4.13: Newborn outcomes during the periods before and after introduction of free
delivery services ................................................................................................... 35
Table 4.14 : Comparison of Study Findings ............................................................................ 36

xiii
LIST OF ABBREVIATIONS AND ACRONYMS
ANC - Antenatal Care
BP - Blood Pressure
EmCS - Emergency Caesarian Section
EMoC - Emergency Obstetric Care
FDS - Free Delivery Services
FHR - Fetal Heart Rate
FMC - Free Maternal Healthcare
GoK - Government of Kenya
KDHS - Kenya Demographic Health Survey
KNCHR - Kenya National Commission on Human Rights
KNH - Kenyatta National Hospital
MMR - Maternal Mortality Ratio
MDG - Millenium Development Goal
PR - Pulse Rate
SIRCLE - Health Services Implementation Research and Clinical Excellence
SMDP - Safe Motherhood Demonstration Project
SVD - Spontaneous Vaginal Delivery
UoN - University of Nairobi
WHO - World Health Organization

xiv
DEFINITION OF KEY TERMS
Partograph: The partograph is a graphical tool for monitoring of the progress of labour as
well as maternal and foetal well-being and serves as an early warning system and assists in
early decision making for intervention or transfer.
Structure indicators: Indicators that measure the organizational, material, human and
intellectual resources needed to provide care
Process indicators: Indicators used to measure the activities used to provide care. These
processes need structural inputs to be done effectively.
Outcome indicators: Indicators used to measure the results of the health care processes.
Fetoscope: Apparatus used for the physical taking of the fetal heart rate. It is usually placed
on the abdomen and the user deciphers the fetal heart rate by placing his/her ear on the
apparatus while on the abdomen of the mother.
APGAR score: A measure of the physical condition of a newborn infant. It is obtained by
adding points (2 or 1 or 0) for heart rate, respiratory effort, muscle tone, response to
stimulation and skin coloration; a score of ten represents the best possible condition.

xv
ABSTRACT
Background: The Kenyan Maternal Mortality Ratio is estimated at 488/100,000 live births.
Millennium Development Goals 4 and 5 to reduce child mortality and improve maternal
health, remain important global health challenges and ensuring skilled birth attendance is a
crucial intervention for achieving these goals. In order to try to circumvent one of the barriers
to increased skilled birth attendance, the Government of Kenya, on June 1st 2013, initiated a
policy of free maternity services in all public facilities, effective immediately.
Purpose of the Study: The study aims at assessing the effect of initiation of free delivery
services at Naivasha District Hospital (county hospital in Naivasha-Kenya, a peri-urban area)
by measuring a key process indicator for delivery services, partograph utilization, before and
after the initiation of free maternity care.
Methodology: A before and after design (quasi-experimental design) was used in which,
partograph data for two groups were collected at two different but commensurate periods in
the period before and after initiation of free delivery services policy (“After” period: July to
September 2013 and October to December 2013; “Before” period: July to September 2012
and October to December 2012). The study site was Naivasha District Hospital (model Level
4 county hospital). Partographs in the stipulated periods were retrieved, and randomly
sampled to obtain the calculated sample size. Using a structured questionnaire, data from the
partograph was extracted for: completeness, adequacy of filling, intervention characteristics
(timeliness and appropriateness) and outcome indicators (delivery outcome and fetal
outcome). The data were analyzed for descriptive statistics and tests of association carried
out. The results for the „before‟ and „after‟ period were then compared for any similarities or
significant differences.
Results: There was a statistically significant decrease in the overall completeness of the
partographs both in the immediate post-intervention period (28.4% to 10.2%) and short term
post-intervention period (36.4% to 20.5%). Adequacy of filling of the fetal heart rate and
progress of labour parameters was generally adequate (>70%) and there were no major
differences both in the immediate term and short term post-intervention periods. Adequacy of
filling of the maternal parameters was generally inadequate (<50%) and there was no
statistically significant change in its recording both in the immediate term and short term.

xvi
Overall recording of the neonatal parameters was generally adequate (>80%) and there was
no major change in its recording in the immediate and short term post-intervention. There
was also no significant change in the intervention characteristics (timeliness/appropriateness
of intervention). There was a slight rise in the SVD rate in the immediate term (89.8% to
90.9%), but a slight decline in the short term (93.2% to 78.4%). There was a decrease that
was not statistically significant (P=0.301) in the emergency caeserian rate in the short term
(10.2% to 5.9%) and a statistically significant (P=0.047) rise in the short term (6.8%-16.9%).
There was a slight rise in the bad APGAR scores at 5 minutes in both the immediate term
(5.7%-8.0%) and short term (3.4% to 6.8%). These changes were however not statistically
significant (P=0.159)
Conclusion: Overall completeness of the partographs decreased both in the immediate and
short term after introduction of free delivery services. There was also a slight rise in the bad
APGAR scores. Despite these compromises, there were no significant changes in terms of
adequacy of filling of most of the partograph parameters and intervention characteristics.

1
CHAPTER ONE
INTRODUCTION
1.1 The Kenyan Maternal Health Situation
The Maternal Mortality Ratio as per KDHS 2008-09 is estimated to be 488 per 100,000 live
births. The fifth Millennium Development Goal is to reduce the maternal mortality ratio by
75 percent between 1990 and 2015.1 The aforementioned MMR is still significantly high and
a key strategy to reducing it is to ensure delivery by skilled staff. 2008-2009 KDHS data
suggest that 44% of births are managed by health professionals and 43% are delivered at a
health facility; 56% of deliveries occur at home.1
Skilled pre-conception, ante-natal, delivery and post-delivery care is important in reducing
complications rate to the mother and the baby. Increasing the delivery number in health
facility settings is therefore an important factor in decreasing health risk encountered during
the delivery process.1
KDHS 2008-09 findings as per some of the factors contributing to where deliveries occurred
(home versus health facility) were: parity status (higher parity increased the chances of the
delivery occurring at home); rural versus urban status (deliveries in rural settings are more
likely to occur at home); wealth quantile of the mother (the higher the wealth quantile, the
less likely for the delivery to occur at home); level of education of the mother (the higher the
education, the more likely for the delivery to occur in a health facility); number of antenatal
visits (mothers who had more antenatal visits are more likely to deliver at a health facility).

2
Main reasons cited by women in the survey (KDHS 2008-2009) for not delivering in a health
facility include: Distance being too far or lack of transport or both (42 percent) and that it was
not necessary (21 percent). Cited frequently also was labor occurring too quickly (18 percent)
and high cost (17 percent). Few women quoted: lack of female providers, it not being
customary to delivery in a health facility, family prohibition, poor service quality or health
facility not being open as factors contributing to them not delivering in a health facility.1
Women in urban centers for example Nairobi (Capital city of Kenya) are more likely to cite
cost as a factor to not delivering in a health facility than women in a rural area for example
North Eastern region (pastoral area in Kenya). Women in North Eastern region are less likely
to cite cost as a factor, but more likely to cite distance and poor service quality as their
reasons for not delivering in a health facility.5 Abrupt deliveries is more of a factor in more
educated and wealthier women than they are for those with less education and wealth1
Regional differences exist in level of skilled birth attendance in the various regions in Kenya
(Table 1.1). The main reasons contributing to this being: the urban/rural status of the town,
wealth quantile of the people in the region and level of education. The unique feature of the
North Eastern region is that: although 32% of the deliveries are attended by a skilled
provider, only 17% occur in a health facility. A sizeable number of deliveries are attended by
skilled providers at home.
Table 1.1: Proportion of births assisted my medically trained personnel1
Province Doctor Nurse/Midwife Other Health
Worker
Total (%)
Nairobi 33.7 55.2 0.1 89
Central 45.0 28.8 0.1 73.9
Coast 21.3 24.3 0.2 45.8
Eastern 16.9 26.2 0.0 43.1
Nyanza 13.5 32.0 1.5 47
Rift Valley 10.0 23.7 0.4 34.1
Western 5.5 20.3 0.1 25.9
North Eastern 1.0 30.6 0.7 32.3

3
1.2 Introduction of free maternal health care in Kenya
Reduction of child mortality and improving of maternal health (MDG 4 and 5), remain
primary global health challenges.2 Ensuring skilled delivery care is a crucial intervention for
achieving these goals. 3,4
Before the introduction of free delivery care, a point of note had been made that, despite
Kenya having a high antenatal attendance rate (92%), most of these mothers end up not
delivering under a skilled health attendant. Not delivering under a skilled attendant
contributes to the high maternal deaths, since most of these deaths occur due to treatable and
preventable causes including: obstructed labour, hypertension in pregnancy and its
complications, infection, haemorrhage and unsafe abortion.
Government of Kenya, on 1st June 2013, and with immediate effect, initiated a policy of free
delivery services in all public health facilities. This was done in order to circumvent one of
the barriers to skilled delivery care. Effects of the implementation of this policy were felt
almost immediately with the Director of Public Health and Sanitation reporting increases in
facility deliveries ranging between 10% to 50%.5 Some facilities, for example Kenyatta
National Hospital (KNH; Kenya‟s national referral hospital), reported even higher numbers.
KNH reported increases of almost 100% in the clients seeking maternal care5
1.3 The partograph as a quality assessment and assurance tool
Kenya‟s MMR is still high-448/100,000 live births as per the KDHS 2008-09. A significant
cause of maternal mortality in the Kenyan population is: prolonged labor. Others include:
hemorrhage, infection and pre-eclampsia/eclampsia.6,7

4
Prolonged labor can lead to the following complications: ruptured uterus, exhaustion,
dehydration, maternal infection and obstructed labor. It can also lead to neonatal infection.8
Obstructed labor results from a disproportion between the presenting part and the
encountered pelvic diameter. World Health Organization recent data approximate 8% of
maternal deaths as being attributable to obstructed labor.9
Management of labor using a partograph, a chart for recording information about the
maternal status, fetal status and progress of labor, is a key instrument in prevention and
management of prolonged labor and its complications (post-partum haemorrhage, sepsis,
obstructed labor, uterine rupture).1 Prompt detection of abnormal progress of labor will
prevent prolonged labor and its sequelae: all of which are major causes of maternal mortality
and morbidity.8,9,10

5
CHAPTER TWO
LITERATURE REVIEW
2.0 Introduction
This section discusses the various pertinent literatures to the study. It starts by discussing the
various experiences of the different countries (low and middle income) that have
implemented free maternal health care. It then discusses various literatures as pertains the
assessment of quality of care in health. It then concludes by discussing various literature on
the significance, use and levels of utilization of the partograph as an intra-partum monitoring
tool.
2.1 Effect of Free Maternal Health Care
Due to its unpredictable, yet essential nature, the cost of delivery can represent a significant
challenge to especially the low and middle income household.
User fees for health services were introduced or substantially increased in many low-income
countries in the 1980s and early 1990s as part of structural adjustment policies promoted by
the World Bank11
and in African countries in particular following the 1987 joint World
Health Organization/United Nations Children‟s Fund Bamako Initiative.12
The Bamako
Initiative aimed to address severe problems in the financing of primary health care including
maternity care. User charges for essential drugs were introduced to generate funds to improve
the quality of health services and equity in access to these services. Recently, however,
numerous countries in sub-Saharan Africa have officially abolished or reduced user fees for
childbirth services with the aim of increasing skilled birth attendance and reducing the
catastrophic costs of emergency delivery care.
6
Dzakpasu (2013) et al.13
did a systematic review of 20 studies dealing with the “impact of user
fees on maternal health service utilization and related outcomes in low and middle income
countries.” The study reported the following outcomes in these key areas of maternal health:
Impact on antenatal care
Generally, ANC visits tended to increase with fee abolition and decrease on fee introduction.
Exceptions to the above trend were: an increase in ANC attendance at a Cambodian hospital
following fee introduction (postulated to be due to improved quality and substitution of
formal fees with informal fees)14
, and after abolition of fees, “no effect on the use of a mobile
clinics serving 14 rural communities in South Africa”(fees were initially low, so abolition of
fees did not represent a significant enough cost saving to counteract and ongoing trend of
decreased ANC use)15
and following fee abolition, an un-sustained increase in visits in
Afghanistan (attributable to the fact that ANC services had largely been free even before the
fee abolition).16
Impact on facility deliveries
The general trend noted was that there was a decrease in facility deliveries with introduction
of fees and an increase with abolition of fees. Exceptions were the study in a Cambodian
Hospital hospital where the reverse was noted: an increase in facility deliveries following fee
introduction and quality care improvements14
, and three other studies in Cambodia17
, South
Africa18
and BurkinaFaso19
which showed temporal and geographic fluctuations in facility
delivery but no overall impact following fee changes.

7
After institution of fees, two hospital studies in urban Nigeria noted an increase in the number
of delivery admissions with complications20,21
. Ekwempu et al. (1990)20
noted this pattern
despite an increase in the number of midwives and the number of obstetricians remaining
constant. Both studies suggested that this trend was due to reduced and delayed health-
seeking behavior due to the financial burden imposed by fee introduction. In Ghana22, 23, 24
,
Senegal25
and Nepal26
, following removal or reduction in fees, a rising number of pregnant
patients with complications (haemorrhage, hypertensive disease in pregnancy, caeserian
section rate) was noted. In these studies, the percentage increase in attended deliveries with
complications was always higher than the percentage increase in facility deliveries
overall22,23,24
.
Effects on maternal and perinatal mortality
An increase in the maternal and perinatal deaths following fee introduction was noted in the
two Nigerian Hospital studies.20,21
On the other hand, Bosu et al. (2007)23
, following fee
exemption, reported reductions in delivery-related mortality ratios and institutional MMR in
Ghana‟s Central and Volta regions. Acknowledgement however was made that there had
been already a downward trend in MMR even before fee abolition. Daponte et al. (2000)27
,
however, found that the institutional MMR at a South African tertiary hospital increased
following fee removal. It was postulated that: an increase in patient load was not backed up
by a corresponding increase in staff and other facility resources, and thus quality of care
deteriorated.

8
Effects on inequality
One study in Ghana showed that facility deliveries increased in all wealth quantiles following
fee abolition; however, this did not consistently result in reduction in inequality.28
Dzakapsu et al. (2013)13
systematic review had the following conclusions: “Most studies to
evaluate the impact of user fees on utilization of maternal health services employ poor
methods and therefore cannot produce reliable estimates of effect. Nevertheless, consistency
in the direction of effects provided some evidence that removal of fees increases facility
delivery in particular, and may also increase the number of managed delivery complications.
Few studies look at impact of user-fees on related health outcomes or on equity in access to
care. User fee changes are often large-scale programs which are best evaluated using
interrupted time series or controlled before-and-after study designs both of which facilitate
estimating effect sizes net of temporal trends. Impacts on facility delivery must be evaluated
jointly with indicators of quality of care, access to emergency obstetric care and equity for a
comprehensive understanding of user fee effects.”
2.2 Measuring the quality of maternal health care
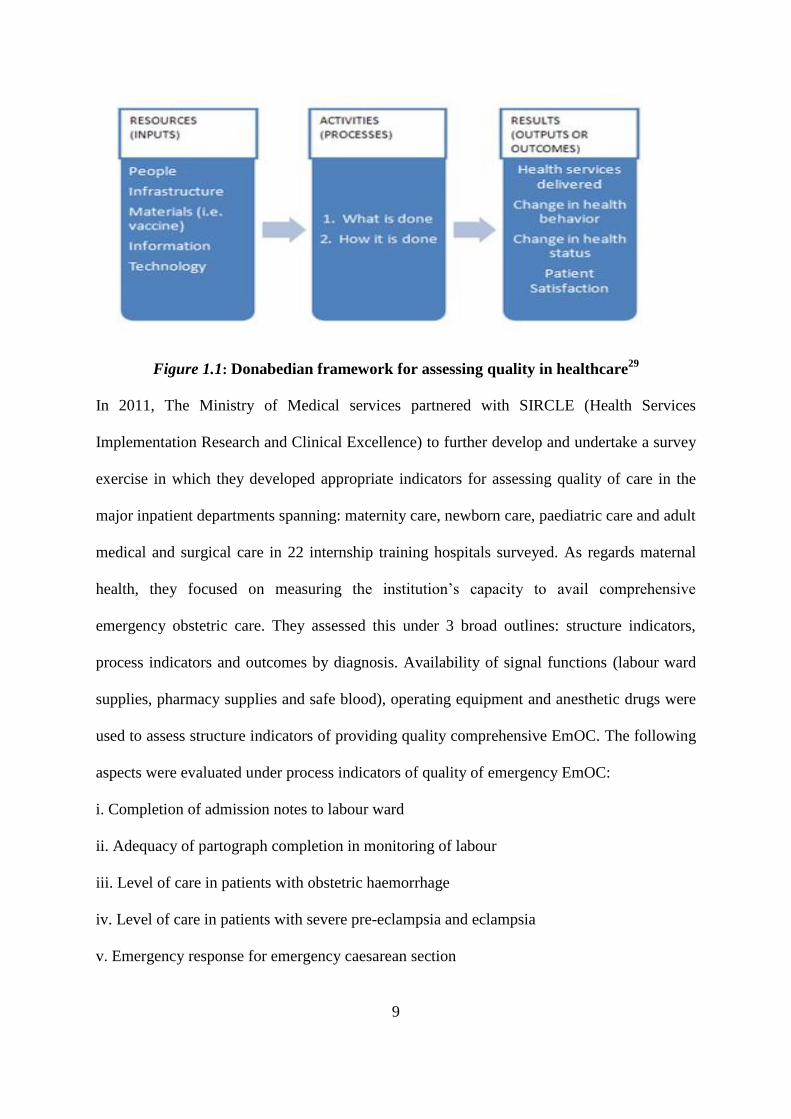
Donabedian model (1988)29
measured quality of care in terms of: (i) Structure or inputs- the
organizational, material, human and intellectual resources needed to provide care (ii)
processes, the activities in which these resources are used to provide care and (iii) outcomes,
the results of the activities. Health care processes eventually result in health impacts.
The structure components input into the processes; and the processes influence the outcomes.
The goal of quality improvement is to produce better outcome; better outcomes are achieved
by improving the processes that lead to the outcome of interest.
9
Figure 1.1: Donabedian framework for assessing quality in healthcare29
In 2011, The Ministry of Medical services partnered with SIRCLE (Health Services
Implementation Research and Clinical Excellence) to further develop and undertake a survey
exercise in which they developed appropriate indicators for assessing quality of care in the
major inpatient departments spanning: maternity care, newborn care, paediatric care and adult
medical and surgical care in 22 internship training hospitals surveyed. As regards maternal
health, they focused on measuring the institution‟s capacity to avail comprehensive
emergency obstetric care. They assessed this under 3 broad outlines: structure indicators,
process indicators and outcomes by diagnosis. Availability of signal functions (labour ward
supplies, pharmacy supplies and safe blood), operating equipment and anesthetic drugs were
used to assess structure indicators of providing quality comprehensive EmOC. The following
aspects were evaluated under process indicators of quality of emergency EmOC:
i. Completion of admission notes to labour ward
ii. Adequacy of partograph completion in monitoring of labour
iii. Level of care in patients with obstetric haemorrhage
iv. Level of care in patients with severe pre-eclampsia and eclampsia
v. Emergency response for emergency caesarean section

10
Under partograph completion in monitoring of labor, of the abstracted case files, 364 patients
were required to use a partograph, out of these 333 (96%) used the partograph. Table 2 shows
the results of adequacy of partograph completion with a median (IQR) score of 7 out of 10
(2-9). Cervical dilatation, contraction and foetal heart rate were recorded in more than 70% of
cases. Liqour, degree of moulding, maternal temperature and respiratory rate were
inadequately documented.
Table 1.2: Adequacy of completion of partograph as per results of the SIRCLE survey30
Variable scored atleast one observation
recorded (N=333)
% of time documented
i. Cervical Dilatation 73
ii. Contractions 72
iii. Fetal Heart Rate 71
iv. Maternal Blood Pressure 67
v. Fetal Head Descent 65
vi. Maternal Pulse Rate 59
vii. * Liquor 48
viii. * Degree of moulding 36
ix. * Maternal Temperature 42
x. * Maternal Respiratory Rate 31
*Done in ≤ 50% of cases
2.3 Partograph for intrapartum labour monitoring
The partograph is a graphical tool for monitoring progress of labor, maternal and fetal well
being during labor. It serves as an “early warning system” and assists in early decision
making for transfer or intervention.31
Ministry of Health-Kenya, in 1995, introduced as a
policy a modified partograph for labour management and monitoring.

11
A multi-centre WHO study involving over 35,000 study participants had findings that
suggested that the partograph is beneficial in reducing: intra-partum still births, reducing
augmented labor, prolonged labor and emergency caeserian sections (EMCS)32,33
.
Wasike(1991)34
study locally collaborated the above findings .
Safe motherhood Demonstration Project (SMDP) in Western Kenya 2000-01 showed that
training improves partograph utility (11% utilization before SMDP; 85% utilization during
SMDP)35
.
A cross-sectional study by Qureshi et al. (2012)36
on partograph knowledge and utilization
came up with the following results: The correct use was low, the knowledge on the use of the
tool was average and there was minimal formal training being provided. Staff shortage was
listed as the most common cause of not using the tool. Other reasons for poor partograph
utility included: lack/shortage/dysfunctional supplies for monitoring labour (fetoscopes,
blood pressure machines), negative attitudes, lack of knowledge especially on interpretation
of findings, conflict between providers as to their roles in filling the partograph, and senior
staff themselves not acting as role models with regards to the use, advocacy and
implementation of the partograph.
The study concluded that: “The partograph was available in most units. However, accurate
recording of parameters to monitor the foetus, the mother and progress of labour as
recommended was mostly not done. Shortage of staff, lack of knowledge, lack of team work,
lack of supplies and negative attitude among healthcare providers were some of the obstacles
noted to hamper partograph use.”

12
A cross-sectional study by Fawole et al. (2008)37
assessed knowledge and utilization of the
partograph among health care workers in southwestern Nigeria. Respondents were selected
by multi-stage sampling method from primary, secondary and tertiary levels of care. Findings
were: Only 32.3% used the partograph to monitor women in labour. Partograph use was
reported significantly more frequently by respondents in tertiary level compared with
respondents from primary/secondary levels of care. Only 37.3% of respondents who were
predominantly from the tertiary level of care could correctly mention at least one component
of the partograph. The study concluded that: “The partograph is utilized mainly in tertiary
health facilities; knowledge about the partograph is poor. Though affordable, the partograph
is commonly not used to monitor the Nigerian woman in labor.”
The WHO partograph was modified to make it simpler and easier to use. The latent phase of
labor was removed and plotting the partograph now begins in the active phase, when the
cervix is dilated to 4 cm.38
In the active phase of labor, the graph plotting cervical dilatation
in relation to time will normally remain on or to the left of the alert line, and its crossing this
line is a “warning sign” that labor may be prolonged. The action line is 4 hours to the right of
the alert line; therefore, if a plot reaches the action line, a decision must be made about the
cause of the slow progress and appropriate action taken as per intervention or referral.38
2.4 Conceptual Framework
Various researchers in the healthcare industry have used the Donabedian framework to assess
quality of healthcare service. This study utilized this framework (assessing structure
indicators, process indicators and outcome indicators) to assess the quality of intra-partum
monitoring (specifically using the partograph) before and after the initiation of free delivery
services in Kenya.

13
The structure framework (in terms of number of workers, physical inputs for partograph
utilization) of the healthcare institution (Naivasha District Hospital) more or less remained
the same during the periods of this study hence much emphasis was not placed on the
structure indicators.
The process indicator that was narrowed down on to assess delivery services was partograph
utilization. Partograph utilization was assessed in terms of: (i) Completeness: that is if the
five major parts of the partograph i.e. patient bio-data, maternal condition, fetal condition,
labour progress and summary of labour were filled. (ii) Adequacy of filling of the partograph:
that is if the parameters e.g. maternal blood pressure (BP) have been filled in as per the
partograph guidelines. For example, in the case of BP, it‟s supposed to be filled four hourly.
(iii) Intervention characteristics: If intervention was needed, an assessment was done of
whether it was done or not. And if it was done, an assessment was done of its appropriateness
and timeliness.
The outcome indicators that were assessed since they are directly influenced by the process
indicator (partograph utilization), i.e. whose outcome could be more directly attributed to the
quality of the process were: Fetal Outcome (specifically APGAR score at 5 mins) and
Delivery outcome (Spontaneous Vaginal Delivery or Emergency Caesarian Section or
Assisted Vaginal Delivery)

14
This relationship between the variables was summarized as below:
Figure 1.2: Conceptual Framework for the impact of free delivery services on
partograph utilization (Source: Author (2015)
2.5 Operational Framework
The operational framework shows the measurable indicators derived from the dependent
variables. The measurable indicators are the actual parameters that were measured in the
field.
Figure 1.3: Operational framework for the impact of free delivery services on
intrapartum monitoring using the partograph (Source: Author, 2015)
1. Apgar Score Grading
2. Frequency of:
SVD/EmCS/Assisted
Vaginal Delivery
1. Completeness
2. Adequacy of Filling
3. Intervention
Characteristics
(Independent
Variable)
Time period in
relation to initiation
of free maternity
care
(Dependent Variable)
Outcome Indicators:
FETAL OUTCOME
DELIVERY
OUTCOME
ouOUTCOMEOUTCO
ME
(Dependent Variable)
Process Indicator:
PARTOGRAPH
UTILIZATION
(Dependent Variable)
Outcome Indicators:
FETAL OUTCOME
DELIVERY OUTCOME
OUTCOMEOUTCOME
(Dependent Variable)
Process Indicator:
PARTOGRAPH
UTILIZATION
(Independent Variable)
Time period in relation to
initiation of free maternity
care

15
2.6 Research Justification
The Kenyan government in June 1, 2013 set up an initiative of free delivery services in order
to increase access to skilled attendance and consequently achieve its MDG target of reducing
its MMR.
In an ideal setting, increased attendance by skilled healthcare-workers would mean better
care and thus an increase in quality obstetric care and thus better outcomes for both the
mother and the baby. But the converse can also be true, such that with increased number of
patients to handle, the quality of obstetric care might actually decline thereby negating the
whole point of getting mothers to be attended by a skilled health practitioner.
Despite the current momentum globally to abolish maternal and child health user fees,
adequate evidence quantifying impact remains scant. The study aimed at assessing if the
quality of care, specifically in terms of intra-partum monitoring using the partograph tool, has
improved or declined after the introduction of free delivery services.
The assessment of whether the quality of obstetric care has either improved or declined after
the introduction of free delivery care can help in the formulation of policy in terms of:
(i) Providing a snapshot view of the current state of health affairs after the introduction of a
key policy of free delivery services (ii) Identifying and assessment of the key areas of
challenge in terms of effective implementation of free delivery care, specifically in ensuring
that it is successful and it does not compromise other areas of quality of healthcare (iii)
Identifying areas of improvement and recommendations henceforth.

16
2.7 Research Question
Was there any difference in partograph utilization, in the immediate and short-term period,
after introduction of free delivery services at Naivasha District Hospital?
2.8 Null Hypothesis
There is no difference in partograph utilization, in the immediate and short term period, after
introduction of free delivery services at Naivasha District Hospital.
2.9 General objective
The general objective of this study was to assess the effect of free delivery services on
partograph utilization, in the immediate and short term period, at Naivasha District Hospital
2.9.1 Specific objectives.
Among women who delivered in the defined study periods “before” and “after” introduction
of free delivery services at Naivasha District Hospital:
i. To determine the difference in completion of the partographs
ii. To assess the difference in the adequacy of filling of partographs
iii. To assess the difference in the appropriateness and timeliness of interventions based
on partograph findings
iv. To determine the differences in early perinatal and maternal delivery outcomes
.
17
CHAPTER THREE
RESEARCH METHODOLOGY
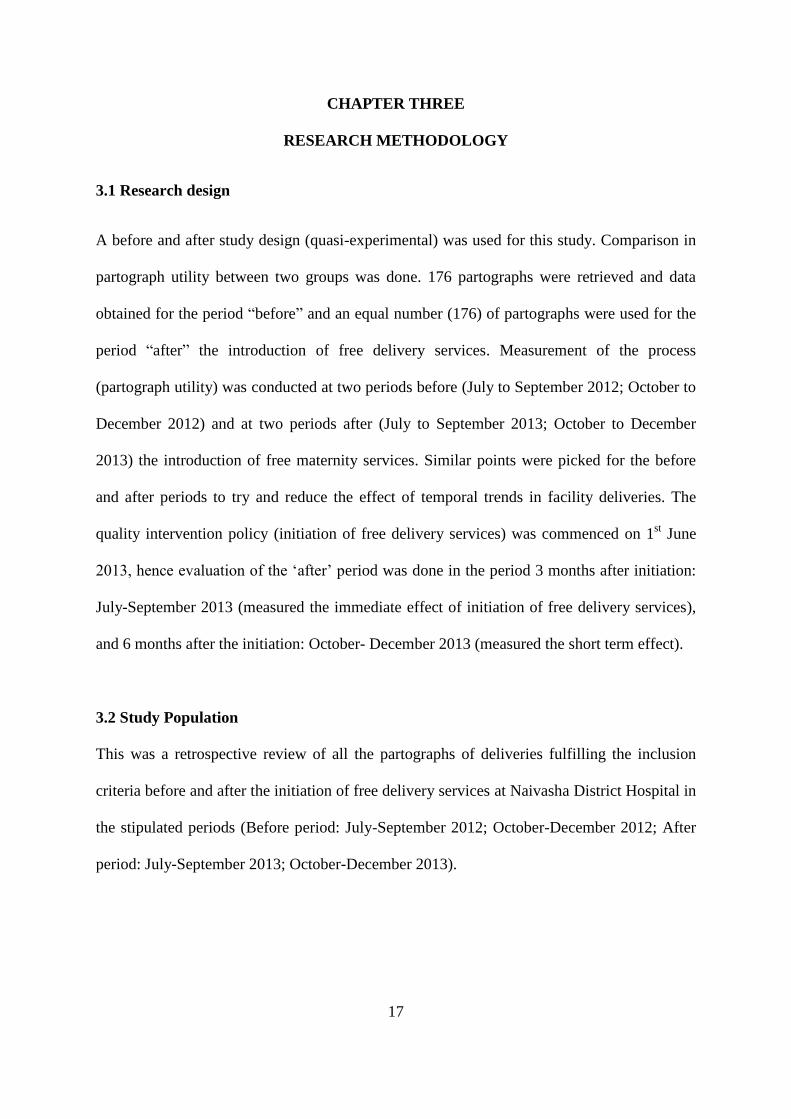
3.1 Research design
A before and after study design (quasi-experimental) was used for this study. Comparison in
partograph utility between two groups was done. 176 partographs were retrieved and data
obtained for the period “before” and an equal number (176) of partographs were used for the
period “after” the introduction of free delivery services. Measurement of the process
(partograph utility) was conducted at two periods before (July to September 2012; October to
December 2012) and at two periods after (July to September 2013; October to December
2013) the introduction of free maternity services. Similar points were picked for the before
and after periods to try and reduce the effect of temporal trends in facility deliveries. The
quality intervention policy (initiation of free delivery services) was commenced on 1st June
2013, hence evaluation of the „after‟ period was done in the period 3 months after initiation:
July-September 2013 (measured the immediate effect of initiation of free delivery services),
and 6 months after the initiation: October- December 2013 (measured the short term effect).
3.2 Study Population
This was a retrospective review of all the partographs of deliveries fulfilling the inclusion
criteria before and after the initiation of free delivery services at Naivasha District Hospital in
the stipulated periods (Before period: July-September 2012; October-December 2012; After
period: July-September 2013; October-December 2013).

18
Inclusion criteria
Partographs for all women reporting in labour at term (≥37 weeks) with no antecedent
conditions
Pregnancy at term gestation which was monitored with a partograph (patients who labored,
and partograph was blank, also included)
Partographs for all deliveries in the stipulated periods of the study
Partographs for all methods of delivery that qualify for partograph monitoring (Emergency
Caeserian Section/Spontaneous Vaginal Delivery/Assisted Vaginal Delivery)
Exclusion criteria
Partographs of mothers who had antecedent conditions prior or during admission e.g. Pre-
eclampsia, Obstetric Haemorrhage etc.
Partographs of women who were previously planned for an elective caeserian, then they went
into labour and consequently were scheduled for an emergency caeserian section.
3.3 Study Site and Setting
Naivasha District Hospital: which is a model level IV county hospital. It was also selected
due to its sound record keeping practices.
3.4 Sample size and Sampling procedure
The sample size was calculated using the formula39
:

19
Description:
• K- constant which depends on α and β (15.68)
• P₁- estimated proportion of partograph utilization prior to initiation of free delivery
services
• P₂- estimated proportion of partograph utilization after initiation of free delivery
services
• Statistical significance= 5% (α= 0.05)
• Statistical power= 80% (β= 20%)
• P₁- SIRCLE survey median= 62% (0.62)
• Effect size (smallest detectable change)= 20%
• P₂= P₁ ± Effect size
• N comes to 88 for each period of evaluation i.e. for the period July to September
2013, N=88; for the period October to December 2013, N=88; for the period July to
September 2012, N=88; for the period October to December 2012, N=88.
Obtaining the specific partograph review samples for each of the stipulated periods was
done as follows: The average number of deliveries for each of the stipulated time periods
was calculated for example if the number of deliveries between the period July to
September 2013 was 1500. The average number of deliveries per day becomes: 16
(1500/total number of days=1500/92). Thus, in-order to meet the specified sample size for
the specified time period (in this case July to September 2013), data from 6 days would
need to be collected (Needed sample size/Average number of deliveries per day=88/16).
The specific 6 days were picked by random sampling of papers indicating the various
days over the stipulated time period (In this case, all the dates over the period of July to
September 2013 were written down on small pieces of paper and folded, random
sampling of 6 of those papers was done to identify the 6 days which partograph data was

20
to be abstracted). Once the days were identified, 16 (for this example) of the files
containing partographs fulfilling the inclusion criteria were abstracted for data collection.
3.5 Data collection procedures and instruments
A retrospective review of partographs fulfilling the inclusion criteria in the stipulated time
periods was done. The researcher worked with record clerks to retrieve files of patients. The
researcher reviewed the files and collected data from 88 partographs in each of the stipulated
time periods. Data from the partographs was extracted and filled in a structured questionnaire
to evaluate and grade the variables of the study as described below:
Completeness: Completeness of the partograph was measured depending on the five main
sections: Patient Biodata(Name, Age, Gravida status, Parity, Patient Record Identifier, Date
of Admission, Time of Admission, Rupture of Membranes), Fetal monitoring(FHR, status of
membranes, liquor, and moulding), Maternal monitoring (temperature, blood pressure, and
pulse rate), Progress of Labour(cervical dilatation, uterine contractions, and descent of foetal
head), Summary of Labour(Apgar Score, Delivery Outcome)
Key to grading:
Complete: if there was some information on all five sections
Incomplete: If information was there on some sections, but not all
Blank: If there was no information on all sections
Adequacy of filling: Adequacy of filling was measured depending on the specified
partograph guidelines for the specified parameter e.g. blood pressure should be recorded four
hourly, cervical dilatations should be recorded four hourly etc.
Key to grading:
Adequate: If specified guidelines concerning recording of the parameter were met
Inadequate: If some readings were available but not according to the specified guidelines

21
Grossly inadequate: If no reading was available
Intervention Characteristics: As per the partograph data, and as per the partograph
guidelines, determination was made whether intervention was needed (Intervention needed:
Yes/No). If intervention was needed, assessment was done as per its: timeliness (Timely/Not
timely) and appropriateness (Appropriate/Inappropriate).
Fetal Outcome: Fetal outcome was assessed depending on the “APGAR” scoring system at
5 minutes.
Key to grading:
Good: if it was greater or equal to 9 at five minutes
Borderline: If it was between 7 and 8 inclusive
Bad: If it was less than seven
Delivery Outcome: Assessed delivery outcome as per whether it was: spontaneous vaginal
delivery, emergency caeserian section, assisted vaginal delivery
3.6 Data analysis and Reporting
Descriptive analysis tools e.g. percentages were used to present the number and percentages
of the independent variables for example number and percentage of partographs that are
complete. Presentation and reporting was made in tables.
The variables were coded, entered and analysed using SPSS version 18.0. The researcher and
the statistician did the data cleaning, clarification and quality control. Descriptive statistics
were run and frequency tables were produced to describe partograph utilization. Where the
test was applied for statistical significance, the cut off point for the level of significance was
0.05.

22
3.5.1 Reliability and Validity
Reliability in a quantitative study is the extent to which results are consistent over time,
accurately represent the total population and the degree to which the results can be
reproduced under similar methodology.
Validity in quantitative research determines objectivity of the results thus whether the
research truly measured what it was intended to measure. Credibility of the results depends
on instrument construction.40, 41
In this study, reliability and validity were achieved in a number of ways as follows:
(i) Team approach where researcher and assistant regularly met and discussed the data
collected from partographs. The in-charges were also contacted to verify some issues if not
clear
(ii) Same data collection tool was used consistently and the researcher and assistant were in
constant communication especially where there arose any issues as per the grading of the
independent variables.
(iii) Feedback workshop: The information obtained from partograph reviews was
complemented with health workers‟ responses. Preliminary findings were presented in a staff
meeting to validate the findings and to reduce subjective views which might have lead to
unwarranted emphasis or invalid conclusions. The researcher took advantage of the routine
morning meetings for nurses and clinicians at Naivasha District Hosptial to clarify any issues
and to give feedback.
3.6 Ethical issues
Precautions were taken to ensure confidentiality of the patient‟s information obtained from
the files.

23
Approval was sort from both: Naivasha District Hospital and KNH/University of Nairobi
Ethical Review Committee
3.7 Study Limitation
The study though having tried to suitably select an appropriate study site for the study
(Naivasha District Hospital), it is of importance to mention that the study site and its
findings‟ may not in all dimensions represent the picture that is happening in all other public
hospitals in Kenya.
It is important to note that the dimensions that were measured in terms of indicators of quality
of care may not encompass all dimensions of quality of maternal healthcare as regards the
partograph. This is so, especially as regards the structure indicators. However, other
dimensions may be added and adopted, if required, in future studies.
Also of note, is that the study did not cover the long term effect of free delivery services at
Naivasha District Hospital.
Despite some of these limitations, the study had some strengths in that: (i) Unlike previous
studies, it measured partograph utility of almost all partograph parameters (ii) It also
measured the immediate and short term effect of partograph utility after initiation of free
delivery services policy and also took into consideration the temporal trends when it came to
comparing partograph utility between the time periods
24
CHAPTER FOUR
RESULTS
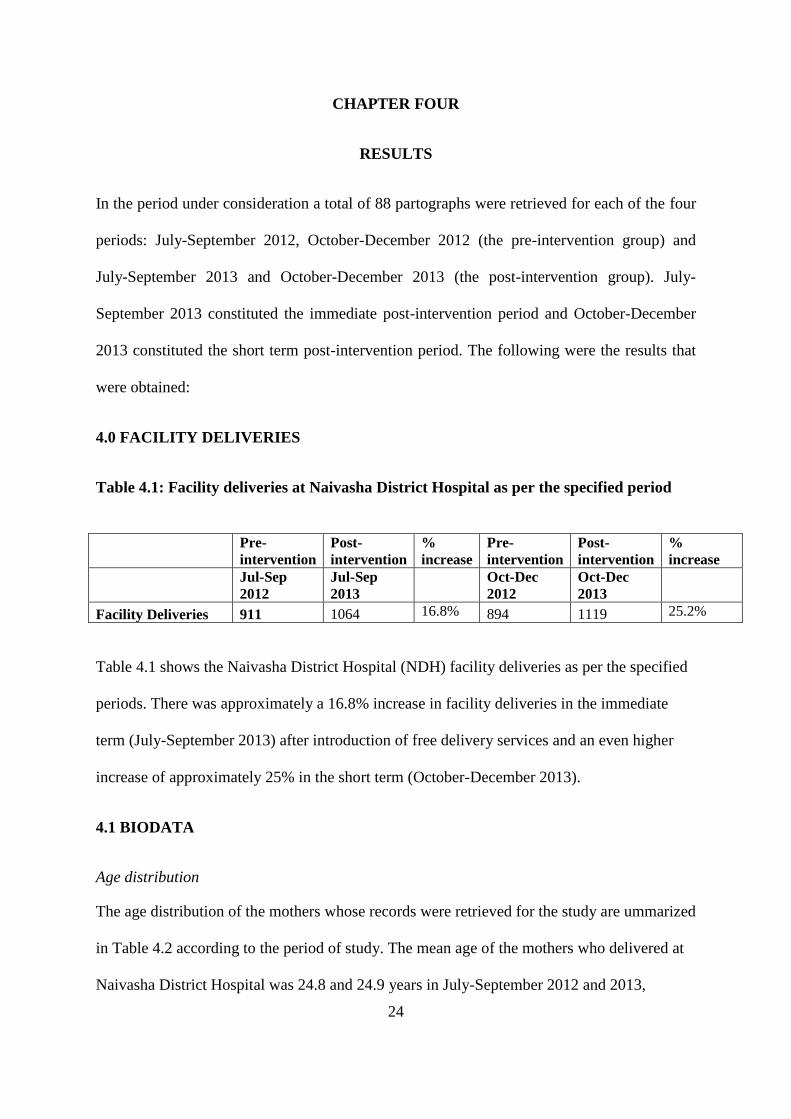
In the period under consideration a total of 88 partographs were retrieved for each of the four
periods: July-September 2012, October-December 2012 (the pre-intervention group) and
July-September 2013 and October-December 2013 (the post-intervention group). July-
September 2013 constituted the immediate post-intervention period and October-December
2013 constituted the short term post-intervention period. The following were the results that
were obtained:
4.0 FACILITY DELIVERIES
Table 4.1: Facility deliveries at Naivasha District Hospital as per the specified period
Pre-
intervention
Post-
intervention
%
increase
Pre-
intervention
Post-
intervention
%
increase
Jul-Sep
2012
Jul-Sep
2013
Oct-Dec
2012
Oct-Dec
2013
Facility Deliveries 911 1064 16.8% 894 1119 25.2%
Table 4.1 shows the Naivasha District Hospital (NDH) facility deliveries as per the specified
periods. There was approximately a 16.8% increase in facility deliveries in the immediate
term (July-September 2013) after introduction of free delivery services and an even higher
increase of approximately 25% in the short term (October-December 2013).
4.1 BIODATA
Age distribution
The age distribution of the mothers whose records were retrieved for the study are ummarized
in Table 4.2 according to the period of study. The mean age of the mothers who delivered at
Naivasha District Hospital was 24.8 and 24.9 years in July-September 2012 and 2013,

25
respectively and the mean age of mothers who delivered in October-December was 25.5 year
in 2012 and 25.2 years in 2013 (Table 4.2). Between 46.6% and 59.1% of mothers delivering
at the hospital during the four time periods were aged 19-24 years (Table 4.2).
Table 4.2: Age distribution of mothers delivering in Naivasha District Hospital
according to delivery period
Pre-intervention Post-intervention Pre-intervention Post-intervention
Jul-Sep 2012 Jul-Sep 2013 Oct-Dec 2012 Oct-Dec 2013
Mean age ± SD 24.8 ± 4.7 24.9 ± 5.3 25.5 ± 6.4 25.2 ± 5.2
19-24 years 41(46.6) 52(59.1) 45(51.1) 49(55.7)
25-29 years 30(34.1) 18(20.5) 17(19.3) 19(21.6)
30-34 years 15(17.0) 10(11.4) 13(14.8) 15(17.0)
35 + years 2(2.3) 8(9.1) 13(14.8) 5(5.7)
Parity
Table 4.3 shows the distribution of mothers whose partographs were used for the study at
Naivasha District Hospital between July 2012 and December 2013 according to gravidity.
Most mothers during each of the four periods were first time mothers with between 39.8%
and 43.2% of mothers reporting that they were primigravidae. At least 10% (range 12.5% to
22.7%) of the mothers reported that the order of the index pregnancy was four or greater.
Table 4.3: Distribution of mothers delivering at Naivasha District Hospital according to
gravidity and delivery period
Pre-
intervention
Post-
intervention
Pre-
intervention
Post-
intervention
Jul-Sep 2012 Jul-Sep 2013 Oct-Dec 2012 Oct-Dec 2012
Gravidity
1 35(39.8) 36(40.9) 36(40.9) 38(43.2)
2 27(30.7) 29(33.0) 17(19.3) 20(22.7)
3 12(13.6) 7(8.0) 15(17.0) 19(21.6)
4+ 14(15.9) 16(18.2) 20(22.7) 11(12.5)

26
4.2 COMPLETENESS OF PARTOGRAPHS
Overall, most partographs were incomplete during both time periods before and after
introduction of free delivery services (Table 4.4). In the pre-intervention period between
28.4% and 36.4% of partographs were considered to have been filled in completely compared
to between 10.2 and 20.5% of partographs retrieved during the period after introduction of
free delivery services. Only a single partograph retrieved during the period of the study was
completely blank.
Table 4.4: Overall completeness of partographs before and after introduction of free
delivery services in Naivasha District Hospital
Pre-
intervention
Post-
intervention
P Pre-
intervention
Post-
intervention
P
Jul-Sep
2012
Jul-Sep
2013
Oct-Dec
2012
Oct-Dec
2013
Completeness of partograph
Complete 25(28.4) 9(10.2) 0.002 32(36.4) 18(20.5) 0.019
Incomplete 62(70.5) 79(89.8) 56(63.6) 70(79.5)
Blank 1(1.1) 0(0.0) 0(0.0) 0(0.0)
4.3 ADEQUACY OF FILLING IN PARTOGRAPHS
The adequacy of filling partographs was determined through assessing the level of
documentation of monitoring for fetal heart rate, progress of labour, maternal and neonatal
parameters.
4.3.1 Fetal heart rate
Table 4.5 shows that the between 72.7% and 83% of the partographs in the period before the
introduction of free maternal services were filled in adequately. In the post intervention
period the proportion of partographs with adequately documented fetal heart rate was
between 77.3% and 80.7%. The proportion of grossly inadequate fetal heart rate monitoring

27
on partographs ranged from 8% to 12% before free delivery services and 14.8% to 18.2% in
the post intervention period.
Table 4.5: Adequacy of documentation of fetal heart rate in the periods before and after
introduction of free delivery services
Pre-
intervention
Post-
intervention
P Pre-
intervention
Post-
intervention
P
Jul-Sep
2012
Jul-Sep
2013
Oct-Dec
2012
Oct-Dec
2013
Fetal heart rate
Adequate 73(83.0) 68(77.3) 0.373 64(72.7) 71(80.7) 0.003
Inadequate 7(8.0) 7(8.0) 13(14.8) 1(1.1)
Grossly inadequate 7(8.0) 13(14.8) 11(12.5) 16(18.2)
4.3.2 Progress of labour
The progress of labour was monitored and recorded on most partographs as shown in Table
4.6. The highest levels of documentation of progress of labour throughout all the four time
periods, before and after introduction of free delivery services, was in monitoring cervical
dilatation (range 84.1% to 94.3%). Between 70% and 85% of all partographs during the study
periods had adequate information on monitoring of cervical dilation, descent and uterine
contractions.
28
Table 4.6: Adequacy of documentation of progress of labour using partographs in
Naivasha District Hospital before and after introduction of free delivery services
Pre-
intervention
Post-
intervention
P Pre-
intervention
Post-
intervention
P
Jul-Sep
2012
Jul-Sep
2013
Oct-Dec
2012
Oct-Dec
2013
Cervical dilatation at admission
Yes 83(94.3) 79(89.8) 0.265 77(87.5) 74(84.1) 0.517
No 5(5.7) 9(10.2) 11(12.5) 14(15.9)
Monitoring of cervical
dilatation
Adequate 75(85.2) 71(80.7) 0.351 65(73.9) 72(81.8) 0.001
Inadequate 9(10.2) 8(9.1) 14(15.9) 1(1.1)
Grossly inadequate 4(4.5) 9(10.2) 9(10.2) 15(17.0)
Monitoring of descent
Adequate 73(83.0) 71(80.7) 0.298 62(70.5) 72(81.8) 0.001
Inadequate 11(12.5) 8(9.1) 15(17.0) 1(1.1)
Grossly inadequate 4(4.5) 9(10.2) 11(12.5) 15(17.0)
Monitoring of uterine
contractions
Adequate 73(83.0) 72(81.8) 0.652 64(72.7) 71(80.7) 0.001
Inadequate 9(10.2) 7(8.0) 14(15.9) 1(1.1)
Grossly inadequate 6(6.8) 9(10.2) 10(11.4) 16(18.2)
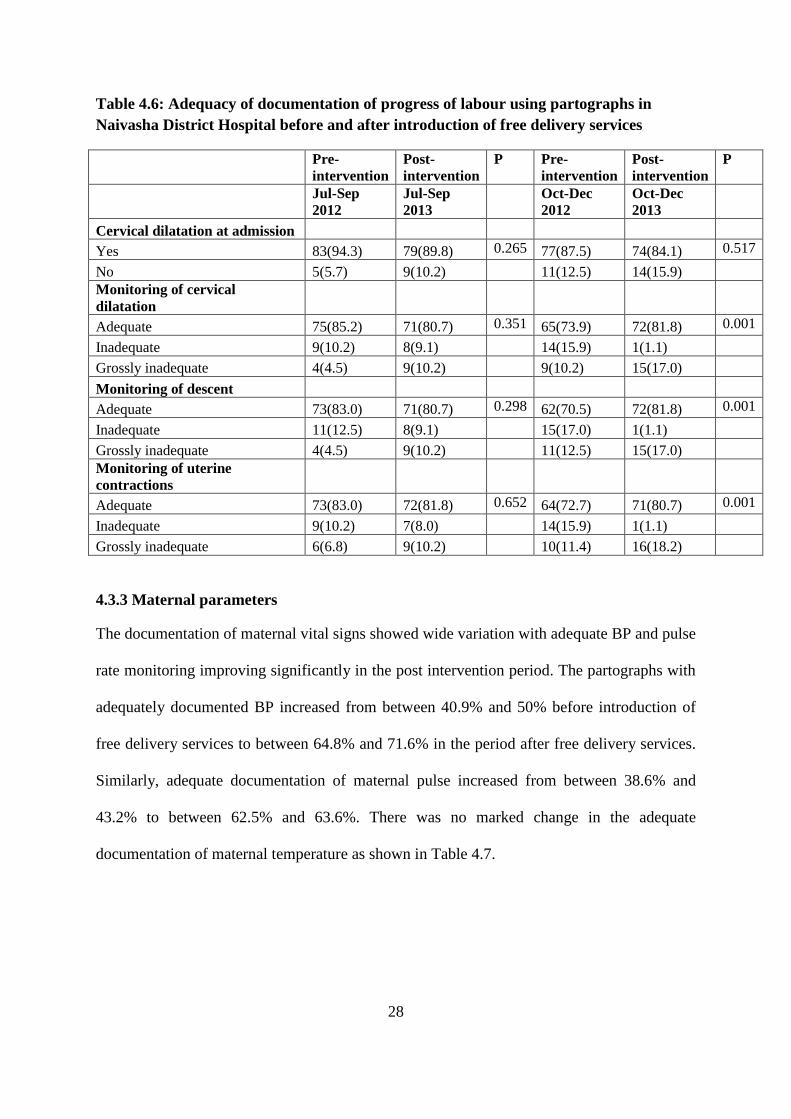
4.3.3 Maternal parameters
The documentation of maternal vital signs showed wide variation with adequate BP and pulse
rate monitoring improving significantly in the post intervention period. The partographs with
adequately documented BP increased from between 40.9% and 50% before introduction of
free delivery services to between 64.8% and 71.6% in the period after free delivery services.
Similarly, adequate documentation of maternal pulse increased from between 38.6% and
43.2% to between 62.5% and 63.6%. There was no marked change in the adequate
documentation of maternal temperature as shown in Table 4.7.

29
Table 4.7: Adequacy of documentation of maternal vital signs in the periods before and
after introduction of free maternal services
Pre-
intervention
Post-
intervention
P Pre-
intervention
Post-
intervention
P
Jul-Sep
2012
Jul-Sep
2013
Oct-Dec
2012
Oct-Dec
2013
Maternal BP monitoring
Adequate 44(50.0) 63(71.6) 0.012 36(40.9) 57(64.8) <0.001
Inadequate 22(25.0) 14(15.9) 26(29.5) 5(5.7)
Grossly inadequate 22(25.0) 11(12.5) 26(29.5) 26(29.5)
Maternal pulse monitoring
Adequate 38(43.2) 56(63.6) 0.017 34(38.6) 55(62.5) 0.003
Inadequate 23(26.1) 18(20.5) 22(25.0) 7(8.0)
Grossly inadequate 27(30.7) 14(15.9) 32(36.4) 26(29.5)
Maternal temperature
monitoring
Adequate 32(36.4) 27(30.7) 0.097 25(28.4) 27(30.7) 0.943
Inadequate 14(15.9) 26(29.5) 18(20.5) 17(19.3)
Grossly inadequate 42(47.7) 35(39.8) 45(51.1) 44(50.0)
4.3.4 Neonatal parameters
For documentation of newborn data partographs were inspected to determine percentages of
partographs that contained information on vital status, APGAR score, birth weight and sex of
baby (Table 4.8). With the exception of vital status recording there were no significant
changes in documentation of newborn data on partographs in the periods before and after
introduction of free delivery services. The partographs retrieved in July to September 2013
were approximately 4 times more likely to contain vital status information at birth compared
with those from the corresponding period in 2012 (OR = 3.7, 95% CI 1.3 to 11.7%; p = 0.02).
Almost all partographs retrieved before and after free delivery services had APGAR scores
(range, 94.3% to 98.9%) and birth weight (range, 94.3% to 98.9%) documented (Table 4.8).
Documentation of the sex of the baby was also high before the introduction of free delivery

30
services (range, 92% to 96.6%) and did not change significantly after introduction of free
delivery services (range, 89.8% to 95.5%).
Table 4.8: Documentation of newborn data in the periods before and after introduction
of free delivery services
Key:
Yes: Parameter recorded; No: parameter not recorded
Partograph OR
(95% CI) P
Partograph OR
(95%CI) P Yes No Yes No
Baby
(Alive/SB)
recording
Jul-Sep 2012
72
(81.8)
16
(18.2) 1.0
Oct-Dec
2012
76
(87.4)
11
(12.6) 1.0
Jul-Sep 2013
83
(94.3)
5
(5.7)
3.7
(1.3-10.6) 0.015
Oct-Dec
2013
81
(92.0)
7
(8.0)
1.7
(0.6-4.5) 0.311
Apgar score
recorded
Jul-Sep 2012
87
(98.9)
1
(1.1) 1.0
Oct-Dec
2012
87
(98.9)
1
(1.1) 1.0
Jul-Sep 2013
82
(94.3)
5
(5.7)
0.2
(0.0-1.7) 0.134
Oct-Dec
2013
85
(96.6)
3
(3.4)
0.3
(0.0-3.2) 0.335
Birth weight
recorded
Jul-Sep 2012
83
(94.3)
5
(5.7) 1.0
Oct-Dec
2012
87
(98.9)
1
(1.1) 1.0
Jul-Sep 2013
86
(97.7)
2
(2.3)
2.6
(0.5-13.7) 0.263
Oct-Dec
2013
86
(97.7)
2
(2.3)
0.5
(0.0-5.6) 0.568
Sex of the
fetus
recorded
Jul-Sep 2012
85
(96.6)
3
(3.4) 1.0
Oct-Dec
2012
81
(92.0)
7
(8.0) 1.0
Jul-Sep 2013
79
(89.8)
9
(10.2)
0.3
(0.1-1.2) 0.087
Oct-Dec
2013
84
(95.5)
4
(4.5)
1.8
(0.5-6.4) 0.356
Resuscitation
done
Jul-Sep 2012 56
(63.6)
32
(36.4) 1.0
Oct-Dec
2012
63
(71.6)
25
(28.4) 1.0
Jul-Sep 2013 64
(72.7)
24
(27.3)
1.5
(0.8-2.9) 0.197
Oct-Dec
2013
58
(65.9)
30
(34.1)
0.8
(0.4-1.5)
0.41
7

31
4.3.5 Other parameters
As shown in Table 4.9 documentation of uterotonic use, placental status, and approximate
blood loss was done adequately in at least 70% of the partographs that were retrieved from all
four time periods, both before and after the introduction of free maternity services. However,
documentation of the presence of perineal tear or episiotomy was done less frequently (range
52.2 to 72.7%) across the time periods. There was no significant change in the recording of
uterotonic use after introduction of free delivery services (79.3% versus 74.7% in July-
September, p = 0.472; and 79.5% to 72.4% in October-December, p = 0.271). Similarly, the
recording of placental status (73.9% to 75.9% and 80.7 to 73.9% for period 1 and 2,
respectively) and blood loss (90.9 to 90.8% and 87.5 to 81.8%) did not change significantly
with introduction of free delivery services.
The changes in documentation of presence of perineal tears or episiotomy were not
significant with proportions changing from 67% to 55.2% during the first period (p = 0.123)
and from 67% to 72.7% for the second period (p = 0.412)

32
Table 4.9: Adequacy of filling of summary of labor parameters before and after
introduction of free delivery services
Adequate
recording OR
(95% CI) P
Adequate
recording OR
(95%CI) P
Yes No
Yes No
Uterotonic
use
Jul-Sep 2012 69
(79.3)
18
(20.7) 1.0
Oct-
Dec
2012
70
(79.5)
18
(20.5) 1.0
Jul-Sep 2013 65
(74.7)
22
(25.3)
0.8
(0.4-1.6) 0.472
Oct-
Dec
2013
63
(72.4)
24
(27.6)
0.7
(0.3-1.4) 0.271
Placental
Status
(complete/
incomplete)
recording
Jul-Sep 2012 65
(73.9)
23
(26.1) 1.0
Oct-
Dec
2012
71
(80.7)
17
(19.3) 1.0
Jul-Sep 2013 66
(75.9)
21
(24.1)
1.1
(0.6-2.2) 0.728
Oct-
Dec
2013
65
(73.9)
23
(26.1)
0.7
(0.3-1.4) 0.282
Approximate
blood loss
recording
Jul-Sep 2012 80
(90.9)
8
(9.1) 1.0
Oct-
Dec
2012
77
(87.5)
11
(12.5) 1.0
Jul-Sep 2013 79
(90.8)
8
(9.2)
1.0
(0.4-2.8) 1.000
Oct-
Dec
2013
72
(81.8)
16
(18.2)
0.6
(0.3-1.5) 0.298
Presence of
perineal
tear/episioto
my
recording
Jul-Sep 2012 59
(67.0)
29
(33.0) 1.0
Oct-
Dec
2012
59
(67.0)
29
(33.0) 1.0
Jul-Sep 2013 48
(55.2)
39
(44.8)
0.6
(0.3-1.1) 0.123
Oct-
Dec
2013
64
(72.7)
24
(27.3)
1.3
(0.7-2.5) 0.412

33
4.4 INTERVENTION CHARACTERISTICS
Based on a holistic evaluation of the partograph between 8% and 10.2% of partographs from
the period before introduction of free delivery services had an indication of the need for
intervention. These percentages changed to between 7.1% and 14.3% in the post free delivery
services period and these changes were not statistically significant (p = 0.964 and 0.418,
respectively).
Interventions were appropriate (100%) both in the period before and after introduction of free
delivery services. In cases where intervention was needed there was evidence of timely
intervention in 75% and 100% of cases in the period before free delivery services. In the post
intervention period these percentages changes to 80% and 90.9% representing non-significant
changes (Table 4.10).
Table 4.10: Intervention based on partograph findings before and after introduction of
free delivery services
Intervention OR
(95%CI) P
Intervention OR
(95%CI) P Yes No Yes No
Intervention
needed
Jul-Sep 2012
7
(8.0)
81
(92.0) 1.0
Oct-Dec
2012
9
(10.2)
79
(89.8)
1.0
Jul-Sep 2013
6
(7.1)
79
(92.9)
1.0
(0.3-3.1) 0.964
Oct-Dec
2013
12
(14.3)
72
(85.7)
1.5
(0.6-3.7) 0.418
Appropriate
intervention
Jul-Sep 2012 7(100) 0 N/A
Oct-Dec
2012 9(100) 0 N/A
Jul-Sep 2013 6(100) 0 N/A N/A
Oct-Dec
2013 12(100) 0 N/A N/A
Timely
intervention Yes No
Yes No
Jul-Sep 2012
6
(75.0)
2
(25.0) 1.0
Oct-Dec
2012
5
(100.0)
0
(0.0) 1.0
Jul-Sep 2013
4
(80.0)
1
(20.0)
1.3
(0.1-20.1) 0.835
Oct-Dec
2013
10
(90.9)
1
(9.1) N/A N/A
34
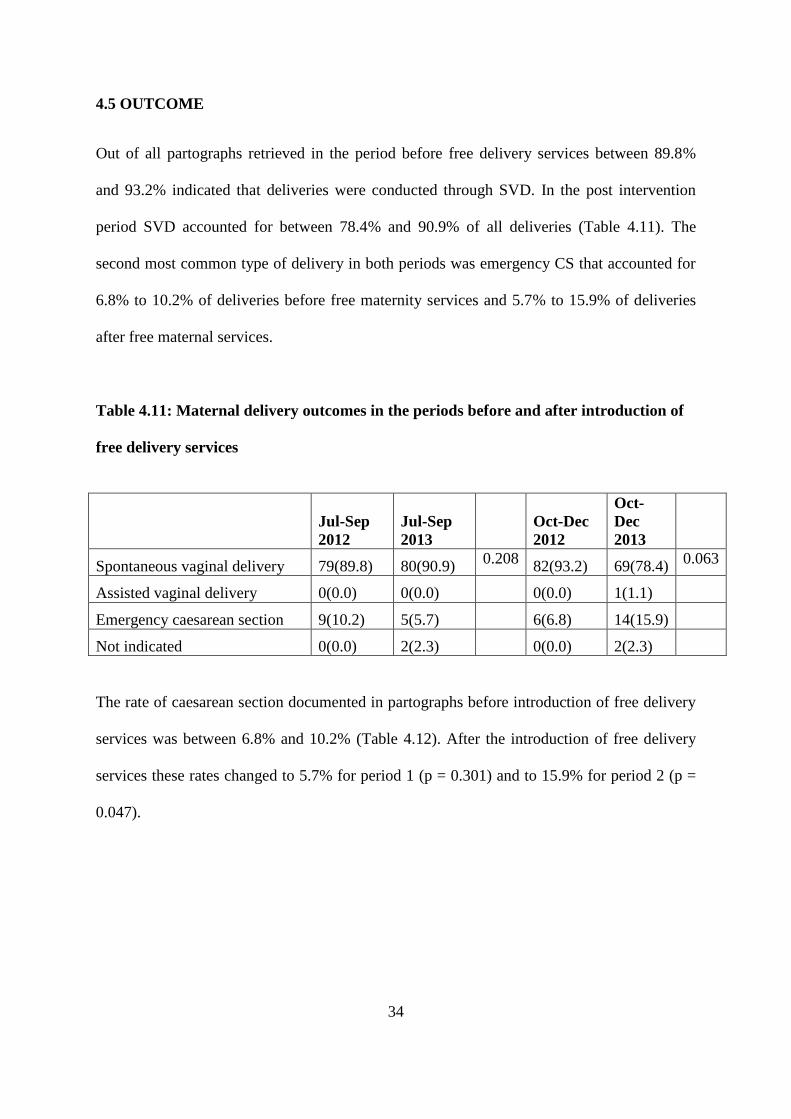
4.5 OUTCOME
Out of all partographs retrieved in the period before free delivery services between 89.8%
and 93.2% indicated that deliveries were conducted through SVD. In the post intervention
period SVD accounted for between 78.4% and 90.9% of all deliveries (Table 4.11). The
second most common type of delivery in both periods was emergency CS that accounted for
6.8% to 10.2% of deliveries before free maternity services and 5.7% to 15.9% of deliveries
after free maternal services.
Table 4.11: Maternal delivery outcomes in the periods before and after introduction of
free delivery services
Jul-Sep
2012
Jul-Sep
2013
Oct-Dec
2012
Oct-
Dec
2013
Spontaneous vaginal delivery 79(89.8) 80(90.9) 0.208
82(93.2) 69(78.4) 0.063
Assisted vaginal delivery 0(0.0) 0(0.0)
0(0.0) 1(1.1)
Emergency caesarean section 9(10.2) 5(5.7)
6(6.8) 14(15.9)
Not indicated 0(0.0) 2(2.3)
0(0.0) 2(2.3)
The rate of caesarean section documented in partographs before introduction of free delivery
services was between 6.8% and 10.2% (Table 4.12). After the introduction of free delivery
services these rates changed to 5.7% for period 1 (p = 0.301) and to 15.9% for period 2 (p =
0.047).

35
Table 4.12: Documented caesarean section rates before and after introduction of free
delivery services
Yes No
OR
(95%CI) P
Yes No
OR
(95%CI) P
Emergency
CS
Jul-
Sep
2012
9
(10.2)
79
(89.8) 1.0
Oct-
Dec
2012
6
(6.8)
82
(93.2) 1.0
Emergency
CS
Jul-
Sep
2013
5
(5.7)
83
(94.3) 0.5(0.2-0.7) 0.301
Oct-
Dec
2013
14
(15.9)
74
(86.1)
2.8
(1.0-7.6) 0.047
4.5.1 APGAR score
Table 4.13 shows that there was no change in the rate of “good” apgar scores in the
immediate period after initiation of free delivery services (remained at 80.7%) but there was a
slight decline in the short term period (90.9% to 81.8%). The rate of “bad” apgar scores
slightly rose in the immediate term (5.7% to 8.0%) and also rose slightly in the short term
(3.4% to 6.8%)
Table 4.13: Newborn outcomes during the periods before and after introduction of free
delivery services
Jul-Sep
2012
Jul-Sep
2013
Oct-Dec
2012
Oct-Dec
2013 Chi
P
value
APGAR score at 5 minutes
Good 71(80.7) 71(80.7) 80(90.9) 72(81.8) 13.1 0.159
Borderline 11(12.5) 4(4.5) 4(4.5) 4(4.5)
Bad 5(5.7) 7(8.0) 3(3.4) 6(6.8)
APGAR score not indicated 1(1.1) 5(5.7) 1(1.1) 3(3.4)
Table 4.14 shows a summary of the current study findings. The current study findings
compare well with the previous study findings even though showing a marked improvement
on recording of all partograph parameters except maternal temperature.

36
Table 4.14: Summary of current study findings
Region Ethiopia-
Amhara
Region
Kenya Kenya Kenya-Naivasha
District Hosp.
Study FantuAbebe
et al (2013)
Cross-
sectional
study
Qureshi et al
(2012) cross-
sectional
study
Sircle survey
(2013)
Current Study (Oct-
Dec 2013)
Findings
Cervical
Dilation
monitoring
60.3% 70-97% 73% 81.8%
Contractions 60.3% 30-80% 72% 80.7%
FHR 79.3% 53-90% 71% 80.7%
Descent 41.3% 53-90% 65% 81.8%
Maternal PR 32.8% 43-77% 59% 62.5%
Liquor 51.7% 13-80% 48% -
Moulding - 13-43% 36% -
Maternal
Temp
- - 42% 30.7%
Maternal
Resp. Rate
- - 31% -

37
CHAPTER FIVE
DISCUSSION
5.0 Facility Deliveries
Dzakpasu (2013) et al.19
systematic review findings on the impact of user fees showed that
facility deliveries tended to increase with user fee exemption. Similar findings were noted at
Naivasha District Hospital, after waivering of delivery costs. There was an approximately
16.8% increase in facility deliveries in the immediate term (July-September 2013) at
Naivaisha District Hospital after introduction of free delivery services and an even higher
increase of approximately 25% in the short term (October-December 2013).
These findings also correlate with the KDHS 2014 findings (Figure 5.1) which show an
increase in number of deliveries attended by a skilled provider (from 44% to 62%) and
number of deliveries attended at a health facility (from 43% to 61%).
The increase in facility deliveries could be explained by the elimination of cost as a factor in
primary delay in seeking health care.
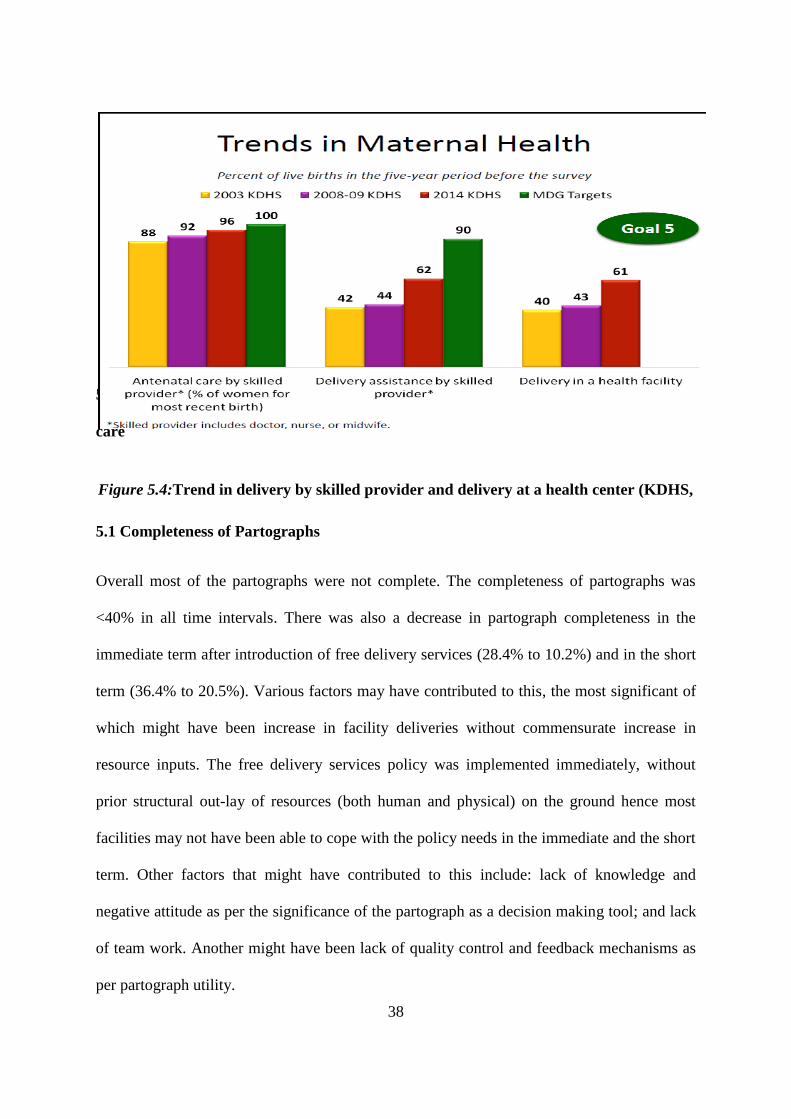
38
5.1 Completion of Partographs before and after introduction of free maternal health
care
5.1 Completeness of Partographs
Overall most of the partographs were not complete. The completeness of partographs was
<40% in all time intervals. There was also a decrease in partograph completeness in the
immediate term after introduction of free delivery services (28.4% to 10.2%) and in the short
term (36.4% to 20.5%). Various factors may have contributed to this, the most significant of
which might have been increase in facility deliveries without commensurate increase in
resource inputs. The free delivery services policy was implemented immediately, without
prior structural out-lay of resources (both human and physical) on the ground hence most
facilities may not have been able to cope with the policy needs in the immediate and the short
term. Other factors that might have contributed to this include: lack of knowledge and
negative attitude as per the significance of the partograph as a decision making tool; and lack
of team work. Another might have been lack of quality control and feedback mechanisms as
per partograph utility.
Figure 5.4:Trend in delivery by skilled provider and delivery at a health center (KDHS,
2014)

39
5.2 Adequacy of filling of Partograph parameters
Fetal Heart Rate (FHR): Overall adequacy of filling of this parameter was good (>70%). In
most studies (Table 4.14), FHR has traditionally been filled relatively well. This might be
because of its perceived importance over other parameters by health care providers. There
was a slight decrease in the immediate term (maybe again due to the abruptness in which the
policy was implemented and also the increase in facility deliveries without commensurate
resources out-lay on the ground). There was a statistically significant increase in the short
term (might have been due to adaptation/recovery of the resources to the new facility delivery
levels after the initial slump).
Progress of labor parameters: These have also been generally well filled even from prior
studies (Table 4.14). Key findings in the progress of labor parameters were: Overall adequacy
of filling was good (>70%). Generally, there was a slight decrease in the immediate term
however it was not statistically significant. There was a statistically significant average
increase in the short term. These parameters like FHR have been traditionally perceived as
important and thus are generally well filled.
The decrease in monitoring of these parameters in the immediate term could have been due to
the initial impetus of increased facility deliveries but with stabilization of the new delivery
figures, the staff might have adapted to the new levels and thus even leading to an
improvement in their recordings.
Maternal parameters: Overall recording of maternal parameters was generally not good
(<65%) on most parameters. Maternal BP: Improved both in the immediate and short term
after free delivery services. Maternal PR: Improved both in the immediate and short term
after free delivery services. Maternal Temperature: Overall recording was bad (<30%); no

40
major statistically significant changes in the immediate and short term in terms of maternal
temperature recording.
Recording of maternal parameters has been traditionally low, even in prior studies. This is
mostly due to the misconceived lack of significance to the overall outcome that these
parameters usually carry.
Neonatal parameters: Overall recording of these parameters was excellent (>90%) except the
parameter: “rescuscitation done”. This is mostly due to the fact that the details of this section
are mandatory for transfer of the patient to the next attendant and also due to the fact that
these details are needed for the birth notification process to be initiated. So a good number of
partographs had these parameters filled.
5.3 Intervention characteristics
Of the partographs that needed intervention, the appropriateness of the intervention was
excellent (100%) in almost all the cases. The timeliness of intervention in all time periods
was generally good (>75%). There were no significant variations in appropriateness and
timeliness of intervention between the periods before and after free delivery services.
5.4 Outcome
Key findings were: there was a statistically significant increase in the Emergency CS rate in
the short term (6.8% to 15.9%). This may have been largely contributed by the increase in
facility deliveries at Naivasha District Hospital. An increase in CS rate might mean a
concomitant increase in the financial burden of delivery that GoK might have to bear to
sustain free delivery services policy.

41
There were also increases in the “Bad” Apgar scores both in the immediate and short term but
these changes were not statistically significant. This is in tandem with neonatal mortality
KDHS 2014 findings, which have fairly remained stable (apart from 2014 findings which
reported a significant drop from 31% to 22%), despite a significant increase in facility
deliveries over the years.
Figure 5.5:Trends in Neonatal Mortality (KDHS, 2014)

42
CONCLUSION
Facility Delivery at Naivasha District Hospital increased both in the immediate and short
term period after introduction of the free delivery services policy on 1st June 2013. Overall
completeness of the partographs decreased both in the immediate and short term after
introduction of free delivery services. There was also an increase in CS rate. However, there
were no significant changes in terms of adequacy of filling of most of the parameters,
intervention characteristics and outcomes in terms of APGAR score at 5 minutes after
initiation of the free delivery services policy.
In conclusion, initiation of free delivery services is a good initiative; it has increased access to
skilled delivery care through decrease in the cost factor of primary delay; but it has also led to
some compromises in quality of care (overall completeness of partographs), in this case.
Despite the compromises noted, the study overall shows that there is no marked effect in the
adequacy of filling of most parameters in the immediate and short term period after initiation
of free delivery services policy.
RECOMMENDATIONS
1. The free delivery services policy needs to be backed up with commensurate resources
to cope with the increased number of facility deliveries
2. Emphasis on training and quality control in terms of the process indicators-ensure
compliance to set guidelines of partograph utilization will contribute to improved
maternal and perinatal health outcomes
3. A multicenter study encompassing the long term effect of free delivery services
should be considered in future to try and gain a more wholistic picture of the impact
of the free delivery services policy on the quality of skilled healthcare delivered.

43
REFERENCES
1. Kenya National Bureau of Statistics (KNBS) and ICF Macro. 2010. Kenya Demographic
and Health Survey 2008-09. Calverton, Maryland: KNBS and ICF Macro.
2. United Nations. 2011. The Millenium Development Goals Report 2011. NewYork: United
Nations.
3. Martines J, Paul VK, Bhutta ZA et al. 2005. Neonatal survival: a call for action. The
Lancet 365: 1189–97.
4. Campbell OMR, Graham WJ on behalf of the Lancet Maternal Survival Series Steering
Group. 2006. Strategies for reducing maternal mortality: getting on with what works. The
Lancet 368: 1284–99.
5. Cited by Nicole Bourbonnais, Implementing Free Maternal Health Care in Kenya(Kenya
National Commission of Human Rights, Nov. 2013)., pg 3
6. WHO: Maternal Mortality Update 2002. A Focus in Emergency Obstetrics Care UNFPA,
New York 2003:4-9.
7. Lawn, J., Kerber, K.: Opportunities for Africa‟s newborns: Practical data, policy and
programmatic support for newborn care in Africa. World Health Organization on behalf of
The Partnership for Maternal Newborn and Child Health; 2006.

44
8. WHO: The partograph an essential tool to make decision during labor, maternal and
neonatal health. best practice; 2002
9. WHO, UNICEF, UNFPA and the World Bank: Trends in Maternal Mortality 1990 to 2010.
Estimates Developed by WHO, UNICEF, UNFPA and the World Bank. Geneva: World
Health Organization; 2012.
10. Ganesh D. Preventing Prolonged Labor by Using Partograph: Internet Journal of
Gynecology and Obstetrics 2007, 7 (1).
11. Akin JS, Birdsall N, De Ferranti DM, Bank W. 1987. Financing Health Services in
Developing Countries: An Agenda for Reform. World Bank Policy Study. Washington, D.C.:
World Bank.
12. Hardon A. 1990. Ten best readings in . . . the Bamako Initiative. Health Policy and
Planning 5: 186–9.
13. Dzakpasu S, Powell-Jackson T, Campbell OMR. Impact of user fees on maternal health
utilization and related health outcomes: a systematic review. Health Policy and Planning
2013; 1-14. doi:10.1093/heapol/czs142. (accessed 12th
April, 2014)
14. Akashi H, Yamada T, Huot E, Kanal K, Sugimoto T. 2004. User fees at a public hospital
in Cambodia: effects on hospital performance and provider attitudes. Social Science &
Medicine 58: 553–64.

45
15. Wilkinson D, Gouws E, Sach M, Karim SS. 2001. Effect of removing user fees on
attendance for curative and preventive primary health care services in rural South Africa.
Bulletin of the World Health Organization 79: 665–71.
16. Steinhardt LC, Aman I, Pakzad I et al. 2011. Removing user fees for basic health
services: a pilot study and national roll-out in Afghanistan. Health Policy and Planning 26:
ii92–103.
17. Jacobs B, Price N. 2004. The impact of the introduction of user fees at a district hospital
in Cambodia. Health Policy and Planning 19: 310–21.
18. Schneider H, Gilson L. 1999. The impact of free maternal health care in South Africa. In:
Berer M, Ravindran TKS (eds). Safe Motherhood Initiatives: Critical Issues. Oxford:
Blackwell Science
19. Ridde V, Richard F, Bicaba A, Queuille L, Conombo G. 2011. The national subsidy for
deliveries and emergency obstetric care in Burkina Faso. Health Policy and Planning 26:
ii30–40.
20. Ekwempu CC, Maine D, Olorukoba MB, Essien ES, Kisseka MN. 1990. Structural
adjustment and health in Africa. The Lancet 336: 56–7.
21. Owa JA, Osinaike AI, Makinde OO. 1995. Trends in utilization of obstetric care at
Wesley Guild Hospital, Ilesa, Nigeria. Tropical and Geographic Medicine 47: 86-8.

46
22. Asante FA, Chikwama C, Daniels A, Armar-Klemesu M. 2007. Evaluating the economic
outcomes of the policy of fee exemption for maternal delivery care in Ghana. Ghana Medical
Journal 41: 110–7.
23. BosuW.K, Bell J. S, Armar-Klemesu M, Tornui J. A. 2007. Effect of delivery care user
fee exemption policy on institutional maternal deaths in the Central and Volta Regions of
Ghana. Ghana Medical Journal 41: 118–24.
24. Witter S, Armar-Klemesu M, Dieng T. 2008. National fee exemption schemes for
deliveries: comparing the recent experiences of Ghana and Senegal. In: Richard F, Witter S,
De Brouwere V (eds). Reducing Financial Barriers to Obstetric Care in Low-income
Countries. Antwerp: ITG Press
25. Witter S, Dieng T, Mbengue D, Moreira I, De Brouwere V. 2010. The national free
delivery and caesarean policy in Senegal: evaluating process and outcomes. Health Policy
and Planning 25: 384–92.
26. Witter S, Khadka S, Nath H, Tiwari S. 2011. The national free delivery policy in Nepal:
early evidence of its effects on health facilities. Health Policy and Planning 26: ii84–91.
27. Daponte A, Guidozzi F, Marineanu A. 2000. Maternal mortality in a tertiary center after
introduction of free antenatal care. International Journal of Gynecology & Obstetrics 71:
127–33.

47
28. Penfold S, Harrison E, Bell J, Fitzmaurince A. 2007. Evaluation of the delivery fee
exemption policy in Ghana: population estimates of changes in delivery service utilization in
two regions. Ghana Medical Journal 41: 100–9.
29.Donabedian A. The quality of care. How can it be assessed? JAMA 1988; 260: 1743-8
30. Ministry of Medical Services, University of Nairobi and KEMRI Wellcome-Trust. 2013.
SIRCLE survey.
31. WHO. Preventing prolonged labour: a practical guide.ThePartograph, part
I,II,IIIGeneva,World Health Organization, 1994 (WHO/FHE/MSM/93.8; 93.9;93.10).
32. World Health Organization. The application of theWHOPartograph in the management of
labour. Report of a WHO multicentre study 1990-91. Maternal Health and Safe motherhood
Programme. Geneva.1994. WHO/FHE/MSN/94.4).
33. The WHO partograph in the management of labour. The Lancet.1994; 343:1399.
34. Wasike, C.S.G. Evaluation of the impact of the ministry of health partograph on active
management of labour at Moi Teaching and Referral Hospital Eldoret. MMed. Thesis
University of Nairobi. 199
35. Wamwana, E.B., Ndavi, P.M., Gichangi, P.B., et al. Quality of record keeping in the
intrapartum periodat the Provincial General Hospital, Kakamega, Kenya. East Afr. Med. J.
2007; 84:16.

48
36. Qureshi Z.P, Sekadde-Kigondu C, Mutiso S.M. Rapid Assessment of Partograph
Utilization in selected maternity units in Kenya. East African Medical Journal Vol. 87, No.6,
June 2012
37. Fawole AO, Hanyimbo KI, Adekanle DA. Knowledge and utilization of the Partograph
among obstetric care givers in South West Nigeria. African Reproductive Health 2008;
12(1):22-29
38. Orji E. Evaluating progress of labour in nulliparas and multiparas using the modified
WHO partograph. International Journal of Gynecology and Obstetrics 2008(102), 249-252
39. Fox N., Hunn A., Mathers N. Sampling and sample size calculation. The NIHR RDS for
the East Midlands/ Yorkshire and Humber 2007.
40. Kvale S; Brinkmann S. Interviews: Learning the Craft of Qualitative Research
Interviewing. 2009; 2nd Edition. London: Sage Publications Ltd.
41. Glesne C. Becoming Qualitative Researchers. An Introduction. 2006; 3rd ed.
Pearson/Allyn & Bacon.
42. Kenya Demographic Health Survey: Key Indicators report, 2014.

49
APPENDIX
APPENDIX I: PARTOGRAPH TOOL

50
APPENDIX II: QUESTIONNAIRE
SECTION A
Please enter the following information about the specific partograph:
Patient Identifier (e.g. IP number):………. Age:…………….
Parity: …………. Gravida:……….
Date that partograph was filled (Enter the date of delivery)………
SECTION B
Instruction: Please Tick as appropriate
Variable: Completeness
1. Categorize the completeness of the partograph based on the four parameters (Fetal
Monitoring/Progress of Labour/Maternal monitoring/Outcome)
Complete
Incomplete
Blank
Variable: Adequacy of filling
1. Categorize the quality of the Fetal Heart Rate Monitoring:
Adequate
Inadequate
Grossly inadequate

51
2. Initial cervical dilatation recorded?
Yes
No
3. Categorize the monitoring of cervical dilatation:
Adequate
Inadequate
Grossly inadequate
4. Categorize the quality of monitoring of “descent”:
Adequate
Inadequate
Grossly inadequate
5. Categorize the monitoring of “uterine contractions”:
Adequate
Inadequate
Grossly inadequate
6. Categorize the monitoring of “Maternal Blood Pressure”:
Adequate
Inadequate
Grossly inadequate
7. Categorize the monitoring of “Maternal Pulse Rate”:
Adequate
Inadequate
Grossly inadequate

52
8. Categorize the monitoring of “Maternal Temperature”:
Adequate
Inadequate
Grossly inadequate
9. Membrane intact/ruptured recording:
Yes
No
10. Recording of whether uterotonic (oxytocin or other) was used done:
Yes
No
11. Placenta status(complete/incomplete) recorded:
Yes
No
12. Approximate Blood loss recorded:
Yes
No
13. Presence of perineal tear/episiotomy recorded:
Yes
No
14. Baby alive/still birth recorded:
Yes
No
15. Apgar Score recorded:
Yes
No

53
16. Birth weight recorded:
Yes
No
17. Sex of the fetus recorded:
Yes
No
18. Whether rescuscitation done recorded:
Yes
No
19. Person who delivered the patient recorded:
Yes
No
20. Time and Date of delivery recorded:
Yes
No
Variable: Intervention characteristics
1. As per the wholistic evaluation of the partograph, was intervention needed?
Yes
No
If intervention was needed, proceed to (2), if answer “No”, proceed to (IV)
2. Was intervention done?
Yes
No

54
If answer is “Yes”, proceed to (3)(4), if answer “No”, proceed to (IV)
3. Was intervention appropriate?
Yes
No
4. Was intervention timely?
Yes
No
Variable: Outcome
1. Categorize the fetal outcome as per the Apgar score at 5 min:
Good
Borderline
Bad
Apgar score not indicated
2. What was the delivery outcome?
Spontaneous Vaginal Delivery
Assisted Vaginal Delivery
Emergency Caeserian Section
Not indicated

55
APPENDIX III: DUMMY TABLE FOR RESULTS
Period After Free Delivery Services
Period Before initiation of Free Delivery Services
July-Sep 2013
Oct-Dec 2013
Jul-Sep 2012
Oct-Dec 2012
No % No % No % No %
Completeness Complete
Incomplete
Blank
Adequacy of Filling
1. FHR Adequate
Inadequate
Grossly Inadequate
2. Initial Cervical dilatation
Yes
No
3. Cervical dilatation plotting
Adequate
Inadequate
Grossly inadequate
4. Cervical Descent plotting
Adequate
Inadequate
Grossly inadequate

56
Period After Free
Delivery Services
Period Before initiation
of Free Delivery Services
July-Sep
2013
Oct-Dec
2013
Jul-Sep
2012
Oct-Dec
2012
No % No % No % No %
Adequacy of Filling
5. Uterine Contractions
Plotting
Adequate
Inadequate
Grossly
Inadequate
6. Maternal BP Plotting Adequate
Inadequate
Grossly
inadequate
7. Maternal Pulse Rate
Plotting
Adequate
Inadequate
Grossly
inadequate
8. Maternal Temp
Plotting
Adequate
Inadequate
Grossly
inadequate
9. Membrane Status
(Ruptured/Intact)
Yes
No

57
Period After Free
Delivery Services
Period Before initiation
of Free Delivery Services
July-Sep
2013
Oct-Dec
2013
Jul-Sep
2012
Oct-Dec
2012
No % No % No % No %
Adequacy of Filling
10. Uterotonic use Yes
No
11. Placental
Status(complete/incomplete)
recording
Yes
No
12. Approximate blood loss
recording
Yes
No
13. Presence of perineal
tear/episiotomy recording
Yes
No
14. Baby (Alive/SB) recording Yes
No
15. Apgar score recorded Yes
No
16. Birth weight recorded Yes
No
17. Sex of the fetus recorded Yes
No

58
Period After Free
Delivery Services
Period Before initiation
of Free Delivery Services
July-Sep
2013
Oct-Dec
2013
Jul-Sep
2012
Oct-Dec
2012
No % No % No % No %
Intervention Characteristics
1. Intervention needed Yes
No
2. Intervention Done
where needed
Yes
No
3. Intervention appropriate
where was needed
Yes
No
4. Intervention timely
where was needed
Yes
No
Outcome
1. Apgar Score at 5 mins Good
Borderline
Bad
2. Delivery Outcome SVD
Assisted
Vaginal
Emergency
CS

59
APPENDIX III: TIMELINE
ACTIVITY
Apr-
Sep
2014
Oct-
Dec
2014
Jan
2015
Feb
2015
Mar
2015
Apr
2015
May
2015
June
2015
Proposal writing
and presentation
Ethical committee
approval
Pretesting of data
collecting tools
Data collection
Data consolidation
and analysis
Compilation of
report

60
APPENDIX IV: BUDGET
ITEM QUANTITY UNIT PRICE
(KSH)
TOTAL (KSH)
Biro pens 10 20 200
Pencils 6 10 60
Box files 1 150 150
Spring file 6 100 600
Sharpener 6 150 900
Erasers 6 20 120
Stapler 1 500 500
Paper punch 1 600 600
Staple remover 1 250 250
Notebook 1 100 100
Printing
QQquestionnaire
10 10 100
Photocopy 110*5 pages 2 1,100
Photocopy forms 110*5 pages 2 1,100
Sensitization 2 days 3000 6,000
Motivation pay
assistants
110 300 33,000
Communication
(telephone costs
and internet
bundles
- - 6,000
Data statistician 1 30,000 30,000
Transport - 20,000 20,000
Final book
bofinal proposal
booklet
4 1,500 6,000
Grand total 106,780

61
APPENDIX V: KNH ETHICAL APPROVAL LETTER