the effect of individual’s technological belief and usage
TRANSCRIPT

The Effect of Individual’s Technological Belief and Usage on
their Absorptive Capacity towards their Learning Behaviour in the Learning
Environment
II
University of Technology Sydney Faculty of Engineering and IT July 2020
The Effect of Individual’s Technological Belief and Usage on their Absorptive Capacity towards their Learning Behaviour in the Learning Environment by Thomas Dolmark Thesis submitted in fulfilment of the requirements for the degree of Masters by Research under the supervision of Dr Osama Sohaib and Professor Ghassan Beydoun

III
Certificate of Original Authorship
I, Thomas Dolmark declare that this thesis, is submitted in fulfilment of the
requirements for the award of Masters by Research, in the Information System
Modelling School at the Faculty of Engineering and IT at the University of Technology
Sydney.
This thesis is wholly my own work unless otherwise referenced or acknowledged. In
addition, I certify that all information sources and literature used are indicated in the
thesis.
This document has not been submitted for qualifications at any other academic
institution.
This research is supported by the Australian Government Research Training Program.
Signature:
Date: 21/09/20
Production Note:Signature removed prior to publication.

IV
Table of Content
Acknowledgement........................................................................................................ VIIIList of Publications ......................................................................................................... IX
Conference Paper ........................................................................................................ IXWorking Papers ........................................................................................................... IX
List of Abbreviations........................................................................................................ XAbstract ........................................................................................................................... XIList of Tables................................................................................................................ XIIIList of Figures .............................................................................................................. XIVChapter 1: Introduction ................................................................................................. 1
1.1 Statement of the Problem .................................................................................... 11.2 Research Questions ............................................................................................. 31.3 Purpose of the Study ........................................................................................... 31.4 Significance of the Study .................................................................................... 41.5 Thesis Outline ..................................................................................................... 5
Chapter 2: Literature Review ........................................................................................ 62.1 Explaining Knowledge........................................................................................ 62.2 Managing Knowledge ......................................................................................... 72.3 Barriers to Knowledge Transfer in Organisations .............................................. 82.4 Absorptive Capacity............................................................................................ 92.5 The Benefits of Technology in Learning .......................................................... 132.6 Technology Readiness Index ............................................................................ 142.7 Technology Readiness Persona......................................................................... 152.8 Tools for Knowledge Sources ........................................................................... 16
2.8.1 Benefits of Tools for Knowledge Sources ................................................ 172.8.2 The Failing of Tools for Knowledge Sources ........................................... 172.8.3 Organisational Responsibility ................................................................... 182.8.4 Conclusion ................................................................................................ 18
2.9 Social Influences ............................................................................................... 192.10 Social Networks ................................................................................................ 20
2.10.1 What is a Social Network .......................................................................... 202.10.2 Social Networks in Education ................................................................... 212.10.3 Conclusion ................................................................................................ 21
2.11 Beliefs Affects Learning Behaviour ................................................................. 212.11.1 Individual Work Performance ................................................................... 22
V
2.11.2 Conclusion ................................................................................................ 232.12 Chapter Summary ............................................................................................. 23
Chapter 3: Theoretical Background and Research Model .......................................... 253.1 Theoretical Foundation and Research Model ................................................... 25
3.1.1 Research Model ......................................................................................... 273.2 Hypothesis Development .................................................................................. 27
3.2.1 From TRI on ACAP .................................................................................. 273.2.2 TKS on ACAP .......................................................................................... 293.2.3 SI on ACAP .............................................................................................. 293.2.4 SN on ACAP ............................................................................................. 293.2.5 ACAP to Learning Behaviour ................................................................... 30
3.3 Chapter Summary ............................................................................................. 30Chapter 4: Research Methodology.............................................................................. 31
4.1 Research Design................................................................................................ 314.1.1 Data Collection Design ............................................................................. 314.1.2 Data Analysis Design ................................................................................ 32
4.2 Population and Sample ..................................................................................... 334.3 Instrumentation and Measurements .................................................................. 344.4 Items Table........................................................................................................ 38
4.4.1 Demographic Questions ............................................................................ 394.5 Ethics Consideration ......................................................................................... 474.6 Data Collection Procedure ................................................................................ 474.7 Data Analysis Process ....................................................................................... 48
4.7.1 Structural Equation Modelling (SEM) ...................................................... 484.7.2 Partial Least Square-Structural Equation Modelling ................................ 494.7.3 The PLS-SEM Algorithm ......................................................................... 554.7.4 Evaluation of PLS-SEM Results ............................................................... 56
4.8 Chapter Summary ............................................................................................. 64Chapter 5: Results ....................................................................................................... 66
5.1 Descriptive Analysis of Demographic Variables .............................................. 665.1.1 Gender Identity.......................................................................................... 665.1.2 Biological Age .......................................................................................... 685.1.3 Technological Age .................................................................................... 695.1.4 Provenance of Students ............................................................................. 705.1.5 Current Education ..................................................................................... 715.1.6 TRI Taxonomy .......................................................................................... 73
5.2 Stage 1 Measurement Model ............................................................................ 74

VI
5.2.1 Reliability and Validity ............................................................................. 745.3 Stage 2 Disjoint Approach ................................................................................ 81
5.3.1 Measurement Model.................................................................................. 815.3.2 Statistical Significance .............................................................................. 83
5.4 Chapter Summary ............................................................................................. 86Chapter 6: Discussion, Implication and Conclusion ................................................... 88
6.1 Revisiting the Research’s Aim and Objectives, Research Questions, and Hypotheses .................................................................................................................. 88
6.1.1 Aim: Confirm that an individual's technological beliefs have an effect on an individual's learning capabilities and their learning behaviour. ......................... 886.1.2 Objective 1: Provide empirical evidence. ................................................. 896.1.3 Objective 2: Determine which factor has an effect e.g. which TR dimension affects individual ACAP and learning behaviour. ................................. 896.1.4 Objective 3: Provide a model to build instruments. .................................. 896.1.5 Research Question ..................................................................................... 896.1.6 Hypotheses Results ................................................................................... 906.1.7 Conclusion ................................................................................................ 93
6.2 Discussion on Research Findings ..................................................................... 936.3 Contribution and Implications of the Results ................................................... 96
6.3.1 Theoretical Implications............................................................................ 966.3.2 Practical Implications ................................................................................ 97
6.4 Limitations and Recommendations for Future Research .................................. 986.4.1 Demographic Bias ..................................................................................... 986.4.2 Self-Reporting Bias ................................................................................... 996.4.3 Social Network is an Ambiguous Term .................................................... 996.4.4 An Organisation is Not Only the Sum of its Individuals ........................ 1006.4.5 The Truth in Absorptive Capacity........................................................... 1006.4.6 ACAP is a Dynamic Capability .............................................................. 1006.4.7 The Different Versions of ACAP ............................................................ 1016.4.8 PLS-SEM Limitations ............................................................................. 1016.4.9 Insecurity, Discomfort, TKS and SI ........................................................ 1016.4.10 Innovation Can Mean Many Different Things ........................................ 1026.4.11 The IWP Limitation ................................................................................ 1036.4.12 Limitations from Other Research ............................................................ 1036.4.13 Conclusion .............................................................................................. 103
6.5 Summary ......................................................................................................... 103References ..................................................................................................................... 105

VII
Appendix A Survey Items ............................................................................................. 114
VIII
Acknowledgement
I dedicate this thesis to my late grandmother Maria Dolmark. She, like many other
people, never had the opportunity to study even though her wisdom, love and strength
inspired me to pursue knowledge. This work is because of you Nona.
I wish to also thank my father Victor Dolmark. There are many people who are unable
to pursue further education. I wouldn’t have been able to do this without his continuous
and unconditional support.
I would like to thank the University of Technology Sydney (UTS), the teachers,
students and friends who supported me whilst writing this thesis, in particular my
supervisors Dr Osama Sohaib and Prof. Ghassan Beydoun; my friends at UTS such as
Diah Priharsari, Ezwan Shah Abd Majid, and Fatuma Kabuye; the School of
Information System Modelling and the Graduate Research School who support and
supply students with the resources necessary for them to achieve success; the proof-
readers who indicated when this thesis was unreadable; and finally, the admin and other
supporting staff who are often forgotten but never-the-less are ever present and helping.
I would not have been able to persist without the support of this community. In these
trying times (bush fires, COVID-19, and many other tragic events), I wish to send a
message of hope to those who are facing despair. To reach this point, it took a lifelong
journey punctuated with struggles. However, there is support and potential. Do not ever
let anyone hold you back and stick with those who will stand with you.
IX
List of Publications
Conference Paper
Dolmark, T., Sohaib, O. & Beydon, G. 2019, 'The Effect of Technology Readiness on
Individual Absorptive Capacity for Knowledge Transfer', ISD 2019, ed. C.B. A.
Siarheyeva, M. Lang, H. Linger, & C. Schneider, Information Systems Development:
Information Systems Beyond 2020 (ISD2019 Proceedings), Toulon, France: ISEN
Yncréa Méditerranée.
https://aisel.aisnet.org/isd2014/proceedings2019/ISDMethodologies/17/
Working Papers
Dolmark, T., Sohaib, O. & Beydon, G. ‘The Effect of Tools, Social Networks and
Social Influences on Individual Absorptive Capacity toward Learning Behavior in
Australian Universities’
Dolmark, T., Sohaib, O. & Beydon, G. ‘The Effect of Technology Readiness on
Individual Absorptive Capacity toward Learning Behavior in Australian Universities’
X
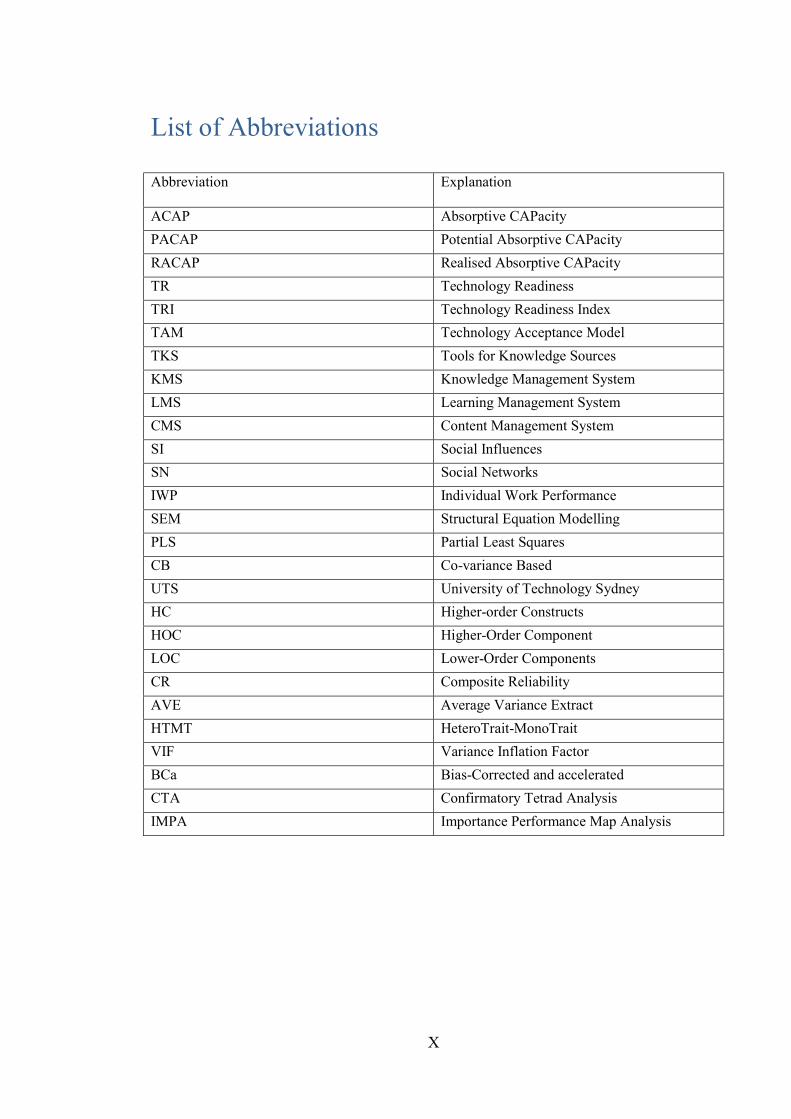
List of Abbreviations
Abbreviation Explanation
ACAP Absorptive CAPacity PACAP Potential Absorptive CAPacity RACAP Realised Absorptive CAPacity TR Technology Readiness TRI Technology Readiness Index TAM Technology Acceptance Model TKS Tools for Knowledge Sources KMS Knowledge Management System LMS Learning Management System CMS Content Management System SI Social Influences SN Social Networks IWP Individual Work Performance SEM Structural Equation Modelling PLS Partial Least Squares CB Co-variance Based UTS University of Technology Sydney HC Higher-order Constructs HOC Higher-Order Component LOC Lower-Order Components CR Composite Reliability AVE Average Variance Extract HTMT HeteroTrait-MonoTrait VIF Variance Inflation Factor BCa Bias-Corrected and accelerated CTA Confirmatory Tetrad Analysis IMPA Importance Performance Map Analysis

XI
Abstract
While hard to define, knowledge is critical for organisational success. Organisations
who know this spend a significant amount of resources to manage it. In organisations,
there are three common barriers to knowledge transfer which are causal ambiguity,
relation between knowledge holder and recipient, and recipient’s Absorptive CAPacity
(ACAP). Horizontal organizational structures appear to be an effective solution to
causal ambiguity and relation between knowledge holder and recipient because they
allow knowledge to flow across organisational silos. The recipient’s ACAP is defined as
a dynamic capability to absorb knowledge. While the content and its context are
important for knowledge transfer, technology can also enhance learning.
This study addressed the gap in knowledge by examining the role of Technology
Readiness (TR), Tools for Knowledge Sources (TKS), Social Influences (SI) and Social
Networks (SN) in an individual's ACAP towards learning behaviour. The research
addresses the following research question. What is the effect of an individual's
technological belief and use on their capability to absorb knowledge towards their
technological learning behaviour?
A research model is proposed to empirically test the relationship between TR and
individual's ACAP towards learning behaviour. As beliefs affect behaviour, the TRI
measures an individual's propensity towards technology. Other antecedents such as
TKS, SI and SN may also have an effect on an individual’s ACAP. To assess behaviour
under control of an individual the Individual Work Performance (IWP) was adapted
towards learning behaviours.
XII
To test the presence of a causal effect, this study applied a quantitative approach to
confirm theories. A survey was conducted at the University of Technology Sydney
(UTS). An online questionnaire was used to collect data from students. A total of 199
participated in the survey. This questionnaire borrowed items from other academic peer
reviewed journals. The data were analysed using the Partial Least Square (PLS)-
Structural Equation Modelling (SEM) approach. The PLS approach had many benefits
such as being flexible and the use of formative and reflective indicators. A High order
Construct (HC) allowed abstraction in the research model. The disjoint two-stage
approach enabled further validation of the measurement model in its second stage.
The results generated mixed findings. Among the different hypotheses enumerated, the
individual’s technological belief in Optimism and Innovation, and the SN had a
significantly very weak effect on individual ACAP which in turn had a significantly
weak effect on their learning behaviour. This study highlighted the need to assess
individual ACAP and learning behaviour.

XIII
List of Tables
Table 1. TRI Taxonomy Table ........................................................................................ 16
Table 2.Terms and Definition Table ............................................................................... 34
Table 3. Demographic Items ........................................................................................... 39
Table 4. Online Questionnaire Items .............................................................................. 40
Table 5. Gender Identity Count ....................................................................................... 67
Table 6. Other Gender Identities Responses ................................................................... 67
Table 7. Age Range Response Rate Count ..................................................................... 68
Table 8. Tech Age Response Rate Count........................................................................ 69
Table 9. Student Provenance Count ................................................................................ 70
Table 10. Other Responses Count ................................................................................... 70
Table 11. TR Dimensions Average and Median Response............................................. 73
Table 12. Stage 1 Reflective Indicator Outer Loadings .................................................. 75
Table 13. Stage 1 Reflective Indicator Construct Reliability and Average Variance Extracted ......................................................................................................................... 76
Table 14. Stage 1 Reflective Indicator Heterotrait-Monotrait Ratio .............................. 76
Table 15. Stage 1 Formative Indicator Statistical Significance ...................................... 77
Table 16. Stage 1 Collinearity Statistics VIF .................................................................. 79
Table 17. Disjoint Stage 2 Formative Indicator Statistical Significance ........................ 81
Table 18. Disjoint Stage 2 Collinearity Statistics VIF .................................................... 82
Table 19. Path Coefficients Relevance and Statistical Significance ............................... 83

XIV
List of Figures
Figure 1. Zahra and Georges (2002) ACAP framework. ................................................ 12
Figure 2. Research Model ............................................................................................... 27
Figure 3. Research Design Flow Chart ........................................................................... 33
Figure 4. Reflective Indicator and Construct Assessment, Outer Loading Relevance Testing (Hair 2017, p.114) .............................................................................................. 57
Figure 5. Formative Indicator and Construct Assessment, Outer Loading Relevance Testing (Hair 2017, p.150) .............................................................................................. 60
Figure 6. Gender Identity Distribution Pie Chart ............................................................ 67
Figure 7. Age Range Count Graph .................................................................................. 68
Figure 8. Tech Age Range Count Graph ......................................................................... 69
Figure 9. Student Provenance Distribution Pie Chart ..................................................... 71
Figure 10. Current Education Distribution Pie Chart...................................................... 72
Figure 11. Current Education Count Bar Chart .............................................................. 72
Figure 12. TR Dimensions Average and Median Response Graph ................................ 74
Figure 13. Disjoint Stage 2 Construct Effect Model ....................................................... 84
Figure 14. Summary of Research Results ....................................................................... 90
Page 1
Chapter 1: Introduction
1.1 Statement of the Problem
Davenport and Prusak (1998, p.2-6) distinguished between data, information and knowledge
as follows: when data has meaning, it is information; and when information has been
experienced, it is knowledge (Garavelli, Gorgoglione & Scozzi 2002; Karlsen & Gottschalk
2004). However, knowledge is a mix of various factors that are not clearly defined
(Davenport & Prusak 1998, p.5). It is intangible and difficult to imitate (Lopez-Cruz &
Garnica 2018). The undefinable portion of knowledge is called tacit (Polanyi 1967', p.4-5).
Tacit knowledge is hard to encode as it is personal and difficult to formalize, this makes it
more difficult to transfer (Goh 2002; Polanyi 1967', p.4-5). This tacit portion of knowledge
can be subject to misinterpretation or dispute (Bhatt 2001). However, experience does clearly
help develop knowledge (Davenport & Prusak 1998, p.7).
Knowledge is considered critical for organisations to succeed (Karlsen & Gottschalk 2004).
Managers who do not leverage knowledge are jeopardizing their operations (Prusak 1997).
Organisations that recognize the importance of knowledge spend a lot of resources to manage
it (Iyengar, Sweeney & Montealegre 2015). They attempt to transfer knowledge where it can
be used (Kuo & Lee 2009; Vance & Eynon 1998). Knowledge transfer is in part a
communication process (Vance & Eynon 1998) which is affected by the subjects' objectives,
experiences, values and context (Garavelli, Gorgoglione & Scozzi 2002). Knowledge can
only be of value if it can be accessed when it is needed (Karlsen & Gottschalk 2004). It is
useless if it is accessed in hindsight (Kuo & Lee 2009). And yet being overwhelmed with
information yields little value: only information that an individual reflects or learns has value
(Kuo & Lee 2009). However, even if organisations fully commit to knowledge management,
Page 2
barriers to knowledge transfer can still exist (Szulanski 1996). In organisations, these barriers
are causal ambiguity, an arduous rapport between knowledge holder and recipient, and
recipient's ACAP (Szulanski 1996). Employee motivation is not a barrier in knowledge
transfer (Szulanski 1996). Causal ambiguity is when the cause of an effect is uncertain or
unknown (Szulanski 1996). It is more likely to be addressed when subunits share knowledge
(Uygur 2013) which can be accomplished with horizontal cross-functional communication
flows. An arduous relation between the knowledge holder and recipient is another barrier to
knowledge transfer (Szulanski 1996). Withholding critical information is considered as a
means for managers to assert power (Goh 2002). This is believed to stem from a punitive and
distrustful organisational culture rather than a technological issue (Goh 2002). Horizontal
structures differ from the traditional vertical hierarchy as they allow communication to flow
across business functions (Goh 2002). They appear to be an effective solution to causal
ambiguity, and rapport between knowledge holder and recipient (Tang, Xi & Ma 2006;
Uygur 2013). In this case the recipient’s ACAP remains.
The recipient’s ACAP is important as organisations learn through its members (Cohen &
Levinthal 1990). Yet, there is little research into individual ACAP (Lowik, Kraaijenbrink &
Groen 2017; Minbaeva, Mäkelä & Rabbiosi 2012; Yao & Chang 2017). Technologies and
systems can enhance an individual’s learning capability (Hamilton, Rosenberg & Akcaoglu
2016). When assistive learning technologies were introduced in American universities,
students capabilities improved beyond their education (Raskind & Scott 1993). Content and
its context are important for pedagogy and their transformation is enabled by technology
(Beydoun, Kultchitsky & Manasseh 2007; Koehler et al. 2014). An individual’s behaviour is
influenced by their beliefs (Ajzen 1991), their cognition and the affection they receive (Ajzen
2011). An individual’s belief towards technology can be measured by the TRI. This aligns
well with individuals (Lin, Shih & Sher 2007). The outcome behaviours of individuals can be
Page 3
assessed with the IWP which can be adapted to construct a generic questionnaire (Koopmans
et al. 2013).
1.2 Research Questions
What is the effect of an individual's technological belief and use on their capability to absorb
knowledge to their technological learning behaviour?
1.3 Purpose of the Study
This research aims to confirm if an individual’s technological belief and usage have an effect
on an individual's learning capability and their technological learning behaviours. Its purpose
is to provide empirical evidence of any causal-effect. To accomplish this, this study proposes
to use the following conceptual framework:
The ACAP by Zahra & George (2002) reduced at the individual scope to assess their
capability to absorb knowledge,
The TRI v2.0 from Parasuraman & Colby (2015) to measure an individual's
technological belief.
Kelman (1958) SI to assess an individual’s subjective norm.
Individual use of TKS and SN.
The IWP (Koopmans et al. 2013) to assess an individual's learning behaviour,
Finally, Ajzen (1991) theory of planned behaviour which states that belief affects
behaviour to underpin the model.
To provide empirical evidence of the causal effect, a quantitative approach is preferred.
Quantitative research seeks to provide truth using an objective scientific method (Bloomfield
& Fisher 2019). It is suitable to confirm theories (Teddlie & Tashakkori 2009, p.22) as it
provides methods (Watson 2015) that use statistical analysis for numerical data to test
Page 4
hypotheses (Bloomfield & Fisher 2019). Small sample sizes run the risk of not gathering
enough data to support hypotheses (Fowler & Lapp 2019). Also, the chance of outliers is
reduced with a large population sample (Fowler & Lapp 2019). An online web questionnaire
allows collecting data from participants within a short amount of time over a large geographic
area (Wright 2017). A quantitative approach would use statistical analysis with numerical
data from a large population sample to confirm the existence of a causal-effect from an
individual's technological belief and use to their capability and learning.
As SEM is the preferred technique to test causal-effect (Hair Jr., Sarstedt, et al. 2014), the
PLS-SEM is a well-established analysis method. It has fewer restrictions regarding
assumptions (Hair, Ringle & Sarstedt 2011; Hair, Risher & Ringle 2019). It can be used for a
small sample size (Hair, Ringle & Sarstedt 2011; Hair, Risher & Ringle 2019). It can work
with non-normal data (Cassel, Hackl & Westlund 1999; Hair Jr., Sarstedt, et al. 2014). It does
not rely on the model fit concept (Hair Joseph, Sarstedt & Ringle 2019). The research model
has formative constructs and hence PLS-SEM is preferred (Hair, Risher & Ringle 2019). It is
suitable for theory confirmation and testing (Hair, Ringle & Sarstedt 2011; Hair, Risher &
Ringle 2019). For this study, a quantitative approach is preferred to provide empirical
evidence by testing hypotheses using PLS-SEM statistical analysis with numerical data
gathered with online questionnaires.
1.4 Significance of the Study
This study has many benefits. The research findings provide insight into which individual
technological beliefs and use would impact an individual's learning capability and their
learning behaviour. More research into individual ACAP may help further understand
creativity and innovation (Da Silva & Davis 2011). Findings would confirm if an individual's
belief in technological innovation has an effect of either positive or negative on their ACAP.
Page 5
Insight into which learning capability and behaviour is affected by which individual
technological belief and its use would provide guidance as to where to direct efforts when
developing technologies and pedagogical methods using technology. This study also provides
a model that can be repurposed. While frameworks can at times be poor, frameworks can still
offer advantages and remain useful; thus, “it is better to have some than none” (Mishra &
Koehler 2006). The means to evaluate e-learning services and delivery must be developed by
both practitioners and researchers (Adeyinka et al. 2010; Saarinen 1996). The research model
could be repurposed to build instruments to help pedagogues and their students but as well as
businesses. This study also contributes to the literature on individual ACAP, technology, and
knowledge transfer as individual ACAP as a barrier remains little researched (Lowik,
Kraaijenbrink & Groen 2017; Minbaeva, Mäkelä & Rabbiosi 2012). The findings provide
results that are applicable beyond education; its significance would be greater than its
context. All these benefits would be significant to pedagogues, engineers, businesses and any
other stakeholder involved in the transfer of knowledge using technology.
1.5 Thesis Outline
This chapter introduced the research’s problem, question, purpose and significance. The next
chapter reviews the literature to further expand the background of the research’s problem and
its question. Chapter 3 introduces a research model and uses the theoretical background to
build the research hypotheses. Chapter 4 explains the rationale behind the design for this
study and justifies the PLS-SEM method as it is the method of analysis. Chapter 5 provides
the results of said analysis enumerating which null hypotheses have not been rejected.
Chapter 6 concludes with a summary of its results, implication, limitation, and
recommendations for future research.
Page 6
Chapter 2: Literature Review
This chapter reviews literature to establish and consolidate the research question. It begins
with a rough explanation of knowledge. It proceeds to explaining how knowledge can be and
is managed along with its shortfalls. The barriers to knowledge transfer in organisations are
explained along their potential solutions. As ACAP remains a barrier without a clear solution,
ACAP is introduced as the central scope of this research. A case is then made to present
technology as an enabler of learning. The TRI is then presented as a framework that measures
an individual's propensity towards technology. The TRI taxonomy is useful for categorising a
sample population. TKS is argued to have an effect on individual ACAP. SI and SN contend
that they are influences on individual ACAP, and are posited to have an impact on individual
ACAP. Finally, IWP is proposed as a framework to measure the outcome behaviour from an
individual.
2.1 Explaining Knowledge
To understand knowledge management or its transfer; knowledge must first be properly
understood. As discussed earlier in Chapter 1 Section 1, information is data that meaning and
knowledge is information with experience (Davenport & Prusak 1998, p.2-6; Garavelli,
Gorgoglione & Scozzi 2002; Karlsen & Gottschalk 2004). The various factors that make
knowledge are not clearly defined (Davenport & Prusak 1998, p.5). While intangible and
difficult to imitate (Lopez-Cruz & Garnica 2018), experience does help develop knowledge
(Davenport & Prusak 1998, p.7). The undefinable portion of knowledge is referred to as tacit
knowledge (Polanyi 1962, p.90; Polanyi 1967, p.4-5). Examples of tacit knowledge would be
riding a bike or intuition. This tacit portion of knowledge can be subject to misinterpretation
or dispute (Bhatt 2001). Tacit knowledge cannot be reduced nor codified into information
(Lopez-Cruz & Garnica 2018). Tacit knowledge is hard to encode as it is personal and
Page 7
difficult to formalise, and this makes it more difficult to transfer (Goh 2002; Polanyi 1967,
p.4-5).
Knowledge transfer is in part a communication process (Vance & Eynon 1998). This
communication process begins with the sender encoding information into data, and then this
data is transmitted across a medium which can be subjected to pollution (Vance & Eynon
1998). Finally, this data is collected and decoded into information by the receiver (Vance &
Eynon 1998). This codification process is affected by the subjects' objectives, experiences,
values and context (Garavelli, Gorgoglione & Scozzi 2002). Alas, when organisations
attempt to manage or transfer knowledge, they neglect the recipient’s perspective and his
prior experiences (Bhatt 2001; Muhammad et al. 2016). Being overwhelmed with
information yields little value; only information that an individual reflects or learns has value
(Kuo & Lee 2009).
2.2 Managing Knowledge
Knowledge is critical for organisational success(Garavelli, Gorgoglione & Scozzi 2002; Goh
2002; Hwang et al. 2008; Karlsen & Gottschalk 2004; Othman, Beydoun & Sugumaran
2014). Organisations that recognise this spend significant resources to manage it (Iyengar,
Sweeney & Montealegre 2015). When knowledge is not used, it loiters, until, it becomes
redundant (Prusak 1997). This led to Hewlett-Packard's famous statement, "If only HP knew
what HP knows, we could be three times more productive!" (Prusak 1997). Managers who do
not leverage knowledge are jeopardising their operations (Prusak 1997).
As competition pressures businesses to leverage knowledge, the need for knowledge
increases (García-Morales, Ruiz-Moreno & Llorens-Montes 2007; Iyengar, Sweeney &
Montealegre 2015; Prusak 1997). In a product’s life cycle, each phase has a different
knowledge absorption requirement (Zou, Guo & Guo 2016). In the introduction and decline
Page 8
phases, organisations have little to no need for knowledge whereas in the growth and
maturity phase, the need for knowledge is at its highest (Zou, Guo & Guo 2016). Ultimately,
when a project ends, its resources are scattered along with its knowledge (Karlsen &
Gottschalk 2004; Prusak 1997). This is to the detriment of organisations (Prusak 1997).
Knowledge can only be of value if it can be accessed when it is needed (Karlsen &
Gottschalk 2004). It is useless if it is accessed in hindsight (Kuo & Lee 2009; Othman,
Beydoun & Sugumaran 2014). Organisations that are aware of this attempt to transfer
knowledge where it can be used (Kuo & Lee 2009; Vance & Eynon 1998). In organisations,
knowledge is relevant, time and task sensitive (Garavelli, Gorgoglione & Scozzi 2002; Kuo
& Lee 2009; Othman, Beydoun & Sugumaran 2014; Vance & Eynon 1998).
When organisations are effective at managing knowledge, their ability to innovate improves
(García-Morales, Ruiz-Moreno & Llorens-Montes 2007). They then gain a strategic
competitive advantage (Iyengar, Sweeney & Montealegre 2015; Karlsen & Gottschalk 2004;
Lin, Chang & Chang 2004; Szulanski 1996). They also gain other benefits such as reduced
reinvention of wheels, less work generated, fewer questions, better decisions, error reduction,
more independence for knowledge workers, improved customer relations, service and
profitability (Karlsen & Gottschalk 2004).
2.3 Barriers to Knowledge Transfer in Organisations
Even if organisations fully commit to knowledge management, barriers to knowledge transfer
can still exist (Szulanski 1996). In organisations, these barriers are causal ambiguity, an
arduous rapport between knowledge holder and recipient, and recipient's ACAP (Szulanski
1996). Employee motivation was also discovered to not be a barrier in knowledge transfer
(Szulanski 1996). Causal ambiguity is when the cause of an effect is uncertain or unknown
(Szulanski 1996). Causal ambiguity is more likely to be addressed when subunits share

Page 9
knowledge (Uygur 2013) which can be accomplished with horizontal cross-functional
communication flows. An arduous relations between the knowledge holder and recipient is
another barrier to knowledge transfer (Szulanski 1996). Withholding critical information is
considered as a means to assert power by managers (Goh 2002). This is believed to stem
from a punitive and distrustful organisational culture rather than a technological issue (Goh
2002). Horizontal structures have a positive effect by promoting trust and by disseminating
aspiration (Goh 2002; Karlsen & Gottschalk 2004; Tang, Xi & Ma 2006; Uygur 2013). These
structures differ from the traditional vertical hierarchy as they allow communication to flow
across business functions (Goh 2002). Horizontal organisational structures appear to be an
effective solution to causal ambiguity, and rapport between knowledge holder and recipient
(Karlsen & Gottschalk 2004; Tang, Xi & Ma 2006; Uygur 2013). Recipient’s ACAP remains.
2.4 Absorptive Capacity
Some organisations try to absorb knowledge from external sources (García-Morales, Ruiz-
Moreno & Llorens-Montes 2007). This differs from the process of formalizing new
knowledge which is also known as retentive capacity (Szulanski 1996). Absorbing external
knowledge is referred to as ACAP (Cohen & Levinthal 1990). The ability to absorb new
external knowledge can provide significant benefits (Jansen, Van Den Bosch & Volberda
2005). For example, when an organisation’s ACAP is increased, the organisation’s aspiration
will shift from measuring performances to observing emerging market opportunities (Cohen
& Levinthal 1990).
Cohen & Levinthal (1990) first introduced the concept of ACAP as an organisation’s
capability to absorb knowledge. Zahra & George (2002) further developed a conceptual
framework illustrating ACAP. This framework recognises four different capabilities in the
absorption process (see Figure 1.):
Page 10
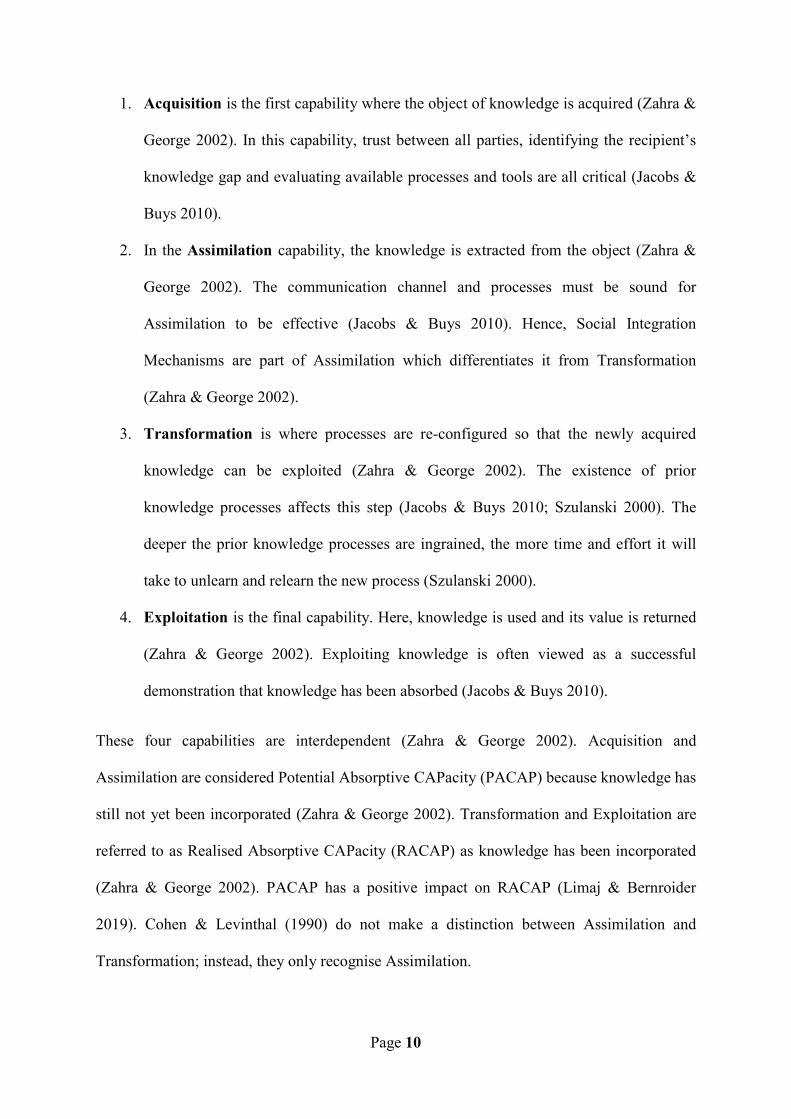
1. Acquisition is the first capability where the object of knowledge is acquired (Zahra &
George 2002). In this capability, trust between all parties, identifying the recipient’s
knowledge gap and evaluating available processes and tools are all critical (Jacobs &
Buys 2010).
2. In the Assimilation capability, the knowledge is extracted from the object (Zahra &
George 2002). The communication channel and processes must be sound for
Assimilation to be effective (Jacobs & Buys 2010). Hence, Social Integration
Mechanisms are part of Assimilation which differentiates it from Transformation
(Zahra & George 2002).
3. Transformation is where processes are re-configured so that the newly acquired
knowledge can be exploited (Zahra & George 2002). The existence of prior
knowledge processes affects this step (Jacobs & Buys 2010; Szulanski 2000). The
deeper the prior knowledge processes are ingrained, the more time and effort it will
take to unlearn and relearn the new process (Szulanski 2000).
4. Exploitation is the final capability. Here, knowledge is used and its value is returned
(Zahra & George 2002). Exploiting knowledge is often viewed as a successful
demonstration that knowledge has been absorbed (Jacobs & Buys 2010).
These four capabilities are interdependent (Zahra & George 2002). Acquisition and
Assimilation are considered Potential Absorptive CAPacity (PACAP) because knowledge has
still not yet been incorporated (Zahra & George 2002). Transformation and Exploitation are
referred to as Realised Absorptive CAPacity (RACAP) as knowledge has been incorporated
(Zahra & George 2002). PACAP has a positive impact on RACAP (Limaj & Bernroider
2019). Cohen & Levinthal (1990) do not make a distinction between Assimilation and
Transformation; instead, they only recognise Assimilation.

Page 11
Antecedents can affect ACAP differently which can lead to different performance (Jansen,
Van Den Bosch & Volberda 2005). These antecedents are:
Knowledge Sources refers to external sources of knowledge that can be acquired by a
firm in both breadth and depth {Zahra, 2002 #84}.
Experience defines the future capabilities to acquire knowledge {Zahra, 2002 #84}. It
also impacts other capabilities through memory {Zahra, 2002 #84}. The
transformation capability is affected by how deep the knowledge processes are
ingrained {Zahra, 2002 #84}. This depth of knowledge is affected by experience.
Advantages represent the benefits that results from the absorption of knowledge
{Zahra, 2002 #84}.
Other external factors affect ACAP:
Activation Triggers are events that stimulate the process of absorbing knowledge
{Zahra, 2002 #84}. Activation Triggers “triggers” ACAP.
Comprehension and understanding is affected by group heuristics which are made of
social interactions {Zahra, 2002 #84}. Social Integration Mechanism is that social
interaction which affects the comprehension and understanding that make
Assimilation.
Regime of Appropriablity is the resulting difficult to imitate value from the
Advantages {Zahra, 2002 #84}.

Figure 1.
This framework is not hard d
dynamic when its resources an
an advantage (Teece, Pisano &
protected while the relevant co
1997). A dynamic capability i
such as organisations.
While this framework was de
level (Lowik, Kraaijenbrink &
innovation, performance and
(Jansen, Van Den Bosch & V
Chang 2017). Pfeffer & Sala
goals are supposedly expecte
Cohen and Levinthal (1990,
depend on the absorptive cap
capacity is not simply the sum
are part of organisations (Coh
Page 12
Zahra and Georges (2002) ACAP framework.
defined, it is dynamic (Zahra & George 200
nd competencies are combined to expand its
& Shuen 1997). Said resources can be develo
ompetencies can be internal or external (Teec
is influenced by its environment (Teece, Pisa
eveloped for organisations, research has used
& Groen 2017). Most of the research into A
d knowledge transfer from the perspectiv
Volberda 2005; Lowik, Kraaijenbrink & G
ancik (1979) say that the individual’s role
ed to be fundamentally interdependent (Prad
p.131) state that “an organization's absorp
acities of its individual members” and that “
m of the absorptive capacities of its employe
hen & Levinthal 1990, p.131), organisation’s
02). A capability is
dimensions to gain
oped, deployed and
ce, Pisano & Shuen
ano & Shuen 1997)
d it at an individual
ACAP has been into
e of organisations
Groen 2017; Yao &
and organisational
dhan & Jena 2017).
ptive capacity will
“a firm's absorptive
ees”. As individuals
knowledge transfer
Page 13
stems from individuals behaviour (Minbaeva, Mäkelä & Rabbiosi 2012). ACAP was initially
conceptualised from individuals’ learning cognitive ability (Cohen & Levinthal 1990).
Individual ACAP as a barrier remains little researched (Lowik, Kraaijenbrink & Groen 2017;
Minbaeva, Mäkelä & Rabbiosi 2012).
2.5 The Benefits of Technology in Learning
Technology changes almost all human work processes (Mishra & Koehler 2006). In the early
1990’s, American campuses introduced assistive technologies to students with learning
disabilities (Day & Edwards 1996). Such technologies would include word processors, spell
checkers, outlining, speech recognition, screen readers, personal data managers, and many
more (Raskind 1993). The introduction of word processors enabled iterative writing process
which allowed students to write better assignments (Collins 1990). These students would still
benefit from using these technologies beyond tertiary education (Raskind & Scott 1993).
Today, such technologies have become accepted standards and are currently used by people
with no learning disabilities.
Technology enables the transformation of content and pedagogy (Beydoun, Kultchitsky &
Manasseh 2007; Koehler et al. 2014) that can enhance learning (Hamilton, Rosenberg &
Akcaoglu 2016). However the integration of technology in education is not without risks.
When a technology is not aligned with its learning task, it can impact a person’s learning
outcome and potentially further leave them behind (Lust et al. 2012). Selecting the right
technology for learning will depend on the impact it will have on a person which can be
different for each individual (Lust et al. 2012). Nevertheless, education is turning towards
technologies to enhance learning experiences (Chan, Chow & Jia 2003). Technologies were
meant to support learning (Hamilton, Rosenberg & Akcaoglu 2016). There is an interest in
Page 14
understanding how technologies affects students and their abilities beyond education (Coates,
James & Baldwin 2005).
2.6 Technology Readiness Index
With the rise of self-serving technologies, organisations needed a framework to better profile
their customers (Parasuraman 2000). Parasuraman (2000) proposed the TRI which measures
people's predisposition towards technology. TRI is not to be confused with Technology
Readiness Level (TRL) which are different levels of a technology’s development and handoff
which was first developed by NASA (Sadin, Povinelli & Rosen 1989). As self-teaching
technologies and dynamic e-learning have been advancing (Muhammad et al. 2016), the TRI
is instructive. Since the original conception of the TRI, it has been streamlined into a new
version which is called TRI 2.0 (Parasuraman & Colby 2015). It retains the four following
core dimensions (Parasuraman & Colby 2015):
Optimism is the belief that technology offers more control, flexibility and efficiency
(Parasuraman 2000).
Innovation is the trend where a technology is a leader or pioneer (Parasuraman
2000).
Insecurity measures scepticism and distrust towards technology (Parasuraman 2000).
Discomfort represents the feeling of being overwhelmed by technology and its
perceived lack of control (Parasuraman 2000).
Optimism and Innovation are considered to be motivators as they motivate individuals to use
technology (Parasuraman 2000). Optimism here is in the context of technology, whereas the
discovery of Szulanski (1996)is that motivation was not a barrier is different then what it was
in the context of knowledge. Also, Walczuch, Lemmink & Streukens (2007) later discovered
that Innovation negatively impacted Perceived Usefulness. Insecurity and Discomfort are
Page 15
viewed as inhibitors as they inhibit technology adoption (Parasuraman 2000). TR is
individual specific unlike Technology Acceptance Model (TAM) which is system specific
(Lin, Shih & Sher 2007). Research has already examined the relationship between TAM and
TRI (Hallikainen & Laukkanen 2016; Walczuch, Lemmink & Streukens 2007). The TR is
more detailed as it has four dimensions as opposed to TAM’s two beliefs model. TR is
individual specific in contrast to the system specific TAM (Lin, Shih & Sher 2007). The TR
is better suited for research into individual ACAP.
2.7 Technology Readiness Persona
The TR was used as a taxonomy to segregate people into the following different personas
(Colby & Parasuraman 2001, p. 59-60) (see Table 1.):
Explorers are the first adopters of technologies as they have the highest amount of
motivation and the least amount of fear (Colby & Parasuraman 2001, p.72-74).
Pioneers generally follow explorers as they consider the practical aspects of
technologies (Colby & Parasuraman 2001, p.75-77).
Sceptics need to be convinced before they adopt a new technology (Colby &
Parasuraman 2001, p.77-80).
Americans also have Paranoids (Tsikriktsis 2004). Paranoids are greatly concerned
about risk (Colby & Parasuraman 2001, p.80-83).
Finally, Laggards will only adopt new technology if they are forced to do so (Colby
& Parasuraman 2001, p.83-86).

Page 16
Table 1. TRI Taxonomy Table
Motivators Inhibitors
Optimism Innovation Discomfort Insecurity
Explorers High High Low Low
Pioneers High High High High
Sceptics Low Low Low Low
Paranoids High Low High High
Laggards Low Low High High
This table illustrates the relation between the TR dimensions and its profile (Colby & Parasuraman 2001, p.61). White and grey are respectively used to point out positives and negatives. In inhibitors, low (white) would be positive and high (grey) would be negative.
As taxonomies are a grading classification, the TR taxonomy appears similar to the adopters
from the Diffusion of Innovations theory. While said theory states that innovation is diffused
through communication over time within social systems (Rogers 2003, p.358-359), it is based
on market data (Rogers 2003, p.280), and thus, it is more product specific (Lin, Shih & Sher
2007). Whereas the TR personas was not based on market data, it was based on profile data
(Colby 2002, p.33), hence; it is more individually focused (Lin, Shih & Sher 2007).
Ultimately, individuals would fall into one of these personas based on their beliefs in
adopting technology (Colby 2002, p.34).
2.8 Tools for Knowledge Sources
Technologies can encourage knowledge management and its transfer (Iyengar, Sweeney &
Montealegre 2015). For example, one of the methods for organisations to manage knowledge
is to implement a Knowledge Management System (KMS)(Karlsen & Gottschalk 2004; Kuo
& Lee 2009; Vance & Eynon 1998; Wang, Wang & Shee 2007). These can also be referred
Page 17
to as ‘‘learning platforms’’, ‘‘distributed learning systems’’, ‘‘course management systems’’,
‘‘content management systems’’, ‘‘portals’’, and ‘‘instructional management systems’’
(Coates, James & Baldwin 2005). These tools or systems that are used to access knowledge
sources could simply be referred to as TKS. These often attempt to capture tacit and explicit
knowledge in organisations to be reused (Damodaran & Olphert 2000; Kuo & Lee 2009).
They are meant to make learning more efficient by delivering content in a malleable manner
(Lust et al. 2012).
2.8.1 Benefits of Tools for Knowledge Sources
While there may be nuances for each one, they can provide some of the following functions:
content development and delivery (internet links, resources and developing object
repositories for learning); formative and summative assessments (online questionnaires,
submission, collaborative spaces and feedback); communication synchronous and
asynchronous (discussion forums, e-mail, list servers, chat and instant messaging); and user
and class management (enrolment and registration, timetables, management of student
activities and office hours) within limitations set by the systems customisation capabilities
(Coates, James & Baldwin 2005). These systems can also be integrated with other ones
(Coates, James & Baldwin 2005). To reduce the workload on staff, templates are often used
to standardise and guide the formalisation of knowledge (Coates, James & Baldwin 2005).
2.8.2 The Failing of Tools for Knowledge Sources
However, these systems can be ineffective at managing knowledge as they treats knowledge
as if it was some sort of stock (Garavelli, Gorgoglione & Scozzi 2002; Lin & Huang 2008).
Knowledge is not simply data on a repository (Cohen & Levinthal 1990; Goh 2002). While
technology can easily transform data into information, it is ineffective at transforming
information into knowledge (Bhatt 2001). Technology is believed to be incapable of catering
Page 18
to its user as it is thought to be unable to reconfigure how it presents knowledge (Bhatt 2001).
These systems must present knowledge easily and effectively for it to be easily
comprehended and appropriately assimilated by its user (Kuo & Lee 2009). Assimilation
relies on social interactions which can make it very slow (Bhatt 2001). The effectiveness of
these systems for its users to absorb its knowledge relies on a culture that develops and shares
knowledge which requires nurturing trust in technology and people (Adams & Lamont 2003;
Damodaran & Olphert 2000).
2.8.3 Organisational Responsibility
Antecedents such as knowledge sources can affect absorption of knowledge differently which
can lead to different performances (Jansen, Van Den Bosch & Volberda 2005). Leadership
can determine the impact of TKS by promoting, reflecting and understanding its effect on
learning (Coates, James & Baldwin 2005). Committing to one system can also mean
exclusion from another (Coates, James & Baldwin 2005). Organisations that outsource their
systems give away control and its content into the hands of other organisations whose
operations may not be aligned with their own (Coates, James & Baldwin 2005). Knowledge
management and its transfer requires organisations full commitment from the start in order to
succeed (Garavelli, Gorgoglione & Scozzi 2002; García-Morales, Ruiz-Moreno & Llorens-
Montes 2007; Goh 2002; Iyengar, Sweeney & Montealegre 2015; Karlsen & Gottschalk
2004; Kumar & Bradford 2017; Lin, Chang & Chang 2004; Minbaeva, Mäkelä & Rabbiosi
2012; Prusak 1997; Uygur 2013; Walczuch, Lemmink & Streukens 2007).
2.8.4 Conclusion
The evaluation of these systems is important as organisations invest considerable amounts
(Adeyinka et al. 2010; Saarinen 1996). The effect TKS has on an individual ACAP would be
of value to said evaluation.

Page 19
2.9 Social Influences
Assimilation relies on comprehension and understanding which is shaped by group heuristic
(Zahra & George 2002). These group heuristics are influenced by social processes. Kelman
(1958) proposes the three social processes of Compliance, Identification and Internalisation
that he calls SI:
Compliance is described as when an individual accepts influence because he wishes
to please another person or group to obtain a reward or avoid punishment while still
disagreeing with said person’s or group's’ value (Kelman 1958). The individual will
only comply with SI when he believes he is being watched by influential agents
(Kelman 1958). Here, the power of the agent’s SI is known as conformity (Kelman
1958).
Identification often means that an individual accepts and defines himself based on
the influence of another person or group (Kelman 1958). The individual adopts the
role of the other where his responses are defined by identity irrespective of values
(Kelman 1958). Identification tends to occur when the individual’s relation to the
agent will stand out (Kelman 1958). The individual will often identify with an agent
they find attractive (Kelman 1958).
Internalisation is when an individual accepts influence because the values that are
presented match his or her own (Kelman 1958). The individual will consider the
influence to shape his behaviour or actions if it is a useful solution (Kelman 1958).
The individual will internally conform based on the agent’s credibility (Kelman
1958). The individual will accept the influence of the agent based on its relevance to
an issue irrespective of being watched or standing out (Kelman 1958).

Page 20
Venkatesh et al. (2003) suggested that experienced workers and women would rely more on
SI when adopting systems. It would be interesting to assess the effect SI has on individual
ACAP through assimilation.
2.10 Social Networks
SN refers to using online spaces to connect, communicate, share, socialise, entertain, work
and so on and so forth (Beydoun, Kultchitsky & Manasseh 2007; Gupta & Bashir 2018). SNS
allows extensive access to different sources of information (Gupta & Bashir 2018). With the
introduction of mobile device applications, the popularity of SN is increasing, especially with
lonely or young adults (Gupta & Bashir 2018; Leung 2002; Morahan-Martin & Schumacher
2003; Pempek, Yermolayeva & Calvert 2009).
2.10.1 What is a Social Network
As a communication tool, SN are capable of combining interpersonal and mass
communication together (Boyd & Ellison 2007; Gupta & Bashir 2018; Pempek, Yermolayeva
& Calvert 2009). While websites are focused on interests and their communities, SN are
centred around people (Boyd & Ellison 2007). They differ from each other in their user
access and visibility controls (Boyd & Ellison 2007). SN provide the opportunity to connect
individuals with similar interests that otherwise could not (Gupta & Bashir 2018;
Haythornthwaite 2005). SN facilitate creating new and adding latent ties (Ellison, Steinfield
& Lampe 2007; Gupta & Bashir 2018; Haythornthwaite 2005) which have the potential to
become stronger ones (Haythornthwaite 2005). As users interact with each other, weak and
latent ties can turn into strong ones (Haythornthwaite 2005). Increasing ties enhances social
capabilities which benefit ACAP (Jansen, Van Den Bosch & Volberda 2005). However, most
users of SN are not looking to create new connections but instead are seeking to extend their
already existing SN (Boyd & Ellison 2007; Ellison, Steinfield & Lampe 2007; Gupta
Page 21
&Bashir 2018; Subrahmanyam et al. 2008). SN are dependent on reciprocal trust which acts
as a social glue (Kamel Boulos & Wheeler 2007).
2.10.2 Social Networks in Education
In the context of learning, SN can potentially improve student learning, foster collaboration
and enhance creativity (George & Dellasega 2011) if properly integrated with education
(Gupta & Bashir 2018). SN offer flexibility to contact peers and teachers outside normal
hours (Gupta & Bashir 2018). As teachers interact with their students via SN, they can learn
from them as well (Gupta & Bashir 2018). SN can allow for groups to act in concert without
users knowing each other (Kamel Boulos & Wheeler 2007). However, SN can have multiple
negative consequences such as relationship problems, reduced academic performance or
decreased community engagement (Gupta & Bashir 2018; Kuss & Griffiths 2011). SN can
have both a positive and negative impact on students (Gupta & Bashir 2018).
2.10.3 Conclusion
The collaborative and interactive nature of SN has tremendous learning potential (Gupta &
Bashir 2018). Universities are adopting SN as they understand its power and implications in
education (Gupta & Bashir 2018). Assessing the effect of SN on individual ACAP would be
valuable.
2.11 Beliefs Affects Learning Behaviour
As behaviour is influenced by beliefs (Ajzen 1991) among other factors such as cognition and
affection (Ajzen 2011), an individual’s behaviour is affected by their beliefs onto their
capability to absorb knowledge. Behaviours in relation to learning in a technological context
would be described as technological learning behaviour.

Page 22
2.11.1 Individual Work Performance
Koopmans et al. (2013) revised the IWP to focus on the behaviour or action under the control
of an employee rather than the outcome. Environment constrained behaviours are excluded
(Koopmans et al. 2013; Rotundo & Sackett 2002). This IWP generally consists of task
performance, contextual and adaptive performance, and counterproductive work behaviour
(Koopmans et al. 2013):
Tasks performance is made of explicit behaviours including fundamental
responsibilities defined in the job description (Pradhan & Jena 2017). Conway (1999)
stated that the cognitive ability required for task performance was facilitated by task
knowledge, task skill and task habits (Pradhan & Jena 2017). Thus the ability to do
the job and experience are the primary antecedents of task performance (Pradhan &
Jena 2017). Koopmans et al. (2013) indicated that work quantity and quality were not
appropriate measures of task performance as they review the effectiveness of
employee behaviour rather than their behaviour itself.
Contextual performance is described as the organisational, social and psychological
behaviours that support the work environment’s technical function (Koopmans et al.
2013). This is often referred to as team spirit (Pradhan & Jena 2017). Contextual
performance can manifest itself as abiding by the prescribed rules and regulations,
helping others in solving difficult tasks, cooperating with others at the time of need,
sharing critical resources and information for organisational development,
volunteering for extra work, supporting organisational decisions for a better
transformation, and upholding enthusiasm at work (Coleman & Borman 2000;
Pradhan & Jena 2017).
Adaptive performance refers to an individual’s ability to adapt and acclimatise to
change in a dynamic work environment (Koopmans et al. 2013; Pradhan & Jena
Page 23
2017). Koopmans et al. (2013) stated that adaptive performance was not a separate
dimension of contextual performance. While contextual performance proactive and
adaptive performance is reactive, both can support organisational, social and
psychological behaviours (Koopmans et al. 2013).
Counterproductive work behaviour describes behaviour that can harm an
organisation or its members (Rotundo & Sackett 2002) such as off-task behaviour,
absenteeism, addiction, and theft (Hunt 1996; Koopmans et al. 2013; Koopmans et al.
2011). However, counterproductive work behaviour is not the opposite of contextual
performance; hence, the absence of one does not indicate the other (Koopmans et al.
2013).
2.11.2 Conclusion
Koopmans et al. (2013) and Pradhan & Jena (2017) both suggest further research to improve
the IWP. Even though frameworks can at times be weak, they can however still offer benefits
and remain helpful (Mishra & Koehler 2006). The IWP can be used to construct generic
questionnaires (Koopmans et al. 2013). Missing some items is not critical (Koopmans et al.
2013). The IWP can be adapted to assess an individual's learning behaviour.
2.12 Chapter Summary
Knowledge is difficult to define; however, it has elements of information, experience, truth
and altruism. Knowledge is hard to manage because it requires relevance, timing, task fit
alignment and culture. Organisations who understand how critical knowledge is for success
will spend significant resources attempting to manage it. Those who don’t value knowledge
are missing a valuable resource. Barriers to knowledge transfer can still exist even if
organisations fully commit to it. These are causal ambiguity, an arduous relation between
knowledge holder and recipient, and recipients ACAP. Horizontal structures are a solution to
Page 24
causal ambiguity and arduous relations between knowledge holder and recipient as these
structures allow information to flow between organisational silos. This leaves recipients
ACAP which is the dynamic capability to absorb knowledge. Individual ACAP remains an
under-researched barrier. Technology can enhance learning or the absorption of knowledge.
Students who once struggled with learning have been able to overcome their limitations with
technologies. As beliefs affect behaviours, an individual's attitude towards technology can be
measured by the TRI which is aligned with individuals and not systems. The TRI persona is a
useful taxonomy to categorise individuals. As knowledge source is an ACAP antecedent,
TKS can lead to different ACAP performances. As comprehension is affected by social
mechanisms, SI influences ACAP through Assimilation. As SN are repositories of social
connections that enable social interactions, they can also have an influence on ACAP through
Assimilation. As again beliefs affect behaviours, an individual’s working behaviour can be
assessed by the IWP. The IWP can be adapted to assess an individual’s learning behaviour.
Page 25
Chapter 3: Theoretical Background and Research
Model
This chapter proposes the approach, different hypotheses, and which conceptual frameworks
would be best to answer the research question. Here, the theoretical foundation will first
explain the research problem, its purpose and significance. Then, a research model is
presented. Finally, hypotheses are developed and stated.
3.1 Theoretical Foundation and Research Model
As discussed in Chapter 2, the recipient’s ACAP is a barrier to knowledge transfer in
organisations (Szulanski 1996). Technology can enhance learning (Hamilton, Rosenberg &
Akcaoglu 2016),and beliefs affects behaviours (Ajzen 1991). Chapter 2 presents the theory
from the literature review in more detail.
What is the effect of recipients’ technological belief and usage on their capability to absorb
knowledge towards their technological learning behaviour?
The research aim of this study is to confirm if an individual’s technological belief and usage
has an effect on an individual's learning capability and their technological learning
behaviours. Its purpose is to provide empirical evidence of said causal-effect. This study will
use the Technology Readiness Index (TRI), Tools for Knowledge Source (TKS), Social
Influences (SI), Social Network (SN), Absorptive CAPacity (ACAP) and Individual Work
Performance (IWP) conceptual frameworks to measure or assess said causal-effect on
individuals. The TRI measures people’s beliefs technology (Parasuraman 2000). It is
individual focused (Lin, Shih & Sher 2007). TKS, SN and SI could also have an effect on
ACAP. Recipient's ACAP has been reduced at the individual scope to better align it with the
individual focused TRI. While ACAP was initially conceptualised from individuals’ learning
Page 26
cognitive ability (Cohen & Levinthal 1990), there has been little research into individual
ACAP (Lowik, Kraaijenbrink & Groen 2017; Minbaeva, Mäkelä & Rabbiosi 2012). As
beliefs affects behaviours (Ajzen 1991), and in order to test the effect of an individual's
technological belief and usage on their learning capability, an individual’s learning behaviour
will be assessed adapting the IWP (Koopmans et al. 2013).
This study uses a quantitative approach to provide its empirical evidence. Quantitative
research seeks to provide truth using objective scientific method (Bloomfield & Fisher 2019).
It is suited to confirming theories (Teddlie & Tashakkori 2009, p.22). It provides methods
that use statistical or numerical data to test theories (Watson 2015). It uses statistical analysis
on numerical data to test hypotheses (Bloomfield & Fisher 2019). As Fowler & Lapp (2019)
states: “a larger population sample reduces the chance of outliers”. Furthermore, small
sample sizes run the risk of not gathering enough data to support hypotheses (Fowler & Lapp
2019). Confirming a theoretical causal-effect with a large population sample would provide
the findings with extrapolation that has a credible generalisation. To gather its numerical
data, online questionnaires are used. Among the different statistical analysis methods, PLS-
SEM is well-established and can be used to test the hypotheses. A quantitative approach is
preferred to provide empirical evidence by testing hypotheses using the PLS-SEM statistical
analysis with numerical data gathered with online questionnaires.

Page 27
3.1.1 Research Model
As discussed earlier in Chapter 3 Section 1, this section provides the research model.
Figure 2. Research Model
3.2 Hypothesis Development
Here follows the list of this study’s research hypotheses, how they relate to the different
concepts and their rationale (see Figure 2.). Chapter 2 offers detailed explanation for the
concepts used.
3.2.1 From TRI on ACAP
Optimism is defined as “a positive view of technology and a belief that it offers people
increased control, flexibility, and efficiency in their lives” (Parasuraman 2000). The use of
the word ‘belief’ infers that it is not real but closer to potential. Optimism is a positive view
(Parasuraman 2000; Walczuch, Lemmink & Streukens 2007). It is a motivator (Parasuraman
2000). Recipient’s motivation to absorb new knowledge was determined to not be a barrier to
knowledge transfer (Szulanski 1996). However, said motivation was regarding knowledge
Page 28
(Szulanski 1996) and did not include technologies. As Optimism is a motivator (Parasuraman
2000) and highly potential, it would be positively associated with individual ACAP.
H1: Optimism positively influences individual ACAP.
Insecurity is defined as “distrust of technology, stemming from scepticism about its ability to
work properly and concerns about its potential harmful consequences” (Parasuraman 2000).
The use of the word ‘potential’ is explicit. Insecurity has a strong connotation with negativity
(Walczuch, Lemmink & Streukens 2007). It is an inhibitor (Parasuraman 2000). As
Insecurity is an inhibitor (Parasuraman 2000) and also potential, it would be negatively
associated with individual PACAP.
H2: Insecurity negatively influences individual ACAP.
Innovation is defined as “a tendency to be a technology pioneer and thought leader”
(Parasuraman 2000). The tense of the sentence implies that Innovation is in the present state;
hence, it is real. Innovation is initially considered a motivator as it enables opportunity
(García-Morales, Ruiz-Moreno & Llorens-Montes 2007; Parasuraman 2000). As Innovation
is a motivator (Parasuraman 2000) and real, it would be positively associated with individual
RACAP.
H3a: Innovation positively influences individual ACAP.
Innovation can impact ACAP differently. Walczuch, Lemmink & Streukens (2007)
discovered that it could also be perceived negatively. Innovation does not always improve
performance (Vlačić et al. 2019).
H3b: Innovation negatively influences individual ACAP.
Discomfort is defined as “a perceived lack of control over technology and a feeling of being
overwhelmed by it.” (Parasuraman 2000). The tense is in the past which suggests that it has
been realised. Discomfort is a negative experience (Walczuch, Lemmink & Streukens 2007).
Page 29
Insecurity and discomfort are inhibitors (Parasuraman 2000) and would be negatively
associated with individual ACAP.
H4: Discomfort negatively influences individual ACAP.
3.2.2 TKS on ACAP
Antecedents such as Knowledge Sources can affect ACAP differently which can lead to
different performance (Jansen, Van Den Bosch & Volberda 2005). Technology can transform
data into information (Bhatt 2001). It enables the transformation of content and pedagogy
(Beydoun, Kultchitsky & Manasseh 2007; Koehler et al. 2014) which can make learning
more efficient by delivering content in a malleable manner (Lust et al. 2012). TKS influences
an individual's ACAP.
H5: Tools for Knowledge Source influences individual ACAP.
3.2.3 SI on ACAP
The assimilation of knowledge relies on comprehension and understanding (Zahra & George
2002). This is shaped by group heuristics and communication shape (Jacobs & Buys 2010;
Zahra & George 2002). SI affects communication and heuristic (Kelman 1958). SI affects
individual's ACAP through Assimilation.
H6: Social Influences affect individual ACAP through Assimilation.
3.2.4 SN on ACAP
SN are used to connect, communicate, share, socialise, entertain, work and so on and so forth
(Beydoun, Kultchitsky & Manasseh 2007; Gupta & Bashir 2018). These are capable of
interpersonal and mass communication (Boyd & Ellison 2007; Gupta & Bashir 2018;
Pempek, Yermolayeva & Calvert 2009). They provide the opportunity to connect individuals
with similar interests that otherwise could not (Gupta & Bashir 2018; Haythornthwaite 2005).

Page 30
They can potentially improve learning, foster collaboration and enhance creativity (George &
Dellasega 2011).
H7: Social Networks affect individual ACAP through Assimilation.
3.2.5 ACAP to Learning Behaviour
As behaviour is influenced by beliefs (Ajzen 1991), if an individual's technological belief and
usage affects their ACAP, it would also influence their learning behaviour in a technological
context.
H8: Individual’s ACAP affects their learning behaviour.
3.3 Chapter Summary
Individual ACAP is a barrier to knowledge transfer. As beliefs influence behaviour, does an
individual’s technological belief influence his ACAP towards his technological learning
behaviour? To answer this research question, this study will provide empirical evidence using
a large population sample and the quantitative analysis method PLS-SEM. It will add to
existing limited research, provide further insights and an adaptable model to help bridge
knowledge and technology. The hypotheses to be tested have been enumerated.
Page 31
Chapter 4: Research Methodology
This chapter explains the methodology chosen to answer the research question, its hypotheses
and model from Chapter 3. It first presents the research design. Following this, the preferred
population and sample for this study is argued. Instrumentation and measures present terms,
definitions and items with their origins are discussed. After this, the ethics consideration
proceeds to explain the process, the rationale and the outcome of the ethics application are
presented. The data collection procedure then summarises the process and steps taken to
collect the data, the response rate, the data filtering and cleansing process. Finally, the data
analysis process defends that the PLS-SEM is suitable for this study.
4.1 Research Design
This study has been designed through the following stages (see Figure 3.). This study started
with a literature review in Chapter 2 to compile knowledge to determine knowledge gaps and
develop a research question. In Chapter 3, this study proposes to use a quantitative approach
to provide empirical evidence of the existence of a causal-effect from TRI, TKS, SN and SI
to individual ACAP to their learning behaviour (see Figure 2.). A large population sample
reduces the chance that the sample is an outlier (Fowler & Lapp 2019) as the data is collected
across a large number of participants rather than a small or individual one. This would
provide better generalisability to confirm hypotheses concerned with common individuals.
4.1.1 Data Collection Design
Using online questionnaires, a large number of participants can be reached within a short
amount of time over a great amount of distance (Wright 2017). While some individuals will
complete online questionnaires, others will ignore it and this leads to a systemic bias (Wright
2017). However, there are methods that handle biases, for example, BCa bootstrapping can
Page 32
address data skewness (Hair, Risher & Ringle 2019). To collect a large amount of data, an
online questionnaire was distributed at the University of Technology Sydney. To ensure that
the questions used in the questionnaire are credible, these have been copied or adapted from
other peer reviewed research and anonymously tested. The data collected will be compiled
into a data set that is then analysed with an established approach and method to confirm this
study’s hypotheses.
4.1.2 Data Analysis Design
The quantitative research approach is suitable for confirming theories (Teddlie & Tashakkori
2009, p.22). As this study attempts to confirm theories, a quantitative research approach is
preferred. Quantitative approach also contains methods concerned with statistical or
numerical analysis (Watson 2015). Statistical generalisation underpins most quantitative
research as it relies on the sample used being representative (Polit & Beck 2010). With
random sampling, the generalisation occurs when the population has an equal chance of being
measured (Polit & Beck 2010). But this is not generalisation, it is instead “the most probable”
(Polit & Beck 2010; Teddlie & Tashakkori 2009, p.22). As findings are always within a
context, the extrapolation required for generalisation can never truly be justified (Polit &
Beck 2010). Even with this limitation, using a large data set to confirm these research
hypotheses with statistical data would allow the results enough credible generalisations at
least within its context. The data set is analysed using PLS-SEM which is an established
quantitative method. Finally, this study is proofread before its release to ensure that its
content is understandable to an average person.
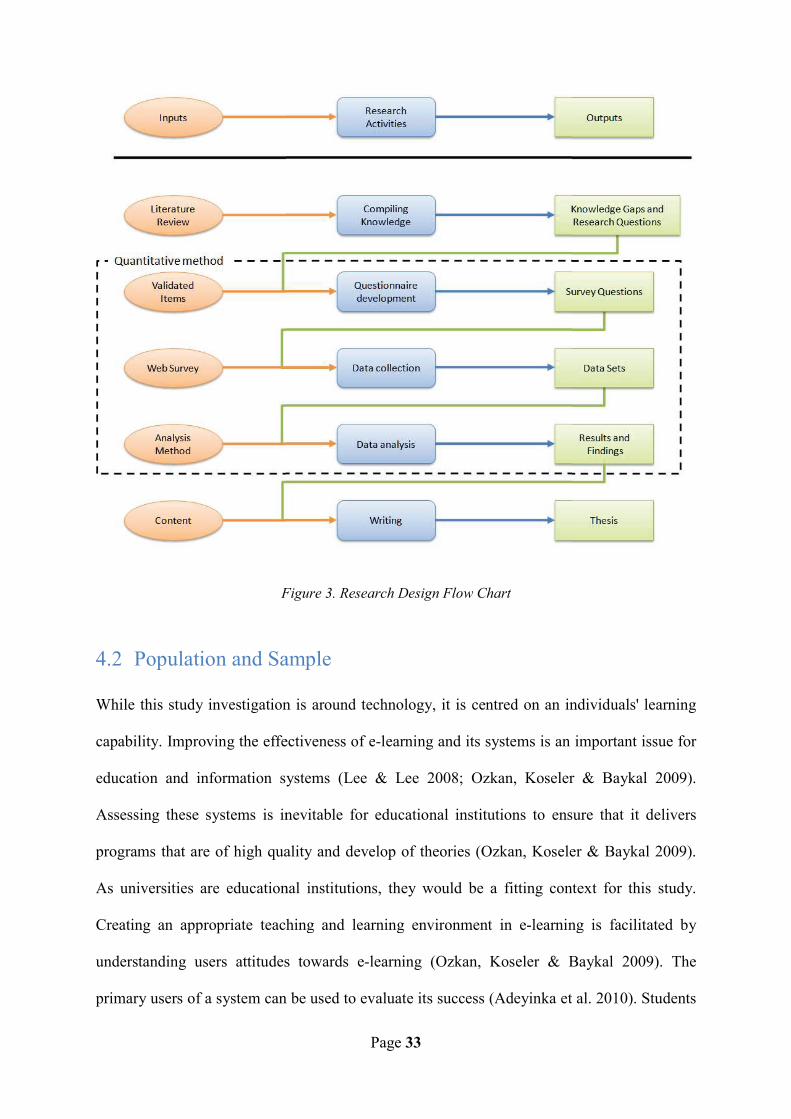
F
4.2 Population and Sa
While this study investigation
capability. Improving the effe
education and information sy
Assessing these systems is in
programs that are of high qua
As universities are education
Creating an appropriate teach
understanding users attitudes
primary users of a system can
Page 33
Figure 3. Research Design Flow Chart
ample
n is around technology, it is centred on an in
ectiveness of e-learning and its systems is an
ystems (Lee & Lee 2008; Ozkan, Koseler
nevitable for educational institutions to ens
ality and develop of theories (Ozkan, Kosele
nal institutions, they would be a fitting con
hing and learning environment in e-learnin
s towards e-learning (Ozkan, Koseler & B
n be used to evaluate its success (Adeyinka et
ndividuals' learning
important issue for
r & Baykal 2009).
sure that it delivers
er & Baykal 2009).
text for this study.
ng is facilitated by
Baykal 2009). The
al. 2010). Students
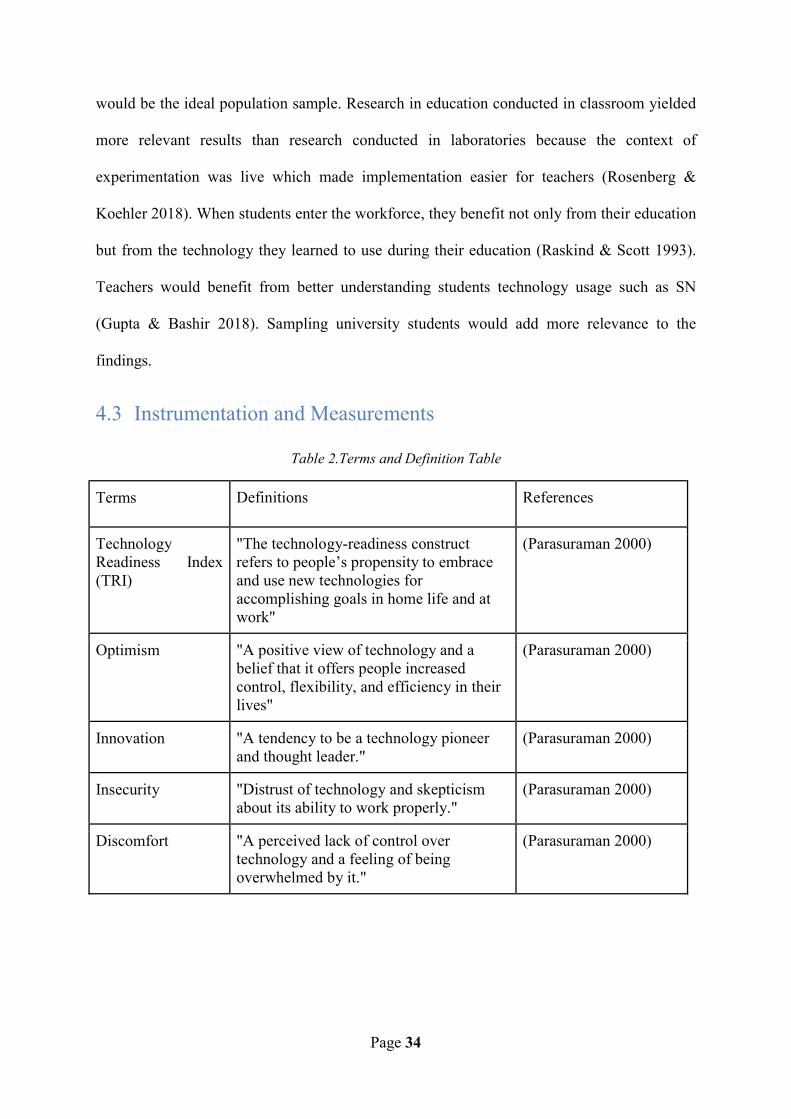
Page 34
would be the ideal population sample. Research in education conducted in classroom yielded
more relevant results than research conducted in laboratories because the context of
experimentation was live which made implementation easier for teachers (Rosenberg &
Koehler 2018). When students enter the workforce, they benefit not only from their education
but from the technology they learned to use during their education (Raskind & Scott 1993).
Teachers would benefit from better understanding students technology usage such as SN
(Gupta & Bashir 2018). Sampling university students would add more relevance to the
findings.
4.3 Instrumentation and Measurements
Table 2.Terms and Definition Table
Terms Definitions References
Technology Readiness Index (TRI)
"The technology-readiness construct refers to people’s propensity to embrace and use new technologies for accomplishing goals in home life and at work"
(Parasuraman 2000)
Optimism "A positive view of technology and a belief that it offers people increased control, flexibility, and efficiency in their lives"
(Parasuraman 2000)
Innovation "A tendency to be a technology pioneer and thought leader."
(Parasuraman 2000)
Insecurity "Distrust of technology and skepticism about its ability to work properly."
(Parasuraman 2000)
Discomfort "A perceived lack of control over technology and a feeling of being overwhelmed by it."
(Parasuraman 2000)

Page 35
Absorptive CAPacity (ACAP)
"We define ACAP as a set of organisational routines and processes by which firms acquire, assimilate, transform, and exploit knowledge to produce a dynamic organisational capability"
(Zahra & George 2002)
Absorptive CAPacity (ACAP)
“Thus, prior related knowledge confers an ability to recognize the value of new information, assimilate it, and apply it to commercial ends. These abilities collectively constitute what we call a firm's ‘absorptive capacity.’”
(Cohen & Levinthal 1990)
Potential ACAP "Potential ACAP (PACAP) makes the firm receptive to acquiring and assimilating external knowledge (Lane & Lubatkin, 1998)"
(Zahra & George 2002)
Acquisition "Acquisition refers to a firm's capability to identify and acquire externally generated knowledge that is critical to its operation."
(Zahra & George 2002)
Assimilation "Assimilation refers to the firm's routines and processes that allow it to analyze , process, interpret, and understand the information obtained from external sources (Kim, 1997a,b; Szulanski, 1996)"
(Zahra & George 2002)
Realised ACAP "Realized ACAP (RACAP) is a function of the transformation and exploitation capabilities discussed earlier."
(Zahra & George 2002)
Transformation "Transformation denotes a firm's capability to develop and refine the routines that facilitate combining existing knowledge and the newly acquired and assimilated knowledge."
(Zahra & George 2002)
Exploitation “Exploitation as an organisational capability is based on the routines that allow firms to refine, extend, and leverage existing competencies or to create new ones by incorporating acquired and transformed knowledge into its operations.”
(Zahra & George 2002)

Page 36
e-Learning “Electronic learning (e-learning), referring to learning via the Internet, has become a major phenomenon in recent years.”
(Wang, Wang & Shee 2007)
Knowledge Management Systems
“KMS is an IT-based system developed to support and to enhance knowledge management (KM).”
(Kuo & Lee 2009)
Content Management System
“CMSs are defined as systems that combine a range of subject management and pedagogical tools to provide a means of designing, building and delivering online or virtual learning environments (Coates, James, & Baldwin, 2005).”
(Lust et al. 2012)
Learning Management System
“LMS are enterprise-wide and internet-based systems, such as WebCT and Blackboard, that integrate a wide range of pedagogical and course administration tools.”
(Coates, James & Baldwin 2005)
Group Support System
“GSS literature has frequently used the term ‘‘group memory’’ for this shared repository and its tools.”
(Haseman, Nazareth & Paul 2005)
Social Influences “Social influence is defined as the degree to which an Individual perceives that important others believe he or she should use the new system.”
(Venkatesh et al. 2003)
Social Influences “The experiment reported here grows out of a broader theoretical framework concerned with the analysis of different processes of attitude change resulting from social influence.” “The three processes represent three qualitatively different ways of accepting influence.”
(Kelman 1958)
Subjective Norms “The second predictor is a social factor termed subjective norm; it refers to the perceived social pressure to perform or not to perform the behavior.”
(Ajzen 1991)
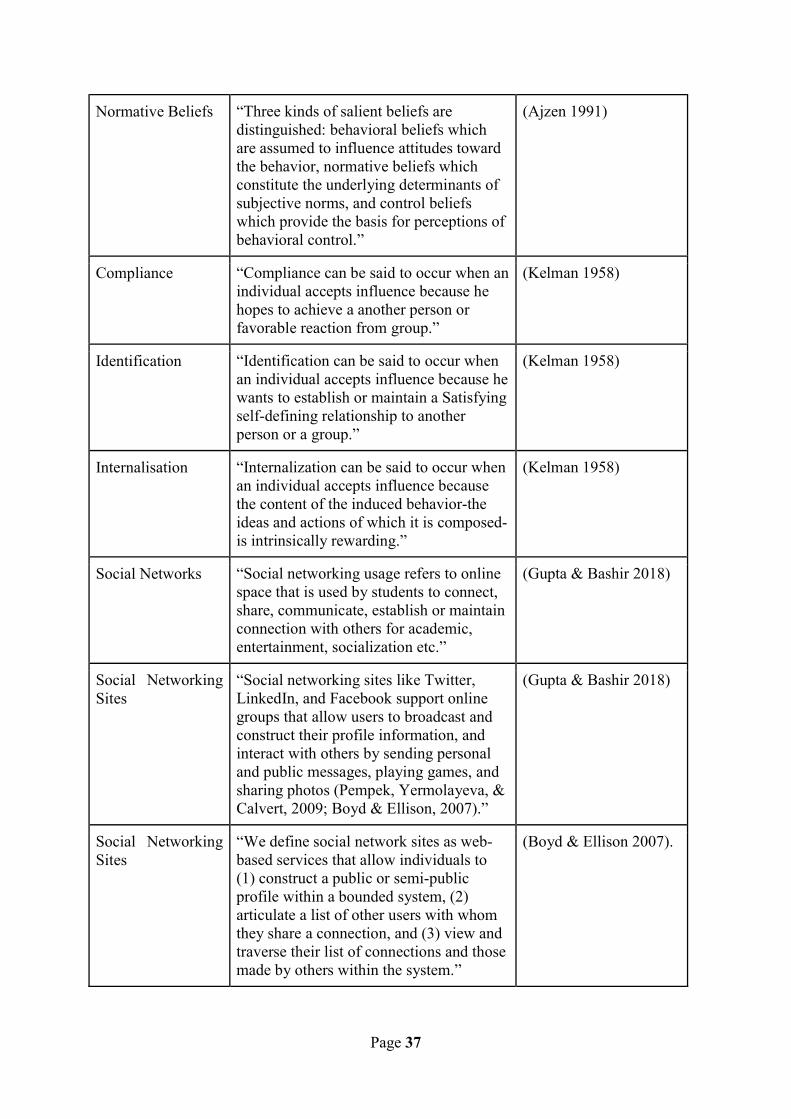
Page 37
Normative Beliefs “Three kinds of salient beliefs are distinguished: behavioral beliefs which are assumed to influence attitudes toward the behavior, normative beliefs which constitute the underlying determinants of subjective norms, and control beliefs which provide the basis for perceptions of behavioral control.”
(Ajzen 1991)
Compliance “Compliance can be said to occur when an individual accepts influence because he hopes to achieve a another person or favorable reaction from group.”
(Kelman 1958)
Identification “Identification can be said to occur when an individual accepts influence because he wants to establish or maintain a Satisfying self-defining relationship to another person or a group.”
(Kelman 1958)
Internalisation “Internalization can be said to occur when an individual accepts influence because the content of the induced behavior-the ideas and actions of which it is composed-is intrinsically rewarding.”
(Kelman 1958)
Social Networks “Social networking usage refers to online space that is used by students to connect, share, communicate, establish or maintain connection with others for academic, entertainment, socialization etc.”
(Gupta & Bashir 2018)
Social Networking Sites
“Social networking sites like Twitter, LinkedIn, and Facebook support online groups that allow users to broadcast and construct their profile information, and interact with others by sending personal and public messages, playing games, and sharing photos (Pempek, Yermolayeva, & Calvert, 2009; Boyd & Ellison, 2007).”
(Gupta & Bashir 2018)
Social Networking Sites
“We define social network sites as web-based services that allow individuals to (1) construct a public or semi-public profile within a bounded system, (2) articulate a list of other users with whom they share a connection, and (3) view and traverse their list of connections and those made by others within the system.”
(Boyd & Ellison 2007).
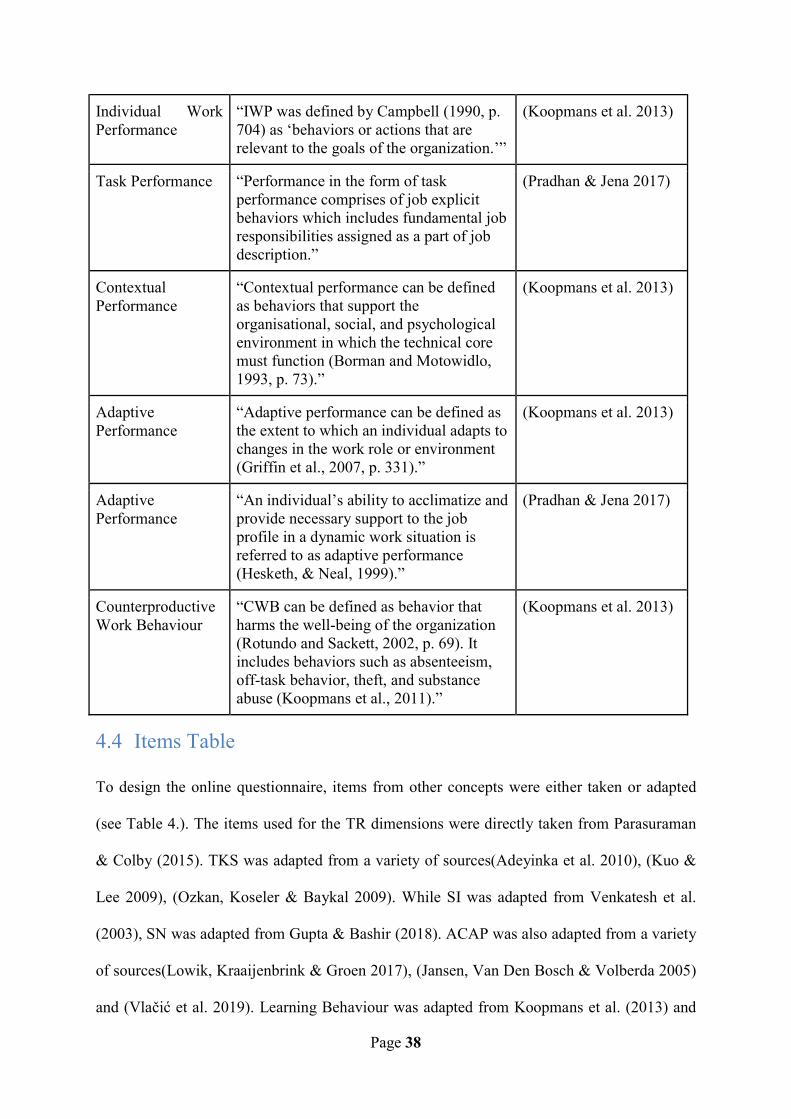
Page 38
Individual Work Performance
“IWP was defined by Campbell (1990, p. 704) as ‘behaviors or actions that are relevant to the goals of the organization.’”
(Koopmans et al. 2013)
Task Performance “Performance in the form of task performance comprises of job explicit behaviors which includes fundamental job responsibilities assigned as a part of job description.”
(Pradhan & Jena 2017)
Contextual Performance
“Contextual performance can be defined as behaviors that support the organisational, social, and psychological environment in which the technical core must function (Borman and Motowidlo, 1993, p. 73).”
(Koopmans et al. 2013)
Adaptive Performance
“Adaptive performance can be defined as the extent to which an individual adapts to changes in the work role or environment (Griffin et al., 2007, p. 331).”
(Koopmans et al. 2013)
Adaptive Performance
“An individual’s ability to acclimatize and provide necessary support to the job profile in a dynamic work situation is referred to as adaptive performance (Hesketh, & Neal, 1999).”
(Pradhan & Jena 2017)
Counterproductive Work Behaviour
“CWB can be defined as behavior that harms the well-being of the organization (Rotundo and Sackett, 2002, p. 69). It includes behaviors such as absenteeism, off-task behavior, theft, and substance abuse (Koopmans et al., 2011).”
(Koopmans et al. 2013)
4.4 Items Table
To design the online questionnaire, items from other concepts were either taken or adapted
(see Table 4.). The items used for the TR dimensions were directly taken from Parasuraman
& Colby (2015). TKS was adapted from a variety of sources(Adeyinka et al. 2010), (Kuo &
Lee 2009), (Ozkan, Koseler & Baykal 2009). While SI was adapted from Venkatesh et al.
(2003), SN was adapted from Gupta & Bashir (2018). ACAP was also adapted from a variety
of sources(Lowik, Kraaijenbrink & Groen 2017), (Jansen, Van Den Bosch & Volberda 2005)
and (Vlačić et al. 2019). Learning Behaviour was adapted from Koopmans et al. (2013) and
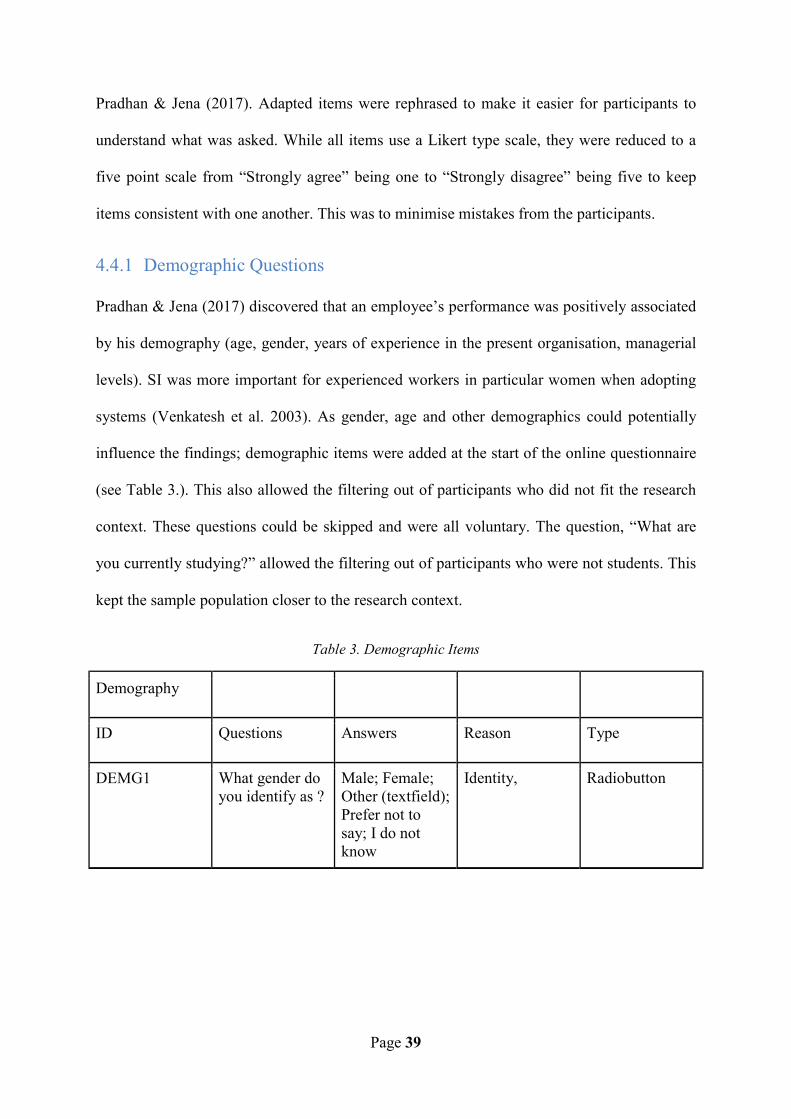
Page 39
Pradhan & Jena (2017). Adapted items were rephrased to make it easier for participants to
understand what was asked. While all items use a Likert type scale, they were reduced to a
five point scale from “Strongly agree” being one to “Strongly disagree” being five to keep
items consistent with one another. This was to minimise mistakes from the participants.
4.4.1 Demographic Questions
Pradhan & Jena (2017) discovered that an employee’s performance was positively associated
by his demography (age, gender, years of experience in the present organisation, managerial
levels). SI was more important for experienced workers in particular women when adopting
systems (Venkatesh et al. 2003). As gender, age and other demographics could potentially
influence the findings; demographic items were added at the start of the online questionnaire
(see Table 3.). This also allowed the filtering out of participants who did not fit the research
context. These questions could be skipped and were all voluntary. The question, “What are
you currently studying?” allowed the filtering out of participants who were not students. This
kept the sample population closer to the research context.
Table 3. Demographic Items
Demography
ID Questions Answers Reason Type
DEMG1 What gender do you identify as ?
Male; Female; Other (textfield); Prefer not to say; I do not know
Identity, Radiobutton
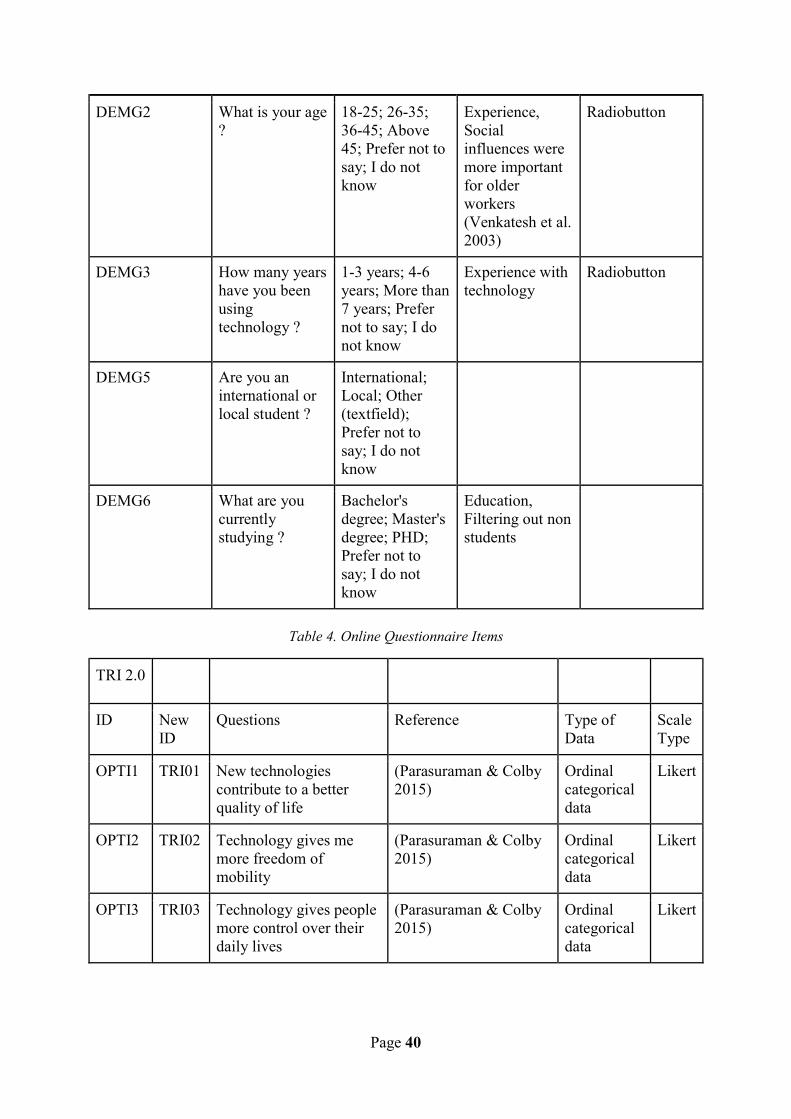
Page 40
DEMG2 What is your age ?
18-25; 26-35; 36-45; Above 45; Prefer not to say; I do not know
Experience, Social influences were more important for older workers (Venkatesh et al. 2003)
Radiobutton
DEMG3 How many years have you been using technology ?
1-3 years; 4-6 years; More than 7 years; Prefer not to say; I do not know
Experience with technology
Radiobutton
DEMG5 Are you an international or local student ?
International; Local; Other (textfield); Prefer not to say; I do not know
DEMG6 What are you currently studying ?
Bachelor's degree; Master's degree; PHD; Prefer not to say; I do not know
Education, Filtering out non students
Table 4. Online Questionnaire Items
TRI 2.0
ID New ID
Questions Reference Type of Data
Scale Type
OPTI1 TRI01 New technologies contribute to a better quality of life
(Parasuraman & Colby 2015)
Ordinal categorical data
Likert
OPTI2 TRI02 Technology gives me more freedom of mobility
(Parasuraman & Colby 2015)
Ordinal categorical data
Likert
OPTI3 TRI03 Technology gives people more control over their daily lives
(Parasuraman & Colby 2015)
Ordinal categorical data
Likert

Page 41
OPTI4 TRI04 Technology makes me more productive in my personal life
(Parasuraman & Colby 2015)
Ordinal categorical data
Likert
INNO1 TRI05 Other people come to me for advice on new technologies
(Parasuraman & Colby 2015)
Ordinal categorical data
Likert
INNO2 TRI06 In general, I am among the first in my circle of friends to acquire new technology when it appears
(Parasuraman & Colby 2015)
Ordinal categorical data
Likert
INNO3 TRI07 I can usually figure out new high-tech products and services without help from others
(Parasuraman & Colby 2015)
Ordinal categorical data
Likert
INNO4 TRI08 I keep up with the latest technological developments in my areas of interest
(Parasuraman & Colby 2015)
Ordinal categorical data
Likert
DISC1 TRI09 When I get technical support from a provider of a high-tech product or service, I sometimes feel as if I am being taken advantage of by someone who knows more than I do
(Parasuraman & Colby 2015)
Ordinal categorical data
Likert
DISC2 TRI10 Technical support lines are not helpful because they don’t explain things in terms I understand
(Parasuraman & Colby 2015)
Ordinal categorical data
Likert
DISC3 TRI11 Sometimes, I think that technology systems are not designed for use by ordinary people
(Parasuraman & Colby 2015)
Ordinal categorical data
Likert
DISC4 TRI12 There is no such thing as a manual for a high-tech product or service that’s written in plain language
(Parasuraman & Colby 2015)
Ordinal categorical data
Likert
INSE1 TRI13 People are too dependent on technology to do things for them
(Parasuraman & Colby 2015)
Ordinal categorical data
Likert
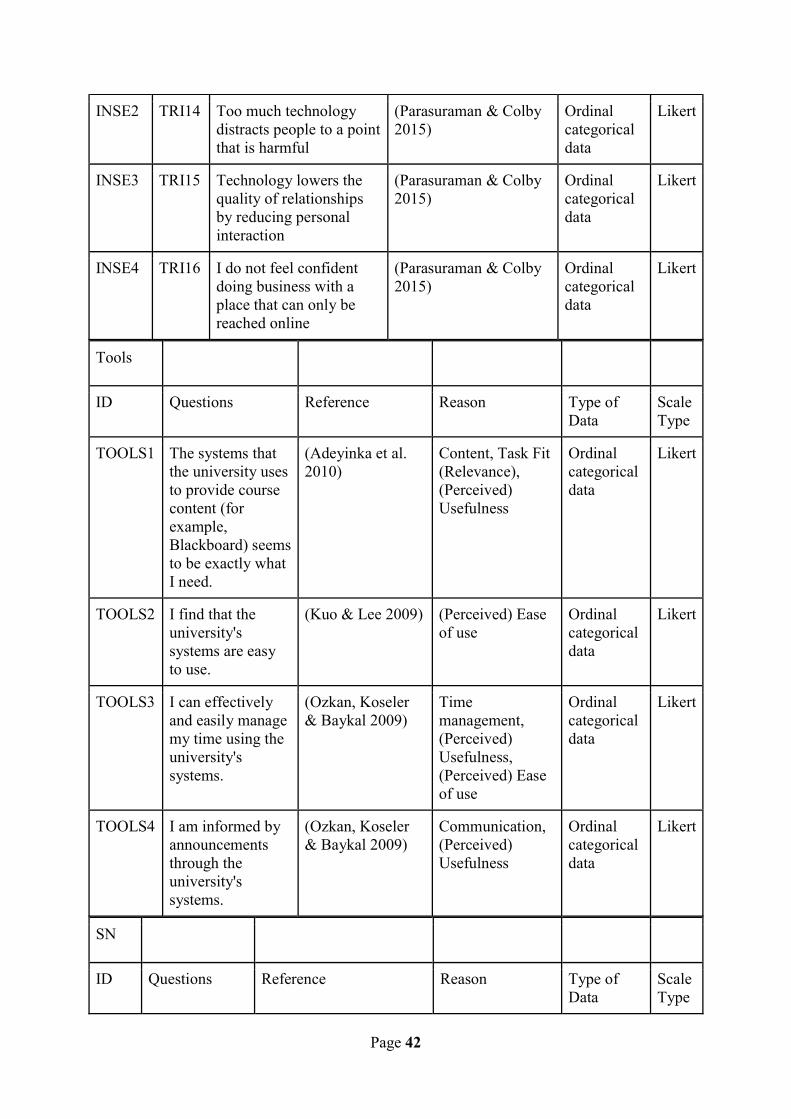
Page 42
INSE2 TRI14 Too much technology distracts people to a point that is harmful
(Parasuraman & Colby 2015)
Ordinal categorical data
Likert
INSE3 TRI15 Technology lowers the quality of relationships by reducing personal interaction
(Parasuraman & Colby 2015)
Ordinal categorical data
Likert
INSE4 TRI16 I do not feel confident doing business with a place that can only be reached online
(Parasuraman & Colby 2015)
Ordinal categorical data
Likert
Tools
ID Questions Reference Reason Type of Data
Scale Type
TOOLS1 The systems that the university uses to provide course content (for example, Blackboard) seems to be exactly what I need.
(Adeyinka et al. 2010)
Content, Task Fit (Relevance), (Perceived) Usefulness
Ordinal categorical data
Likert
TOOLS2 I find that the university's systems are easy to use.
(Kuo & Lee 2009) (Perceived) Ease of use
Ordinal categorical data
Likert
TOOLS3 I can effectively and easily manage my time using the university's systems.
(Ozkan, Koseler & Baykal 2009)
Time management, (Perceived) Usefulness, (Perceived) Ease of use
Ordinal categorical data
Likert
TOOLS4 I am informed by announcements through the university's systems.
(Ozkan, Koseler & Baykal 2009)
Communication, (Perceived) Usefulness
Ordinal categorical data
Likert
SN
ID Questions Reference Reason Type of Data
Scale Type
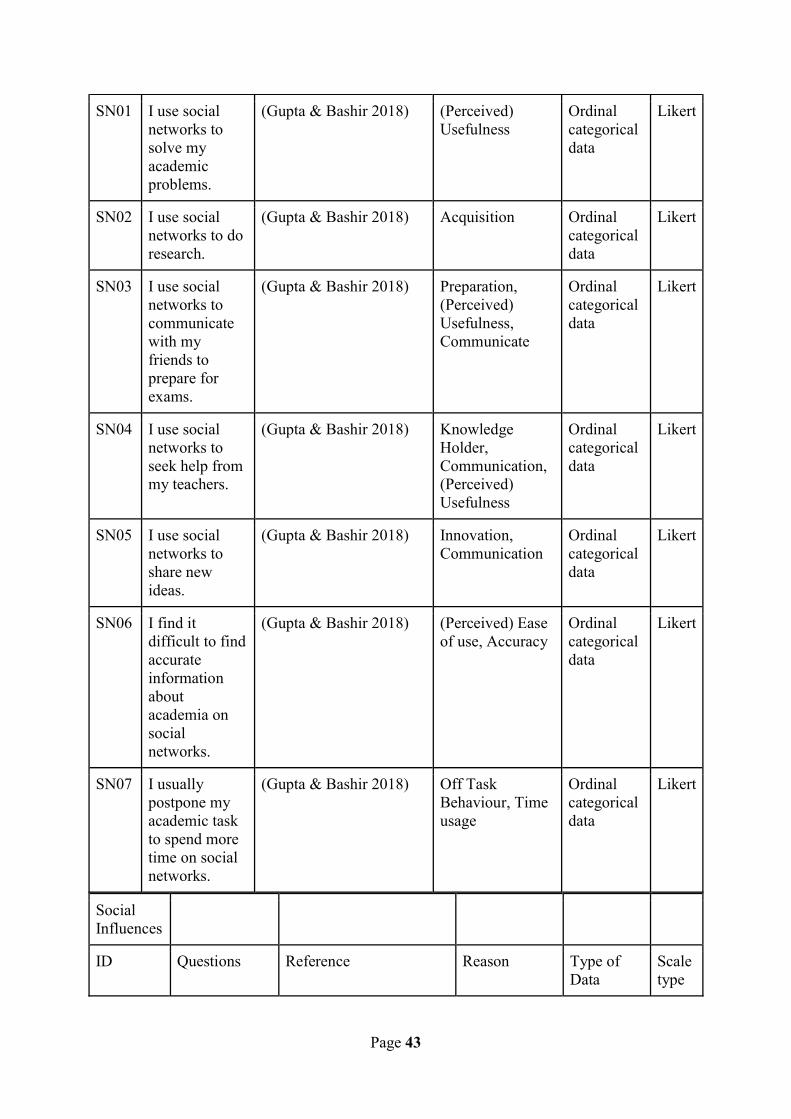
Page 43
SN01 I use social networks to solve my academic problems.
(Gupta & Bashir 2018) (Perceived) Usefulness
Ordinal categorical data
Likert
SN02 I use social networks to do research.
(Gupta & Bashir 2018) Acquisition Ordinal categorical data
Likert
SN03 I use social networks to communicate with my friends to prepare for exams.
(Gupta & Bashir 2018) Preparation, (Perceived) Usefulness, Communicate
Ordinal categorical data
Likert
SN04 I use social networks to seek help from my teachers.
(Gupta & Bashir 2018) Knowledge Holder, Communication, (Perceived) Usefulness
Ordinal categorical data
Likert
SN05 I use social networks to share new ideas.
(Gupta & Bashir 2018) Innovation, Communication
Ordinal categorical data
Likert
SN06 I find it difficult to find accurate information about academia on social networks.
(Gupta & Bashir 2018) (Perceived) Ease of use, Accuracy
Ordinal categorical data
Likert
SN07 I usually postpone my academic task to spend more time on social networks.
(Gupta & Bashir 2018) Off Task Behaviour, Time usage
Ordinal categorical data
Likert
Social Influences
ID Questions Reference Reason Type of Data
Scale type
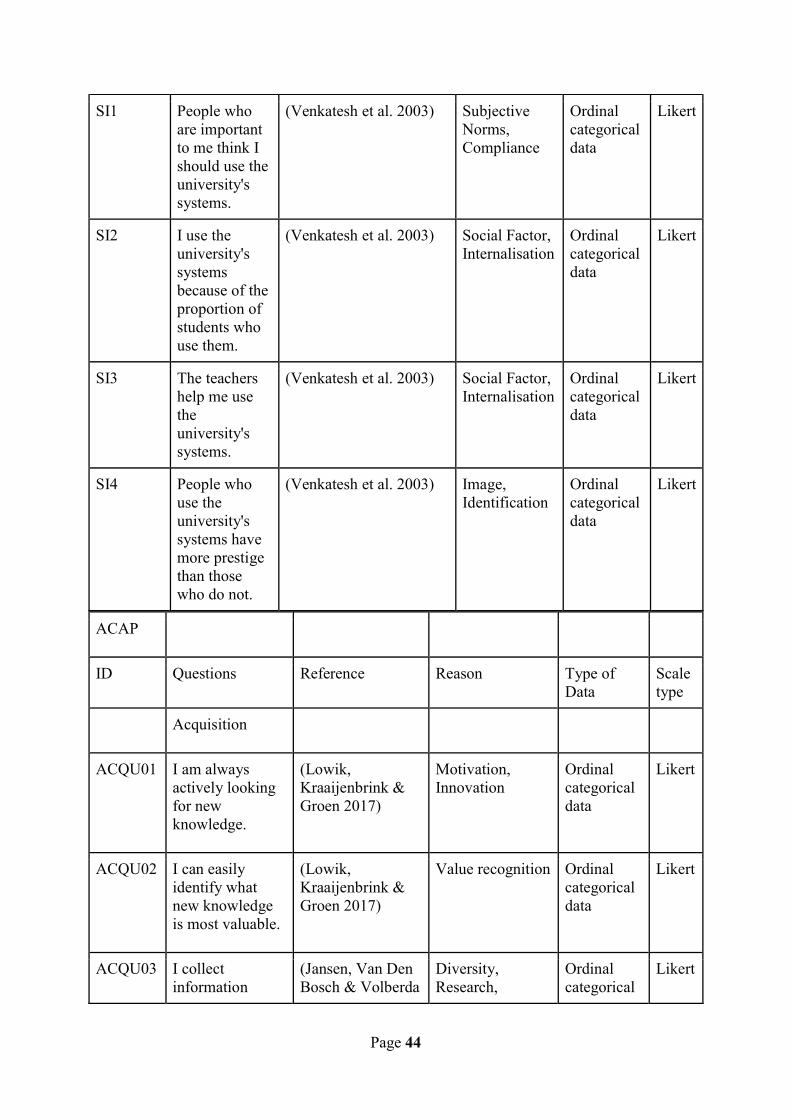
Page 44
SI1 People who are important to me think I should use the university's systems.
(Venkatesh et al. 2003) Subjective Norms, Compliance
Ordinal categorical data
Likert
SI2 I use the university's systems because of the proportion of students who use them.
(Venkatesh et al. 2003) Social Factor, Internalisation
Ordinal categorical data
Likert
SI3 The teachers help me use the university's systems.
(Venkatesh et al. 2003) Social Factor, Internalisation
Ordinal categorical data
Likert
SI4 People who use the university's systems have more prestige than those who do not.
(Venkatesh et al. 2003) Image, Identification
Ordinal categorical data
Likert
ACAP
ID Questions Reference Reason Type of Data
Scale type
Acquisition
ACQU01 I am always actively looking for new knowledge.
(Lowik, Kraaijenbrink & Groen 2017)
Motivation, Innovation
Ordinal categorical data
Likert
ACQU02 I can easily identify what new knowledge is most valuable.
(Lowik, Kraaijenbrink & Groen 2017)
Value recognition Ordinal categorical data
Likert
ACQU03 I collect information
(Jansen, Van Den Bosch & Volberda
Diversity, Research,
Ordinal categorical
Likert
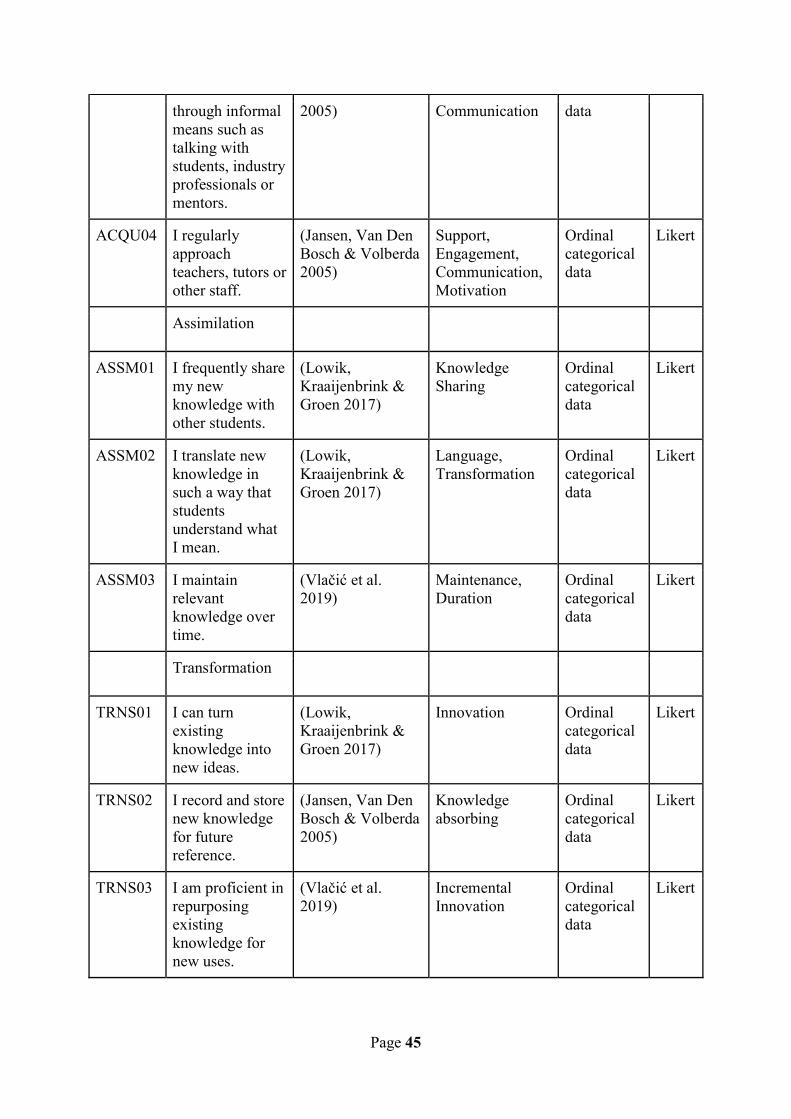
Page 45
through informal means such as talking with students, industry professionals or mentors.
2005) Communication data
ACQU04 I regularly approach teachers, tutors or other staff.
(Jansen, Van Den Bosch & Volberda 2005)
Support, Engagement, Communication, Motivation
Ordinal categorical data
Likert
Assimilation
ASSM01 I frequently share my new knowledge with other students.
(Lowik, Kraaijenbrink & Groen 2017)
Knowledge Sharing
Ordinal categorical data
Likert
ASSM02 I translate new knowledge in such a way that students understand what I mean.
(Lowik, Kraaijenbrink & Groen 2017)
Language, Transformation
Ordinal categorical data
Likert
ASSM03 I maintain relevant knowledge over time.
(Vlačić et al. 2019)
Maintenance, Duration
Ordinal categorical data
Likert
Transformation
TRNS01 I can turn existing knowledge into new ideas.
(Lowik, Kraaijenbrink & Groen 2017)
Innovation Ordinal categorical data
Likert
TRNS02 I record and store new knowledge for future reference.
(Jansen, Van Den Bosch & Volberda 2005)
Knowledge absorbing
Ordinal categorical data
Likert
TRNS03 I am proficient in repurposing existing knowledge for new uses.
(Vlačić et al. 2019)
Incremental Innovation
Ordinal categorical data
Likert
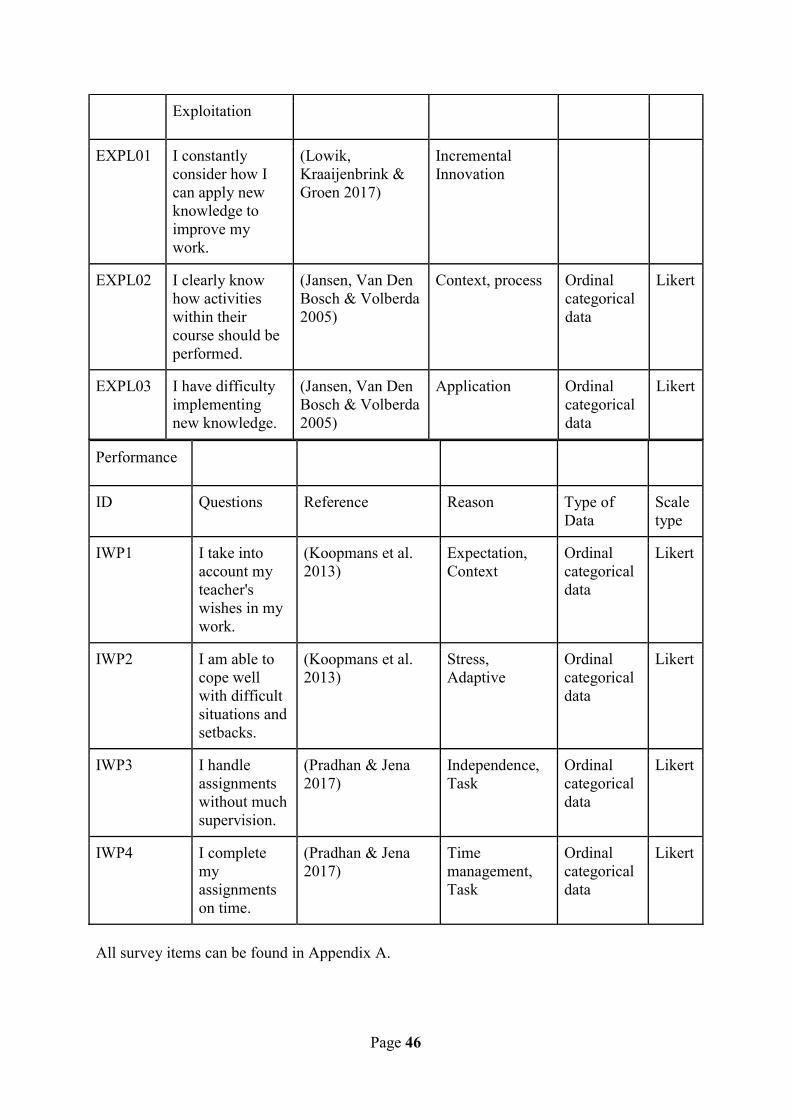
Page 46
Exploitation
EXPL01 I constantly consider how I can apply new knowledge to improve my work.
(Lowik, Kraaijenbrink & Groen 2017)
Incremental Innovation
EXPL02 I clearly know how activities within their course should be performed.
(Jansen, Van Den Bosch & Volberda 2005)
Context, process Ordinal categorical data
Likert
EXPL03 I have difficulty implementing new knowledge.
(Jansen, Van Den Bosch & Volberda 2005)
Application Ordinal categorical data
Likert
Performance
ID Questions Reference Reason Type of Data
Scale type
IWP1 I take into account my teacher's wishes in my work.
(Koopmans et al. 2013)
Expectation, Context
Ordinal categorical data
Likert
IWP2 I am able to cope well with difficult situations and setbacks.
(Koopmans et al. 2013)
Stress, Adaptive
Ordinal categorical data
Likert
IWP3 I handle assignments without much supervision.
(Pradhan & Jena 2017)
Independence, Task
Ordinal categorical data
Likert
IWP4 I complete my assignments on time.
(Pradhan & Jena 2017)
Time management, Task
Ordinal categorical data
Likert
All survey items can be found in Appendix A.
Page 47
4.5 Ethics Consideration
A consent form was placed at the beginning of the online questionnaire before the
demographic items. It explained to the participant who was responsible, what the research
was for, and how the data they supplied was going to be used. The consent form also
explained that the questionnaire was voluntary and that the participants could withdraw
anytime before completion without any consequences.
All demographic items could be skipped and the words “Prefer not to say” and “I do not
know” were included to provide further options to not answer. “Prefer not to say” allowed
participants who do not consent to not provide information. “I do not know” measured
ambiguity for items when participants may not have been able to provide accurate answers.
The consent form also informed participants that the questionnaire was anonymous. To not
record participants' date of birth, the online questionnaire instead asked participants to select
their age range. Name, date of birth or any questions that would directly identify a participant
were not asked to protect their identity and safeguard their anonymity. This was to gain their
trust to further increase the chance that they would answer honestly. This also would protect
the identity of participants in the event of a data breach.
The questionnaire was submitted to the UTS Human Research Ethics Committee. A data
management plan was also supplied to ensure that the data would be properly handled. The
risk was determined to be negligible. The online questionnaire was approved to be released to
the public by the UTS Human Research Ethics Committee.
4.6 Data Collection Procedure
The questionnaire was hosted on Qualtrics which is an online web survey platform. It
contained 62 items including the consent form. Qualtrics estimated that it takes less than 15
Page 48
min to complete it. Prior to its release, it had been tested by two participants who wished to
remain anonymous. All answers were deleted before the questionnaire was released to the
public. The data collected was downloaded as an excel file. A total of 252 rows existed in the
excel file, three of which were headers, leaving a total of 249 records. Records whose
progress were not ‘100’ were filtered out, leaving 204 completed records. As the context of
this research is universities, participants who had answered they were not studying a
Bachelor’s or Master’s degree, or Ph.D. were also omitted, leaving 199 completed records.
This study deemed that ensuring the research context outweighed the omission of five
records. Said filtered data was copied and pasted into a CSV spreadsheet that was then
imported into SmartPLS3. The record on line 137 column ‘DEMG1_4_TEXT’ had the value
“Female sex, no gender”. SmartPLS3 interpreted the comma as a column separator. To
resolve this issue, the record was updated to “Female sex no gender” as it was thought it
would not affect the value of the statement. The CSV spreadsheet was then imported into
SmartPLS3 without any issues.
4.7 Data Analysis Process
Among the different quantitative methods, the preferred method for this study which is PLS-
SEM is argued in the following section.
4.7.1 Structural Equation Modelling (SEM)
While Wright (1921) first developed path analysis in the early 1920’s (Hair, Ringle &
Sarstedt 2011), Structural models only started to be applied in the social sciences in the
1970’s (Bollen 1989; Hair, Ringle & Sarstedt 2011). Structural Equation Modelling (SEM)
began to appear in the early 1980’s (e.g. (Bagozzi & Yi 1988; Fornell & Larcker 1981a,
1981b)) (Hair, Ringle & Sarstedt 2011). SEM has gained popularity as concepts and
complete theories required testing (Hair Jr., Sarstedt, et al. 2014). SEM’s method is able to

Page 49
assess the measurement of and test the relationships between latent variables (Babin, Hair &
Boles 2008; Hair Jr., Sarstedt, et al. 2014). Bollen & Long (1993) is ‘‘a synthesis of
procedures developed in econometrics, and psychometrics’’ (Henseler et al. 2014, p.1). Byrne
(1998) states that there are two important features that define the term SEM (Henseler et al.
2014, p.3):
A. “the causal processes under study are represented by a series of structural (i.e.,
regression) equations”,
B. “that these structural relations can be modelled pictorially to enable a clearer
conceptualization of the theory under study”.
4.7.2 Partial Least Square-Structural Equation Modelling
Wold (1974), 1980) originally developed the Partial Least Square SEM (PLS-SEM)
technique which through iteration maximizes the explained variance of endogenous
constructs (Fornell & Bookstein 1982; Hair Jr., Sarstedt, et al. 2014). As a causal modelling
approach, PLS-SEM maximizes the dependent latent constructs’ explained variance (Hair,
Ringle & Sarstedt 2011). Henseler et al. (2014) articulated that PLS could be used to estimate
composite factor models and provided benefits in exploratory research. PLS-SEM estimation
of structural models is more robust (Hair, Ringle & Sarstedt 2011; Reinartz, Haenlein &
Henseler 2009). PLS-SEM has been used in:
marketing and business (Fornell & Bookstein 1982; Hair, Ringle & Sarstedt 2011;
Hair, Sarstedt, Ringle, et al. 2012; Hair Jr., Sarstedt, et al. 2014; Ringle, Sarstedt &
Straub 2012),
management (Hair, Sarstedt, Pieper, et al. 2012; Hair Jr., Sarstedt, et al. 2014; Ringle,
Sarstedt & Straub 2012),
Page 50
management information systems (Hair Jr., Sarstedt, et al. 2014; Ringle, Sarstedt &
Straub 2012),
operations management (Hair Jr., Sarstedt, et al. 2014; Peng & Lai 2012),
accounting (Hair Jr., Sarstedt, et al. 2014; Lee et al. 2011; Ringle, Sarstedt & Straub
2012),
and social sciences (Hair, Risher & Ringle 2019; Hair Jr., Sarstedt, et al. 2014;
Henseler et al. 2014; Lee et al. 2011; Peng & Lai 2012; Sosik, Kahai & Piovoso
2009).
Many software systems are available for PLS such as PLS-Graph, SmartPLS and even R (e.g.
semPLS) (Hair, Risher & Ringle 2019; Monecke & Leisch 2012).
Assumptions
Regarding assumptions, PLS-SEM has fewer restrictions; therefore, if the assumptions in
CB-SEM cannot be met, PLS-SEM is preferred (Hair, Ringle & Sarstedt 2011; Hair, Risher
& Ringle 2019). However, CB-SEM remains robust when breaking assumptions (Reinartz,
Haenlein & Henseler 2009) and the absence of distributional assumption is not sufficient
reason for selecting PLS-SEM (Hair, Risher & Ringle 2019).
Sample Size
PLS-SEM can work efficiently with a wider sample size range and thus models are increased
in complexity (Hair, Ringle & Sarstedt 2011; Hair, Risher & Ringle 2019). Although PLS-
SEM can still be used for a small sample size (Hair, Risher & Ringle 2019), the model’s
complexity and data characteristic still depend on the sample size (Henseler et al. 2014). The
required sample size should be determined by power analyses based on anticipated
significance level, model structure and the expected effect sizes (Hair, Risher & Ringle 2019;
Marcoulides & Chin 2013). The inverse square root and gamma exponential methods can
Page 51
also be used to calculate the minimum sample size (Hair, Risher & Ringle 2019; Kock &
Hadaya 2018).
Non-Normal Data
Non-normal data can make CB-SEM deliver abnormal results (Hair, Risher & Ringle 2019;
Reinartz, Haenlein & Henseler 2009). PLS-SEM transforms non-normal data in accordance
with the central limit theorem and hence non-normal data is less stringent to work with
(Cassel, Hackl & Westlund 1999; Hair Jr., Sarstedt, et al. 2014). PLS-SEM appears to be
more robust with non-normal data in comparison to its CB-SEM counterpart (Hair, Risher &
Ringle 2019; Sarstedt et al. 2016). Using BCa bootstrapping can adjust skewness of
confidence intervals (Hair, Risher & Ringle 2019).
Statistical Power
PLS-SEM’s focus on maximizing partial structures is one of its disadvantages (Hair, Ringle
& Sarstedt 2011). The statistical analysis’ power can be reduced with highly skewed data
(Hair Jr., Sarstedt, et al. 2014). Skewness can be reduced with Bias-Corrected and accelerated
(BCa) bootstrapping (Hair, Risher & Ringle 2019). The higher statistical power of SEM-PLS
is useful for theories under development in exploratory research (Hair, Risher & Ringle
2019).
Goodness of Fit
As PLS-SEM does not rely on the model fit concept (Hair Joseph, Sarstedt & Ringle 2019), it
is sometimes wrongly thought of as not useful for theory testing and confirmation (Hair,
Risher & Ringle 2019; Westland 2015). Model’s goodness of fit has no adequate global
measurements which restrict PLS-SEM from being used to test and confirm theories (Hair,
Ringle & Sarstedt 2011). PLS-SEM is also appropriate for theory confirmation (Hair, Risher
& Ringle 2019).
Page 52
Measures: Formative vs. Reflective
When the structural model has formative constructs then the preferred approach is PLS-SEM
(Hair, Risher & Ringle 2019). This research’s model is made of formative and reflective
constructs.
Reflective measures are when indicators are caused by the construct (arrows pointing from
the construct to the indicator) (Hair Jr., Sarstedt, et al. 2014). The effect of a construct on a
reflective indicator is referred to as a loading. As for the remaining constructs, the TRI
measures beliefs (Parasuraman 2000). The indicators for the TR dimension were directly
taken from Parasuraman & Colby (2015). The IWP measures behaviours (Koopmans et al.
2013). The indicators used for Learning Behaviour were derived from Koopmans et al.
(2013) and Pradhan & Jena (2017). As “personality” and “attitudes” causes something that is
observable, these indicators are realised therefore reflective (Diamantopoulos & Winklhofer
2001; Fornell & Bookstein 1982). To avoid measuring the same behaviour twice, the
antithetical counterproductive work behaviour was not added to the online questionnaire.
Formative measures are when indicators cause the construct (arrows pointing from the
indicator to the construct) (Hair Jr., Sarstedt, et al. 2014). The effect of a formative indicator
on a construct is referred to as a weight. When a combination of indicators make a construct
then they should be formative (Fornell & Bookstein 1982). TKS refer to systems such as
KMS, Learning Management System (LMS) and Content Management System (CMS) that
deliver knowledge. Indicators for this construct were derived from three sources (Adeyinka et
al. 2010; Kuo & Lee 2009; Ozkan, Koseler & Baykal 2009). SN refers to online sites and
services that allow individuals to connect and interact with one another (Gupta & Bashir
2018). Indicators for SN were adapted from Gupta & Bashir (2018). The combination of the
indicators forms the TKS and SN in the model. The different set of indicators that make SI in
the model were derived from Venkatesh et al. (2003). Acquisition, Assimilation,

Page 53
Transformation and Exploitation are interdependent (Zahra & George 2002). The indicators
used for these four capabilities make the PACAP, RACAP and ACAP construct. When the
indicators make the construct, as such, these have been set to the formative. PLS-SEM allows
the usage of formative indicators (Hair Jr., Sarstedt, et al. 2014).
Hair Jr., Sarstedt, et al. (2014) recommends applying the most recent evaluation of criteria to
ensure validity for said indicators.
Using Higher-Order Construct
Higher-order Constructs (HC) allows for abstract constructs modelling (referred to as Higher-
Order Component (HOC)) along with its sub constructs (Becker et al. 2019). This extends the
abstraction from single layer to multiple layers (Becker et al. 2019). It also achieves model
parsimony by reducing the number of path models relationships (Becker et al. 2019; Johnson,
Rosen & Chang 2011). This can also help HC with the bandwidth-fidelity dilemma
(Cronbach & Gleser 1965, p.100). In addition, they can reduce formative indicator
collinearity (Becker et al. 2019). There are three concerns regarding HC (Becker et al. 2019).
First, the measurement theory must be well developed for the conceptualisation and
specification of HC (Becker et al. 2019). Researchers must decide on the Lower-Order
Components (LOC) measurement model specification and the HOC and its LOC relationship
(Becker et al. 2019). The four types of HC are reflective-reflective, reflective-formative,
formative-reflective, and formative-formative (Becker et al. 2019; Becker, Klein & Wetzels
2012; Cheah et al. 2019). The second concern is the choice of approach for identifying HC
(Becker et al. 2019). The repeated indicators approach or the two-stage approach are among
the more prominent (Becker et al. 2019). Finally, the measurement quality of HC is
challenging to evaluate (Becker et al. 2019). The LOC and HOC reliability and validity are
sometimes not assessed, and other times the relationship between them is interpreted as a
structural model (Becker et al. 2019). The LOC should be assessed as elements of the HC

Page 54
measurement model (Becker et al. 2019). The discriminant validity should be assessed on
both LOC and HC (Becker et al. 2019). Acquisition, Assimilation, Transformation and
Exploitation are all dynamic capabilities of ACAP that are interdependent (Zahra & George
2002). ACAP is the HOC of said LOC capabilities of Acquisition, Assimilation,
Transformation and Exploitation. As all components are formative, the preferred HC is
formative-formative.
Theory Testing and Confirmation
PLS-SEM is suited for prediction and developing theories (Hair, Ringle & Sarstedt 2011;
Hair, Risher & Ringle 2019; Reinartz, Haenlein & Henseler 2009). From a statistical point of
view, CB-SEM and PLS-SEM differ methodologically, however, estimations from PLS-SEM
can be a good substitute for CB-SEM results (Hair, Ringle & Sarstedt 2011). For theory
testing, PLS-SEM is a good alternative (Hair, Ringle & Sarstedt 2011; Hair, Risher & Ringle
2019).
Conclusion
The objective of the analysis must be understood before selecting an appropriate method for
SEM (Hair, Ringle & Sarstedt 2011). Despite the increased usage of PLS-SEM, it is still
perceived as less rigorous and thus less suitable for examining latent variable relationships
(Hair, Ringle & Sarstedt 2011). However, PLS-SEM offers many benefits that CB-SEM does
not have when properly applied (Hair, Ringle & Sarstedt 2011). In contrast to CB-SEM, PLS-
SEM can deal with more problems (Hair, Ringle & Sarstedt 2011). For every model, every
distribution, every set of parameter values, and every sample size, there is no such thing as
the perfect estimation method (Henseler et al. 2014). An objective mind should highlight the
advantages and limitations of any method (Henseler et al. 2014). When the objective is to test
cause-effect-relationships models with latent variables, SEM is the technique of choice (Hair
Jr., Sarstedt, et al. 2014). Even though PLS-SEM is a preferred method for predictions (Hair,

Page 55
Ringle & Sarstedt 2011; Reinartz, Haenlein & Henseler 2009), it is also appropriate for
theory confirmation (Hair, Risher & Ringle 2019). As the purpose of this study is to provide
evidence of a causal-effect between conceptual frameworks, PLS-SEM remains an
appropriate method to predict and confirm said causal-effect.
4.7.3 The PLS-SEM Algorithm
Hair, Ringle & Sarstedt (2011) details the following algorithms for PLS-SEM which is
featured in the table below.
Stages and steps in calculating the basic PLS-SEM algorithm (Hair, Ringle & Sarstedt 2011)
are as follows:
1) Stage One: Iterative estimation of latent construct scores
1) Step 1: Outer approximation of latent construct scores (the scores of Y1, Y2,
and Y3 are computed based on the manifest variables’ scores and the outer
coefficients from step 4)
2) Step 2: Estimation of proxies for structural model relationships between latent
constructs (P1 and P2)
3) Step 3: Inner approximation of latent construct scores (based on scores for Y1,
Y2, and Y3 from step 1 and proxies for structural model relationships, P1 and
P2, from step 2)
4) Step 4: Estimation of proxies for coefficients in the measurement models (the
relationships between indicator variables and latent constructs with scores
from step 3; W1 to W7)
2) Stage Two: Final estimates of coefficients (outer weights and loadings, structural
model relationships) are determined using the ordinary least squares method for each
partial regression in the PLS‑SEM model.
Page 56
4.7.4 Evaluation of PLS-SEM Results
The evaluation of PLS-SEM results requires first the assessment of the measurement and then
the structural model (Hair, Risher & Ringle 2019).
Assessing Measurement Model
Formative and reflective indicators rely on a different criteria for their evaluations (Hair,
Risher & Ringle 2019; Hair Jr., Sarstedt, et al. 2014).
Reflective Indicators and Constructs
To assess reflective measurements model, the steps (see Figure 4.) are as follows:
1. Examine reflective indicator loading (Hair, Risher & Ringle 2019). To provide acceptable
indicator reliability, recommended loadings should be above 0.708. This means that the
indicator’s variance of the construct is above 50 per cent. Indicators with outer loadings
beneath 0.40 should always be removed (Hair Jr., Hult, et al. 2014, p. 103). Indicators with
outer loadings between 0.40 and 0.70 should be removed if it increases the Composite
Reliability (CR) or Average Variance Extracted (AVE).
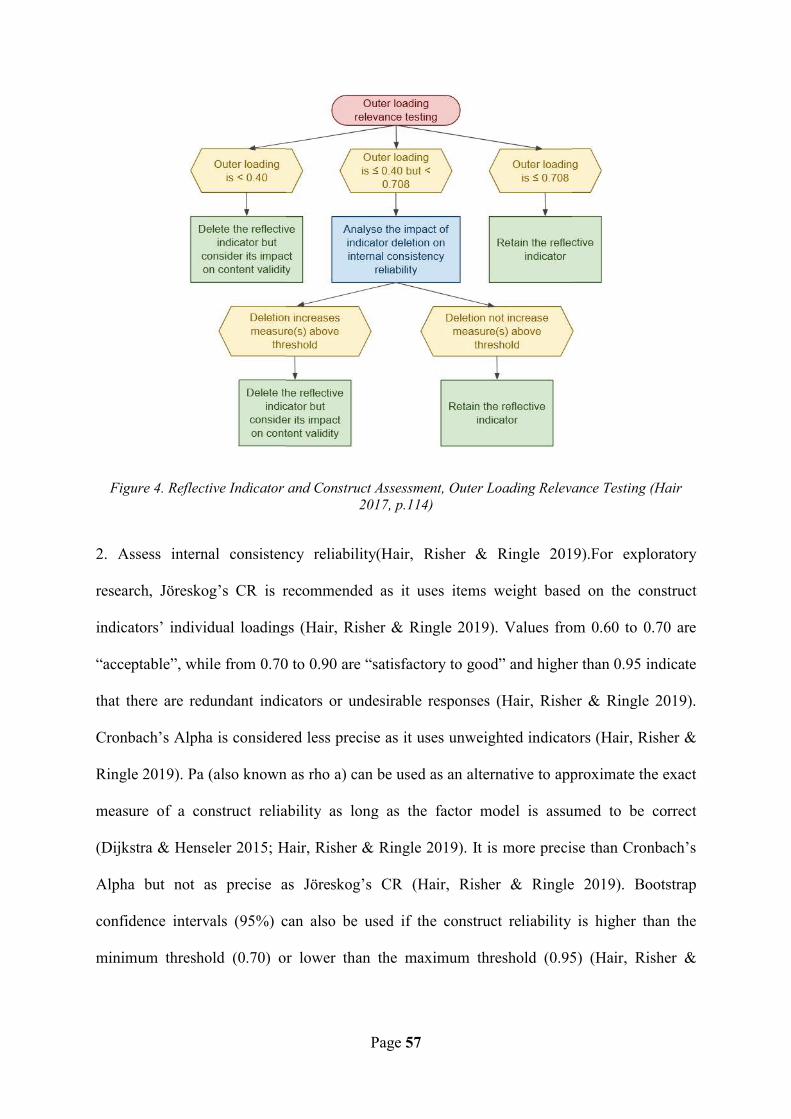
Figure 4. Reflective Indicator
2. Assess internal consisten
research, Jöreskog’s CR is r
indicators’ individual loading
“acceptable”, while from 0.70
that there are redundant indic
Cronbach’s Alpha is consider
Ringle 2019). Pa (also known
measure of a construct relia
(Dijkstra & Henseler 2015; H
Alpha but not as precise a
confidence intervals (95%) c
minimum threshold (0.70) o
Page 57
and Construct Assessment, Outer Loading Releva2017, p.114)
ncy reliability(Hair, Risher & Ringle 201
recommended as it uses items weight base
gs (Hair, Risher & Ringle 2019). Values fro
0 to 0.90 are “satisfactory to good” and highe
cators or undesirable responses (Hair, Rishe
red less precise as it uses unweighted indicato
n as rho a) can be used as an alternative to app
ability as long as the factor model is assu
Hair, Risher & Ringle 2019). It is more preci
as Jöreskog’s CR (Hair, Risher & Ringle
can also be used if the construct reliability
r lower than the maximum threshold (0.95
ance Testing (Hair
9).For exploratory
d on the construct
om 0.60 to 0.70 are
r than 0.95 indicate
er & Ringle 2019).
ors (Hair, Risher &
proximate the exact
umed to be correct
se than Cronbach’s
e 2019). Bootstrap
is higher than the
5) (Hair, Risher &
Page 58
Ringle 2019). The percentile method should be preferred (Aguirre-Urreta & Rönkkö 2018;
Hair, Risher & Ringle 2019).
3. Address the convergent validity which explains the variance of items (Hair, Risher &
Ringle 2019). On each construct, the AVE should be used for all indicators. The AVE is
calculated by squaring the loading of each indicator on a construct then calculating the mean
value (Hair, Risher & Ringle 2019). To explain at least 50 percent of the variance of its
indicators, the AVE value should be higher than 0.50 (Hair, Risher & Ringle 2019).
4. Assess discriminant validity which indicates how distinct is a construct from another
construct in the model (Hair, Risher & Ringle 2019). The HeteroTrait-MonoTrait ratio
(HTMT) of the correlations is the recommended assessment measurement (Hair, Risher &
Ringle 2019; Henseler, Ringle & Sarstedt 2015; Voorhees et al. 2016). When HTMT values
are high, it indicates problems with discriminant validity (Hair, Risher & Ringle 2019). A
recommended threshold value less than 0.85 is recommended even though 0.90 would still
indicate that there are no problems (Hair, Risher & Ringle 2019; Henseler, Ringle & Sarstedt
2015).
Assessing Formative Indicators and Constructs
The evaluation of formative measurement models is based on indicator collinearity, statistical
significance, and relevance of the indicator weights (Hair, Risher & Ringle 2019).
Indicator collinearity can be evaluated using Variance Inflation Factor (VIF) which should be
ideally lower or close to 3 (Hair, Risher & Ringle 2019). Collinearity issues can still exist
with values below 3 (Becker et al. 2015; Hair, Risher & Ringle 2019; Mason 1991). VIF is
assessed in the structural model.
Page 59
The following process is used to assess the statistical significance of formative indicators (see
Figure 5.). Statistical significance can be evaluated using bootstrapping (Hair, Risher &
Ringle 2019). In case the indicator weights bootstrap distribution is skewed, the BCa
bootstrap is recommended to test the statistical significance (Hair, Risher & Ringle 2019).
The percentile method can be used as a fallback to build bootstrap-based confidence intervals
(Aguirre-Urreta & Rönkkö 2018; Hair, Risher & Ringle 2019). If the outer weight of a
formative indicator is not significant (p-value is above 0.05) then its outer loading should be
assessed (Hair, Risher & Ringle 2019). If its outer loading is above 0.50 then it is absolutely
but not relatively important (Hair Jr., Hult, et al. 2014, p. 129). A formative indicator’s
loading of and below 0.50 should be removed except if there is strong justification based on
measurement theory (Hair, Risher & Ringle 2019). An indicator’s loading is not significant
(p-value above 0.05) then it can be considered for removal (Hair Jr., Hult, et al. 2014, p. 129-
130). However, removing an indicator from formative measurement can reduce the
measurement content validity as these are not interchangeable (Diamantopoulos &
Winklhofer 2001; Hair, Risher & Ringle 2019).

Figure 5. Formative Indicator
Following this, the relevance
Ringle 2019). Weights close
weak relationship, and in rare
indicates abnormal results (Ha
Assessing Structural Models
The coefficient of determina
2012) or the blindfolding-ba
significance and relevance o
model (Hair, Risher & Ringle
Page 60
and Construct Assessment, Outer Loading Relev2017, p.150)
e of the indicator’s weight should be assesse
to +1 or -1 indicate a strong positive relatio
e cases the value can even be above +1 or lo
air, Risher & Ringle 2019).
ation (R2 also known or in-sample predicti
ased cross validated redundancy measure
f the path coefficients are all criteria to as
2019).
vance Testing (Hair
ed (Hair, Risher &
onship, close to 0 a
ower than -1 which
ive power (Rigdon
Q2, the statistical
ssess the structural
Page 61
Ensuring no regression bias
But first, to ensure that collinearity does not bias the regression results, the VIF values can be
calculated from the predictors constructs latent variable scores in a partial regression (Hair,
Risher & Ringle 2019). Again, the VIF values should be 3 or lower (Hair, Risher & Ringle
2019).
Examining the effect of constructs
The R2 value of endogenous construct should then be examined (Hair, Risher & Ringle
2019). R2 of 0.75 is substantial, R2 of 0.50 is moderate, R2 of 0.25 is weak (Hair, Ringle &
Sarstedt 2011), although, depending on the discipline, values as low as 0.10 can be
satisfactory (Hair, Risher & Ringle 2019; Raithel et al. 2012). Although Q2 value is
presented as another out of sample prediction measurement, it is not as if it combines the
aspects of out-of-sample prediction and in-sample explanatory power (Hair, Risher & Ringle
2019; Shmueli et al. 2016). R2 can only indicate a model’s in-sample and not out-of-sample
explanatory power (Dolce, Esposito Vinzi & Lauro 2017; Hair, Risher & Ringle 2019;
Shmueli 2010; Shmueli & Koppius 2011).
F2 can be used to report the effect size along with path coefficients where F2 values higher
than 0.02 are small effects, 0.15 are medium, and 0.35 are large (Hair, Risher & Ringle
2019). F2 is recommended to be reported only if requested by reviewers or editors (Hair,
Risher & Ringle 2019).
Selecting a Higher-Order Constructs Approach
The repeated indicators or the two-stage approaches are among the more prominent approach
of identifying HC (Becker et al. 2019; Ringle, Sarstedt & Straub 2012). To estimate the HC,
measurement models can be used by the PLS algorithm either in Mode A or Mode B (Becker
et al. 2019). Mode A is typically used to estimate reflective measurement models and Mode
Page 62
B is used to estimate formative measurement models (Becker et al. 2019). To evaluate the
HC, the LOC measurement models and the HC measurement model relationships between
HOC and LOC are needed (Becker et al. 2019).
The (extended) repeated indicators approach
The repeated indicators approach assigns all indicators of the LOC to the HOC (Becker et al.
2019). When all LOC have the same number of indicators, this approach works best (Becker,
Klein & Wetzels 2012; Ringle, Sarstedt & Straub 2012). Small biases are produced when the
repeated indicator approach is used in the estimation of the HC measurements model (Becker
et al. 2019). The repeated indicators approach becomes problematic when used with a
dependant reflective-formative and formative-formative HC in the path model (Becker et al.
2019). Antecedent constructs not part of the HC but in the path model and cannot explain any
HC variance as its path coefficient will be close to zero and not significant (Becker et al.
2019; Ringle, Sarstedt & Straub 2012). The relationship between the antecedent constructs
and the LOC need to be specified (Becker et al. 2019). The antecedent construct’s total effect
on the HOC including all indirect effects via LOC needs to be analysed to portray an accurate
picture of antecedent’s actual effect on HOC (Becker et al. 2019; Becker, Klein & Wetzels
2012).
Estimation process
To estimate measurement model in the repeated indicators, the choice of modes is applied to
the orientation of HOC and not LOC (Becker et al. 2019; Becker, Klein & Wetzels 2012).
Validation process
Repeated indicators cannot evaluate HC because its measurement model is defined by its
relation with its LOC (Becker et al. 2019). Standard measurement model assessment criteria
needs to be applied to the relationship between HOC and LOC (Becker et al. 2019). Also
Page 63
discriminant validity issue cannot be resolved by HC (Becker et al. 2019). LOC must be
considered as the HOC measurement model to assess its discriminant validity (Becker et al.
2019). HOC only needs to be assessed as part of the structural model (Becker et al. 2019).
Structural model robustness checks should complement the analysis (Becker et al. 2019;
Sarstedt et al. 2019).
The two-stage approach
The two-stage approach has two versions that lead to similar results (Becker et al. 2019;
Cheah et al. 2019). It has a better parameter recovery of paths pointing from and to the HC
and exogenous construct in the path model (Becker et al. 2019). In the first stage, the scores
of all constructs are saved and are used as new variable in the dataset (Becker et al. 2019). In
the second stage of the embedded approach, the constructs score are used as the HC
measurement model (Becker et al. 2019). In the second stage of the disjoint approach, LOC
construct scores are used to measure the HC (Becker et al. 2019).
Estimation
To estimate the measurement model in the disjoint two-stage approach, the standard settings
should be applied with mode A for reflective measurements and mode B for formative
(Becker et al. 2019). Becker et al. (2019) recommends for the estimation of HC to use the
path weighting scheme as the default setting in PLS-SEM.
Validation Process
Stage one considers all measurement models including LOC (Becker et al. 2019). Stage two
measurement model needs to assess HC as an expression of the relationships between HOC
and LOC (Becker et al. 2019). As the disjoint two stage approach uses multi-items allows the
assessment of the structural model (Becker et al. 2019). Other advanced PLS-SEM analysis
techniques such as Confirmatory Tetrad Analysis (CTA)-PLS, PLSpredict or Importance

Page 64
Performance Map Analysis (IPMA) needs further research to address the use in stage two of
un-standardised latent variable scores from stage one (Becker et al. 2019).
Conclusion
CTA-PLS, PLSpredict or IPMA from PLS-SEM requires further research to address the use
in stage two of un-standardised latent variable scores from stage one (Becker et al. 2019).
However as opposed to the repeated indicator approach, the disjoint two stage approach can
assess the structural model (Becker et al. 2019). The disjoint two stage approach remains the
preferred HC approach.
4.8 Chapter Summary
PLS-SEM has many advantages over its CB-SEM counterpart. It has fewer restrictions with
assumptions, works better with wider sample range and complex models and is more robust
with non-normal data. It has higher statistical power making it useful for exploratory research
and does not rely on the model fit concept. With PLS-SEM, the use of HC allows for abstract
modelling. The two stage approach has better parameter recovery with the disjoint approach
allowing for structural model assessment. To use the two stage approach, the latent variable
scores are saved from stage 1. They are then used as indicators in stage 2.
To assess the measurement model, reflective indicators’ loading must be above 0.4. The
constructs must be for CR between 0.6 and 0.95, for AVE above 0.50, and for HTMT below
0.85. For formative indicators, there should not be any indicator whose weight is not
significant (above 0.05) and loading is below 0.5 and insignificant (above 0.05). Weights
need to be in between +1 and -1 for the results to be normal.
To assess the structural model, the VIF values must be below 3, the p-value must be below
the statistical significance threshold of 0.05 and the R2 value assesses the construct’s effect

Page 65
with 0.75 as substantial, 0.50 as moderate, 0.25 as weak, and depending if the discipline
accepts it, 0.10 as very weak. With HC, more research is required to use other methods of
assessment.

Page 66
Chapter 5: Results
This chapter presents the results produced using the methodology described in Chapter 4.
Here, the demographic variables are described and analysed starting with gender identity,
biological age, technological age, provenance of students, education and TRI taxonomy of
participants. In addition, this chapter reports the measurement model and structural model
results of stage 1 and stage 2 disjoint approach to demonstrate that these are all within
acceptable thresholds and their statistical significance. This chapter finishes with explaining
that further research is required to use other PLS-SEM reporting methods.
5.1 Descriptive Analysis of Demographic Variables
The answers collected from the demography section of the online questionnaire are
discussed. From those answers, the inclusion of options such as “Prefer not to answer”, “I do
not know” and “Other” is justified. First, gender identities are introduced. Second, the
different age demographics are presented. Then, the technological ages are discussed. After,
the residential addresses are argued. The provenance of participants is then shown. The
participants' curriculum is made known. Finally, the TRI taxonomy is argued.
5.1.1 Gender Identity
When asked participants about “What gender do you identify as ?”, 53% of the participants
predominantly identified as female and 45% as male (see Figure 6.). None of the participants
answered “I do not know” (see Table 5.). The three participants who answered “Prefer not to
say” validate the inclusion of said consent option (see Table 6.). Participants who answered
“Other” were provided a text field to enter further information. The “Other” answers
provided were “Female sex, no gender” and “Genderqueer” (see Table 6.). While the
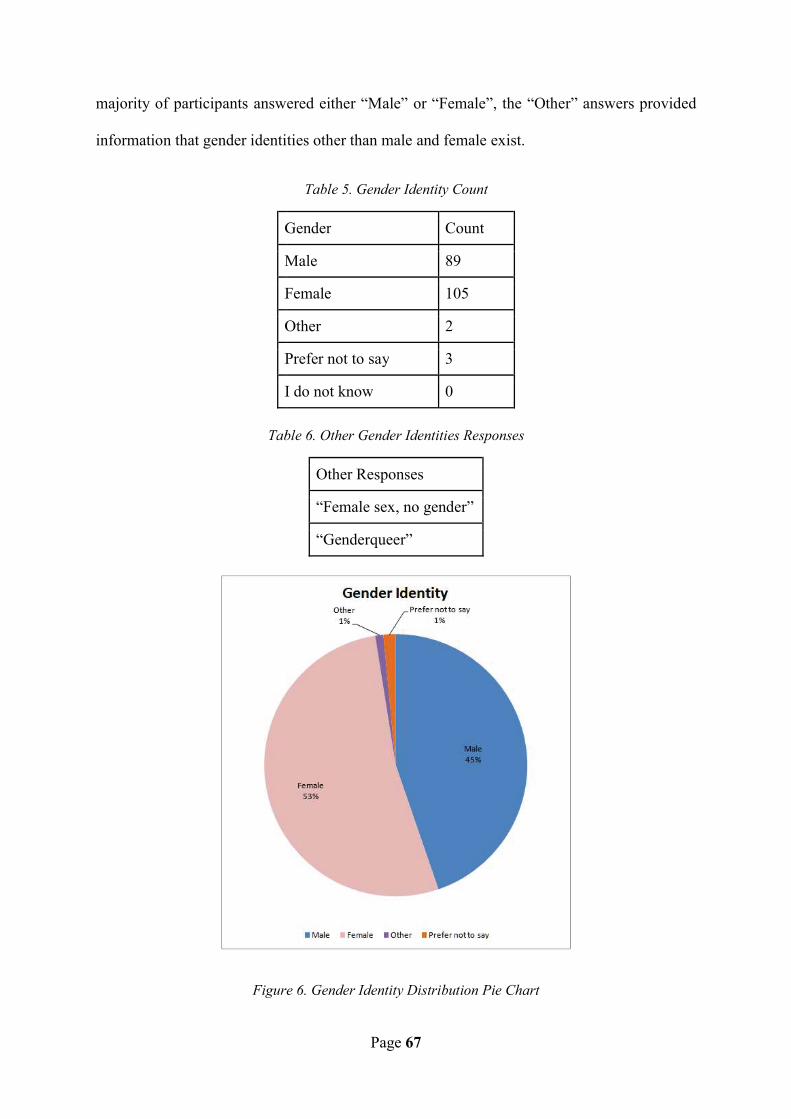
majority of participants answ
information that gender identi
G
M
F
O
P
I
Tab
Figur
Page 67
wered either “Male” or “Female”, the “Other”
ities other than male and female exist.
Table 5. Gender Identity Count
Gender Count
Male 89
Female 105
Other 2
Prefer not to say 3
I do not know 0
ble 6. Other Gender Identities Responses
Other Responses
“Female sex, no gender”
“Genderqueer”
re 6. Gender Identity Distribution Pie Chart
” answers provided
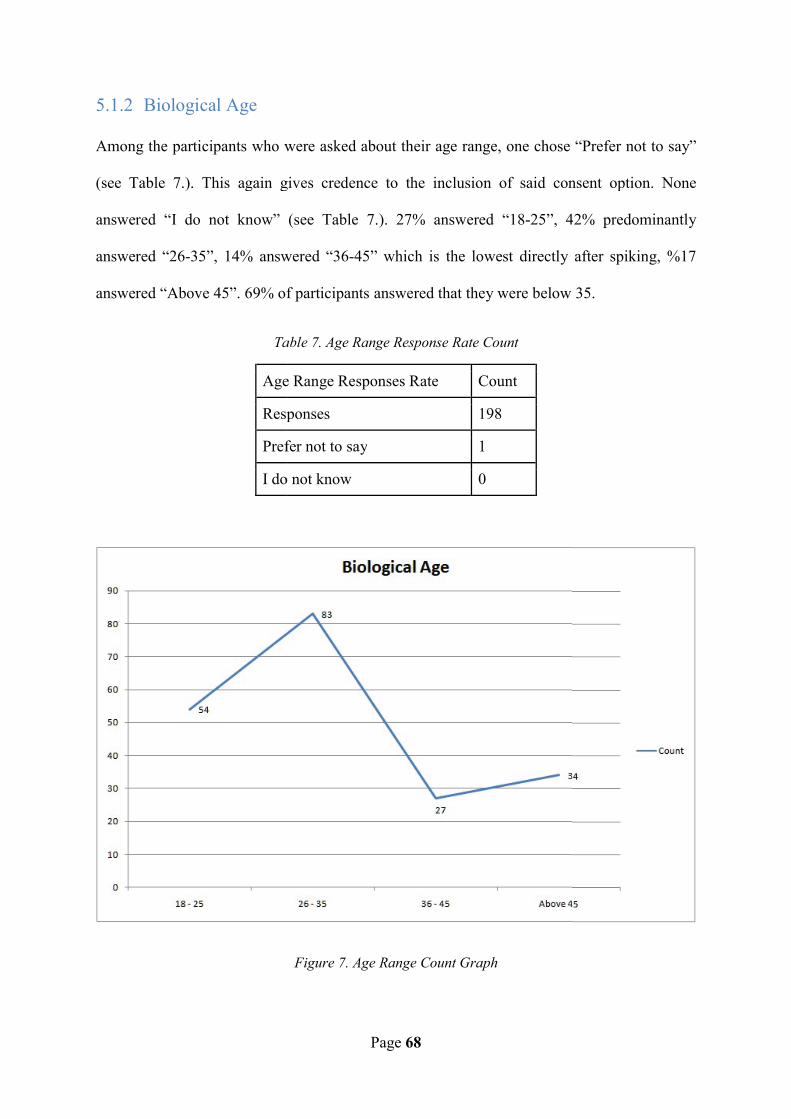
5.1.2 Biological Age
Among the participants who w
(see Table 7.). This again g
answered “I do not know”
answered “26-35”, 14% answ
answered “Above 45”. 69% o
Ta
Age
Res
Pref
I do
Page 68
were asked about their age range, one chose
gives credence to the inclusion of said con
(see Table 7.). 27% answered “18-25”, 4
wered “36-45” which is the lowest directly
f participants answered that they were below
able 7. Age Range Response Rate Count
e Range Responses Rate Count
ponses 198
fer not to say 1
o not know 0
Figure 7. Age Range Count Graph
“Prefer not to say”
nsent option. None
42% predominantly
after spiking, %17
35.
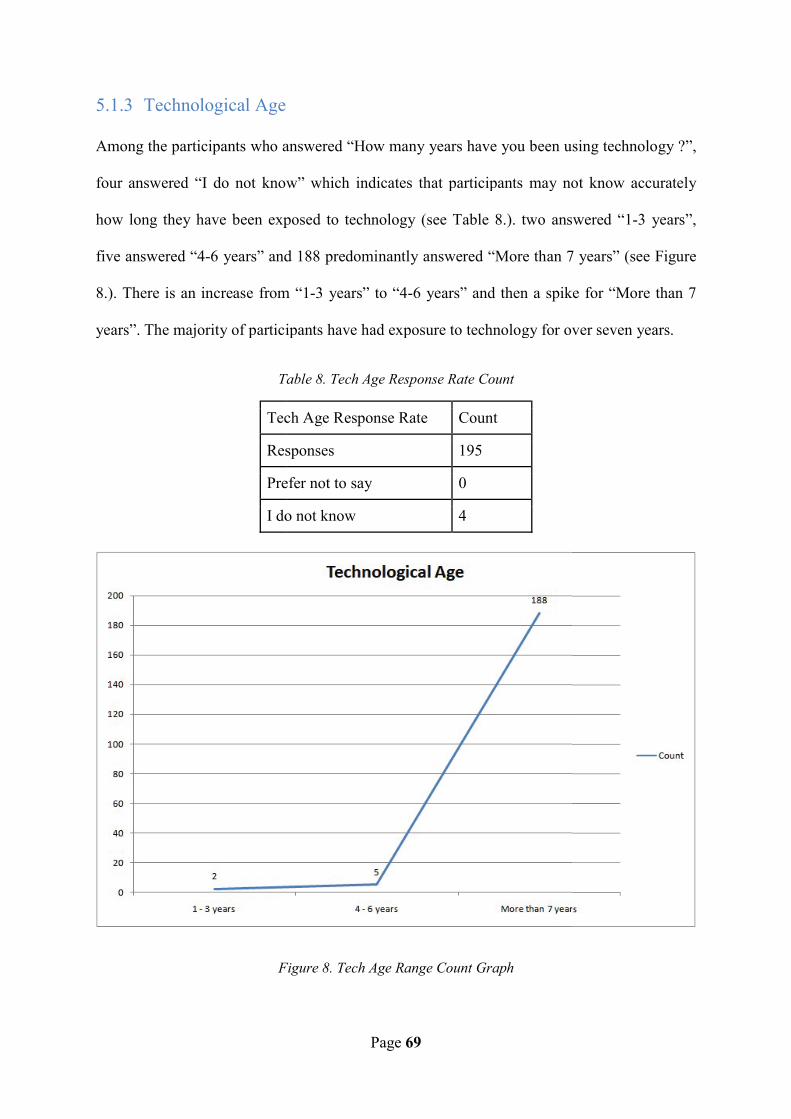
5.1.3 Technological Age
Among the participants who a
four answered “I do not know
how long they have been exp
five answered “4-6 years” and
8.). There is an increase from
years”. The majority of partici
T
Tec
Res
Pre
I do
F
Page 69
answered “How many years have you been u
w” which indicates that participants may no
posed to technology (see Table 8.). two ans
d 188 predominantly answered “More than 7
m “1-3 years” to “4-6 years” and then a spik
ipants have had exposure to technology for ov
Table 8. Tech Age Response Rate Count
ch Age Response Rate Count
sponses 195
efer not to say 0
o not know 4
Figure 8. Tech Age Range Count Graph
sing technology ?”,
ot know accurately
wered “1-3 years”,
7 years” (see Figure
ke for “More than 7
ver seven years.
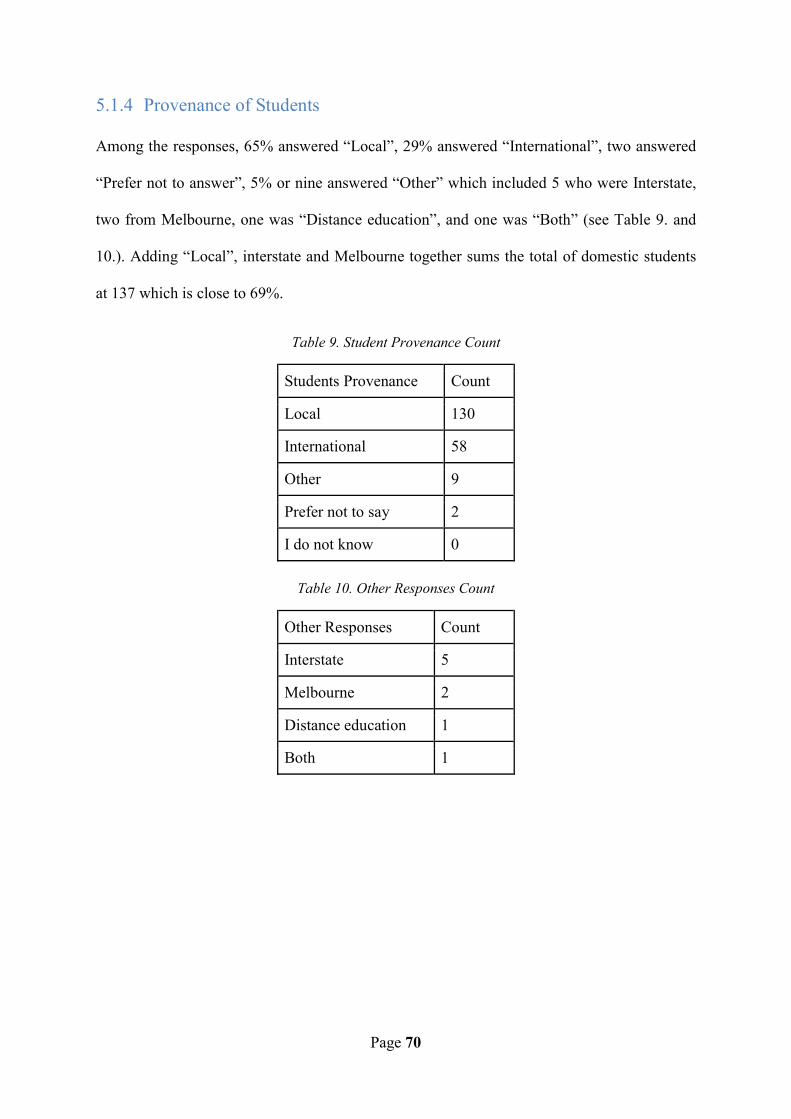
Page 70
5.1.4 Provenance of Students
Among the responses, 65% answered “Local”, 29% answered “International”, two answered
“Prefer not to answer”, 5% or nine answered “Other” which included 5 who were Interstate,
two from Melbourne, one was “Distance education”, and one was “Both” (see Table 9. and
10.). Adding “Local”, interstate and Melbourne together sums the total of domestic students
at 137 which is close to 69%.
Table 9. Student Provenance Count
Students Provenance Count
Local 130
International 58
Other 9
Prefer not to say 2
I do not know 0
Table 10. Other Responses Count
Other Responses Count
Interstate 5
Melbourne 2
Distance education 1
Both 1
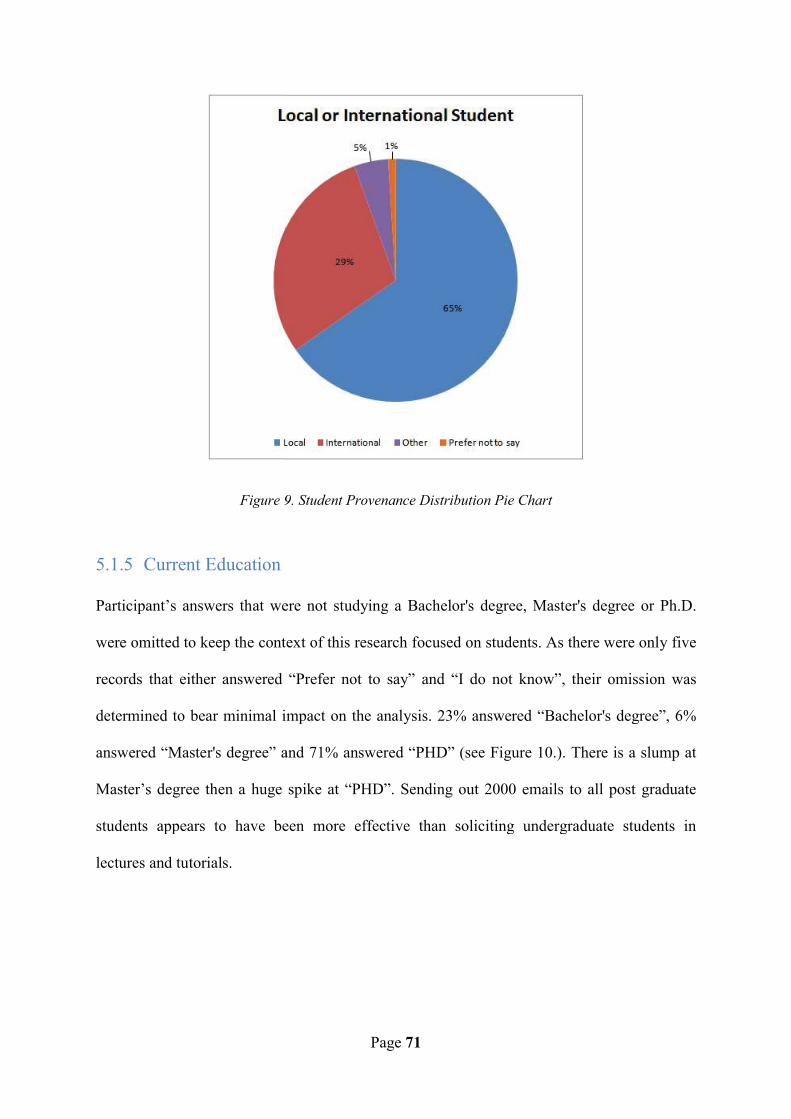
Figure 9
5.1.5 Current Education
Participant’s answers that we
were omitted to keep the cont
records that either answered
determined to bear minimal i
answered “Master's degree” a
Master’s degree then a huge
students appears to have be
lectures and tutorials.
Page 71
9. Student Provenance Distribution Pie Chart
ere not studying a Bachelor's degree, Master
ext of this research focused on students. As t
“Prefer not to say” and “I do not know”, t
mpact on the analysis. 23% answered “Bach
and 71% answered “PHD” (see Figure 10.). T
spike at “PHD”. Sending out 2000 emails t
een more effective than soliciting undergr
r's degree or Ph.D.
here were only five
their omission was
helor's degree”, 6%
There is a slump at
to all post graduate
raduate students in

Figure 1
Figur
Page 72
10. Current Education Distribution Pie Chart
re 11. Current Education Count Bar Chart
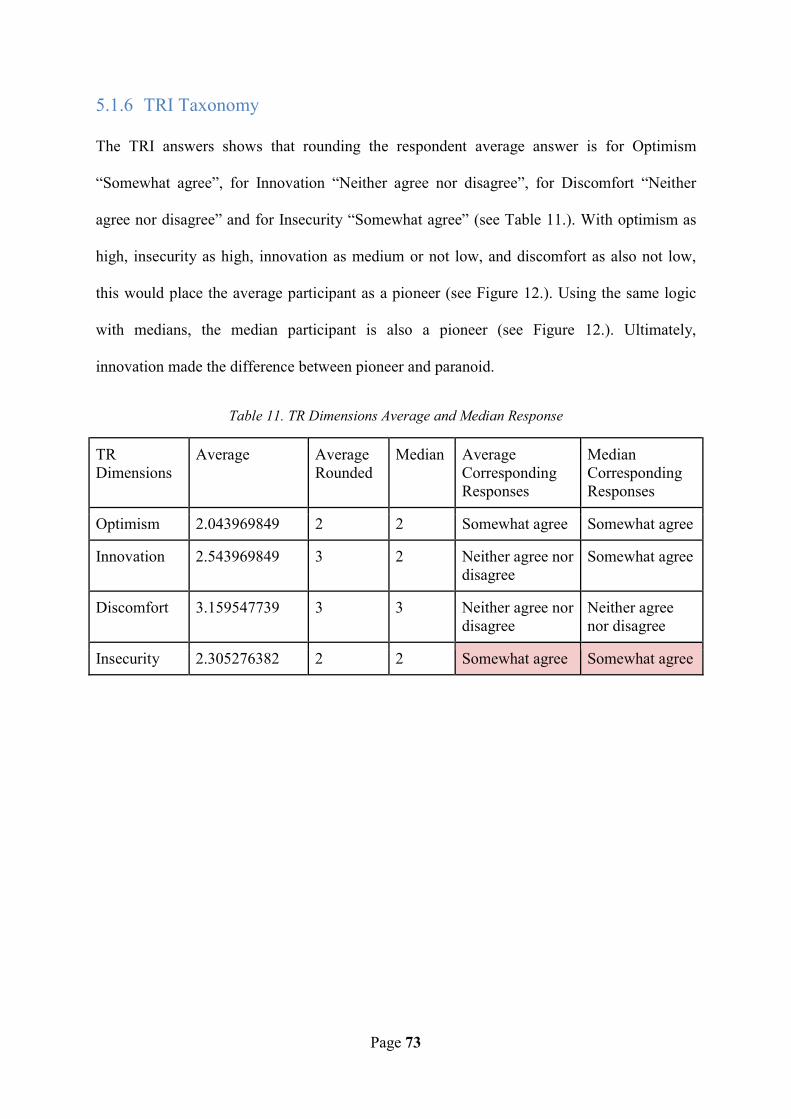
Page 73
5.1.6 TRI Taxonomy
The TRI answers shows that rounding the respondent average answer is for Optimism
“Somewhat agree”, for Innovation “Neither agree nor disagree”, for Discomfort “Neither
agree nor disagree” and for Insecurity “Somewhat agree” (see Table 11.). With optimism as
high, insecurity as high, innovation as medium or not low, and discomfort as also not low,
this would place the average participant as a pioneer (see Figure 12.). Using the same logic
with medians, the median participant is also a pioneer (see Figure 12.). Ultimately,
innovation made the difference between pioneer and paranoid.
Table 11. TR Dimensions Average and Median Response
TR Dimensions
Average Average Rounded
Median Average Corresponding Responses
Median Corresponding Responses
Optimism 2.043969849 2 2 Somewhat agree Somewhat agree
Innovation 2.543969849 3 2 Neither agree nor disagree
Somewhat agree
Discomfort 3.159547739 3 3 Neither agree nor disagree
Neither agree nor disagree
Insecurity 2.305276382 2 2 Somewhat agree Somewhat agree
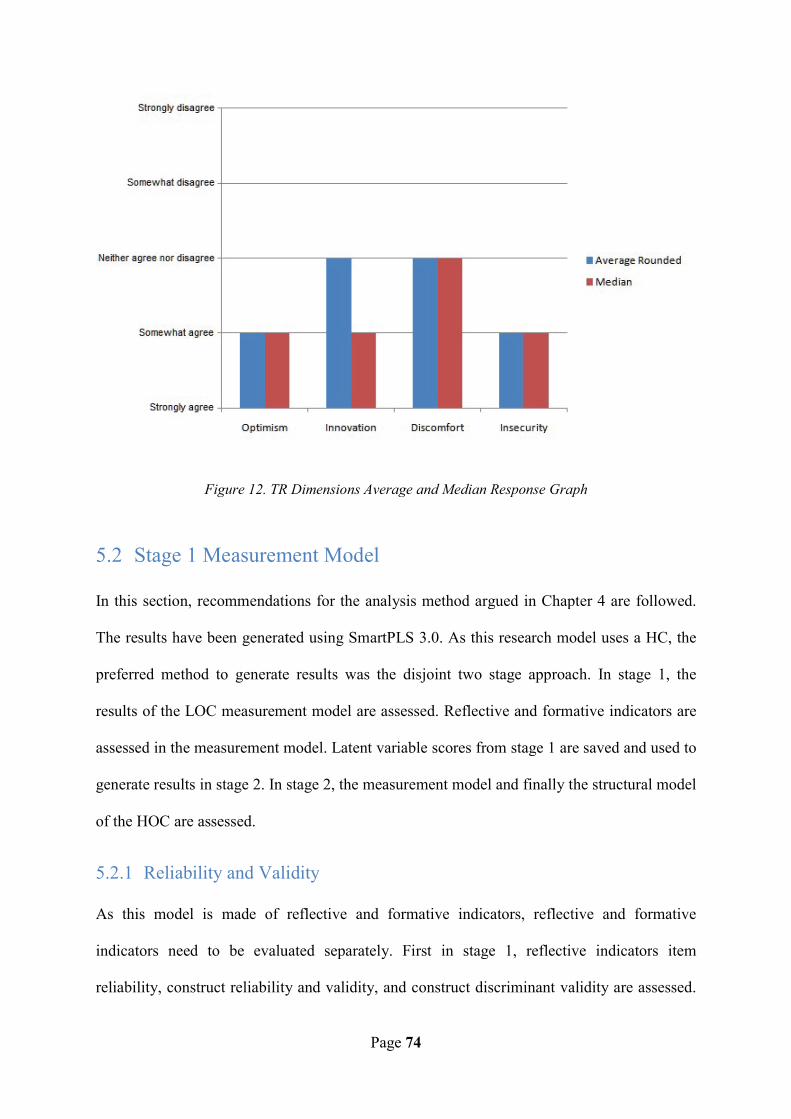
Figure 12. TR
5.2 Stage 1 Measurem
In this section, recommendati
The results have been generat
preferred method to generate
results of the LOC measurem
assessed in the measurement m
generate results in stage 2. In
of the HOC are assessed.
5.2.1 Reliability and Vali
As this model is made of
indicators need to be evalu
reliability, construct reliability
Page 74
R Dimensions Average and Median Response Grap
ment Model
ions for the analysis method argued in Chap
ted using SmartPLS 3.0. As this research mo
e results was the disjoint two stage approa
ment model are assessed. Reflective and form
model. Latent variable scores from stage 1 ar
stage 2, the measurement model and finally t
idity
reflective and formative indicators, reflect
uated separately. First in stage 1, reflectiv
y and validity, and construct discriminant va
aph
pter 4 are followed.
odel uses a HC, the
ch. In stage 1, the
mative indicators are
e saved and used to
the structural model
tive and formative
ve indicators item
alidity are assessed.

Page 75
Then the statistical significance of formative indicators is assessed. Finally, indicator
collinearity and structural model assessment are examined together as they both are assessed
by VIF scores.
Reflective Indicators Item Reliability
As recommended in Chapter 4, these results were generated using the PLS-SEM algorithm
with the weighting scheme set to ‘Path’, maximum iteration set to ‘300’, and stop criterion
set to ‘7’.
Table 12. Stage 1 Reflective Indicator Outer Loadings
Discomfort Innovation Insecurity Learning Behaviour Optimism
DISC1 0.574
DISC2 0.593
DISC3 0.738
DISC4 0.884
INNO1 0.799
INNO2 0.688
INNO3 0.850
INNO4 0.805
INSE2 0.598
INSE4 0.887
IWP2 0.713
IWP3 0.809
IWP4 0.742
OPTI1 0.677
OPTI2 0.674
OPTI4 0.862

Page 76
All indicator loadings are above the 0.4 removal threshold (see Table 12.). While the
recommended threshold should be above 0.708, all CR and AVE are within good thresholds.
Reflective indicators’ loading are all within acceptable thresholds. They should therefore be
reliable.
Construct Reliability and Validity
Table 13. Stage 1 Reflective Indicator Construct Reliability and Average Variance Extracted
Composite Reliability Average Variance Extracted (AVE)
Discomfort 0.80 0.50
Innovation 0.87 0.62
Insecurity 0.72 0.57
Learning Behaviour 0.80 0.57
Optimism 0.78 0.55
All CR are above 0.7 which is “satisfactory to good” and below 0.9 which indicates there are
no redundant items. The CR values indicate that the internal consistency is reliable (see Table
13.). All reflective indicators AVE are above 0.5 which addresses the convergent validity.
Construct Discriminant Validity
Table 14. Stage 1 Reflective Indicator Heterotrait-Monotrait Ratio
Discomfort Innovation Insecurity Learning Behaviour
Optimism
Discomfort
Innovation 0.179
Insecurity 0.733 0.189
Learning Behaviour
0.260 0.244 0.275
Optimism 0.210 0.294 0.377 0.163
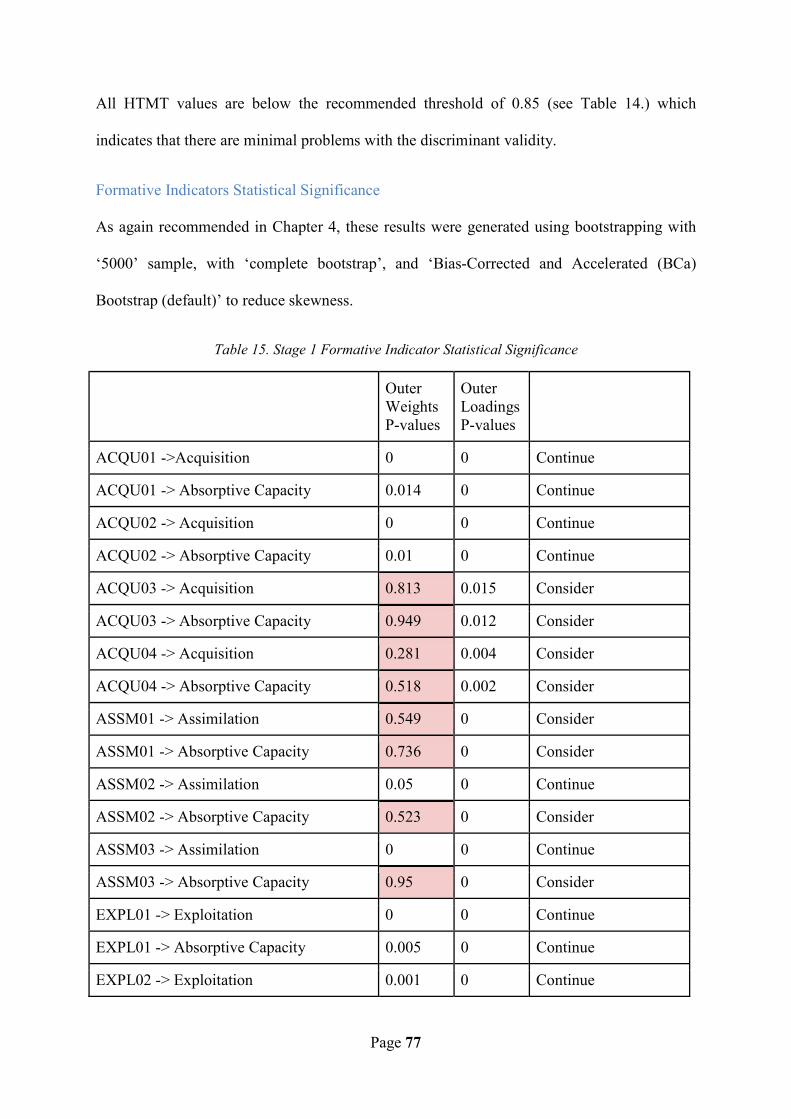
Page 77
All HTMT values are below the recommended threshold of 0.85 (see Table 14.) which
indicates that there are minimal problems with the discriminant validity.
Formative Indicators Statistical Significance
As again recommended in Chapter 4, these results were generated using bootstrapping with
‘5000’ sample, with ‘complete bootstrap’, and ‘Bias-Corrected and Accelerated (BCa)
Bootstrap (default)’ to reduce skewness.
Table 15. Stage 1 Formative Indicator Statistical Significance
Outer Weights P-values
Outer Loadings P-values
ACQU01 ->Acquisition 0 0 Continue
ACQU01 -> Absorptive Capacity 0.014 0 Continue
ACQU02 -> Acquisition 0 0 Continue
ACQU02 -> Absorptive Capacity 0.01 0 Continue
ACQU03 -> Acquisition 0.813 0.015 Consider
ACQU03 -> Absorptive Capacity 0.949 0.012 Consider
ACQU04 -> Acquisition 0.281 0.004 Consider
ACQU04 -> Absorptive Capacity 0.518 0.002 Consider
ASSM01 -> Assimilation 0.549 0 Consider
ASSM01 -> Absorptive Capacity 0.736 0 Consider
ASSM02 -> Assimilation 0.05 0 Continue
ASSM02 -> Absorptive Capacity 0.523 0 Consider
ASSM03 -> Assimilation 0 0 Continue
ASSM03 -> Absorptive Capacity 0.95 0 Consider
EXPL01 -> Exploitation 0 0 Continue
EXPL01 -> Absorptive Capacity 0.005 0 Continue
EXPL02 -> Exploitation 0.001 0 Continue
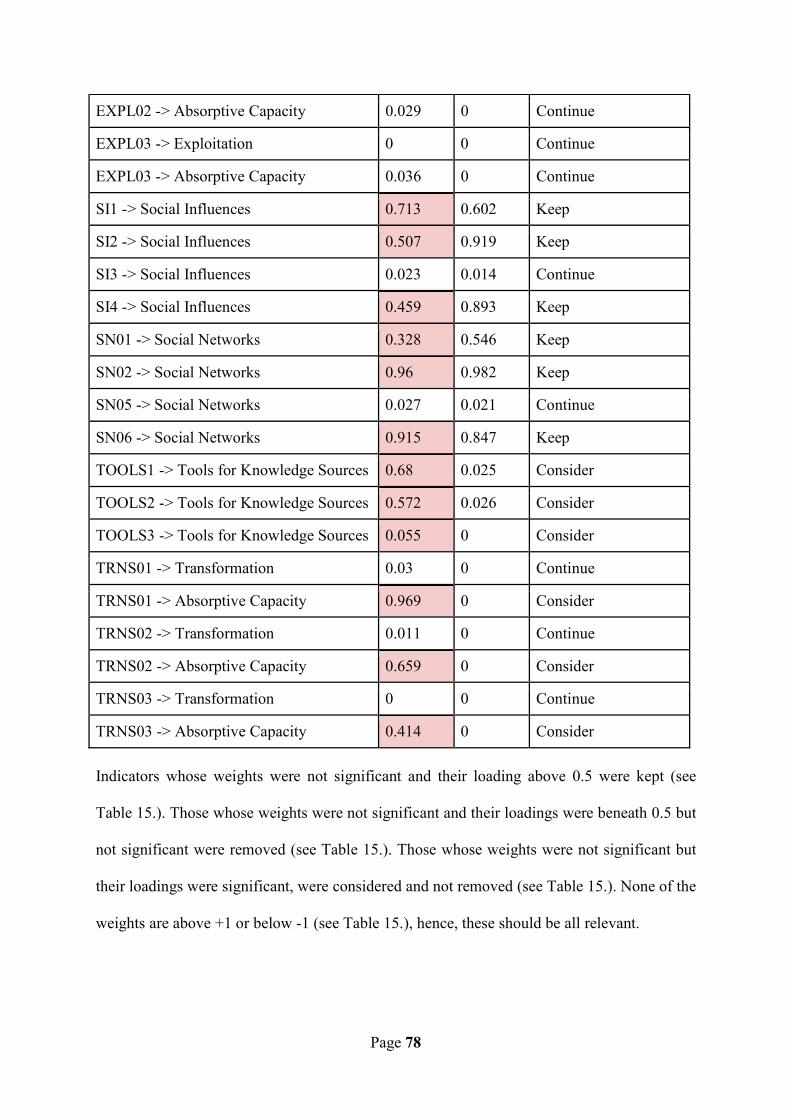
Page 78
EXPL02 -> Absorptive Capacity 0.029 0 Continue
EXPL03 -> Exploitation 0 0 Continue
EXPL03 -> Absorptive Capacity 0.036 0 Continue
SI1 -> Social Influences 0.713 0.602 Keep
SI2 -> Social Influences 0.507 0.919 Keep
SI3 -> Social Influences 0.023 0.014 Continue
SI4 -> Social Influences 0.459 0.893 Keep
SN01 -> Social Networks 0.328 0.546 Keep
SN02 -> Social Networks 0.96 0.982 Keep
SN05 -> Social Networks 0.027 0.021 Continue
SN06 -> Social Networks 0.915 0.847 Keep
TOOLS1 -> Tools for Knowledge Sources 0.68 0.025 Consider
TOOLS2 -> Tools for Knowledge Sources 0.572 0.026 Consider
TOOLS3 -> Tools for Knowledge Sources 0.055 0 Consider
TRNS01 -> Transformation 0.03 0 Continue
TRNS01 -> Absorptive Capacity 0.969 0 Consider
TRNS02 -> Transformation 0.011 0 Continue
TRNS02 -> Absorptive Capacity 0.659 0 Consider
TRNS03 -> Transformation 0 0 Continue
TRNS03 -> Absorptive Capacity 0.414 0 Consider Indicators whose weights were not significant and their loading above 0.5 were kept (see
Table 15.). Those whose weights were not significant and their loadings were beneath 0.5 but
not significant were removed (see Table 15.). Those whose weights were not significant but
their loadings were significant, were considered and not removed (see Table 15.). None of the
weights are above +1 or below -1 (see Table 15.), hence, these should be all relevant.

Page 79
Indicator Collinearity and Structural Model Assessment
These VIF scores were generated using the PLS-SEM algorithm with the weighting scheme
set to ‘Path’, maximum iteration set to ‘300’, and stop criterion set to ‘7’.
Table 16. Stage 1 Collinearity Statistics VIF
VIF
ACQU01 1.6
ACQU01 1.8
ACQU02 1.4
ACQU02 1.7
ACQU03 1.2
ACQU03 1.3
ACQU04 1.2
ACQU04 1.4
ASSM01 1.4
ASSM01 1.7
ASSM02 1.5
ASSM02 1.9
ASSM03 1.3
ASSM03 1.7
DISC1 1.3
DISC2 1.4
DISC3 1.6
DISC4 1.5
EXPL01 1.1
EXPL01 1.8
EXPL02 1.1
EXPL02 1.3
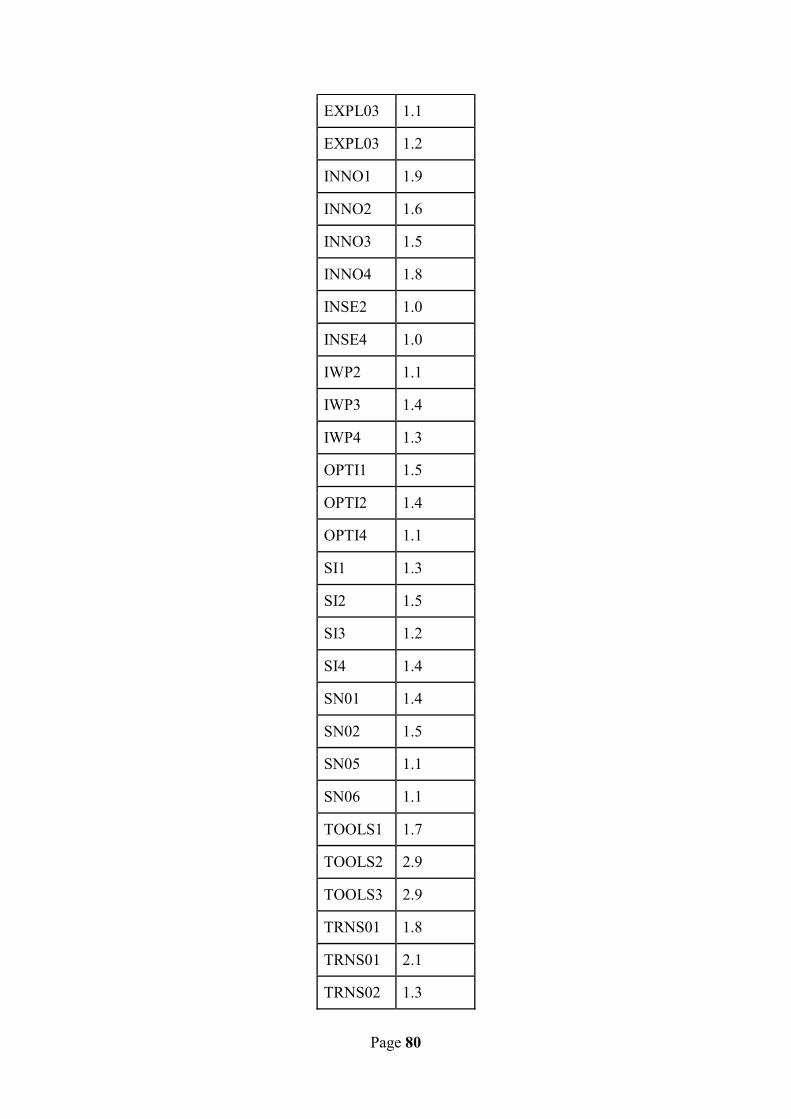
Page 80
EXPL03 1.1
EXPL03 1.2
INNO1 1.9
INNO2 1.6
INNO3 1.5
INNO4 1.8
INSE2 1.0
INSE4 1.0
IWP2 1.1
IWP3 1.4
IWP4 1.3
OPTI1 1.5
OPTI2 1.4
OPTI4 1.1
SI1 1.3
SI2 1.5
SI3 1.2
SI4 1.4
SN01 1.4
SN02 1.5
SN05 1.1
SN06 1.1
TOOLS1 1.7
TOOLS2 2.9
TOOLS3 2.9
TRNS01 1.8
TRNS01 2.1
TRNS02 1.3

Page 81
TRNS02 1.5
TRNS03 1.6
TRNS03 1.9 While collinearity issues can still exist with VIF scores below 3 (see Table 16.), these values
are below the said score. This should ensure that all formative indicators are statistically
significant and do not bias the regression results of the structural model.
5.3 Stage 2 Disjoint Approach
Stage 2 disjoint approach calculates its results using the latent variable scores from stage 1. In
stage 2, the HC measurement model is assessed as an expression of the relationship between
HOC and LOC (Becker et al. 2019). As the relationship between LOC and HOC is formative-
formative, the measurement model should assess the statistical significance of formative
indicators.
5.3.1 Measurement Model
Formative Indicators Statistical Significance
These results were generated using bootstrapping with ‘5000’ sample, with ‘complete
bootstrap’, and ‘Bias-Corrected and Accelerated (BCa) Bootstrap (default)’ to reduce
skewness.
Table 17. Disjoint Stage 2 Formative Indicator Statistical Significance
Outer Weights P-values
Outer Loadings P-values
Acquisition -> Absorptive Capacity 0.000 0.000 Continue
Assimilation -> Absorptive Capacity 0.500 0.000 Consider
Exploitation -> Absorptive Capacity 0.055 0.000 Consider
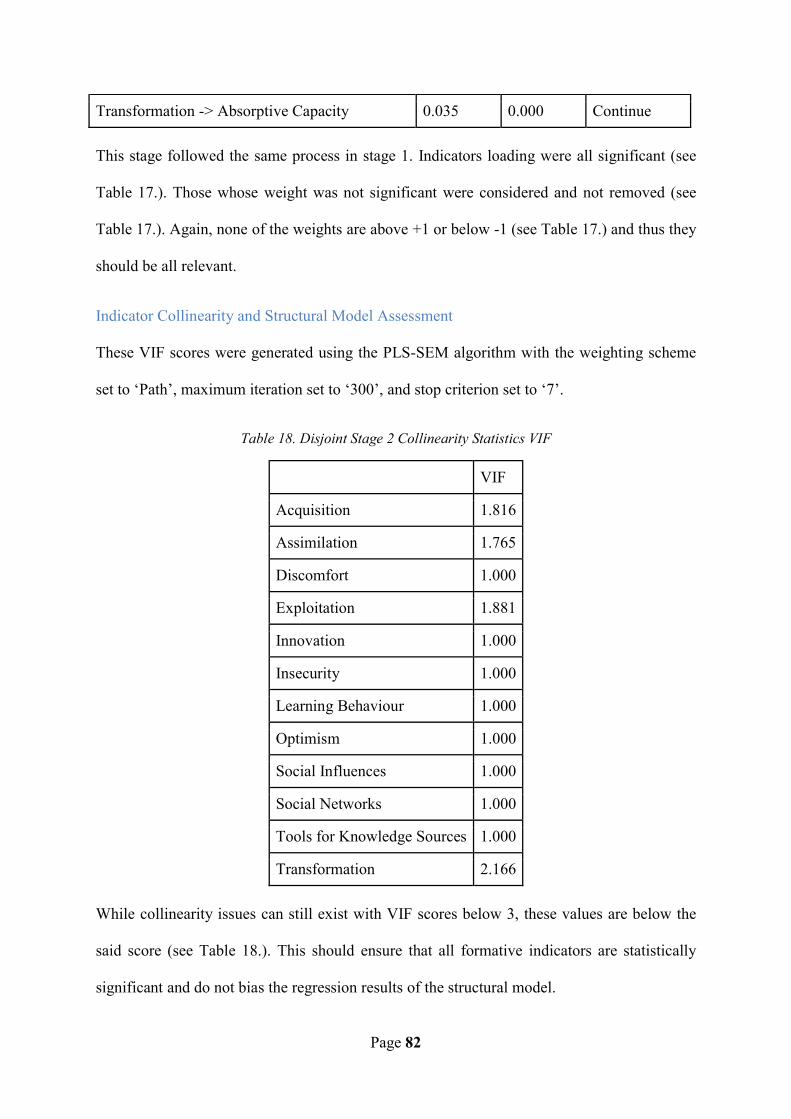
Page 82
Transformation -> Absorptive Capacity 0.035 0.000 Continue
This stage followed the same process in stage 1. Indicators loading were all significant (see
Table 17.). Those whose weight was not significant were considered and not removed (see
Table 17.). Again, none of the weights are above +1 or below -1 (see Table 17.) and thus they
should be all relevant.
Indicator Collinearity and Structural Model Assessment
These VIF scores were generated using the PLS-SEM algorithm with the weighting scheme
set to ‘Path’, maximum iteration set to ‘300’, and stop criterion set to ‘7’.
Table 18. Disjoint Stage 2 Collinearity Statistics VIF
VIF
Acquisition 1.816
Assimilation 1.765
Discomfort 1.000
Exploitation 1.881
Innovation 1.000
Insecurity 1.000
Learning Behaviour 1.000
Optimism 1.000
Social Influences 1.000
Social Networks 1.000
Tools for Knowledge Sources 1.000
Transformation 2.166 While collinearity issues can still exist with VIF scores below 3, these values are below the
said score (see Table 18.). This should ensure that all formative indicators are statistically
significant and do not bias the regression results of the structural model.

Page 83
5.3.2 Statistical Significance
The p-values of the path coefficient were generated using bootstrapping with ‘5000’ sample,
‘complete bootstrap’, and ‘Bias-Corrected and Accelerated (BCa) Bootstrap (default)’ to
reduce skewness. The path coefficient and R2 values were generated using the PLS-SEM
algorithm with the weighting scheme set to ‘Path’, maximum iteration set to ‘300’, and stop
criterion set to ‘7’.
Table 19. Path Coefficients Relevance and Statistical Significance
Hypothesis Number
Path Path Coefficient
Standard Deviation (STDEV)
T Value (T Statistics)
P-values Supported?
H1 Optimism -> Absorptive Capacity
0.174 0.085 2.044 0.041 Yes
H2 Insecurity -> Absorptive Capacity
-0.006 0.091 0.068 0.946 No
H3a Innovation -> Absorptive Capacity
0.219 0.070 3.128 0.002 Yes
H3b Innovation -> Absorptive Capacity
0.219 0.070 3.128 0.002 Yes
H4 Discomfort -> Absorptive Capacity
-0.088 0.083 1.060 0.289 No
H5 Tools for Knowledge Sources -> Absorptive Capacity
0.070 0.074 0.939 0.348 No
H6 Social Influences -> Absorptive Capacity
0.059 0.067 0.879 0.379 No

H7 Social Networks-> Absorptive Capacity
H8 Absorptive Capacity -> Learning Behaviour
Figure
The following hypotheses we
SEM determine if said hypoth
statistical significance. The st
provided as an extra measurem
Page 84
s 0.233 0.079 2.960 0.0
0.461 0.067 6.872 0.0
13. Disjoint Stage 2 Construct Effect Model
ere developed in Chapter 3. The results produ
hesis have had their null hypothesis rejected
trength of the effect is determined by the R2
ment even though it is not required.
003 Yes
000 Yes
uced from the PLS-
or not based on the
2 score. F2 value is
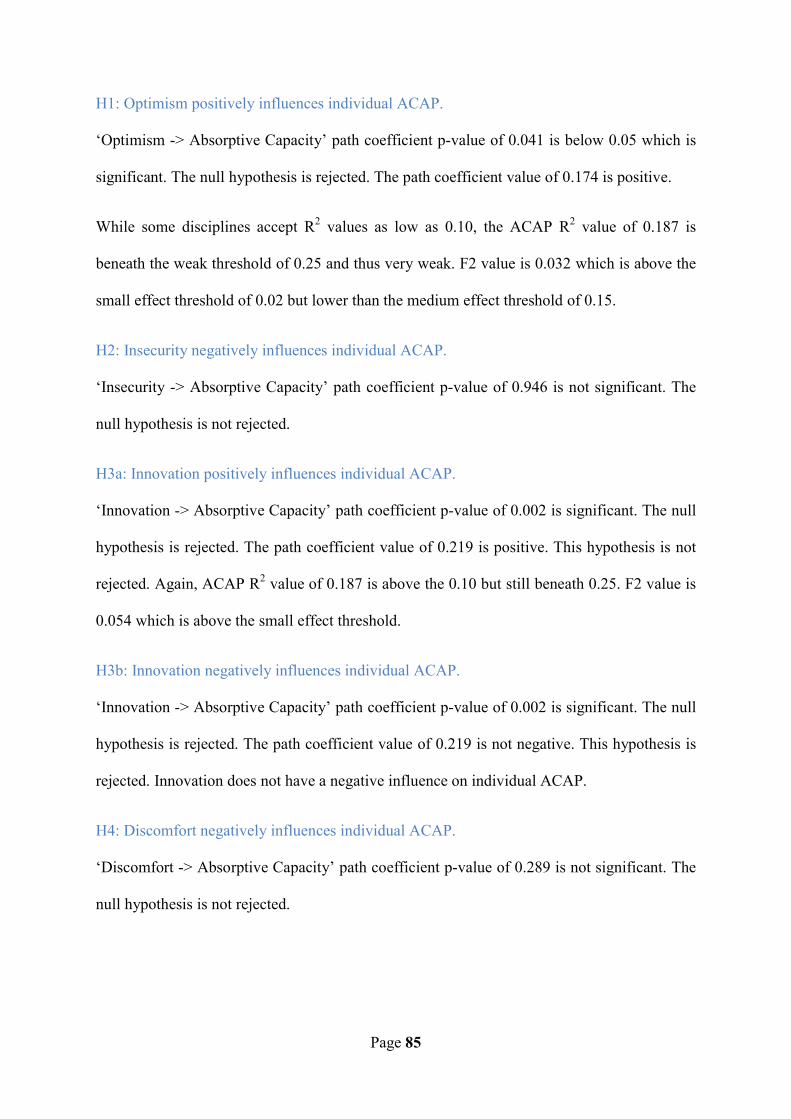
Page 85
H1: Optimism positively influences individual ACAP.
‘Optimism -> Absorptive Capacity’ path coefficient p-value of 0.041 is below 0.05 which is
significant. The null hypothesis is rejected. The path coefficient value of 0.174 is positive.
While some disciplines accept R2 values as low as 0.10, the ACAP R2 value of 0.187 is
beneath the weak threshold of 0.25 and thus very weak. F2 value is 0.032 which is above the
small effect threshold of 0.02 but lower than the medium effect threshold of 0.15.
H2: Insecurity negatively influences individual ACAP.
‘Insecurity -> Absorptive Capacity’ path coefficient p-value of 0.946 is not significant. The
null hypothesis is not rejected.
H3a: Innovation positively influences individual ACAP.
‘Innovation -> Absorptive Capacity’ path coefficient p-value of 0.002 is significant. The null
hypothesis is rejected. The path coefficient value of 0.219 is positive. This hypothesis is not
rejected. Again, ACAP R2 value of 0.187 is above the 0.10 but still beneath 0.25. F2 value is
0.054 which is above the small effect threshold.
H3b: Innovation negatively influences individual ACAP.
‘Innovation -> Absorptive Capacity’ path coefficient p-value of 0.002 is significant. The null
hypothesis is rejected. The path coefficient value of 0.219 is not negative. This hypothesis is
rejected. Innovation does not have a negative influence on individual ACAP.
H4: Discomfort negatively influences individual ACAP.
‘Discomfort -> Absorptive Capacity’ path coefficient p-value of 0.289 is not significant. The
null hypothesis is not rejected.
Page 86
H5: Tools for knowledge source influences individual ACAP.
‘Tools for Knowledge Sources -> Absorptive Capacity’ path coefficient p-value of 0.348 is
not significant. The null hypothesis is not rejected.
H6: Social Influences affect ACAP through Assimilation.
‘Social Influences -> Absorptive Capacity’ path coefficient p-value of 0.379 is not
significant. The null hypothesis is not rejected.
H7: Social Networks affect ACAP through Assimilation.
‘Social Networks -> Absorptive Capacity’ path coefficient p-value of 0.003 is significant.
The null hypothesis is rejected. The path coefficient value of 0.233 is positive. Again, the
ACAP R2 value of 0.187 is above 0.10 which is very weak. F2 value is 0.065 which is above
the small effect threshold.
H8: Individual’s ACAP affects their learning behaviour.
‘Absorptive Capacity -> Learning Behaviour’ path coefficient p-value of 0.000 is significant.
The null hypothesis is rejected. The path coefficient value of 0.461 is positive. Learning
Behaviour R2 value of 0.213 is above the very weak threshold of 0.10 and close but still
below the weak threshold of 0.25. F2 value is 0.270 which is above the small effect threshold.
Further research on the use in stage two of un-standardised latent variable scores from stage
one is required to address the use of CTA-PLS, PLSpredict or IPMA (Becker et al. 2019).
Other methods of reporting have not been used.
5.4 Chapter Summary
The demographic items gave a fair representation of participants in regard to the general
population. It also allowed filtering out records from participants that did not fit the research
context. Five records were filtered out because they were not studying any degree, masters or
Page 87
Ph.D. The TRI was also reverse engineered to determine that the average participant was a
pioneer. SmartPLS 3 was used to perform the PLS-SEM analysis. The PLS algorithm was
executed with the weighting scheme set to ‘Path’, maximum iteration set to ‘300’, and stop
criterion set to ‘7’. Bootstrapping was executed with ‘5000’ sample, with ‘complete
bootstrap’, and ‘Bias-Corrected and Accelerated (BCa) Bootstrap (default)’ to reduce
skewness. All the values that are used in the assessment of measurements model and
structural model are within acceptable results. These results follow the recommended
guidelines. The rejection of null hypotheses should be valid. Optimism, Innovation and SN
have a very weak significant effect on individual ACAP, and individual ACAP has a weak
significant effect on Learning Behaviour. Other hypotheses have been rejected.
Page 88
Chapter 6: Discussion, Implication and Conclusion
By using a quantitative approach, this study is able to provide empirical results to support its
findings. This chapter revisits the research question with the results it has produced and
makes propositions about its contributions and its limitations. It concludes this study while
leaving its audience with highlighted value that they can repurpose. It first revisits this
research’s stated aim and objective, question and hypotheses. It then follows with a
discussion about its findings. The contributions and implications both theoretical and
practical of the results are then presented. Limitations are also enumerated and explained. A
conclusion and a brief summary are provided.
6.1 Revisiting the Research’s Aim and Objectives, Research
Questions, and Hypotheses
In this section; the study’s aim and its objectives which are set in Chapter 1, the research
question and its hypotheses posited in Chapter 3; are revisited using the results from Chapter
5. The aims and objectives were introduced as early as Chapter 1.
6.1.1 Aim: Confirm that an individual's technological beliefs have an effect on
an individual's learning capabilities and their learning behaviour.
The aim of this research was to confirm that technology had an effect on individual learning
and behaviour. It did confirm that individual belief towards technology and some social
interfaces had an effect on their capability to absorb knowledge which then affected their
learning behaviour.
Page 89
6.1.2 Objective 1: Provide empirical evidence.
As findings are always within a context (Polit & Beck 2010), a different data set might
produce different results. However, the data collected along with PLS-SEM analysis allows
the results to be recalculated. The validity of PLS-SEM was argued extensively in Chapter 4.
As these results can be verified by independent reviewers, this study provides empirical
evidence to sustain its results.
6.1.3 Objective 2: Determine which factor has an effect e.g. which TR
dimension affects individual ACAP and learning behaviour.
This study has found that an individual’s technological motivators such as optimism and
innovation have a significant causal-effect on an individual's absorptive capacity. SN has a
significant causal-effect on an individual's absorptive capacity through Assimilation. The
individual’s absorptive capacity has a significant causal-effect on their learning behaviour.
Although, all these effects are very weak, this study provides some insight about which
factors have a significant effect on individual ACAP.
6.1.4 Objective 3: Provide a model to build instruments.
The model’s study can be reproduced or improved upon which can be used to develop
instruments for future researchers and pedagogues to help identify where individuals fail to
learn. This study provides a research model to measure the causal-effect of factors onto
learning and behaviour.
6.1.5 Research Question
Chapter 2 established that knowledge is important (Garavelli, Gorgoglione & Scozzi 2002;
Goh 2002; Hwang et al. 2008; Karlsen & Gottschalk 2004; Othman, Beydoun & Sugumaran
2014), and the recipient’s ACAP is among the different barriers to its transfer (Szulanski

Page 90
1996) and that individual ACAP is little researched (Lowik, Kraaijenbrink & Groen 2017;
Minbaeva, Mäkelä & Rabbiosi 2012; Yao & Chang 2017). Technology can enhance learning
(Hamilton, Rosenberg & Akcaoglu 2016) and beliefs affects behaviours (Ajzen 1991). This
raised the following question in Chapter 3.
What is the effect of an individual's technological belief and use on their capability to absorb
knowledge to their technological learning behaviour?
This question was answered using a quantitative approach (see Chapter 3). 199 records were
used as data for the statistical analysis which was performed by PLS-SEM (see Chapter 4).
The results and its validation were reported in Chapter 5.
6.1.6 Hypotheses Results
The hypotheses from Chapter 3 are revisited and explained taking into account the results
from Chapter 5.
Figure 14. Summary of Research Results
Page 91
H1: Optimism positively influences individual ACAP.
Optimism is the positive view that technology offers more control, flexibility and efficiency
in their lives (Parasuraman 2000). Optimism has a very weak significant effect on an
individual’s ACAP. See Chapter 5 for further information about the results.
H2: Insecurity does not negatively influence individual ACAP.
Insecurity is a distrust of technology, stemming from scepticism about its ability to work
properly and concerns about its potential harmful consequences (Parasuraman 2000).
However, insecurity does not have a significant effect on an individual’s ACAP. See Chapter
5 for further information about the results.
H3a: Innovation positively influences individual ACAP.
Innovation is the thought that technology has a tendency to be pioneer and leader
(Parasuraman 2000). Innovation has a very weak significant positive effect on an individual’s
ACAP. See Chapter 5 for further information about the results.
H3b: Innovation does not negatively influence individual ACAP.
Walczuch, Lemmink & Streukens (2007)discovered that innovation could also be perceived
negatively. It does not always improve performance (Vlačić et al. 2019). However the results
did satisfy that Innovation does not have a very weak significant negative effect on an
individual’s ACAP. See Chapter 5 for further information about the results.
H4: Discomfort does not negatively influence individual ACAP.
Discomfort is the perceived lack of control over technology and a feeling of being
overwhelmed by it (Parasuraman 2000). However, Discomfort does not have a significant
effect on an individual's ACAP. See Chapter 5 for further information about the results.

Page 92
H5: Tools for Knowledge Source does not influence individual ACAP.
Knowledge Sources is an antecedent to ACAP which can affect ACAP differently which can
lead to different performance (Jansen, Van Den Bosch & Volberda 2005). Organisations
invest considerably into tools for these knowledge sources (Adeyinka et al. 2010; Saarinen
1996). However, TKS does not have a significant effect on an individual’s ACAP. See
Chapter 5 for further information about the results.
H6: Social Influences do not affect ACAP through Assimilation.
When adopting systems, SI is relied on more by experienced workers and women (Venkatesh
et al. 2003). However SI does not have a significant effect on an individual's ACAP. See
Chapter 5 for further information about the results.
H7: Social Networks affect ACAP through Assimilation.
SN can improve learning, foster collaboration and enhance creativity (George & Dellasega
2011). Comprehension and understanding is shaped by group heuristic which makes
Assimilation (Zahra & George 2002). The results show that SN has a very weak significant
effect on an individual’s ACAP through Assimilation. SN can have both a positive and
negative impact on individuals’ comprehension (Gupta & Bashir 2018). See Chapter 5 for
further information about the results.
H8: Individual’s ACAP affects their learning behaviour.
Behaviour is influenced by beliefs (Ajzen 1991) as well as other factors (Ajzen 2011).
Instead of outcomes, behaviours or actions are under the control of an employee (Koopmans
et al. 2013). Individual’s ACAP has a weak significant effect on an individual’s learning
behaviour. Individual’s ACAP is a mediating effect towards learning behaviour. See Chapter
5 for further information about the results.

Page 93
These results relied on 199 data records collected via an online questionnaire. However, the
validity of this data should be addressed by the PLS-SEM analysis. The results validity relied
also on the PLS-SEM measurement and structural model assessment. Mistakes and errors are
still possible, however, in Chapter 5, a great amount of effort has been placed to ensure
validity of these results.
6.1.7 Conclusion
The aim was satisfied even though the results were not as decisive as we had hoped.
Objectives have also been satisfied although future research could further fulfil these
objectives. The rejection or not of the hypotheses used to answer the research question are
sustained by reliable results.
6.2 Discussion on Research Findings
As the results in Chapter 5 establish which hypotheses are supported, these are discussed
further in the following section and how they relate to findings from other research.
H1: Optimism positively influences individual ACAP.
Optimism has a very weak effect on individual ACAP. Although expected, this finding was
still surprising. Szulanski (1996) found that motivation was not a barrier to knowledge
transference. While Optimism in technology and motivation in knowledge transference are
not immediately perceived as directly related, there is, after reflection, a genuine question
about how Optimism and motivation are related.
H2: Insecurity does not negatively influence individual ACAP.
Insecurity was not established to have a negative influence on ACAP. This may be because
the sample population was on average pioneers. Future research could investigate a sample
Page 94
population of paranoids or laggards. While the results are disappointing, they are sustained by
the collected data and an appropriate analysis method.
H3a: Innovation positively influences individual ACAP.
Even though Innovation has a very weak effect on ACAP, the rejection of its null hypothesis
is aligned with Lowik, Kraaijenbrink & Groen (2017) findings’ that Innovation has a positive
effect on individual ACAP. Lowik, Kraaijenbrink & Groen (2017) researched if individual
ACAP affected innovation performance. This study shows that believing in technological
innovation enhances individual ACAP and learning behaviour.
H3b: Innovation does not negatively influence individual ACAP.
Innovation has a positive and not a negative influence. As this null hypothesis was not
rejected, as it aligns with what was said in the previous section.
H4: Discomfort does not negatively influence individual ACAP.
Discomfort like Insecurity was not established to have a negative influence on ACAP. Again,
this could also be because of the sample population being on average pioneers rather than
paranoid or laggard. Similar to insecurity, sampling another population may yield different
results.
H5: Tools for Knowledge Source does not influence individual ACAP.
TKS does not appear to affect individual ACAP. This was unexpected as knowledge sources
are an antecedent to ACAP, their tools could have had an effect as well. The results, however,
show that these have no effect. This suggests that there is a distinction between technology
and knowledge.
Page 95
H6: Social Influences do not affect ACAP through Assimilation.
SI have no effect on individual ACAP. This was surprising because Venkatesh et al. (2003)
suggested that SI had an effect on individuals that were either women or with experience,
however, this was when adopting technologies and not absorbing knowledge. Perhaps the
distinction between technology and knowledge is greater than expected.
H7: Social Networks affect ACAP through Assimilation.
The other finding is that SN has a significant causal-effect on individual ACAP through
Assimilation. The effect of SN is very weak. SN has an effect on an individual's
understanding. With the advent of social media and its popularity, future research could
investigate their effect on learning in more detail.
H8: Individual’s ACAP affects their learning behaviour.
An individual’s ACAP has a significant weak effect on their learning behaviour. This effect
demonstrates that absorbing knowledge has an effect on behaviour. This indicates that
individual ACAP can be a mediator to individual learning behaviour. This lends to Ajzen
(2011) statement where he suggests that beliefs are not solely responsible for behaviour. This
causal effect from individual ACAP to learning behaviour could be adapted when
investigating knowledge transfer failures or for future research.
Optimism and Innovation are technological motivators while Insecurity and Discomfort are
technological inhibitors (Parasuraman 2000). Insecurity and Discomfort appear to not have a
causal-effect on individual ACAP. The average and median participant is a pioneer as their
beliefs in motivators and inhibitors are high. Perhaps a different population sample might
yield different results. TKS and SI appear not to affect an individual's learning capability but
Social Networks appear to do so. Finally, the results showed that individual ACAP has an
effect on their learning behaviour.
Page 96
6.3 Contribution and Implications of the Results
This study and the implications of its results contribute to both theoretical fields and practical
application in the areas of learning and technology.
6.3.1 Theoretical Implications
The theoretical implication from this study shows that behaviour is not solely affected by
beliefs, that it contributes to already existing research and that its failure still has value to
offer.
Its results also add to the underlying theory of planned behaviour that says beliefs influence
behaviour (Ajzen 1991) . The very weak effect that individual technological beliefs has on
individuals does pertain to Ajzen (2011) revision of his (Ajzen 1991) theory where he states
that there are other factors than beliefs that affect people’s behaviour.
Never-the-less, this study demonstrates that individual ACAP is a mediating factor towards
individual learning behaviour. This adds to the literature about learning and performance.
Obviously further research would help understand this causal-effect in more detail.
This study adds to the literature on individual ACAP, IWP, SN and PLS-SEM. However, this
could be expected from all research. While individual ACAP has little research (Lowik,
Kraaijenbrink & Groen 2017; Minbaeva, Mäkelä & Rabbiosi 2012), this study shows that
there is a relation between individuals’ learning and behaviour. It would be of great value to
further investigate said relation from a theoretical perspective as well as a practical one. As
technology becomes more embedded into individuals’ lives, the findings that SN has an
effect on individual’s learning further ads to the increasing interest in leveraging SN to
enhance learning. PLS-SEM is gaining popularity. Even though this study may not contribute
much to the already existing pool of literature using PLS-SEM, it never-the-less does.
Page 97
While it is disappointing that other concepts such as Insecurity, Discomfort, TKS or SI were
not shown to have an effect on individual ACAP, this still contributes to research. The
absence of an effect from TKS to individual ACAP in particular does imply that perhaps in
regards to knowledge transfer the tool is not the issue but rather the knowledge source itself.
Lowik, Kraaijenbrink & Groen (2017) recommends further investigation of the effect of
antecedents on individual ACAP. Perhaps technology may not be at fault when knowledge
transfer fails. Though, further research would be required to investigate and sustain this.
6.3.2 Practical Implications
This study has practical implications with its findings on Optimism, Innovation and SN. Its
model also offers an instrument to measure learning and behaviour.
The findings show that Optimism and Innovation have a significant very weak effect. This
implies that individuals with Optimism and Innovation technological beliefs should have
slightly better ACAP. This suggests that perhaps teaching individuals to be optimistic and
innovative with technology will improve their learning capability slightly. This might only be
observable over a long period of time. Never-the-less, efforts should be dedicated to increase
individuals’ motivation in technology such as Optimism and Innovation to improve their
learning behaviour. Lowik, Kraaijenbrink & Groen (2017) makes recommendations to
improve innovation which are bisociative cognitive style and network diversity.
Learning practices should also take into account Social Networks of individuals as they have
a significant very weak causal-effect on individual ACAP through assimilation. Pedagogues
could take note of the SN their students belong to. Students should also be made aware that
expanding their social circle might help them increase their individual ACAP as network
diversity enhances individual ACAP (Lowik, Kraaijenbrink & Groen 2017).
Page 98
While Optimism, Innovation and SN may each have a very weak effect on individual ACAP,
the combination of all these factors together might have a greater effect than anticipated.
Discovering other constructs which have a positive influence on individual ACAP may help
understand learning further and help guide pedagogues further.
While this study has limitations, frameworks can still offer advantages and remain helpful
(Mishra & Koehler 2006). This study demonstrates an application for individual ACAP and
the IWP as a new method to measure individual learning to their behaviour using PLS-SEM.
Individual ACAP has a mediating effect on learning behaviour. Further investigation of the
relation between individual ACAP and IWP could further improve the practical application of
this model. This study offers practitioners a model and method to further understand how
students approach technology.
6.4 Limitations and Recommendations for Future Research
While this study did its best to provide reliable and honest results, it still has limitations.
Among these limitations, those identified so far were demographic bias; self-reporting bias;
social network as an ambiguous term; an organisation is not only the sum of its individuals;
the truth in ACAP; ACAP is a dynamic capability; the different versions of ACAP; PLS-
SEM limitations, and innovation has many meanings; insecurity, discomfort, TKS and SI;
innovation can mean many different things; the IWP limitation; and limitations from other
work this study builds upon. All these limitations are discussed further below.
6.4.1 Demographic Bias
Large population sampling in quantitative research reduces the chance of outliers (Fowler &
Lapp 2019). However this does not erase said chance but only reduces it. 141 students who
answered were studying for a Ph.D., 13 for a master’s degree, and 45 for a bachelor’s degree
as stated in Chapter 5. While this study has a visible demographic skewness, BCa
Page 99
bootstrapping should hopefully address any skewness of data (Hair, Risher & Ringle 2019).
Never-the-less, these are all university students. While university students could be assumed
to have high ACAP, the average and median participant appears to be according to the TRI a
pioneer. This could be due to the data collection method as online questionnaires use
technology which could have deterred paranoids or laggards from answering said
questionnaire. The future research with a different sample population would expand this
research. A laggard population could be sampled using data collection methods that are more
suited for laggards instead of a technological online questionnaire.
6.4.2 Self-Reporting Bias
Another potential limitation could stem from individuals themselves which is known as the
self reporting bias. As individuals emphasize merits and downplay faults, they are motivated
to self-enhance which is known as the leniency effect (van der Heijden & Nijhof 2004). This
leniency effect according to Koopmans et al. (2013) is a limitation of the IWP. While
participants have been informed that this questionnaire was voluntary and anonymous, they
could still have been prone to self-reporting bias for the IWP and other concepts like ACAP.
Again, BCa bootstrapping should mitigate data skewness (Hair, Risher & Ringle 2019).
6.4.3 Social Network is an Ambiguous Term
The other limitation that stemmed from individuals came from their own understanding. Even
though the questionnaire was tested prior to distribution, a few participants have reported that
“Social Network” was ambiguous as it could pertain to both real life and technology. This
ambiguity was deliberate to invoke both Social Networking Sites and Services in the
participants’ minds. Participants could still be confused or misunderstand other terms or
questions in the survey. However this would have been mitigated with the anonymous test
before the questionnaire was released. Also if this ambiguity was to bias the data, the
Page 100
rejection of the null hypothesis should still remain because the measurement and structural
model were assessed appropriately as demonstrated in Chapter 5.
6.4.4 An Organisation is Not Only the Sum of its Individuals
The focus of this study on individuals is also a limitation. While ACAP was initially
conceptualised from individuals’ learning cognitive ability (Cohen & Levinthal 1990), Cohen
and Levinthal (1990, p.131) state that “an organization's absorptive capacity will depend on
the absorptive capacities of its individual members” and that “a firm's absorptive capacity is
not simply the sum of the absorptive capacities of its employees”. The expectation that
individual role and organisational goals are interdependent (Pradhan & Jena 2017) is an
assumption. The research scope on individuals might not be translatable into collective or
organisational ACAP. This warrants further research.
6.4.5 The Truth in Absorptive Capacity
Another limitation of ACAP is that it does not consider truth within knowledge. Szulanski
(2000) explained that in the transformation capability, the amount of time and effort needed
to reconfigure the knowledge process was dependent on how ingrained the experience was.
While experience confers justification to belief, warrant is required for true belief to become
knowledge (Huemer 2013). For it to be knowledge it needs to be true, justified and believed
(Plato 1999). Nowhere within ACAP is the element of truth discussed. This limitation still
exists even at the individual scope. It would be very interesting to understand where and how
truth pertains in individuals’ ACAP.
6.4.6 ACAP is a Dynamic Capability
The ACAP framework is dynamic and not static (Zahra & George 2002). A dynamic
capability gains an advantage when its dimensions gain resources and competencies (Teece,
Pisano & Shuen 1997). This means that ACAP can change over time depending on factors.
Page 101
To assess said change over time a longitudinal study would be required, but alas this was
impossible as this study had limited time for its completion. It would be interesting to see
how individual ACAP changes over time and this could be investigated in future research.
6.4.7 The Different Versions of ACAP
There have been multiple iterations of said ACAP. The Cohen & Levinthal (1990) version
did not make a distinction between Transformation and Assimilation, and instead only
recognised Assimilation. This version was thought to be a bit too abstract. Todorova &
Durisin (2007) proposed a more detailed revision of ACAP. This version was a bit too rigid.
This study preferred to use Zahra & George (2002) version of the ACAP framework for its
simplicity while keeping Transformation as a separate process from Assimilation. This
version appeared to be balanced between abstract and rigid. However the difference between
versions remains a limitation.
6.4.8 PLS-SEM Limitations
BCa bootstrapping was used to mitigate any skewness in the data that this study used. This
method may have limitations. PLS-SEM certainly does with its focus on maximising partial
model structures (Hair, Ringle & Sarstedt 2011). However all statistical methods are prone to
shortfalls (Henseler et al. 2014). As limitations still exist and mistakes can happen, this study
has done its best to provide reliable and honest results.
6.4.9 Insecurity, Discomfort, TKS and SI
The results of this study were unable to establish that Insecurity, Discomfort, TKS and SI has
an effect on ACAP. The discussion did not elaborate on this as there was no contribution to
add to the default state of the null hypothesis. There is, however, still value to know that these
constructs have no effect in this research context as perhaps a different context may prove
that these do have an effect.
Page 102
6.4.10 Innovation Can Mean Many Different Things
In this study, Innovation is, using Parasuraman (2000) definition, which is that, “a tendency
to be a technology pioneer and thought leader”. However, Innovation has many other
definitions. Zaltman, Duncan & Holbek (1973) offer three definitions to innovation which are
the combination of entities or concepts that produce a unique configuration, the process of
adoption, and finally, a novel idea, practice or object has been invented irrespective if it is
adopted or not. Dewar & Dutton (1986) redefine innovation to include its adoption process.
An individual’s social environment can motivate and drive the adoption of an innovation
(Talukder 2012). It is also an idea, practice, or material artefact perceived to be new by the
relevant unit of adoption (Dewar & Dutton 1986). Innovation may appear as a fashion trend
although it originates from anti-conformity. Dewar & Dutton (1986) do make a distinction
between the two types of innovations: radical and incremental. Radical innovation can lead to
a major modification of a product or process which requires depth of knowledge provided by
technical experts (Dewar & Dutton 1986). Whereas incremental innovation does not require
as much knowledge depth as they are small improvements or adjustments (Dewar & Dutton
1986). Limaj & Bernroider (2019) defines innovations as exploratory or exploitative.
Exploratory innovation is exploring for new opportunities to make new products (Limaj &
Bernroider 2019). Exploitative innovation is merely exploiting existing capabilities to make
incremental changes to a product (Limaj & Bernroider 2019). Limaj & Bernroider (2019)
explicitly use the word ‘incremental’ to define exploitative. The difference lies with the focus
on the process rather than the outcome. Radical and incremental innovation differ by the
amount of their new technical content and knowledge (Dewar & Dutton 1986). This was not
measured in this study. Perhaps future research could investigate if there is a relation between
successful innovation adoption and the amount of knowledge absorbed required for
innovation adoption.
Page 103
6.4.11 The IWP Limitation
One limitation of the IWP is antithetical items which are items that are not opposite but
measure the same content (Dalal 2005; Koopmans et al. 2013). For example, contextual
performance and counterproductive work behaviour could potentially measure the same item
more than once (Koopmans et al. 2013). As the IWP items suffer from not measuring all
dimensions together, it also does not incorporate all individual behaviours (Koopmans et al.
2013).
6.4.12 Limitations from Other Research
Furthermore this study would inherit all the limitations of the previous research it uses to
build upon such as the TRI, ACAP, IWP and other constructs. The sparseness of empirical
research has hindered the development of the IWP (Pradhan & Jena 2017). Further research
is needed to improve the IWP (Koopmans et al. 2013; Pradhan & Jena 2017). Hopefully, this
research’s contribution to IWP will further warrant its interest.
6.4.13 Conclusion
This study did its best to provide enough evidence to warrant to its results. These results
however are not absolute. They require qualifications and have limitations. As stated before,
frameworks even though at times poor can still offer benefits and be useful (Mishra &
Koehler 2006). These results answered the research question as best as it could.
6.5 Summary
This study has demonstrated that an individual’s technological belief of Optimism and
Innovation has a very weak effect on their capability to absorb knowledge, and that SN has a
very weak effect on an individual’s understanding when absorbing knowledge, and

Page 104
furthermore that an individuals' capability to absorb knowledge has a weak effect on their
learning behaviour.
Using a quantitative approach required a large population sample. Online questionnaires
allowed data to be collected from participants over a large distance. 199 records were used
for the analysis. PLS-SEM, as a quantitative method was able to analyse large collected data
sets to provide results that can be recalculated. While this study may fall short because of its
limitations, these have been acknowledged in Chapter 6. It has done its best to be transparent
to provide validity to its results. Even if the results are weak at best, they never-the-less
answer the question that it set out to answer. Its insight tells that efforts should be directed to
an individual technological Optimism and Innovation, as an individual’s SN could influence
his or her understanding and an individual’s learning capability could lead to learning
behaviour. Its findings will hopefully be of use to other researchers, organisations,
pedagogues and the general public. The model could be adapted for future research or to
make a measuring instrument. The journey to bridge knowledge and technology is a long one,
even if one stumbles, one must persevere to progress.

Page 105
References
Adams, G.L. & Lamont, B.T. 2003, 'Knowledge management systems and developing sustainable competitive advantage', Journal of Knowledge Management, vol. 7, no. 2,pp. 142-54.
Adeyinka, T., Mutula, S.M., Athulang, M. & Angelina, T. 2010, 'An Evaluation of WebCT Course Content Management System at the University of Botswana', International Journal of E-Adoption (IJEA), vol. 2, no. 2,pp. 48-78.
Aguirre-Urreta, M.I. & Rönkkö, M. 2018, 'STATISTICAL INFERENCE WITH PLSC USING BOOTSTRAP CONFIDENCE INTERVALS', MIS Quarterly, vol. 42, no. 3,pp. 1001-20.
Ajzen, I. 1991, 'The Theory of Planned Behavior', Organizational Behavior and Human Decision Processes, vol. 50, no. 2,pp. 179-211.
Ajzen, I. 2011, 'The theory of planned behaviour: Reactions and reflections', Psychology & Health, vol. 26, no. 9,pp. 1113-27.
Babin, B.J., Hair, J.F. & Boles, J.S. 2008, 'Publishing Research in Marketing Journals Using Structural Equation Modeling', Journal of Marketing Theory and Practice, vol. 16, no. 4,pp. 279-86.
Bagozzi, R.P. & Yi, Y. 1988, 'On the evaluation of structural equation models', Journal of the Academy of Marketing Science, vol. 16, no. 1,pp. 74-94.
Becker, J.-M., Hwa, C., Ringle, C., Sarstedt, M. & Hair, J. 2019, 'How to specify, estimate, and validate higher-order constructs in PLS-SEM', Australasian Marketing Journal (AMJ).
Becker, J.-M., Klein, K. & Wetzels, M. 2012, 'Hierarchical Latent Variable Models in PLS-SEM: Guidelines for Using Reflective-Formative Type Models', Long Range Planning, vol. 45, no. 5,pp. 359-94.
Becker, J.-M., Ringle, C.M., Sarstedt, M. & Völckner, F. 2015, 'How collinearity affects mixture regression results', Marketing Letters, vol. 26, no. 4,pp. 643-59.
Beydoun, G., Kultchitsky, R. & Manasseh, G. 2007, 'Evolving semantic web with social navigation', Expert Systems with Applications, vol. 32, no. 2,pp. 265-76.
Bhatt, G.D. 2001, 'Knowledge management in organizations: examining the interaction between technologies, techniques, and people', Journal of Knowledge Management, vol. 5, no. 1,pp. 68-75.
Bloomfield, J. & Fisher, M.J. 2019, 'Quantitative research design', Journal of the Australasian Rehabilitation Nurses' Association (JARNA), vol. 22, no. 2,pp. 27-30.
Bollen, K.A. 1989, Structural Equations with Latent Variables, John Wiley & Sons, Incorporated, Somerset, UNITED STATES.
Bollen, K.A. & Long, J.S. 1993, Testing Structural Equation Models, SAGE Publications. Boyd, D.M. & Ellison, N.B. 2007, 'Social Network Sites: Definition, History, and
Scholarship', Journal of Computer-Mediated Communication, vol. 13, no. 1,pp. 210-30.
Byrne, B.M. 1998, Structural Equation Modeling with LISREL, PRELIS, and SIMPLIS: Basic Concepts, Applications, and Programming, L. Erlbaum Associates.
Cassel, C., Hackl, P. & Westlund, A.H. 1999, 'Robustness of partial least-squares method for estimating latent variable quality structures', Journal of Applied Statistics, vol. 26, no. 4,pp. 435-46.
Chan, A.Y.K., Chow, K.O. & Jia, W. 2003, 'A Framework for Evaluation of Learning Effectiveness in Online Courses', Springer Berlin Heidelberg, Berlin, Heidelberg, pp. 383-95.
Page 106
Cheah, J.-H., Ting, H., Ramayah, T., Memon, M.A., Cham, T.-H. & Ciavolino, E. 2019, 'A comparison of five reflective–formative estimation approaches: reconsideration and recommendations for tourism research', Quality & Quantity, vol. 53, no. 3,pp. 1421-58.
Coates, H., James, R. & Baldwin, G. 2005, 'A Critical Examination Of The Effects Of Learning Management Systems On University Teaching And Learning', Tertiary Education and Management, vol. 11, no. 1,pp. 19-36.
Cohen, W.M. & Levinthal, D.A. 1990, 'Absorptive Capacity: A New Perspective on Learning and Innovation', Administrative Science Quarterly, vol. 35, no. 1,pp. 128-52.
Colby, C.L. 2002, E-Techno-Ready Marketing of e-Services Customer Beliefs About Technology and the Implications for Marketing e-Services, Routledge, Armonk, UNITED STATES.
Colby, C.L. & Parasuraman, A. 2001, Techno-Ready Marketing: How and Why Customers Adopt Technology, Free Press.
Coleman, V.I. & Borman, W.C. 2000, 'Investigating the Underlying Structure of the Citizenship Performance Domain', Human Resource Management Review, vol. 10, no. 1,pp. 25-44.
Collins, T. 1990, 'The impact of microcomputer word processing on the performance of learning disabled students in a required first-year writing course', Computers and Composition, vol. 8, no. 1,pp. 49-67.
Conway, J.M. 1999, 'Distinguishing contextual performance from task performance for managerial jobs', Journal of Applied Psychology, vol. 84, no. 1,pp. 3-13.
Cronbach, L.J. & Gleser, G.C. 1965, Psychological tests and personnel decisions, U. Illinois Press, Oxford, England.
Da Silva, N. & Davis, A.R. 2011, 'Absorptive Capacity at the Individual Level: Linking Creativity to Innovation in Academia', The review of higher education, vol. 34, no. 3,pp. 355-79.
Dalal, R.S. 2005, 'A Meta-Analysis of the Relationship Between Organizational Citizenship Behavior and Counterproductive Work Behavior', Journal of Applied Psychology, vol. 90, no. 6,pp. 1241-55.
Damodaran, L. & Olphert, W. 2000, 'Barriers and facilitators to the use of knowledge management systems', Behaviour & Information Technology, vol. 19, no. 6,pp. 405-13.
Davenport, T.H. & Prusak, L. 1998, Working Knowledge: How Organizations Manage What They Know, Harvard Business School Press, Boston.
Day, S.L. & Edwards, B.J. 1996, 'Assistive Technology for Postsecondary Students with Learning Disabilities', Journal of Learning Disabilities, vol. 29, no. 5,pp. 486-92.
Dewar, R.D. & Dutton, J.E. 1986, 'The Adoption of Radical and Incremental Innovations: An Empirical Analysis', Management Science, vol. 32, no. 11,pp. 1422-33.
Diamantopoulos, A. & Winklhofer, H.M. 2001, 'Index Construction with Formative Indicators: An Alternative to Scale Development', Journal of Marketing Research, vol. 38, no. 2,pp. 269-77.
Dijkstra, T.K. & Henseler, J. 2015, 'CONSISTENT PARTIAL LEAST SQUARES PATH MODELING', MIS Quarterly, vol. 39, no. 2,pp. 297-A5.
Dolce, P., Esposito Vinzi, V. & Lauro, C. 2017, 'Predictive Path Modeling Through PLS and Other Component-Based Approaches: Methodological Issues and Performance Evaluation', in H. Latan & R. Noonan (eds), Partial Least Squares Path Modeling: Basic Concepts, Methodological Issues and Applications, Springer International Publishing, Cham, pp. 153-72.

Page 107
Dolmark, T., Sohaib, O. & Beydon, G. 2019, 'The Effect of Technology Readiness on Individual Absorptive Capacity for Knowledge Transfer', ISD 2019, ed. C.B. A. Siarheyeva, M. Lang, H. Linger, & C. Schneider, Information Systems Development: Information Systems Beyond 2020 (ISD2019 Proceedings), Toulon, France: ISEN Yncréa Méditerranée.
Ellison, N.B., Steinfield, C. & Lampe, C. 2007, 'The Benefits of Facebook “Friends:” Social Capital and College Students’ Use of Online Social Network Sites', Journal of Computer‐Mediated Communication, vol. 12, no. 4,pp. 1143-68.
Fornell, C. & Bookstein, F.L. 1982, 'Two Structural Equation Models: LISREL and PLS Applied to Consumer Exit-Voice Theory', Journal of Marketing Research, vol. 19, no. 4,pp. 440-52.
Fornell, C. & Larcker, D.F. 1981a, 'Evaluating Structural Equation Models with Unobservable Variables and Measurement Error', Journal of Marketing Research, vol. 18, no. 1,pp. 39-50.
Fornell, C. & Larcker, D.F. 1981b, 'Structural equation models with unobservable variables and measurement error: Algebra and statistics', JMR, Journal of Marketing Research (pre-1986), vol. 18, no. 000003,p. 382.
Fowler, S.B. & Lapp, V. 2019, 'Sample size in quantitative research: Sample size will affect the significance of your research', American Nurse Today, vol. 14, p. 61+.
Garavelli, A.C., Gorgoglione, M. & Scozzi, B. 2002, 'Managing knowledge transfer by knowledge technologies', Technovation, vol. 22, no. 5,pp. 269-79.
García-Morales, V.J., Ruiz-Moreno, A. & Llorens-Montes, F.J. 2007, 'Effects of Technology Absorptive Capacity and Technology Proactivity on Organizational Learning, Innovation and Performance: An Empirical Examination', Technology Analysis & Strategic Management, vol. 19, no. 4,pp. 527-58.
George, D.R. & Dellasega, C. 2011, 'Use of social media in graduate-level medical humanities education: Two pilot studies from Penn State College of Medicine', Medical Teacher, vol. 33, no. 8,pp. e429-e34.
Goh, S.C. 2002, 'Managing effective knowledge transfer: an integrative framework and some practice implications', Journal of Knowledge Management, vol. 6, no. 1,pp. 23-30.
Gupta, S. & Bashir, L. 2018, 'SOCIAL NETWORKING USAGE QUESTIONNAIRE: DEVELOPMENT AND VALIDATION IN AN INDIAN HIGHER EDUCATION CONTEXT', Turkish Online Journal of Distance Education (TOJDE), vol. 19, no. 4,pp. 214-27.
Hair, J.F. 2017, A primer on partial least squares structural equation modeling (PLS-SEM), Second edition. edn, Sage, Thousand Oaks, California.
Hair, J.F., Ringle, C.M. & Sarstedt, M. 2011, 'PLS-SEM: Indeed a Silver Bullet', Journal of Marketing Theory and Practice, vol. 19, no. 2,pp. 139-52.
Hair, J.F., Risher, J.J.S., Marko & Ringle, C.M. 2019, 'When to use and how to report the results of PLS-SEM', European Business Review, vol. 31, no. 1,pp. 2-24.
Hair, J.F., Sarstedt, M., Pieper, T.M. & Ringle, C.M. 2012, 'The Use of Partial Least Squares Structural Equation Modeling in Strategic Management Research: A Review of Past Practices and Recommendations for Future Applications', Long Range Planning, vol. 45, no. 5,pp. 320-40.
Hair, J.F., Sarstedt, M., Ringle, C.M. & Mena, J.A. 2012, 'An assessment of the use of partial least squares structural equation modeling in marketing research', Journal of the Academy of Marketing Science, vol. 40, no. 3,pp. 414-33.
Hair Joseph, F., Sarstedt, M. & Ringle, C.M. 2019, 'Rethinking some of the rethinking of partial least squares', European Journal of Marketing, vol. 53, no. 4,pp. 566-84.

Page 108
Hair Jr., J.F., Hult, G.T.M., Ringle, C.M. & Sarstedt, M. 2014, A Primer on Partial Least Squares Structural Equation Modeling (PLS-SEM), SAGE Publications.
Hair Jr., J.F., Sarstedt, M., Hopkins, L. & Kuppelwieser, V.G. 2014, 'Partial least squares structural equation modeling (PLS-SEM): An emerging tool in business research', European Business Review (Bingley), vol. 26, no. 2,pp. 106-21.
Hallikainen, H. & Laukkanen, T. 2016, 'How technology readiness explains acceptance and satisfaction of digital services in B2b healthcare sector?', PACIS, p. 294.
Hamilton, E.R., Rosenberg, J.M. & Akcaoglu, M. 2016, 'The Substitution Augmentation Modification Redefinition (SAMR) Model: a Critical Review and Suggestions for its Use', TechTrends, vol. 60, no. 5,pp. 433-41.
Haseman, W.D., Nazareth, D.L. & Paul, S. 2005, 'Implementation of a group decision support system utilizing collective memory', Information & Management, vol. 42, no. 4,pp. 591-605.
Haythornthwaite, C. 2005, 'Social networks and Internet connectivity effects', Information, Communication & Society, vol. 8, no. 2,pp. 125-47.
Henseler, J., Dijkstra, T.K., Sarstedt, M., Ringle, C.M., Diamantopoulos, A., Straub, D.W., Ketchen, D.J., Hair, J.F., Hult, G.T.M. & Calantone, R.J. 2014, 'Common Beliefs and Reality About PLS:Comments on Rönkkö and Evermann (2013)', Organizational Research Methods, vol. 17, no. 2,pp. 182-209.
Henseler, J., Ringle, C.M. & Sarstedt, M. 2015, 'A new criterion for assessing discriminant validity in variance-based structural equation modeling', Journal of the Academy of Marketing Science, vol. 43, no. 1,pp. 115-35.
Huemer, M. 2013, 'Epistemological asymmetries between belief and experience', Philosophical Studies, vol. 162, no. 3,pp. 741-8.
Hunt, S.T. 1996, 'GENERIC WORK BEHAVIOR: AN INVESTIGATION INTO THE DIMENSIONS OF ENTRY‐LEVEL, HOURLY JOB PERFORMANCE', Personnel Psychology, vol. 49, no. 1,pp. 51-83.
Hwang, H.-G., Chang, I.C., Chen, F.-J. & Wu, S.-Y. 2008, 'Investigation of the application of KMS for diseases classifications: A study in a Taiwanese hospital', Expert Systems with Applications, vol. 34, no. 1,pp. 725-33.
Iyengar, K., Sweeney, J.R. & Montealegre, R. 2015, 'Information Technology Use as a Learning Mechanism: The Impact of IT Use on Knowledge Transfer Effectiveness, Absorptive Capacity, and Franchisee Performance', Mis Quarterly, vol. 39, no. 3,pp. 615-41.
Jacobs, M.J. & Buys, A.J. 2010, 'Evaluating the Military's Technology Absorptive Capacity', PICMET 2010 Technology Management For Global Economic Growth, Phuket, pp. 1-6.
Jansen, J.J.P., Van Den Bosch, F.A.J. & Volberda, H.W. 2005, 'Managing Potential and Realized Absorptive Capacity: How Do Organizational Antecedents Matter?', The Academy of Management Journal, vol. 48, no. 6,pp. 999-1015.
Johnson, R.E., Rosen, C.C. & Chang, C.-H. 2011, 'To Aggregate or Not to Aggregate: Steps for Developing and Validating Higher-Order Multidimensional Constructs', Journal of Business and Psychology, vol. 26, no. 3,pp. 241-8.
Kamel Boulos, M.N. & Wheeler, S. 2007, 'The emerging Web 2.0 social software: an enabling suite of sociable technologies in health and health care education', Health Information And Libraries Journal, vol. 24, no. 1,pp. 2-23.
Karlsen, J.T. & Gottschalk, P. 2004, 'Factors affecting knowledge transfer in IT projects', Engineering Management Journal, vol. 16, no. 1,pp. 3-10.

Page 109
Kelman, H.C. 1958, 'COMPLIANCE, IDENTIFICATION, AND INTERNALIZATION: THREE PROCESSES OF ATTITUDE CHANGE', Journal of Conflict Resolution, vol. 2, no. 1,pp. 51-60.
Kock, N. & Hadaya, P. 2018, 'Minimum sample size estimation in PLS‐SEM: The inverse square root and gamma‐exponential methods', Information Systems Journal, vol. 28, no. 1,pp. 227-61.
Koehler, M.J., Mishra, P., Kereluik, K., Shin, T.S. & Graham, C.R. 2014, 'The Technological Pedagogical Content Knowledge Framework', Handbook of research on educational communications and technology, Springer, pp. 101-11.
Koopmans, L., Bernaards, C., Hildebrandt, V., Buuren, S.v., van der Beek, A.J. & de Vet, H.C.W. 2013, 'Development of an individual work performance questionnaire', International Journal of Productivity and Performance Management, vol. 62, no. 1,pp. 6-28.
Koopmans, L., Bernaards, C.M., Hildebrandt, V.H., Schaufeli, W., de Vet, H.C.W. & van der Beek, A.J. 2011, 'Conceptual frameworks of individual work performance – A systematic review', Journal of Occupational and Environmental Medicine, vol. 53, no. 8,pp. 846-66.
Kumar, V. & Bradford, J. 2017, 'An investigation into the development of the absorptive capacity of manufacturing SMEs AU - Saad, Mohammed', International Journal of Production Research, vol. 55, no. 23,pp. 6916-31.
Kuo, R.Z. & Lee, G.G. 2009, 'KMS adoption: the effects of information quality', Management Decision, vol. 47, no. 10,pp. 1633-51.
Kuss, D.J. & Griffiths, M.D. 2011, 'Online Social Networking and Addiction-A Review of the Psychological Literature', International Journal of Environmental Research and Public Health, vol. 8, no. 9,pp. 3528-52.
Lee, J.-K. & Lee, W.-K. 2008, 'The relationship of e-Learner’s self-regulatory efficacy and perception of e-Learning environmental quality', Computers in Human Behavior, vol. 24, no. 1,pp. 32-47.
Lee, L., Petter, S., Fayard, D. & Robinson, S. 2011, 'On the use of partial least squares path modeling in accounting research', International Journal of Accounting Information Systems, vol. 12, no. 4,pp. 305-28.
Leung, L. 2002, 'Loneliness, self-disclosure, and ICQ ("I seek you") use', Cyberpsychology & Behavior: The Impact Of The Internet, Multimedia And Virtual Reality On Behavior And Society, vol. 5, no. 3,pp. 241-51.
Limaj, E. & Bernroider, E.W.N. 2019, 'The roles of absorptive capacity and cultural balance for exploratory and exploitative innovation in SMEs', Journal of Business Research, vol. 94, pp. 137-53.
Lin, C.-H., Shih, H.-Y. & Sher, P.J. 2007, 'Integrating Technology Readiness into Technology Acceptance: The TRAM Model', Psychology & Marketing, vol. 24, no. 7,pp. 641-57.
Lin, C., Chang, S. & Chang, C.-S. 2004, 'The impact of technology absorptive capacity on technology transfer performance', International journal of technology transfer and commercialisation, vol. 3, no. 4,pp. 384-409.
Lin, T.-C. & Huang, C.-C. 2008, 'Understanding knowledge management system usage antecedents: An integration of social cognitive theory and task technology fit', Information & Management, vol. 45, no. 6,pp. 410-7.
Lopez-Cruz, O. & Garnica, N.J. 2018, 'Engineering Organizational Absorptive Capacity for Effective Knowledge Transfer', International Conference on Software Process Improvement, Springer International Publishing, Cham, pp. 186-97.
Page 110
Lowik, S., Kraaijenbrink, J. & Groen, A.J. 2017, 'Antecedents and effects of individual absorptive capacity: a micro-foundational perspective on open innovation', Journal of Knowledge Management, vol. 21, no. 6,pp. 1319-41.
Lust, G., Juarez Collazo, N.A., Elen, J. & Clarebout, G. 2012, 'Content Management Systems: Enriched learning opportunities for all?', Computers in Human Behavior, vol. 28, no. 3,pp. 795-808.
Marcoulides, G.A. & Chin, W.W. 2013, 'You Write, but Others Read: Common Methodological Misunderstandings in PLS and Related Methods', New Perspectives in Partial Least Squares and Related Methods, eds H. Abdi, W.W. Chin, V. Esposito Vinzi, G. Russolillo & L. Trinchera, Springer New York, New York, NY, pp. 31-64.
Mason, C.H.P., William D. Jr. 1991, 'Collinearity, Power, and Interpretation of Multiple Regressi', JMR, Journal of Marketing Research, vol. 28, no. 3,p. 268.
Minbaeva, D.B., Mäkelä, K. & Rabbiosi, L. 2012, 'Linking HRM and knowledge transfer via individual-level mechanisms', Human Resource Management, vol. 51, no. 3,pp. 387-405.
Mishra, P. & Koehler, M.J. 2006, 'Technological pedagogical content knowledge: A framework for teacher knowledge', Teachers College Record, vol. 108, no. 6,p. 1017.
Monecke, A. & Leisch, F. 2012, 'semPLS: Structural Equation Modeling Using Partial Least Squares', Journal of Statistical Software, vol. 48, no. 3,p. 32.
Morahan-Martin, J. & Schumacher, P. 2003, 'Loneliness and social uses of the Internet', Computers in Human Behavior, vol. 19, no. 6,pp. 659-71.
Muhammad, A., Zhou, Q., Beydoun, G., Xu, D. & Shen, J. 2016, 'Learning path adaptation in online learning systems', 2016 IEEE 20th International Conference on Computer Supported Cooperative Work in Design (CSCWD), pp. 421-6.
Othman, S.H., Beydoun, G. & Sugumaran, V. 2014, 'Development and validation of a Disaster Management Metamodel (DMM)', Information Processing & Management, vol. 50, no. 2,pp. 235-71.
Ozkan, S., Koseler, R. & Baykal, N. 2009, 'Evaluating learning management systems: Adoption of hexagonal e-learning assessment model in higher education', Transforming Government: People, Process and Policy, vol. 3, no. 2,pp. 111-30.
Parasuraman, A. 2000, 'Technology readiness index (TRI): A multiple-item scale to measure readiness to embrace new technologies', Journal of Service Research, vol. 2, no. 4,pp. 307-20.
Parasuraman, A. & Colby, C.L. 2015, 'An Updated and Streamlined Technology Readiness Index: TRI 2.0', Journal of Service Research, vol. 18, no. 1,pp. 59-74.
Pempek, T.A., Yermolayeva, Y.A. & Calvert, S.L. 2009, 'College students' social networking experiences on Facebook', Journal of Applied Developmental Psychology, vol. 30, no. 3,pp. 227-38.
Peng, D.X. & Lai, F. 2012, 'Using partial least squares in operations management research: A practical guideline and summary of past research', Journal of Operations Management, vol. 30, no. 6,pp. 467-80.
Pfeffer, J. & Salancik, G.R. 1979, 'The External Control of Organizations. A Resource Dependence', The Economic Journal, vol. 89, no. 356,pp. 969-70.
Plato 1999, Theaetetus, Project Gutenberg. Polanyi, M. 1962, Personal Knowledge: Towards a Post-critical Philosophy, Routledge &
Kegan Paul, London. Polanyi, M. 1967, The Tacit Dimension, Peter Smith, Gloucester. Polit, D.F. & Beck, C.T. 2010, 'Generalization in quantitative and qualitative research: Myths
and strategies', International Journal of Nursing Studies, vol. 47, no. 11,pp. 1451-8.

Page 111
Pradhan, R.K. & Jena, L.K. 2017, 'Employee Performance at Workplace: Conceptual Model and Empirical Validation', Business Perspectives and Research, vol. 5, no. 1,pp. 69-85.
Prusak, L. 1997, Knowledge in Organizations, Butterworth-Heinemann, Boston. Raithel, S., Sarstedt, M., Scharf, S. & Schwaiger, M. 2012, 'On the value relevance of
customer satisfaction. Multiple drivers and multiple markets', Journal of the Academy of Marketing Science, vol. 40, no. 4,pp. 509-25.
Raskind, M. 1993, 'Assistive technology and adults with learning disabilities: A blueprint for exploration and advancement', Learning Disability Quarterly, vol. 16, no. 3,pp. 185-96.
Raskind, M.H. & Scott, N.G. 1993, 'Technology for Postsecondary Students with Learning Disabilities', in S.A. Vogel & P.B. Adelman (eds), Success for college students with learning disabilities, Springer, New York, pp. 240-79.
Reinartz, W., Haenlein, M. & Henseler, J. 2009, 'An empirical comparison of the efficacy of covariance-based and variance-based SEM', International Journal of Research in Marketing, vol. 26, no. 4,pp. 332-44.
Rigdon, E.E. 2012, 'Rethinking Partial Least Squares Path Modeling: In Praise of Simple Methods', Long Range Planning, vol. 45, no. 5,pp. 341-58.
Ringle, C.M., Sarstedt, M. & Straub, D.W. 2012, 'A Critical Look at the Use of PLS-SEM in MIS Quarterly', MIS Quarterly, vol. 36, no. 1,pp. iiv-8.
Rogers, E.M. 2003, Diffusion of innovations, Free Press. Rosenberg, J.M. & Koehler, M.J. 2018, 'Context and Teaching with Technology in the
Digital Age', in I.R. Management Association (ed.), Teacher Training and Professional Development: Concepts, Methodologies, Tools, and Applications, IGI Global, Hershey, PA, pp. 440-65.
Rotundo, M. & Sackett, P.R. 2002, 'The relative importance of task, citizenship, and counterproductive performance to global ratings of job performance: A policy-capturing approach', Journal of Applied Psychology, vol. 87, no. 1,pp. 66-80.
Saarinen, T. 1996, 'An expanded instrument for evaluating information system success', Information & Management, vol. 31, no. 2,pp. 103-18.
Sadin, S.R., Povinelli, F.P. & Rosen, R. 1989, 'The NASA technology push towards future space mission systems', Acta Astronautica, vol. 20, pp. 73-7.
Sarstedt, M., Hair, J.F., Ringle, C.M., Thiele, K.O. & Gudergan, S.P. 2016, 'Estimation issues with PLS and CBSEM: Where the bias lies!', Journal of Business Research, vol. 69, no. 10,pp. 3998-4010.
Sarstedt, M., Ringle, C.M., Cheah, J.-H., Ting, H., Moisescu, O.I. & Radomir, L. 2019, 'Structural model robustness checks in PLS-SEM', Tourism Economics, p. 1354816618823921.
Shmueli, G. 2010, 'To Explain or to Predict?', Statistical Science, vol. 25, no. 3,pp. 289-310. Shmueli, G. & Koppius, O.R. 2011, 'Predictive Analytics in Information Systems Research',
MIS Quarterly, vol. 35, no. 3,pp. 553-72. Shmueli, G., Ray, S., Velasquez Estrada, J.M. & Chatla, S.B. 2016, 'The elephant in the
room: Predictive performance of PLS models', Journal of Business Research, vol. 69, no. 10,pp. 4552-64.
Sosik, J.J., Kahai, S.S. & Piovoso, M.J. 2009, 'Silver Bullet or Voodoo Statistics?:A Primer for Using the Partial Least Squares Data Analytic Technique in Group and Organization Research', Group & Organization Management, vol. 34, no. 1,pp. 5-36.
Subrahmanyam, K., Reich, S.M., Waechter, N. & Espinoza, G. 2008, 'Online and offline social networks: Use of social networking sites by emerging adults', Journal of Applied Developmental Psychology, vol. 29, no. 6,pp. 420-33.
Page 112
Szulanski, G. 1996, 'Exploring Internal Stickiness: Impediments To The Transfer Of Best Practice Within The Firm', Strategic Management Journal, vol. 17, no. S2,pp. 27-43.
Szulanski, G. 2000, 'The Process of Knowledge Transfer: A Diachronic Analysis of Stickiness', Organizational Behavior and Human Decision Processes, vol. 82, no. 1,pp. 9-27.
Talukder, M. 2012, 'Factors affecting the adoption of technological innovation by individual employees: An Australian study', Procedia - Social and Behavioral Sciences, vol. 40, pp. 52-7.
Tang, F., Xi, Y. & Ma, J. 2006, 'Estimating the effect of organizational structure on knowledge transfer: A neural network approach', Expert Systems with Applications, vol. 30, no. 4,pp. 796-800.
Teddlie, C. & Tashakkori, A. 2009, Foundations of Mixed Methods Research: Integrating Quantitative and Qualitative Approaches in the Social and Behavioral Sciences, SAGE Publications.
Teece, D.J., Pisano, G. & Shuen, A. 1997, 'Dynamic Capabilities and Strategic Management', Strategic Management Journal, vol. 18, no. 7,pp. 509-33.
Todorova, G. & Durisin, B. 2007, 'Absorptive Capacity: Valuing a Reconceptualization', The Academy of Management Review, vol. 32, no. 3,pp. 774-86.
Tsikriktsis, N. 2004, 'A Technology Readiness-Based Taxonomy of Customers: A Replication and Extension', Journal of Service Research, vol. 7, no. 1,pp. 42-52.
Uygur, U. 2013, 'Determinants of causal ambiguity and difficulty of knowledge transfer within the firm', Journal of Management and Organization, vol. 19, no. 6,pp. 742-55.
van der Heijden, B.I.J.M. & Nijhof, A.H.J. 2004, 'The value of subjectivity: problems and prospects for 360-degree appraisal systems', The International Journal of Human Resource Management, vol. 15, no. 3,pp. 493-511.
Vance, D. & Eynon, J. 1998, 'On the Requirements of Knowledge Transfer Using Information Systems: A Schema Whereby Such Transfer Is Enhanced', AMCIS 1998 Proceedings 212, Baltimore, pp. 632-4.
Venkatesh, V., Morris, M.G., Davis, G.B. & Davis, F.D. 2003, 'User Acceptance of Information Technology: Toward a Unified View', MIS Quarterly, vol. 27, no. 3,pp. 425-78.
Vlačić, E., Dabić, M., Daim, T. & Vlajčić, D. 2019, 'Exploring the impact of the level of absorptive capacity in technology development firms', Technological Forecasting and Social Change, vol. 138, pp. 166-77.
Voorhees, C.M., Brady, M.K., Calantone, R. & Ramirez, E. 2016, 'Discriminant validity testing in marketing: an analysis, causes for concern, and proposed remedies', Journal of the Academy of Marketing Science, vol. 44, p. 119+.
Walczuch, R., Lemmink, J. & Streukens, S. 2007, 'The effect of service employees’ technology readiness on technology acceptance', Information & Management, vol. 44, no. 2,pp. 206-15.
Wang, Y.-S., Wang, H.-Y. & Shee, D.Y. 2007, 'Measuring e-learning systems success in an organizational context: Scale development and validation', Computers in Human Behavior, vol. 23, no. 4,pp. 1792-808.
Watson, R. 2015, 'Quantitative research', Nursing standard (Royal College of Nursing (Great Britain) : 1987), vol. 29, pp. 44-8.
Westland, J.C. 2015, 'Partial Least Squares Path Analysis', in J.C. Westland (ed.), Structural Equation Models: From Paths to Networks, Springer International Publishing, Cham, pp. 23-46.
Wold, H. 1974, 'Causal flows with latent variables: Partings of the ways in the light of NIPALS modelling', European Economic Review, vol. 5, no. 1,pp. 67-86.
Page 113
Wold, H. 1980, 'Model Construction and Evaluation When Theoretical Knowledge Is Scarce'pp. 47-74.
Wright, K.B. 2017, 'Researching Internet-Based Populations: Advantages and Disadvantages of Online Survey Research, Online Questionnaire Authoring Software Packages, and Web Survey Services', Journal of Computer-Mediated Communication, vol. 10, no. 3.
Wright, S. 1921, Correlation and Causation. Yao, F.K. & Chang, S. 2017, 'Do Individual Employees' Learning Goal Orientation and Civic
Virtue Matter? A Micro-Foundations Perspective on Firm Absorptive Capacity', Strategic Management Journal, vol. 38, no. 10,pp. 2041-60.
Zahra, S.A. & George, G. 2002, 'Absorptive Capacity: A Review, Reconceptualization, and Extension', The Academy of Management Review, vol. 27, no. 2,pp. 185-203.
Zaltman, G., Duncan, R. & Holbek, J. 1973, Innovations & Organizations, R.E. Krieger Publishing Company.
Zou, B., Guo, F. & Guo, J. 2016, 'Absorptive capacity, technological innovation, and product life cycle: a system dynamics model', SpringerPlus, vol. 5, no. 1,p. 1662.
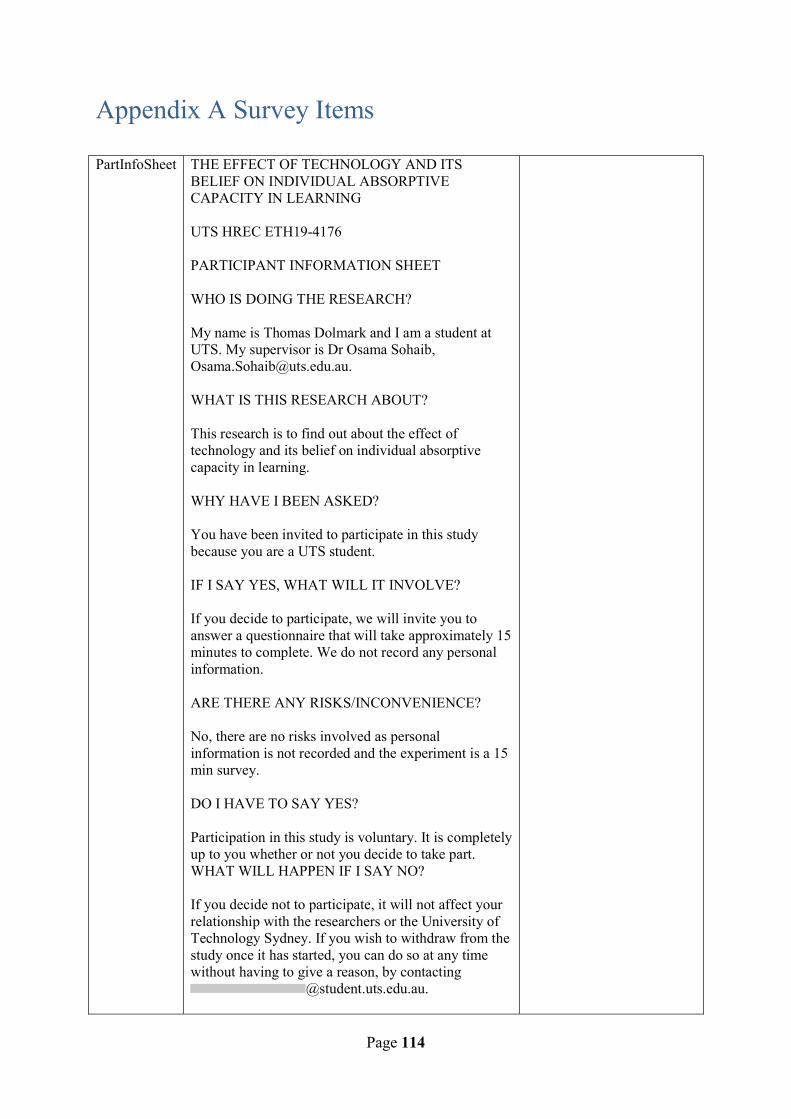
Page 114
Appendix A Survey Items
PartInfoSheet THE EFFECT OF TECHNOLOGY AND ITS BELIEF ON INDIVIDUAL ABSORPTIVE CAPACITY IN LEARNING UTS HREC ETH19-4176 PARTICIPANT INFORMATION SHEET WHO IS DOING THE RESEARCH? My name is Thomas Dolmark and I am a student at UTS. My supervisor is Dr Osama Sohaib, [email protected]. WHAT IS THIS RESEARCH ABOUT? This research is to find out about the effect of technology and its belief on individual absorptive capacity in learning. WHY HAVE I BEEN ASKED? You have been invited to participate in this study because you are a UTS student. IF I SAY YES, WHAT WILL IT INVOLVE? If you decide to participate, we will invite you to answer a questionnaire that will take approximately 15 minutes to complete. We do not record any personal information. ARE THERE ANY RISKS/INCONVENIENCE? No, there are no risks involved as personal information is not recorded and the experiment is a 15 min survey. DO I HAVE TO SAY YES? Participation in this study is voluntary. It is completely up to you whether or not you decide to take part. WHAT WILL HAPPEN IF I SAY NO? If you decide not to participate, it will not affect your relationship with the researchers or the University of Technology Sydney. If you wish to withdraw from the study once it has started, you can do so at any time without having to give a reason, by contacting
@student.uts.edu.au.
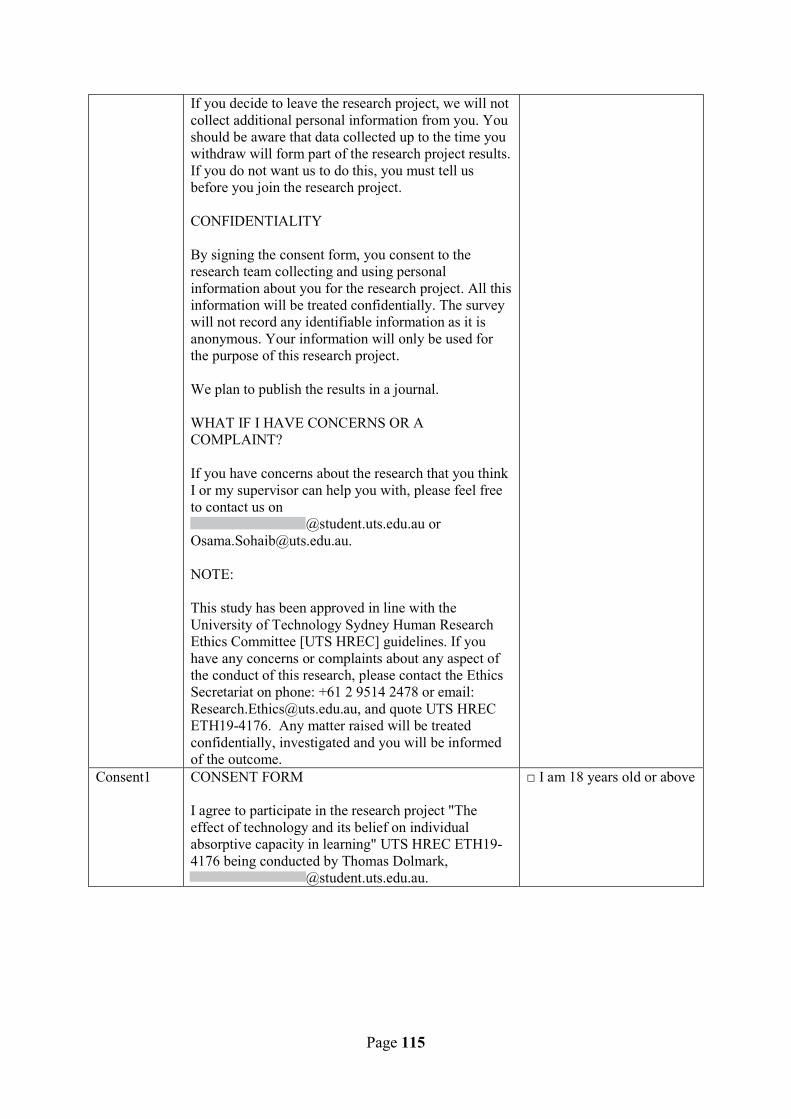
Page 115
If you decide to leave the research project, we will not collect additional personal information from you. You should be aware that data collected up to the time you withdraw will form part of the research project results. If you do not want us to do this, you must tell us before you join the research project. CONFIDENTIALITY By signing the consent form, you consent to the research team collecting and using personal information about you for the research project. All this information will be treated confidentially. The survey will not record any identifiable information as it is anonymous. Your information will only be used for the purpose of this research project. We plan to publish the results in a journal. WHAT IF I HAVE CONCERNS OR A COMPLAINT? If you have concerns about the research that you think I or my supervisor can help you with, please feel free to contact us on
@student.uts.edu.au or [email protected]. NOTE: This study has been approved in line with the University of Technology Sydney Human Research Ethics Committee [UTS HREC] guidelines. If you have any concerns or complaints about any aspect of the conduct of this research, please contact the Ethics Secretariat on phone: +61 2 9514 2478 or email: [email protected], and quote UTS HREC ETH19-4176. Any matter raised will be treated confidentially, investigated and you will be informed of the outcome.
Consent1 CONSENT FORM I agree to participate in the research project "The effect of technology and its belief on individual absorptive capacity in learning" UTS HREC ETH19-4176 being conducted by Thomas Dolmark,
@student.uts.edu.au.
□ I am 18 years old or above
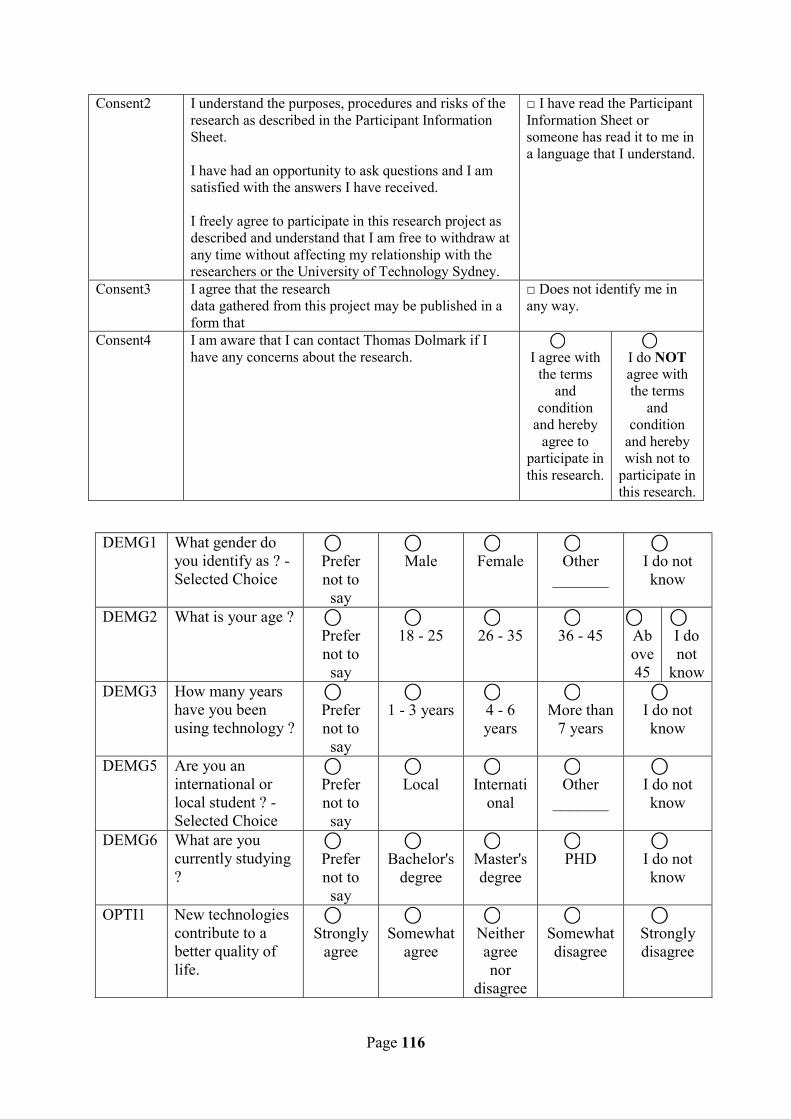
Page 116
Consent2 I understand the purposes, procedures and risks of the research as described in the Participant Information Sheet. I have had an opportunity to ask questions and I am satisfied with the answers I have received. I freely agree to participate in this research project as described and understand that I am free to withdraw at any time without affecting my relationship with the researchers or the University of Technology Sydney.
□ I have read the Participant Information Sheet or someone has read it to me in a language that I understand.
Consent3 I agree that the research data gathered from this project may be published in a form that
□ Does not identify me in any way.
Consent4 I am aware that I can contact Thomas Dolmark if I have any concerns about the research. I agree with
the terms and
condition and hereby
agree to participate in this research.
I do NOT agree with the terms
and condition
and hereby wish not to
participate in this research.
DEMG1 What gender do you identify as ? - Selected Choice
Prefer not to say
Male
Female
Other
_______
I do not know
DEMG2 What is your age ? Prefer not to say
18 - 25
26 - 35
36 - 45
Above 45
I do not
know DEMG3 How many years
have you been using technology ?
Prefer not to say
1 - 3 years
4 - 6 years
More than
7 years
I do not know
DEMG5 Are you an international or local student ? - Selected Choice
Prefer not to say
Local
Internati
onal
Other
_______
I do not know
DEMG6 What are you currently studying ?
Prefer not to say
Bachelor's
degree
Master's degree
PHD
I do not know
OPTI1 New technologies contribute to a better quality of life.
Strongly
agree
Somewhat
agree
Neither agree nor
disagree
Somewhat disagree
Strongly disagree
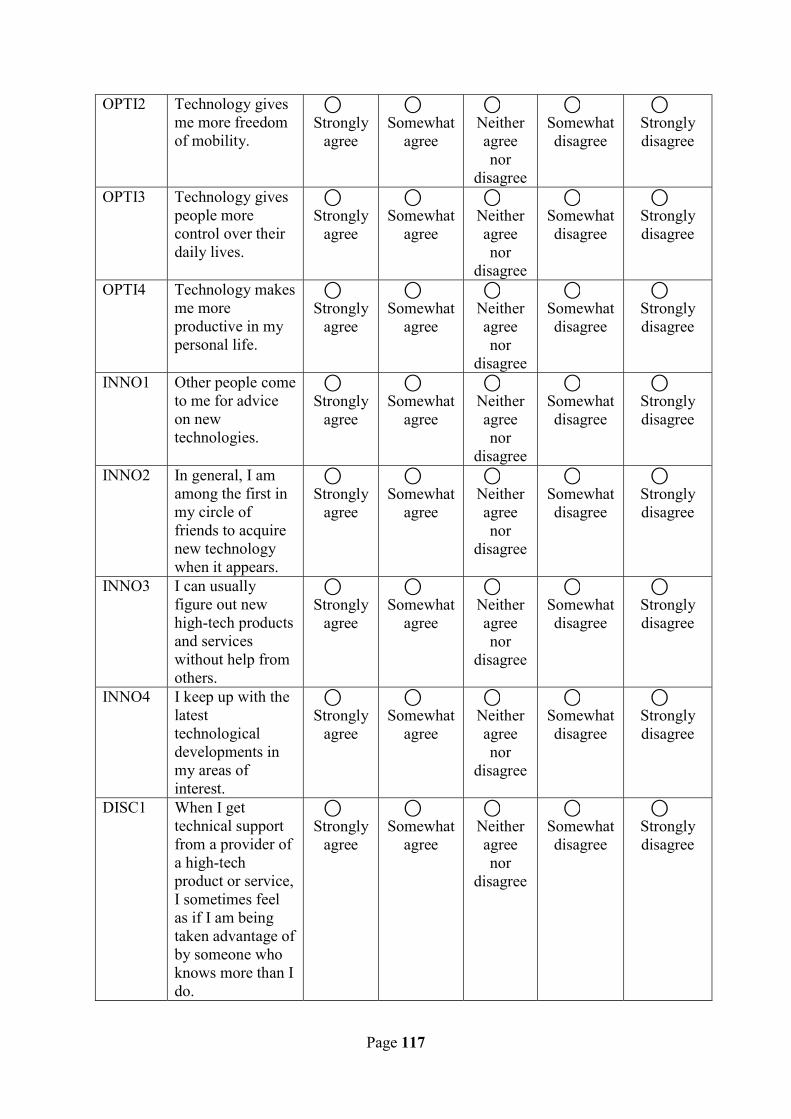
Page 117
OPTI2 Technology gives me more freedom of mobility.
Strongly
agree
Somewhat
agree
Neither agree nor
disagree
Somewhat disagree
Strongly disagree
OPTI3 Technology gives people more control over their daily lives.
Strongly
agree
Somewhat
agree
Neither agree nor
disagree
Somewhat disagree
Strongly disagree
OPTI4 Technology makes me more productive in my personal life.
Strongly
agree
Somewhat
agree
Neither agree nor
disagree
Somewhat disagree
Strongly disagree
INNO1 Other people come to me for advice on new technologies.
Strongly
agree
Somewhat
agree
Neither agree nor
disagree
Somewhat disagree
Strongly disagree
INNO2 In general, I am among the first in my circle of friends to acquire new technology when it appears.
Strongly
agree
Somewhat
agree
Neither agree nor
disagree
Somewhat disagree
Strongly disagree
INNO3 I can usually figure out new high-tech products and services without help from others.
Strongly
agree
Somewhat
agree
Neither agree nor
disagree
Somewhat disagree
Strongly disagree
INNO4 I keep up with the latest technological developments in my areas of interest.
Strongly
agree
Somewhat
agree
Neither agree nor
disagree
Somewhat disagree
Strongly disagree
DISC1 When I get technical support from a provider of a high-tech product or service, I sometimes feel as if I am being taken advantage of by someone who knows more than I do.
Strongly
agree
Somewhat
agree
Neither agree nor
disagree
Somewhat disagree
Strongly disagree
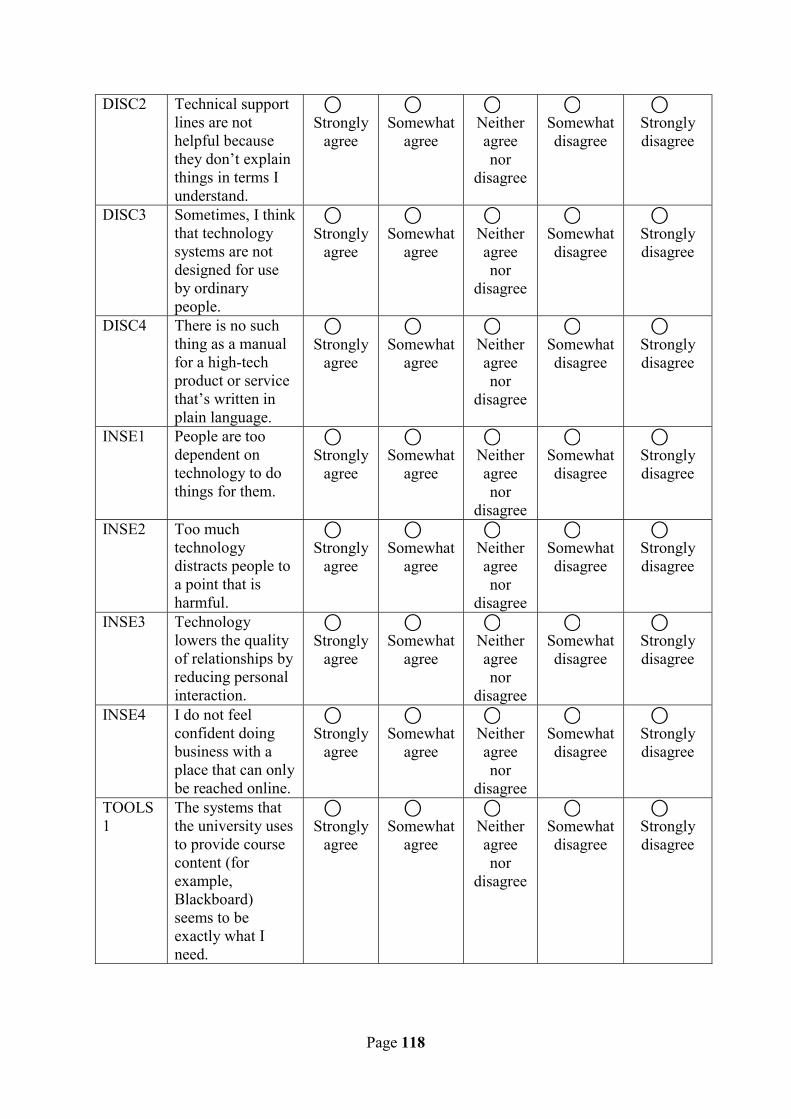
Page 118
DISC2 Technical support lines are not helpful because they don’t explain things in terms I understand.
Strongly
agree
Somewhat
agree
Neither agree nor
disagree
Somewhat disagree
Strongly disagree
DISC3 Sometimes, I think that technology systems are not designed for use by ordinary people.
Strongly
agree
Somewhat
agree
Neither agree nor
disagree
Somewhat disagree
Strongly disagree
DISC4 There is no such thing as a manual for a high-tech product or service that’s written in plain language.
Strongly
agree
Somewhat
agree
Neither agree nor
disagree
Somewhat disagree
Strongly disagree
INSE1 People are too dependent on technology to do things for them.
Strongly
agree
Somewhat
agree
Neither agree nor
disagree
Somewhat disagree
Strongly disagree
INSE2 Too much technology distracts people to a point that is harmful.
Strongly
agree
Somewhat
agree
Neither agree nor
disagree
Somewhat disagree
Strongly disagree
INSE3 Technology lowers the quality of relationships by reducing personal interaction.
Strongly
agree
Somewhat
agree
Neither agree nor
disagree
Somewhat disagree
Strongly disagree
INSE4 I do not feel confident doing business with a place that can only be reached online.
Strongly
agree
Somewhat
agree
Neither agree nor
disagree
Somewhat disagree
Strongly disagree
TOOLS1
The systems that the university uses to provide course content (for example, Blackboard) seems to be exactly what I need.
Strongly
agree
Somewhat
agree
Neither agree nor
disagree
Somewhat disagree
Strongly disagree
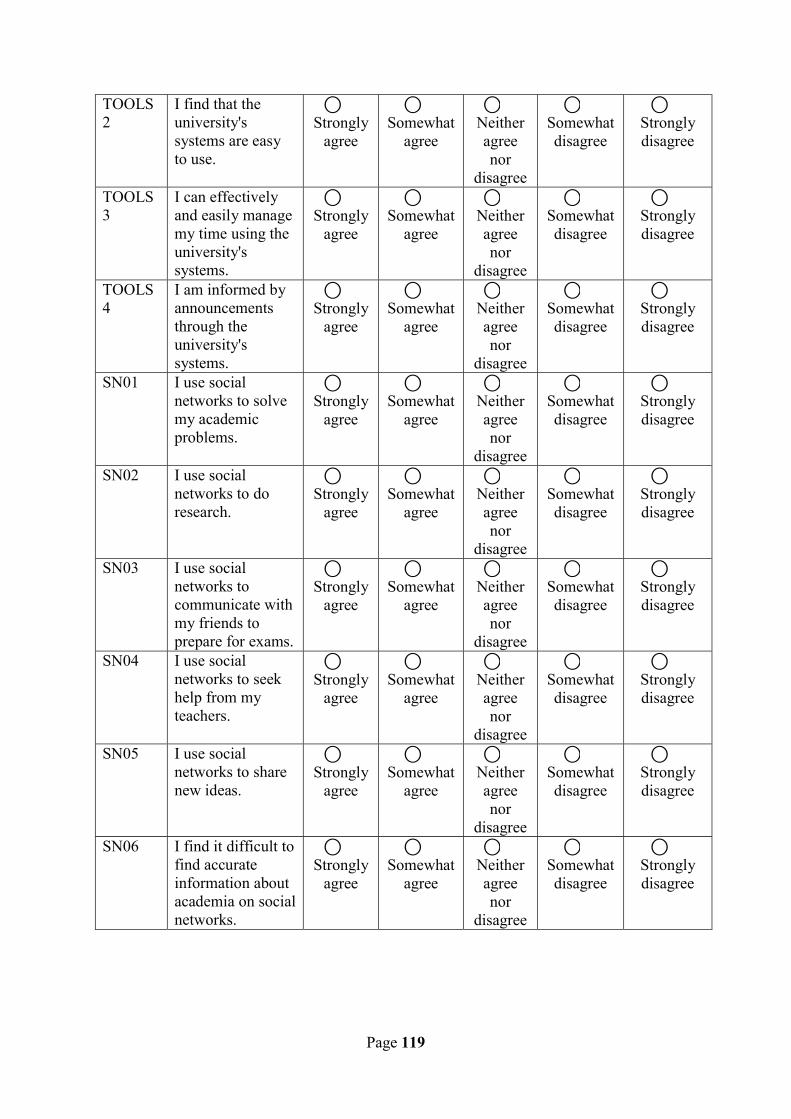
Page 119
TOOLS2
I find that the university's systems are easy to use.
Strongly
agree
Somewhat
agree
Neither agree nor
disagree
Somewhat disagree
Strongly disagree
TOOLS3
I can effectively and easily manage my time using the university's systems.
Strongly
agree
Somewhat
agree
Neither agree nor
disagree
Somewhat disagree
Strongly disagree
TOOLS4
I am informed by announcements through the university's systems.
Strongly
agree
Somewhat
agree
Neither agree nor
disagree
Somewhat disagree
Strongly disagree
SN01 I use social networks to solve my academic problems.
Strongly
agree
Somewhat
agree
Neither agree nor
disagree
Somewhat disagree
Strongly disagree
SN02 I use social networks to do research.
Strongly
agree
Somewhat
agree
Neither agree nor
disagree
Somewhat disagree
Strongly disagree
SN03 I use social networks to communicate with my friends to prepare for exams.
Strongly
agree
Somewhat
agree
Neither agree nor
disagree
Somewhat disagree
Strongly disagree
SN04 I use social networks to seek help from my teachers.
Strongly
agree
Somewhat
agree
Neither agree nor
disagree
Somewhat disagree
Strongly disagree
SN05 I use social networks to share new ideas.
Strongly
agree
Somewhat
agree
Neither agree nor
disagree
Somewhat disagree
Strongly disagree
SN06 I find it difficult to find accurate information about academia on social networks.
Strongly
agree
Somewhat
agree
Neither agree nor
disagree
Somewhat disagree
Strongly disagree
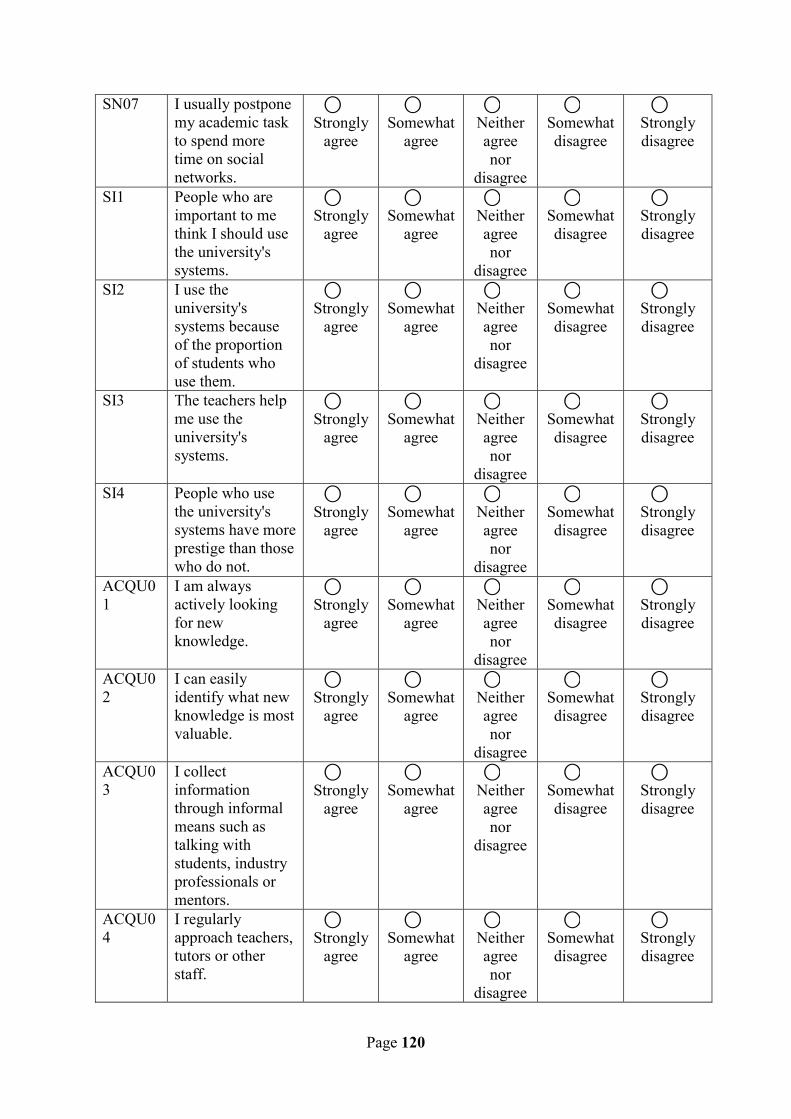
Page 120
SN07 I usually postpone my academic task to spend more time on social networks.
Strongly
agree
Somewhat
agree
Neither agree nor
disagree
Somewhat disagree
Strongly disagree
SI1 People who are important to me think I should use the university's systems.
Strongly
agree
Somewhat
agree
Neither agree nor
disagree
Somewhat disagree
Strongly disagree
SI2 I use the university's systems because of the proportion of students who use them.
Strongly
agree
Somewhat
agree
Neither agree nor
disagree
Somewhat disagree
Strongly disagree
SI3 The teachers help me use the university's systems.
Strongly
agree
Somewhat
agree
Neither agree nor
disagree
Somewhat disagree
Strongly disagree
SI4 People who use the university's systems have more prestige than those who do not.
Strongly
agree
Somewhat
agree
Neither agree nor
disagree
Somewhat disagree
Strongly disagree
ACQU01
I am always actively looking for new knowledge.
Strongly
agree
Somewhat
agree
Neither agree nor
disagree
Somewhat disagree
Strongly disagree
ACQU02
I can easily identify what new knowledge is most valuable.
Strongly
agree
Somewhat
agree
Neither agree nor
disagree
Somewhat disagree
Strongly disagree
ACQU03
I collect information through informal means such as talking with students, industry professionals or mentors.
Strongly
agree
Somewhat
agree
Neither agree nor
disagree
Somewhat disagree
Strongly disagree
ACQU04
I regularly approach teachers, tutors or other staff.
Strongly
agree
Somewhat
agree
Neither agree nor
disagree
Somewhat disagree
Strongly disagree
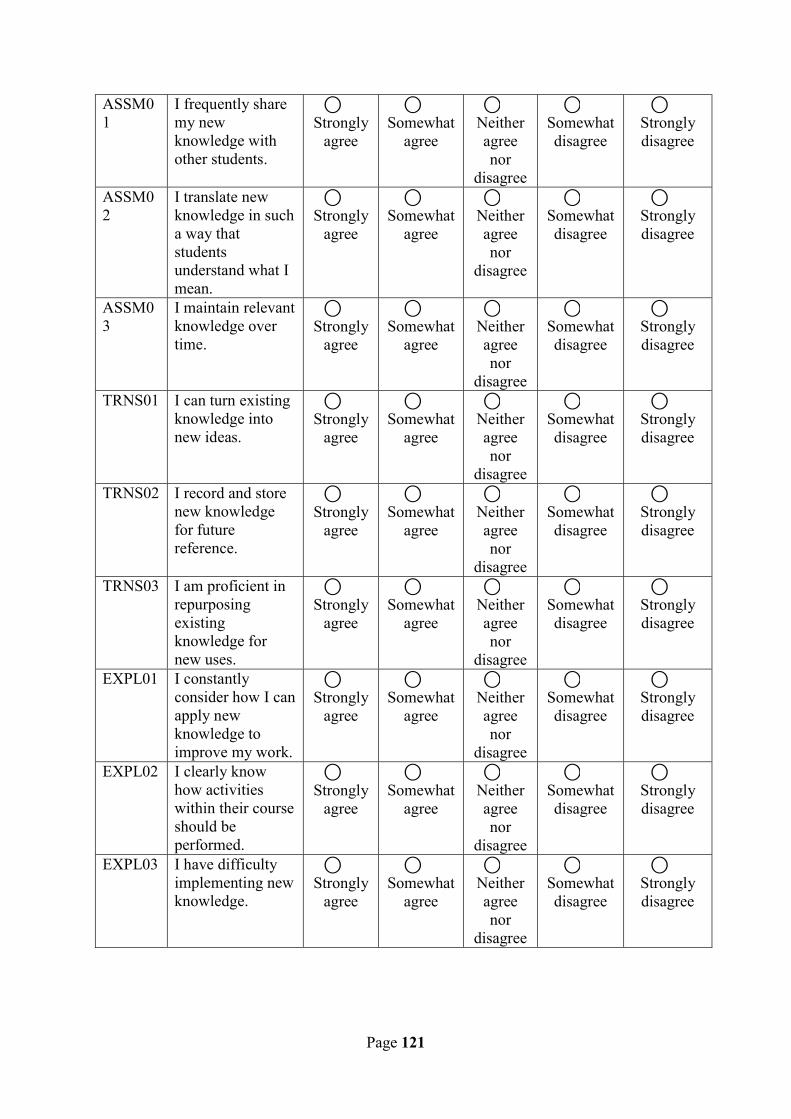
Page 121
ASSM01
I frequently share my new knowledge with other students.
Strongly
agree
Somewhat
agree
Neither agree nor
disagree
Somewhat disagree
Strongly disagree
ASSM02
I translate new knowledge in such a way that students understand what I mean.
Strongly
agree
Somewhat
agree
Neither agree nor
disagree
Somewhat disagree
Strongly disagree
ASSM03
I maintain relevant knowledge over time.
Strongly
agree
Somewhat
agree
Neither agree nor
disagree
Somewhat disagree
Strongly disagree
TRNS01 I can turn existing knowledge into new ideas.
Strongly
agree
Somewhat
agree
Neither agree nor
disagree
Somewhat disagree
Strongly disagree
TRNS02 I record and store new knowledge for future reference.
Strongly
agree
Somewhat
agree
Neither agree nor
disagree
Somewhat disagree
Strongly disagree
TRNS03 I am proficient in repurposing existing knowledge for new uses.
Strongly
agree
Somewhat
agree
Neither agree nor
disagree
Somewhat disagree
Strongly disagree
EXPL01 I constantly consider how I can apply new knowledge to improve my work.
Strongly
agree
Somewhat
agree
Neither agree nor
disagree
Somewhat disagree
Strongly disagree
EXPL02 I clearly know how activities within their course should be performed.
Strongly
agree
Somewhat
agree
Neither agree nor
disagree
Somewhat disagree
Strongly disagree
EXPL03 I have difficulty implementing new knowledge.
Strongly
agree
Somewhat
agree
Neither agree nor
disagree
Somewhat disagree
Strongly disagree
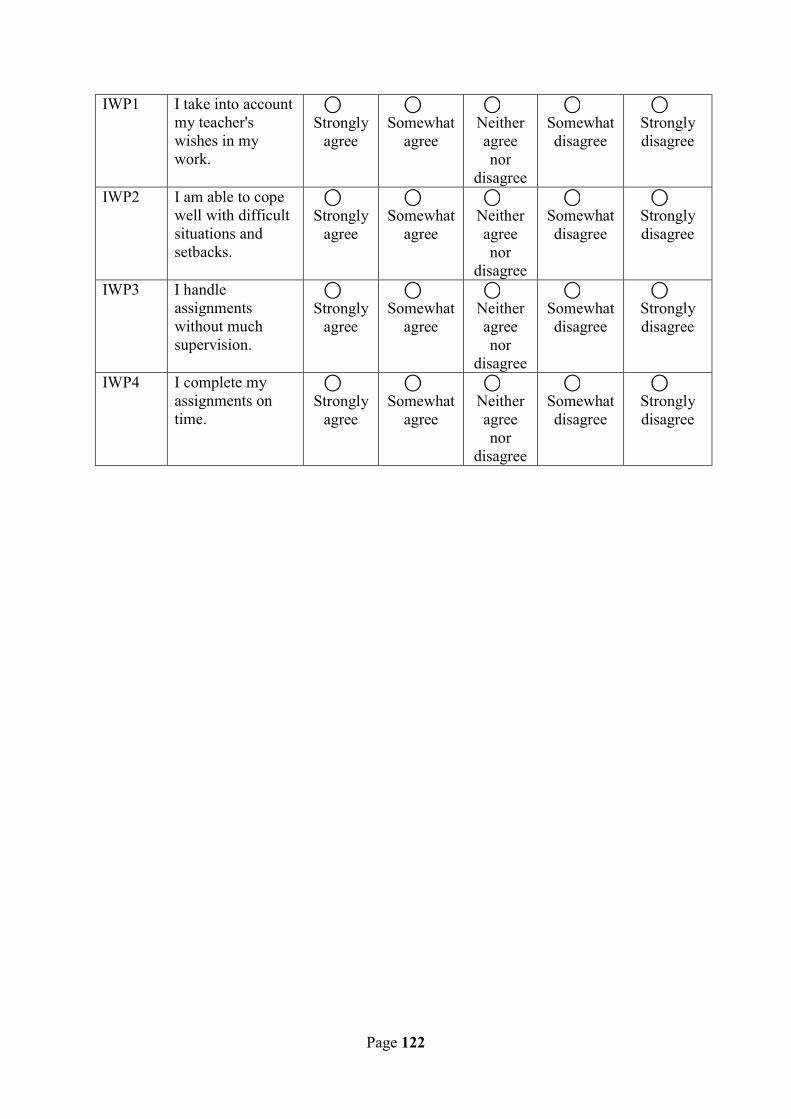
Page 122
IWP1 I take into account my teacher's wishes in my work.
Strongly
agree
Somewhat
agree
Neither agree nor
disagree
Somewhat disagree
Strongly disagree
IWP2 I am able to cope well with difficult situations and setbacks.
Strongly
agree
Somewhat
agree
Neither agree nor
disagree
Somewhat disagree
Strongly disagree
IWP3 I handle assignments without much supervision.
Strongly
agree
Somewhat
agree
Neither agree nor
disagree
Somewhat disagree
Strongly disagree
IWP4 I complete my assignments on time.
Strongly
agree
Somewhat
agree
Neither agree nor
disagree
Somewhat disagree
Strongly disagree