the effect of intercalants on the host liposome
TRANSCRIPT

1
IntroductionHypericin (Hy) and vitamin E (VitE; see Figure 1) have each been long known for their therapeutic properties. The former is a natural pigment found in abundance in wild flowers of the Hypericum perforatum L. or St. John’s wort genus (Brockman et al., 1939; Giese, 1980) and has been widely investigated as a pigment for photodynamic action. In this regard, it has been used as an anticancer (Carpenter and Kraus, 1991; Hudson et al., 1993; Lenard et al., 1993; Kremer et al., 1977; Couldwell et al., 1994; Anker et al., 1995; Zhang et al., 1997), antiviral, and anti-retroviral (Meruelo et al., 1988; Lavie et al., 1989; Meruelo et al., 1992; Diwu, 1995; Lavie et al., 1995; Andersen et al., 1991; Schinazi et al., 1990), including anti-HIV human immunodeficiency virus (Kraus et al., 1996; Degar et al., 1992; Hudson et al., 1991) agent. Its mechanism of action involves initial incorporation into the membrane of the tumor’s cell; subsequent irradiation by visible light initi-ates the photodynamic process. Interestingly, the sodium
salt of hypericin (NaHy) has come into use as a result of its improved solubility.
Vitamin E (or α-tocopherol), a well-known natural antioxidant (Burton et al., 1983; Burton and Ingold, 1981), is found within the bilayer of membranes and protects lipids from oxidative damage (Sharma and Beutner, 1993; VERIS, 1993, 1994; Sebrel and Harris, 1972; Brigelius-Flohe and Davies, 2007; Traber and Atkinson, 2007; Azzi, 2007). It functions as a radical chain-breaking antioxidant through hydrogen atom transfer. The result-ing phenoxy radical is recycled by other reducing agents, notably vitamin C (Perly et al., 1985). The use of the syn-thetic vitamin E acetate (VitEAc) has proliferated because of its greater shelf-life and oxidative stability.
Because of our ongoing interest in active oxygen species, we turned to explore the chemistry of both Hy and VitE within liposomes (Gennis, 1989; Cooper and Hausman, 1997; Munro, 2003; Israelachvili et al., 1976; Israelachvili et al., 1977, 1980), which serve as
RESEARCH ARTICLE
The effect of intercalants on the host liposome
Yael Cohen1, Hana Weitman2, Michal Afri1, Rinat Yanus1, Safra Rudnick1, Yeshayahu Talmon3, Judith Schmidt3, Pinchas Aped1, Smadar Shatz2, Benjamin Ehrenberg2, and Aryeh A. Frimer1,4
1Department of Chemistry, 2Department of Physics, Bar-Ilan University, Ramat Gan, Israel, 3Department of Chemical Engineering, Technion-Israel Institute of Technology, Haifa, Israel, and 4Ethel and David Resnick Chair in Active Oxygen Chemistry, Bar-Ilan University, Ramat Gan, Israel
AbstractWhen phospholipids are vigorously dispersed in water, liposomes are formed. In the present study, we have explored the effect of intercalant concentration on various properties of unilamellar liposomes. Liposomes were sonically intercalated with vitamin E acetate (VitEAc) and hypericin (Hy) until no difference in light transmission was observed, which reflects the formation of liposomes of minimal diameter. Our studies indicate that the intercalant structure and concentration have an influence on the liposome diameter, which could be directly measured by cryogenic transmittance electronic microscopy. Thus, intercalated VitEAc substantially decreased the diameter of unilamellar dimyristoylphosphatidylcholine liposomes, whereas Hy did not. In addition, we followed peak intensities in the absorbance and fluorescence spectra of Hy as a function of intercalant concentration in the liposomal solution. Initially, the fluorescence intensity increased linearly with concentration; however, the curve then arched asymptotically, followed by a decrease in fluorescence at yet higher concentrations. Because the Hy monomer is the only species that emits fluorescence, we believe that the decrease of fluorescence intensity is the result of Hy aggregation.Keywords: cryo-TEM, fluorescence, NMR, vitamin E acetate, hypericin
Address for Correspondence: Aryeh A. Frimer, Department of Chemistry, Bar-Ilan University, Ramat Gan 52900, Israel; Fax: 972-3-7384053; E-mail: [email protected]
(Received 02 February 2012; revised 02 May 2012; accepted 21 May 2012)
Journal of Liposome Research, 2012; Early Online: 1–13© 2012 Informa Healthcare USA, Inc.ISSN 0898-2104 print/ISSN 1532-2394 onlineDOI: 10.3109/08982104.2012.698419
Journal of Liposome Research
00
00
1
13
02February2012
02May2012
21May2012
0898-2104
1532-2394
© 2012 Informa Healthcare USA, Inc.
10.3109/08982104.2012.698419
2012
The effect of intercalants on the host liposome
Y. Cohen et al.
Jour
nal o
f L
ipos
ome
Res
earc
h D
ownl
oade
d fr
om in
form
ahea
lthca
re.c
om b
y B
ar-I
lan
Uni
vers
ity o
n 07
/16/
12Fo
r pe
rson
al u
se o
nly.

2 Y. Cohen et al.
Journal of Liposome Research
excellent models for the complex biomembrane systems. Although Hy, NaHy, VitE, and VitEAc do not form micelles or bilayers in water alone, these hydrophobic compounds are readily dispersed in the presence of the phospholipid, dimyristoylphosphatidylcholine (DMPC), and become well intercalated within the bilayer of the resulting liposomes. Using a novel nuclear magnetic resonance (NMR) technique, we have previously described the qualitative determination of the depth of NaHy and VitEAc within DMPC liposomes (Weitman et al. 2001a, Afri et al., 2004). This NMR approach is based on the excellent correlation existing between the 13C-NMR chemical shift (δ) of a polarizable carbon for example, the carbonyl (C=O) or nitronyl (C=N-) carbon, and Dimroth’s and Reichardt’s (Dimroth et al., 1963; Reichardt, 1965, 1990, 1994) E
T(30) polarity parameter
of the solvent in which the spectrum was obtained (Maciel and Ruben, 1963; Maciel and Natterstad, 1965; Ueji and Makamaura, 1976; Menger et al., 1978; Menger, 1979; Menger et al., 1988; Janzen, et al., 1989). We note, however, that because of the relative lack of sensitivity of the NMR method, intercalant concentrations within the lipid bilayer need to be approximately 17 mole%—substantially higher than the 2–5 mole% of intercalant commonly used in liposome studies (Afri et al., 2002). Nevertheless, using cryo-TEM (cryogenic transmittance electronic microscopy) (Nilsson et al., 2000; Walter et al., 1991; Bernheim-Groswasser et al., 2000), Afri et al. have
shown that, despite the high intercalant concentrations, liposomes are indeed generated (Afri et al., 2002).
Several articles have appeared concerning the effect of increased intercalant concentration on the chemical and physical properties of liposomes (Tulenko et al., 1988; Kumar, 1991). However, little attention has been focused (Perillo and Garcia, 2001; Handa, 2001) on the effect of the identity, concentration, and location of an intercalant within the lipid bilayer on the size, curvature, and shape of liposomes. To this end, we returned, once again, to NaHy and VitEAc to examine the effect of their intercala-tion into DMPC liposomes in this regard.
MethodsGeneralReactions were carried out at room temperature, unless otherwise indicated. Absorption spectra were measured by a PerkinElmer Lambda 9 UV/Vis/NIR PC-controlled spectrophotometer. Fluorescence emission and excita-tion spectra and fluorescence time-dependent mea-surements were performed on a digital PC-controlled fluorimeter (model LS-50B; PerkinElmer, Norwalk, Connecticut, USA). To maintain a linear dependence of the fluorescence intensity on concentration, we made sure that the samples had an optical density <0.05 at the excitation wavelength. Fluorescence spectral analy-sis was performed using MATLAB 6.1 software (The
Figure 1. Hy, NaHy, VitE, and VitEAc.
Jour
nal o
f L
ipos
ome
Res
earc
h D
ownl
oade
d fr
om in
form
ahea
lthca
re.c
om b
y B
ar-I
lan
Uni
vers
ity o
n 07
/16/
12Fo
r pe
rson
al u
se o
nly.

The effect of intercalants on the host liposome 3
© 2012 Informa Healthcare USA, Inc.
MathWorks, Inc., Natick, Massachusetts, USA), using singular value decomposition (SVD) and constrained linear and nonlinear least squares optimization functions (Weitman et al., 2001). Origin software (OriginLab Corp., Northampton, Massachusetts, USA) was utilized in the workup of the spectral data. Other standard equipment, including a centrifuge (Sorvall type M; Ivan Sorvall, Inc., Norwalk, Connecticut, USA), a vortex mixer (Winn Vortex Genie), and a sonicator (Soniprep 150, Titanium Probe Ultrasonic Disintegrator, model MK2, at a 20 KHz out-put frequency; Sanyo-MSE, Crawley, UK), were utilized. Average liposome particles size and size distribution were determined by measuring the diameters of more than 50 particles on light micrographs, with the image analysis software, AnalySIS Auto (Soft Imaging System GmbH, Münster, Germany). Molecular modeling calculations for the minimum energy orientation were carried out with either PCMODEL (version 7.50.00; Serena Software, Bloomington, Indiana, USA), Gaussian 98 (Revision A.7), or Gaussian 03 (Revision B.04; Frisch et al., 2003).
Glassware preparation and chemicalsDoubly purified water (dpH
2O) was ultrapurified
by passing it through Millipore Milli-Q columns (Millipore, Billirica, Massachusetts, USA). Vials and glassware were first rinsed with concentrated HCl (to remove all traces of detergents) and then washed with dpH
2O. Dimyristoylphosphatidylcholine (DMPC) and
(+)-α-tocopherol acetate (VitEAc) were purchased from Sigma-Aldrich (St. Louis, Missouri, USA). NaHy was kindly supplied by the late Professor Yehuda Mazur and Dr. Dalia Freeman (Mazur et al., 1992; Freeman et al., 1994). dpH
2O, KH
2PO
4, and KOH were used in the prepa-
ration of a 0.1-M phosphate buffer solution (pH 7.8 and containing 10–4 M of ethylene diamine tetraacetic acid); the buffer solution was utilized, in turn, to prepare all aqueous solutions, unless otherwise specified. For the experiments described below, we used the following stock solutions: 2 mM of sodium hypericin (NaHy) in MeOH; 2 mM of VitEAc in CHCl
3; a solution of “empty”
DMPC liposomes (i.e., containing no intercalant in the lipid bilayer)—prepared by sonicating 2.5 mg/mL of lipid in dpH
2O; and DMPC liposomes (2.5 mg/mL of DMPC in
dpH2O) intercalated with NaHy.
“Empty” DMPC liposome solution“Empty” liposomes (i.e., liposomes without any inter-calant in the lipid bilayer) were prepared as follows. Chloroform (approximately 200 µL/mg lipid) was placed in an acid-washed vial (vide supra), and DMPC was dis-solved therein. When liposomes with intercalant were needed, the desired intercalant in the appropriate molar ratio and DMPC were dissolved in the chloroform. CHCl
3
was then evaporated with a gentle stream of N2 while
rotating the vial and warming it to ~30°C. This resulted in a thin layer of lipid on the walls of the vial. The vial was then set in a cotton-packed, round-bottomed flask, and any solvent residue was removed by rotary evaporation.
The vial was then charged with dpH2O or 0.1-M phosphate
buffer solution (pH 7.8), yielding a cloudy solution of 5 mg of lipid/mL. The vial was vigorously agitated with a vortex shaker for 10 minutes, yielding a solution of multilamel-lar liposomes. The liposomal solution was then sonicated until clear (signifying the presence of predominantly small unilamellar liposomes) and/or until no difference in light transmission was observed (indicating a minimal liposomal radius). This generally took 20–25 minutes. The sonication of intercalant and lipid together is henceforth referred to as “cosonication.” Nuclear magnetic resonance (NMR) studies revealed that the liposomal solutions are stable for several days at room temperature, but, as a rule, were utilized within 24 hours.
Intercalation into liposomes by diffusionA set of samples was prepared containing constant con-centrations of empty DMPC liposomes with increasing concentrations of intercalant in dpH
2O. Samples were
agitated with the shaker overnight (approximately 16 hours), permitting diffusion of the lipophilic intercalant into the liposomes, until the equilibrium concentration was attained. Emission spectra were recorded for the complete set, after the incubation period, to determine the DMPC/intercalant mole ratio. Kinetics of intercala-tion were determined by measuring the fluorescence in a time-drive mode, until no further change was observed.
Kb measurements for NaHy in DMPC liposomes
The binding (or intercalation) constant, Kb, measures
the partitioning of intercalants into liposomes; it can be calculated by the technique described by Ehrenberg (Ehrenberg, 1992; Ehrenberg et al., 1998). A set of 20 samples (total volume of 3 mL each) containing a con-stant concentration of NaHy (6 μL from a stock solution of 2 mM in methanol), with increasing concentrations of empty DMPC liposomes (0.0–0.8 mg/mL), was prepared. Samples remained on the shaker overnight, during which time the intercalant diffused into the liposomes, until the equilibrium concentration was reached. Emission spectra were then recorded for the complete set, and the fluorescence intensity at 601 nm was used to calculate K
b.
Cryo-TEM imaging and calculationsIn all cryo-TEM measurements, solution samples were pre-heated to 31°C in a water bath before sampling. This tem-perature is above the T
m of the DMPC hydrocarbon chains
in liposomes, which is 23.6°C (Sassaroli et al., 1990). A single drop of the sample completely covered a perforated carbon film supported on a grid, held by a pair of tweezers in a temperature- and humidity-controlled chamber (con-trolled environment verification system) at 31°C. The drop was blotted with filter paper to create a thin liquid layer on the grid. The specimen was vitrified by plunging it into liq-uid ethane at its freezing point. The vitrified specimen was transferred into a Gatan 626 cryospecimen holder (Gatan, Inc., Pleasanton, California, USA), using its “transfer sta-tion.” The specimen was kept at approximately –175°C in
Jour
nal o
f L
ipos
ome
Res
earc
h D
ownl
oade
d fr
om in
form
ahea
lthca
re.c
om b
y B
ar-I
lan
Uni
vers
ity o
n 07
/16/
12Fo
r pe
rson
al u
se o
nly.

4 Y. Cohen et al.
Journal of Liposome Research
an FEI T12 transmission electron microscope, operated at 120 kV. Images were recorded by a Gatan US1000 cooled-CCD digital camera, using the Gatan DigitalMicrograph software package (Talmon et al., 1990).
Mean diameters of the vitrified intercalated and empty liposomes were measured as follows: 1) For each cryo-TEM image, a square of fixed area was drawn in the upper left-hand corner, and 50–200 liposomes in the square were measured; 2) micrographs were measured in their 50% enhanced magnitude to better observe the borders of the liposome edges; 3) only unilamellar lipo-somes were measured; fused or multilamellar liposomes, or those encapsulated within another liposome, were not measured; 4) only liposomes whose entire diameter was in the picture were included in the calculation; 5) a total of approximately 1,000 liposomes were measured for each intercalant/lipid molar ratio; 6) measurements and calculations (average and standard deviation; SD) were performed using the AnalySIS program; experi-ments were repeated thrice; and 7) average mean diam-eter, μ
D, was calculated as shown in Equation 1, whereas
the uncertainty in this value was calculated as shown in Equation 2 (Bevington, 1969).
µ
χσ
σ
≅∑
∑
i
i
i
2
21
(1)
σσ
µ2
2
11
≅∑
i
(2)
In these equations, μ is the average of several measure-ments, χ
i is the result of each measurement, σ
i is the
measurement uncertainty, and σμ is the uncertainty of the calculated average.
Results and discussionThe effect of VitEAc concentration on the liposomal diameterIn our opening remarks, we briefly mentioned the excel-lent correlation existing between 13C NMR chemical shifts and the E
T(30) polarity of the solvent in which the
spectrum was measured. Once a chemical shift-polarity correlation graph has been prepared for polarizable carbons in a given compound, an observed 13C chemi-cal shift for that carbon can be viewed as reporting the E
T(30) micropolarity experienced by the “reporter”
carbon. Because the lipid bilayer has a polarity gradient ranging from that of water [E
T(30) 63.1 kcal/mol] at the
interface, down to that of hexane [ET(30) 31.0 kcal/mol]
in the inner slab of alkyl chains, this correlation can be used to qualitatively locate reporter carbons of intercal-ants within lipid bilayers. Unfortunately, because of the relative insensitivity of the NMR technique, we had to cosonicate the intercalant and DMPC in a molar ratio of
1:5 (17 mole%) to clearly observe the intercalant reporter carbon within the liposome. This, however, raised the question of whether liposomes were formed at all at such high concentrations of intercalant. In previous studies, we therefore turned to cryo-TEM and demon-strated that, even under those concentrated conditions, liposomes are indeed formed (Weitman et al., 2001a; Afri et al., 2002, 2004).
In the present study, we are interested in the influ-ence of high intercalant concentrations (approxi-mately 17 mole%) on the liposomal diameter and structure. To this end, solutions of empty DMPC lipo-somes—namely, liposomes without any intercalant in the lipid bilayer—were sonicated (approximately 25 minutes) until there was no further difference in light absorbance. The lack of absorbance change is indicative of the formation of liposomes of minimal diameter. We also intercalated into liposomes varying concentrations of either VitEAc (by the cosonication of intercalant and DMPC lipid) or NaHy (by diffusion of intercalant into sonically preformed liposomes or by cosonication—see Methods). The influence of the intercalant and its concentration on the liposomes’ diameter were followed by cryo-TEM. En passant, we also confirmed that liposomes are formed at each of the concentrations studied.
As just mentioned, VitEAc was intercalated into DMPC liposomes by cosonication. 13C NMR analysis verified that, after sonication, the intercalated VitEAc was still in its initial ester form and was not hydrolyzed to VitE. Vitrified samples of empty DMPC liposomes, (i.e., liposomes con-taining no intercalant; Figure 2A), as well as DMPC lipo-somes containing intercalated VitEAc in VitEAc/DMPC molar ratios of 1:49 (Figure 2B), 1:19 (Figure 2C), and 1:4 (Figure 2D), were examined by cryo-TEM.
Mean diameter of liposomes was determined (see above), and these are summarized in Table 1 as a func-tion of the molar ratios of VitEAc/DMPC. As observed from Table 1 and the cryo-TEM images (Figure 2), there is an inverse relationship between VitEAc concentra-tion and the liposomal diameter. Thus, the greater the concentration of VitEAc in the preparation solution, the smaller the liposomal diameter. At the highest con-centration of VitEAc (20 mol%), the liposomal diam-eter is approximately 20% smaller than it is in empty liposomes.
Very large liposomes (with diameters larger than 100 nm), which represent a minority of the liposomes present in the TEM picture, were included in the calcula-tion of average diameter. They contribute to the large SD. Mean diameters of liposomes were surprisingly small. We therefore repeated the measurements, but found the results to be essentially the same. The data clearly indi-cate that the intercalation of VitEAc into the lipid bilayers increases the host liposome’s curvature (i.e., decreases the radius of curvature). Its influence exists even at low inter-calant concentration, and this curvature effect becomes increasingly pronounced as the VitEAc ratio increases.
Jour
nal o
f L
ipos
ome
Res
earc
h D
ownl
oade
d fr
om in
form
ahea
lthca
re.c
om b
y B
ar-I
lan
Uni
vers
ity o
n 07
/16/
12Fo
r pe
rson
al u
se o
nly.

The effect of intercalants on the host liposome 5
© 2012 Informa Healthcare USA, Inc.
Our assumption is that when the solution is sonicated, the tocopherol acetate partitions into the liposome because of a driving hydrophobic effect; however, it then stresses the bilayer to assume a shape that better accommodates its own inherent curvature (see discussion below). The preferred arrangement, in this case, would seem to be smaller liposomes with greater curvatures; this, in turn, results in bigger spaces between the lipid molecules, which can accommodate larger amounts of VitEAc. This is energetically preferred over the creation of “islands” of VitEAc in the water. Additionally, the decrease in the radius of curvature may be attributable to the interdigi-tation phenomenon (Wittenberg et al., 2008), and addi-tional study of this point is clearly worthwhile.
To explore the generality of the above-described observations, we turned to study the effect of another intercalant with which we have much experience: NaHy (Roslaniec et al., 2000; Weitman et al. 2001a, 2001b). NaHy is an excellent candidate for this study because, though it has no fluorescence in aqueous media, it does
fluoresce upon intercalation into the lipid bilayer. This allows us to approach the issue of its intercalation into the lipid bilayer from a variety of vantage points.
The effect of NaHy concentration on liposomal diameterDetermination of the intercalation binding constant, K
b, of NaHy
The intercalation or binding constant, Kb, quantifies the
ability of intercalants to penetrate into liposomes. Thus, the higher the K
b value, the greater the amount of sub-
stance intercalating into the liposome. The Kb of NaHy was
measured by the spectroscopic technique of Ehrenberg (Ehrenberg, 1992; Ehrenberg et al., 1998), which corre-lates between the spectral data of the intercalant and the lipid concentration. Fluorescence of the intercalant was measured in aqueous solution, F
init, and in the presence
of increasing amounts of lipids, Fobs
(Figure 3).As observed from the insert in Figure 3, the intensity of
the main fluorescence band of NaHy increases asymptot-ically as the lipid concentration increases. By fitting the data to the hyperbolic function of Equation 3, the asymp-totic, saturation, fluorescence intensity, F
comp, and K
b, are
obtained. Kb of NaHy in DMPC liposomes was found to
be 10.94 ± 0.24 mL/mg:
F
F F K
Kobs =++
init comp b
b
L]
L]
[
[1 (3)
Figure 2. Cryo-TEM image of DMPC liposomes: (a) empty; (b) containing 1:49 n/n VitEAc/DMPC; (c) containing 1:19 n/n VitEAc/DMPC; (d) containing 1:4 n/n VitEAc/DMPC.
Table 1. Mean diameter of DMPC liposomes intercalated in various molar ratios with VitEAc by cosonication.VitEAc/DMPC molar ratio (mol%) Mean diameter (nm)1:4 (20) 18.5 ± 6.31:19 (5) 18.2 ± 4.41:49 (2) 20.1 ± 7.0Empty (0) 20.1 ± 5.0
Jour
nal o
f L
ipos
ome
Res
earc
h D
ownl
oade
d fr
om in
form
ahea
lthca
re.c
om b
y B
ar-I
lan
Uni
vers
ity o
n 07
/16/
12Fo
r pe
rson
al u
se o
nly.

6 Y. Cohen et al.
Journal of Liposome Research
By contrast, NaHy’s binding constant to lecithin was found by Roslaniec et al. (2000) to be 31.2 ± 4.0 mL/mg. Although both DMPC and lecithin are phospholipids, their struc-tures do differ. DMPC is a pure synthetic phospholipid containing two saturated 14-carbon lipid chains. Lecithin, on the other hand, is a natural mixture, containing fatty acid chains of various lengths, some of which are unsatu-rated, whereas others are saturated. Liposomes made of lecithin are known to be less ordered than those made from DMPC and have lower phase-transition temperatures and microviscosities. All these properties enhance the uptake of binding molecules (van der Meer, 1984).
Returning to the binding constant of NaHy in DMPC liposomes, the reciprocal of K
b, 0.091 mg/mL, indicates
that at this concentration of DMPC, half of the NaHy in solution will be intercalated in the liposome.
The influence of sonication time on liposome capacityWe have noted several times that the optimal sonication time for the preparation of liposomes with our probe
sonicator is approximately 25 minutes. After this dura-tion, the liposomal solution becomes clear (signifying the presence of liposomes whose diameter is smaller than the wavelength of visible light or 400 nm) and/or no difference in light transmission is observed (indicating a minimal liposomal radius). We were interested in dis-covering how the intercalation capacity of the liposome changes as a function of the sonication time. To this end, we sonicated DMPC lipid solutions over a 25-minute period, removing a sample of the resulting empty lipo-somal solution every 5 minutes, and then measuring the intercalation constant, K
b. The longer the sonication
duration, the greater was the fluorescence intensity of the liposomal solutions (Figure 4). From this, we con-clude that as sonication time increases, so does liposome capacity. This is presumably because, as the liposome becomes smaller, its curvature increases. As a result, the intermolecular spaces become wider and there is more room for the intercalant molecules to insert themselves.
In a second experiment, we prepared empty liposomes and allowed NaHy to diffuse in while shaking. Increasing amounts of NaHy were used and the molar ratio (n/n) of NaHy/lipid ranged from 1:32 to 1:180. The fluorescence intensity at 610 nm was measured for each set of liposomes. Samples were once more sonicated for another 25 minutes, and fluorescence intensity was measured again. Much to our surprise, all samples showed a decrease in fluorescence intensity after sonication. Another observation was of a decrease in fluorescence intensity when NaHy/lipid ratio approached 1:55 n/n. We assume that this is the full capac-ity point of the DMPC liposome for NaHy (Figure 5).
We can explain the above results by focusing on the second sonication step. In the latter, we effectively have a “sonic” rearrangement during which the liposome reas-sembles into smaller liposomes with a larger curvature. NaHy, present in the water phase as aggregates, can inter-calate into the liposome, leading to more aggregation
Figure 4. Fluorescence as a function of sonication time.
Figure 5. Black dots: fluorescence after intercalation of NaHy into empty liposomes by diffusion (shaking). Red dots: as above, followed by subsequent sonication.
Figure 3. Determination of the Kb-intercalation (binding) constant
of Hy into DMPC.
Jour
nal o
f L
ipos
ome
Res
earc
h D
ownl
oade
d fr
om in
form
ahea
lthca
re.c
om b
y B
ar-I
lan
Uni
vers
ity o
n 07
/16/
12Fo
r pe
rson
al u
se o
nly.

The effect of intercalants on the host liposome 7
© 2012 Informa Healthcare USA, Inc.
inside the liposome. This, in turn, leads to a reduction in fluorescence. We can observe in Figure 5 that low fluores-cence is observed either at low or high NaHy concentra-tions. The latter is the result of the aggregates resident in the bilayer.
To further study the effect of NaHy content on the size of the liposomes, four samples were prepared: a) empty DMPC liposomes prepared by sonication (for approxi-mately 25 minutes); b) the above sample sonicated a second time (for an additional 25 minutes); c) NaHy
intercalated liposomes prepared by allowing NaHy to diffuse into sample a in a 1:19 n/n NaHy/DMPC molar ratio; and d) NaHy intercalated liposomes prepared by resonicating sample a (for an additional 25 minutes) in the presence of NaHy in a 1:19 n/n NaHy/DMPC molar ratio.
In contradistinction to the inverse relationship between the VitEAc concentration and liposome diam-eter observed above, in the case of NaHy, there is a direct correlation between NaHy concentration and the liposo-mal diameter. Thus, NaHy intercalated liposomes—pre-pared by diffusion or sonication of empty liposomes with NaHy—have liposomal diameters approximately 24% larger than that of the corresponding empty liposomes (Table 2; Figure 6).
The different effect of VitEAc and NaHy on the liposomal diameter seems to be a result of their dif-ferent three-dimensional (3D) structure. PCModel calculations reveal that VitEAc has a conical shape (see Figure 7A), with an oval head group and a sin-gle thin, long tail. Presumably, the thin tail slips in between the lipid molecules and has minimal reper-cussions. The bulky relatively polar acetate group in VitEAc, however, is located in the polar head region of the liposome (Perly et al., 1985; Afri et al., 2004) and disturbs the lipid packing. In particular, it causes the head groups to flare out. As a result of the coni-cal shape of the VitEAc intercalant, the curvature of
Table 2. Mean diameter of NaHy-intercalated DMPC liposomes prepared by sonication and cosonication or diffusion.
SampleMean diameter
(nm)(a) Empty liposomes prepared by sonicationa 33.4 ± 2.1(b) Empty liposomes after resonication of
sample a30.1 ± 1.0
(c) NaHy intercalated liposomes prepared by allowing NaHy to diffuse into empty liposomes (sample a) in a 1:19 NaHy/DMPC molar ratio
41.6 ± 4.2
(d) NaHy-intercalated liposomes prepared by resonicating sample a in the presence of NaHy in a 1:19 NaHy/DMPC molar ratio
35.6 ± 1.9
a The discrepancy in the diameter of empty liposomes between Tables 1 and 2 is attributable to the differing probe sonication apparatus used. Nevertheless, the values are reproducible and internally consistent.
Figure 6. Cryo-TEM images of DMPC liposomes: (a) empty liposomes; (b) empty DMPC liposomes after double sonication; (c) NaHy diffusion-intercalated liposomes; (d) NaHy sonically intercalated liposomes.
Jour
nal o
f L
ipos
ome
Res
earc
h D
ownl
oade
d fr
om in
form
ahea
lthca
re.c
om b
y B
ar-I
lan
Uni
vers
ity o
n 07
/16/
12Fo
r pe
rson
al u
se o
nly.

8 Y. Cohen et al.
Journal of Liposome Research
the liposome becomes greater, thereby reducing the liposomal diameter.
The situation is quite different in the case of NaHy. Its molecular shape approximates a rectangular prism (see Figure 7B and 7C). Therefore, when it intercalates into the liposome, it takes up the same volume both at the perimeter of the liposome as deeper within. This, in turn, causes the curvature to become smaller—enlarging the liposomal diameter.
Determination of NaHy concentration within liposomesNaHy solvent-dependent absorption and fluorescence spectraWe should note that the intercalant/lipid ratios cited above are those based on the amount of substrate added to the lipid solution. To obtain a more exact quantita-tive measure of the amount of NaHy and VitEAc actu-ally intercalated into the liposomal bilayer, we turned to absorbance (UV/Vis) and fluorescence spectroscopy. For these techniques to be of value, it is necessary that the spectra of the intercalant within the lipid bilayer be significantly different from its spectra in water so that a combined spectrum could be resolved by mathematical techniques. If this is the case, we can slowly introduce substrates into the liposomal solution and allow them to diffuse into the bilayer. When saturation is reached, no further rise will be observed in the fluorescence intensity and a clear change in the absorbance’s outlines.
In this regard, the absorbance spectrum of VitEAc is very problematic, because the liposome scattering, which is enhanced at shorter wavelengths, blurs the VitEAc spec-trum. As far as the fluorescence spectrum is concerned, the quantum yield of VitEAc is very low and therefore dif-ficult to detect in the liposomal medium. This precludes using VitEAc as a suitable probe. By contrast, the NaHy spectra are well defined and its bands are conveniently located in the red range. In the absorbance spectrum, there are two major peaks: at 560 and 600 nm. In its monomer form (observed in dilute methanol solutions; Roslaniec et al., 2000), the band at 560 nm is the weaker of the two, whereas, in the aggregate form, it is the former that predominates (Weitman, 2001). For our purposes, we should emphasize that when NaHy is intercalated within the liposomal bilayer (Figure 8), a sharp peak at 600 nm predominates—characteristic of the NaHy monomer.
Turning now to the fluorescence spectrum, NaHy shows an emission at 602 nm in organic solvents and within the liposomal bilayer, but none in water. This is presumably because aggregate formation in water quenches the fluorescence emission (O’Connell et al., 2007). Because of the unambiguity of the spectral data, NaHy suggested itself as an ideal candidate for a concen-tration effect study within liposomes.
Analysis of the NaHy absorbance spectraIn preparation for this study, we first explored the effect of increasing concentration of NaHy in water—in the absence of liposomes. An increasing amount of NaHy was added dropwise to water, and we followed the spec-tral change as the concentration increased from 6.65 to 80 µM. The SVD analysis by the MATLAB software deter-mined that the absorption spectrum is composed of two different, and partially overlapping, spectra of different relative amplitudes. This signals the presence of two distinct species of NaHy in water solution. Interstingly, however, both are nearly identical in shape and have λ max at 550 nm, but differ in the relative intensities of their bands. We hypothesize that one is a dimeric form, whereas the other is comprised of higher aggregates.
We next added an increasing amount of NaHy to a solution of empty liposomes (0.28 mg/mL in lipid). The NaHy was intercalated by sonication, and concentrations varied between 6.65 and 80 µM (as in the pure water experiment), which corresponds to NaHy/lipid molar ratios of 1:60 to 1:5. The overlay of some of the measured absorbance spectra is shown in Figure 9.
This figure contains the results of the SVD analysis of these spectra and reveals the presence of four spe-cies—dashed lines marked 1–4. As observed in overlay plots in Figure 9, the measured spectra have two primary maxima: at approximately 550 and 600 nm. As already noted, the major peak in liposomes is a sharp absorp-tion at 600 nm, whereas in water, the main peak is broad and located at 550 nm. The curves of species 1 and 2 have their maximal intensity peak at ~550 nm and are essen-tially identical with those observed in water—indicat-ing that they are aggregates resident in water (see also Figure 5). The other two dashed curves, marked 3 and 4, have a maximum intensity at approximately 600 nm, which signifies that they are two types of NaHy species
Figure 7. 3D representations of: (a) VitEAc; (b) NaHy (profile); (c) NaHy (planar view).
Jour
nal o
f L
ipos
ome
Res
earc
h D
ownl
oade
d fr
om in
form
ahea
lthca
re.c
om b
y B
ar-I
lan
Uni
vers
ity o
n 07
/16/
12Fo
r pe
rson
al u
se o
nly.

The effect of intercalants on the host liposome 9
© 2012 Informa Healthcare USA, Inc.
resident in the liposome. We assume that the sharper curve (line 4) is the NaHy monomer itself, whereas the some-what broader curve (line 3) is a low level of aggregate, perhaps dimers, within the membrane’s lipid phase.
Inception of aggregate formation: intercalation by diffusionAbove, we noted that there is a decrease in fluorescence when a ratio of NaHy/lipid of approximately 1:55 n/n was reached (see Figure 5). We maintained that this is the “full capacity point” of NaHy monomers in DMPC liposomes and the point at which aggregates begin to form. To fur-ther confirm this result, we took two samples of NaHy intercalated liposomes—in 1:5 and 1:50 molar ratios—and studied the effect of simply adding empty liposomes
(without additional sonication). After each addition, we measured the liposomal solution absorbance at λ max (600 nm). The results are shown in Figure 10.
Figure 10 shows that the intensity at 600 nm increases substantially as we add empty liposomes to the more concentrated 1:5 molar ratio NaHy/lipid solution (line rising from bottom left to top right); the slope of line is 53.44. The reason is that at this high NaHy concentration, there is substantial aggregation of NaHy in the bilayer. The addition of empty liposomes dilutes the aggregates, allowing the monomer-aggregate equilibrium to shift in the direction of lesser aggregation and more mono-meric NaHy. This, in turn, results in a sharper, stronger absorption at 600 nm. In addition, at the high NaHy con-centration, a substantial amount of NaHy is available in the water as aggregates (dimers and trimers). As empty liposomes are added, more NaHy intercalates into the bilayer, resulting in increased absorption. As expected, the effect observed at the 1:5 ratio is not observed at 1:50.
Inception of aggregate formation: intercalation by sonicationWe would like to emphasize the power of the absorbance versus fluorescence tool in the case of sodium hyperi-cin. As noted above, the absorbance measures the total NaHy concentration, whereas the fluorescence emis-sion reflects only the concentration of nonaggregated NaHy monomers inside the liposome. This gives us great insight into what actually is taking place within the lipo-somal solution.
As described above, we observed that DMPC lipo-somes become saturated with monomeric NaHy, when the NaHy/lipid ratio approached 1:55. In determining this value, NaHy was intercalated by diffusion. To confirm the above-described results still further, we intercalated NaHy into liposomes after the “cosonication” method. As shown in Table 3, the NaHy concentration ranged from 1.86 to 80 µM, whereas the lipid concentration was maintained constant at 400 µM (the corresponding NaHy/lipid molar ratio ranged from 1:215 to 1:5, respectively). Increasing
Figure 8. Absorbance spectra of sodium hypericin (NaHy) in water (10 μM) and within liposomes (10 mg/mL).
Figure 9. Overlay of the absorbance spectra (solid lines) of seven liposome samples (400 µM lipid) containing NaHy in NaHy/lipid molar ratios ranging from 1:60 (solid navy blue plot at very bottom) to 1:5 (solid brown plot in middle) [where (NaHy) = 6.65–80 µM, respectively]. SVD analysis on a MATLAB (The MathWorks, Inc., Natick, Massachusetts, USA) platform reveals the presence of four species, whose spectra (dashed lines) are marked as 1–4.
Figure 10. Absorbance changes (λmax
at 600 nm) upon the addition of empty liposomes to NaHy intercalated liposomes in NaHy:lipid molar ratios of 1:5.
Jour
nal o
f L
ipos
ome
Res
earc
h D
ownl
oade
d fr
om in
form
ahea
lthca
re.c
om b
y B
ar-I
lan
Uni
vers
ity o
n 07
/16/
12Fo
r pe
rson
al u
se o
nly.
10 Y. Cohen et al.
Journal of Liposome Research
NaHy concentration showed an increase in fluorescence (excitation at 560 nm, emission at 602 nm) up to 1:50 n/n NaHy/lipid. At higher ratios, a decrease in fluorescence was observed, signaling the onset of aggregation.
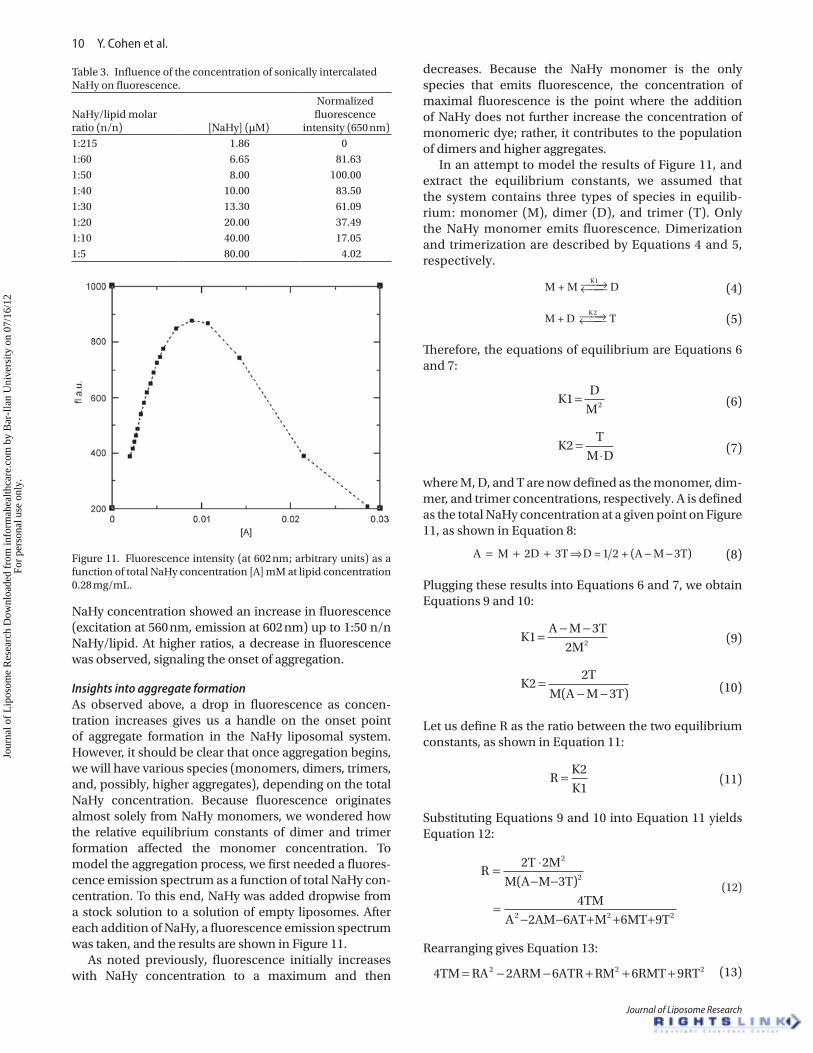
Insights into aggregate formationAs observed above, a drop in fluorescence as concen-tration increases gives us a handle on the onset point of aggregate formation in the NaHy liposomal system. However, it should be clear that once aggregation begins, we will have various species (monomers, dimers, trimers, and, possibly, higher aggregates), depending on the total NaHy concentration. Because fluorescence originates almost solely from NaHy monomers, we wondered how the relative equilibrium constants of dimer and trimer formation affected the monomer concentration. To model the aggregation process, we first needed a fluores-cence emission spectrum as a function of total NaHy con-centration. To this end, NaHy was added dropwise from a stock solution to a solution of empty liposomes. After each addition of NaHy, a fluorescence emission spectrum was taken, and the results are shown in Figure 11.
As noted previously, fluorescence initially increases with NaHy concentration to a maximum and then
decreases. Because the NaHy monomer is the only species that emits fluorescence, the concentration of maximal fluorescence is the point where the addition of NaHy does not further increase the concentration of monomeric dye; rather, it contributes to the population of dimers and higher aggregates.
In an attempt to model the results of Figure 11, and extract the equilibrium constants, we assumed that the system contains three types of species in equilib-rium: monomer (M), dimer (D), and trimer (T). Only the NaHy monomer emits fluorescence. Dimerization and trimerization are described by Equations 4 and 5, respectively.
M + M DK1 →← (4)
M + D TK2 →← (5)
Therefore, the equations of equilibrium are Equations 6 and 7:
K1
D
M2=
(6)
K2
T
M D=
⋅ (7)
where M, D, and T are now defined as the monomer, dim-mer, and trimer concentrations, respectively. A is defined as the total NaHy concentration at a given point on Figure 11, as shown in Equation 8:
A M 2D 3T D = 1 2 + (A M 3T)= + + ⇒ − −
(8)
Plugging these results into Equations 6 and 7, we obtain Equations 9 and 10:
K1
A M 3T
2M2=− −
(9)
K2
2T
M(A M 3T)=
− − (10)
Let us define R as the ratio between the two equilibrium constants, as shown in Equation 11:
R
K2
K1=
(11)
Substituting Equations 9 and 10 into Equation 11 yields Equation 12:
R2T 2M
M(A M 3T)
4TM
A 2AM 6AT M 6MT 9T
2
2
2 2 2
= ⋅− −
=− − + + +
(12)
Rearranging gives Equation 13:
4TM RA 2ARM 6ATR RM 6RMT 9RT2 2 2= − − + + + (13)
Table 3. Influence of the concentration of sonically intercalated NaHy on fluorescence.
NaHy/lipid molar ratio (n/n) [NaHy] (µM)
Normalized fluorescence
intensity (650 nm)1:215 1.86 01:60 6.65 81.631:50 8.00 100.001:40 10.00 83.501:30 13.30 61.091:20 20.00 37.491:10 40.00 17.051:5 80.00 4.02
Figure 11. Fluorescence intensity (at 602 nm; arbitrary units) as a function of total NaHy concentration [A] mM at lipid concentration 0.28 mg/mL.
Jour
nal o
f L
ipos
ome
Res
earc
h D
ownl
oade
d fr
om in
form
ahea
lthca
re.c
om b
y B
ar-I
lan
Uni
vers
ity o
n 07
/16/
12Fo
r pe
rson
al u
se o
nly.

The effect of intercalants on the host liposome 11
© 2012 Informa Healthcare USA, Inc.
We now have a quadratic equation in T (Equation 14), which has only one physical solution (Equation 15):
9R 2[3R(A M) 2M] R(A M) 0T T2 − − + + − = (14)
T1,2 =
− + ± − + − −
=
2[3R(A M) 2M]
0
4 3 2 36
18
2 2 2[ ( ) ] ( )R A M M R A M
R
(15)
This equation gives us a solution for T as a function of A, M, and R at each point in Figure 11.
Regarding M, the monomer concentration can be inferred from the first four points of Figure 9. We see that at the lower NaHy concentrations, the fluorescence intensity is directly proportional to the concentra-tions. The assumption is that with [A] < 5 µM, most of the NaHy is present as a monomer. From the first four points, with suitability (minimal squares) to the straight-line equation, Fl = a[A]+b, the relationship between the fluorescence intensity and the monomer concentration was found. This relationship is true for every point in Figure 11. Because M can be measured (based on the flu-orescence), [A] is what we added, and R is of our choosing (see next paragraph); the only unknown parameter is T.
We turn now to R, which is the ratio between the two equilibrium constants, K2 (dimer formation) and K1 (trimer formation) [R = K2/K1]. To get a sense of how these values interact, we decided to choose three
values: 0.1, 10, and 100. We remind the reader that these values describe situations where the amount of trimer formation (K2) is one tenth, 10 times, and 100 times larger than dimer formation (K1).
In Figure 12A–12C, we have plotted the correla-tion between the total concentration of NaHy and the monomer, dimer, and trimer concentrations present in the solution. From these three figures, we conclude that although aggregation begins at approximately [A] > 6 µM, all three species (monomer, dimer, and trimer) are present in equilibrium at approximately 15 µM at rela-tive ratios that depend on R. As the value of R (= K2/K1) increases, more trimers will be formed at the expense of dimers; nevertheless, this has little effect on the fluores-cent monomer concentration.
It can be readily observed that the monomer con-centration essentially depends only on the total NaHy concentration; it is independent of the other species in solution, and thus the exact values of K1 and K2 are irrelevant. Because fluorescence stems only from the monomer, this is the species we are measuring in the experiments described in this article.
ConclusionWe have found that upon intercalation, NaHy and VitEAc have surprisingly different influences on the diameter of the liposomes. This is true irrespective of whether these compounds are intercalated by sonication or diffusion.
Figure 12. Correlation between the NaHy’s total concentrations [A] and the concentration of monomer (M), dimer (D), and trimer (T) present in the solution. (a) K2/K1 = 0.1; (b) K2/K1 = 10; (c): K2/K1 = 100.
Jour
nal o
f L
ipos
ome
Res
earc
h D
ownl
oade
d fr
om in
form
ahea
lthca
re.c
om b
y B
ar-I
lan
Uni
vers
ity o
n 07
/16/
12Fo
r pe
rson
al u
se o
nly.

12 Y. Cohen et al.
Journal of Liposome Research
Thus, intercalated VitEAc substantially decreased the diameter of unilamellar DMPC liposomes, whereas Hy intercalation enlarged the liposome diameter. We attri-bute this result to the difference between their molecu-lar shapes: The VitEAc molecule is conical, whereas the NaHy is oblong. The wide hydrophilic head of VitEAc spreads out the outer head-group lamella and enlarges the liposomal curvature; this results in smaller lipo-somes. The NaHy molecules, on the other hand, expand the outer and inner lamella of the liposome, thus enlarg-ing the liposome diameter.
We employed fluorescence intensity to measure the capacity of a liposome for taking up a foreign molecule. When the intercalant-to-lipid ratio of NaHy/lipid reaches approximately 1:55 n/n, the liposome is saturated with NaHy monomers. Further increase in the NaHy concen-tration results in aggregate formation, which is reflected in the decrease of fluorescence. Increasing the NaHy concentration still further increases the amount of dimers and trimers present in solution, which decreases the fluorescence intensity even more. Interestingly, the monomer concentration essentially depends only on the total NaHy concentration and is independent of the other species in solution.
These initial results give us greater insight into the many complicated processes occurring as intercalants become incorporated in the liposomal lipid bilayer. But, it can also serve as a jumping board for a multidimensional study. Several directions for future research present themselves at this juncture. First, the data obtained need to be expanded to other biologically relevant intercalants in the hope of developing a clear relationship between the molecular shape of intercalants and various biophysical/chemical properties, including the liposomal curvature. Differential scanning calorimetry could be used to obtain further insight into both the physical and energetic prop-erties of liposomes containing intercalant. We also need to look more carefully at the changes in liposome curva-ture as a function of sonication time. This we will do with an eye to developing liposomal drug delivery systems. Second, we have chosen, in this initial study, to focus on the synthetic saturated phospholipid, DMPC. Clearly, we will need to explore the role of the liposome by expand-ing this research to biological lipids and biomimetic systems. Finally, we need to explore the driving force for aggregation of NaHy inside the liposome. Undoubtedly, Π-Π interactions are involved, although their specifics have yet to be explored in the present instance. All this information will hopefully be beneficial in the treatment of disease, which may well be improved by studying the effect of intercalants and other factors on membrane curvature.
AcknowledgmentsThe authors thank Prof. Ilan Hammel of Tel Aviv University for his guidance in determining the number and diameters of liposomes.
Declaration of interestThe authors acknowledge the kind and generous support of The Israel Science Foundation (grant nos.: 327/02 and 437/06), founded by The Israel Academy of Sciences and Humanities, and The Ethel and David Resnick Chair in Active Oxygen Chemistry at Bar-Ilan University.
ReferencesAfri, M., Ehrenberg, B., Talmon, Y., Schmidt, J., Cohen, Y., Frimer, A.
A. (2004). Active oxygen chemistry within the liposomal bilayer. Part III: locating Vitamin E, ubiquinol, and ubiquinone and their derivatives in the lipid bilayer. Chem Phys Lipids 131:107–121.
Afri, M., Gottlieb, H. E., Frimer, A. A. (2002). Superoxide organic chemistry within the liposomal bilayer. Part II: a correlation between location and chemistry. Free Radic Biol Med 32:605–618.
Andersen, D. O., Weber, N. D., Wood, S. G., Huges, B. G., Murray, B. K., North, J. A. (1991). In vitro virucidal activity of selected anthraquinones and anthraquinone derivatives. Antiviral Res 16:185–196.
Anker, L., Gopolarakrishna, R., Jones, K. D., Law, R. E., Couldwell, W. T. (1995). Hypericin in adjuvant brain tumor therapy. Drugs Fut 20:511–517.
Azzi, A. (2007). Molecular mechanism of α-tocopherol action. Free Radic Biol Med 43:16–21.
Bernheim-Groswasser, A., Wachtel, E., Talmon, Y. (2000). Micellar growth, network formation, and criticality in aqueous solutions of the nonionic surfactant C12E5. Langmuir 16:4131–4140.
Bevington, P. R. (1969). Data reduction and error analysis for the physical sciences. New York: McGraw-Hill.
Brigelius-Flohe, B., Davies, K. J. A. (2007). Is vitamin E an antioxidant, a regulator of signal transduction and gene expression, or a ‘junk’ food? Free Radic Biol Med 43:2–3.
Burton, G. W., Ingold, K. U. (1981). Autoxidation of biological molecules. 1. The antioxidant activity of vitamin E and related chain-breaking phenolic antioxidants in vitro. J Am Chem Soc 103:6472–6477.
Burton, G. W., Joyce, A., Ingold, K. U. (1983). Is vitamin E the only lipid-soluble, chain-breaking antioxidant in human blood plasma and erythrocyte membranes. Arch Biochem Biophys 221:281–290.
Brockman, H., Haschad, M. N., Maier, K., Pohl, F. (1939). Hypericin, the photodynamically active pigment from Hypericum perforatum. Naturwissenschaften 27:550–555.
Carpenter, S., Kraus, G. A. (1991). Photosensitization is required for inactivation of equine infectious anemia virus by hypericin. Photochem Photobiol 53:169–174.
Couldwell, W. T., Gopalakrishna, R., Histon, D. R., He, S., Weiss, M. H., Law, R. E., et al. (1994). Hypericin: a potential antiglioma therapy. Neurosurgery 35:705–709.
Cooper, G. M., Hausman, R. E. (1997). The cell. Washington, DC: AMS.Degar, S., Prince, A. M., Pascual, D., Lavie, G., Levin, B., Mazur Y.,
et al. (1992). Inactivation of the human immunodeficiency virus by hypericin: evidence for photochemical alterations of p24 and a block in uncoating. AIDS Res Hum Retrov, 8:1929–1936.
Dimroth, K., Reichardt, C., Siepmann, T., Bohlmann, F. (1963). On pyridinium N-phenol betaines and their use to characterize the polarity of solvents. [In German]. Liebigs Ann Chem 661:1–37.
Diwu, Z. (1995). Novel therapeutic and diagnostic applications of hypocrellins and hypericins. Photochem Photobiol 61:529–539.
Ehrenberg, B. (1992). The partitioning of probes to membranes by spectroscopic titration. J Photochem Photobiol B 14:383–386.
Ehrenberg, B., Anderson, J. L., Foote, C. S. (1998). Kinetics and yield of singlet oxygen photosensitized by hypericin in organic and biological media. Photochem Photobiol 68:135–140.
Freeman, D., Frolow, F., Kapinus, E., Lavie, D., Lavie, G., Meruelo, D., et al. (1994). Acidic properties of hypericin and its octahydroxy analogue in the ground and excited states. J Chem Soc Chem Comm 7:891–892.
Jour
nal o
f L
ipos
ome
Res
earc
h D
ownl
oade
d fr
om in
form
ahea
lthca
re.c
om b
y B
ar-I
lan
Uni
vers
ity o
n 07
/16/
12Fo
r pe
rson
al u
se o
nly.

The effect of intercalants on the host liposome 13
© 2012 Informa Healthcare USA, Inc.
Frisch, M. J., Trucks, G. W., Schlegel, H. B., Scuseria G. E., Robb, M. A., Cheeseman, J. R., et al. (2003). Gaussian 03, Revision B.04. Pittsburgh, Pennsylvania USA: Gaussian, Inc.
Gennis, R. B. (1989). Biomembranes molecular structure and function. New York: Springer-Verlag.
Giese, A. C. (1980). Hypericism. Photochem Photobiol Rev 5:229–255.Handa, T. (2001). Stability and plasma apolipoprotein binding of lipid
emulsions. Food Hydrocoll 15:277–283.Hudson, J. B., Harris, L., Towers, G. H. N. (1993). The importance of light
in the anti-HIV effect of hypericin. Antiviral Res 20:173–178.Hudson, J. B., Lopez-Bazzocchi, I., Towers, G. H .N. (1991). Antiviral
activities of hypericin. Antiviral Res 15:101–112.Israelachvili, J. N., Marcelja, S., Horn, R. G. Q. (1980). Physical principles
of membrane organization. Rev Biophys 13:121–200.Israelachvili, J. N., Mitchell, D. J., Ninham, B. W. (1976). Theory of self-
assembly of hydrocarbon amphiphiles into micelles and bilayers. J Chem Soc Faraday Trans II 72:1525–1568.
Israelachvili, J. N., Mitchell, D. J., Ninham, B. W. (1977). Theory of self-assembly of lipid bilayers and vesicles. Biochim Biophys Acta 470:185–201.
Janzen, E. J., Haire, D. L., Coulter, G. A., Stronks, H. J., Krygsman, P. H., Tower, R. A., et al. (1989). Locating spin traps in heterogeneous media by 13C NMR spectroscopy. Investigations in SDS micelles, DMPC vesicles, and rat liver microsomes. J Org Chem 54:2915–2920.
Kraus, G. A., Zjang, W., Fehr, M. J., Petrich, J. W., Wannemuehler, Y., Carpenter, S. (1996). Research at the interface between chemistry and virology: development of a molecular flashlight. Chem Rev 96:523–535.
Kremer, J. M. H., Kops-Werkhoven, M. M., Pathmamanoharan, C., Guzman, O. L. J., Wiersema, P. H. (1977). Phase diagrams and the kinetic of phospholipid exchange for vesicles of different composition and radius. Biochim Biophys Acta 471:177–188.
Kumar, V. V. (1991). Complementary molecular shapes and additivity of the packing. Proc Natl Acad Sci USA 88:444–448.
Lavie, G., Mazur, Y., Meruelo, D. (1995). The chemical and biological properties of hypericin—a compound with a broad-spectrum of biological-activities. Med Res Rev 15:111–119.
Lavie, G., Valentine, F., Levin, B., Mazur, Y., Gallo, G., Weiner, D., et al. (1989). Studies of the mechanisms of action of the antiretroviral agents hypericin and pseudohypericin. Proc Natl Acad Sci USA 86:5963–5967.
Lenard, J., Rabson, A., Vanderoef, R. (1993). Photodynamic inactivation of infectivity of human immunodeficiency virus and other enveloped viruses using hypericin and rose bengal. Proc. Natl. Acad. Sci. USA 90:158–162.
Maciel, G. H., Natterstad, J. J. (1965). Carbon-13 chemical shifts of the carbonyl group. III. Solvent effects. J Chem Phys 42:2752–2759.
Maciel, G. H., Ruben, Z. C. (1963). Solvent effects on the 13C chemical shift of the carbonyl group of acetone. J Am Chem Soc 85:3903–3904.
Mazur, Y., Bock, H., Lavie, D. (1992). Canadian Patent Application, 202993. Chem Abst 116:6343z.
Menger, F. M. (1979). On the structure of micelles. Accounts Chem Res 12:111–117.
Menger, F. M., Aikens, P., Wood, M. (1988). The water content of phospholipid bilayers. J Chem Soc Chem Comm 180–182.
Menger, F. M., Jercunica, J. M., Johnson, J. C. (1978). The water content of a micelle interior. The Fjord vs. Reef models. J Am Chem Soc, 100:4676–4678.
Meruelo, D., Degar, S., Amari, N., Mazur, Y., Lavie, D., Levin, B., et al. (1992). Mode of action of hypericin as an antiretroviral agent and other relevant findings. In: Chu, C. K., Cutler, H. G. (Eds.), Natural products as antiviral agents (p. 91). New York: Plenum.
Meruelo, D., Lavie, G., Lavie, D. (1988). Therapeutic agents with dramatic antiretroviral activity and little toxicity at effective doses: aromatic polycyclic diones hypericin and pseudohypericin. Proc Natl Acad Sci U S A 85:5230–5234.
Munro, S. (2003). Lipid rafts: elusive or illusive? Cell 115:377–388.Nilsson, S., Goldraich, M., Lindman, B., Talmon, Y. (2000). Novel organized
structures in mixtures of hydrophobically modified polymer and two oppositely charged surfactants. Langmuir 16:6825–6832.
O’Connell, M. J., Chan, C. K., Li, W., Hicks, R. K., Doorn, S. K., Wang, H. L. (2007). Polyelectrolyte platform for sensitive detection of biological analytes via reversible fluorescence quenching. Polymer 48:7582–7589.
Perillo, M. A., Garcia, D. A. (2001). Flunitrazepam induces geometrical changes at the lipid-water interface. Colloid Surf B Biointerfaces 20:63–72.
Perly, B., Smith, I. C. P., Hughes, L., Burton, G. W., Ingold, K. U. (1985). Estimation of the location of natural alpha-tocopherol in lipid bilayers by C-13-NMR spectroscopy. Biochem Biophis Acta 819:131–135.
Reichardt, C. (1965). Empirical parameters of the polarity of solvents. Angew Chem Int Edit 4:29–40.
Reichardt, C. (1990). Solvents and solvent effects in organic chemistry. Weinheim, Germany: Wiley-VCH Verlag GmbH.
Reichardt, C. (1994). Solvatochromic dyes as solvent polarity indicators. Chem Rev 94:2319–2358.
Roslaniec, R., Weitman, H., Freeman, D., Mazur, Y., Ehrenberg, B. (2000). Liposome binding constants and singlet oxygen quantum yields of hypericin, tetrahydroxy helianthrone, and their derivatives: studies in organic solutions and in liposomes. J Photoch Photobio B 57:149–158.
Sassaroli, M., Vauhkonen, M., Perry, D., Eisinger, J. (1990). Lateral diffusivity of lipid analogue excimeric probes in dimyristoylphosphatidylcholine bilayers. Biophys J 57:281–290.
Schinazi, R. F., Chu, K., Babu, J. R., Oswald, B. J., Saalmann, V., Cannon, D. L., et al. (1990). Anthraquinones as a new class of antiviral agents against human immunodeficiency virus. Antiviral Res 13:265–272.
Sebrel, W. H., Harris, R. S. (Eds.). (1972). The vitamins (vol. 5, pp. 165–317). New York: Academic.
Sharma, M. K., Beutner, G. R. (1993). Interaction of vitamin C and vitamin E during free radical stress in plasma: an ESR study. Free Radic Biol Med 14:649–653.
Talmon, Y., Burnst, J. H., Chestnut, M. H., Siegel, D. P. (1990). Time-resolved cryotransmission electron microscopy. J Electron Microsc Tech, 14:6–12.
Traber, M. G., Atkinson, J. (2007). Vitamin E, antioxidant and nothing more. Free Radic Biol Med 43:4–15.
Tulenko, T. N., Chen, M., Mason, P. E., Mason, R. P. (1988). Physical effects of cholesterol on arterial smooth muscle membranes: evidence of immiscible cholesterol domains and alterations in bilayer width during atherogenesis. J Lipid Res 39:947–956.
Ueji, S., Makamaura, M. (1976). Effects of solvents on carbon-13 chemical shifts of the carbonyl system. Tetrahedron Lett 2549–2552.
van der Meer, W. (1984). Physical aspects of membrane fluidity. In: Shinitzky, M. (Ed.), Physiology of membrane fluidity (vol. 1, pp. 53–71). Boca Raton, Florida, USA: CRC.
VERIS. (1993). Vitamin E: abstracts, vitamin E research, and information service. LaGrange, Illinois, USA: VERIS.
VERIS. (1994). Vitamin E: fact book, vitamin E research, and information service. LaGrange, Illinois, USA: VERIS.
Walter, A., Vinson, P. K., Kaplon, A., Talmon, Y. (1991). Intermediate structures in the cholate-phosphatidylcholine vesicle micelle transition. Biophys J 60:1315–1325.
Weitman, H. (2001). Photosensitization by second-generation sensitizers in solutions and in membranes. Ramat Gan, Israel, Ph.D. Thesis, Bar Ilan University.
Weitman, H., Roslaniec, M., Frimer, A. A., Afri, M., Freeman, D., Mazur, Y., et al. (2001a). Solvatochromic effects in the electronic absorption and nuclear magnetic resonance spectra of hypericin in organic solvents and in lipid bilayers. Photochem Photobiol 73:110–118.
Weitman, H., Schatz, S., Gottlieb, H. E., Kobayashi, N., Ehrenberg, B. (2001b). Spectroscopic probing of the acid-base properties and photosensitization of a fluorinated phthalocyanine in organic solutions and liposomes. Photochem Photobiol 73:473–481.
Wittenberg, N. J., Zheng, L., Winograd, N., Ewing, A. G. (2008). Short-chain alcohols promote accelerated membrane distention in a dynamic liposome model of exocytosis. Langmuir 24:2637–2642.
Zhang, W., Law, R. E., Histon, D. R., Couldwell, W. T. (1997). Inhibition of human malignant glioma cell motility and invasion in vitro by hypericin, a potent protein kinase C inhibitor. Cancer Lett 120:31–38.
Jour
nal o
f L
ipos
ome
Res
earc
h D
ownl
oade
d fr
om in
form
ahea
lthca
re.c
om b
y B
ar-I
lan
Uni
vers
ity o
n 07
/16/
12Fo
r pe
rson
al u
se o
nly.