the effect of iron overload on the long-term toxicological effects of fumonisin … · 2012. 10....
TRANSCRIPT

The Effect of Iron Overload on the
Long-term Toxicological Effects of
Fumonisin B1 in Rat Liver
Denise A. Werner

Department for Anatomical Pathology
(Head of Department: Prof. Dr. P. Cruse)
Faculty of Health Sciences,
University of Cape Town, South Africa
Written under the direction of Prof. Dr. P. Hall
Submitted at the Department of General Pathology and Neuropathology
(Head of Department: Prof. Dr. W. Schmahl)
Faculty of Veterinary Medicine,
Ludwig-Maximilians-University Munich, Germany
The Effect of Iron Overload on the Long-term Toxicological Effects of Fumonisin B1 in Rat Liver
Practical work completed at the PROMEC Unit
(Head of Department: Prof. Dr. W. Marasas)
Medical Research Council,
Cape Town, South Africa
Inaugural dissertation presented for the degree of
Doctor medicinae veterinarieae (Dr. med.vet.)
at the Faculty of Veterinary Medicine,
Ludwig-Maximilians-University Munich, Germany
by
Denise Werner of Spokane, USA
Munich 2002

Gedruckt mit Genehmigung der Tierärztlichen Fakultät der
Ludwig-Maximilians-Universität München
Dekan: Univ.-Prof. Dr. R. Stolla
Referent: Univ.-Prof. Dr. W. Schmahl
Korreferent: Univ.-Prof. Dr. J. Meyer
Tag der Promotion: 19. Juli 2002

Dedicated to my rats

TABLE OF CONTENTS
I
Table of Contents Chapter 1: Introduction
Chapter 2: Literature Review 2.1. Toxicological effects of FB1
2.1.1. Introduction
2.1.2. Chemical structure of the fumonisins
2.1.3. Biological activity and pathogenesis
2.1.4. Cancer initiation and promotion
2.1.5. Toxicity in animals
2.1.5.1. Rodents
2.1.5.2. Equines
2.1.5.3. Pigs
2.1.5.4. Non-human primates
2.1.5.5. Poultry
2.1.5.6. Ruminants
2.1.5.7. Other animals
2.1.6. Toxicity in humans
2.2. Dietary iron overload
2.2.1. Iron metabolism
2.2.2. Clinical features and pathology of iron overload
2.2.3. Iron overload disorders
2.2.3.1. Primary iron overload
2.2.3.2. Secondary iron overload
2.2.4. Mechanisms of iron toxicity
2.2.5. Iron and carcinogenesis
2.3. Aim
Chapter 3: Materials and Methods 3.1. Chemicals
3.2. Animals
3.3. Diets
Page
1
4
4
4
5
6
7
8
8
11
13
16
17
18
19
21
24
24
26
27
27
28
34
35
39
40
40
41
43

TABLE OF CONTENTS
II
3.4. Experimental design
3.4.1. Pre-weaning iron loading regimen
3.4.2. Pilot study on iron loading
3.4.3. Long-term FB1/Fe interactive study
3.5. Liver pathology
3.5.1. Light microscopy
3.5.2. Immunohistochemistry
3.5.2.1. Hepatocellular proliferation
3.5.2.2. Enzyme altered foci and/or nodules
3.6. Hepatic iron analysis
3.6.1. Biochemical measurement
3.6.2. Histological assessment
3.7. Assessment of lipid peroxidation
3.7.1. Homogenate preparation and incubation
3.7.2. Determination of thiobarbituric acid reacting substances
3.7.3. Determination of conjugated dienes
3.7.4. Determination of proteins
3.8. Statistics
Chapter 4: Results 4.1. Pilot study
4.1.1. Body weight and liver weight/body weight ratio
4.1.2. Liver pathology
4.1.2.1. Macroscopical pathology
4.1.2.2. Microscopical pathology
4.1.2.3. Hepatocellular proliferation
4.1.3. Hepatic iron analysis
4.1.3.1. Biochemical measurement
4.1.3.2. Histological assessment
4.1.4. Hepatic lipid peroxidation
4.2. Long-term study
4.2.1. Feed intake
44
44
44
45
48
48
49
49
49
50
50
50
51
51
51
52
52
53
55
55
55
60
60
60
61
62
62
64
66
69
69

TABLE OF CONTENTS
III
4.2.2. Body weight and body weight gain
4.2.3. Liver weight/body weight ratio
4.2.4. Haematological and biochemical parameters
4.2.5. Liver pathology
4.2.5.1. Macroscopical pathology
4.2.5.2. Microscopical pathology
. 4.2.5.3. Immunohistochemistry
4.2.5.3.1. Hepatocellular proliferation
4.2.5.3.2. Enzyme altered foci and/or nodules
4.2.6. Hepatic iron analysis
4.2.7. Hepatic lipid peroxidation
4.2.8. Rat sickness and termination
Chapter 5: Discussion Chapter 6: Summary
Chapter 7: Zusammenfassung Chapter 8: Bibliography
Appendix I. Dietary composition of AIN-93M
II. Method for biochemical hepatic iron measurement
III. Tables of data
Acknowledgements
Curriculum vitae
70
71
72
79
79
83
89
89
90
95
96
97
99
114
116
119
I
III
VII
XVI
XVIII

LIST OF ABBREVIATIONS
IV
List of abbreviations
2-AAF 2-acetylaminofluorene
ABC avidin-biotin-peroxidase complex
AFB1 aflatoxin B1
AIN-93M diet American Institute of Nutrition-93 Maintenance diet
ALP alkaline phosphatase
ALT alanine transaminase
Anti-BrdU monoclonal anti-5-bromo-2’-deoxy-uridine antibody
AST aspartate transaminase
ATP adenosine triphosphatase
BHT butylated hydroxytoluene
BrdU 5-bromo-2’-deoxy-uridine
BSA bovine serum albumin
BW body weight
CCl4 carbon tetrachloride
CD conjugated dienes
CMS chloroform-methanol-saline
ddH2O double distilled water
DEN N-nitroso diethylamine
DMT-1 divalent metal transporter
DNA deoxyribonucleic acid
EDTA ethylene diamine tetra-acetic acid disodium salt
ELEM equine leukoencephalomalacia
F344 Fisher 344 rat
FB1 fumonisin B1
FB2 fumonisin B2
FB3 fumonisin B3
FA1 fumonisin A1
FA2 fumonisin A2
Fe dietary carbonyl iron
GGT γ-glutamyl transpeptidase
GH genetic haemochromatosis

LIST OF ABBREVIATIONS
V
GSTP placental form of glutathione-S-transferase
GSTP+ glutathione-S-transferase positive
h hour
Hb haemoglobin
HBV hepatitis B virus
HCC hepatocellular carcinoma
HCT haematocrit = packed cell volume
HCV hepatitis C virus
HFE classical hereditary haemochromatosis gene
HPLC high performance liquid chromatography
H&E haematoxylin and eosin
Ig immunoglobulin
i.p. intraperitoneal
i.v. intravenous
Ireg transport protein for iron
IRP iron-regulatory protein
KCl potassium chloride
LDH lactate dehydrogenase
LW liver weight
LW/BW liver to body weight ratio
MDA malondialdehyde
MCH mean cell haemoglobin
MCHC mean cell haemoglobin concentration
MCV mean cell volume
MRC Medical Research Council NaOH sodium hydroxide
nd not determined
NTD neural tube defects
OC oesophageal cancer PbNO3 lead nitrate
PBS phosphate buffered saline
PCT porphyria cutanea tarda
PH partial hepatectomy
PL platelet count

LIST OF ABBREVIATIONS
VI
PPE porcine pulmonary edema syndrome
PROMEC Programme on Mycotoxins and Experimental
Carcinogenesis
RBC red blood cell count
RDW red blood cell distribution width
RE reticuloendothelial
Sa sphinganine
Sa/So ratio sphinganine to sphingosine ratio
SL sphingolipid
So sphingosine
STDEV standard deviation
T½ half-life
TBA 2-thiobarbituric acid
TBARS thiobarbituric acid reacting substances
tBWG total body weight gain
TCA trichloroacetic acid
TfR transferrin receptor
URO-D uroporphyrinogen decarboxylase
WBC white blood cell count

INTRODUCTION
1
Chapter 1 Introduction
Fumonisin B1 (FB1), a mycotoxin produced by the fungus Fusarium
verticillioides, is a natural contaminant of maize world-wide (Gelderblom et al.,
1988b; Sydenham et al., 1990; Marasas, 1996). It has been shown to cause a
variety of toxic effects in animals, including equine leukoencephalomalacia
(Marasas et al., 1988b; Kellerman et al., 1990; Ross et al., 1990, Wilson et al.,
1990) and porcine pulmonary oedema syndrome (Harrison et al., 1990; Ross et
al., 1990). Human dietary consumption of Fusarium-contaminated maize
products has been linked epidemiologically to increased rates of oesophageal
cancer in areas of the world where the staple diet consists of maize. In the
Transkei region of South Africa (Rheeder et al., 1992; Sydenham et al., 1990),
maize forms a major part of the diet and is also used to make traditional beer in
rural areas (Bothwell et al., 1964; Gordeuk et al., 1992).
FB1 is hepatotoxic and hepatocarcinogenic in rats (Gelderblom et al., 1996b).
The mycotoxin has been shown in short-term studies to cause progressive toxic
hepatitis characterised by hepatocellular necrosis, bile duct proliferation and
fibrosis (Gelderblom et al., 1988a). Long-term feeding has resulted in chronic
toxic hepatitis that progresses to cirrhosis, cholangiofibrosis, and eventually
hepatocellular carcinoma and cholangiocarcinoma (Gelderblom et al., 1991).
Both hepatocellular carcinoma (HCC) and iron overload are important health
problems in sub-Saharan Africa (Gordeuk et al., 1992). Chronic hepatitis B virus
(HBV) infection is recognised as a major risk factor for HCC; in addition,
patients with alcohol-or HBV-induced liver cirrhosis have an increased risk of
developing HCC in the presence of hepatic iron overload compared to those
with normal body iron stores (Deugnier et al., 1998; Deugnier and Loréal, 2000).
The role of hepatic iron overload in black Africans is not fully elucidated. It has
recently been proposed that African iron overload might also be risk factor for
HCC (Gangaidzo and Gordeuk, 1995; Mandishona et al., 1998). Certain African
populations appear to have a genetic predisposition to increased iron
absorption, which is augmented by an additional high dietary intake resulting

INTRODUCTION
2
from the home-brewing of traditional beer in iron pots (Gordeuk et al., 1992).
Extreme iron overload is ten times more common in sub-Saharan Africans than
in homozygous genetic haemochromatosis in Caucasians (Gordeuk, 1992).
HCC is an important complication of genetic haemochromatosis (GH), (Bacon
et al., 1999) and the occurrence of HCC in humans with iron overload has been
attributed to the progression from iron-induced cirrhosis (Niederau et al., 1985).
The direct role which iron plays in the development of HCC is, however, not
clear.
The FB1 mycotoxin could play a role in the development of human HCC in high
incidence areas of South Africa, possibly acting as a co-factor with other known
contributing factors such as a chronic HBV and HCV infection, excess hepatic
iron, and the carcinogenic mycotoxin aflatoxin B1 (AFB1). It has recently been
shown in rainbow trout and rats that synergism between AFB1 and FB1 could
contribute to the development of HCC (Carlson et al., 2001, Gelderblom et al.,
2002).
Iron could enhance the cytotoxic and oxidative effect of FB1 since both
substances induce free radical production and resulting cell membrane
damage. Hepatocytes exposed to FB1 are more susceptible to chemically
induced oxidative stress (Abel and Gelderblom, 1998). By inducing hepatocyte
regeneration (Stål et al., 1995), iron acts as a mitogen (Deugnier et al., 1992)
and the synergistic effect of iron in studies of cancer promotion can perhaps be
attributed to this mitostimulatory effect (Smith et al., 1990). Proliferating cells
also appear to be more sensitive to the toxic effects of fumonisins (Li et al.,
2000) and the mitotoxic effect of iron on hepatocytes could provide favourable
conditions for enhanced FB1 toxicity.
A pilot study was first conducted to establish a model of iron loading for the
subsequent long-term carcinogenesis study. By evaluating the effect of different
dietary iron levels on hepatic iron overload over time, and the effect of reducing
this dosage after 10 weeks, optimum conditions for iron loading in the absence
of adverse side effects could be determined.

INTRODUCTION
3
The aim of the long-term study was to examine the interaction between FB1 and
increased hepatic iron levels, utilising the stop model of chemical
carcinogenesis, and in particular determine whether excess iron could
potentiate the hepatocarcinogenic effects of FB1.
LITERATURE REVIEW
4
Chapter 2 Literature review
2.1. Toxicological effects of FB1 2.1.1. Introduction The discovery and characterisation of the fumonisin B (FB) mycotoxins was the
result of the dedicated work of the South African PROMEC Unit of the Medical
Research Council (MRC) in collaboration with the Veterinary Research Institute,
Onderstepoort, and the Council for Scientific and Industrial Research (CSIR),
Pretoria (Gelderblom et al., 1988a; Bezuidenhout et al., 1988). The fumonisins
are toxic secondary metabolites produced mainly by Fusarium verticillioides
(Sacc.) Nirenberg (Fusarium moniliforme Sheldon) as well as Fusarium
proliferatum (Marasas et al., 1984; Ross et al., 1990). F. verticillioides is a
common fungal contaminant of maize intended for human and animal
consumption world-wide (Marasas et al., 1984) and is prevalent in corn
screenings and commercial rations (Wilson et al., 1985b).
Fumonisins have been implicated in numerous diseases affecting domestic
animals such as horses and pigs (Haliburton et al., 1986). Long-term feeding of
FB1 in rats induces hepatocarcinogenic and nephrocarcinogenic effects in 2
different rats species. (Gelderblom et al., 1991, 2001c; Howard et al., 2001).
The fumonisins are epidemiologically linked to the high incidence of
oesophageal cancer (OC) in certain regions of the world where the staple diet
consists of maize (Kmet and Mahboubi, 1972; Hormozdiari et al., 1975;
Rheeder et al., 1992; Sydenham et al., 1990; Chu and Li, 1994). Recently,
attention has also been drawn to the high incident rate of neural tube defects
(NTD) in areas of high maize consumption, possibly due to fumonisin
contamination (Ncayiyana, 1986; Venter et al., 1995).
FB1 is not mutagenic in the Salmonella mutagenicity test (Gelderblom and
Snyman, 1991; Park et al., 1992), does not induce unscheduled DNA synthesis
in rat hepatocytes (Norred et al., 1992), and is generally regarded as a non-
genotoxic carcinogen (Gelderblom et al., 1992). A recent study indicated that

LITERATURE REVIEW
5
FB1 induces chromosomal aberrations in primary hepatocytes (Knasmuller et
al., 1996) while different in vitro and in vivo studies reported on the induction of
oxidative damage (Gelderblom et al., 2001a).
2.1.2. Chemical structure of the fumonisins
In total, 6 fumonisins have been isolated and characterised. Of these, fumonisin
B1-3 (FB1, FB2, and FB3) are the major fumonisins occurring naturally on maize,
while fumonisin B4 (FB4) and the N-acetyl derivatives fumonisins A1 (FA1) and
A2 (FA2) are produced in less significant levels. The fumonisins are diesters of
propane-1, 2,3-tricarboxylic acid and 2-amino-12, 16-polyhydroxy-icosanes. The
chemical structures of the 3 major fumonisins (FB1, FB2, and FB3) are illustrated
in Figure 2.1 (Bezuidenhout et al., 1988).
FB : R = OH; R = OHFB : R = H; R = OHFB : R = OH; R = H
1 1 2
2 1 2
3 1 2
20 18
19 17 11 9 7
8 6 4
26
25
21
16 15 14 12 1013
33
34 3536
37
38
22
5 32
1
28 29
27
CO H2
CO H2
CO H2
R1
NH2
OHR2O
O
O
O
CO H2
30
Fig 2.1. Structure of the 3 major fumonisins (FB1, fumonisin B1; FB2, fumonisin B2;
FB3, fumonisin B3).
Amongst the different analytical methods that have been used to determine the
fumonisins, high performance liquid chromatography (HPLC) has proven to be
most reproducible and sensitive, and is used by many laboratories (Shephard et
al., 1996a).

LITERATURE REVIEW
6
2.1.3. Biological activity and pathogenesis
Sydenham et al. (1993) suggested that the toxicological effects of FB1 result
from extremely low levels retained within the organism or by secondary
reactions initiated by the toxin. FB1 has been shown to be poorly absorbed from
the alimentary tract; it is cleared rapidly from circulation in plasma (half-life T½ =
20min) and is excreted primarily in faeces (90%), even after intravenous
administration (Shephard et al., 1992; Norred et al., 1993; Prelusky et al.,
1994). Small quantities are retained in liver and kidney and excreted via bile
and urine respectively.
FB1 bears considerable structural similarity to the long-chain (sphingoid) base
backbones of sphingolipids (SL). The compound is known to disrupt the de
novo pathway of sphingolipid biosynthesis by inhibiting the activity of
sphingosine N-acyltransferase (ceramide synthase) (Merrill et al., 1993b). This
in turn results in a reduction in the conversion of [3H] sphingosine (So) to [3H]
ceramide and an increased amount of sphinganine (Sa). Subsequently, the ratio
of free Sa to free So (Sa/So) in serum and tissues increases. This was found
when rats, ponies and pigs were exposed to fumonisins in their feed (Riley et
al., 1994).
Sphingolipids are thought to be involved in the regulation of cell growth,
differentiation, and neoplastic transformation through participation in cell-to-cell
communication, cell-substratum interactions, and possible interactions with cell
receptors and signalling systems (Hannun et al., 1986; Ballou et al., 1992;
Schroeder et al., 1994). Interference with these normal cell activities could be
the basis of the toxicity of FB1. Tolleson et al. (1999) suggested that
accumulation of excess Sa and depletion of ceramide or complex SL derived
from ceramide could be SL-dependant mechanisms for FB1-induced in vitro
apoptosis of cells. The most sensitive target organs would presumably be less
tolerant of sphingolipid dysregulation (Bucci and Howard, 1996b).
It has recently also been shown that other mechanisms of hepatotoxicity are
involved. These include effect of FB1 on lipid biosynthesis (Gelderblom et al,
1996a), fatty acid accumulation (Gelderblom et al, 1996a), and oxidative stress

LITERATURE REVIEW
7
(Abel and Gelderblom, 1998). Lipid peroxidation has been shown in cell
membrane preparations (Yin et al. 1998) and isolated rat liver nuclei (Sahu et
al., 1998) and in primary rat hepatocytes and rat liver in vivo (Abel and
Gelderblom, 1998). FB1 disrupts membrane structure and permeability through
elevation of the oxidation rate, free radical production, and lipid peroxidation
(Yin et al. 1998). In vitro studies have shown that lipid peroxidation is dose
dependant and corresponds to the cytotoxic effect of FB1 (Abel and
Gelderblom, 1998). However, it appears to be secondary to the FB1-induced
hepatoxicity. Cellular membranes consist largely of phospholipids, which
contain fatty acids (Horribin, 1990). Disruption of the phospholipid and n-6 fatty
acid metabolic pathways, occurring at low dietary levels of FB1, needs to be
further investigated, especially in regard to cancer promotion (Gelderblom et al.,
2001a).
2.1.4. Cancer initiation and promotion
Fumonisins are non-genotoxic, and appear to have weak cancer initiating
properties, but function mainly as tumour promoting agents (Gelderblom et al.,
1994). This was demonstrated in the short-term study by Gelderblom et al.,
(1988a) in which FB1 was also isolated. Studies based on the “resistant
hepatocyte” model developed in the liver by Solt and Farber (1976) have also
been conducted to show the cancer initiating and promoting potential of FB1
(Gelderblom et al., 1994). Carcinogenesis is a multi-step process, comprising of
initiation, promotion, and progression (Farber and Sarma, 1987). The resistant
hepatocyte model encompasses the induction of hepatocytes resistant to the
growth-inhibitory or toxic effects of certain carcinogens (for example, genotoxic
carcinogens induce this phenotype very rapidly). The stimulatory effect of cell
proliferation on cancer initiation was proposed by Cayama et al., (1978). During
cancer promotion, the outgrowth of the initiated cell is stimulated, while the
growth of normal hepatocytes is retarded (Farber, 1991). In the progression
phase, cell populations with a malignant phenotype and growth pattern are
established. In the case of FB1, the balance between the mitoinhibitory effect on
the proliferation of normal cells and the stimulation of hepatocyte regeneration
due to the hepatotoxicity will determine if cell proliferation will reach a critical
point to support the cancer initiating event. Gelderblom et al. (1994) showed

LITERATURE REVIEW
8
that 29.7 mg FB1/100g body weight (BW) for 21 days effected initiation. The
same dose for 7 days did not, suggesting that the inhibitory effect on cell
proliferation was dominant. Also, FB1 has been shown to induce apoptosis
(Lemmer et al., 1999), which is known to reduce the number of initiated cells
(Bursch et al., 1992). FB1 has been shown to effect cancer promotion at
relatively low doses (50mg/kg diet) without inducing excessive hepatotoxicity
(Gelderblom et al., 1996c). This mechanism can be attributed to the
mitoinhibitory effect of FB1 on normal hepatocytes presumably via the disruption
of different cell regulatory processes (Gelderblom et al., 1995).
2.1.5. Toxicity in animals
Comparative toxicity studies of culture material of F. verticillioides indicated that
the target organs vary in different animal species, whereas the liver and kidneys
seem to be constantly affected.
2.1.5.1. Rodents
Hepatotoxicity and carcinogenicity in rats and mice
In a chronic feeding study, freeze-dried corn cultures (batch MRC 826B) fed to
BD IX rats at different levels (2-4%) induced liver cancer in 80% and ductular
carcinoma in 63% of surviving rats after 450 days (Marasas et al., 1984). At a
lower dose of 0.5%, the same culture material produced neoplastic nodules,
ductular hyperplasia, cholangiocarcinomas, and metastasising hepatocellular
cancer (HCC) in 2 rats (Jaskiewicz et al., 1987). Unlike the first study, little
fibrosis was found. Basal cell hyperplasia was observed in the oesophagus of
12 of the 21 rats and oesophageal papilloma in 1 animal. Wilson et al. (1985a)
fed a corn-only diet (deficient in vitamins and lipotropes) to male Fisher 344
(F344) rats and induced nodules, adenofibrosis, and cholangiocarcinomas in
the liver after 4 to 6 months. The corn was naturally contaminated with
F. verticillioides and was associated with an ELEM outbreak.
After the isolation of FB1 by Gelderblom et al. in 1988 (a), many medium and
short-term studies were conducted with known levels of the toxin. FB1 has since
been demonstrated to be hepatotoxic and hepatocarcinogenic in rats
(Gelderblom, 1996b; Lemmer et al., 1999). Short-term studies induce the

LITERATURE REVIEW
9
proliferation of bile ductules, fibrosis, nodular regeneration, and hepatocellular
necrosis (Gelderblom et al., 1988a). Early findings also include small rounded,
eosinophilic hepatocytes with irregular chromatin, apoptosis, minimal
inflammatory reaction, necrotic cells, and an elevation in parameters such as
alanine transferase (ALT), aspartate transferase (AST), alkaline phosphatase
(ALP), lactate dehydrogenase (LDH), cholesterol, and triglycerides (Voss et al.,
2001). With time, an increase in apoptotic and necrotic cells, mitotic figures,
vacuolisation, cytomegaly, and pleomorphism is seen. Advanced lesions
include bile duct and oval cell proliferation, foci of cellular alteration,
cholangiomatous lesions, and fibrosis (Gelderblom et al., 1991). Hyperplastic
foci staining positively for gamma glutamyl transpeptidase (GGT) and the
placental form of glutathione S-transferase (GSTP) were also reported
(Gelderblom et al., 1988a, 1993, and 1996c). Apoptosis of proximal tubule
epithelial cells and the resultant cell proliferation in the kidneys have been
described, resulting in decreased kidney weights (Voss et al., 2001). An
increase in serum creatinine, and GGT, LDH, and protein in urine accompany
these lesions.
In a long-term study, male BD IX rats were fed FB1 at 50 mg FB1/kg diet
(Gelderblom et al., 1991). After 6 months, regenerative nodules and
cholangiofibrosis were seen. Between 18-26 months, the liver was
characterised by micro- and macronodular cirrhosis with large expansive
nodules of cholangiofibrosis. Within nodules, fatty changes, hyaline droplet
degeneration, necrosis and areas with a “ground-glass appearance” were seen
histologically. HCC was induced in 66% of the rats (metastasising in 4 rats), and
100% of the animals developed cholangiofibrosis. The kidneys showed diffuse
interstitial lymphocytic nephritis and mild glomerulonephritis.
In a chronic study of 24 months, low levels of FB1 (1, 10, 25mg/kg semi-purified
diet) were fed to BD IX rats (Gelderblom et al., 2001c). A dose response and
the existence of a threshold were thus demonstrated for the induction of
hepatocyte nodules. No HCCs or cholangiofibrotic lesions were seen between
18 and 24 months. At the high dose, major lesions included anisokaryosis,
neoplastic nodules, oval cell proliferation, bile duct hyperplasia, lobular

LITERATURE REVIEW
10
distortion, and portal fibrosis while all rats terminated at the end of the study
showed foci staining positively for GSTP (GSTP+). At the lower dose, lesser
lesions were described and at the lowest level of FB1 only mild toxic lesions
were seen.
In an additional long-term study, FB1 was fed to female and male F344 rats at
various concentrations over a 2-year period (Howard et al., 2001). Female rats
received 0, 5, 15, 50 and 100 ppm FB1 and no occurrence of tumours was noted
in any of the organs. Male rats fed 0, 5, 15, 50 and 150 ppm FB1 exhibited renal
tubule adenomas and carcinomas at the 50 and 150 ppm dose levels. Contrary
to other studies, no hepatic pathology was noted in either male or female rats.
In addition to liver and kidney toxicity, the immune system is also affected.
Bondy et al. (1995) described disseminated thymic necrosis, decreased thymic
weight and increased serum immunoglobulin M (IgM) concentrations.
Studies in mice have also shown the liver and kidneys to be the target organs,
though mice appear to be more resistant to nephrotoxic effects of FB1 than rats
(Voss et al., 1995). They show a similar liver pathology as in rats (Bucci et al.,
1998; Sharma et al., 1997; Bondy et al., 1997) and females were shown to be
more sensitive than males. In a chronic 2-year study, FB1 was fed to female and
male B6C3F1 mice at various concentrations (Howard et al., 2001). Female
mice were fed 0, 5, 15, 50, and 80 ppm FB1 and the incidence of hepatocellular
adenomas was increased at 50 and 80 ppm. Hepatocellular carcinomas were
also detected in the two high dose groups. FB1 did not enhance the incidence of
tumours (adenomas and carcinomas) in male mice.
FB1 does not cross the placenta (Voss et al., 1996) and is not teratogenic
(Collins et al., 1998), but may be embryotoxic at maternally toxic doses in mice
(Reddy et al., 1996).
Hamsters
The developmental toxicity of fumonisins was tested on pregnant Syrian
hamsters (Floss et al., 1994; Penner et al., 1998). At levels up to 18 mg FB1/kg,

LITERATURE REVIEW
11
foetal prenatal deaths and delayed foetal development increased in a dose
dependant manner, although no clinical signs were observed in the mother
animals.
2.1.5.2. Equines Equine leukoencephalomalacia (ELEM) is a non-contagious, acute, and highly
fatal neurological disease affecting horses, donkeys, and mules. It has been
referred to as the blind staggers, cerebritis, mouldy corn disease,
leukoencephalitis, corn stalk disease, and foraging disease (Wilson et al.,
1973). ELEM has been documented in various countries such as the USA
(Ross et al., 1990), Egypt (Wilson et al, 1971), South Africa (Kellerman et al,
1972), New Caledonia (Domenech et al, 1985), Argentina (Monina et al, 1981),
Brazil (Riet-Correa et al, 1982), and China (Iwanoff et al, 1957), to name a few.
Widespread outbreaks in the USA in 1989/1990 and in 1995 claimed the lives of
many horses (Ross et al., 1990; House et al., 1995). The disease has been
attributed to the consumption of mouldy corn since the beginning of this century
(Butler, 1902) and the causative agents were identified as fumonisin B1 and B2
(Marasas et al., 1988b) only 80 years later.
Equines are very sensitive to dietary fumonisin exposure, although differences
in susceptibility seem to exist (Schwarte et al., 1937; Wilson et al., 1992). The
factors that may be important in the appearance of clinical disease include
differences in individual resistance, length of exposure, level of contaminant,
previous exposure and possibly other conditions concurrently afflicting the
animal. Adults also appear to be more susceptible (Wilson et al, 1973). The
onset of clinical signs after exposure to the toxin varies from a few days to
several weeks (Kellerman et al., 1990). The pathognomonic finding is
liquefactive necrosis of the white matter of the cerebral hemispheres, though
the name is misleading as the grey matter can also be affected, including the
cerebellum, brain stem, and spinal cord (Iwanoff et al., 1957; Marasas et al.,
1988b). It was once suggested that, in an apparent dose dependent manner,
equines could either develop the neurotoxic form or hepatosis without
neurological symptoms and in some cases both symptoms simultaneously
(Marasas et al, 1976). In experimental cases of high doses given over short

LITERATURE REVIEW
12
periods of time, a hepatic syndrome manifested by icterus, systemic
haemorrhages, and oedema was the predominant outcome. Lower doses over
longer periods of time produced the classic form of ELEM with neurological
symptoms (Marasas et al., 1976). The diagnosis of ELEM is mostly based on
gross pathological and/or histological findings. Morbidity is generally 25%, and
although mortality usually approaches 100% (Diaz and Boermans, 1994),
animals can survive, often with residual neurological deficits (Caramelli et al.,
1993; Diaz and Boermans, 1994). Treatment, however, is limited to
symptomatic and supportive care aimed at minimising inflammation and self-
trauma (Wilkins et al., 1994). It has been suggested by the Mycotoxin
Committee of the American Association of Veterinary Laboratory Diagnosticians
that the level of FB1 in the feed should not exceed 5 ppm (Miller et al., 1996).
The pathogenesis of ELEM has not been completely elucidated. The
mycotoxins have not been shown to cross the blood brain barrier (Norred et al.,
1998). Thus the toxic effect following exposure to FB1 could be related to
secondary effects. Brain tissue is rich in SL, which are important structural
components of membranes (Norred et al., 1998), and Wang et al. (1992) have
demonstrated the inhibition of SL biosynthesis in ponies fed diets containing 15-
44 µg FB1/g feed. Inhibition of brain ceramide synthase by fumonisins, and
resultant depletion of SL and increase of cytotoxic Sa and So could be
hypothesised to lead to the necrosis. The subsequent elevation of the SL
biomarkers in serum also precedes elevation of any other clinical chemistry,
especially liver enzymes (Wang et al., 1992; Yoo et al., 1992). However, it has
also been demonstrated in a study in which horses consumed FB1
contaminated feed that the brains of horses, with and without pathological
lesions, did not have altered Sa/So ratios, although many other tissues did
(Goel et al., 1996). The lesion is grossly similar to that observed after cerebral
haemorrhage, suggesting a vascular origin rather than a direct toxic effect on
brain tissues (Wilson et al., 1973; Norred et al., 1998). Regions of
leukoencephalomalacia (degeneration of the white tissue) are near edges of
blood vessels and these areas are strongly infiltrated by inflammatory cells
(Xavier et al., 1991). The disruption in the microcirculation of the white matter
could result in oedema (Wilkins et al., 1994). Constable et al. (2000) has shown

LITERATURE REVIEW
13
that fumonisin-induced pulmonary oedema in pigs could be due to sphingosine-
mediated calcium-channel blockade of the heart and blood vessels. It has thus
been proposed that the pathophysiology of ELEM is also related to
cardiovascular dysfunction and ELEM perhaps results from an inability to
appropriately regulate blood brain flow as the horse lowers its head to eat and
drink.
2.1.5.3. Pigs In a comparative study by Kriek et al. (1981), culture material of F. verticillioides
MRC 826 on autoclaved maize was fed to various animals including pigs. Three
doses of 5 g/kg BW were administered and 2 pigs died within 6 days from
severe pulmonary oedema. As equine leukoencephalomalacia was also
induced with the same culture material, it was suspected that the metabolite
causing ELEM and pulmonary oedema would be the same. In 1989, numerous
outbreaks of pulmonary oedema and hydrothorax were documented in swine in
the USA, concurrently to ELEM outbreaks in horses (Harrison et al., 1990;
Osweiler et al., 1992). The disease was linked to the consumption of maize
screenings contaminated with F. verticillioides and the lesions were identical to
those in the study conducted by Kriek et al. (1981). Clinical symptoms subsided
within a day after removal of the contaminated feed. The affliction received the
name “porcine pulmonary edema syndrome” (PPE) (Ross et al., 1990) and it is
suspected that the disease has been documented since the 1950’s in Hungary,
where it is known as “fattening or unique pulmonary edema of pigs” (Fazekas et
al., 1998).
Subsequently, the syndrome was induced experimentally with maize screenings
implicated in the 1989 outbreaks (Harrison et al., 1990; Osweiler et al., 1992;
Haschek et al., 1992). Pure FB1 injected intravenously at a dose of 0.4 mg/kg
BW/day (d) for 4 days also effected PPE (Harrison et al., 1990). This, however,
could not be reproduced in two other studies (Osweiler et al., 1992; Haschek et
al., 1992), while PPE has also not been reproduced experimentally by the oral
administration of purified FB1.

LITERATURE REVIEW
14
Onset of clinical signs can be very abrupt and include intense respiratory
distress, decreased heart rate, apathy, cyanosis in the skin and mucous
membranes, and recumbency (Osweiler et al., 1992; Smith et al., 1999).
Vomiting and diarrhoea have also been reported and recently haemodynamic
changes have been measured indicating cardiovascular injury preceding the
development of pulmonary oedema (Colvin et al., 1993; Smith et al., 1996 a, b;
Gumprecht et al., 1998; Smith et al., 1999; Constable et al., 2000; Smith et al.,
2000). Some animals have died before showing any signs. Pigs develop PPE
within 4 to 7 days of consumption of feed containing culture material (with
fumonisin at levels of >91 ppm or >15 mg/kg BW/d), and within 7 days of daily
intravenous doses of FB1 (Harrison et al., 1990; Haschek et al., 1992; Colvin et
al., 1993; Motelin et al., 1994; Gumprecht et al., 1998). Abortions have also
been observed after feeding with maize screenings (Harrison et al., 1990). This
has, however, not been linked experimentally with fumonisin B1. It has recently
been shown that FB1 can cause damage to foetuses in utero (Zomborszky-
Kovacs et al., 2000). Pulmonary oedema and pathological as well as
biochemical changes indicative of liver damage were found in piglets
immediately following parturition.
Gross pathologically and histopathologically, an accumulation of clear straw-
coloured fluid that clotted upon opening the thorax, and interstitial and
interlobular oedema have been found. Accumulation of membranous material
(multilamellar bodies) in pulmonary intravascular macrophages in pigs with
pulmonary oedema has also been described. FB1 has also been shown to
induce liver injury. Acute changes include disorganisation of hepatic cords,
hepatocellular vacuolation, megalocytosis, apoptosis, necrosis, and cell
proliferation (Harrison et al., 1990; Haschek et al., 1992; Osweiler et al., 1992;
Colvin et al., 1993; Motelin et al., 1994; Gumprecht et al., 1998). Accumulation
of membranous material (multilamellar bodies) within hepatocytes and Kupffer
cells has also been found (Haschek et al., 1992). In chronic studies early
“perilobular fibrosis”, hepatocellular necrosis and nodular hyperplasia is
characteristic (Colvin & Harrison, 1992; Casteel et al., 1993; Colvin et al., 1993).
Liver pathology has only been found in pigs that survived experimentally

LITERATURE REVIEW
15
induced PPE (Colvin & Harrison, 1992; Haschek et al. 1992; Osweiler et al.,
1992; Casteel et al., 1993; Colvin et al., 1993; Motelin et al., 1994).
Pancreatic lesions, hyperplastic oesophageal plaques, gastric ulceration,
hypertrophy of the heart and medial hypertrophy of the pulmonary arteries have
also been reported (Harrison et al., 1990; Casteel et al., 1993; Casteel et al.,
1994; Guzman et al., 1997). In a study conducted by Motelin et al., (1994) using
maize screenings containing FB1 and FB2 at varying levels, a dose related
increase in the serum biochemical parameters ALP, AST, GGT, bilirubin and
cholesterol was reported. Haematological values of fumonisin-fed pigs remain
within normal limits (Motelin et al., 1994; Rotter et al., 1996).
Levels as low as 5 ppm in the feed have resulted in elevations of the Sa/So
ratio (Motelin et al., 1994; Riley et al., 1993) which has led to the
recommendation by the Mycotoxin Committee of the American Association of
Veterinary Laboratory Diagnosticians that the level of FB1 in the feed should not
exceed 10 ppm (Miller et al., 1996).
In chronic toxicity studies, in addition to hepatotoxicosis, lesions in the
oesophageal mucosa and decreases in cardiac output were described (Casteel
et al., 1993). Casteel et al. (1994) also found medial pulmonary arterial
hypertrophy indicative of hypertension. Reduced body weight gain and immuno-
suppressive effects resulting from chronic exposure to fumonisin contaminated
feed is one of the principal concerns from an economical point of view
(USDA/APHIS Veterinary Services Fact Sheet, 1995; Rotter et al., 1996; Smith
et al., 1996; Gumprecht et al., 1998). It has been shown that fumonisin residues
accumulate in liver and kidneys when fed over extended periods, thus low
concentrations are proved to be toxic (Prelusky et al., 1996).
It has recently been hypothesised that PPE in pigs is due to fumonisin induced
cardio-vascular impediments (Smith et al., 2000). Pigs treated with 20 mg/kg
BW/d for 3 days had lower cardiac outputs and heart rates and showed a
marked reduction in cardiac contractility. This decreased cardiac contractility
results in an increase in pulmonary artery wedge pressure and subsequent

LITERATURE REVIEW
16
pulmonary oedema (Haschek et al., 2001). These cardio-vascular effects are
consistent with sphingosine mediated L-type Ca2+ channel blockade. Pulmonary
oedema in pigs that consumed fumonisin is thus primarily due to acute left
sided heart failure instead of increased vascular permeability as inhibition of
cardiac function occurs without alteration in alveolar/capillary membrane
permeability (Constable et al., 2000; Haschek et al., 2001).
2.1.5.4. Non-human primates
Studies with primates were first conducted on baboons (Kriek et al., 1981).
Culture material of the F. verticillioides strain MRC 602 was fed for 5 months to
2 years at varying dietary concentrations. One animal developed acute
congestive heart failure and in another, liver cirrhosis was the principle lesion.
Various amounts of culture material of F. verticillioides strain MRC 826 were fed
to vervet monkeys (Cercopithecus pygerythrus) in a long-term study over a
period of 13.5 years using a low fat carbohydrate diet. The fungal isolate was
obtained from home-grown maize in an area in Transkei, South Africa, with a
high rate of human OC. Jaskiewicz et al. (1987) reported the first results
obtained after 180 days. Acute, sub-acute and chronic toxic hepatitis of various
degrees was induced in all experimental monkeys, demonstrating close
similarity with human viral hepatitis. Disturbance of the trabecular structure,
degeneration and necrosis of hepatocytes, mononuclear infiltration and cirrhosis
in severe cases were seen. Elevation of serum liver enzymes was also
observed.
Fincham et al. (1992) demonstrated an atherogenic effect of F. verticillioides in
the vervet monkeys of the same experiment. The dietary level of less than 0.5%
w/w of culture material of strain MRC 826 corresponded to the contamination of
a human diet. The finding included an atherogenic plasma lipid profile,
increased plasma fibrinogen, and activity of blood coagulation factor VII, which
could enhance atherogenesis. It was hypothesised that these alterations were
secondary to chronic hepatotoxicity characterised by liver fibrosis and elevated
cholesterol, albumin and serum enzymes AST, ALT, LDH, GGT and ALP.

LITERATURE REVIEW
17
At the termination of the 13.5-year study, the results indicated active chronic
toxic hepatitis, as seen histopathologically and in elevated liver function
enzymes (Gelderblom et al., 2001d). In addition, cholesterol and total bilirubin
were increased. The kidneys were also affected resulting in an increase in
serum urea, creatinine, and creatine kinase. A significant decrease in blood
parameters such as white and red blood cells was also observed.
In this same long-term study, it was shown that FB1 disrupts sphingoid
metabolism (Shephard et al., 1996b; van der Westhuizen et al., 2001) and the
serum Sa/So ratio (van der Westhuizen et al., 2001). It was also shown that the
accumulation of the fumonisins in the hair of the vervet monkeys could be used
to assess fumonisin exposure (Sewram et al., 2001).
2.1.5.5. Poultry
The effect of fumonisins and fumonisin-containing F. verticillioides culture
material has been investigated in chickens, ducklings, and turkey poults. Similar
results were found in short-term studies on the various species. In a dose
response fashion, levels between 75 and 400 mg FB1/kg feed resulted in a
reduction in feed intake, weight gain and feed conversion (Brown et al., 1992;
Ledoux et al., 1992; Weibking et al., 1993a; Bermudez et al., 1995). In addition
Ledoux et al. (1992) reported diarrhoea and rickets. An increase in the weights
of organs such as the liver, kidney, proventriculus, and pancreas was also
documented (Brown et al., 1992; Ledoux et al., 1992; Weibking et al., 1993a, b;
Bermudez et al., 1995). Histopathologically, lesions including hepatic necrosis,
biliary hyperplasia, thymic cortical atrophy, and widening of the proliferating
cartilage zone in the proximal tibiotarsal epiphyses have been described. Serum
calcium, cholesterol and AST were reportedly elevated at higher levels of
fumonisin (Ledoux et al., 1992; Weibking et al., 1993a). In addition, culture
material containing levels of 75 mg FB1/kg feed has been shown to increase Sa
and Sa/So ratios in young chicks (Weibking et al., 1993a). Chronic studies
involving feeding turkey poults 75 mg FB1/kg feed for 18 weeks also showed a
decrease in weight gain, increased liver weights, and also an increase in total
white blood cell count, absolute heterophil count, absolute lymphocyte count,

LITERATURE REVIEW
18
and heterophil:lymphocyte ratio (Bermudez et al., 1996). These FB1 levels did
not result in mortality.
In the various studies, high dietary levels of fumonisins were used to show a
toxic effect on poultry. Levels lower than 80 mg/kg feed have been shown not to
result in changes of parameters such as body weight, feed efficiency, or water
consumption. (Henry et al., 2000). In one recent study, however, levels as low
as 5 mg FB1/kg feed/d for 12 days resulted in liver alterations in ducks (Bailly et
al., 2001). In general, though, poultry appear to be relatively resistant to FB1. As
high concentrations do not necessarily reflect contamination levels and
consumption by average birds, the significance for the poultry industry can be
deemed low (Pittet et al., 1992; Diaz and Boermans, 1994).
2.1.5.6. Ruminants
Ruminants appear to possess a lower susceptibility to fumonisins occurring
naturally in feed than horses and pigs. In a feeding study of up to 148 ppm FB1
for 31 days, no effect on weight gain or feed intake was observed, but
impairment of liver and to some extent immune function was described
(Osweiler et al., 1993). Administration of 1 mg FB1/kg/d intravenously to milk-
fed calves for 7 days resulted in lethargy and a reduction in appetite (Mathur et
al., 2001). Biochemical parameters were assessed and showed indications of
liver and renal damage. Pathological lesions in the liver included disorganised
hepatic cords, varying severity of hepatocyte apoptosis, hepatocyte
proliferation, and proliferation of bile ductular cells. Kidney alterations were
characterised by vacuolar change, apoptosis, karyomegaly, and proliferation of
proximal renal tubular cells, as well as dilation of proximal renal tubules. Serum
Sa concentrations were also shown to be increased. Cardiovascular changes
such as those seen in pigs were not found.
Studies with angora goats have also been conducted (Gurung et al., 1998). At
levels of 95 mg FB1/kg for 112 days, no clinical signs were documented.
However, in addition to an elevated Sa/So ratio in tissue, a time dependant
increase in levels of AST, LDH, GGT, cholesterol and triglycerides showing
evidence of mild liver damage and kidney dysfunction were observed.

LITERATURE REVIEW
19
Acute “nephrosis” and “hepatosis” in sheep fed F. verticillioides culture material
were recorded in a comparative study performed by Kriek et al. (1981). Two
sheep administered culture material via a rumen fistula died after 8 doses at 5
g/kg over 10 days (total dose 1920g) and 11 doses over 12 days, respectively.
The results were confirmed in 1995 in lambs dosed intraruminally with F.
verticillioides culture material (Edrington et al., 1995). Fifteen lambs were dosed
up to 45 mg FB1/kg BW total fumonisins for 4 days and terminated on day 11. In
this study, feed intake decreased and biochemical parameters were again
indicative of liver and kidney damage. Histologically tubular nephrosis and mild
hepatopathy was described. The lambs receiving the highest dose died before
termination.
A white tailed deer showing neurological symptoms similar to those of ELEM
were described in a case in the United States in 1989 (Howerth et al., 1989).
The animal had apparently eaten mouldy maize contaminated with F.
verticillioides. This is the only case of ELEM symptoms documented in
ruminants.
In a study where FB1 was incubated in ruminal fluid for 72 hours (1 mg/l), it was
shown that it is poorly metabolised in the rumen (Caloni et al., 2000). FB1 was
not detectable in milk in cows fed an average of 3 mg FB1/kg BW/d for 14 days,
and thus milk does not seem to pose a hazard for human consumption (Richard
et al., 1996).
2.1.5.7. Other animals
Rabbits appear to be very sensitive to the toxic effects of purified FB1 and
kidneys, liver and brain have been demonstrated to be the target organs.
Multiple intravenous doses of up to 1 mg/kg BW/d for 4 or 5 days caused
rabbits to be lethargic and anorectic, and clinical chemistry parameters
corresponding to liver and kidney injury and Sa/So ratio in tissues were
increased (Gumprecht et al., 1995). However, a single dose of 1.25 mg/kg
apparently induces only kidney damage. Histopathologically, the toxicity
manifests itself as severe proximal tubular necrosis and mild necrosis,
hepatocyte vacuolation, and bile stasis. Doses at levels from 0.5-1.75 mg

LITERATURE REVIEW
20
FB1/kg/d have been shown to be lethal for adult pregnant rabbits (Bucci et al.,
1996a; LaBorde et al., 1997). FB1 did not cross the placenta and was not
embryotoxic (LaBorde et al., 1997). Two animals that died after a gavage of
1.75 mg/kg/d for respectively 9 and 11 days showed leukoencephalomalacia
and haemorrhage in the brain (Bucci et al., 1996).
In the 1960’s, aflatoxin B1 (AFB1) was shown to cause liver cancer in trout
(Halver, 1968). To determine the toxicity of the newly discovered mycotoxin
FB1, feeding studies with F. verticillioides culture material containing known
levels of FB1 subsequently were done on channel catfish, Ictalurus punctatus
(Brown et al., 1994; Lumlertdacha et al., 1995). It was shown that levels of 20
mg/kg and higher are hepatotoxic to year-1 and year-2 channel fish. Carlson et
al. (2001) also reported the promoting effects of FB1 on AFB1 initiated liver
tumours. Without a known initiator however, FB1 at levels up to 104 ppm for 34
weeks did not induce any tumours.
Diets containing F. verticillioides culture material contaminated with FB1, FB2,
and FB3 have also been fed to adult female minks (Restum et al., 1995). The
minks in the treatment group were lethargic and clinical chemistry parameters
were altered. No other clinical signs or histopathological lesions were
determined. A further study was conducted to determine the effect of dietary
fumonisins on the reproductive performance (Powell et al., 1996) of adult
female minks. It was shown that the breeding behaviour was not affected, but
minks receiving fumonisin had smaller litter sizes, the number of stillborn kits
was higher, and the kits had reduced body weights at birth. Hepatocyte
vacuolation and alterations in clinical parameters were also noted in the
mothers. Fumonisin content in the milk was detected to be 0.7% of the dietary
FB1 concentration, which however did not have an affect on the survival rate of
the kits. A similar study also reportedly documented increased free Sa, So and
the Sa/So ratio in the urine in mink (Morgan et al., 1997).

LITERATURE REVIEW
21
2.1.6. Toxicity in humans
Oesophagus
The National Cancer Registry of South Africa has reported oesophageal cancer
(OC) to be the most common cause of cancer deaths in black males in South
Africa, and the third most common in black females (Sitas et al., 1997). The rate
of OC in both sexes in the southern Transkei is the highest in the world, while
the frequency in the northern Transkei is comparably low (Jaskiewicz et al.,
1987; Makaula et al., 1996). The southern Transkei is an ecological zone that
provides ideal conditions for infection of corn ears by F. verticillioides and
subsequent fumonisin production (Marasas et al., 2001). Home-grown maize is
the major dietary staple in southern Africa and is also used in home-brewed
beer in the Transkei (Van Rensburg, 1981; Cook, 1971; Marasas et al., 1988a).
F. verticillioides has been shown to be the most prevalent fungus on maize in
the area with highest incidence of OC (Marasas et al., 1981) and the correlation
between OC and fumonisins has also been established (Sydenham et al.,
1990).
Many factors have been implicated in the development of OC. Alcohol and
tobacco smoking are risk factors in OC (Blot, 1994); however a correlation has
not been established in the Transkei (Rose, 1973; Sammon et al., 1992).
Deficiencies in vitamin A, vitamin B12, vitamin E, selenium, and folic acid were
determined in persons from the high incidence area in the Transkei, compared
to the low incidence region (Van Helden et al., 1987 Jaskiewicz et al., 1988a).
However, levels of zinc, copper, and magnesium were not different between the
two population groups. Deficiencies in these nutrients as well as manganese
and molybdenum play a role in the development of OC (Van Rensburg, 1985).
Exposure to other mycotoxins poses a risk for certain cancers such as OC and
liver cancer. Such mycotoxins include AFB1, the mutagen fusarin C
(Gelderblom et al., 1984), and other metabolites produced by F. verticillioides
(Bever et al., 2000). Conflicting data has been presented in regard to the risk of
the consumption of traditional beer. Sammon et al. (1992) found that the beer
did not play a role in the aetiology of OC in the Transkei, while Segal et al.
(1988) reported it to be a major risk factor in Soweto, South Africa.

LITERATURE REVIEW
22
High incident rates of OC have been reported in other areas of the world such
as the Linxian County of Henan Province in northern China (Li et al., 1980;
Yang, 1980), and the Caspian littoral of Iran (Kmet and Mahboubi, 1972;
Hormozdiari et al., 1975). High levels of fumonisin contamination were found in
the Linxian County (Chu and Li., 1994), where maize is a large part of the staple
diet (Li et al., 1980; Yang, 1980; Zhen, 1984). Fumonisin contamination has
been determined in other high incidence areas for OC such as Zimbabwe
(Sydenham et al., 1993), the Pordenone Province, Italy (Pascale et al., 1995),
and Charleston, South Carolina, USA (Sydenham et al., 1991) where maize is
also consumed in high quantities (Rossi et al., 1982; Franceschi et al., 1990;
Brown et al., 1988).
A role of fumonisin in the aetiology of OC has however not been conclusively
demonstrated and there is thus far no evidence that fumonisins initiate or
promote OC in animals. There is also no epidemiological evidence of cancer
being linked to fumonisin consumption in animals.
Neural tube Recent in-vitro studies have shown that FB1 blocks cellular uptake of folate, an
important vitamin for cellular physiology (Stevens and Tang, 1997; Wolf, 1998).
Folate is also essential in the early stages of pregnancy for organogenesis
(Lucock et al., 1998). Recently, the adverse effect of FB1 on folate uptake by
exposure to dietary FB1 has been implicated in the development of NTD. High
rates in blacks in the Transkei region of the Eastern Cape Province, South
Africa, have been documented (Ncayiyana, 1986; Venter et al., 1995) and
shown to be 5-10 times higher than those residing in Cape Town (Cornell et al.,
1983). A number of cases were reported in southern Texas in 1990/1991
(Hendricks, 1999) and in the Hebei Province of China (Moore et al., 1997).
These are all areas where high quantities of maize are consumed and where
high levels of fumonisins have been determined (Sydenham et al., 1990;
Sydenham et al., 1991; Chu and Li., 1994).

LITERATURE REVIEW
23
Liver Studies on the possible role of fumonisins in HCC were conducted in China
(Ueno et al., 1997). It was demonstrated that in areas of a high incidence of
HCC, higher levels of FB1 contamination were also found. This correlation has
not been found in the Transkei however (Makaula et al., 1996). It has been
shown in animal studies that synergism between AFB1 and FB1 could contribute
to the development of HCC. This has been reported in hepatocarcinogenesis
studies in rainbow trout and rats (Carlson et al., 2001; Gelderblom et al., 2002)
and the findings in animal models, and in the Chinese study, raise the possibility
that FB1 may be a factor in human HCC.

LITERATURE REVIEW
24
2.2. Dietary iron overload 2.2.1. Iron metabolism
Iron is an essential component of haemoglobin, myoglobin, and many enzymes
in the body and thus an important nutrient in a well-balanced diet (Andrews,
1999). An adult can absorb approximately 1-2 mg of dietary iron each day.
Ferric iron is enzymatically reduced in the proximal small intestine to ferrous
iron by ferrireductase (Riedel et al., 1995). The divalent metal transporter 1
(DMT-1) enables this iron to be transported into the enterocytes of the villus tips
of the duodenum, which is the site of major iron absorption (Gunshin et al.,
1997). The mechanism by which haeme iron (primarily found in meats) is
absorbed is not entirely elucidated (Andrews, 1999). In the enterocytes, iron is
then oxidised again to ferric iron by hephaestin and either stored in the
enterocyte as ferritin, the major storage form of iron, or transported into the
circulation by the transport protein Ireg1 (Vulpe et al., 1999; McKie et al., 2000).
In serum, the absorbed ferric iron is bound to transferrin, a molecule that can
bind 2 molecules of the oxidised form of iron (Rouault and Klausner, 1997).
Usually a third of the circulating transferrin molecules are occupied with iron.
The diferric transferrin then binds to a transferrin receptor (TfR) on the cellular
plasma membranes of peripheral cells and endocytosis of TfR-transferrin
complex takes place. Two types of TfR’s have been identified (Kawabata et al.,
1999). After acidification, ferric iron is released from the complex and
transported into the cytoplasm by DMT-1. Iron is then available for metabolism
or for storage as ferritin, and the apo-transferrin is released to bind ferric iron.
The intestinal absorption of iron is controlled by a variety of factors; for example,
high dietary intake of iron is self-limiting, as the enterocytes eventually stop
absorbing iron due to high intra-cellular levels (Andrews, 1999). The expression
of TfR on the cell membrane is regulated by 2 iron-regulatory proteins (IRPs),
which in turn are modulated by the level of iron in the cell (Rouault and
Klausner, 1997; Harford and Klausner, 1990; Addess et al., 1997; Kim et al.,
1995; Iwai et al., 1998). Iron deficiency increases expression of TfR and thus
increases iron-uptake and reduces iron storage. Absorption mechanisms also
respond to existing body stores and to erythropoiesis (Finch, 1994). The
classical genetic haemochromatosis gene (HFE) encodes the protein expressed

LITERATURE REVIEW
25
in the deep crypt cells of the duodenum, the precursor cells to the enterocytes
(Feder et al., 1996). This protein has been shown to be closely associated with
TfR at the plasma membrane and regulates the uptake of diferric transferrin in
the enterocytes in response to information received by the crypt cells about total
body iron stores and the erythrocyte production of the body.
The hepatocytes and the macrophages of the reticuloendothelial (RE) system
are the main cells that store iron (Brittenham, 1994; Baker and Morgan, 1994).
Iron exceeding the binding capacity of transferrin is taken up by hepatocytes
after transport through the portal system and stored as ferritin. Iron deposition is
found first in the periportal hepatocytes (zone 1). With increasing iron storage,
deposits will also be found in hepatocytes in zones 2 (mid-zonal region) and 3
(perivenular region). Haemosiderin, brown granules visible in haematoxylin and
eosin (H&E) stained sections by light microscopy, develops once the capacity
for storage of ferritin is surpassed. Iron is utilised mainly in the bone marrow,
where it is essential for haeme biosynthesis; haeme is then incorporated into
the erythrocytes. RE cells recycle haeme iron by uptake of old erythrocytes and
the iron is either stored or released into circulation for re-use (Andrews, 1999).
After absorption into the body, major excretion of excess iron is not
physiologically possible, which emphasises the importance of intestinal
regulation of iron homeostasis (Andrews, 1999). A healthy adult will not absorb
excess dietary iron. An adult excretes approximately 1-2 mg of dietary iron each
day, the same amount as absorbed from the diet. The enterocytes storing iron
as ferritin are eventually sloughed into the lumen and excreted via the gastro-
intestinal tract. Menstruating women also physiologically excrete iron; when
blood loss is excessive, iron deficiency anaemia occurs. In addition, skin cell
loss and sweating contribute to iron loss, and some iron is also excreted in urine
(Bothwell et al., 1979). Iron is also lost during pregnancy, childbirth, and
lactation.
There are various methods of assessing iron body stores: measurement of
serum ferritin and transferrin saturation; chelation tests using desferrioxamine-
induced urinary iron excretion; a liver biopsy with histological grading and/or

LITERATURE REVIEW
26
biochemical measurement of hepatic the iron concentration (Powell et al.,
1994).
2.2.2. Clinical features and pathology of iron overload
Various clinical symptoms and signs occur as a result of iron overload.
Depending on the aetiology and degree of iron overload, one can see skin
pigmentation, diabetes mellitus, heart failure, hypogonadism and cirrhosis of the
liver (Britton et al., 1994). In advanced cases, cardiomyopathy and liver failure
can be the cause of death. Men usually develop symptoms earlier than women,
who physiologically lose iron via menstruation and pregnancy (Tavill and Bacon,
1990).
Perls’ Prussian blue staining is used to illustrate iron distribution and deposition
in the parenchyma cells of the affected liver (Britton et al., 1994). Distribution
varies, depending on the underlying disorder. In genetic haemochromatosis
(GH), deposits are initially seen in hepatocytes in zone 1, the periportal region
of the liver, with progressive loading of other hepatocytes throughout the liver
lobule (Deugnier et al., 1992). Thus, a gradient extending from zone 1 to zone 3
(perivenular) with maximum deposition in zone 1 develops with increased
severity of iron loading. Kupffer cell and portal tract macrophage deposition
increases gradually. In other disorders, such as transfusional iron overload,
deposition is seen mainly in the macrophages of the RE system (Britton et al.,
1994). The most prominent storage form of iron is called haemosiderin, which is
seen as tiny granules in the hepatocyte. Haemosiderin can also be seen as
brown pigment in the H&E staining.
At high levels of hepatic iron, other histological findings include hepatic fibrosis,
cirrhosis and hepatocellular carcinoma (HCC) (Niederau et al., 1985; Britton et
al., 1994). Ramm et al. (1997) have correlated high hepatic iron levels in
patients with haemochromatosis with the activation of hepatic stellate cells.
Activated stellate cells have been shown experimentally to increase collagen
production and the authors propose that iron-loaded hepatocytes directly or
indirectly stimulate collagen production. Initially, portal areas become expanded
with iron-loaded macrophages and collagenous tissue. Liver cirrhosis in

LITERATURE REVIEW
27
subjects with iron-overload can then be complicated by the development of
HCC. It has not been clarified if iron plays a direct role in inducing HCC, or if the
increased risk is based on the cirrhotic process (Stål et al., 1995).
2.2.3. Iron overload disorders
2.2.3.1. Primary iron overload
Genetic haemochromatosis Genetic haemochromatosis (GH) is a common, inherited primary iron overload
disorder due to mutations in HFE (Feder et al., 1996). The two most common
mutations associated with the HFE gene are the C282Y and H63D mutations
(Feder et al., 1996). The C282Y mutation occurs when tyrosine is substituted
for cysteine at amino acid 282, and the H63D mutation results from a
substitution of aspartate for histidine at amino acid 63. An average of 85% of
patients showing clinical signs for GH is homozygous for C282Y. A mutation in
the HFE gene influences the TfR-mediated uptake of iron and iron metabolism
is disrupted. This results in an abnormal increase in iron absorption in the
intestine and increased iron storage in the parenchymal cells of various organs,
primarily the liver, but also the heart and pancreas, among others (Sheldon et
al., 1935). The iron deposition eventually leads to organ failure. Iron overload
based on genetic defects will even take place on diet consisting of a normal
amount of iron.
The clinical presentation is usually late in adulthood, due to the time required for
iron to accumulate and subsequently cause tissue injury (Cartwright et al.,
1979; Niederau et al., 1996; Adams et al., 1997). The disease can present as
diabetes mellitus, cirrhosis, and increased skin pigmentation, as first described
by Trousseau in 1865. Further clinical features include hepatic dysfunction,
hypogonadism, hyperpigmentation, arthritis, cardiomyopathy, and/or fatigue
(Bacon et al., 1999). If left untreated, the liver of a GH patient can become
cirrhotic, and develop end-stage liver disease and hepatocellular carcinoma
(HCC). Investigations may reveal abnormal liver enzyme levels and
hyperglycaemia (due to destruction of β-islet cells in the pancreas).

LITERATURE REVIEW
28
The disease is most common in Caucasian populations, predominantly of
northern European descent (Smith et al., 1997). It is not found in African
populations (Merryweather-Clarke et al. 1997). Morbidity has not been reported
in persons under the age of 20 and men develop organ damage earlier than
women (Bacon et al., 1999).
Measurement of serum iron, transferrin saturation, or ferritin in association with
typical clinical symptoms is suggestive of GH (Bacon et al., 1999). This
diagnosis can be confirmed with the help of various other diagnostic methods:
1) family history; 2) abnormal iron studies; 3) histological grading of 3 or 4 for
iron on a liver biopsy; 4) hepatic iron concentration; 5) hepatic iron index (iron
concentration divided by age) of >1.9; and/or the more recent genotyping for
mutations in HFE (Feder et al., 1996; Barton et al., 1997; Bacon et al., 1999).
If diagnosed in the early stages of the disease, phlebotomy with subsequent
iron depletion is successful in managing GH (Niederau et al., 1999; Barton and
Bottomley, 2000). Phlebotomy can also prevent further complications resulting
from iron overload, but does not remove the risk of HCC in cirrhotic patients.
Dietary restrictions can be supportive. Conflicting data has been presented in
regard to the therapeutic effect of a liver transplant (Pillay et al., 1991; Kilpe et
al., 1993; Kowdley et al., 1995; Farrell et al., 1994).
2.2.3.2. Secondary iron overload
Dietary and parental iron overload Under normal circumstances, a healthy body will not absorb excess dietary iron.
Increased iron absorption occurs only in cases of extremely high availability
and/or underlying genetic factors resulting in a disruption of iron metabolism
(i.e. GH) (Pippard, 1994). A combination of high dietary intake and increased
absorption enhances the degree of iron overload at a young age.
Transfusions are life saving therapies used for various afflictions for example β-
thalassaemia (Pippard, 1994). As mentioned before, excretion of excess body
iron is insufficient, and repeated transfusions, containing 200-250 mg per unit of
blood, increase iron stores rapidly, even when stores are ample (Green et al.,

LITERATURE REVIEW
29
1968). Initial loading occurs in macrophages of the RE system, thus posing
minimal danger to organs (Andrews, 1999). When the capacity of the
macrophages has been exceeded, deposition in parenchymal cells takes place,
resulting in organ injury. Because of the underlying disorder, treatment does not
include phlebotomy, but rather chelation therapy with deferoxamine.
Chronic liver disease (i) Alcoholic liver disease
Excessive alcohol intake has been shown to increase iron deposits, resulting in
deposition that differs in amount and distribution from that resulting from GH
(Valerio et al., 1996). The iron is seen as coarse granules scattered through the
hepatocyte cytoplasm, and the hepatocytes that contain iron are randomly
distributed in the lobules. The amount of iron deposited is not excessive; the
hepatic iron concentration is not significantly elevated in cases of alcohol abuse
alone (Bassett et al., 1986; Summers et al., 1990). This contrasts with the
deposition of iron in periportal hepatocytes in early GH, the gradual progression
to involve all hepatocytes, and the pericanalicular predominance of iron within
the cells. Various mechanisms have been proposed for the excess iron
deposition in alcoholic liver disease, including iron found in the alcoholic
beverages and favourable conditions in the gastrointestinal tract for increased
intestinal iron absorption due to an increase in gastric acid secretion (Charlton et
al., 1964).
A high proportion of patients with clinically and biochemically diagnosed GH
have been reported to consume excessive alcohol; the alcohol is thought to
hasten the progression of the liver injury in such patients and thus contribute to
manifestation of clinical symptoms (Powell et al., 1994). In patients shown to
consume excessive amounts of alcohol and to have co-existent GH, alcohol can
contribute to organ injury by enhancing lipid peroxidation and collagen
biosynthesis, resulting in the premature onset of fibrosis and cirrhosis (Irving et
al., 1988). The combination of excessive alcohol consumption and GH often
results in an increase in iron deposits in Kupffer cells and portal tract
macrophages. This is thought to be due to release of iron from hepatocytes
injured during episodes of alcoholic hepatitis. Similar associations have also

LITERATURE REVIEW
30
been demonstrated with porphyria cutanea tarda, another iron loading disorder
(Powell et al., 1994).
(ii) Porphyria cutanea tarda
Porphyria cutanea tarda (PCT), the most common type of porphyria, is an iron
dependent skin disorder resulting in various symptoms such as fragile skin,
subepidermal bullae, scarring, and pigment deposition (Kappas et al., 1995).
PCT patients can present with liver disease, although cirrhosis is unusual
(Lefkowitch and Grossman, 1983). Abnormal liver enzyme values, ‘chronic
hepatitis’ seen histopathologically, and hepatic siderosis are alterations seen in
most clinically symptomatic patients (Lefkowitch and Grossman, 1983).
The pathogenesis is based on a decrease in the biological activity of
uroporphyrinogen decarboxylase (URO-D), an enzyme essential in the final
phase of the biosynthesis of haeme (De Verneuil et al., 1978). The enzyme is
present in the liver primarily, but also in erythrocytes. A reduction in enzyme
activity results in an accumulation of uroporphyrinogen and other porphyrinogen
substrates of URO-D, and in an increased oxidation of porphyrinogen to
porphyrin. Symptoms are caused by photosensitization in response to porphyrin
deposits in the skin (Kappas et al., 1995).
Iron is believed to play a role in this process though not directly in deactivating
URO-D; it is however required (De Verneuil et al., 1978; Elder et al., 1985; Elder
and Roberts, 1995). Iron overload can be determined in 60-70% of PCT cases
(Fargion et al., 1996) and clinical manifestation seems to appear secondary to
this and other factors (Sampietro et al., 1999). Clinical features can be triggered
by such elements as excess alcohol consumption, an increase in oestrogen
levels, viral infections (in particular the human deficiency and hepatitis viruses),
exposure to halogenated hydrocarbons or combination of two or more of these
factors (Lundvall et al., 1970; Haberman et al., 1975; Rocchi et al., 1986;
Fargion et al., 1992; Kappas et al., 1995). These exogenous factors influence
the accumulation of iron in the hepatocytes, which in turn enables PCT to
develop and become clinically manifest.

LITERATURE REVIEW
31
There are two types of PCT: sporadic, the most common form, accounts for
80% of the cases. The reduction in URO-D enzyme activity is restricted to the
hepatocytes (Garey et al., 1993). The less common type is familial, in which
case the disease in inherited as an autosomal dominant trait. The deactivation
of the enzyme occurs in both erythrocytes and the liver (Elder et al., 1985;
Garey et al., 1993). A high proportion of PCT patients are C282Y homozygous
(Roberts et al., 1997; Elder and Worwood, 1998). It is hypothesised that as with
other exogenous factors, mutations in HFE increase susceptibility to PCT due to
increased iron absorption.
Depletion of iron through phlebotomy is used in the treatment of the clinical
manifestation of PCT, even in cases without acute iron overload, which confirms
the role of iron dependent deactivation of URO-D (Kappas et al., 1995). After
iron depletion, skin lesions abate and urinary excretion of porphyrins is reduced
(Lundvall, 1971).
Haematological diseases Anaemia results from either abnormal production of erythrocytes or
haemoglobin, or depletion of existent red blood cells. Except in cases of blood
loss that leads to iron deficiency, anaemia automatically results in an increase
in body iron stores (Pippard, 1994).
Thalassaemia major is one example of an iron-loading anaemia (Pippard,
1994). This type of anaemia is caused by haemolysis resulting in release of
large amounts of iron into circulation. Thalassaemia major is the homozygous
form of β-thalassaemia and is an autosomal hereditary disease. Defective
globin synthesis leads to reduced haemoglobin production, which in turn results
in severe anaemia and iron overload. The disease becomes clinically apparent
at an early age and patients are usually transfusion dependent.
Hepatosplenomegaly is a common development, as also skeletal abnormalities.
If left untreated, patients die of cardiac dysfunction or cirrhosis, and few survive
past the age of 20, even with treatment: Bone marrow transplant is the only
possibility of a cure. Splenectomy can be helpful and chelating agents to
remove iron can be administered as a supporting therapy.

LITERATURE REVIEW
32
Sideroblastic anaemia is inherited or acquired, and develops due to defective
haeme production (Pippard, 1994). Iron cannot be utilised effectively and
accumulates in the mitochondria of developing erythrocytes, producing the
diagnostic “ring sideroblasts” (Bottomley, 1982). The inherited form is very rare,
and most common in males in childhood or adolescence. The acquired form is
more frequent and found more commonly in older patients. The anaemia can
remain stable for years; otherwise phlebotomy therapy can be commenced. In
more severe cases where blood transfusions are needed, additional chelation
therapy may be necessary.
Other haematological disorders resulting in iron-overload are, for example,
anaemia associated with chronic renal disorder, in which there is a reduced
production of the hormone erythropoietin and erythropoiesis is ineffective;
congenital dyserythropoietic anaemia; congenital red cell aplasia; adult
hypoplastic anaemia; and haemolytic anaemia.
Neonatal iron overload Neonatal iron overload is a rare disease of severe hepatic iron overload and
subsequent cirrhosis and liver failure affecting babies in the perinatal period
(Knisely, 1992). Iron deposits are also seen in the myocardium and pancreatic
acinar cells (Goldfischer et al., 1981; Blisard and Bartow, 1986). The affliction is
not associated with HFE mutations (Goldfischer et al., 1981) and the cause has
not been determined to be primary or secondary (Witzleben and Uri, 1970;
Hoogstraten et al., 1990). The only treatment is a liver transplant, which due to
technical reasons (the transplant must take place soon after birth), is not usually
successful (Rand et al., 1992; Lund et al., 1993; Sigurdsson et al., 1998).
Juvenile haemochromatosis Juvenile haemochromatosis is a rare iron disorder in persons age 15-30
characterised by a severe rate of iron overload resulting in liver and heart
disease (Kaltwasser et al., 1998). Patients die of heart failure before the age of
30. Juvenile haemochromatosis appears to be inherited, but it is not related to
mutations in the HFE gene, and the genetic cause remains unknown. The
disease has been well documented in several Italian families (Camaschella et

LITERATURE REVIEW
33
al., 1997) and it has been hypothesised that the underlying mechanism of iron
overload is the same as in GH (Andrews, 1999).
Sub-Saharan dietary iron overload African iron overload was first documented in 1929 and was originally called
Bantu siderosis (Bothwell et al., 1979; Gordeuk, 1992). Sub-Saharan iron
overload has since been described in various populations south of the Sahara
and can occur in up to 10% of the population in some rural communities
(Gordeuk, 1992). Extreme iron overload is 10 times more common in sub-
Saharan Africans than homozygous GH in Caucasian populations.
Until recently, it was believed that the high iron overload found in these
populations was due to the high bio-availability of the iron released during the
home-brewing of traditional beer made from maize in non-galvanised iron pots
(Bothwell et al., 1964; Gordeuk, 1992). The mean value for the total iron
concentration in the drink is 15.1 mg/dl (750 times higher than commercially
produced beer) and about one third of the iron in the beer is ferrous iron
(Pippard, 1994). However, studies have shown that only a small percentage of
drinkers develop iron overload, leading to the assumption that genetic factors
also play a role in the increased absorption of dietary iron (Gordeuk et al., 1986
Gordeuk et al., 1992; Moyo et al., 1997). These populations appear to have
predisposition to increased iron absorption, which is augmented by an
additional high dietary intake (Gordeuk et al., 1992). The hypothesis of genetic
transmission in African iron overload has recently been confirmed in a study
conducted by Moyo et al. (1998).
Hepatic iron overload can be mild to severe, with hepatic fibrosis and cirrhosis
occurring at high concentrations (Pippard, 1994). It has recently been proposed
that African iron overload might also be risk factor for HCC (Gangaidzo and
Gordeuk, 1995; Mandishona et al., 1998). Iron levels increase with age, with
women accumulating less iron. Other complications seen in cases of severe
iron overload without accompanying cirrhosis usually arise from secondary
deficiency in ascorbic acid. These include scurvy and osteoporosis, resulting in
fractures, attributed to oxidation of ascorbic acid and resulting in decreased

LITERATURE REVIEW
34
production of collagen and new bone (Seftel et al., 1966). Sub-Saharan iron
overload is occasionally linked to diabetes mellitus (Seftel et al., 1961), heart
failure, and oesophageal carcinoma (MacPhail et al., 1979).
Iron distribution in the liver differs from that seen in GH, but rather shows a
similarity to iron distribution in iron-loading anaemias, namely deposition in
Kupffer as well as parenchymal cells (Bothwell and Bradlow, 1960). The typical
zonal gradient from periportal to perivenular in GH is not seen (Gordeuk et al.,
1992).
A diagnosis is made based on a history of excessive consumption of traditional
beer in conjunction with clinical features such as hepatomegaly and
hyperpigmentation (Pippard, 1994). High serum iron and ferritin levels, and also
transferrin saturation are indicative of iron overload, and analysis of a liver
biopsy can confirm the diagnosis (Gordeuk et al., 1986; Pippard, 1994).
Phlebotomy can be used remove excess iron (Speight and Cliff, 1974).
2.2.4. Mechanisms of iron toxicity
The mechanism of iron toxicity has not been fully elucidated. It has been
proposed that lipid peroxidation is one mechanism of toxicity of iron overload
(Bacon et al., 1983). Non-bound ferric iron can be reduced to ferrous iron by
superoxide (McCord, 1996). Ferryl ions and hydroxyl radicals are then
generated by the reoxidation of ferrous iron. These free radicals can cause
extensive damage to cell membranes, proteins, and promote oxidative DNA
injury resulting in mutagenesis (McCord, 1996; Andrews, 1999). Subsequent
breakdown of polyunsaturated fatty acids takes place in the membrane
phospholipids, thus disrupting cell function (Hogberg et al., 1973; Myers et al.,
1991). Iron-induced lipid peroxidation in hepatic mitochondria and microsomes
has also been observed to impair electron transport and decrease levels of
cytochromes P-450 and b5 (Bacon et al., 1985; Bacon et al., 1986).
A recent study linked chronic experimental iron overload and lipid peroxidation
to disturbances in plasma lipid transport and hepatobiliary sterol metabolism
(Brunet et al., 1999). An elevation of malondialdehyde (MDA) levels was

LITERATURE REVIEW
35
measured, which is an indication of lipid peroxidation. Young et al. (1992) also
reported that patients with clinical GH have increased plasma levels of MDA.
In addition to free radical-induced injury, the accumulation of cellular iron in the
cell results in low levels of cellular adenosine triphosphatase (ATP), defective
cellular calcium homeostasis, and subsequent damage to DNA, which may
directly contribute to hepatocellular damage (Britton et al., 1994). Lipid
peroxidation of lysosomal membranes has been associated with low membrane
fluidity and limited lysosomal acidification (Hogberg et al., 1973).
Long-term iron overload activates hepatic stellate cells and leads to hepatic
fibrosis (Britton et al., 1994, Ramm et al., 1997). An inherent association
between lipid peroxidation and fibrogenesis due to increased collagen
biosynthesis has been made (Parola et al., 1993). It can be theorised that
increased collagen gene expression and subsequent fibrosis could be due to
iron-induced lipid peroxidation (Britton et al., 1994).
In addition, iron toxicity may be enhanced via impairment of the immune
system. Non-transferrin iron and ferritin have been observed in vitro to suppress
the proliferation of lymphocytes (Matzner et al., 1979; Djeha and Brock, 1992).
2.2.5. Iron and carcinogenesis
An increase in total iron stores has been epidemiologically linked as a risk factor
for cancer in humans (Stevens et al., 1988; Selby and Friedman, 1988; Stevens
et al., 1994). Iron overload has repeatedly been shown to play a role in the
enhancement of tumour cell growth, and iron deficiency and iron chelating
agents appear to inhibit carcinogenesis (Deugnier et al., 1998; Deugnier and
Loréal, 2000). For example, Chen et al. (1999) demonstrated that a high dietary
content of iron augments the development of oesophageal adenocarcinoma in
rats. Iron has been implicated in the development of HCC via peroxidation and
subsequent yield of free radicals (Weinberg, 1983; Perera et al., 1987; Toyokuni
1996). In vitro studies have shown that iron can be genotoxic and mutagenic to
isolated DNA (Loeb et al., 1988) and chronic iron overload promotes the

LITERATURE REVIEW
36
unwinding of double-stranded DNA in rat hepatocytes (Edling et al., 1990),
supporting the process of cancer initiation.
Transferrin iron may promote tumour cell growth by providing a favourable
environment for the tumour cell to proliferate. Cells, including tumour cells, need
iron to proliferate, and the presence of iron has been reported to promote DNA
synthesis in rat hepatocyte cultures (Chenoufi et al., 1997) and the growth of
human hepatoma cells (Hann et al., 1990). It has been shown that nodule
hepatocytes are unable to take up iron in a situation of iron overload (Williams
and Yamamoto, 1972), in spite of high numbers of diferric transferrin binding
sites (Eriksson et al., 1986). The affinity of the receptor to diferric transferrin is
not affected. It was suggested that the dissociation of iron from transferrin is
disturbed, perhaps due to insufficient acidification in the endosomes, which
leads to a slower rate of iron accumulation in hepatocytes within the nodules
(Eriksson et al., 1986; Andersson et al. 1989). Low intracellular iron in the
nodules could lead to a reduction in lipid peroxidation, contributing to the cell
growth advantage of these hepatocytes in a toxic environment, as described in
the resistant hepatocyte model by Solt and Farber (1976). It has been
suggested that iron-free foci are proliferative lesions that could be pre-
neoplastic/precursors to HCC (Hirota et al., 1982; Deugnier et al., 1993a, b;
Blanc et al., 1999). It is not known, however if iron plays a direct role in initiating
or promoting HCC, or if HCC results indirectly from iron-induced cirrhosis (Stål
et al., 1995).
Many studies support the hypothesis that iron promotes GH by inducing
cirrhosis, which is seen in the majority of GH cases (Stål et al., 1995). HCC has
been found to be the cause of death in 27.5-45% of patients with clinical GH
and concurrent severe iron overload (Niederau et al., 1996; Fargion et al.,
1992). The risk in GH patients of developing HCC once cirrhosis has developed
has been estimated to be 200-fold higher than in non-cirrhotic GH patients
(Bradbear et al., 1985; Niederau et al., 1985). In cases of GH, a risk for HCC
still exists even after iron depleting treatment (Fargion et al., 1992). Ludwig et
al. (1997) also reported continuous iron loading in livers in which cirrhosis is due
to causes other than GH. Patients with alcohol-or HBV-induced liver cirrhosis

LITERATURE REVIEW
37
have an increased risk of developing HCC in the presence of hepatic iron
overload compared to those with normal body iron stores (Deugnier et al., 1998;
Deugnier and Loréal, 2000).
Elevated liver iron stores have also been found in cases in which HCC
developed in non-cirrhotic livers (Turlin et al., 1995). Others have reported an
increased risk of various cancers, including HCC, in the presence of iron
overload, but in the absence of cirrhosis (Deugnier et al., 1998; Deugnier and
Loréal, 2000). Though rare, HCCs have been reported in GH patients with non-
cirrhotic livers (Fellows et al., 1988; Blumberg et al., 1988).
Experimentally, disparate results have also been obtained. Yoshiji et al. (1991)
described the role of iron in the development of pre-neoplastic foci in the livers
of rats initiated with diethylnitrosamine (DEN) and promoted by phenobarbital.
In an additional study with DEN as initiator, iron dextran administered
parenterally did not act as an initiator alone (Carthew et al., 1997). However, the
iron dextran did act as a promoter as seen in the increase in the placental form
of glutathione-S-transferase (GSTP) expressing foci in the absence of fibrosis.
The study by Carthew et al. (1997) demonstrates that fibrosis is not necessarily
a prerequisite for iron-induced foci in the liver of a rat.
The Solt-Farber animal model of chemical carcinogenesis has been used to
examine the effect of iron overload in the development of HCC. In a long-term
study supplementing with 2.5%-3% dietary carbonyl iron (Fe), Stål et al. (1995)
mimicked iron overload as seen in non-cirrhotic GH. To examine the effect as
an initiator, iron replaced DEN, partial hepatectomy (PH) or both. The promotive
effects were tested on a complete initiating regime consisting of a low-dose
DEN and PH, or a necrogenic dose of DEN. The mitostimulatory effect of iron
was documented and the mitoinhibitory effect of 2-acetylaminofluorene (2-AAF)
was counteracted by iron. However, no promotive effect of iron was noted. In
fact, a decrease in volume density of nodules was effected when iron was given
with a complete promotive regimen; a decrease in the number of foci in initiated
livers was also observed. It was concluded that iron is not genotoxic, does not
promote the growth of initiated cells, and has weak mitogenic characteristics.

LITERATURE REVIEW
38
The same research group conducted a study in 1999 using 1.25-2.5% Fe added
to the diet 2 weeks after initiation with DEN and promotion with 2-AAF in
combination with PH (Stål et al., 1999). Iron increased the number of pre-
neoplastic foci, but no enhancement of progression to HCC was seen. Similar
levels of dietary carbonyl iron restricted promotion by carbon tetrachloride
(CCl4) after initiation with DEN (Wang et al., 1999). In a study examining
carbonyl iron as a co-factor in the development of HCC, iron enhanced the
cytotoxic effect of ethanol in the Solt-Farber model, as measured by elevation in
levels of serum aminotransferase. Iron did not however increase the formation
of pre-neoplastic GSTP positive (GSTP+) lesions. Lemmer et al. (1999) also
described an apparent ‘protective’ effect of carbonyl iron fed for 5 weeks on
FB1-induced cancer initiation and promotion.
In conclusion, dietary iron appears to have a direct and indirect role in the
development of HCC in humans and possibly in animal models. The results of
the different studies associated with iron overload do not clarify the carcinogenic
effect of iron and the mechanism needs to be further elucidated.

LITERATURE REVIEW
39
2.3. Aims The aims of the present study were to
(i) to establish a model of iron loading, in which a high baseline hepatic iron
level could be maintained at a low dietary iron level;
(ii) to examine the interaction between FB1 and increased hepatic iron
levels, utilising the stop model of chemical carcinogenesis;
(iii) to determine whether excess iron potentiates the hepatocarcinogenic
effects of FB1.

MATERIALS AND METHODS
40
Chapter 3 Materials and methods
3.1. Chemicals
Fumonisin B1
Fumonisin B1 (FB1) was purified from maize cultures of Fusarium verticillioides
strain MRC 826 according to a method described by Cawood et al., 1991.
Extraction of FB1 was accomplished with CH3OH/H2O (3:1) followed by a
solvent-partitioning step using CHCl3. The ensuing purification of the aqueous
phase was achieved on Amberlite XAD-2, silica gel, and reversed-phase (C18)
chromatographic columns. This method yielded FB1 to the purity of 92.97% as
compared to an analytical standard by high performance liquid chromatography
(HPLC) (Shephard et al., 1990). The main FB1 impurities constitute
monomethylester derivatives of FB1, which are artefacts of the purification
procedure (Cawood et al., 1991).
Carbonyl Iron
Carbonyl iron is manufactured using the carbonyl decomposition process, which
yields an extremely pure form of elemental iron (97%) with only traces of
carbon, oxygen and nitrogen. In the process, iron reacts with carbon monoxide
at high temperatures to form reduced pentacarbonyl iron, Fe(CO)5. The
carbonyl iron in this study was purchased from Sigma Chemical Co (St. Louis,
Missouri).
5-Bromo-2’-deoxy-uridine
5-bromo-2’-deoxy-uridine (BrdU) is an immunochemically detectable pyrimidine
analogue of thymidine (Sigma product information sheet; website
http://www.sigma.sial.com/sigma/proddata/b5002.htm). For handling of BrdU,
precautions are required. Stocks were stored protected from light at 4oC.
Gloves were worn during preparation, spillage thoroughly cleaned, and syringes
and residues incinerated. BrdU was purchased from Roche Products (PTY) Ltd
(Roche Diagnostics, Basel, Switzerland).

MATERIALS AND METHODS
41
Monoclonal anti-BrdU
The amount of BrdU incorporated into the cellular DNA was determined
immunohistochemically after in vivo labelling using a monoclonal anti-BrdU
antibody (Immunohistology Grade, mouse IgG1 isotype) (Roche Molecular
Biochemicals USA 2000 Biochemicals Catalog website http://biochem-
us.comvos.de). The antibody recognises BrdU in the nuclei of formalin-fixed,
paraffin-embedded tissue sections and demonstrates the incorporation of BrdU
immunohistochemically by an indirect immunoperoxidase method (Sigma
Biosciences Information Sheet for Monoclonal Anti-BrdU). The monoclonal anti-
BrdU was obtained from Sigma Biosciences (St. Louis, Missouri).
Placental form of glutathione S-transferase
Avidin-biotin-peroxidase complex (ABC) and affinity-purified biotin-labelled goat
anti-rabbit IgG (immunoglobulin G) serum (Vector Laboratories, Burlingame,
CA) were used in staining paraffin wax sections of liver to detect glutathione-S-
transferase (placental form) positive (GSTP+) cells.
Other chemicals
Trichloroacetic acid (TCA), 2-thiobarbituric acid (TBA), butylated hydroxytoluene
(BHT), and bovine serum albumin (BSA) were purchased from Sigma
Chemicals Co (St. Louis, Missouri) and ethylene diamine tetra-acetic acid
disodium salt (EDTA) from Synthon Fine Chemicals PTY Limited.
All other chemicals and solvents for lipid analysis were of analytical grade and
obtained from Merck, S.A. Organic solvents (methanol, chloroform and hexane)
used for lipid extractions and analyses were glass-distilled prior to use. All
glassware was cleaned with a phosphate free soap (Contrad concentrate,
Merck, S.A.) and rinsed with glass-distilled methanol.
3.2. Animals
Male Fischer 344 rats were bred in the Primate Unit of the Diabetes Research
Group (RIND building) of the South African Medical Research Council (MRC).
Rats were housed in a controlled environment at 23 - 24°C and 60% humidity

MATERIALS AND METHODS
42
with a 12 hour (h) artificial light cycle. Water was available ad libitum. Food cups
were changed as needed and the cages were replaced on a monthly basis.
The Ethics Committee for Research on Animals (ECRA) approved this study
and it was conducted in compliance with policies and standards detailed in the
MRC's principles and guidelines for the use of animals in biomedical research.
These regulations are printed in GUIDELINES ON ETHICS FOR MEDICAL
RESEARCH, REVISED EDITION, 1993 and the NATIONAL CODE FOR
ANIMAL USE IN RESEARCH, EDUCATION, DIAGNOSIS AND TESTING OF
DRUGS AND RELATED SUBSTANCES IN SOUTH AFRICA, 1990 published
by the Chief Director: Veterinary Services, Private Bag X250, Pretoria 0001.
Pre weaning period
The rat pups were caged with their mothers on corncob bedding. The study
commenced on day 3 (day 1=day of birth) and the rats were fed a modified
version of the diet developed by the American Institute of Nutrition (AIN-93M)
(Reeves et al., 1993) with or without supplemented carbonyl iron twice a day.
Food was available ad libitum. The mothers were weighed once a week.
Pilot study on iron loading
Sixty-eight male Fischer 344 (F344) rats at the age of 4 weeks (after weaning)
were used in the study. The animals were caged 2-3 per cage on corncob
bedding and were weighed 3 times a week. Food was available ad libitum and
during the week the rats were fed twice a day and on the weekends once a day.
The bedding of the dietary iron-treated rats was changed on a weekly basis and
that of the controls changed every 2nd week as deemed necessary.
Long-term FB1/Fe interactive study
Eighty male F344 rats at the age of 4 weeks (after weaning) were used in the
study. The rats were kept separately on vermiculite bedding, an inert, non-toxic
mineral, except for the rats used for averaged feeding, which were kept in wire
grid cages, as wastage could not be accounted for in the bedding (see Chapter
3.4.3). Vermiculite bedding was discontinued after 39 days because of the
excessive dust build-up caused by vermiculite, making it very impractical. All the

MATERIALS AND METHODS
43
animals were then caged individually in wire grid cages. The cages were rotated
every 2 weeks to different shelf levels, starting at week 27. The rats were
weighed twice weekly until week 51, after which they were weighed once
weekly.
PerspexTM houses were introduced at week 33 to assuage the tendency of
ulcerative pododermatitis to develop on grid floors. PerspexTM cast acrylic sheet
(polymethyl methacrylate) is an inert substance manufactured from methyl
methacrylate, a standard organic chemical produced from crude oil feedstock
(www.ineosacrylics.com). The material has been used for many years in
medical devices such as in the production of the intra-ocular lens. No
detrimental health effects of PerspexTM are known.
3.3. Diets
Each diet was prepared in 6 kg quantities at a time and stored under nitrogen in
3 bags at 2 kg each at 4°C until used.
AIN-93M diet
All the rats received a modified version of the AIN-93M diet, which is
recommended as a maintenance diet for rodents. It is formulated to replace the
previous version (AIN-76A) to improve animal maintenance. In this study,
methionine was substituted for L-Cystine and soybean oil was used as the fat
source (Appendix AI). The iron content of the control AIN-93M diet was 35 mg
iron per kg diet.
Iron-supplemented diet
The iron-supplemented diet was prepared according to a modification of the
method previously described by Plummer et al. (1997) by mixing carbonyl iron
into the AIN-93M diet to obtain the desired concentrations. The appropriate
amount of iron was first mixed into a 200 g sample of the powdered diet after
which this sample was diluted to the original concentration and stored.

MATERIALS AND METHODS
44
Fumonisin B1-containing diet
The required amount of FB1 stock sample was first dissolved in methanol (50
ml) and mixed into a sample (200 g) of the AIN-93M diet, after which it was
dried in a fume cupboard at room temperature for 12h (Gelderblom et al., 1994).
Subsequently, the sample was thoroughly mixed into the AIN-93M diet to obtain
the desired concentration of FB1. Gloves and masks were worn for protection
while preparing and administering fumonisin-containing diets.
3.4. Experimental design
3.4.1. Pre-weaning iron loading regimen
To achieve iron loading via breast milk, the mothers of the rats allocated to the
iron group received pellets (Epol, Ltd, S.A.) on day 1 and 2, and then 1% dietary
carbonyl iron (Fe) mixed into the AIN-93M powdered diet starting on day 3. The
mothers of the control rats received AIN-93M without iron. The mothers and
pups were housed together on corncob bedding. In addition to mother’s milk,
the pups commenced to consume the mother’s AIN diet approximately after 2
weeks and were weaned at an age of 4 weeks.
3.4.2. Pilot study on iron loading
At weaning, 4 rats from the iron supplemented group and 4 rats from the control
group were sacrificed to assess body weight (BW), total body weight gain
(tBWG), the liver to body weight ratio (LW/BW), liver pathology, the degree of
hepatic iron loading (baseline group), and lipid peroxidation.
The remaining 60 rats were then randomly divided into four treatment groups
(n=15 each) as outlined in Table 3.1. After 10 weeks, the dietary iron dosage
was reduced to 0.5% for all iron-supplemented groups and continued up to 15
weeks after which the experiment was terminated. Subgroups from all four
groups were sacrificed on a regular basis during the course of the experiment
(Table 3.1) to monitor the various parameters.

MATERIALS AND METHODS
45
Table 3.1. Summary of the treatment regimens for the iron loading trial (pilot study).
Level of dietary iron feeding for week 0-10 Duration of treatment 1% Fe 1.5% Fe 2% Fe Control
4 wk n=4 - - n=4
6 wk n=5 n=5 n=5 n=5
10 wk* n=5 n=5 n=5 n=5
15 wk n=5 n=5 n=5 n=5
Total no. of rats n=19 n=15 n=15 n=19 *At week 10, the dietary iron of all the iron-treated rats was reduced to 0.5%.
Termination
The rats that were sacrificed at weeks 4, 6, and 10 were anaesthetised
intraperitoneal (i.p.) with sodium pentobarbitone (6%) (0.1 ml/100 g BW) and
terminated by cutting the abdominal aorta (exanguination). At 15 weeks, the
rats were sacrificed by decapitation 1h after an i.p. injection of BrdU (100 mg/kg
BW). The livers were removed, weighed and samples for histopathology
prepared. Liver slices (2-3 mm) were taken from the median, left lateral and
caudate lobes and fixed in 10% neutral buffered formalin for 24h. The
remainder of the liver was snap frozen in liquid nitrogen for biochemical
measurement of hepatic iron and the level of lipid peroxidation.
3.4.3. Long-term FB1/Fe interactive study
Averaged feeding was introduced in the long-term study to reduce the variability
of certain parameters, such as BW, tBWG, and the LW/BW ratio, between rats
of different treatment groups. This entailed weighing the feed of a specified
group every day, calculating the average feed intake, and feeding the other rats
accordingly.
Treatment period: weeks 4-10 (iron loading period)
Iron supplemented groups
The rats were subjected to the pre-weaning iron loading treatment regimen as
described above. At weaning, 5 rats were sacrificed to determine the degree of

MATERIALS AND METHODS
46
hepatic iron loading (baseline group) and the remaining rats were fed 1% Fe
(n=35). The feed intake profiles of 10 rats fed the iron-supplemented diet were
monitored once daily and the feed of the other groups adjusted accordingly. At
the age of 10 weeks, 5 rats were culled to monitor the extent of iron loading in
the liver prior to the FB1 feeding.
Non iron-supplemented groups
At weaning, 5 rats from the mothers that received the control AIN 93M diet were
sacrificed to serve as controls for the iron-treated group, and the remainder of
the rats (n=35) were continued on the AIN-93M diet. At the age of 10 weeks, 5
rats were culled as a control for the 1% Fe treated group prior to FB1 feeding.
Treatment period: weeks 10-35 (FB1 treatment period)
The iron-treated rats were randomly divided into either the FB1/Fe (n=15) or Fe
(n=15) group, while the AIN-93M control rats were randomly divided into either
the FB1/AIN-93M (n=15) or the AIN-93M control (n=15) group according to a
2x2 factorial design (Table 3.2). At this stage the dietary iron level was reduced
to 0.5% to prevent possible toxic effects of the combined FB1/Fe treatment. The
average feed intake of the entire FB1/Fe group (n=15) was measured while the
averaged intake the FB1/AIN-93M group was occasionally monitored from week
17 onwards for comparison.
Table 3.2. Experimental outlay (2x2 factorial design) of the long-term study (10-35 week period).
Treatment regimens FB1 FB1 control
0.5% Fe FB1/Fe group (n=15) Fe group (n=15)
Fe control FB1/AIN group (n=15) Control (n=15)

MATERIALS AND METHODS
47
Rats from the different groups were subjected to the following treatment
regimens:
FB1/Fe group (n=15): The rats received FB1 at a dietary level of 250 mg/kg
AIN-93M containing 0.5% Fe for a period of 5 weeks. The dietary FB1 was
lowered to 100 mg/kg AIN-93M diet for the remainder of 20 weeks.
Fe group (n=15): The rats received 0.5% Fe-containing AIN-93M diet for 25
weeks.
FB1/AIN group (n=15): Rats were fed 250 mg FB1/kg AIN-93M diet for 5
weeks, followed by a 100 mg/kg diet for 20 weeks in the absence of iron.
Control (n=15): These control rats received only the AIN-93M diet for 25
weeks.
Treatment period: weeks 35-60 (post FB1 treatment period)
FB1-treatment was discontinued at week 35 (Table 3.3.), while the iron
treatment protocol was continued up to 60 weeks. The purpose of this was to
assess the reversibility of fumonisin-induced liver injury in the fumonisin treated
group and to monitor the promoting effects of iron on the FB1-induced
pathological changes of the liver. Five rats from each group were sacrificed at
35 weeks, and at 60 weeks, all remaining rats were terminated to assess iron
loading as well as the pathological changes at these time-points.
Termination
A summary of the termination schedule for the rats over the 60-week period is
outlined in Table 3.3. At 35 weeks, 10 rats, and at 60 weeks all the rats,
received BrdU (100mg/kg BW, i.p.) dissolved in DMSO:Saline (1:3) 1h prior to
sacrifice. The animals were anaesthetised with sodium pentobarbitone (6%)
(0.1ml/100g BW; i.p.) and subsequently terminated by cutting the abdominal
aorta (exanguination) at the different time-points (Table 3.3.). Blood was
collected from the abdominal aorta for haematological and biochemical

MATERIALS AND METHODS
48
analyses. The livers were removed and weighed. Slices of liver were taken from
the median, left lateral, and caudate lobes, and fixed in 10% neutral buffered
formalin for 24hr. The remainder of the liver was snap frozen in liquid nitrogen
for biochemical measurement of hepatic iron and the level of lipid peroxidation.
Table 3.3. Summary of the treatment for the long-term study. Duration of treatment FB1/Fe Fe FB1/AIN Control
4 wk - n=5 - n=5
10 wk* - n=5 - n=5
Total no. of rats 10 10
35 wk n=5 n=5 n=5 n=5
60 wk n=10 n=9# n=10 n=10
Total no. of rats n=15 n=14# n=15 n=15 *At week 10, the dietary iron of all the iron-treated rats was reduced to 0.5% and FB1 feeding commenced; rats were fed 250 mg FB1/kg diet for 5 weeks followed by 100 mg/kg for 20 weeks. #One rat died at 60d due to kidney/bladder stones.
3.5. Liver pathology
3.5.1. Light microscopy
Slices of liver (4-5 mm in thickness) were fixed in 10% neutral buffered formalin
overnight prior to processing and embedding in paraffin wax. Sections (4 µm)
were prepared for light microscopy by following routine processing protocols. 4h
processing cycles were used cycle to prevent the tissue from becoming brittle
and to preserve antigenicity. Stains included routine haematoxylin and eosin
(H&E) and Perls’ Prussian blue stain for trivalent iron.
Histopathological evaluation of the liver sections included assessment of
hepatocyte necrosis, apoptosis, fatty change, mitoses, architectural distortion,
fibrosis and regenerative nodules, and dysplastic nodules (low-grade and high-
grade dysplasia). High-grade dysplasia was characterised by a discrete, non-
invasive pushing edge into adjacent liver tissue, large cells with clear
cytoplasm, mitosis, intranuclear inclusions, large nucleoli, oval cells, apoptosis
of occasional dysplastic cells, and moderate nuclear pleomorphism.
MATERIALS AND METHODS
49
Hepatocellular cancer (HCC) was characterised by invasion into surrounding
liver tissue and the vascular system, and metastasis to other organs.
Both foci and nodules were evaluated. Lesions up to 10 µm in diameter were
called foci, and those larger than 10 µm were termed nodules. The assessment
was done ‘blind’ and the numbers on the glass slides were ‘decoded’ after
completion of the evaluation.
3.5.2. Immunohistochemistry
3.5.2.1. Hepatocellular proliferation
BrdU can be incorporated into cell DNA at the S-phase of the cell cycle instead
of thymidine and with a monoclonal antibody is used to assess cell proliferation
(website http://www.sigma.sial.com/sigma/proddata/b5002.htm; Sigma product
information sheet). Rats were injected with BrdU 1h prior to termination. Liver
sections (2-3 µm thick) were cut from the tissue blocks for the subsequent
staining with monoclonal anti-BrdU antibody. BrdU was detected by the ABC
method using a monoclonal anti-BrdU antibody (Sigma Chemical Company)
and the slides were scored by counting at least 500 cells randomly per liver
section (x40), and labelling indices expressed as a percentage. In cases where
no staining was seen in 500 cells, the total number of BrdU positive (BrdU+)
cells was counted and the labelling was expressed as cells/cm2. The total area
of the liver sections was determined by a computerised image analyser
(Kontron Image Analysis Division, Videoplan, Image Processing System).
3.5.2.2. Enzyme altered foci and/or nodules
Glutathione S-transferase (placental form) (GSTP) staining with the avidin-
biotin-peroxidase complex (ABC) and affinity-purified biotin-labelled goat anti-
rabbit IgG serum (Vector Laboratories, Burlingame, CA) was performed on liver
sections (5 µm) to assess enzyme altered cells (Ogawa et al. 1980). Sections
were washed with petroleum benzene and a graded alcohol series prior to
staining with the reagents using the ABC kit. Rabbit GSTP-antiserum (DAKO)
was used at a dilution of 1:800. Subsequently, sections were counterstained
with Carazzi's haematoxylin to provide blue stained nuclei within the reddish-
brown GSTP+ cells. Negative controls, omitting the primary antibody, were

MATERIALS AND METHODS
50
included to test for the specificity of anti-GSTP antibody binding. The number
and size of GSTP+ foci were assessed by light microscopy (4-10 X
magnification). The GSTP+ stained cells were categorised as singlets, duplets,
or minifoci (<10 cells/focus), while larger lesions (>10 cells/focus) were scored
according to their internal diameter (largest of the longitudinal or transverse
diameter). Lesions up to 10 µm in diameter were called foci, and those larger
than 10 µm were termed nodules. The total area of the liver sections was
determined by a computerised image analyser (Kontron Image Analysis
Division, Videoplan, Image Processing System) and the amount of GSTP+
lesions were expressed as number per cm2 liver section area.
3.6. Hepatic iron analysis
3.6.1. Biochemical measurement
Iron content was determined using a modified method obtained from the
Biochemistry Department, Flinders Medical Centre, Adelaide, South Australia
(6D223, methods manual, see Appendix for method and modifications). Liver
tissue was dried in a pre-weighed glass test tube overnight at 105°C and then
allowed to cool in a dessicator. The tubes were weighed and the dry liver weight
calculated. Subsequently, the tissue was digested in 0.4 ml of 35% nitric acid at
70°C for 1h, and then diluted in 0.2 M sodium acetate buffer pH 4.5 and 10N
NaOH. If the liver was not totally digested after 1h, then the digestion process
was allowed to continue for another 30 minutes (min). Iron concentration,
expressed as mmol/kg dry liver, was determined colourimetrically using a
Hitachi random access auto-analyser modular (Roche Diagnostic Systems,
Basel, Switzerland).
3.6.2. Histological assessment
In addition to the biochemical measurement, the initial intention was to also
evaluate iron-loading in the hepatocytes by semi-quantitative grading of Perls’
Prussian blue stain for trivalent iron (Williams et al., 1962). Due to a
combination of problems, such grading was not feasible on many of the slides
from the long-term study. These included problems in processing the tissue
sections resulting in poor staining quality; also a shift of iron deposition from

MATERIALS AND METHODS
51
necrotic hepatocytes to Kupffer cells and portal tract macrophages in the FB1-
treated rats rendered the grading of iron in hepatocytes impractical. The degree
of the hepatic iron loading obtained in pilot study was nevertheless evaluated to
demonstrate the accordance of the biochemical measurement and histological
assessment of iron concentration. Stainable iron in hepatocytes was graded 0
to 4, using a modification of the scale devised by Scheuer et al. (1962) (Table
3.4.).
Table 3.4. Grading of stainable iron in hepatocytes (modified from Scheuer et al., 1962).
Stainable iron in hepatocytes (%) Grade
Absent 0
less than 25% 1
25% to 50% 2
50% to 75% 3
75% to 100% 4
3.7. Assessment of lipid peroxidation
3.7.1. Homogenate preparation and incubation
Liver samples were homogenised on ice in 19 volumes of 1.15% KCl containing
0.01 M phosphate buffer (pH 7.4). A sample of 200 µl was taken for protein
determination and the remaining homogenate was incubated in a closed bottle
at 37oC for 1h.
3.7.2. Determination of thiobarbituric acid reacting substances
The concentration of thiobarbituric acid reacting substances (TBARS) measured
as malondialdehyde (MDA) was used as an index of the extent of lipid
peroxidation. TBARS were measured according to a modified method described
by Hu et al. (1989). Two ml of the incubated homogenate were vortexed with 2
ml of TCA reagent, consisting of 10% TCA, BHT (12.5 µm BHT/10ml TCA
solution) and EDTA (0.372 g EDTA/l TCA solution), and centrifuged at 2000
rpm for 15 min. Addition of EDTA and BHT to the TCA reagent prevents further
oxidative damage during the assay procedure. Two ml of the supernatant was

MATERIALS AND METHODS
52
added to 2 ml of a 0.67% 2-TBA solution, vortexed, and heated in capped tubes
at 90ºC for 20 min in a water-bath (Kinchington et al., 1993). The mixture was
allowed to cool and the absorbency measured at 532 nm (Esterbauer and
Cheeseman, 1990) with the Beckman® Spectrophotometer UV 5260. Lipid
peroxidation was expressed as nmol MDA equivalents per mg protein, using the
molar extinction coefficient of 1.56 x 10⁵ M-1 cm-1 at 532 nm for MDA (Buege
and Aust, 1978).
3.7.3. Determination of conjugated dienes
To confirm the induction of lipid peroxidation, selected tissue samples were also
analysed for conjugated dienes (CD) according to the method of Hu et al.,
(1989). A 2 ml aliquot of the heated homogenate was extracted with 7.5 ml
chloroform:methanol (1:2) by shaking for 1 min. Another 2.5 ml of chloroform
was added and the solution vortexed for 30 seconds (s). To this mixture, 2.5 ml
of saline saturated with chloroform-methanol-saline (CMS) was added and the
mixture was vortexed for 30s. After centrifuging at 1500 rpm for 15 min, 2 ml of
the bottom chloroform layer was removed and dried under nitrogen at 40oC.
Hexane (1 ml) was used to dissolve the lipids and the absorbency measured at
233nm with the Beckman® Spectrophotometer UV 5260. The conjugated dienes
were determined by using the molar extinction coefficient of 2.7 x 10⁴ M-1 cm-1
and expressed as nmol CD equivalents per mg protein.
3.7.4. Determination of proteins
Proteins in the homogenate were measured for the purpose of lipid peroxidation
determination according to the method described by Bradford (1976). The
method is based on the observation that the absorbency maximum of
Coomassie Brilliant Blue G-250 shifts from 495 nm to 595 nm when the colour
reagent reacts with protein.
The reagent is prepared by dissolving 100 mg Coomassie Brilliant Blue G-250
in 50 ml 95% ethanol and adding 100 ml 85% (w/v) phosphoric acid to this
solution. The stock solution was then diluted 1:5 times with double distilled
water (ddH20) and filtrated with two layers of Whatman paper (Whatman
International Ltd, England). Stock solution is kept at 4ºC. A standard solution
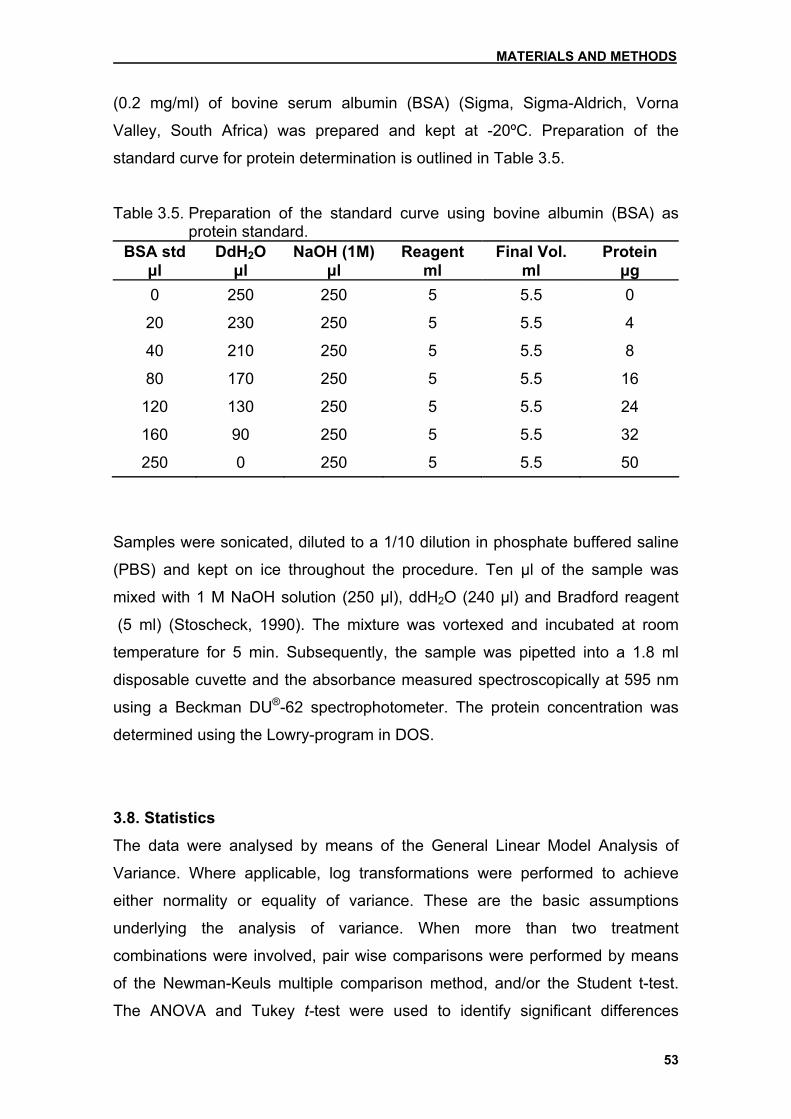
MATERIALS AND METHODS
53
(0.2 mg/ml) of bovine serum albumin (BSA) (Sigma, Sigma-Aldrich, Vorna
Valley, South Africa) was prepared and kept at -20ºC. Preparation of the
standard curve for protein determination is outlined in Table 3.5.
Table 3.5. Preparation of the standard curve using bovine albumin (BSA) as protein standard.
BSA std µl
DdH2O µl
NaOH (1M)µl
Reagent ml
Final Vol. ml
Protein µg
0 250 250 5 5.5 0
20 230 250 5 5.5 4
40 210 250 5 5.5 8
80 170 250 5 5.5 16
120 130 250 5 5.5 24
160 90 250 5 5.5 32
250 0 250 5 5.5 50
Samples were sonicated, diluted to a 1/10 dilution in phosphate buffered saline
(PBS) and kept on ice throughout the procedure. Ten µl of the sample was
mixed with 1 M NaOH solution (250 µl), ddH2O (240 µl) and Bradford reagent
(5 ml) (Stoscheck, 1990). The mixture was vortexed and incubated at room
temperature for 5 min. Subsequently, the sample was pipetted into a 1.8 ml
disposable cuvette and the absorbance measured spectroscopically at 595 nm
using a Beckman DU®-62 spectrophotometer. The protein concentration was
determined using the Lowry-program in DOS.
3.8. Statistics
The data were analysed by means of the General Linear Model Analysis of
Variance. Where applicable, log transformations were performed to achieve
either normality or equality of variance. These are the basic assumptions
underlying the analysis of variance. When more than two treatment
combinations were involved, pair wise comparisons were performed by means
of the Newman-Keuls multiple comparison method, and/or the Student t-test.
The ANOVA and Tukey t-test were used to identify significant differences

MATERIALS AND METHODS
54
between the means of more than two groups. Differences were considered
significant when p<0.05. The statistical analyses and graphical summaries were
performed by means of the Number Cruncher Statistical System (NCSS 2000),
Statistical System for Windows (Hintze, JL (1999) User’s Guide. Number
Cruncher Statistical Systems, Kaysville, Utah).

RESULTS
55
Chapter 4 Results
4.1. Pilot study The pilot study was conducted to establish a model of iron loading for the
subsequent long-term carcinogenesis study. The effect of 1%, 1.5% and 2%
dietary carbonyl iron (Fe) on various parameters and the effect of reducing this
dosage to 0.5% at 10 weeks was evaluated over a total period of 15 weeks (see
Chapter 3.4.2, Experimental design).
4.1.1. Body weight and liver to body weight ratios
Rats fed iron-supplemented feed had softer faeces than control rats. Diarrhoea
was seen in only 1 rat from the 1% Fe treatment group.
The mean body weight (BW) of the rats fed the 1% Fe was significantly
(p=0.0002) lower than the control rats over the treatment period of 15 weeks,
despite the reduction of iron to 0.5% after 10 weeks (Fig 4.1a). The mean BW of
rats in the 1.5 and 2% Fe groups was also significantly (p=0.0001) lower than
the controls with no difference between the iron-treated groups (Fig 4.1b). The
increase in BW from week 10 to 15 after reduction to 0.5% Fe was significant in
the 1.5% (p=0.002) and 2% Fe (p=0.004) groups, while no significant (p=0.1)
increase was noticed in the 1% Fe group (Fig 4.1c). The BW of the control rats
also significantly (p=0.0001) increased during this time period.
The average total body weight gain (tBWG) was significantly (p<0.05) lower in
the iron-treated rats compared the control rats up to 10 weeks (Fig 4.2). The
tBWG of the control group increased until week 10, after which it remained
constant up to week 15. At weeks 6 and 10, there was no significant difference
(p>0.05) in the tBWG between the iron-treated groups, although the 1% Fe
group tended to have the highest tBWG. After reducing the iron level to 0.5% at
week 10, the tBWG’s of the iron-treated groups did not differ significantly
(p>0.05) from the control group anymore. In this regard, the tBWG of the 2% Fe
group surpassed that of the 1% and 1.5% Fe groups, an increase that was

RESULTS
56
significant (p=0.003). The tBWG of the 1.5% Fe group was also significant
(p=0.002) in this time period (week 10-15), while it was only marginally
significant in the 1% Fe group (p=0.055). No significant (p=0.4) increase in the
tBWG was noticed for the control rats during this period.
0.00
75.00
150.00
225.00
300.00
4 6 10 15Week
BW (g)
Group0 % Fe1 % Fe
Fig 4.1a

RESULTS
57
50.00
112.50
175.00
237.50
300.00
0 1 1.5 2% Fe
BW (g)
Fig 4.1b
50.00
112.50
175.00
237.50
300.00
6 10 15Week
BW (g)
Group0 % Fe1 % Fe1.5 % Fe2 % Fe
Fig 4.1c
Fig 4.1. a) The change in mean body weight (BW) of the control and 1% Fe group as a function of time. b) The differences between the combined BW of the four treatment groups over the entire treatment period. Standard deviations for the individual mean BW for each group at each time point are shown in the Appendix in Table A.IIIa. c) The effect of the level of dietary iron on the BW as a function of time. Dietary iron levels of all the treatment groups were reduced to 0.5% after 10 weeks.

RESULTS
58
0.00
50.00
100.00
150.00
200.00
6 10 15 Week
tBWG (g)
Group 0 % Fe 1 % Fe 1.5 % Fe2 % Fe
Fig 4.2. The effect of different levels of dietary iron on the total body weight gain
(tBWG) over the 15-week study period. The dietary iron level of all the treatment groups was reduced to 0.5% after 10 weeks.
The iron-treated rats exhibited a significantly (p=0.0001) higher mean liver to
body weight (LW/BW) ratios than the controls during the entire 15-week study
period irrespective the iron treatment regimen used (Fig 4.3a).
At week 4 (pre-weaning treatment period), the difference between LW/BW ratio
of the 1% Fe and control group was only marginally significant (p=0.07; data not
shown). At week 6, the LW/BW ratio did not differ significantly between the rats
of the four treatment groups (Fig 4.3b). The LW/BW ratios significantly (p<0.05)
decreased in all treatment groups from week 6 to 10. At week 10, the LW/BW
ratio of only the rats fed 1.5% Fe was significantly higher than the control group,
while at week 15, all the iron-fed groups (receiving 0.5% Fe for 5 weeks) had
significantly higher LW/BW ratios.
The LW/BW ratio of the 2% Fe group was significantly (p<0.05) higher than the
1% Fe group at week 15. The increase in the LW/BW ratio between weeks 10
and 15 was significant (p=0.017) in the 2% Fe group only.

RESULTS
59
2.00
3.00
4.00
5.00
6.00
0 1 1.5 2% Fe
LW/BW (%)
Fig 4.3a
2.00
3.00
4.00
5.00
6.00
6 10 15Week
LW/BW (%)
Group
0 % Fe1 % Fe1.5 % Fe2 % Fe
Fig 4.3b
Fig 4.3. a) The effect of varying dietary iron levels on the combined liver to body weight (LW/BW) ratio of each group over the experimental period of 15 weeks. Standard deviations for individual LW/BW ratios at each time point are shown in the Appendix in Table A.IIIa. b) The effect of the dietary iron levels on the LW/BW ratio as a function of time. The dietary iron level of all treatment groups was reduced to 0.5% after 10 weeks.
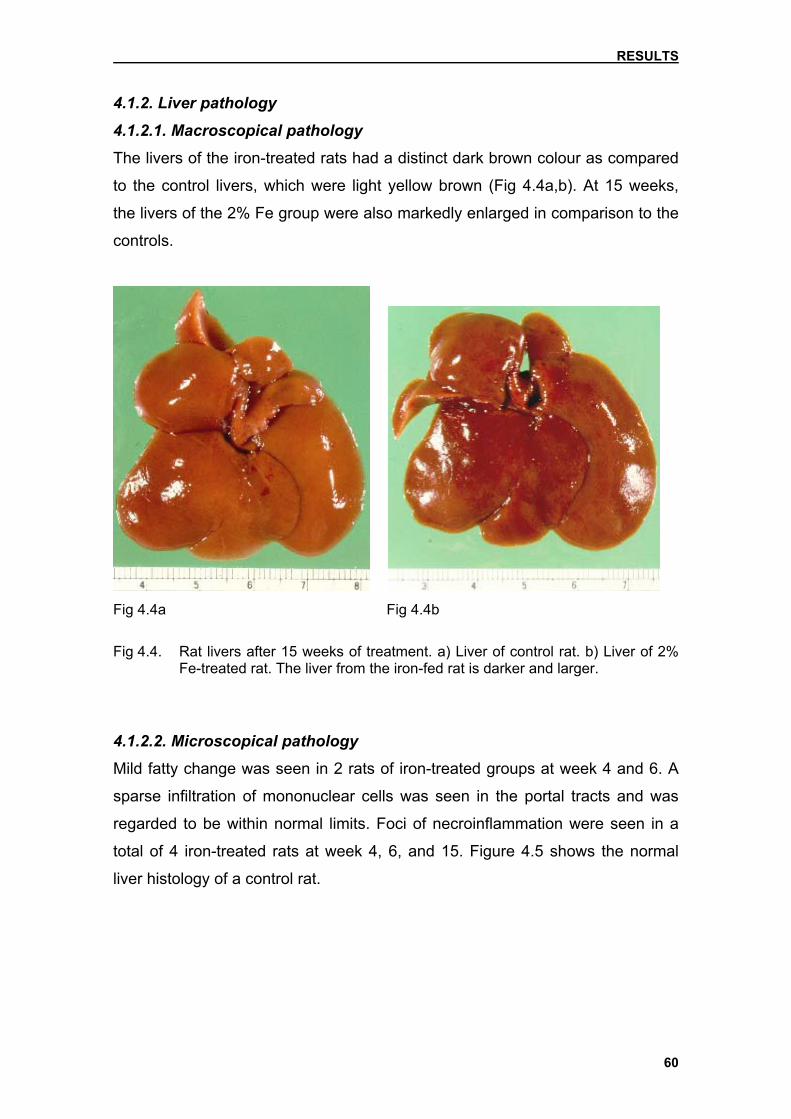
RESULTS
60
4.1.2. Liver pathology
4.1.2.1. Macroscopical pathology
The livers of the iron-treated rats had a distinct dark brown colour as compared
to the control livers, which were light yellow brown (Fig 4.4a,b). At 15 weeks,
the livers of the 2% Fe group were also markedly enlarged in comparison to the
controls.
Fig 4.4a Fig 4.4b
Fig 4.4. Rat livers after 15 weeks of treatment. a) Liver of control rat. b) Liver of 2%
Fe-treated rat. The liver from the iron-fed rat is darker and larger.
4.1.2.2. Microscopical pathology
Mild fatty change was seen in 2 rats of iron-treated groups at week 4 and 6. A
sparse infiltration of mononuclear cells was seen in the portal tracts and was
regarded to be within normal limits. Foci of necroinflammation were seen in a
total of 4 iron-treated rats at week 4, 6, and 15. Figure 4.5 shows the normal
liver histology of a control rat.
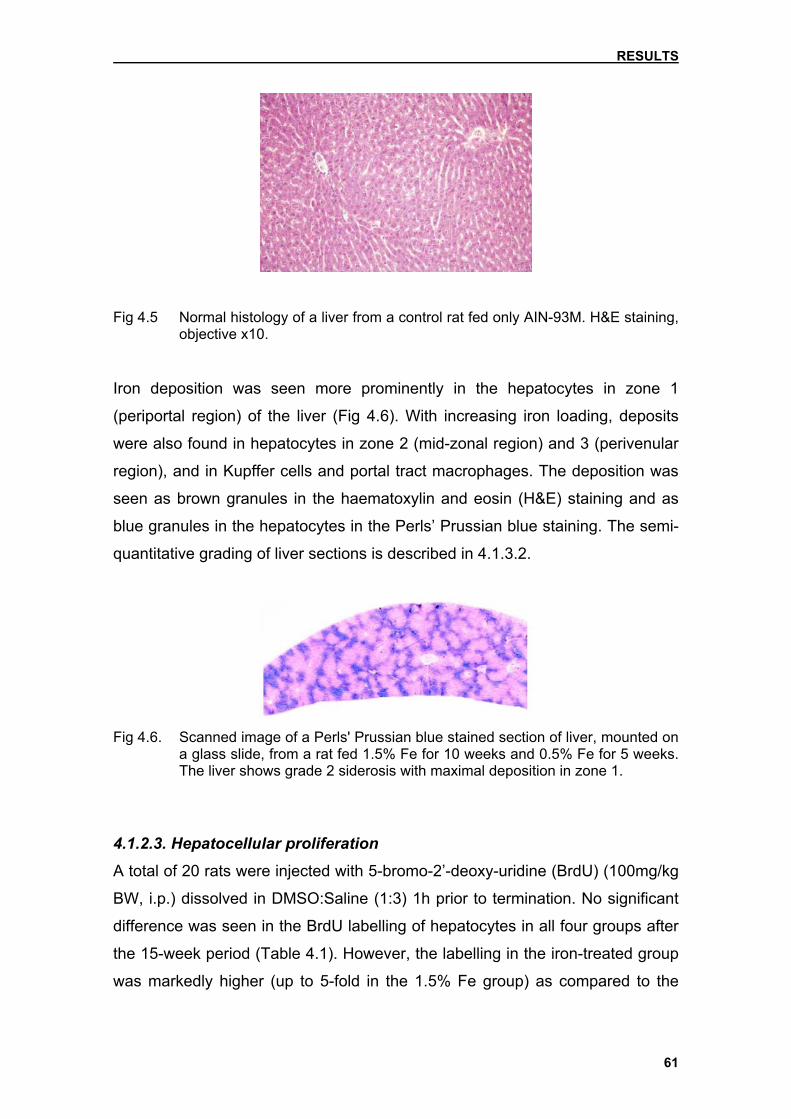
RESULTS
61
Fig 4.5 Normal histology of a liver from a control rat fed only AIN-93M. H&E staining, objective x10.
Iron deposition was seen more prominently in the hepatocytes in zone 1
(periportal region) of the liver (Fig 4.6). With increasing iron loading, deposits
were also found in hepatocytes in zone 2 (mid-zonal region) and 3 (perivenular
region), and in Kupffer cells and portal tract macrophages. The deposition was
seen as brown granules in the haematoxylin and eosin (H&E) staining and as
blue granules in the hepatocytes in the Perls’ Prussian blue staining. The semi-
quantitative grading of liver sections is described in 4.1.3.2.
Fig 4.6. Scanned image of a Perls' Prussian blue stained section of liver, mounted on
a glass slide, from a rat fed 1.5% Fe for 10 weeks and 0.5% Fe for 5 weeks. The liver shows grade 2 siderosis with maximal deposition in zone 1.
4.1.2.3. Hepatocellular proliferation
A total of 20 rats were injected with 5-bromo-2’-deoxy-uridine (BrdU) (100mg/kg
BW, i.p.) dissolved in DMSO:Saline (1:3) 1h prior to termination. No significant
difference was seen in the BrdU labelling of hepatocytes in all four groups after
the 15-week period (Table 4.1). However, the labelling in the iron-treated group
was markedly higher (up to 5-fold in the 1.5% Fe group) as compared to the

RESULTS
62
controls. No BrdU labelling was performed at the 6 and 10-week termination
time points.
Table 4.1. BrdU labelling of hepatocytes in the liver of rats treated with different dietary levels of iron for 15 weeks.
BrdU labelling* Treatment group
Control 1% 1.5% 2% Fe
Cells/cm2 0.77±1.22 1.77±1.55 3.98±2.65 2.44±2.90 *Values represent the means ± standard deviation of 5 rats per group. Dietary iron levels of all the treatment groups were reduced to 0.5% after 10 weeks.
4.1.3. Hepatic iron analysis
4.1.3.1. Biochemical measurement
Over the study period of 15 weeks, the means of the log transformations of the
hepatic iron levels of the iron-treated rats were significantly (p=0.0001) higher
than the controls (Fig 4.7a). At 4 weeks (pre-weaning treatment period), the
hepatic iron level of the weaned rats was significantly (p=0.0004) higher than
that of the controls.
At week 10, the level of hepatic iron in rats in the 2% Fe treatment group was
significantly (p<0.05) higher as compared to the 1% and 1.5% Fe-treated rats
(Fig4.7b). After the reduction in dietary iron to 0.5% for 5 weeks, the hepatic
iron concentration significantly decreased in the 1.5 % (p=0.03) and 2% Fe
(p=0.012) groups while no significant (p=0.55) change was noticed in the 1% Fe
group. There was no significant difference in the hepatic iron levels between the
three iron-treated groups after 15 weeks. The hepatic iron level significantly
(p=0.001) increased in the control group during this treatment period.

RESULTS
63
0.00
0.63
1.25
1.88
2.50
0 1 1.5 2 % Fe
Hepatic iron (log)
Fig 4.7a
0.00
0.63
1.25
1.88
2.50
6 10 15 Week
Hepatic iron (log)
Group 0 % Fe 1 % Fe 1.5 % Fe 2 % Fe
Fig 4.7b
Fig 4.7. a) Level of hepatic iron (log) in rats fed varying dietary iron levels over a period of 15 weeks. b) The effect of dietary iron as a function of time on the hepatic iron level. The dietary iron level of all treatment groups was reduced to 0.5% after 10 weeks. Mean hepatic iron level of 2% Fe-treated rats was significantly (p<0.05) higher than in the 1% and 1.5% Fe treatment groups at 10 weeks. Standard deviations for individual hepatic iron concentrations not shown due to the use of log transformations.

RESULTS
64
4.1.3.2. Histological assessment
The semi-quantitative assessment of the Perls’ Prussian blue staining of the
liver sections of iron-treated rats demonstrated progressive hepatic iron loading.
Grading was performed as described in section 3.6.2. Iron-treated rats were
constantly given significantly (p<0.05) higher scores than the controls at all time
points.
When comparing the different iron-treated groups, a significant increase in
hepatic iron was seen between weeks 4 and 6 in the 1.5% (p=0.002) and 2%
Fe groups (p=0.019), while it was markedly increased in the 1% Fe group
(Table 4.2.). At 6 weeks, hepatic iron of the 1% Fe group reached a maximum,
while that of the 1.5% and 2% Fe treatment groups reached a maximum after
10 weeks. At 10 weeks, the mean score given to the 1% Fe group was
significantly lower than the 1.5% Fe group (p=0.002) and the 2% group
(p=0.004). Between weeks 10 and 15, hepatic iron scores decreased
significantly (p=0.001) in the 1.5% Fe-treated group, and marginally (p=0.062)
in the 2% Fe group.
Table 4.2. Semi-quantitative hepatic iron grading of liver sections of rats receiving different dietary iron levels for over a period of 15 weeks.
Treatment group Weeks
(% Fe) 4 6 10 15
1% 1.5±0.58 2.7±1.0a 2.7±0.45a 2.4±0.89a
1.5% nd 3.4±0.89a* 3.8±0.45b# 1.8±0.45a#
2% nd 2.8±0.27a* 3.7±0.45b 2.7±0.84a Dietary iron levels of all the treatment groups were reduced to 0.5% after 10 weeks. Values represent the means ± standard deviation of 4 to 5 rats per group. Values followed by the same letter do not differ significantly at the respective time point. *Values significantly increased as compared to the 1% Fe group at 4 weeks. #Significant (p=0.001) decrease in hepatic iron score from week 10-15. nd=not determined.

RESULTS
65
A significant (p=0.0001) correlation (r2=0.8986) exists between the quantitative
biochemical measurement and the semi-quantitative visual assessment of
hepatic iron content (Fig 4.8.).
Fig 4.8. The correlation between the semi-quantitative grading and biochemical measurement of hepatic iron content.
0
50
100
150
200
1 2 3 4
Grading
Hep
atic
iron
(mm
ol/k
g)

RESULTS
66
4.1.4. Hepatic lipid peroxidation
The mean log malondialdehyde (MDA) levels decreased significantly (p=0.004)
in all treatment groups as a function of time, irrespective the dietary iron
regimen (Fig 4.9a). There was a significant (p=0.0001) interaction between the
increase in the mean log MDA level and dietary iron level between weeks 6 to
15.
When considering the individual treatment groups, there was a significant
(p=0.01) increase in the MDA values of the iron-treated group compared to the
controls at week 4 (pre-weaning treatment period). At week 6, dietary
supplementation with 1.5% and 2% Fe increased the MDA values to
significantly (p<0.05) higher levels than those of the controls, while the mean
MDA of 1% Fe group was markedly (not significantly) higher (Fig 4.9b).
At week 10, only the 1.5% Fe-treated rats had significantly (p<0.05) higher MDA
levels while the mean levels in the 1% and 2% Fe rats were markedly (not
significantly) increased above the control rats.
The MDA levels were significantly decreased in the 1% (p=0.017) and 1.5%
(p=0.001) Fe groups after the reduction of the dietary iron level to 0.5%.
However, the MDA levels of the 1.5%, as well as the 2% Fe groups, were still
significantly (p<0.05) increased above the controls.
Measurement of lipid peroxidation by measuring conjugated dienes (CD) was
far less sensitive, however a marginal increase (p<0.1) was observed in the
iron-treated groups above the controls over the 6 to 15 week experimental
period (Fig 4.10).

RESULTS
67
-2.00
-1.38
-0.75
-0.13
0.50
6 10 15Week
MDA (log)
Fig 4.9a
-2.00
-1.38
-0.75
-0.13
0.50
6 10 15Week
MDA (log)
Group0 % Fe1 % Fe1.5 % Fe2 % Fe
Fig 4.9b
Fig 4.9. a) The combined levels (log) of lipid peroxidation measured as malondialdehyde (MDA) in the liver of all rats over a period of 15 weeks. b) The effect of dietary iron level on MDA as a function of time. The dietary iron level of all the treatment groups was reduced to 0.5% after 10 weeks. Standard deviations for individual MDA levels not shown due to the use of log transformations.
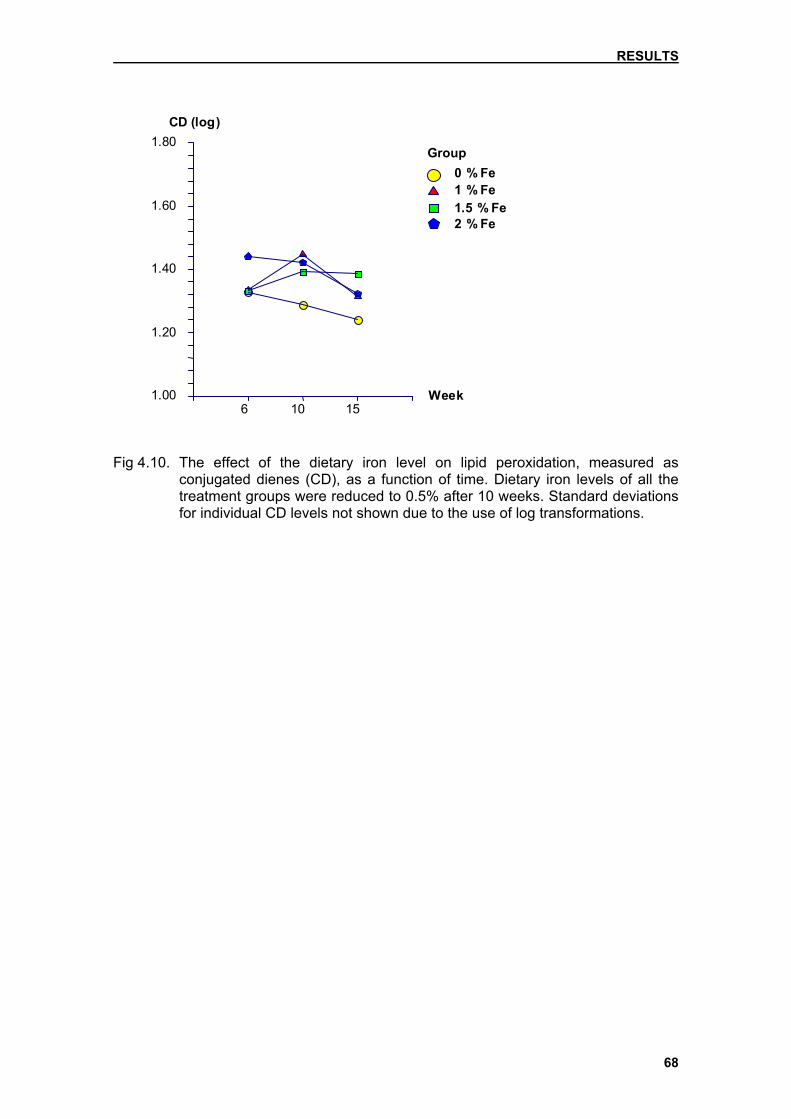
RESULTS
68
1.00
1.20
1.40
1.60
1.80
6 10 15Week
CD (log)
Group0 % Fe1 % Fe1.5 % Fe2 % Fe
Fig 4.10. The effect of the dietary iron level on lipid peroxidation, measured as
conjugated dienes (CD), as a function of time. Dietary iron levels of all the treatment groups were reduced to 0.5% after 10 weeks. Standard deviations for individual CD levels not shown due to the use of log transformations.

RESULTS
69
4.2. Long-term study Using a dietary level of 1% Fe for 10 weeks, and a reduction to 0.5% Fe at the
time FB1 feeding commenced, the interaction between FB1 and increased
hepatic iron levels was examined in the long-term study. FB1 was removed at
35 weeks, while iron feeding continued until week 60 (see Chapter 3.4.3,
Experimental design).
4.2.1 Feed intake
The feed intake of rats from the Fe group (4-10 weeks) and FB1/Fe and FB1/AIN
groups (10-60 weeks) was monitored on a weekly basis and the other groups
averaged fed accordingly (see Chapter 3.4.3). Rats fed iron-supplemented feed
had softer faeces than non-iron-fed rats; however, no diarrhoea developed in
any rats. The profiles of average daily feed, dietary iron, and fumonisin B1 (FB1)
intake of the rats are presented in Table 4.3, 4.4, and 4.5.
Table 4.3. Average daily feed intake of rats during the experimental period of 60
weeks. Treatment group Feed intake (g/100 g BW)
4-10 wks 10-35 wks 35-60 wks
FB1/Fe nd 5.2±1.0 4.0±0.9
Fe 10.2±2.1 4.9±0.9 4.3±1.7
FB1/AIN nd 5.1±1.0 4.0±0.8
Control 8.5±1.4 4.6±0.8 4.0±1.5 Dietary iron levels of the iron treatment groups were reduced to 0.5% at 10 weeks, at which time FB1 feeding commenced. Values represent the means ± standard deviation per group. nd: not determined.
Table 4.4. Average daily additional* dietary iron intake of rats during the experimental period of 60 weeks.
Treatment group Dietary iron intake (mg/100 g BW)*
4-10 wks 10-35 wks 35-60 wks
FB1/Fe nd 26.0±1.0 20.0±0.9
Fe 102.0±2.1 24.5±0.9 21.5±1.7 *Iron content in AIN-93M diet (35 mg per kg diet) was not taken into consideration. Dietary iron levels of the iron treatment groups were reduced to 0.5% at 10 weeks. Values represent the means ± standard deviation per group. nd: not determined.

RESULTS
70
Table 4.5. Average daily FB1 intake of rats during the experimental period of 10-35 weeks.
Treatment group FB1 intake (mg/100 g BW)*
Week 10-15 Week 15-35
FB1/Fe 1.67±0.1 0.48±0.1
FB1/AIN 1.65±0.1 0.47±0.1 *Rats were fed 250 mg FB1/kg diet for 5 weeks, followed by 100 mg/kg for 20 weeks. Dietary iron levels of the iron treatment groups were reduced to 0.5% at 10 weeks at which time FB1 feeding commenced. Values represent the means ± standard deviation per group.
4.2.2. Body weight and total body weight gain
The mean body weight (BW) of the rats increased significantly (p<0.0001) over
the study period, but there was no significant interaction (p=0.95) between the
BW and treatment regimen. Corresponding to this data, the total body weight
(tBWG) between the different time points of measurement was also significant
(p<0.0001) and did not differ significantly between the groups (Fig 4.11).
Fig 4.11. The total body weight gain (tBWG) of all treatment groups as a function of
time. Dietary iron levels of the iron treatment groups were reduced to 0.5% after 10 weeks. Standard deviations are shown in the Appendix in Table AIIIb.
0
50
100
150
200
250
300
350
0 10 20 30 40 50 60
Week
tBW
G (g
) FB /Fe
Fe
FB /AIN
Control
1
1

RESULTS
71
4.2.3. Liver to body weight ratios
Treatment period: weeks 4-10 (iron loading period) There was a significant (p=0.004) interaction between the increased liver to
body weight (LW/BW) ratio and excess iron during the treatment period (Fig
4.12). At week 4, the LW/BW ratios of the controls were higher than the ratios of
the iron-treated group, though not significantly. However, at week 10, the
means of the LW/BW ratio were significantly (p<0.05) higher in the iron-fed
group as compared to control rats, increasing significantly in comparison to both
groups at week 4. In contrast, the LW/BW ratio of the control rats tended to
decrease (not significantly).
Treatment period: weeks 10-35 (FB1 treatment period) The mean LW/BW ratios of the rats decreased significantly (p<0.05) for all
treatment groups from 10 to 35 weeks (Fig 4.12). The Fe group had significantly
(p<0.05) higher ratios than the other three groups, including the FB1/Fe group,
at 35 weeks.
Treatment period: weeks 35-60 (post FB1 treatment period) The LW/BW ratios showed a significant (p<0.05) increase over this time period
(Fig 4.12). After removal of FB1 from the diet, the mean LW/BW ratios increased
significantly (p<0.001) in the FB1/Fe group and reached a similar level as the Fe
group. The increase in the Fe group was marginally significant (p=0.06) during
the same treatment period. The LW/BW ratios of both iron-treated groups were
significantly (p<0.001) higher than the non-iron treated rats at 60 weeks. The
difference between FB1-treated and control rats was not significant at this time.

RESULTS
72
2
2.5
3
3.5
4
4.5
5
5.5
4 10 35 60
Week
LW/B
W(%
) FB /FeFeFB /AINControl
Fig 4.12. The liver to body weight (LW/BW) ratios of all treatment groups as a function
of time. Dietary iron levels of the iron-treated groups were reduced to 0.5% after 10 weeks.
4.2.4. Haematological and biochemical parameters
The biochemical parameters of one control rat showing abnormal pathology at
35 weeks was not used in the statistical analysis because of the resulting
distortion of the means ± standard deviation.
No significant difference was noticed between the different treatment groups
and time points with regard to haematological parameters including white blood
cell count (WBC), platelet count (PL), red blood cell distribution width (RDW)
and basophilic cells.
The percentage of neutrophil cells increased significantly (p<0.035) in the Fe
group between 35 and 60 weeks. When considering the quantitative mean
neutrophil count (1/100), the removal of FB1 increased the count in the FB/Fe
group. The increase between 35 and 60 weeks was marginally significant in the
FB/Fe (p=0.056) and Fe (p=0.059) group.
The mean lymphocyte percentage significantly (p<0.001) decreased over the
time period, irrespective of treatment group. In comparison, the mean
percentage of monocytes increased significantly (p=0.001) as a function of time
with no interaction with Fe or FB1.
1
1

RESULTS
73
The red blood cell count (RBC) significantly (p=0.001) increased with time,
irrespective of treatment group. At 35 weeks, FB1-treated rats had significantly
(p<0.05) lower values than their counterparts (Fig 4.13a). After the FB1 was
omitted from the diet, the RBC of the rats increased significantly to levels similar
to that of the non FB1-treated rats. In addition, iron-treated rats tended to have
lower RBC means than non-treated rats but the difference was not significant.
Similar to the RBC levels, the haematocrit (HCT) levels were significantly
(p<0.05) lower at 35 week in the FB1-treated rats as compared to the non-
treated rats (Fig 4.13b). The mean HCT significantly (p=0.001) increased from
week 35 to 60. The haemoglobin (Hb) values were also significantly (p=0.05)
decreased by FB1 when compared to the other treatment groups (Fig 4.13c).
Upon removal of FB1 at 35 weeks, the Hb increased significantly towards the
levels monitored in the untreated control rats.
6.50
7.38
8.25
9.13
10.00
35 60Week
RBS (x1012/l)
FB1
NoYes
Fig 4.13a

RESULTS
74
30.00
35.00
40.00
45.00
50.00
35 60Week
HCT (%)
FB1
NoYes
Fig 4.13b
11.00
12.25
13.50
14.75
16.00
35 60Week
Hb (g/dl)
FB1
NoYes
Fig 4.13c
Fig 4.13. The effect of FB1-treatment (10-35 weeks) and subsequent removal from the diet at 35 weeks on a) red blood cell count (RBC); b) haematocrit (HCT); and c) haemoglobin (Hb). Standard deviations of individual groups are shown in the Appendix in Table AIIIc.

RESULTS
75
The mean cell volume (MCV) was significantly increased in iron-treated rats at
both 35 and 60 weeks (p=0.03). The FB1/Fe group had significantly (p<0.05)
higher values than the other groups, while values of the Fe group were
significantly (p<0.05) higher than that of the FB1/AIN and control groups (Fig
4.14).
The mean cell haemoglobin (MCH) decreased significantly (p<0.001) from 35 to
60 weeks, irrespective of group. Iron-treated rats had significantly (p<0.001)
higher means than non-iron-treated rats (Fig 4.15a). Corresponding to this, the
overall mean cell haemoglobin concentration (MCHC) also decreased
significantly (p<0.001) from 35 to 60 weeks. Again, iron-treated rats had
significantly (p<0.001) higher means than non-iron-treated rats (Fig 4.15b). No
effect was noticed as a result of the FB1-treatment.
44.00
46.50
49.00
51.50
54.00
No YesFB1
MCV (fl)
FeNoYes
Fig 4.14. The effect of FB1 and excess iron on the mean cell volume (MCV) during the
35 to 60 week experimental period. Standard deviations of groups at each time point are shown in the Appendix in Table AIIIc.

RESULTS
76
15.00
15.75
16.50
17.25
18.00
35 60Week
MCH (pg)
FeNoYes
Fig 4.15a
31.00
32.50
34.00
35.50
37.00
35 60Week
MCHC (%)
FeNoYes
Fig 4.15b
Fig 4.15. The effect of excess iron on a) mean cell haemoglobin (MCH) and b) the mean cell haemoglobin concentration (MCHC) as a function of time (weeks). Standard deviations of individual groups are shown in the Appendix in Table AIIIc.

RESULTS
77
The biochemical data consisting of serum glucose, γ-glutamyl transpeptidase
(GGT), total protein, urea, and total cholesterol were not affected by FB1 during
the treatment period of 25 weeks (10 to 35 weeks) and the post FB1 period up
to 60 weeks.
The mean serum iron was significantly (p<0.001) higher in iron-treated rats than
in their counterparts (Fig 4.16). Rats from the FB1/Fe group also tended to have higher iron levels than rats treated with dietary iron only, though the differences
were not significant (p>0.05).
10.00
21.25
32.50
43.75
55.00
No YesFB1
Serum iron (µmol/l)
FeNoYes
Fig 4.16. The effect of FB1 and dietary iron on serum iron at 60 weeks.
The mean total and direct bilirubin decreased significantly (p<0.001) over time,
irrespective of treatment group. At week 35, the rats from the FB1/AIN group
had significantly (p<0.05) higher levels than non-treated rats, while Fe
significantly (p=0.05) decreased the bilirubin parameters (Fig 4.17a,b).
However, at 60 weeks the effect of FB1 was reversed following the removal of
the compound from the diet. A similar effect was noticed with respect to the Fe
where the total and direct bilirubin were reduced over time to similar levels of
the control rats.

RESULTS
78
0.00
5.00
10.00
15.00
20.00
35 60 Week
Total bilirubin (µmol/l)
FB1 No Yes
Fig 4.17a
0.00
3.00
6.00
9.00
12.00
35 60 Week
Direct bilirubin (µmol/l)
Fe No Yes
Fig 4.17b Fig 4.17. a) The effect of FB1-treatment (10-35 weeks) and subsequent removal from
the diet at 35 weeks on total bilirubin. b) The effect of excess iron on direct bilirubin during the 35 to 60 week experimental period. Standard deviations of individual groups are shown in the Appendix in Table AIIIe.

RESULTS
79
The combined treatment of FB1/Fe exhibited a marginal effect (p<0.1) regarding
an increase in the level of the serum enzyme aspartate transferase (AST) (Fig
4.18a). A similar response was noticed with respect to the level of alanine
transaminase (ALT), which was significantly (p=0.03) increased by FB1 (Fig
4.18b). In this regard, the combined FB1/Fe group exhibited ALT levels
significantly (p<0.05) higher when compared to the control group.
The mean alkaline phosphatase (ALP; p=0.03) and creatinine (p=0.03) levels
significantly) decreased as a function of time while dietary iron further
accentuated (p=0.04) the decrease in ALP. FB1 on the other hand significantly
(p=0.001) increased both the ALP and creatinine levels and rats from the
FB1/AIN group had overall significantly (p<0.05) higher ALP values than the
other groups (Fig 4.19a). After removal of FB1, both creatinine and ALP
decreased significantly (p<0.05) in these rats (Fig 4.19b). At 60 weeks no
significant differences were noticed between the FB1/AIN treated and control
rats with respect to these two parameters.
4.2.5. Liver pathology
4.2.5.1. Macroscopical pathology
The livers of the iron treated rats were yellow-brown in colour and were larger
than the controls. At 35 weeks, the FB1/Fe treated animals (5/5) exhibited
numerous white foci/nodules on the capsular surface, ranging from 2-8 mm in
size and found throughout the liver (Fig 4.20a). A similar appearance was
noticed in the liver of the FB1-treated rats although only 4/5 rats had
foci/nodules, and these were noted to be smaller than those of the FB1/Fe (2-4
mm) (Fig 4.20b).
At 60 weeks, the difference between the two FB1-treated groups was not as
marked. All rats in the two groups had various nodules on the external surface
and these ranged in size from small (2 mm) to massive growths over 10 mm
(Fig 4.20c,d). All lobes were affected. One rat from the Fe group also had a 3-4
mm nodule in the median lobe.

RESULTS
80
100.00
225.00
350.00
475.00
600.00
No YesFB1
AST (U/l)
FeNoYes
Fig 4.18a
0.00
100.00
200.00
300.00
400.00
No YesFB1
ALT (U/l)
FeNoYes
Fig 4.18b
Fig 4.18. The effect of FB1 and iron overload on a) aspartate transaminase (AST) and b) alanine transaminase (ALT) during the 35 to 60 week experimental period. Standard deviations of groups at each time point are shown in the Appendix in Table AIIIe.

RESULTS
81
50.00
112.50
175.00
237.50
300.00
No YesFB1
ALP (U/l)
FeNoYes
Fig 4.19a
50.00
65.00
80.00
95.00
110.00
35 60Week
Creatinine (µmol/l)
FeNoYes
Fig 4.19b
Fig 4.19. a) The effect of FB1 and dietary iron on alkaline phosphatase (ALP) over the 35 to 60 week experimental period. b) The effect of dietary iron treatment on creatinine during the 35 to 60 week experimental period. Standard deviations of individual groups and at each time point are shown in the Appendix in Table AIIIe.

RESULTS
82
Fig 4.20a Fig 4.20b
Fig 4.20c Fig 4.20d Fig 4.20. Liver pathology of the fumonisin B1-treated rat. Livers of rats treated with
FB1/Fe at a) 35 weeks and c) 60 weeks. Livers of rats treated with FB1/AIN at b) 35 weeks and d) 60 weeks. Arrows depict foci/nodules at 35 weeks and larger nodules at 60 weeks.

RESULTS
83
4.2.5.2. Microscopical pathology Termination time point: weeks 4 and 10 (iron loading period) At age 4 and 10 weeks, 5 rats from both groups were terminated in order to
assess the ‘baseline’ hepatic iron loading.
As in the pilot study, iron deposition seen as brown granules in the H&E staining
and as blue granules in the Perl’s Prussian blue staining were observed most
prominently in the hepatocytes in zone 1 (periportal region) of the liver. With
increasing iron loading, deposits were also found in hepatocytes in zone 2 (mid-
zonal region) and 3 (perivenular region). Minimal iron accumulation was seen in
Kupffer cells and portal tract macrophages.
At 10 weeks, a mild non-specific steatohepatitis was observed in 1 iron-treated
rat (1/5). Minimal fatty change and foci of necroinflammation were observed in
both iron-treated and control rats.
Termination time point: week 35 (25-week FB1 treatment period) FB1/Fe group
After treatment with FB1, at week 35, all rats (5/5) in FB1/Fe group exhibited at
least 1 nodule displaying high-grade dysplasia, with 4/5 having several nodules
(Fig 4.21a; Table 4.6). Three from 5 rats also showed smaller nodules and foci
showing mild or no dysplasia. High-grade dysplasia, as defined earlier for the
purpose of this study (see Chapter 3.5.1), was characterised by the presence of
a non-invasive pushing edge into adjacent liver tissue, large cells with clear
cytoplasm, mitosis, intranuclear inclusions, large nucleoli, apoptosis of
occasional dysplastic cells, and moderate nuclear pleomorphism (Fig 4.21b).
Oval cells were seen inside each of the high-grade dysplastic lesions. No
hepatocellular cancers (HCCs), characterised by invasion into surrounding liver
tissue and the vascular system, and metastasis to other organs, were seen.

RESULTS
84
Fig. 4.21a Fig. 4.21b
Fig 4.21. Liver histopathology in FB1/Fe treated rats. High-grade dysplastic nodule at 35 weeks at a) objective x4 and b) objective x20; H&E staining.
Iron distribution in these rats had changed as compared to iron-loaded rats at
10 weeks. Iron deposition was still seen in hepatocytes, but due to a shift of iron
from necrotic hepatocytes, deposits were also seen in Kupffer cells and portal
tract macrophages (Fig 4.22). Hepatocytes in the dysplastic nodules did not
contain iron, but some iron deposition was seen in Kupffer cells within the
nodules.
Fig 4.22. Shift in iron distribution in liver section of FB1/Fe-treated rat. Iron is seen in Kupffer cells (straight arrow) and portal tract macrophages (diagonal arrow) as well as in most of the hepatocytes. Perls’ Prussian blue staining, objective x10.

RESULTS
85
Fe group
The rats in the Fe group showed iron deposition in hepatocytes, Kupffer cells,
and portal tract macrophages, as described at week 10, but no evidence of liver
injury and no nodules were seen.
FB1/AIN group
Only 2 rats (2/5) in the FB1/AIN group had nodules showing high-grade
dysplasia (Fig 4.23). The dysplasia showed the same characteristics as
described for FB1/Fe group. In 1 rat (1/5), an area of fatty change, several small
low-grade dysplastic nodules and 1 small focus, also displaying low-grade
dysplasia, were observed. Two rats (2/5) showed no liver injury at all and were
thought to be control animals until the codes on the glass slides were broken.
No HCCs were seen.
Fig 4.23. High-grade dysplastic nodule in FB1/AIN treated rat at 35 weeks. H&E staining, objective x4.
Iron deposition in Kupffer cell and portal tract macrophages was also seen in 2
FB1/AIN animals, which had received no iron supplementation. Hepatocytes,
however, had accumulated no iron.
Control group
Some of the control rats showed minor changes: minimal fatty change (2/5),
portal tract inflammation (2/5), and tiny foci of necroinflammation (2/5). One
control rat, however, showed bile ductular proliferation in one portal tract,
polymorphs and ductular cells in the parenchyma, and terminal portal

RESULTS
86
inflammatory infection. No nodules were seen and the cause of this pathology is
not known but it may have been in some way related to respiratory infection that
occurred in the final days (see Chapter 4.2.8).
Table 4.6. Summary of hepatic nodules and foci seen histologically in H&E staining at 35 weeks.
Treatment group Total no. of nodules/foci in H&E sections
FB1/Fe 33 (in 5/5 rats)
Fe 0
FB1/AIN 7 (in 3/5 rats)
Control 0 Termination time point: week 60 (25-week post FB1 treatment period) FB1/Fe treated rats
At 60 weeks, 8 animals in the FB1/Fe group (8/10) showed at least 1 high-grade
nodule, and 6 of these 8 rats had several large nodules showing high-grade
dysplasia, and also smaller nodules and foci showing varying degrees dysplasia
(Table 4.7). Most of the hepatocytes within the nodules had clear cytoplasm, but
some ‘mixed’ cell nodules (clear cells and cells with abundant deeply
eosinophilic cytoplasm) were also seen. Most of the nodules showing high-
grade dysplasia contained mitosis, and showed apoptosis as well as prominent
numbers of oval cells. Two rats (2/10) developed only low-grade dysplastic
nodules and foci. Also, mild fatty change, slight portal tract inflammation, and
foci of necroinflammation in the parenchyma were observed in some rats. No
HCCs were seen.
Iron distribution was similar as seen in rats from the same group terminated at
35 weeks. Iron granules were still seen in hepatocytes, but due to a shift of iron
from necrotic hepatocytes, increasing deposition was seen in Kupffer cells and
portal tract macrophages. Hepatocytes in the dysplastic nodules did not contain
iron, but again deposition was seen in Kupffer cells within the nodules (Fig
4.24).

RESULTS
87
Fig 4.24. Liver section of rat from the FB1/Fe group at 60 weeks showing grade 3 parenchymal iron deposition. Arrow points to iron-free nodule. Perls’ Prussian blue staining, objective x20.
Fe-treated rats
Three rats in the Fe-treated group (3/9) showed mild fatty change, 1 showed
portal tract inflammation and 1 rat developed a focus of necroinflammation in
the parenchyma. One iron-treated rat developed mild fatty change and
surprisingly 1 large, mixed cell nodule. The nodule showed high-grade
dysplasia with fatty change within the nodule, mitosis, moderate nuclear
pleomorphism, and some cells with multiple nucleoli.
Increased iron accumulation was seen in Kupffer cells and portal tract
macrophages, in addition to deposition in hepatocytes. The hepatocytes in the
nodule showed no iron deposition (Fig 4.25).
Fig 4.25 Digital image of a Perls' Prussian blue stained section of liver mounted on a
glass slide. The nodule did not stain; no iron had accumulated in hepatocytes.

RESULTS
88
FB1/AIN –treated rats
Eight rats of 10 in the FB1/AIN group (8/10) had at least 1 large nodule of high-
grade dysplasia (Fig 4.26). The dysplasia showed the same characteristics as
described for FB1/Fe group. In addition, these 8 rats had smaller nodules of
varying degree of dysplasia and the remaining 2 rats (2/10) had only foci of low-
grade dysplasia. Portal tract inflammation was observed in 1 rat (1/10) and fatty
change was described in 3 rats, of which 1 rat showed severe fatty change. No
HCCs were seen.
Fig 4.26. High-grade dysplastic nodule in FB1/AIN-treated rat at 60 weeks. The arrow points to oval cells. H&E staining, objective x20.
Iron deposition in Kupffer cell and portal tract macrophages was also seen in 2
FB1/AIN animals, which had received no iron supplementation and had no iron
deposition in the hepatocytes.
Control rats
Control animals showed mild fatty change (6/10), a focus of necroinflammation
(1/10), and portal tract inflammation (1/10). One animal had 2 very small foci of
dysplastic cells.

RESULTS
89
Table 4.7. Summary of hepatic nodules and foci seen histologically in H&E staining at 60 weeks.
Treatment group Total no. of nodules/foci in H&E sections
FB1/Fe > 68* (in 10/10 rats)
Fe 1 (in 1/10 rat)
FB1/AIN > 50* (in 10/10 rats)
Control 0 *Exact number of nodules not determined because of poorly defined borders.
4.2.5.3. Immunohistochemistry
4.2.5.3.1. Hepatocellular proliferation
Termination time point: week 35 (25-week FB1 treatment period) A total of 10 rats were injected with 5-bromo-2’-deoxy-uridine (BrdU) (100
mg/kg BW, i.p.) dissolved in DMSO:Saline (1:3) 1h prior to termination. Figure
4.27 shows a liver section taken from a rat from the group FB1/Fe at 35 weeks.
Due to the high number of stained hepatocytes in the FB1/Fe group, two
different methods were used to evaluate hepatocellular proliferation. Liver
sections of the 3 rats in the FB1/Fe group were scored by counting at least 500
cells per liver section (x40) and the labelling indices were expressed as a
percentage. One section from an FB1/AIN rat also showed a high labelling index
and was scored as a percentage. The sections from the other rats were scored
as the number of stained cells/cm2 (Table 4.8).
Fig 4.27. Section of liver from FB1/Fe rat at 35 weeks. The liver shows BrdU staining in
the nuclei of hepatocytes. BrdU antibody staining, objective x20.

RESULTS
90
Liver sections from rats treated with FB1/Fe had by far the most labelled
hepatocytes with a mean of almost 4% of hepatocytes being stained. Rats from
the FB1/AIN group had over twice as many labelled hepatocytes than the
controls and a third more than seen in the Fe group. The Fe group also
demonstrated twice as much labelling as the controls.
Table 4.8. BrdU labelling of hepatocytes in the liver of rats in the different
treatment groups at 35 weeks (FB1-feeding for 25 weeks). BrdU labelling* Treatment group
Fe FB1/AIN Control
No. of rats n=4 n=3 n=1
Cells/cm2 0.88±1.16 1.02±1.31 0.42 *Values represent the means ± standard deviation per group.
Termination time point: week 60 (25-week post FB1 treatment period) The sections from the 35 rats injected with BrdU prior to termination were
scored as the number of stained cells/cm2 and the index is illustrated in Table
4.7. The differences among the groups are not significant. However, the
labelling in the all treatment groups was markedly higher (over twice as much)
as compared to the controls.
Table 4.9. BrdU labelling of hepatocytes in the liver of rats in the different
treatment groups at 60 weeks (FB1 removal at 35 weeks). BrdU labelling* Treatment group
FB1/Fe Fe FB1/AIN Control
No. of rats n=8 n=8 n=10 n=9
Cells/cm2 0.71±0.57 0.73±1.09 0.81±0.92 0.34±0.34 *Values represent the means ± standard deviation per group.
4.2.5.3.2. Enzyme altered foci and/or nodules The number of single cells (‘singlets’) that were positive for the placental form of
glutathione S-transferase (GSTP+) was significantly (p<0.001) higher in iron-
treated rats than in non-iron rats at both 35 and 60 weeks. The FB1/Fe group
tended to have more GSTP+ singlets than those treated with iron alone, though

RESULTS
91
not significantly (p>0.05). A similar result was seen regarding GSTP+ ‘duplets’
(2 cells together). Iron-treated rats also had significantly (p<0.001) more stained
duplets than non-iron rats, though in contrast to single cell staining, rats treated
with iron alone tended to have higher numbers than the FB1/Fe. The number of
singlets and duplets significantly (p<0.005) decreased for iron-treated rats
between weeks 35 and 60.
At 35 weeks, groups of more than 2 GSTP+ cells were not reported. At 60
weeks, no significant (p>0.05) difference was seen between treatment groups in
regard to the number of groups with 4-10 GSTP+ cells.
Foci/nodules were divided into different groups according to the size (in µm) of
foci/nodules expressed per cm2 (Fig 4.29 and 4.30). The four treatment groups
did not differ significantly in regard to the number of foci smaller than 1 µm. Only
the FB1/AIN group had marginally (p=0.075) higher numbers than the Fe group
at 35 weeks.
At 35 weeks, FB1/Fe rats had significantly (p<0.033) more foci (size: 1-10 µm)
than control rats and marginally (p=0.053) higher than the Fe group (Fig 4.29).
The FB1/AIN group had markedly higher numbers of foci than the Fe and
control groups. Both FB1-treated groups had significantly more foci than the
control (p=0.001) and Fe groups (p<0.005) at 60 weeks (Fig 4.30). The increase
in the number of foci was not significant, however.
At both time points, the mean number of 10–20 µm nodules per cm2 was
significantly higher in FB1/Fe (p=0.001) as compared to rats treated with
FB1/AIN, as well as compared to the Fe and control groups (Fig 4.29 and Fig
4.30). At 35 weeks, 1 FB1/AIN rat developed nodules of this size. This
increased to 6 rats having nodules at 60 weeks, and the number of nodules per
cm2 was markedly higher than Fe and control rats, which did not show any
nodules at all. There was no significant difference in number of nodules when
comparing 35 to 60 weeks.

RESULTS
92
At 35 weeks, nodules of the size 20-50 µm were found in significantly higher
numbers in FB1/Fe group as compared to the Fe and control groups (p=0.025),
which did not develop any nodules of this size (Fig 4.29). Fig 4.28 depicts
GSTP+ cells of such a nodule from a rat in the FB1/Fe group. The mean number
of nodules per cm2 in the FB1/Fe group was marginally higher than the FB1/AIN
(p=0.083) rats, of which only 1 rat developed nodules. At 60 weeks, the FB1/Fe
group again had significantly higher numbers of nodules of this size as
compared to the Fe (p=0.001; 1 rat with 1 nodule) and control group (p<0.001;
no nodules) (Fig 4.30). The FB1/AIN group had marginally higher numbers than
the Fe group (p=0.079) and significantly higher than the controls (p=0.046). The
number of nodules marginally increased in rats of the FB1/AIN (p=0.09) and
FB1/Fe group (p=0.085) from week 35 to 60.
Fig 4.28. GSTP+ cells of a nodule 20-50 µm in a section of liver from an FB1/Fe treated rat at 35 weeks. GSTP staining, objective x10.
At 35 weeks, only 1 rat from FB1/Fe group (1/5) had 1 nodule larger than 50 µm.
At 60 weeks, both FB1-treated groups had developed equal numbers of nodules
larger than 50 µm/cm2. No nodules of this size were detected in the Fe and
control groups.

RESULTS
93
Fig 4.29. The number of foci/nodules seen in the different treatment groups at 35
weeks.
Fig 4.30. The number of foci/nodules seen in the different treatment groups at 60
weeks.
With respect to the total number of foci and nodules,
(i) at 35 weeks, only rats from the FB1/Fe group had a significantly higher
number than rats from the Fe (p=0.009) and the control group (p=0.006).
Though not significant, the FB1/Fe group had almost twice as many nodules
per cm2 as the FB1/AIN group. On the other hand, rats from the FB/AIN
group had developed markedly higher numbers of nodules than the Fe and
control groups;
(ii) at 60 weeks, both FB1-treated groups had significantly (p<0.008) more foci
and nodules than the Fe and control groups and did not differ significantly
from one another;
0.0
0.5
1.0
1.5
<1 '1-10 '10-20 '20-50 >50
µm
num
ber/c
m2 FB /Fe
FeFB /AINControl
0.0
0.5
1.0
1.5
<1 '1-10 '10-20 '20-50 >50µm
num
ber/c
m2 FB /Fe
FeFB /AIN Control
1
1
1
1

RESULTS
94
(iii) over all (35 and 60 weeks), due to the high numbers per cm2 at 35 weeks,
the FB1/Fe group developed significantly (p<0.05) more foci and nodules
than rats treated only with FB1 (Fig 4.31).
When considering only nodules (lesions larger than 10 µm), the FB1/Fe group
had significantly (p<0.005) higher total numbers (0.38/cm2) when compared to
the FB1/AIN (0.04/cm2) group at 35 weeks. The Fe and control groups had
developed no nodules at this time. This statistical significance in the FB1/Fe
group compared to the other groups was also observed at 60 weeks (p<0.014),
although there was no increase in total numbers of nodules in this group
(0.4/cm2). In contrast, the total number of nodules of this size markedly
increased in the FB1/AIN group (0.19/cm2) from week 35 to 60 and was
significantly higher than the Fe (p=0.042; 0.01/cm2) and control (p=0.022; no
nodules) groups.
0.00
0.75
1.50
2.25
3.00
No YesFB1
Number/cm2
FeNoYes
Fig 4.31. The effect of iron overload and FB1 on the total number of foci/nodules per
cm2 over the period of 35 and 60 weeks. Standard deviations of groups at each time point are shown in the Appendix in Table AIIIh.

RESULTS
95
4.2.6. Hepatic iron analysis
Biochemical measurement
Treatment period: weeks 4-10 (iron loading period) The hepatic iron level was significantly (p<0.001) higher in the iron-treated
group compared to the controls at both time points (Fig 4.32). Hepatic iron
concentrations decreased significantly (p<0.05) in the iron-treated group as a
function of time, while the levels in the livers of the control rats remained the
same.
Treatment period: weeks 10-35 (FB1 treatment period) There was a significant increase in hepatic iron levels in the FB1/Fe (p=0.023)
and control (p=0.009) group over this time period (Fig 4.32). At 35 weeks,
hepatic iron levels in the FB1/Fe group were significantly (p<0.01) higher than
the other three groups, while the Fe group had significantly (p=0.001) higher
levels than the FB1/AIN and control groups.
Treatment period: weeks 35-60 (post FB1 treatment period) After removal of FB1, hepatic iron levels decreased significantly in the FB1/Fe
(p=0.049) (Fig 4.32). The hepatic iron levels in both iron-treated groups no
longer differed significantly (p=0.2). These were however significantly (p<0.001)
higher than the non-iron groups.

RESULTS
96
Fig 4.32. The effect of dietary iron on the hepatic iron level as a function of time.
Dietary iron levels of the iron-treated groups were reduced to 0.5% after 10 weeks.
4.2.7. Hepatic lipid peroxidation
Treatment period: 4-10 weeks (iron loading period) There was a significant (p=0.007) decrease in the malondialdehyde (MDA)
values between 4 and 10 weeks, irrespective of the treatment group. The
groups themselves did not significantly differ at either time point (Fig 4.33).
Treatment period: 10-35 weeks (FB1 treatment period) A marginal (p=0.094) increase in MDA levels was seen only in the FB1/Fe group
between 10 and 35 weeks (Fig 4.33). At 35 weeks, the MDA values of the
FB1/Fe group differed significantly from the FB1/AIN (p=0.017) group and
control (p=0.035) group and were slightly higher than the Fe group. The Fe
group was marginally (p=0.086) higher than the FB1/AIN group, and markedly
higher than the control group.
Treatment period: 35-60 weeks (post FB1 treatment period) The decrease in MDA values over this time period was significant (p=0.02) for
the Fe group (Fig 4.33). At 60 weeks, the FB1/Fe group was significantly higher
than all other groups (p<0.001).
0
20
40
60
80
100
120
140
4 10 35 60
Week
Hep
atic
iron
(mm
ol/k
g)
FB /FeFeFB /AINControl
1
1

RESULTS
97
Fig 4.33. The effect of iron overload on the hepatic lipid peroxidation level, measured
as MDA, as a function of time. Dietary iron levels of the iron-treated groups were reduced to 0.5% after 10 weeks.
4.2.8. Rat sickness and termination One rat from the iron-fed group died at 8 ½ weeks. A post mortem revealed
bladder and kidney stones and death was not attributed to the dietary iron
treatment.
Over the course of the experiment, 19 abscesses in 14 rats were counted
(Table 4.8). Eight of these were found in the FB1/Fe group, 7 in the Fe-group, 2
in the FB1/AIN group, and 2 in control rats. All but 2 lesions were located in the
corner of the mouth and Escherichia coli was determined via pus swab. Two
control rats had an abscess each, respectively in the umbilical region and on
the right hind hock. The abscesses were emptied and flushed with iodine. The
effect on feed intake and other biological values were assessed, and it was
determined that the abscesses did not influence these parameters.
Mycoplasma pulmonis was isolated from the animal unit and was found to affect
all rats, including the controls. The infection expressed itself clinically as head
tilts (5 rats) indicative of otitis interna, and respiratory problems (21 cases in 17
0.07
0.09
0.11
0.13
0.15
0.17
0.19
0.21
0.23
0.25
4 10 35 60
Week
MD
A (n
mol
/mg)
FB /FeFeFB /AINControl
1
1

RESULTS
98
rats) (Table 4.8). These were first treated with Penicillin (Peni La Phenix),
Amoxycillin (Clamoxyl), and then with Oxytetracycline (Terravit). The
condition of 3 rats (2 from the FB1/Fe group, 1 from the Fe group) eventually
necessitated early termination at week 53, 54 and 55 respectively. Pneumonia
was determined to be the cause of the extreme respiratory distress.
Oxytetracycline was introduced after week 55 as prophylactic medicine to
further ward off any deaths and no further cases became clinically apparent.
Once a unit is infected, the eradication of the organism is nearly impossible and
was not feasible in this case.
Table 4.8. Summary of rat sickness and treatments in the long-term study.
Abscess Head tilt Respiratory problems Antibiotics Other
FB1/Fe 8(4) 2 6(5) 9(7) 0
Fe 7(6) 0 3 4(3) 1a
FB1/AIN 2 2 8(6) 8(6) 1b
Control 2c 1 3 5 0 ( )=number of animals afflicted; aKidney/bladder stones-->Death at age 60d; bCataract; cAbscess in umbilical region (1), rt hind hock (1).

DISCUSSION
99
Chapter 5 Discussion
The role of hepatic iron overload in the development of liver cancer in
experimental animals, and more specifically rats, has not been clarified
mechanistically. Several reports have indicated that iron overload enhances the
cancer initiating and/or promoting activity of hepatocarcinogens (Yoshiji et al.,
1991; Stål et al., 1999). This has been attributed to the oxidative effect of
excess hepatic iron, augmenting cellular damage to membranal structures and
macromolecules such as protein and DNA resulting in mutagenesis (McCord,
1996; Andrews, 1999). Increased mutational events in cellular DNA are known
to enhance the level of cancer initiating events and the subsequent disruption of
cell signalling pathways related to cell proliferation and apoptosis (Cohen and
Ellwein, 1990; Cohen, 1998).
In a pilot study, the effect of different levels of dietary iron (1%, 1.5%, and 2%)
on hepatic iron concentration and various biological parameters was critically
evaluated in rats as a function of time. The parameters included pre-weaning
iron loading, total body weight gain (tBWG), the liver to body weight (LW/BW)
ratio, hepatic iron levels, hepatocellular proliferation, and lipid peroxidation.
These parameters were monitored during regular intervals over a period of 15
weeks to obtain optimum conditions of iron loading with minimal adverse effects
on the rat. The effect of reducing the dietary iron level to 0.5% after 10 weeks
was also evaluated. The aim was to develop a model of iron loading in which a
high baseline hepatic iron concentration could be established, and then be
maintained, by feeding iron at a relatively low concentration while carrying out a
long-term carcinogenesis study with FB1, without excessive side effects related
to iron toxicity. Thus, the investigation into the enhanced and/or protective
effects of excess hepatic iron on FB1-induced hepatocarcinogenesis could be
carried out under ideal conditions, in which any synergistic toxicological effects
of the combined dietary iron and FB1 treatment, which could possibly adversely
affect the process of hepatocarcinogenesis, were minimised.

DISCUSSION
100
The negative effect of dietary iron on tBWG has been documented in rats
before and has been attributed to feed refusal and iron toxicity to the
gastrointestinal system, resulting in diarrhoea (Mackinnon et al., 1995; Lemmer
et al., 1999). Carbonyl iron must be solubilised by gastric acid before intestinal
absorption (Huebers et al., 1986); after solubilisation, carbonyl iron is
subsequently absorbed similarly to the iron salt ferrous sulphate, a dietary iron
supplement that has also been associated with gastro-intestinal side effects
(Devasthali et al., 1991). Plummer et al. (1997) suggested that in addition to
diarrhoea per se, carbonyl iron might impair absorption of nutrients that can also
contribute to growth retardation in iron-supplemented animals. Additional
studies have also suggested that iron supplementation in iron-sufficient children
could retard their growth (Idjradinata et al., 1994), and also increase morbidity
due to diarrhoea in infants in less-developed countries (Brunser et al., 1993).
The iron-fed rats in this study did not have severe diarrhoea, but only softer
faeces than the controls. The tBWG of all the iron-treated rats was however
significantly reduced during the treatment period up to 10 weeks (Fig 4.2). This
implies that diarrhoea is not the sole cause of reduced weight gain in growing
animals, and that feed refusal likely played a prominent role in the growth
retardation seen here. The suggestion that carbonyl iron interferes with the
uptake of dietary nutrients also needs to be further examined. After the initial
10-week period of iron loading, at which time the dietary iron level was reduced
to 0.5% for 5 weeks, the tBWG of the iron-treated rats increased to levels
similar to those of the control rats. The tBWG in the control group slightly
decreased during this period, reflecting that the BW values of control rats had
began to plateau. The 2% dietary carbonyl iron (Fe) group showed the fastest
recovery with respect to body weight (BW) (Fig 4.1c). A level of 2% Fe was
shown by Lemmer et al. (1999) to exhibit excessive toxicity. The dramatic
rebound effect in tBWG in the 2% Fe group is clearly related to the reduction in
the level of iron feeding, but the mechanisms are not understood.
Supplementation with 2% Fe for 10 weeks appeared to adversely affect the rats
in regard to tBWG.

DISCUSSION
101
At 6 weeks, no significant difference was seen in the LW/BW ratio between the
four treatment groups (Fig 4.3b). The LW/BW ratios significantly (p<0.05)
decreased in all groups from week 6 to 10, corresponding to the significant
increase in BW during this time. This decrease was most marked in the control
group, due to the additional decrease in the absolute liver weight (LW), while
the LW actually increased in the iron-treated groups. After 10 weeks, excess
iron was found to increase the LW/BW ratio (Fig 4.3a). At this time point, only
the 1.5% Fe group exhibited a significantly higher LW/BW ratio than the control
group, while at 15 weeks, after 5 weeks on the lower 0.5% Fe level, the LW/BW
ratio was significantly increased in all the iron-fed groups as compared to the
controls. The LW/BW ratio dramatically increased between weeks 10 and 15 in
the 2% Fe group, surpassing the ratio of the 1% and 1.5% Fe-treated groups.
When considering these parameters, it would appear that the 2% Fe level
exhibited adverse effects in the liver in addition to on the tBWG.
An increase in absolute liver weights (LW) was reported in a study in which iron
dextran was administered parenterally (Carthew et al., 1997). In the current
study, an increase in the absolute LW due to iron compared to controls was
seen only at the end of the 15-week study period in the 2% group. This was
also observed macroscopically; the livers of rats in this group were enlarged in
comparison to control livers. This could be attributed to the mitogenic effect of
iron.
Corresponding to the data showing an increase in LW/BW ratio, hepatocellular
proliferation demonstrated by increased BrdU labelling was up to 5-fold higher
in the iron-treated rats than in the control rats (Table 4.1). However, this was not
statistically significant, due to the variation between individual rats.
Nevertheless, iron appears to have a marked effect on hepatocellular
proliferation. Stål et al. (1995) also reported increased liver weights and
labelling indexes in a long-term study supplementing with 2.5-3% Fe in rat
chow.
Macroscopically, the livers of the iron-treated rats had a distinct dark brown
colour due to iron deposition, as compared to the control livers, which were light

DISCUSSION
102
yellow brown (Fig 4.4a,b). Apart from iron deposition in hepatocytes and Kupffer
cells, supplementation with dietary iron over 15 weeks did not alter the normal
liver histopathology. Since similar changes were seen in the livers of control
rats, the foci of necroinflammation seen in iron-treated rats were attributed to
infection with Mycoplasma pulmonis. The initial iron deposition observed in the
periportal region of the liver is typically seen when supplementing with carbonyl
iron (Fig 4.6). This pattern of hepatic iron distribution is similar to hepatic iron
overload in genetic haemochromatosis (GH), which is why carbonyl iron is
commonly used in animal models of iron overload (Bacon et al., 1983; Park et
al., 1987).
As expected, hepatic iron concentration was consistently higher over the study
period in iron-fed rats than in the control rats (Fig 4.7a). The 2% Fe level
resulted in the highest hepatic iron concentration after 10 weeks and the
concentration was significantly higher than the 1% and 1.5% Fe groups (Fig
4.7b). However, after reduction of the dietary iron to 0.5%, the hepatic iron
levels were significantly decreased in the 1.5% and 2% Fe groups and at 15
weeks had reached the same hepatic iron level as seen in the 1% Fe group. At
the 1% Fe level, hepatic iron concentrations were maintained at a constant level
throughout the study, even after reducing the dosage to 0.5% Fe at 10 weeks.
Thus, a higher level of dietary iron did not prove to have a long-term advantage
over the 1% Fe level.
Throughout the study period, lipid peroxidation, measured as increased levels
of malondialdehyde (MDA) (Fig 4.9) and conjugated dienes (CD) (Fig 4.10),
was higher in the iron-treated groups than in the controls. Even after reduction
of the dietary iron level to 0.5%, the level of oxidative damage was still
significantly higher in the iron-treated groups. It has been proposed by Bacon et
al. (1983) that lipid peroxidation is one mechanism for toxicity of iron overload;
chronic iron overload was linked to increased levels of CD as a result of lipid
peroxidation. The present study support findings by Stål et al. (1996) and
Brunet et al. (1999) related to the increase in hepatic MDA.

DISCUSSION
103
Based on the results obtained in the pilot study, the iron-feeding regimen of 1%
Fe was selected during the pre-weaning and pre-carcinogen treatment period of
the long-term study. As hepatotoxicity is associated with FB1-induced cancer
induction, a dietary iron level of 0.5% was selected for the FB1-treatment period,
since this level proved effective as a maintenance dose for increased hepatic
iron levels with minimal toxic effects to the rat.
The aim of the long-term study was to evaluate the effect of iron overload on the
toxicological effects of FB1 in the rat, and in particular to determine whether
excess iron could potentiate the hepatocarcinogenic effects of the mycotoxin.
The most important finding was seen in the enhanced induction of
hepatocellular nodules in rats receiving the combined treatment of FB1 and
dietary iron for 25 weeks. It would appear that excess iron augmented the FB1
cancer initiating and/or promoting potential. At 35 weeks, the livers of all the rats
(5/5) that received the combined FB1/Fe treatment had developed nodules, as
observed macroscopically and microscopically. The macroscopic evaluation of
nodules was performed only on the capsular surface. Three slices were taken
from the median, left lateral, and caudate lobes from each animal and
processed for histopathological evaluation; this was constant for each treatment
group. Microscopically, 1 to 14 nodules per animal were seen in the FB1/Fe
group at 35 weeks (Table 4.6; Appendix IIIf). Most of the nodules were
classified as high-grade dysplastic lesions (Fig 4.21a,b) while 3/5 rats also had
some low-grade dysplastic nodules. Numbers mentioned in the microscopic
assessment are only representative of the total liver and are expressed per
three tissue sections of liver examined. High-grade dysplasia was assessed
according to criteria defined earlier for the purpose of this study (see Chapter
3.5.1) and included large cells with clear cytoplasm, mitosis, intranuclear
inclusions, large nucleoli, apoptosis of occasional dysplastic cells, and
moderate nuclear pleomorphism. None of the lesions in the study were called
hepatocellular cancers (HCCs), which are characterised by invasion into
surrounding liver tissue and the vascular system, and metastasis to other
organs. Oval cells were seen inside each of the high-grade dysplastic lesions
(Fig 4.26). There was much controversy surrounding the origin of oval cells in
the past. However, it is now accepted that they are the progeny of liver stem

DISCUSSION
104
cells (Sell and Dunsford, 1989; Grisham and Thorgeirsson, 1997). Oval cells
are implicated in the genesis of cholangiocarcinomas, but their role in the
development of HCCs is uncertain. Short-term feeding with FB1 has been
shown before to induce oval cell proliferation, and these cells were closely
related to foci and nodules (Lemmer et al., 1999). Similar results were seen in
this study.
Macroscopically, 4/5 rats from the FB1/AIN group were reported to have
nodules on the capsular surface. Only 3/5 rats from this group exhibited nodules
in the 3 liver sections examined microscopically, and the result varied from 2 to
3 nodules per slide/rat. The discrepancy between the macroscopic and
microscopic observations can be explained by the methodology of assessment.
In total, only 7 nodules were recorded in the liver sections from the FB1/AIN
group, of which 4 were high-grade dysplastic (Fig 4.23a; Table 4.6).
At 60 weeks, all the animals of the FB1/Fe (10/10) and the FB1/AIN (10/10)
groups exhibited nodules as examined macro- and microscopically (Table 4.7).
The three liver sections showed nodules varying between 1 to 16 and 1 to 11 in
the two groups, respectively (see Appendix IIIg). In 8/10 animals from these two
treatment groups, most of the nodules showed high-grade dysplasia (Fig
4.23b), while 2/10 animals of each group only had nodules showing low-grade
dysplasia.
It would appear that the progression rate of nodules differed between the FB1-
treated groups at each time point. At 35 weeks, the rate of nodule growth
suggests that cancer promotion in the FB1/Fe group was enhanced as
compared with the FB1/AIN group. However, after removal of FB1, it seems that
the development of nodules in the FB1/AIN group continued to progress, in
contrast to rats treated with the combined treatment FB1/Fe. The further
development of dysplastic nodules appears to in fact be impaired by the
presence of excess hepatic iron; in addition, there was no progression of these
high-grade dysplastic lesions to unequivocal HCCs. It can be hypothesised that
if feeding with FB1, had been continued, the development and progression of

DISCUSSION
105
nodules would have continued to be accelerated in the FB1/Fe group, as
compared to the progression rate of nodules in rats treated with FB1 only.
The observations in the H&E stained liver sections are supported by similar
findings in GSTP stained sections. GSTP staining is used to assess enzyme
altered hepatic foci and pre-neoplastic nodules, which are considered an
estimate of the cancer initiating potency of a hepatocarcinogen (Fig 4.28) (Solt
and Farber, 1976; Farber and Sarma, 1987). When considering the total
number of GSTP+ foci and nodules after 35 weeks, the number was markedly
higher in the combined FB1/Fe treatment group as compared to the FB1/AIN
group. In regard to the different sizes of the GSTP+ nodules, the number of
nodules of the size 20-50 µm/cm2 was also significantly higher in the FB1/Fe
group (Fig 4.29). This would imply that the combined treatment not only
increased the number of foci and nodules, but also increased the size of the
nodules, again indicating that iron overload increases the cancer initiating
and/or promoting potency of FB1.
The effect of excess iron on the progression of FB1-induced GSTP+ hepatocyte
nodules and foci was further evaluated during the post FB1-treatment period of
25 weeks. There was no increase in the development of GSTP+ nodules (>10
um) in the FB1/Fe group after removal of FB1 during the 35 to 60 week period
(Fig 4.27 and 4.28). Conversely, there was a marked increase in GSTP+ nodule
development in the FB1/AIN group, despite withdrawal of FB1. This would imply
that in the absence of FB1, continued supplementation with iron did not further
support nodule development during the tumour progression phase, but rather
delayed the development of GSTP+ nodules, sustaining conclusions drawn with
the histopathological results. In contrast, the pre-neoplastic lesions induced in
the FB1/AIN group had acquired the ability of autonomous growth in the
absence of FB1.
Iron significantly increased the number of singlet and duplet GSTP+ cells in the
liver when compared to control rats; the cause of this is not clearly understood.
At 35 weeks, the FB1/Fe had more GSTP+ singlets than those treated with iron
alone, though this was not statistically significant; the number of the GSTP+

DISCUSSION
106
cells decreased in iron-treated rats from 35 to 60 weeks. The FB1/AIN treatment
regimen did not significantly increase the number of GSTP+ singlets or duplets
compared to the controls.
At 60 weeks one rat from the Fe group exhibited an iron-free hepatic nodule,
which was seen macroscopically and microscopically (Fig 4.25). The GSTP
staining of the nodule was very irregular and only some cells in the nodule
stained positively. It cannot be ascertained if the nodule developed
spontaneously or as a result of iron overload. Single GSTP+ liver cells have
been described to be putative initiated hepatocytes, from which the stages of
cancer initiation and promotion develop (Moore et al., 1987). It can be
hypothesised that the nodule of this one rat developed from the GSTP+ singlets
induced by excess iron.
Livers of rats from the FB1/Fe group accumulated more iron than rats in the Fe
group, an observation supported by both the biochemical measurements and
histological evaluation of hepatic iron (Fig. 4.32). With commencement of FB1
feeding at 10 weeks, the hepatic iron levels in the FB1/Fe group increased to
significantly higher levels than all other groups. After removing FB1, these levels
decreased to the same level as seen in the Fe group. This indicates an
enhancing effect of FB1 on the accumulation of hepatic iron. Histologically,
additional deposition of iron in Kupffer cells and portal tract macrophages was
seen in the FB1/Fe group and attributed to iron release from hepatocytes
following hepatic injury and cell death caused by FB1 (Fig 4.22). In the FB1/Fe
group, new hepatocytes continued to accumulate iron, leading to the higher
hepatic iron levels (Fig 4.32). This is in contrast to a study by Deugnier et al.
(1992), in which it was shown in GH patients that non-iron-related factors (i.e.
alcohol) could result in a shift in iron deposition without an increase in the total
hepatic iron concentration. After FB1 removal, cell death was almost certainly
reduced, and the shift of iron to Kupffer cells decreased and iron deposition
reached levels seen in the Fe group. Liver enzymes decreased during this time,
an indication that liver injury was reduced. Serum iron also tended to be higher
in the FB1/Fe group as compared to the Fe group (Fig 4.16). Both iron-treated

DISCUSSION
107
groups had significantly higher levels than the FB1/AIN and control groups in
regard to this biochemical parameter.
A marked feature of nodules in the iron-loaded rats was the inability of the intra-
nodular hepatocytes to accumulate iron (Fig 4.24 and 4.25). Williams and
Yamamoto demonstrated in 1972 the absence of stainable iron in pre-
neoplastic and neoplastic lesions in the iron-overloaded rat. Iron-free foci are
frequently found in the cirrhotic livers of patients afflicted with GH that has been
complicated by HCC (Blanc et al., 1999). It has been suggested that iron-free
foci are proliferative lesions that could be pre-neoplastic/precursors to HCC
(Hirota et al., 1982; Deugnier et al., 1993a, b; Blanc et al., 1999). The presence
of these lesions could be of importance in the screening for early HCC
(Deugnier et al., 1993). The absence of iron in these lesions has been
documented to be reliable and sensitive indications for hyperplastic lesions
(Williams et al., 1976). Eriksson et al. (1986) discovered that diferric transferrin
binding sites are 60-fold higher on nodule hepatocytes than on cells in the
surrounding liver. As the affinity of the receptor to diferric transferrin is not
affected, it was proposed that the dissociation of iron from transferrin must be
disturbed, due to insufficient acidification in the endosomes (Andersson et al.,
1989). This leads to a slower rate of iron accumulation in the hepatocytes within
nodules. Low intracellular iron in these cells could imply a lower level of lipid
peroxidation in the nodule, contributing to the cell growth advantage of these
hepatocytes despite a toxic environment, as described in the resistant
hepatocyte model by Solt and Farber (1976).
Averaged feeding was introduced from week 4 in the long-term study, and
differences in nutritional intake between the groups were subsequently
eliminated (Table 4.3). This entailed weighing the feed of a specified group
every day, calculating the average feed intake, and feeding the other rats
accordingly. The importance of averaged feeding lies in the reduction in the
variability of certain parameters, such as BW, tBWG, and the LW/BW ratio,
between rats of different treatment groups. The large differences in tBWG
between the different treatment groups in the pilot study were thus avoided in
the long-term study (Fig 4.11).

DISCUSSION
108
Certain variations observed when comparing the pilot study with the long-term
study, despite usage of the same dietary iron level, can be attributed to
averaged feeding. The design of the feed cups used for averaged feeding
reduces wastage, but also tends to decrease the feed and total dietary iron
intake of the rats, which explains lower levels of hepatic iron in the long-term
study as compared to the pilot study. The mean hepatic iron level in the pilot
study was 100 mmol/kg liver compared to almost 60 mmol/kg during the pre-
FB1-treatment iron loading phase of the long-term study. However, hepatic iron
in iron-treated rats of the long-term study was still almost 9-fold that of the
control rats (Fig 4.32). Averaged feeding could also explain the decrease in
hepatic iron in all groups from week 4 to 10 in the long-term study, as averaged
feeding commenced at week 4. In addition to the feed being available ad libitum
in the pilot study, the rats were fed twice per day, which also appeared to
increase feed intake as compared to the long-term study, in which rats were fed
once daily. A similar effect of averaged feeding was seen in regard to lipid
peroxidation. MDA levels in iron-treated rats were also lower in the long-term
study than in the pilot study. In both studies, the MDA levels decreased from
week 4 to 10, irrespective of treatment group. The mechanism for this is not
understood.
No significant difference could be detected in lipid peroxidation measured as
MDA levels between groups up to 10 weeks (Fig 4.33). At the end of the FB1
treatment period, the level of MDA increased only in the combined FB1/Fe
treatment regimen to levels significantly higher than the levels of the FB1/AIN
and control groups. In a study with a similar protocol, conducted by Lemmer et
al. (1999), the combined treatment also significantly increased lipid peroxidation
in the liver at 5 weeks. However, in this study MDA levels were not investigated
at 5 weeks following the high FB1 dose regimen. The present study indicates
that after a further 20 weeks of feeding a decreased level of FB1 (100 mg/kg),
the level of lipid peroxidation was still increased. There was no significant effect
noticed in the liver of the rats treated with dietary iron or FB1/AIN only. Thus,
based on relatively low levels of lipid peroxidation effected by dietary iron and
FB1 alone, ideal conditions were created in which to investigate the synergistic
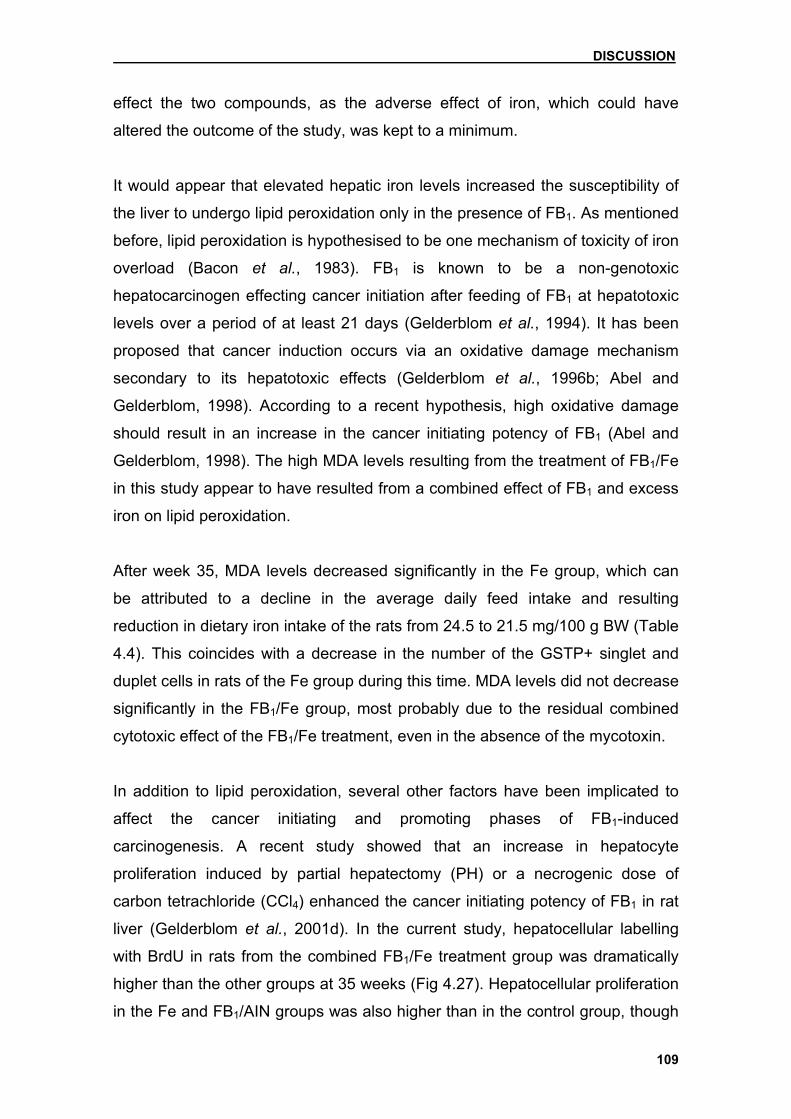
DISCUSSION
109
effect the two compounds, as the adverse effect of iron, which could have
altered the outcome of the study, was kept to a minimum.
It would appear that elevated hepatic iron levels increased the susceptibility of
the liver to undergo lipid peroxidation only in the presence of FB1. As mentioned
before, lipid peroxidation is hypothesised to be one mechanism of toxicity of iron
overload (Bacon et al., 1983). FB1 is known to be a non-genotoxic
hepatocarcinogen effecting cancer initiation after feeding of FB1 at hepatotoxic
levels over a period of at least 21 days (Gelderblom et al., 1994). It has been
proposed that cancer induction occurs via an oxidative damage mechanism
secondary to its hepatotoxic effects (Gelderblom et al., 1996b; Abel and
Gelderblom, 1998). According to a recent hypothesis, high oxidative damage
should result in an increase in the cancer initiating potency of FB1 (Abel and
Gelderblom, 1998). The high MDA levels resulting from the treatment of FB1/Fe
in this study appear to have resulted from a combined effect of FB1 and excess
iron on lipid peroxidation.
After week 35, MDA levels decreased significantly in the Fe group, which can
be attributed to a decline in the average daily feed intake and resulting
reduction in dietary iron intake of the rats from 24.5 to 21.5 mg/100 g BW (Table
4.4). This coincides with a decrease in the number of the GSTP+ singlet and
duplet cells in rats of the Fe group during this time. MDA levels did not decrease
significantly in the FB1/Fe group, most probably due to the residual combined
cytotoxic effect of the FB1/Fe treatment, even in the absence of the mycotoxin.
In addition to lipid peroxidation, several other factors have been implicated to
affect the cancer initiating and promoting phases of FB1-induced
carcinogenesis. A recent study showed that an increase in hepatocyte
proliferation induced by partial hepatectomy (PH) or a necrogenic dose of
carbon tetrachloride (CCl4) enhanced the cancer initiating potency of FB1 in rat
liver (Gelderblom et al., 2001d). In the current study, hepatocellular labelling
with BrdU in rats from the combined FB1/Fe treatment group was dramatically
higher than the other groups at 35 weeks (Fig 4.27). Hepatocellular proliferation
in the Fe and FB1/AIN groups was also higher than in the control group, though

DISCUSSION
110
not significantly (Tables 4.8 and 4.9). Under normal circumstances, hepatocyte
turnover rate in the liver is very low, which is why the liver is a good model to
investigate cell growth and carcinogenesis. Iron has previously been shown to
be mitogenic (Deugnier et al., 1992; Stål et al., 1995); the increase in
hepatocellular proliferation in the FB1/Fe group is attributed to the mitogenic
effect of iron, a combined toxicity of FB1 and iron, and the elevated rate of
mitosis in nodules. After removal of FB1, the enhanced effect of the combined
treatment on hepatocellular proliferation was eliminated, and the index of
labelling in this group decreased to even lower levels than the Fe and FB1/AIN
groups (Table 4.9). These observations support the hypothesis proposed
recently by Li et al. (2000) that proliferating cells appear to be more sensitive to
the toxic effects of fumonisins.
The results of the present long-term study contrast the findings of Lemmer et al.
(1999) who described a protective effect of dietary iron when utilising a short-
term FB1 treatment regimen (5 weeks) and higher levels of dietary iron (1%).
Iron overload was shown to reduce either the cancer initiating and/or promoting
potency of FB1 in rat liver. The protective effect against cancer promotion was
related to the mitogenic properties of iron, which could counteract the
mitoinhibitory effect of FB1 selectively stimulating the outgrowth of initiated cells.
However, the relative high dietary iron levels (2% Fe) used in the pre-FB1
treatment iron loading phase of the study, as well as the 1% Fe level during the
FB1 treatment phase over a period of 5 weeks could have adversely affected
the outcome of the FB1-induced cancer initiating phase. Due to severe growth
retardation, it was necessary to discontinue feeding with 2% Fe after 1 week of
feeding (for 1 week), after which 1% Fe was supplemented. It is therefore
difficult to evaluate the modulating role of iron overload, as the dietary iron
levels were associated with toxicity. Carbonyl iron has been reported to
enhance apoptosis in CCl4-induced promotion in chemical
hepatocarcinogenesis (Wang et al., 1999). The high level of dietary iron used by
Lemmer et al. (1999) could have exhibited an inhibitory effect during the
combined treatment regimen on the induction of nodules, presumably via the
removal of the altered cells via an apoptotic mechanism (Bursch et al., 1992).
On the other hand, as the LW/BW ratio was also increased during the iron

DISCUSSION
111
treatment, an increased mitogenic response could have reduced the cancer
promoting effect of FB1. Similarly, mitogen-induced cell proliferation effected by
carbonyl iron supplementation (Stål et al., 1995) and the mitogen lead nitrate
(PbNO3) (Gelderblom et al., 2001d) failed to enhance cancer initiation.
Therefore, an increase in apoptosis and cell proliferation could explain the
protective effect found by Lemmer et al.
Several differences existed between the FB1 treatment model used by Lemmer
et al. (1999) and the current study. Although a similar cancer initiating protocol
was used, i.e. FB1 at a dietary level of 250 mg/kg diet over a period of 5 weeks,
the reduction in dietary iron to 0.5% at commencement of the FB1 treatment
was new (Table 3.3). Following the first 5 weeks of FB1 feeding, the current
model maintained the FB1 treatment for a further 20 weeks, but at a dietary
level of 100 mg FB1/kg diet in the absence and presence of dietary iron (0.5%
Fe). Cancer promotion has been shown to occur at this non-toxic dietary level,
presumably related to the disruption of growth regulatory signals that favours
the growth of altered hepatocytes generated during cancer initiation
(Gelderblom et al., 1996a). Also different in this study, was the subsequent
removal of FB1 from the diet at 35 weeks to monitor the effect of iron overload
on the tumour progression phase of cancer development. Iron increases the
LW/BW ratio, which was seen in both studies. FB1 has been shown to reduce
the LW/BW (Gelderblom et al., 1994; 1996b); the effect was also seen in this
study. In contrast to the study by Lemmer et al., iron overload could not
counteract the mitoinhibitory effect on normal hepatocytes and the resulting
selection process of FB1 in this regard. Iron appears, though, to still enhance
the regenerative response to FB1-induced hepatocyte death, as hepatocellular
proliferation was increased, resulting perhaps in the promotion of resistant
hepatocytes. Between 10 and 35 weeks, the LW/BW ratio decreased in all
groups, due to a significant increase in BW, despite an increase in absolute LW.
After 35 weeks, the LW/BW ratio increased in all groups, reflecting the increase
in absolute LW and less tBWG. At this time, after removal of FB1, the LW/BW
ratio in the FB1/Fe group increased to the same level as observed in the Fe
group, indicating that the long-term effect of FB1 on the LW/BW ratio does not
persist in the presence of continued iron feeding.

DISCUSSION
112
Various iron models involving carcinogenesis cannot necessarily be compared
to one another, for example in regard to discrepancies in levels of dietary iron
used. In the present study, carbonyl iron was thoroughly mixed into a powdered
diet, ensuring exact information of level and intake (see Chapter 3.3). In
contrast, other studies have used iron-coated pellets, rendering levels and
intake measurements unreliable (Plummer et al., 1987). Therefore, conflicting
data presented in numerous studies in regard to the role of iron overload in the
development of HCC could depend on the specific model utilised, the level of
dietary iron, and the length of carcinogen treatment.
The present study suggests a dual role of iron overload in cancer development
during FB1-induced carcinogenesis. During the cancer initiation/promotion
phase, iron overload in combination with FB1 enhances the susceptibility of the
liver to the formation of foci and nodules; after removal of FB1, excess iron
impairs the progression of pre-neoplastic hepatic lesions into hepatic tumours.
Further studies are needed into the interaction between prolonged FB1 feeding
and iron overload. We postulate that if FB1 feeding had continued after 35
weeks with simultaneous iron supplementation, the development of nodules
would have been enhanced further and most likely progressed to HCCs. The
effect of FB1 and iron on haematological and biochemical parameters also
warrants additional investigation. Certain data support the enhancing effect of
excess iron on FB1-induced hepatotoxicity. The combined treatment FB1/Fe
significantly increased the ALT, AST, and bilirubin serum levels of the rats (Fig
18a,b; Fig 17a,b). Bone marrow also appeared to be affected by this treatment
regimen. The mean cell volume (MCV) was notably increased by the combined
treatment of FB1/Fe (Fig 4.14). Dietary iron (in the presence and absence of
FB1) also increased the MCV, though not to such levels as the combined
treatment did, as well as mean cell haemoglobin (MCH) and mean cell
haemoglobin concentration (MCHC). FB1 (in the presence and absence of
dietary iron) significantly (p=0.001) increased both the ALP (Fig 4.19a) and
creatinine levels. Increased serum creatinine is indicative of kidney injury and
has been documented before in FB1-treated rats (Voss et al., 1993, 1995). Iron
did not appear to enhance the effect of FB1 in this regard. After removal of FB1,

DISCUSSION
113
these serum parameters decreased significantly (p<0.05) in rats of the FB1-
treatment groups, and at 60 weeks no significant differences were noticed
between the FB1-treated and control rats with respect to these serum
parameters. FB1 was shown to reduce the red cell blood count, haemoglobin,
and haematocrit (Fig 4.13). This appears to be a new observation and the
mechanism is not fully understood yet.
Conclusion 1) Excess dietary iron results in hepatic siderosis and augments the cancer
initiation and/or promoting potential of FB1.
2) After removal of FB1, continued supplementation of iron appears to
counteract the progression of hepatocyte nodules induced by FB1.
3) The combined treatment of dietary iron and FB1 significantly increased lipid
peroxidation and hepatocellular proliferation, both of which are implicated in
the pathogenesis of drug/toxin-induced liver injury and HCC.

SUMMARY
114
Chapter 6 Summary
The long-term toxicological effects of hepatic iron overload on the cancer
initiating and promoting properties of fumonisin B1 (FB1) were investigated in
male Fisher 344 rats. An initial pilot (dose response) study over 15 weeks was
performed to determine a level of dietary iron that achieves a high hepatic iron
concentration in the absence of significant side effects, to be used in the
subsequent long-term carcinogenesis study with FB1. Doses of 1%, 1.5% and
2% dietary carbonyl iron (Fe) were used for 10 weeks, followed by a level of
0.5% Fe for another 5 weeks. After 10 weeks of feeding 1% Fe, the hepatic iron
level was 30-fold that of controls. Following the reduction in dietary iron to 0.5%,
the hepatic iron level was maintained and side effects were minimal.
Irrespective the dose of iron, the iron deposition was initially confined to zone 1
(periportal region), but with increased iron loading, extended to zone 2 (mid-
zonal region) and zone 3 (perivenular region). Iron overload was shown to
increase hepatocellular proliferation as seen in labelling of cells with 5-bromo-
2’-deoxy-uridine (BrdU). Lipid peroxidation, measured as MDA, was also
significantly enhanced by excess iron and levels correlated the iron dosage.
In the long-term study, half of the rats were submitted to an iron-loading
regimen with 1% Fe for 10 weeks, while the other half received the powdered
AIN-93M diet only. The iron was then reduced to 0.5%; the rats were divided
into four treatment groups: FB1/Fe (n=15); Fe (n=14); FB1/AIN (n=15); and
control group (n=15), respectively. FB1 was fed at 250 mg/kg AIN-93M diet for 5
weeks, followed by 100 mg/kg for 20 weeks. The effect of iron on FB1-induced
initiation and promotion was assessed in 5 rats from each group at week 35.
FB1 was removed from the diet of the remaining rats but iron supplementation
continued for 25 weeks. The rats were terminated and the effect of dietary iron
on the progression phase of FB1-induced carcinogenesis was assessed.
The feed intake of rats from the Fe group (weeks 4-10), and FB1/Fe and
FB1/AIN groups (weeks 10-60) was measured daily and the other groups were

SUMMARY
115
given averaged feeding accordingly; thus, the total body weight gain (tBWG)
gain did not differ significantly between groups. Excess iron significantly
increased the liver to body weight (LW/BW) ratio; however, iron could not
counteract the mitoinhibitory effect of FB1 on hepatocyte proliferation and the
LW/BW ratio of the FB1/Fe group was significantly lower than the Fe group.
During the 25-week FB1-treatment period, more foci and nodules of dysplastic
cells developed in the FB1/Fe group than in the FB1/AIN group. After removal of
FB1, the number of nodules remained constant in the FB1/Fe group, while
increasing in the FB1/AIN group. Initially, the pattern of iron deposition was the
same as in the pilot study. Hepatocyte necrosis caused by FB1 then resulted in
a shift of iron from hepatocytes to Kupffer cells and portal tract macrophages.
FB1/Fe resulted in increased hepatocellular proliferation as demonstrated by
increased BrdU labelling at 35 weeks. The withdrawal of FB1 reversed this
effect and the index of BrdU labelling decreased to even lower levels than the
Fe and FB1/AIN groups. Hepatic iron was almost 9-fold that of controls at 10
weeks; a significant increase in the hepatic iron levels in the FB1/Fe group was
noticed as compared to all other groups. However, after removing FB1, the
hepatic iron decreased to the same level as seen in the Fe group. During the
FB1 treatment period, MDA increased in the FB1/Fe group to levels significantly
higher than in the FB1/AIN and control groups.
The present study suggests a dual role of iron overload in cancer development
during FB1-induced carcinogenesis. During the cancer initiation/promotion
phase, iron overload in combination with FB1 enhanced the susceptibility of the
liver to the formation of foci and nodules; but after removal of FB1, continued
supplementation of iron impaired the progression of pre-neoplastic hepatic
lesions.

ZUSAMMENFASSUNG
116
Kapitel 7
Zusammenfassung
Die Auswirkungen von Eisenbelastung auf die toxikologische Langzeitwirkung von Fumonisin B1 in der Rattenleber
In der vorliegenden Studie wurden die Langzeitwirkungen einer hepatischen
Eisenbelastung auf das krebserzeugende bzw. –fördernde Potential von
Fumonisin B1 (FB1) an männlichen Fisher 344 Ratten untersucht. Vorab wurde
in einem 15-wöchigen Vorversuch der für eine Langzeitkarzinogenese-Studie
geeignete Eisenanteil im Futter ermittelt, welcher eine möglichst hohe
Eisenkonzentration in der Leber, jedoch noch keine signifikanten
Nebenwirkungen hervorruft. In den ersten 10 Wochen wurden Konzentrationen
von 1%, 1,5% und 2% Karbonyleisen (Fe) im Futter verwendet, um die letzten 5
Wochen mit einem 0,5%-igen Eisengehalt fortzufahren. Nach einer 10-
wöchigen Fütterung von 1% Fe wurde gegenüber den Kontrolltieren eine um
das 30-fache höhere Eisenkonzentration in der Leber erreicht. Bei der
folgenden Reduktion des Futtereisengehaltes auf 0,5% wurde diese
Eisenkonzentration in der Leber aufrechterhalten, die Nebenwirkungen waren
minimal. Unabhängig von der Höhe der Eisendosierung erfolgte die
Eisenablagerung anfänglich in Zone 1 (Läppchenperipherie), erstreckte sich
jedoch mit zunehmender Eisensättigung auch auf die Zonen 2 (mittlere
Läppchenzone) und 3 (Läppchenzentrum). Mittels Zellmarkierung mit 5-Brom-
2’-Desoxy-Uridin (BrdU) wurde eine durch Eisenbelastung induzierte
hepatozelluläre Proliferation nachgewiesen. Weiterhin wurde durch den
Eisenüberschuss eine dosisabhängige Steigerung der Lipidperoxidation
(gemessen als Malondialdehyd (MDA)) festgestellt.
Im Hauptversuch wurde die Hälfte der Tiere 10 Wochen lang entsprechend
eines 1%-igen Eisenanreicherungsschema gefüttert, wohingegen der anderen
Hälfte ausschliesslich AIN-93M-Futter verabreicht wurde. Anschließend wurde
der Eisenanteil auf 0,5 % reduziert. Die Tiere wurden in 4 Gruppen unterteilt:
FB1/Fe (n=15), Fe (n=14), FB1/AIN (n=15) und Kontrollgruppe (n=15). FB1

ZUSAMMENFASSUNG
117
wurde 5 Wochen lang in einer Dosierung von 250 mg/kg AIN-93M-Futter
verwendet, gefolgt von 100 mg/kg für weitere 20 Wochen. Die Auswirkung von
Eisen auf die FB1–induzierte Tumorentstehung bzw. -progression wurde an je 5
Ratten pro Versuchsgruppe in der 35. Woche untersucht. Die übrigen Tiere
erhielten nun FB1–freies Futter, während hingegen Eisen über weitere 25
Wochen supplementiert wurde. Anschließend wurden die Ratten getötet und die
Beeinflussung der Progressionsphase der FB1–induzierten Karzinogenese
durch Fütterungseisen untersucht.
Um eine auf täglicher Basis gleiche Futtermengenaufnahme aller Ratten zu
gewährleisten, wurde von Woche 4-10 entsprechend des Durchschnitts der Fe-
Gruppe gefüttert, von Woche 10-60 diente die Menge der FB1/Fe- und FB1/AIN-
Gruppe als Bezugswert. Es zeigten sich zwischen den einzelnen Gruppen keine
signifikanten Unterschiede bezüglich der Körpergewichtszunahme (tBWG). Bei
Eisenüberschuß war eine signifikante Erhöhung des relativen Lebergewichtes
(LW/BW) festzustellen; der mitoinhibitorischen Wirkung von FB1 konnte jedoch
durch die Eisengabe nicht entgegengewirkt werden, das relative Lebergewicht
in der FB1/Fe-Gruppe war gegenüber der Fe-Gruppe signifikant erniedrigt.
Innerhalb der 25-wöchigen Gabe von FB1 entwickelten sich in der Leber von
Tieren der FB1/Fe-Gruppe entscheidend mehr Foci und Knötchen von
dysplastischen Zellen als in der FB1/AIN-Gruppe. Während die Anzahl dieser
Foci und Knötchen nach Abschluß der FB1-Gabe in der Gruppe FB1/Fe
unverändert blieb, nahm sie in der FB1/AIN-Gruppe weiterhin zu. Das Muster
der Eisenablagerung entsprach anfänglich dem des Vorversuches; die durch
FB1 hervorgerufenen hepatozytären Nekrosen gingen jedoch mit einer
Verlagerung der Eisenspeicherung von Hepatozyten auf Kupffer-Zellen und in
den Portalkanälen lokalisierte Makrophagen einher. Wie durch die
immunhistochemische Untersuchung mit BrdU in der 35. Woche gezeigt
werden konnte, resultierte die Verabreichung von FB1/Fe in einer erhöhten
hepatozellulären Proliferation. Das Absetzen der FB1-Gabe verursachte einen
gegenteiligen Effekt; der Index der BrdU-Markierung sank sogar auf niedrigere
Werte als in den Fe- und FB1/AIN-Gruppen. Die Eisenkonzentration in der
Leber betrug nahezu den 9-fachen Wert der Kontrollgruppe in der 10. Woche;

ZUSAMMENFASSUNG
118
ein signifikanter Anstieg der Eisenkonzentration in der FB1/Fe-Gruppe im
Vergleich zu allen anderen Gruppen war in Woche 35 zu erkennen. Allerdings
sanken die Konzentrationen nach Abschluß der FB1-Gabe auf ähnliche Werte
wie in der Fe-Gruppe. Während des Zeitraums der FB1-Fütterung war eine
Steigerung der MDA in der FB1/Fe-Gruppe auf signifikant höhere Werte als in
den FB1/AIN- und Kontrollgruppen festzustellen.
Die Ergebnisse der vorliegenden Studie lassen erkennen, daß eine
Überversorgung mit Eisen nach FB1-induzierter Karzinogenese die weitere
Tumorentwicklung in zweierlei Hinsicht beeinflußt. Während der Tumorinitiation-
bzw. Progressionphase ist bei Vorliegen eines Eisenüberschusses in
Kombination mit FB1 die Anfälligkeit der Leber für die Ausbildung dysplastischer
Foci erhöht; nach Abschluß der Gabe von FB1 verzögert eine weitere
Eisensupplementation die Progression der prä-neoplastischen Läsionen in der
Leber.

BIBLIOGRAPHY
119
Chapter 8 Bibliography
Abel S and Gelderblom WCA. 1998. "Oxidative Damage and Fumonisin B1-
Induced Toxicity in Primary Rat Hepatocytes and Rat Liver." Toxicology 131;121-31.
Adams PC, Deugnier Y, Moirand R, and Brissot P. 1997. "The Relationship between Iron Overload, Clinical Symptoms, and Age in 410 Patients with Genetic Hemochromatosis." Hepatology 25(1):162-6.
Addess KJ, Basilion JP, Klausner RD, Rouault TA, and Pardi A. 1997. "Structure and Dynamics of the Iron Responsive Element RNA: Implications for Binding of the RNA by Iron Regulatory Binding Proteins." J Mol Biol 274(1):72-83.
Andersson GN, Torndal UB, and Eriksson LC. 1989. "Decreased Vacuolar Acidification Capacity in Drug-Resistant Rat Liver Preneoplastic Nodules." Cancer Res 49(14):3765-9.
Andrews NC. 1999. "Disorders of Iron Metabolism." N Engl J Med 341(26):1986-95.
Bacon BR, Tavill AS, Brittenham GM, Park CH, and Recknagel RO. 1983. "Hepatic Lipid Peroxidation in Vivo in Rats with Chronic Iron Overload." J Clin Invest 71(3):429-39.
Bacon BR, Park CH, Brittenham GM, O'Neill R, and Tavill AS. 1985. "Hepatic Mitochondrial Oxidative Metabolism in Rats with Chronic Dietary Iron Overload." Hepatology 5(5):789-97.
Bacon BR, O'Neill R, and Park CH. 1986. "Iron-Induced Peroxidative Injury to Isolated Rat Hepatic Mitochondria." J Free Radic Biol Med 2(5-6):339-47.
Bacon BR, Powell LW, Adams PC, Kresina TF, and Hoofnagle JH. 1999. "Molecular Medicine and Hemochromatosis: at the Crossroads." Gastroenterology 116(1):193-207.
Bailly JD, Benard G, Jouglar JY, Durand S, and Guerre P. 2001. "Toxicity of Fusarium moniliforme Culture Material Containing Known Levels of Fumonisin B1 in Ducks." Toxicology 163(1):11-22.
Baker E and Morgan EH. 1994. "Iron Transport." pp. 63-95 In Iron Metabolism in Health and Disease, eds Brock JH, Halliday JW, Pippard MJ, and Powell LW. London: W.B. Saunders Company Ltd.
Ballou LR, Chao CP, Holness MA, Barker SC, and Raghow R. 1992. "Interleukin-1-Mediated PGE2 Production and Sphingomyelin Metabolism. Evidence for the Regulation of Cyclooxygenase Gene Expression by Sphingosine and Ceramide." J Biol Chem 267(28):20044-50.

BIBLIOGRAPHY
120
Barton JC and Bottomley SS. 2000. "Iron Deficiency Due to Excessive Therapeutic Phlebotomy in Hemochromatosis." Am J Hematol 65(3):223-6.
Barton JC, Shih WW, Sawada-Hirai R, Acton RT, Harmon L, Rivers C, and Rothenberg BE. 1997. "Genetic and Clinical Description of Hemochromatosis Probands and Heterozygotes: Evidence That Multiple Genes Linked to the Major Histocompatibility Complex Are Responsible for Hemochromatosis." Blood Cells Mol Dis 23(1):135-45.
Bassett ML, Halliday JW, and Powell LW. 1986. "Value of Hepatic Iron Measurements in Early Hemochromatosis and Determination of the Critical Iron Level Associated With Fibrosis." Hepatology 6(1):24-9.
Bermudez AJ, Ledoux DR, and Rottinghaus GE. 1995. "Effects of Fusarium moniliforme Culture Material Containing Known Levels of Fumonisin B1 in Ducklings." Avian Dis 39(4):879-86.
Bermudez AJ, Ledoux DR, Turk JR, and Rottinghaus GE. 1996. "The Chronic Effects of Fusarium moniliforme Culture Material, Containing Known Levels of Fumonisin B1, in Turkeys." Avian Dis 40(1):231-5.
Bever RJ Jr, Couch LH, Sutherland JB, Williams AJ, Beger RD, Churchwell MI, Doerge DR, and Howard PC. 2000. "DNA Adduct Formation by Fusarium Culture Extracts: Lack of Role of Fusarin C." Chem Biol Interact 128(2):141-57.
Bezuidenhout SC, Gelderblom WCA, Gorst-Allman CP, Horak RM, Marasas WFO, Spiteller G, and Vleggaar R. 1988. "Structure Elucidation of the Fumonisins, Mycotoxins from Fusarium moniliforme." Chem Soc Chem Commun 743-5.
Blanc JF, De Ledinghen V, Trimoulet P, Le Bail B, Bernard PH, Saric J, Balabaud C, and Bioulac-Sage P. 1999. "Premalignant Lesions and Hepatocellular Carcinoma in a Non-Cirrhotic Alcoholic Patient with Iron Overload and Normal Transferrin Saturation." J Hepatol 30(2):325-9.
Blisard KS and Bartow SA. 1986. "Neonatal Hemochromatosis." Hum Pathol 17(4):376-83.
Blot WJ. 1994. "Esophageal Cancer Trends and Risk Factors." Semin Oncol 21;403-10.
Blumberg RS, Chopra S, Ibrahim R, Crawford J, Farraye FA, Zeldis JB, and Berman MD. 1988. "Primary Hepatocellular Carcinoma in Idiopathic Hemochromatosis after Reversal of Cirrhosis." Gastroenterology 95(5):1399-402.
Bondy G, Suzuki C, Barker M, Armstrong C, Fernie S, Hierlihy L, Rowsell P, and Mueller R. 1995. "Toxicity of Fumonisin B1 Administered Intraperitoneally to Male Sprague-Dawley Rats." Food Chem Toxicol 33(8):653-65.

BIBLIOGRAPHY
121
Bondy GS, Suzuki CA, Fernie SM, Armstrong CL, Hierlihy SL, Savard ME, and Barker MG. 1997. "Toxicity of Fumonisin B1 to B6C3F1 Mice: a 14-Day Gavage Study." Food Chem Toxicol 35(10-11):981-9.
Bothwell TH and Bradlow BA. 1960. "Siderosis in the Bantu. A Combined Histopathological and Chemical Study." Arch Pathol 70;279-92.
Bothwell TH, Seftel H, Jacobs P, Torrance TD, and Baumslag N. 1964. "Iron Overload in Bantu Subjects. Studies on Availability of Iron in Bantu Beer." Am J Clin Nutr 14;47-51.
Bothwell TH, Charlton RW, Cook JD, and Finch CA. 1979. Iron Metabolism in Man. Oxford: Blackwell Scientific Publications.
Bottomley SS. 1982. "Sideroblastic Anaemia." Clin Haematol 11(2):389-409.
Bradbear RA, Bain C, Siskind V, Schofield FD, Webb S, Axelsen EM, Halliday JW, Bassett ML, and Powell LW. 1985. "Cohort Study of Internal Malignancy in Genetic Hemochromatosis and Other Chronic Nonalcoholic Liver Diseases." J Natl Cancer Inst 75(1):81-4.
Bradford MM. 1976. "A Rapid and Sensitive Method for the Quantitation of Microgram Quantities of Protein Utilizing the Principle of Protein-Dye Binding." Anal Biochem 72;248-54.
Brittenham GM. 1994. "New Advances in Iron Metabolism, Iron Deficiency, and Iron Overload." Curr Opin Hematol 1(2):101-6.
Britton RS, Tavill AS, and Bacon BR. 1994. "Mechanisms of Iron Toxicity." pp. 311-51 In Iron Metabolism in Health and Disease, eds. Brock JH, Halliday JW, Pippard MJ, and Powell LW. London: W.B. Saunders.
Brown LM, Blot WJ, Schuman SH, Smith VM, Ershow AG, Marks RD, and Fraumeni JF Jr. 1988. "Environmental Factors and High Risk of Esophageal Cancer among Men in Coastal South Carolina." J Natl Cancer Inst 80(20):1620-5.
Brown TP, Rottinghaus GE, and Williams ME. 1992. "Fumonisin Mycotoxicosis in Broilers: Performance and Pathology." Avian Dis 36(2):450-4.
Brown DW, McCoy CP, and Rottinghaus GE. 1994. "Experimental Feeding of Fusarium moniliforme Culture Material Containing Fumonisin B1 to Channel Fish, Ictalurus Punctatus." J Vet Diagn Invest 6(1):123-4.
Brunet S, Thibault L, Delvin E, Yotov W, Bendayan M, and Levy E. 1999. "Dietary Iron Overload and Induced Lipid Peroxidation Are Associated With Impaired Plasma Lipid Transport and Hepatic Sterol Metabolism in Rats." Hepatology 29(6):1809-17.
Brunser O, Espinoza J, Araya M, Pacheco I, and Cruchet S. 1993. "Chronic Iron Intake and Diarrhoeal Disease in Infants. A Field Study in a Less-Developed Country." Eur J Clin Nutr 47(5):317-26.

BIBLIOGRAPHY
122
Bucci TJ, Hansen DK, and LaBorde JB. 1996a. "Leukoencephalomalacia and Hemorrhage in the Brain of Rabbits Gavaged with Mycotoxin Fumonisin B1." Nat Toxins 4(1):51-2.
Bucci TJ and Howard PC. 1996b. "Effect of Fumonisin Mycotoxins in Animals." J Tox Toxin Rev 15(3):293-302.
Bucci TJ, Howard PC, Tolleson WH, LaBorde JB, and Hansen DK. 1998. "Renal Effects of Fumonisin Mycotoxins in Animals." Toxicol Pathol 26;160-4.
Buege JA and Aust SD. 1978. "Microsomal Lipid Peroxidation." Methods Enzymol 52302-10.
Bursch W, Oberhammer F, and Schulte-Herman RS. 1992. "Cell Death by Apoptosis and Its Protective Role against Disease." Trends Pharmacol Sci 13(6):245-51.
Butler T. 1902. "Notes on a Feeding Experiment to Produce Leucoencephalitis in a Horse, With Positive Results." Agric Vet Rev 26;748-51.
Caloni F, Spotti M, Auerbach H, Op den Camp H, Gremmels JF, and Pompa G. 2000. "In Vitro Metabolism of Fumonisin B1 by Ruminal Microflora." Vet Res Commun 24(6):379-87.
Camaschella C, Roetto A, Cicilano M, Pasquero P, Bosio S, Gubetta L, Di Vito F, Girelli D, Totaro A, Carella M, Grifa A, and Gasparini P. 1997. "Juvenile and Adult Hemochromatosis Are Distinct Genetic Disorders." Eur J Hum Genet 5(6):371-5.
Caramelli M, Dondo A, Cortellazzi GC, Visconti A, Minervini F, Doko MB, and Guarda F. 1993. "Leukoencephalomalacia in the Equine Caused by Fumonisins: First Report in Italy." Ippologia 4;449-56.
Carlson DB, Williams DE, Spitsbergen JM, Ross PF, Bacon CW, Meredith FI, and Riley RT. 2001. "Fumonisin B1 Promotes Aflatoxin B1 and N-Methyl-N'-Nitro-Nitrosoguanidine-Initiated Liver Tumors in Rainbow Trout." Toxicol Appl Pharmacol 172(1):29-36.
Carthew P, Nolan BM, Smith AG, and Edwards RE. 1997. "Iron Promotes DEN Initiated GST-P Foci in Rat Liver." Carcinogenesis 18;599-603.
Cartwright GE, Edwards CQ, Kravitz K, Skolnick M, Amos DB, Johnson A, and Buskjaer L. 1979. "Hereditary Hemochromatosis. Phenotypic Expression of the Disease." N Engl J Med 301(4):175-9.
Casteel SW, Turk JR, Cowart RP, and Rottinghaus GE. 1993. "Chronic Toxicity of Fumonisin in Weanling Pigs." J Vet Diagn Invest 5(3):413-7.
Casteel SW, Turk JR, and Rottinghaus GE. 1994. "Chronic Effects of Dietary Fumonisin on the Heart and Pulmonary Vasculature of Swine." Fundam Appl Toxicol 23;518-24.

BIBLIOGRAPHY
123
Cawood ME, Gelderblom WCA, Vleggar Y, Behrend Y, Thiel PG, and Marasas WFO. 1991. "Isolation of the Fumonisin Mycotoxins: a Quantitative Approach." J Agric Food Chem 391958-62.
Cayama E, Tsuda H, Sarma DS, and Farber E. 1978. "Initiation of Chemical Carcinogenesis Requires Cell Proliferation." Nature 275(5675):60-2.
Charlton RW, Jacobs P, Seftel H, and Bothwell TH. 1964. "Effect of Alcohol on Iron Absorption." Br Med J 2;1427-9.
Chen X, Yang Gy, Ding WY, Bondoc F, Curtis SK, and Yang CS. 1999. "An Esophagogastroduodenal Anastomosis Model for Esophageal Adenocarcinogenesis in Rats and Enhancement by Iron Overload." Carcinogenesis 20(9):1801-8.
Chenoufi N, Loréal O, Drenou B, Cariou S, Hubert N, Leroyer P, Brissot P, and Lescoat G. 1997. "Iron may induce both DNA Synthesis and Repair in Rat Hepatocytes Stimulated by EGF/Pyruvate." J Hepatol 26(3):650-8.
Chu FS and Li GY. 1994. "Simultaneous Occurrence of Fumonisin B1 and Other Mycotoxins in Moldy Maize Collected from People's Republic of China in Regions with High Incidences of Esophageal Cancer." Appl Environ Microbiol 60;847-52.
Cohen SM and Ellwein LB. 1990. "Cell Proliferation in Carcinogenesis." Science 249;1007-11.
Cohen SM. 1998. "Cell Proliferation and Carcinogenesis." Drug Metab Rev 30;339-57.
Collins TF, Shackelford ME, Sprando RL, Black TN, Laborde JB, Hansen DK, Eppley RM, Trucksess MW, Howard PC, Bryant MA, Ruggles DI, Olejnik N, and Rorie JI. 1998. "Effects of Fumonisin B1 in Pregnant Rats." Food Chem Toxicol 36(5):397-408.
Colvin BM and Harrison LR. 1992. "Fumonisin-Induced Pulmonary Edema and Hydrothorax in Swine." Symposium on Fumonisins: a Current Perspective and View to the Future, Raleigh, North Carolina, USA, April 24-25, 1991. Mycopathologia; 117(1-2):79-82.
Colvin BM, Cooley AJ, and Beaver RW. 1993. "Fumonisin Toxicosis in Swine: Clinical and Pathologic Findings." J Vet Diagn Invest 5;232-41.
Constable PD, Smith GW, Rottinghaus GE, and Haschek WM. 2000. "Ingestion of Fumonisin B1-Containing Culture Material Decreases Cardiac Contractility and Mechanical Efficiency in Swine." Toxicol Appl Pharmacol 162(3):151-60.
Cook P. 1971. "Cancer of the Oesophagus in Africa. A Summary and Evaluation of the Evidence for the Frequency of Occurrence, and a Preliminary Indication of the Possible Association with the Consumption of Alcoholic Drinks Made from Maize." Br J Cancer 25;853-80.

BIBLIOGRAPHY
124
Cornell J, Nelson MM, and Beighton P. 1983. "Neural Tube Defects in the Cape Town Area, 1975-1980." S Afr Med J 64(3):83-4.
de Verneuil H, Aitken G, and Nordmann Y. 1978. "Familial and Sporadic Porphyria Cutanea: Two Different Diseases." Hum Genet 44(2):145-51.
Deugnier YM, Loréal O, Turlin B, Guyader D, Jouanolle H, Moirand R, Jacquelinet C, and Brissot P. 1992. "Liver Pathology in Genetic Hemochromatosis: a Review of 135 Homozygous Cases and Their Bioclinical Correlations." Gastroenterology 102(6):2050-9.
Deugnier YM, Charalambous P, Le Quilleuc D, Turlin B, Searle J, Brissot P, Powell LW, and Halliday JW. 1993a. "Preneoplastic Significance of Hepatic Iron-Free Foci in Genetic Hemochromatosis: a Study of 185 Patients." Hepatology 18(6):1363-9.
Deugnier YM, Guyader D, Crantock L, Lopez JM, Turlin B, Yaouanq J, Jouanolle H, Campion JP, Launois B, and Halliday JW. 1993b. "Primary Liver Cancer in Genetic Hemochromatosis: a Clinical, Pathological, and Pathogenetic Study of 54 Cases." Gastroenterology 104(1):228-34.
Deugnier Y, Turlin B, and Loréal. 1998. "Iron and Neoplasia." J Hepatol 28 (Suppl 1) 21-5.
Deugnier Y and Loréal O. 2000. "Iron as a Carcinogen." pp. 239-49 In Hemochromatosis, eds Barton J and Edwards C. Cambridge: Cambridge University Press.
Devasthali SD, Gordeuk VR, Brittenham GM, Bravo JR, Hughes MA, and Keating LJ. 1991. "Bioavailability of Carbonyl Iron: a Randomized, Double-Blind Study." Eur J Haematol 46(5):272-8.
Diaz GJ and Boermans HJ. 1994. "Fumonisin Toxicosis in Domestic Animals: a Review." Vet Hum Toxicol 36(6):548-55.
Djeha A and Brock JH. 1992. "Uptake and Intracellular Handling of Iron from Transferrin and Iron Chelates by Mitogen Stimulated Mouse Lymphocytes." Biochim Biophys Acta 1133(2):147-52.
Domenech J, Boccas B, Pellegrin F, Laurent D, Kohler F, Magnol J, and Lambert C. 1985. "Equine Leucoencephalomalacia in New Caledonia." Aust Vet J 62(12):422-3.
Edling JE, Britton RS, Grisham MB, and Bacon BR. 1990. "Increased Unwinding of Hepatic Double-Stranded DNA (DsDNA) in Rats with Chronic Dietary Iron Overload (Abstract)." Gastroenterology 98(A585).
Edrington TS, Kamps-Holtzapple CA, Harvey RB, Kubena LF, Elissalde MH, and Rottinghaus GE. 1995. "Acute Hepatic and Renal Toxicity in Lambs Dosed with Fumonisin-Containing Culture Material." J Anim Sci 73(2):508-15.

BIBLIOGRAPHY
125
Elder GH, Urquhart AJ, De Salamanca RE, Munoz JJ, and Bonkovsky HL. 1985. "Immunoreactive Uroporphyrinogen Decarboxylase in the Liver in Porphyria Cutanea Tarda." Lancet 2(8449):229-33.
Elder GH and Roberts AG. 1995. "Uroporphyrinogen Decarboxylase." J Bioenerg Biomembr 27(2):207-14.
Elder GH and Worwood M. 1998. "Mutations in the Hemochromatosis Gene, Porphyria Cutanea Tarda, and Iron Overload." Hepatology 27(1):289-91.
Eriksson LC, Torndal UB, and Andersson GN. 1986. "The Transferrin Receptor in Hepatocyte Nodules: Binding Properties, Subcellular Distribution and Endocytosis." Carcinogenesis 7(9):1467-74.
Esterbauer H and Cheeseman KH. 1990. "Determination of Aldehydic Lipid Peroxidation Product: Malondialdehyde and 4-Hydroxynonenal." pp. 407-21 In Methods in Enzymology, vol. 186, San Diego: Academic Press.
Farber E and Sarma DSR. 1987. "Biology of Disease. Hepatocarcinogenesis: a Dynamic Cellular Perspective." Lab Invest 564-22.
Farber E. 1991. "Hepatocyte Proliferation in Stepwise Development of Experimental Liver Cell Cancer." Dig Dis Sci 36(7):973-8.
Fargion S, Piperno A, Cappellini MD, Sampietro M, Fracanzani AL, Romano R, Caldarelli R, Marcelli R, Vecchi L, and Fiorelli G. 1992. "Hepatitis C Virus and Porphyria Cutanea Tarda: Evidence of a Strong Association." Hepatology 16(6):1322-6.
Fargion S, Fracanzani AL, Romano R, Cappellini MD, Fare M, Mattioli M, Piperno A, Ronchi G, and Fiorelli G. 1996. "Genetic Hemochromatosis in Italian Patients with Porphyria Cutanea Tarda: Possible Explanation for Iron Overload." J Hepatol 24(5):564-9.
Farrell FJ, Nguyen M, Woodley S, Imperial JC, Garcia-Kennedy R, Man K, Esquivel CO, and Keeffe EB. 1994. "Outcome of Liver Transplantation in Patients with Hemochromatosis." Hepatology 20(2):404-10.
Fazekas B, Bajmocy E, Flavits R, Fenyvesi A, and Tanyi J. 1998. "Fumonisin B1 Contamination of Maize and Experimental Acute Fumonisin Toxicosis in Pigs." J Vet Med Series B 45(3):171-81.
Feder JN, Gnirke A, Thomas W, Tsuchihashi Z, Ruddy DA, Basava A, Dormishian F, Domingo R Jr, Ellis MC, Fullan A, Hinton LM, Jones NL, Kimmel BE, Kronmal GS, Lauer P, Lee VK, Loeb DB, Mapa FA, McClelland E, Meyer NC, Mintier GA, Moeller N, Moore T, Morikang E, and Wolff RK. 1996. "A Novel MHC Class I-Like Gene Is Mutated in Patients with Hereditary Haemochromatosis." Nat Genet 13(4):399-408.
Fellows IW, Stewart M, Jeffcoate WJ, Smith PG, and Toghill PJ. 1988. "Hepatocellular Carcinoma in Primary Haemochromatosis in the Absence of Cirrhosis." Gut 29(11):1603-6.

BIBLIOGRAPHY
126
Finch C. 1994. "Regulators of Iron Balance in Humans." Blood 84(6):1697-702.
Fincham JE, Marasas WF, Taljaard JJ, Kriek NP, Badenhorst CJ, Gelderblom WC, Seier JV, Smuts CM, Faber M, and Weight MJ. 1992. "Atherogenic Effects in a Non-Human Primate of Fusarium moniliforme Cultures Added to a Carbohydrate Diet." Atherosclerosis 94(1):13-25.
Floss JL, Casteel SW, Johnson GC, Rottinghaus GE, and Krause GF. 1994. "Development Toxicity of Fumonisin in Syrian Hamsters." Mycopathologia 128(1):33-8.
Franceschi S, Bidoli E, Baron AE, and La Vecchia C. 1990. "Maize and Risk of Cancers of the Oral Cavity, Pharynx, and Esophagus in Northeastern Italy." J Natl Cancer Inst 82(17):1407-11.
Gangaidzo IT and Gordeuk VR. 1995. "Hepatocellular Carcinoma and African Iron Overload." Gut 37727-30.
Garey JR, Franklin KF, Brown DA, Harrison LM, Metcalf KM, and Kushner JP. 1993. "Analysis of Uroporphyrinogen Decarboxylase Complementary DNAs in Sporadic Porphyria Cutanea Tarda." Gastroenterology 105(1):165-9.
Gelderblom WCA, Thiel PG, Marasas WFO, and Van der Merwe KJ. 1984. "Natural Occurrence of Fusarin C, a Mutagen Produced by Fusarium moniliforme, on Corn." J Agric Food Chem 32;1064-7.
Gelderblom WCA, Jaskiewicz K, Marasas WFO, Thiel PG, Horak MJ, Vleggaar R, and Kriek NPJ. 1988a. "Fumonisins: Novel Mycotoxins with Cancer Promoting Activity Produced by Fusarium moniliforme." Appl Environ Microbiol 54;1806-11.
Gelderblom WCA, Marasas WFO, Jaskiewicz K, Combrinck S, and Van Schalkwyk DJ. 1988b. "Cancer Promoting Potential of Different Strains of Fusarium moniliforme in a Short-Term Cancer Initiation/Promotion Assay." Carcinogenesis 9;1405-9.
Gelderblom WCA, Kriek NPJ, Marasas WFO, and Thiel PG. 1991. "Toxicity and Carcinogenicity of the Fusarium moniliforme Metabolite, Fumonisin B1, in Rats." Carcinogenesis 12;1247-51.
Gelderblom WCA and Snyman SD. 1991. "Mutagenicity of Potentially Carcinogenic Mycotoxins Produced by Fusarium moniliforme." Mycotoxin Res 7;46-52.
Gelderblom WCA, Semple E, Marasas WFO, and Farber E. 1992. "The Cancer-Initiating Potential of the Fumonisin B Mycotoxins." Carcinogenesis 13;433-7.
Gelderblom WCA, Cawood ME, Snyman D, Vleggaar R, and Marasas WFO. 1993. "Structure-Activity Relationships of Fumonisins in Short-Term Carcinogenesis and Cytotoxicity Assays." Food Chem Toxicol 31;407-14.

BIBLIOGRAPHY
127
Gelderblom WCA, Cawood ME, Snyman SD, and Marasas WFO. 1994. "Fumonisin B1 Dosimetry in Relation to Cancer Initiation in Rat Liver." Carcinogenesis 15;209-14.
Gelderblom WCA, Snyman SD, Van der Westhuizen L, and Marasas WFO. 1995. "Mitoinhibitory Effect of Fumonisin B1 on Rat Hepatocytes in Primary Culture." Carcinogenesis 16625-31.
Gelderblom WC, Smuts CM, Abel S, Snyman SD, Cawood ME, van der Westhuizen L, and Swanevelder S. 1996a. "Effect of Fumonisin B1 on Protein and Lipid Synthesis in Primary Rat Hepatocytes." Food Chem Toxicol 34(4):361-9.
Gelderblom WCA, Snyman SD, Abel S, Lebepe-Mazur S, Smuts CM, Van der Westhuizen L, Marasas WFO, Victor TC, Knasmüller S, and Huber W. 1996b. "Hepatotoxicity and -Carcinogenicity of the Fumonisins in Rats." pp. 279-96 In Fumonisins in Food, New York: Plenum Press.
Gelderblom WCA, Snyman SD, Lebepe-Mazur S, Van der Westhuizen, Kriek NPJ, and Marasas WFO. 1996c. "The Cancer-Promoting Potential of Fumonisin B1 in Rat Liver Using Diethylnitrosamine as a Cancer Initiator." Cancer Lett 109;101-8.
Gelderblom WC, Abel S, Smuts CM, Marnewick J, Marasas WF, Lemmer ER, and Ramljak D. 2001a. "Fumonisin-Induced Hepatocarcinogenesis: Mechanisms Related to Cancer Initiation and Promotion." Environ Health Perspect 109(Suppl 2):291-300.
Gelderblom WC, Galendo D, Abel S, Swanevelder S, Marasas WF, and Wild CP. 2001b. "Cancer Initiation by Fumonisin B1 in Rat Liver--Role of Cell Proliferation." Cancer Lett 169(2):127-37.
Gelderblom WC, Lebepe-Mazur S, Snijman PW, Abel S, Swanevelder S, Kriek NP, and Marasas WF. 2001c. "Toxicological Effects in Rats Chronically Fed Low Dietary Levels of Fumonisin B1." Toxicology 161(1-2):39-51.
Gelderblom WC, Seier JV, Snijman PW, Van Schalkwyk DJ, Shephard GS, and Marasas WF. 2001d. "Toxicity of Culture Material of Fusarium verticillioides Strain MRC 826 to Nonhuman Primates." Environ Health Perspect 109(Suppl 2):267-76.
Gelderblom WCA, Marasas WFO, Lebepe-Mazur S, Swanevelder S, Vessey CJ, and de la M Hall P. 2002. "Interaction of Fumonisin B1 and Aflatoxin B1 in a Short-Term Carcinogenesis Model in Rat Liver." Toxicology.
Goel S, Schumacher J, Lenz SD, and Kemppainen BW. 1996. "Effects of Fusarium moniliforme Isolates on Tissue and Serum Sphingolipid Concentrations in Horses." Vet Hum Toxicol 38(4):265-70.

BIBLIOGRAPHY
128
Goldfischer S, Grotsky HW, Chang CH, Berman EL, Richert RR, Karmarkar SD, Roskamp JO, and Morecki R. 1981. "Idiopathic Neonatal Iron Storage Involving the Liver, Pancreas, Heart, and Endocrine and Exocrine Glands." Hepatology 1(1):58-64.
Gordeuk VR, Boyd RD, and Brittenham GM. 1986. "Dietary Iron Overload Persists in Rural Sub-Saharan Africa." Lancet 1(8493):1310-3.
Gordeuk VR. 1992. "Hereditary and Nutritional Iron Overload." Baillieres Clin Haematol 5(1):169-86.
Gordeuk V, Mukiibi J, Hasstedt SJ, Samowitz W, Edwards CQ, West G, Ndambire S, Emmanual J, Nkanza N, and Chapanduka Z. 1992. "Iron Overload in Africa. Interaction between a Gene and Dietary Iron Content." N Engl J Med 326(2):95-100.
Green R, Charlton R, Seftel H, Bothwell T, Mayet F, Adams B, Finch C, and Layrisse M. 1968. "Body Iron Excretion in Man: a Collaborative Study." Am J Med 45(3):336-53.
Grisham JW and Thorgeirsson SS. 1997. “Liver Stem Cells.” pp. 233-82. In Stem Cells. ed Potten CS. London, UK. Academic Press.
Gumprecht LA, Marcucci A, Weigel RM, Vesonder RF, Riley RT, Showker JL, Beasley VR, and Haschek WM. 1995. "Effects of Intravenous Fumonisin B1 in Rabbits: Nephrotoxicity and Sphingolipid Alterations." Nat Toxins 3(5):395-403.
Gumprecht LA, Beasley VR, Weigel RM, Parker HM, Tumbleson ME, Bacon CW, Meredith FI, and Haschek WM.1998. "Development of Fumonisin-Induced Hepatotoxicity and Pulmonary Edema in Orally Dosed Swine: Morphological and Biochemical Alterations." Toxicol Pathol 26(6):777-88.
Gunshin H, Mackenzie B, Berger UV, Gunshin Y, Romero MF, Boron WF, Nussberger S, Gollan JL, and Hediger MA. 1997. "Cloning and Characterization of a Mammalian Proton-Coupled Metal-Ion Transporter." Nature 388(6641):482-8.
Gurung NK, Rankins DL Jr, Shelby RA, and Goel S. 1998. "Effects of Fumonisin B1-Contaminated Feeds on Weanling Angora Goats." J Anim Sci 76(11):2863-70.
Guzman RE, Casteel SW, Rottinghaus GE, and Turk JR. 1997. "Chronic Consumption of Fumonisins Derived from Fusarium moniliforme Culture Material: Clinical and Pathologic Effects in Swine." J Vet Diagn Invest 9(2):216-8.
Haberman HF, Rosenberg F, and Menon IA. 1975. "Porphyria Cutanea Tarda: Comparison of Cases Precipitated by Alcohol and Estrogens." Can Med Assoc J 113(7):653-5.

BIBLIOGRAPHY
129
Haliburton JC and Buck WB. 1986. "Equine Leukoencephalomalacia: a Historical Review." Curr Top Vet Med Anim Sci 3375-9.
Halver JE. 1968. "Aflatoxicosis and Trout Hepatoma." Bull Off Int Epizoot 69(7):1249-78.
Hann HW, Stahlhut MW, and Hann CL. 1990. "Effect of Iron and Desferoxamine on Cell Growth and in vitro Ferritin Synthesis in Human Hepatoma Cell Lines." Hepatology 11(4):566-9.
Hannun YA, Loomis CR, Merrill AH Jr, and Bell RM. 1986. "Sphingosine Inhibition of Protein Kinase C Activity and of Phorbol Dibutyrate Binding in vitro and in Human Platelets." J Biol Chem 261(27):12604-9.
Harford JB and Klausner RD. 1990. "Coordinate Post-Transcriptional Regulation of Ferritin and Transferrin Receptor Expression: the Role of Regulated RNA-Protein Interaction." Enzyme 44(1-4):28-41.
Harrison LR, Colvin BM, Greene JT, Newman LE, and Cole JR Jr. 1990. "Pulmonary Edema and Hydrothorax in Swine Produced by Fumonisin B1, a Toxic Metabolite of Fusarium moniliforme." J Vet Diagn Invest 2(3):217-21.
Haschek WM, Motelin G, Ness DK, Harlin KS, Hall WF, Vesonder RF, Peterson RE, and Beasley VR. 1992. "Characterization of Fumonisin Toxicity in Orally and Intravenously Dosed Swine." Mycopathologia 117(1-2):83-96.
Haschek WM, Gumprecht LA, Smith G, Tumbleson ME, and Constable PD. 2001. "Fumonisin Toxicosis in Swine: an Overview of Porcine Pulmonary Edema and Current Perspectives." Environ Health Perspect 109(Suppl 2):251-7.
Hendricks K. 1999. "Fumonisins and Neural Tube Defects in South Texas." Epidemiology 10(2):198-200.
Henry MH, Wyatt RD, and Fletchert OJ. 2000. "The Toxicity of Purified Fumonisin B1 in Broiler Chicks." Poult Sci 79(10):1378-84.
Hirota N, Hamazaki M, and Williams GM. 1982. "Resistance to Iron Accumulation and Presence of Hepatitis B Surface Antigen in Preneoplastic and Neoplastic Lesions in Human Hemochromatotic Livers." Hepatogastroenterology 29(2):49-51.
Hogberg J, Bergstrand A, and Jakobsson SV. 1973. "Lipid Peroxidation of Rat-Liver Microsomes. Its Effect on the Microsomal Membrane and Some Membrane-Bound Microsomal Enzymes." Eur J Biochem 37(1):51-91.
Hoogstraten J, de Sa DJ, and Knisely AS. 1990. "Fetal Liver Disease May Precede Extrahepatic Siderosis in Neonatal Hemochromatosis." Gastroenterology 98(6):1699-701.

BIBLIOGRAPHY
130
Hormozdiari H, Day NE, Aramesh B, and Mahboubi E. 1975. "Dietary Factors and Esophageal Cancer in the Caspian Littoral of Iran." Cancer Res 35(11 Pt. 2):3493-8.
Horribin DF, ed. 1990. Omege-6 Essential Fatty Acids: Pathophysiology and Roles in Clinical Medicine. New York: Alan R. Liss, Inc.
House C. 1995. "Moldy Corn Kills Several Horses in Kentucky, Virginia." Feedstuffs 67;1-3.
Howard PC, Eppley RM, Stack ME, Warbritton A, Voss KA, Lorentzen RJ, Kovach RM, and Bucci TJ. 2001. "Fumonisin B1 Carcinogenicity in a Two-Year Feeding Study Using F344 Rats and B6C3F1 Mice." Environ Health Perspect 109(Suppl 2):277-82.
Howerth EW, Wyatt RD, and Hayes DA. 1989. "Leukoencephalomalacia in a White-Tailed Deer from North Carolina." J Wildl Dis 25(3):384-7.
Hu ML, Frankel EN, Leibovitz BE, and Tappel AL. 1989. "Effect of Dietary Lipids and Vitamin E on in Vitro Lipid Peroxidation in Rat Liver and Kidney Homogenates." J Nutr 119(11):1574-82.
Huebers HA, Brittenham GM, Csiba E, and Finch CA. 1986. "Absorption of Carbonyl Iron." J Lab Clin Med 108(5):473-8.
Idjradinata P, Watkins WE, and Pollitt E. 1994. "Adverse Effect of Iron Supplementation on Weight Gain of Iron-Replete Young Children." Lancet 343(8908):1252-4.
Ineos Acrylics. "Acrylics online" [Web Page]. Available at www.ineosacrylics.com.
Irving MG, Halliday JW, and Powell LW. 1988. "Association between Alcoholism and Increased Hepatic Iron Stores." Alcohol Clin Exp Res 12(1):7-13.
Iwai K, Drake SK, Wehr NB, Weissman AM, LaVaute T, Minato N, Klausner RD, Levine RL, and Rouault TA. 1998. "Iron-Dependent Oxidation, Ubiquitination, and Degradation of Iron Regulatory Protein 2: Implications for Degradation of Oxidized Proteins." Proc Natl Acad Sci USA 95(9):4924-8.
Iwanoff X, Yuan C, and Fang S. 1957. "Ueber Die Toxische Enzephalomalazie (Moldy Corn Poisoning) Der Einhufer in China." Archiv Fuer Experimentelle Veterinaermedizin 11;1033-56.
Jaskiewicz K, Marasas WF, and Taljaard JJ. 1987. "Hepatitis in Vervet Monkeys Caused by Fusarium moniliforme." J Comp Pathol 97(3):281-91.
Jaskiewicz K, Marasas WF, Lazarus C, Beyers AD, and Van Helden PD. 1988. "Association of Esophageal Cytological Abnormalities with Vitamin and Lipotrope Deficiencies in Populations at Risk for Esophageal Cancer." Anticancer Res 8(4):711-5.

BIBLIOGRAPHY
131
Kaltwasser JP, Gottschalk R, and Seidl CH. 1998. "Severe Juvenile Haemochromatosis (JH) Missing HFE Gene Variants: Implications for a Second Gene Locus Leading to Iron Overload." Br J Haematol 102(4):1111-2.
Kappas A, Sassa S, Galbraith RA, and Nordmann Y. 1995. "The Porphyrias." pp. 2103-59 In The Molecular and Metabolic Basis of Inherited Disease, 7th ed. eds Scriver CR, Beaudet AL, Sly WS, and Valle D. New York: McGraw-Hill.
Kawabata H, Yang R, Hirama T, Vuong PT, Kawano S, Gombart AF, and Koeffler HP. 1999. "Molecular Cloning of Transferrin Receptor 2. A New Member of the Transferrin Receptor-Like Family." J Biol Chem 274(30):20826-32.
Kellerman TS, Marasas WF, Pienaar JG, and Naude TW. 1972. "A Mycotoxicosis of Equidae Caused by Fusarium moniliforme Sheldon. A Preliminary Communication." Onderstepoort J Vet Res 39(4):205-8.
Kellerman TS, Marasas WF, Thiel PG, Gelderblom WC, Cawood M, and Coetzer JA. 1990. "Leukoencephalomalacia in Two Horses Induced by Oral Dosing of Fumonisin B1." Onderstepoort J Vet Res 57(4):269-75.
Kilpe VE, Krakauer H, and Wren RE. 1993. "An Analysis of Liver Transplant Experience from 37 Transplant Centers As Reported to Medicare." Transplantation 56(3):554-61.
Kim HY, Klausner RD, and Rouault TA. 1995. "Translational Repressor Activity is Equivalent and is Quantitatively Predicted by in Vitro RNA Binding for Two Iron-Responsive Element-Binding Proteins, IRP1 and IRP2." J Biol Chem 270(10):4983-6.
Kinchington D, Randall S, Winther M, and Horrobin D. 1993. "Lithium Gamma-Linolenate-Induced Cytotoxicity against Cells Chronically Infected With HIV-1." FEBS Lett 330(2):219-21.
Kmet J and Mahboubi E. 1972. "Esophageal Cancer in the Caspian Littoral of Iran: Initial Studies." Science 175(24):846-53.
Knasmuller S, Bresgen N, Kassie F, Mersch-Sundermann V, Gelderblom W, Zohrer E, and Eckl PM. 1997. "Genotoxic Effects of Three Fusarium Mycotoxins, Fumonisin B1, Moniliformin and Vomitoxin in Bacteria and in Primary Cultures of Rat Hepatocytes." Mutat Res 391(1-2):39-48.
Knisely AS. 1992. "Neonatal Hemochromatosis." Adv Pediatr 39;383-403.
Kowdley KV, Hassanein T, Kaur S, Farrell FJ, Van Thiel DH, Keeffe EB, Sorrell MF, Bacon BR, Weber FL Jr, and Tavill AS. 1995. "Primary Liver Cancer and Survival in Patients Undergoing Liver Transplantation for Hemochromatosis." Liver Transpl Surg 1(4):237-41.

BIBLIOGRAPHY
132
Kriek NP, Kellerman TS, and Marasas WF. 1981. "A Comparative Study of the Toxicity of Fusarium verticillioides (=F. moniliforme) to Horses, Primates, Pigs, Sheep and Rats." Onderstepoort J Vet Res 48(2):129-31.
LaBorde JB, Terry KK, Howard PC, Chen JJ, Collins TF, Shackelford ME, and Hansen DK. 1997. "Lack of Embryotoxicity of Fumonisin B1 in New Zealand White Rabbits." Fundam Appl Toxico 40(1):120-8.
Ledoux DR, Brown TP, Weibking TS, and Rottinghaus GE. 1992. "Fumonisin Toxicity in Broiler Chicks." J Vet Diagn Invest 4(3):330-3.
Lefkowitch JH and Grossman ME. 1983. "Hepatic Pathology in Porphyria Cutanea Tarda." Liver 3(1):19-29.
Lemmer ER, Gelderblom WC, Shephard EG, Abel S, Seymour BL, Cruse JP, Kirsch RE, Marasas WF, and Hall PM. 1999. "The Effects of Dietary Iron Overload on Fumonisin B1-Induced Cancer Promotion in the Rat Liver." Cancer Lett 146(2):207-15.
Lemmer ER, Hall PM, Omori N, Omori M, Shephard EG, Gelderblom WC, Cruse JP, Barnard RA, Marasas WF, Kirsch RE, and Thorgeirsson SS. 1999. “Histopathology and Gene Expression Changes in Rat Liver during Feeding of Fumonisin B1, a Carcinogenic Mycotoxin Produced by Fusarium moniliforme.” Carcinogenesis 20 (5):817-24.
Li MH, Lu SH, Ji C, Wang Y, Wang M, Cheng S, and Tian G. 1980. "Experimental Studies on the Carcinogenicity of Fungus-Contaminated Food from Linxian County." pp. 139-8 In Genetic and Environmental Factors in Experimental and Human Cancer, eds Gelbion HV et al. Tokyo: Japan Sci Soc Press.
Li W, Riley RT, Voss KA, and Norred WP. 2000. "Role of Proliferation in the Toxicity of Fumonisin B1: Enhanced Hepatotoxic Response in the Partially Hepatectomized Rat." Journal of Toxicology and Environmental Health 60(7):441-7.
Loeb LA, James EA, Waltersdorph AM, and Klebanoff SJ. 1988. "Mutagenesis by the Autoxidation of Iron with Isolated DNA." Proc Natl Acad Sci USA 85(11):3918-22.
Lucock MD, Daskalakis I, Lumb CH, Schorah CJ, and Levene MI. 1998. "Impaired Regeneration of Monoglutamyl Tetrahydrofolate Leads to Cellular Folate Depletion in Mothers Affected by a Spina Bifida Pregnancy." Mol Genet Metab 65(1):18-30.
Ludwig J, Hashimoto E, Porayko MK, Moyer TP, and Baldus WP. 1997. "Hemosiderosis in Cirrhosis: a Study of 447 Native Livers." Gastroenterology 112(3):882-8.

BIBLIOGRAPHY
133
Lumlertdacha S, Lovell RT, Shelby RA, Lenz SD, and Kemppainen BW. 1995. "Growth, Hematology, and Histopathology of Channel Catfish, Ictalurus Punctatus, Fed Toxins from Fusarium moniliforme." Aquaculture 130201-8.
Lund DP, Lillehei CW, Kevy S, Perez-Atayde A, Maller E, Treacy S, and Vacanti JP. 1993. "Liver Transplantation in Newborn Liver Failure: Treatment for Neonatal Hemochromatosis." Transplant Proc 25(1 Pt 2):1068-71.
Lundvall O, Weinfeld A, and Lundin P. 1970. "Iron Storage in Porphyria Cutanea Tarda." Acta Med Scand 1-2(1):37-53.
Lundvall O. 1971. "The Effect of Phlebotomy Therapy in Porphyria Cutanea Tarda. Its Relation to the Phlebotomy-Induced Reduction of Iron Stores." Acta Med Scand 189(1-2):33-49.
Mackinnon M, Clayton C, Plummer J, Ahern M, Cmielewski P, Ilsley A, and Hall P. 1995. "Iron Overload Facilitates Hepatic Fibrosis in the Rat Alcohol/Low-Dose Carbon Tetrachloride Model." Hepatology 21(4):1083-8.
MacPhail AP, Simon MO, Torrance JD, Charlton RW, Bothwell TH, and Isaacson C. 1979. "Changing Patterns of Dietary Iron Overload in Black South Africans." Am J Clin Nutr 32(6):1272-8.
Makaula NA, Marasas WFO, Venter FS, Badenhorst CJ, Bradshaw D, and Swanevelder S. 1996. "Oesophageal and Other Cancer Patterns in Four Selected Districts of Transkei, Southern Africa: 1985-1990." Afr J Health Sci 311-.
Mandishona E, MacPhail AP, Gordeuk VR, Kedda MA, Paterson AC, Rouault TA, and Kew MC. 1998. "Dietary Iron Overload As a Risk Factor for Hepatocellular Carcinoma in Black Africans." Hepatology 27(6):1563-6.
Marasas WF, Kellerman TS, Pienaar JG, and Naude TW. 1976. "Leukoencephalomalacia: a Mycotoxicosis of Equidae Caused by Fusarium moniliforme Sheldon." Onderstepoort J Vet Res 43(3):113-22.
Marasas WFO, Wehner FC, van Rensburg SJ, and van Schalkwyk DJ. 1981. "Mycoflora of Corn Produced in Human Esophageal Cancer Areas in Transkei, Southern Africa." Phytopathology 71;792-6.
Marasas WF, Kriek NP, Fincham JE, and van Rensburg SJ. 1984. "Primary Liver Cancer and Oesophageal Basal Cell Hyperplasia in Rats Caused by Fusarium moniliforme." Int J Cancer 34(3):383-7.
Marasas WF, Jaskiewicz K, Venter FS, and Van Schalkwyk DJ. 1988a. "Fusarium moniliforme Contamination of Maize in Oesophageal Cancer Areas in Transkei." S Afr Med J 74(3):110-4.

BIBLIOGRAPHY
134
Marasas WF, Kellerman TS, Gelderblom WC, Coetzer JA, Thiel PG, and Van Der Lugt JJ. 1988b. "Leukoencephalomalacia in a Horse Induced by Fumonisin B1 Isolated from Fusarium moniliforme." Onderstepoort J Vet Res 55(4):197-203.
Marasas WF. 1996. "Fumonisins: History, World-Wide Occurrence and Impact." Fumonisins in Food 1-17.
Marasas WF. 2001. "Discovery and Occurrence of the Fumonisins: a Historical Perspective." Environ Health Perspect 109(Suppl 2):239-43.
Mathur S, Constable PD, Eppley RM, Waggoner AL, Tumbleson ME, and Haschek WM. 2001. "Fumonisin B(1) is Hepatotoxic and Nephrotoxic in Milk-Fed Calves." Toxicol Sci 60(2):385-96.
Matzner Y, Hershko C, Polliack A, Konijn AM, and Izak G. 1979. "Suppressive Effect of Ferritin on in Vitro Lymphocyte Function." Br J Haematol 42(3):345-53.
McCord JM. 1996. "Effects of Positive Iron Status at a Cellular Level." Nutr Rev 54(3):85-8.
McKie AT, Marciani P, Rolfs A, Brennan K, Wehr K, Barrow D, Miret S, Bomford A, Peters TJ, Farzaneh F, Hediger MA, Hentze MW, and Simpson RJ. 2000. "A Novel Duodenal Iron-Regulated Transporter, IREG1, Implicated in the Basolateral Transfer of Iron to the Circulation." Mol Cell 5(2):299-309.
Merrill AH Jr, van Echten G, Wang E, and Sandhoff K. 1993. "Fumonisin B1 Inhibits Sphingosine (Sphinganine) N-Acyltransferase and De Novo Sphingolipid Biosynthesis in Cultured Neurons in Situ." J Biol Chem 268(36):27299-306.
Merryweather-Clarke AT, Pointon JJ, Shearman JD, and Robson KJ. 1997. "Global Prevalence of Putative Haemochromatosis Mutations." J Med Genet 34(4):275-8.
Miller MA, Honstead JP, and Lovell RA. 1996. "Regulatory Aspects of Fumonisins With Respect to Animal Feed. Animal Derived Residues in Foods." Adv Exp Med Biol 392;363-8.
Monina MI, Moscotena EA, Ruagar J, Indiart JR, Reinoso EH, Muro A, Nosetto EO, and Pons ER. 1981. "Leucoencefalomalacia Equina. Casos Registrados En El Pais." Revista Militar De Veterinaria 28;13-7.
Moore CA, Li S, Li Z, Hong SX, Gu HQ, Berry RJ, Mulinare J, and Erickson JD. 1997. "Elevated Rates of Severe Neural Tube Defects in a High-Prevalence Area in Northern China." Am J Med Genet 73(2):113-8.
Moore MA, Nakagawa K, Satoh K, Ishikawa T, and Sato K. 1987. “Single GST-P Positive Liver Cells-Putative Initiated Hepatocytes.” Carcinogenesis 8(3):483-6.

BIBLIOGRAPHY
135
Morgan MK, Schroeder JJ, Rottinghaus GE, Powell DC, Bursian SJ, and Aulerich RJ. 1997. "Dietary Fumonisins Disrupt Sphingolipid Metabolism in Mink and Increase the Free Sphinganine to Sphingosine Ratio in Urine but Not in Hair." Vet Hum Toxicol 39(6):334-6.
Motelin GK, Haschek WM, Ness DK, Hall WF, Harlin KS, Schaeffer DJ, and Beasley VR. 1994. "Temporal and Dose-Response Features in Swine Fed Corn Screenings Contaminated with Fumonisin Mycotoxins." Mycopathologia 126(1):27-40.
Moyo VM, Gangaidzo IT, Gomo ZA, Khumalo H, Saungweme T, Kiire CF, Rouault T, and Gordeuk VR. 1997. "Traditional Beer Consumption and the Iron Status of Spouse Pairs from a Rural Community in Zimbabwe." Blood 89(6):2159-66.
Moyo VM, Mandishona E, Hasstedt SJ, Gangaidzo IT, Gomo ZA, Khumalo H, Saungweme T, Kiire CF, Paterson AC, Bloom P, MacPhail AP, Rouault T, and Gordeuk VR. 1998. "Evidence of Genetic Transmission in African Iron Overload." Blood 91(3):1076-82.
Myers BM, Prendergast FG, Holman R, Kuntz SM, and LaRusso NF. 1991. "Alterations in the Structure, Physicochemical Properties, and pH of Hepatocyte Lysosomes in Experimental Iron Overload." J Clin Invest 88(4):1207-15.
Ncayiyana DJ. 1986. "Neural Tube Defects Among Rural Blacks in a Transkei District. A Preliminary Report and Analysis." S Afr Med J 69(10):618-20.
Niederau C, Fischer R, Sonnenberg A, Stremmel W, Trampisch HJ, and Strohmeyer G. 1985. "Survival and Causes of Death in Cirrhotic and in Noncirrhotic Patients with Primary Hemochromatosis." N Engl J Med 313(20):1256-62.
Niederau C, Fischer R, Purschel A, Stremmel W, Haussinger D, and Strohmeyer G. 1996. "Long-Term Survival in Patients with Hereditary Hemochromatosis." Gastroenterology 110(4):1107-19.
Niederau C, Erhardt A, Haussinger D, and Strohmeyer G. 1999. "Haemochromatosis and the Liver." J Hepatol 30(Suppl 1):6-11.
Norred WP, Plattner RD, Vesonder RF, Bacon CW, and Voss KA. 1992. "Effects of Selected Secondary Metabolites of Fusarium moniliforme on Unscheduled Synthesis of DNA by Rat Primary Hepatocytes." Food Chem Toxicol 30(3):233-7.
Norred WP, Plattner RD, and Chamberlain WJ. 1993. "Distribution and Excretion of [14C] Fumonisin B1 in Male Sprague-Dawley Rats." Nat Toxins 1(6):341-6.

BIBLIOGRAPHY
136
Norred WP, Voss KA, Riley RT, Meredith FI, Bacon CW, and Merrill AH Jr. 1998. "Mycotoxins and Health Hazards: Toxicological Aspects and Mechanism of Action of Fumonisins." Proceedings of the 1st International Conference of Asian Society of Toxicology, Yokohama, Japan, June 29-July 2, 1997. Journal of Toxicological Sciences 23(Suppl.2):160-4.
Ogawa K, Solt D, and Farber E. 1980. "Phenotypic Diversity As an Early Property of Putative Preneoplastic Cells in Liver Carcinogenesis." Cancer Res 40;725-33.
Osweiler GD, Ross PF, Wilson TM, Nelson PE, Witte ST, Carson TL, Rice LG, and Nelson HA. 1992. "Characterization of an Epizootic of Pulmonary Edema in Swine Associated with Fumonisin in Corn Screenings." J Vet Diagn Invest 4(1):53-9.
Osweiler GD, Kehrli ME, Stabel JR, Thurston JR, Ross PF, and Wilson TM. 1993. "Effects of Fumonisin-Contaminated Corn Screenings on Growth and Health of Feeder Calves." J Anim Sci 71(2):459-66.
Park DL, Rua SM Jr, Mirocha CJ, Abd-Alla ES, and Weng CY. 1992. "Mutagenic Potentials of Fumonisin Contaminated Corn Following Ammonia Decontamination Procedure." Mycopathologia 117(1-2):105-8.
Park CH, Bacon BR, Brittenham GM, and Tavill AS. 1987. "Pathology of Dietary Carbonyl Iron Overload in Rats." Lab Invest 57(5):555-63.
Parola M, Pinzani M, Casini A, Albano E, Poli G, Gentilini A, Gentilini P, and Dianzani MU. 1993. "Stimulation of Lipid Peroxidation or 4-Hydroxynonenal Treatment Increases Procollagen Alpha 1 (I) Gene Expression in Human Liver Fat-Storing Cells." Biochem Biophys Res Commun 194(3):1044-50.
Pascale M, Doko MB, and Visconti A. 1995. "Determination of Fumonisins in Polenta by High Performance Liquid Chromatography." Proceedings of the 2nd National Congress of Food Chemistry (Giardini-Naxos, 24 May-27 May). Messina, Italy: La Grafica Editoriale.
Penner JD, Casteel SW, Pittman L Jr, Rottinghaus GE, and Wyatt RD. 1998. "Developmental Toxicity of Purified Fumonisin B1 in Pregnant Syrian Hamsters." J Appl Toxicol 18(3):197-203.
Perera MI, Betschart JM, Virji MA, Katyal SL, and Shinozuka H. 1987. "Free Radical Injury and Liver Tumor Promotion." Toxicol Pathol 15(1):51-9.
Pillay P, Tzoracoleftherakis E, Tzakis AG, Kakizoe S, Van Thiel DH, and Starzl TE. 1991. "Orthotopic Liver Transplantation for Hemochromatosis." Transplant Proc 23(2):1888-9.
Pippard MJ. 1994. "Secondary Iron Overload." pp. 271-309 In Iron Metabolism in Health and Disease, eds Brock JH, Halliday JW, Pippard MJ, and Powell LW. London: W.B. Saunders.

BIBLIOGRAPHY
137
Pittet A, Parisod V, and Schellenberg M. 1992. "Occurrence of Fumonisins B1 and B2 in Corn-Based Products from the Swiss Market." J Agric Food Chem 40(8):1352-54.
Plummer JL, MacKinnon M, Cmielewski PL, Williams P, Ahern MJ, Ilsley AH, and de la M Hall P. 1997. " Dose-Related Effects of Dietary Iron Supplementation in Producing Hepatic Iron Overload in Rats." J Gastroenterol Hepatol 12(12):839-42.
Powell LW, Jazwinska E, and Halliday JW. 1994. "Primary Iron Overload." pp. 227-69 In Iron Metabolism in Health and Disease, Brock JH, Halliday JW, Pippard MJ, and Powell LW. London: W.B. Saunders Company Ltd.
Powell DC, Bursian SJ, Bush CR, Render JA, Rottinghaus GE, and Aulerich RJ. 1996. "Effects of Dietary Exposure to Fumonisins from Fusarium moniliforme Culture Material (M-1325) on the Reproductive Performance of Female Mink." Arch Environ Contam Toxicol 31(2):286-92.
Prelusky DB, Trenholm HL, and Savard ME. 1994. "Pharmacokinetic Fate of 14C-Labelled Fumonisin B1 in Swine." Nat Toxins 2(2):73-80.
Prelusky DB, Miller JD, and Trenholm HL. 1996. "Disposition of 14C-Derived Residues in Tissues of Pigs Fed Radiolabelled Fumonisin B1." Food Addit Contam 13(2):155-62.
Ramm GA, Crawford DH, Powell LW, Walker NI, Fletcher LM, and Halliday JW. 1997. "Hepatic Stellate Cell Activation in Genetic Haemochromatosis. Lobular Distribution, Effect of Increasing Hepatic Iron and Response to Phlebotomy." J Hepatol 26(3):584-92.
Rand EB, McClenathan DT, and Whitington PF. 1992. "Neonatal Hemochromatosis: Report of Successful Orthotopic Liver Transplantation." J Pediatr Gastroenterol Nutr 15(3):325-9.
Reddy RV, Johnson G, Rottinghaus GE, Casteel SW, and Reddy CS. 1996. "Developmental Effects of Fumonisin B1 in Mice." Mycopathologia 134(3):161-6.
Reeves PG, Nielsen FH, and Fahey GC Jr. 1993. "AIN-93 Purified Diets for Laboratory Rodents: Final Report of the American Institute of Nutrition Ad Hoc Writing Committee on the Reformulation of the AIN-76A Rodent Diet." J Nutr 123(11):1939-51.
Restum JC, Bursian SJ, Millerick M, Render JA, Merrill AH Jr, Wang E, Rottinghaus GE, and Aulerich RJ. 1995. "Chronic Toxicity of Fumonisins from Fusarium moniliforme Culture Material (M-1325) to Mink." Arch Environ Contam Toxicol 29(4):545-50.
Rheeder JP, Marasas WFO, Thiel PG, Sydenham EW, Shephard GS, and van Schalkwyk DJ. 1992. "Fusarium moniliforme and Fumonisins in Corn in Relation to Human Esophageal Cancer in Transkei." Phytopathology 82(3):353-7.

BIBLIOGRAPHY
138
Richard JL, Meerdink G, Maragos CM, Tumbleson M, Bordson G, Rice LG, and Ross PF. 1996. "Absence of Detectable Fumonisins in the Milk of Cows Fed Fusarium proliferatum (Matsushima) Nirenberg Culture Material." Mycopathologia 133(2):123-6.
Riedel HD, Remus AJ, Fitscher BA, and Stremmel W. 1995. "Characterization and Partial Purification of a Ferrireductase from Human Duodenal Microvillus Membranes." Biochem J 309(Pt 3):745-8.
Riet-Correa F, Meirelles MA, Soares JM, Machado JJ, and Zambrano AF. 1982. "Leucoencefalomalacia Em Equinos Associada a Ingestao De Milho Mofado." Pesquisa Veterinaria Brasileira 227-30.
Riley RT, Hinton DM, Chamberlain WJ, Bacon CW, Wang E, Merrill AH Jr, and Voss KA. 1994. "Dietary Fumonisin B1 Induces Disruption of Sphingolipid Metabolism in Sprague-Dawley Rats: a New Mechanism of Nephrotoxicity." J Nutr 124(4):594-603.
Riley RT, An NH, Showker JL, Yoo HS, Norred WP, Chamberlain WJ, Wang E, Merrill AH Jr, Motelin G, and Beasley VR. 1993. "Alteration of Tissue and Serum Sphinganine to Sphingosine Ratio: an Early Biomarker of Exposure to Fumonisin-Containing Feeds in Pigs." Toxicol Appl Pharmacol 118(1):105-12.
Roberts AG, Whatley SD, Nicklin S, and et al. 1997. "The Frequency of Haemochromatosis-Associated Alleles is Increased in British Patients with Sporadic Porphyria Cutanea Tarda." Hepatology 25159-61.
Rocchi E, Gibertini P, Cassanelli M, Pietrangelo A, Jensen J, and Ventura E. 1986. "Hepatitis B Virus Infection in Porphyria Cutanea Tarda." Liver 6(3):153-7.
Roche Molecular Biochemicals USA. 2000. "Biochemicals Catalog website" [Web Page]. Available at http://biochem-us.comvos.de.
Rose EF. 1973. "Esophageal Cancer in the Transkei: 1955-69." J Natl Cancer Inst 51(1):7-16.
Ross PF, Nelson PE, Richard JL, Osweiler GD, Rice LG, Plattner RD, and Wilson TM. 1990. "Production of Fumonisins by Fusarium moniliforme and Fusarium Proliferatum Isolates Associated with Equine Leukoencephalomalacia and a Pulmonary Edema Syndrome in Swine." Appl Environ Microbiol 56(10):3225-6.
Rossi M, Ancona E, Mastrangelo G, Solimbergo D, Paruzzolo P, Assarini G, Sorrentina P, and Peracchia A. 1982. "Epidemiologic Findings in Esophageal Cancer in the Veneto Region." Minerva Med 731531-40.
Rotter BA, Thompson BK, Prelusky DB, Trenholm HL, Stewart B, Miller JD, and Savard ME. 1996. "Response of Growing Swine to Dietary Exposure to Pure Fumonisin B1 during an Eight-Week Period: Growth and Clinical Parameters." Nat Toxins 4(1):42-50.

BIBLIOGRAPHY
139
Rouault T and Klausner R. 1997. "Regulation of Iron Metabolism in Eukaryotes." Curr Top Cell Regul 35;1-19.
Sahu SC, Eppley RM, Page SW, Gray GC, Barton CN, and O'Donnell MW. 1998. "Peroxidation of Membrane Lipids and Oxidative DNA Damage by Fumonisin B1 in Isolated Rat Liver Nuclei." Cancer Lett 125(1-2):117-21.
Sammon AM. 1992. "A Case-Control Study of Diet and Social Factors in Cancer of the Esophagus in Transkei." Cancer 69(4):860-5.
Sampietro M, Fiorelli G, and Fargion S. 1999. "Iron Overload in Porphyria Cutanea Tarda." Haematologica 84(3):248-53.
Scheuer PJ, Williams R, and Muir AR. 1962. "Hepatic Pathology in Relatives of Patients with Haemochromatosis." J Pathol Bacteriol 84;53-64.
Schroeder JJ, Crane HM, Xia J, Liotta DC, and Merrill AH Jr. 1994. "Disruption of Sphingolipid Metabolism and Stimulation of DNA Synthesis by Fumonisin B1. A Molecular Mechanism for Carcinogenesis Associated with Fusarium moniliforme." J Biol Chem 269(5):3475-81.
Schwarte LH, Biester HE, and Murray C. 1937. "A Disease of Horses Caused by Feeding Moldy Corn." J Amer Vet Assoc 90;76-85.
Seftel HC, Keeley KJ, Isaacson C, and Bothwell TH. 1961. "Siderosis in the Bantu: the Clinical Incidence of Hemochromatosis in Diabetic Subjects." J Lab Clin Med 58;837-44.
Seftel HC, Malkin C, Schmaman A, and et al. 1966. "Osteoporosis, Scurvy, and Siderosis in Johannesburg Bantu." Br Med J 1;642-6.
Segal I, Reinach SG, and de Beer M. 1988. "Factors Associated With Oesophageal Cancer in Soweto, South Africa." Br J Cancer 58(5):681-6.
Selby JV and Friedman GD. 1988. "Epidemiologic Evidence of an Association between Body Iron Stores and Risk of Cancer." Int J Cancer 41(5):677-82.
Sewram V, Nair JJ, Nieuwoudt TW, Gelderblom WC, Marasas WF, and Shephard GS. 2001. "Assessing Chronic Exposure to Fumonisin Mycotoxins: the Use of Hair as a Suitable Noninvasive Matrix." J Anal Toxicol 25(6):450-5.
Sharma RP, Dugyala RR, and Voss KA. 1997. "Demonstration of in-Situ Apoptosis in Mouse Liver and Kidney after Short-Term Repeated Exposure to Fumonisin B1." J Comp Pathol 117(4):371-81.
Sheldon JH. 1935. Haemochromatosis. London: Oxford University.

BIBLIOGRAPHY
140
Shephard GS, Sydenham EW, Thiel PG, and Gelderblom WCA. 1990. "Quantitative Determination of Fumonisin B1 and Fumonisin B2 by High Performance Liquid Chromatography With Fluorescence Detection." J Liq Chromatogr 13(10):2077-88.
Shephard GS, Thiel PG, and Sydenham EW. 1992. "Determination of Fumonisin B1 in Plasma and Urine by High-Performance Liquid Chromatography." J Chromatogr 574(2):299-304.
Shephard GS, Thiel PG, Stockenstrom S, and Sydenham EW. 1996a. "Worldwide Survey of Fumonisin Contamination of Corn and Corn-Based Products." J AOAC Int 79(3):671-87.
Shephard GS, van der Westhuizen L, Thiel PG, Gelderblom WC, Marasas WF, and van Schalkwyk DJ. 1996b. "Disruption of Sphingolipid Metabolism in Non-Human Primates Consuming Diets of Fumonisin-Containing Fusarium moniliforme Culture Material." Toxicon 34(5):527-34.
Sigma. "Sigma product information sheet" [Web Page]. Available at http://www.sigma.sial.com/sigma/proddata/b5002.htm.
Sigurdsson L, Reyes J, Kocoshis SA, Hansen TW, Rosh J, and Knisely AS. 1998. "Neonatal Hemochromatosis: Outcomes of Pharmacologic and Surgical Therapies." J Pediatr Gastroenterol Nutr 26(1):85-9.
Sitas F, Blaauw D, Terblanche M, Madhoo J, and Carrara H. 1997. Incidence of Histologically Diagnosed Cancer in South Africa, 1992. Johannesburg: South African Institute for Medical Research (SAIMIR).
Smith AG, Francis JE, and Carthew P. 1990. "Iron As a Synergist for Hepatocellular Carcinoma Induced by Polychlorinated Biphenyls in Ah-Responsive C57BL/10ScSn Mice." Carcinogenesis 11(3):437-44.
Smith BN, Kantrowitz W, Grace ND, Greenberg MS, Patton TJ, Ookubo R, Sorger K, Semeraro JG, Doyle JR, Cooper AG, Kamat BR, Maregni LM, and Rand WM. 1997. "Prevalence of Hereditary Hemochromatosis in a Massachusetts Corporation: Is Celtic Origin a Risk Factor?" Hepatology 25(6):1439-46.
Smith GW, Constable PD, Bacon CW, Meredith FI, and Haschek WM. 1996a. "Cardiovascular Effects of Fumonisins in Swine." Fundam Appl Toxicol 31(2):169-72.
Smith GW, Constable PD, and Haschek WM. 1996b. "Cardiovascular Responses to Short-Term Fumonisin Exposure in Swine." Fundam Appl Toxicol 33(1):140-8.
Smith GW, Constable PD, Tumbleson ME, Rottinghaus GE, and Haschek WM. 1999. "Sequence of Cardiovascular Changes Leading to Pulmonary Edema in Swine Fed Culture Material Containing Fumonisin." Am J Vet Res 60(10):1292-300.

BIBLIOGRAPHY
141
Smith GW, Constable PD, Eppley RM, Tumbleson ME, Gumprecht LA, and Haschek-Hock WM. 2000. "Purified Fumonisin B1 Decreases Cardiovascular Function but Does Not Alter Pulmonary Capillary Permeability in Swine." Toxicol Sci 56(1):240-9.
Solt D and Farber E. 1976. "New Principle for the Analysis of Chemical Carcinogenesis." Nature 263701-3.
Speight AN and Cliff J. 1974. "Iron Storage Disease of the Liver in Dar Es Salaam: a Preliminary Report on Venesection Therapy." East Afr Med J 51(12):895-902.
Stål P, Hultcrantz R, Moller L, and Eriksson LC. 1995. "The Effects of Dietary Iron on Initiation and Promotion in Chemical Hepatocarcinogenesis." Hepatology 21(2):521-8.
Stål P, Johansson I, Ingelman-Sundberg M, Hagen K, and Hultcrantz R. 1996. "Hepatotoxicity Induced by Iron Overload and Alcohol. Studies on the Role of Chelatable Iron, Cytochrome P450 2E1 and Lipid Peroxidation." J Hepatol 25(4):538-46.
Stål P, Wang GS, Olsson JM, and Eriksson LC. 1999. "Effects of Dietary Iron Overload on Progression in Chemical Hepatocarcinogenesis." Liver 19(4):326-34.
Stevens RG, Jones DY, Micozzi MS, and Taylor PR. 1988. "Body Iron Stores and the Risk of Cancer." N Engl J Med 319(16):1047-52.
Stevens RG, Graubard BI, Micozzi MS, Neriishi K, and Blumberg BS. 1994. "Moderate Elevation of Body Iron Level and Increased Risk of Cancer Occurrence and Death." Int J Cancer 56(3):364-9.
Stevens VL and Tang J. 1997. "Fumonisin B1-Induced Sphingolipid Depletion Inhibits Vitamin Uptake via the Glycosylphosphatidylinositol-Anchored Folate Receptor." J Biol Chem 272(29):18020-5.
Stoschek CM. 1990. "Quantitation of Protein." Methods Enzymol 182;50-69.
Summers KM, Halliday JW, and Powell LW. 1990. "Identification of Homozygous Hemochromatosis Subjects by Measurement of Hepatic Iron Index." Hepatology 12(1):20-5.
Sydenham EW, Thiel PG, Marasas WFO, Shephard GS, van Schalkwyk DJ, and Koch KR. 1990. "Natural Occurrence of Some Fusarium Mycotoxins in Corn From Low and High Esophageal Cancer Prevalence Areas of the Transkei, Southern Africa." J Agric Food Chem 38;1900-3.
Sydenham EW, Shephard GS, Thiel PG, and Marasas WFO. 1991. "Fumonisin Contamination of Commercial Corn-Based Human Foodstuffs." J Agric Food Chem 39;2014-8.

BIBLIOGRAPHY
142
Sydenham EW, Shephard GS, Gelderblom WCA, Thiel PG, and Marasas WFO. 1993. "Fumonisins: Their Implications for Human and Animal Health." pp. 42-8 In Occurrence and Significance of Mycotoxins, K. A. Scudamore. Slough, U.K.: Central Sci Lab.
Tavill AS and Bacon BR. 1990. "Hemochromatosis: Iron Metabolism and the Iron Overload Syndromes." pp. 1273-99 In Hepatology: A Textbook of Liver Disease, eds Zakim D and Boyer TD. Philadelphia: W.B. Saunders.
Tolleson WH, Couch LH, Melchior WB Jr, Jenkins GR, Muskhelishvili M, Muskhelishvili L, Mcgarrity LJ, Domon O, Morris SM, and Howard PC. 1999. "Fumonisin B1 Induces Apoptosis in Cultured Human Keratinocytes through Sphinganine Accumulation and Ceramide Depletion." Int J Oncol 14(5):833-43.
Toyokuni S. 1996. "Iron-Induced Carcinogenesis: the Role of Redox Regulation." Free Radic Biol Med 20(4):553-66.
Trousseau A. 1865. "Glycosurie, Diabète, Sucré ." pp. 663 In Clinique Medicale Del' Hotel-Dieu De Paris, 2nd ed. vol. 2, Paris: Balliere.
Turlin B, Juguet F, Moirand R, Le Quilleuc D, Loreal O, Campion JP, Launois B, Ramee MP, Brissot P, and Deugnier Y. 1995. "Increased Liver Iron Stores in Patients with Hepatocellular Carcinoma Developed on a Noncirrhotic Liver." Hepatology 22(2):446-50.
Ueno Y, Iijima K, Wang SD, Sugiura Y, Sekijima M, Tanaka T, Chen C, and Yu SZ. 1997. "Fumonisins as a Possible Contributory Risk Factor for Primary Liver Cancer: a 3-Year Study of Corn Harvested in Haimen, China, by HPLC and ELISA." Food Chem Toxicol 35(12):1143-50.
USDA/APHIS Veterinary Services Fact Sheet. 1995. Ames, IA: US Department of Agriculture Animal and Plant Health Inspection Service.
Valerio LG Jr, Parks T, and Petersen DR. 1996. "Alcohol Mediates Increases in Hepatic and Serum Nonheme Iron Stores in a Rat Model for Alcohol-Induced Liver Injury." Alcohol Clin Exp Res 20(8):1352-61.
Van der Westhuizen L, Shephard GS, and van Schalkwyk DJ. 2001. "The Effect of Repeated Gavage Doses of Fumonisin B1 on the Sphinganine and Sphingosine Levels in Vervet Monkeys." Toxicon 39(7):969-72.
Van Helden PD, Beyers AD, Bester AJ, and Jaskiewicz K. 1987. "Esophageal Cancer: Vitamin and Lipotrope Deficiencies in an at-Risk South African Population." Nutr and Cancer 10;247-55.
Van Rensburg SJ. 1981. "Epidemiologic and Dietary Evidence for a Specific Nutritional Predisposition to Esophageal Cancer." J Natl Cancer Inst 67(2):243-51.
Van Rensburg SJ. 1985. "Recent Studies on the Etiology of Oesophageal Cancer." S Afr Cancer Bull 29;22-31.

BIBLIOGRAPHY
143
Venter PA, Christianson AL, Hutamo CM, Makhura MP, and Gericke GS. 1995. "Congenital Anomalies in Rural Black South African Neonates--a Silent Epidemic? " S Afr Med J 85(1):15-20.
Voss KA, Chamberlain WJ, Bacon CW, and Norred WP. 1993. "A Preliminary Investigation on Renal and Hepatic Toxicity in Rats Fed Purified Fumonisin B1." Nat Toxins 1(4):222-8.
Voss KA, Chamberlain WJ, Bacon CW, Riley RT, and Norred WP. 1995. "Subchronic Toxicity of Fumonisin B1 to Male and Female Rats." Food Addit Contam 12(3):473-8.
Voss KA, Bacon CW, Norred WP, Chapin RE, Chamberlain WJ, Plattner RD, and Meredith FI. 1996. "Studies on the Reproductive Effects of Fusarium moniliforme Culture Material in Rats and the Biodistribution of [14C] Fumonisin B1 in Pregnant Rats." Nat Toxins 4(1):24-33.
Voss KA, Riley RT, Norred WP, Bacon CW, Meredith FI, Howard PC, Plattner RD, Collins TF, Hansen DK, and Porter JK. 2001. "An Overview of Rodent Toxicities: Liver and Kidney Effects of Fumonisins and Fusarium moniliforme." Environ Health Perspect 109(Suppl 2):259-66.
Vulpe CD, Kuo YM, Murphy TL, Cowley L, Askwith C, Libina N, Gitschier J, and Anderson GJ. 1999. "Hephaestin, a Ceruloplasmin Homologue Implicated in Intestinal Iron Transport, is Defective in the Sla Mouse." Nat Genet 21(2):195-9.
Wang E, Ross PF, Wilson TM, Riley RT, and Merrill AH Jr. 1992. "Increases in Serum Sphingosine and Sphinganine and Decreases in Complex Sphingolipids in Ponies Given Feed Containing Fumonisins, Mycotoxins Produced by Fusarium moniliforme." J Nutr 122(8):1706-16.
Wang GS, Eriksson LC, Xia L, Olsson J, and Stål P. 1999. "Dietary Iron Overload Inhibits Carbon Tetrachloride-Induced Promotion in Chemical Hepatocarcinogenesis: Effects on Cell Proliferation, Apoptosis, and Antioxidation." J Hepatol 30(4):689-98.
Weibking TS, Ledoux DR, Bermudez AJ, Turk JR, Rottinghaus GE, Wang E, and Merrill AH Jr. 1993a. "Effects of Feeding Fusarium moniliforme Culture Material, Containing Known Levels of Fumonisin B1, on the Young Broiler Chick." Poult Sci 72(3):456-66.
Weibking TS, Ledoux DR, Brown TP, and Rottinghaus GE. 1993b. "Fumonisin Toxicity in Turkey Poults." J Vet Diagn Invest 5(1):75-83.
Weinberg ED. 1983. "Iron in Neoplastic Disease." Nutr Cancer 4(3):223-33.
Wilkins PA, Vaala WE, Zivotofsky D, and Twitchell ED. 1994. "A Herd Outbreak of Equine Leukoencephalomalacia." Cornell Vet 84(1):53-9.

BIBLIOGRAPHY
144
Williams R, Scheuer PJ, and Sherlock S. 1962. "The Inheritance of Idiopathic Haemochromatosis: a Clinical and Liver Biopsy Study of 16 Families." Q J Med 31;249-65.
Williams GM and Yamamoto RS. 1972. "Absence of Stainable Iron from Preneoplastic and Neoplastic Lesions in Rat Liver with 8-Hydroxyquinoline-Induced Siderosis." J Natl Cancer Inst 49(3):685-92.
Williams GM, Klaiber M, Parker SE, and Farber E. 1976. "Nature of Early Appearing, Carcinogen-Induced Liver Lesions to Iron Accumulation." J Natl Cancer Inst 57(1):157-65.
Wilson BJ and Maronpot RR. 1971. "Causative Fungus Agent of Leukoencephalomalacia in Equine Animals." Vet Record 88;484-6.
Wilson BJ, Maronpot RR, and Hildebrandt PK. 1973. "Equine Leukoencephalomalacia." J Am Vet Med Assoc 163(11):1293-5.
Wilson TM, Nelson PE, and Knepp CR. 1985a. "Hepatic Neoplastic Nodules, Adenofibrosis, and Cholangiocarcinomas in Male Fisher 344 Rats Fed Corn Naturally Contaminated with Fusarium moniliforme." Carcinogenesis 6(8):1155-60.
Wilson TM, Nelson PE, Ryan TB, Rouse CD, Pittman TP, Neal TP, Porterfield M L, and Saunders GK. 1985b. "Linking Leukoencephalomalacia to Commercial Horse Rations." Vet Med 80;63-9.
Wilson TM, Ross PF, Owens DL, Rice LG, Green SA, Jenkins SJ, and Nelson HA. 1992. "Experimental Reproduction of ELEM. A Study to Determine the Minimum Toxic Dose in Ponies." Mycopathologia 117(1-2):115-20.
Wilson TM, Ross PF, Rice LG, Osweiler GD, Nelson HA, Owens DL, Plattner RD, Reggiardo C, Noon TH, and Pickrell JW. 1990. "Fumonisin B1 Levels Associated with an Epizootic of Equine Leukoencephalomalacia." J Vet Diagn Invest 2(3):213-6.
Witzleben CL and Uri A. 1970. "Perinatal Hemochromatosis Entity or End Result?" Hum Pathol 20;335-40.
Wolf G. 1998. "Inhibition of Cellular Uptake of Folate by Blocking Synthesis of the Membrane Folate Receptor." Nutr Rev 56(3):86-7.
Xavier JG, Brunner CHM, Sakamoto M, Correa B, Fernandes WR, and Dias JLC. 1991. "Equine Leukoencephalomalacia. Report of Five Cases." Braz J Vet Res Anim Sci 28;185-9.
Yang CS. 1980. "Research on Esophageal Cancer in China: A Review." Cancer Res 40;2633-44.
Yin JJ, Smith MJ, Eppley RM, Page SW, and Sphon JA. 1998. "Effects of Fumonisin B1 in Lipid Peroxidation in Membranes." Biochim Biophys Acta 1371;134-42.

BIBLIOGRAPHY
145
Yoo HS, Norred WP, Wang E, Merrill AH Jr, and Riley RT. 1992. "Fumonisin Inhibition of De Novo Sphingolipid Biosynthesis and Cytotoxicity Are Correlated in LLC-PK1 Cells." Toxicol Appl Pharmacol 114(1):9-15.
Yoshiji H, Nakae D, Kinugasa T, Matsuzaki M, Denda A, Tsujii T, and Konishi Y. 1991. "Inhibitory Effect of Dietary Iron Deficiency on the Induction of Putative Preneoplastic Foci in Rat Liver Initiated with Diethylnitrosamine and Promoted by Phenobarbital." Br J Cancer 64(5):839-42.
Young IS, Trouton TG, Torney JJ, Callender ME, and Trimble ER. 1992. "Antioxidant Status in Hereditary Haemochromatosis." Free Rad Res Commun 16(Suppl 1):187.
Zhen YZ. 1984. "Isolation and Culture of Fungi From the Cereals in Counties of Henan Province--5 With High and 3 With Low Incidences of Esophageal Cancer." Zhonghua Zhong Liu Za Zhi 6(1):27-9.
Zomborszky-Kovacs M, Vetesi F, Kovacs F, Bata A, Toth A, and Tornyos G. 2000. "Preliminary Communication: Examination of the Harmful Effect to Fetuses of Fumonisin B1 in Pregnant Sows." Teratog Carcinog Mutagen 20(5):293-9.
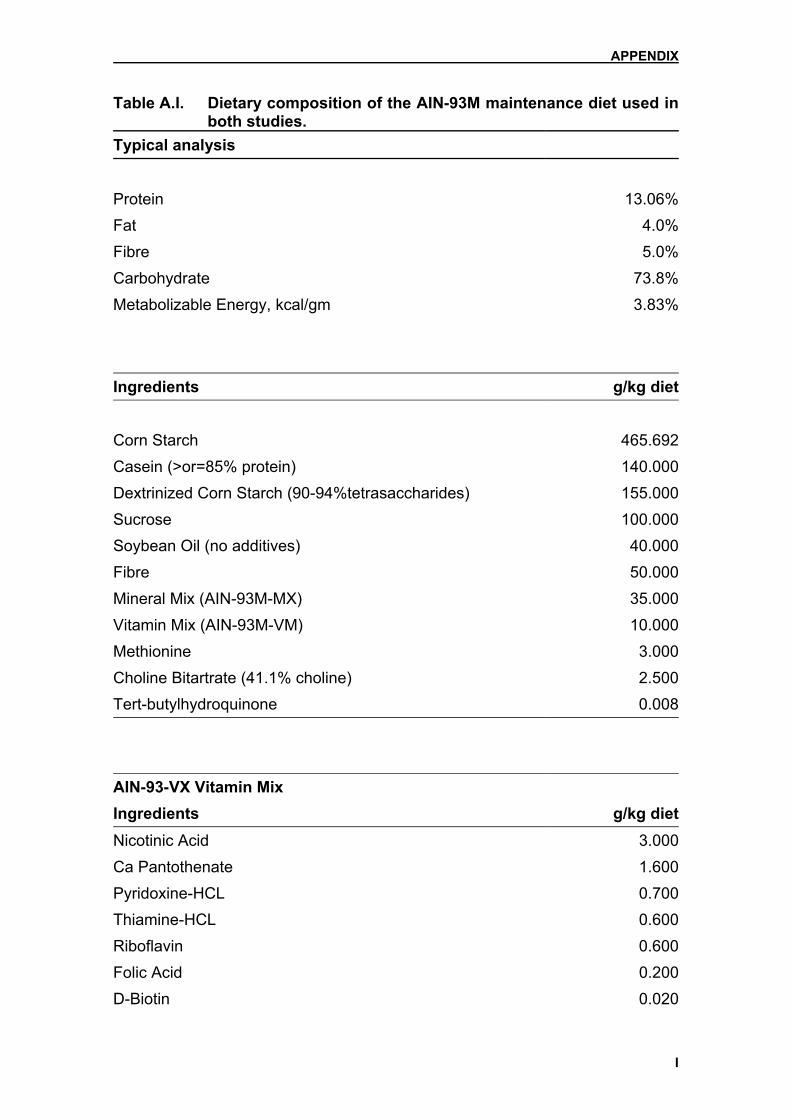
APPENDIX
I
Table A.I. Dietary composition of the AIN-93M maintenance diet used in both studies.
Typical analysis
Protein 13.06%Fat 4.0%Fibre 5.0%Carbohydrate 73.8%Metabolizable Energy, kcal/gm 3.83% Ingredients g/kg diet Corn Starch 465.692Casein (>or=85% protein) 140.000Dextrinized Corn Starch (90-94%tetrasaccharides) 155.000Sucrose 100.000Soybean Oil (no additives) 40.000Fibre 50.000Mineral Mix (AIN-93M-MX) 35.000Vitamin Mix (AIN-93M-VM) 10.000Methionine 3.000Choline Bitartrate (41.1% choline) 2.500Tert-butylhydroquinone 0.008 AIN-93-VX Vitamin Mix Ingredients g/kg dietNicotinic Acid 3.000Ca Pantothenate 1.600Pyridoxine-HCL 0.700Thiamine-HCL 0.600Riboflavin 0.600Folic Acid 0.200D-Biotin 0.020

APPENDIX
II
Table A.I. (continued) Vitamin B-12 (cyanocobalamin)(0.1% in mannitol) 2.500Vitamin E (all-rac-alpha-tocopheryl acetate)(500 IU/g) 15.000Vitamin A (all-trans-retinyl palmitate) (500 000 IU/g) 0.800Vitamin D-3 (cholecalciferol)(400 000 IU/g) 0.250Vitamin K (phylloquinone) 0.075Powdered Sucrose 974.655 AIN-93G-MX Mineral Mix Ingredients g/kg diet Calcium Carbonate, Anhydrous, 40.04% Ca 357.000Potassium Phosphate, Monobasic, 22.76% P; 28.73% K 250.000Sodium Chloride, 39.34% Na; 60.66% Cl 74.000Potassium Sulfate, 44.87% K; 18.39% S 46.600Potassium Citrate Tri Potassium, Monohydrate, 36.16% K 28.000Magnesium Oxide, 60.32% Mg 24.000Ferric Citrate, 16.5% Fe 6.060Zinc Carbonate, 52.14% Zn 1.650Manganous Carbonate, 47.79% Mn 0.630Cupric Carbonate, 57.47% Cu 0.300Potassium Iodate, 59.3% I 0.010Sodium Selenate, Anhydrous, 41.79% Se 0.01025Ammonium Paramolybdate, 4 Hydrate, 54.34% Mo 0.00795Sodium Meta-silicate, 9 Hydrate, 9.88% Se 1.450Chromium Potassium Sulfate, 12 Hydrate, 10.42% Cr 0.275Boric Acid, 17.5% B 0.0815Sodium Fluoride, 45.24% F 0.0635Nickel Carbonate, 45% Ni 0.0318Lithium Chloride, 16.38% Li 0.0174Ammonium Vanadate, 43.55% V 0.0066Powdered Sucrose 209.806

APPENDIX
III
A.II. Method for biochemical hepatic iron measurement 1. Purpose and scope
The determination of iron by colorimetric means in acid digests of liver tissue.
2. Hazards Concentrated Nitric Acid – Poisonous, Danger: may be fatal if swallowed.
Harmful if inhaled and may cause delayed lung injury. Spillage may cause fire
or liberate dangerous gas. First Aid: Do not induce vomiting, if conscious give
water. If inhaled take outside for fresh air.
3. Clinical
Hepatic iron measurements were essential for the diagnosis of GH until the
advent of genotyping and were useful in differentiating patients with GH from
either patients with alcoholic siderosis or heterozygous HG subjects.
4. Principle
The liver tissue is dried, weighed, digested in nitric acid and diluted in sodium
acetate buffer. The iron concentration is determined as follows: iron is released
from transferrin by guanidine hydrochloride and reduced to Fe++ by ascorbic
acid. Fe++ forms a red complex with ferrozine dye and is measured at 570-
700nm.
5. Instrument
Hitachi random access auto-analyser modular (Roche Diagnostic Systems,
Basel, Switzerland).
6. Specimen
Fresh liver tissue

APPENDIX
IV
7. Standards and quality controls
• Standard on Modular is CFAS.
• Control used is FeCl3 (M.W. = 270.30g/mol)
Stock Control (100Mm): weigh 0.2703g FeCl3 and dissolve in 10ml de-
ionised water.
Working Control (1Mm): 50ul stock up to 5ml with water.
NB! Add 100ul 35% Nitric acid to both the stock and working FeCl3 control
as preservative.
• Controls used on the Modular: Precinorm U (Roche) – low control
Precipath U (Roche) – high control
8. Reagents
• Nitric Acid: Analytical Grade Nitric Acid (69%)
• Sodium Acetate Buffer 0.2M
• 10N NaOH
• Modular Iron Reagent – Supplied by Main lab.
9. Preparation of reagents
• Working 35% Nitric Acid: Dilute 69% Nitric Acid with an equal volume of
water.
• 0.2M Sodium Acetate Buffer: Add 8.2g sodium acetate to 500ml distilled
water and dissolve.
• 10N NaOH: 400g NaOH in 1 litre de-ionised water.
10. Stability of reagents
• Working 35% Nitric Acid – stable at room temp.
• Sodium Acetate Buffer – stable at room temp.
• 10N NaOH – stable at room temp.
• Modular Iron Reagent – Stable at 4oC
11. Test procedure
Weigh a glass tube and record weight. Carefully remove a tiny piece of the
frozen liver from Eppendorf tip with tweezers and scalpel blade, and place in the

APPENDIX
V
pre-weighed glass tube. Weigh the tube with the wet liver and record weight.
Dry the tissue overnight by placing in an oven at 1050C. Next day, remove the
glass tube from oven and allow to cool to room temp. Carefully weigh the tube
plus dried tissue and record weight to 4 decimal places. Calculate the dry
weight of the tissue (should at least be 1mg for analysis). Add 0.4ml of 35%
nitric acid* to the tube and vortex gently. Prepare a blank tube containing 0.4ml
of 35% nitric acid only*. Cap both the tubes with Parafilm and place into a 700C
water bath for 60 min. If liver not totally digested after 60 min, then leave for
another 30 min. Remove digested sample from water bath.
Set up a control as shown below and dilute the samples into clean plastic tubes
as follows*:
Blank Control Test 1/10 Test 1/30
35% Nitric Acid 100 µl 50 µl Digested liver sample 100 µl 30 µl
1mM FeCl3 50 µl
10N NaOH 50 µl 25 µl 50 µl 15 µl Sodium Acetate buffer 850 µl 875 µl 850 µl 955 µl
Do the iron determination on the Modular.
* indicates modifications
12. Calculation
W = dry weight of tissue (mg)
V = vol. of nitric acid extract used (µl)
X = result from Modular (µmol/L)
Tissue Fe concentration = (mmol/kg dry weight)
X * 400 V * W

APPENDIX
VI
13. Linear range
0 – 179 µmol/L (as on the Modular)
14. Normal range
Results are reported with one of the following AUSLAB coded comments:
1. <40 mmol/kg NORMAL (BC17)
2. 40 – 100 mmol/kg SLIGHT ELEVATION (BC18)
3. 100 – 200 mmol/kg MODERATE ELEVATION (BC19)
4. >200 mmol/kg GROSS ELEVATION (BC20)
15. Interfering substances
The development of the colour of the ferrozine complex is pH-dependent, so
effective neutralization of the nitric acid digest is important.
Reference
6D223, methods manual of the Biochemistry Department, Flinders University
School of Medicine, Adelaide, Southern Australia

APPENDIX
VII
Ta
ble
A.II
Ia. S
umm
ary
of th
e da
ta re
gard
ing
the
vario
us p
aram
eter
s m
easu
red
in th
e pi
lot s
tudy
at e
ach
time
poin
t. G
roup
(%
Fe)
Wee
k B
W
(g)
tBW
G
(g)
LW
(g)
LW/B
W
(%)
Iron
(mm
ol/k
g)
MD
A
(nm
ol/m
g)
CD
(n
mol
/mg)
B
rdU
(c
ells
/cm
2 )
C
trl
4 63
.25±
16.1
7 nd
2.
22±0
.55
3.53
±0.0
9 6.
97±0
.85
0.29
±0.0
7 23
.39±
5.08
nd
1%
35
.50±
8.10
nd
1.
5±0.
40
4.22
±0.4
9 70
.41±
12.9
5 0.
49±0
.09
20.4
4±8.
78
nd
Ctr
l 6
153.
00±1
3.23
73
.00±
12.9
6 8.
01±1
.24
5.22
±0.4
7 3.
49±0
.57
0.13
±0.0
3 22
.15±
6.79
nd
1%
61
.00±
8.69
28
.60±
6.23
3.
25±0
.40
5.36
±0.5
2 89
.47±
22.5
1 0.
37±0
.18
22.1
4±5.
12
nd
1.5%
68.2
0±4.
15
20.4
0±9.
45
3.34
±0.4
6 4.
89±0
.50
105.
06±1
3.28
0.
87±0
.34
21.9
7±5.
18
nd
2%
59
.80±
5.54
13
.80±
5.45
2.
73±0
.35
4.57
±0.4
6 94
.86±
11.5
1 0.
69±0
.45
30.7
9±15
.65
nd
Ctr
l 10
21
5.20
±6.8
0 17
1.00
±8.6
0 5.
91±0
.57
2.74
±0.1
9 3.
13±0
.49
0.10
±0.0
6 20
.09±
5.63
nd
1%
11
8.00
±19.
94
86.6
0±15
.47
4.37
±0.5
8 3.
80±0
.83
101.
85±1
6.33
0.
38±0
.25
29.3
1±9.
64
nd
1.5%
100.
80±2
3.79
55
.40±
25.1
7 4.
26±1
.16
4.25
±0.7
9 11
9.45
±30.
67
0.97
±0.5
8 25
.10±
5.23
nd
2%
97
.60±
19.0
5 62
.00±
19.1
3 3.
36±0
.44
3.50
±0.4
5 16
0.62
±16.
03
0.41
±0.2
5 27
.85±
9.34
nd
Ctr
l 15
25
8.40
±8.9
1 16
0.20
±7.8
9 7.
88±0
.40
3.05
±0.1
2 6.
12±0
.76
0.10
±0.0
4 17
.77±
4.42
0.
77±1
.22
1%
16
3.20
±29.
88
134.
20±2
7.78
6.
55±1
.08
4.03
±0.1
5 10
0.65
±28.
24
0.21
±0.1
0 20
.66±
2.44
1.
77±1
.55
1.5%
166.
60±2
4.85
13
2.60
±17.
91
7.30
±1.4
5 4.
36±0
.21
91.4
7±23
.81
0.26
±0.0
4 24
.40±
2.32
3.
98±2
.65
2%
19
2.60
±27.
59
151.
60±2
6.75
8.
88±0
.96
4.65
±0.5
5 11
2.69
±19.
53
0.30
±0.1
1 22
.11±
8.10
2.
44±2
.90
Dat
a ar
e th
e m
eans
± s
tand
ard
devi
atio
n of
4 to
5 a
nim
als
per g
roup
; Fe:
die
tary
iron
; Ctrl
: con
trol;
BW
: bod
y w
eigh
t; tB
WG
: tot
al b
ody
wei
ght
gain
; LW
: abs
olut
e liv
er w
eigh
t; LW
/BW
: liv
er to
bod
y w
eigh
t rat
io; I
ron:
hep
atic
iron
con
cent
ratio
n; M
DA
: mal
ondi
alde
hyde
; Brd
U: 5
-bro
mo-
2’-
deox
y-ur
idin
e; n
d: n
ot d
eter
min
ed.

Tabl
e A
.IIIb
. Sum
mar
y of
dat
a re
gard
ing
the
vario
us p
aram
eter
s m
easu
red
in t
he l
ong-
term
stu
dy a
t th
e di
ffere
nt t
ime
poin
ts.
Trea
tmen
t (G
roup
) W
eek
BW
(g
) tB
WG
(g
) LW
(g
) LW
/BW
(%
) Iro
n (m
mol
/kg)
M
DA
(n
mol
/mg)
B
rdU
ce
lls/c
m2
Fe
4 50
.40±
2.19
nd
1.
88±0
.19
3.72
±0.2
2 96
.66±
24.2
6 0.
16±0
.07
nd
Con
trol
80.8
0±7.
40
nd
3.19
±0.3
9 4.
02±0
.40
5.86
±1.7
4 0.
15±0
.03
nd
Fe
10
178.
70±2
7.04
11
5.80
±7.3
6 8.
14±1
.66
4.53
±0.3
7 55
.64±
23.5
9 0.
11±0
.03
nd
Con
trol
208.
28±7
.75
109.
00±1
6.96
7.
74±1
.24
3.70
±0.4
5 6.
24±1
.40
0.11
±0.0
2 nd
FB1/F
e 35
31
6.20
±28.
23
251.
36±2
8.56
7.
92±0
.82
2.51
±0.1
5 91
.32±
22.9
7 0.
13±0
.02
3.67
±1.6
2 (%
)
Fe
33
6.80
±33.
16
266.
34±2
8.01
9.
79±0
.80
2.92
±0.2
4 59
.10±
12.7
8 0.
12±0
.02
0.88
±1.1
6
FB1/A
IN
33
3.00
±20.
40
242.
96±1
9.95
7.
95±0
.79
2.39
±0.1
3 9.
48±0
.85
0.10
±0.0
1 1.
02±1
.31
Con
trol
342.
80±3
2.00
25
5.40
±25.
00
8.58
±0.9
1 2.
50±0
.11
10.0
2±2.
36
0.10
±0.0
2 0.
42
FB1/F
e 60
36
6.38
±14.
97
295.
86±1
6.29
11
.92±
1.27
3.
25±0
.22
63.4
3±11
.63
0.12
±0.0
2 0.
71±0
.57
Fe
36
0.63
±20.
27
297.
29±1
2.15
12
.16±
1.08
3.
38±0
.32
54.3
0±14
.81
0.10
±0.0
1 0.
73±1
.09
FB1/A
IN
37
3.90
±22.
18
297.
50±1
8.31
10
.14±
1.19
2.
74±0
.21
9.81
±3.6
1 0.
09±0
.01
0.81
±0.9
2
Con
trol
365.
00±2
8.81
27
1.88
±31.
60
9.68
±0.9
1 2.
62±0
.12
12.1
0±1.
44
0.10
±0.0
2 0.
34±0
.34
Dat
a ar
e th
e m
eans
± s
tand
ard
devi
atio
n of
5 to
10
anim
als
per
grou
p. F
B1:
fum
onis
in B
1; Fe
: die
tary
iron
; AIN
: Am
eric
an In
stitu
te o
f Nut
ritio
n po
wde
red
diet
-93M
; BW
: bod
y w
eigh
t; tB
WG
: tot
al b
ody
wei
ght g
ain;
LW
: abs
olut
e liv
er w
eigh
t; LW
/BW
: liv
er to
bod
y w
eigh
t rat
io; I
ron:
hep
atic
iro
n co
ncen
tratio
n; M
DA
: mal
ondi
alde
hyde
; Brd
U: 5
-bro
mo-
2’-d
eoxy
-urid
ine;
nd:
not
det
erm
ined
.
APPENDIX
VIII

Tabl
e A
.IIIc
. Sum
mar
y of
the
data
in re
gard
to h
aem
otol
ogic
al p
aram
eter
s in
the
long
-term
stu
dy.
W
BC
R
BC
H
B
HC
T M
CV
MC
H
MC
HC
R
DW
PL
M
PV
(x
109 /l)
(x
1012
/l)
(g/d
l) (%
) (fl
) (p
g)
(%)
(x
109 /l)
(µ
m3 )
35w
k
FB1/F
e 2.
92±0
.77
8.23
±0.3
0 14
.48±
0.53
41
.66±
2.04
50
.64±
0.74
17
.60±
0.23
34
.76±
0.56
11
.12±
0.16
63
7.80
±34.
62
<5±0
.00
Fe
3.40
±1.1
8 8.
53±0
.43
14.9
2±0.
68
42.6
8±2.
76
50.0
0±1.
57
17.5
0±0.
34
35.0
2±0.
98
11.8
4±0.
44
722.
60±8
2.63
<5
±0.0
0
FB1/A
IN
3.14
±1.5
0 8.
16±0
.43
13.8
2±0.
71
40.3
6±2.
92
49.4
6±1.
59
16.9
8±0.
38
34.3
4±0.
86
12.5
2±2.
09
637.
20±1
22.8
7<5
±0.0
0
Ctr
l 2.
98±0
.79
9.01
±0.3
9 14
.98±
0.41
44
.00±
1.10
48
.88±
0.99
16
.68±
0.32
34
.10±
0.32
11
.38±
0.45
60
8.50
±76.
02
<5±0
.00
W
BC
R
BC
H
B
HC
T M
CV
MC
H
MC
HC
R
DW
PL
M
PV
(x
109 /l)
(x
1012
/l)
(g/d
l) (%
) (fl
) (p
g)
(%)
(x
109 /l)
(µ
m3 )
60w
k
FB1/F
e 4.
24±1
.12
8.96
±0.2
4 15
.49±
0.42
46
.37±
1.49
51
.79±
0.39
17
.31±
0.25
33
.37±
0.57
11
.41±
0.40
67
9.86
±63.
89
<5±0
.00
Fe
3.46
±0.4
6 8.
81±0
.49
14.9
9±0.
62
44.5
0±1.
74
50.5
9±1.
22
17.0
4±0.
52
33.6
9±0.
42
11.5
6±0.
36
646.
86±1
87.3
5<5
±0.0
0
FB1/A
IN
3.52
±0.9
1 8.
90±0
.96
14.2
6±1.
60
43.7
4±4.
36
49.1
8±1.
07
16.0
0±0.
54
32.5
2±0.
65
12.4
8±1.
39
636.
80±9
5.96
<5
±0.0
0
Ctr
l 3.
74±1
.87
9.41
±0.2
9 14
.91±
0.57
45
.53±
2.20
48
.04±
1.27
15
.74±
0.50
32
.74±
0.73
12
.24±
0.31
67
9.13
±137
.04
<5±0
.00
Dat
a ar
e th
e m
eans
± s
tand
ard
devi
atio
n of
5 to
10
anim
als
per
grou
p; F
B1:
fum
onis
in B
1; Fe
: die
tary
iron
; AIN
: Am
eric
an In
stitu
te o
f Nut
ritio
n po
wde
red
diet
-93M
; Ctrl
: con
trol;
WB
C: w
hite
blo
od c
ells
; RB
C: r
ed b
lood
cel
ls; H
b: h
aem
oglo
bin;
HC
T: h
aem
atoc
rit; M
CV
: mea
n ce
ll vo
lum
e;
MC
H: m
ean
cell
haem
oglo
bin;
MC
HC
: mea
n ce
ll ha
emog
lobi
n co
ncen
tratio
n; R
DW
: red
cel
l dis
tribu
tion
wid
th; P
L: p
late
let c
ount
; MP
V: m
ean
plat
elet
vol
ume.
APPENDIX
IX
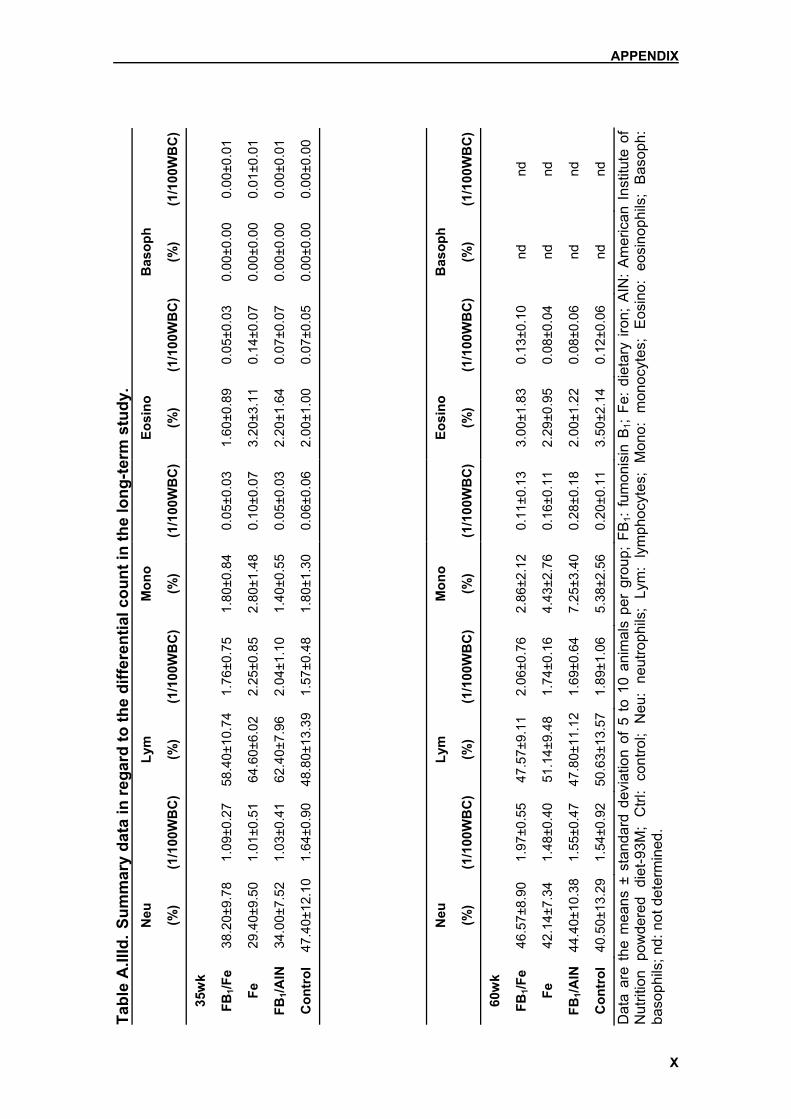
Tabl
e A
.IIId
. Sum
mar
y da
ta in
rega
rd to
the
diffe
rent
ial c
ount
in th
e lo
ng-te
rm s
tudy
.
Neu
Lym
Mon
o
Eosi
no
B
asop
h
(%
) (1
/100
WB
C)
(%)
(1/1
00W
BC
)(%
) (1
/100
WB
C)
(%)
(1/1
00W
BC
)(%
) (1
/100
WB
C)
35w
k
FB1/F
e 38
.20±
9.78
1.
09±0
.27
58.4
0±10
.74
1.76
±0.7
5 1.
80±0
.84
0.05
±0.0
3 1.
60±0
.89
0.05
±0.0
3 0.
00±0
.00
0.00
±0.0
1
Fe
29.4
0±9.
50
1.01
±0.5
1 64
.60±
6.02
2.
25±0
.85
2.80
±1.4
8 0.
10±0
.07
3.20
±3.1
1 0.
14±0
.07
0.00
±0.0
0 0.
01±0
.01
FB1/A
IN
34.0
0±7.
52
1.03
±0.4
1 62
.40±
7.96
2.
04±1
.10
1.40
±0.5
5 0.
05±0
.03
2.20
±1.6
4 0.
07±0
.07
0.00
±0.0
0 0.
00±0
.01
Con
trol
47
.40±
12.1
0 1.
64±0
.90
48.8
0±13
.39
1.57
±0.4
8 1.
80±1
.30
0.06
±0.0
6 2.
00±1
.00
0.07
±0.0
5 0.
00±0
.00
0.00
±0.0
0
N
eu
Ly
m
M
ono
Eo
sino
Bas
oph
(%
) (1
/100
WB
C)
(%)
(1/1
00W
BC
)(%
) (1
/100
WB
C)
(%)
(1/1
00W
BC
)(%
) (1
/100
WB
C)
60w
k
FB1/F
e 46
.57±
8.90
1.
97±0
.55
47.5
7±9.
11
2.06
±0.7
6 2.
86±2
.12
0.11
±0.1
3 3.
00±1
.83
0.13
±0.1
0 nd
nd
Fe
42.1
4±7.
34
1.48
±0.4
0 51
.14±
9.48
1.
74±0
.16
4.43
±2.7
6 0.
16±0
.11
2.29
±0.9
5 0.
08±0
.04
nd
nd
FB1/A
IN
44.4
0±10
.38
1.55
±0.4
7 47
.80±
11.1
21.
69±0
.64
7.25
±3.4
0 0.
28±0
.18
2.00
±1.2
2 0.
08±0
.06
nd
nd
Con
trol
40
.50±
13.2
9 1.
54±0
.92
50.6
3±13
.57
1.89
±1.0
6 5.
38±2
.56
0.20
±0.1
1 3.
50±2
.14
0.12
±0.0
6 nd
nd
Dat
a ar
e th
e m
eans
± s
tand
ard
devi
atio
n of
5 t
o 10
ani
mal
s pe
r gr
oup;
FB
1: fu
mon
isin
B1;
Fe:
diet
ary
iron;
AIN
: A
mer
ican
Ins
titut
e of
N
utrit
ion
pow
dere
d di
et-9
3M;
Ctrl
: co
ntro
l; N
eu:
neut
roph
ils;
Lym
: ly
mph
ocyt
es;
Mon
o: m
onoc
ytes
; E
osin
o: e
osin
ophi
ls;
Bas
oph:
ba
soph
ils; n
d: n
ot d
eter
min
ed.
APPENDIX
X

Tabl
e A
.IIIe
. Su
mm
ary
of th
e da
ta in
rega
rd to
bio
chem
ical
par
amet
ers
in th
e lo
ng-te
rm s
tudy
. 35
wk
Glu
c G
GT
T.Pr
ot
T. B
ili
AST
A
LT
ALP
D
. Bili
C
reat
U
rea
(m
mol
/l)
(U/l)
(g
/l)
(µm
ol/l)
(U
/l)
(U/l)
(U
/l)
(µm
ol/l)
(µ
mol
/l)
(mm
ol/l)
FB1/F
e 10
.40±
1.91
5.60
±2.0
7 65
.60±
2.1
11.0
4±2.
97
307.
60±1
11.3
7 11
3.08
±47.
97
139.
20±2
2.40
5.
98±1
.79
84.8
0±3.
96
4.72
±0.5
9
Fe
10.7
6±2.
363.
00±1
.00
68.0
0±4.
60
8.54
±1.4
3 22
8.78
±74.
08
80.0
4±23
.99
96.6
0±26
.01
4.32
±0.5
1 71
.00±
6.60
5.
38±0
.52
FB1
11.1
0±0.
755.
40±2
.07
65.3
2±4.
28
13.2
2±3.
75
242.
58±2
4.26
89
.62±
18.2
9 16
7.20
±68.
17
7.74
±2.3
5 78
.20±
9.01
5.
74±0
.89
Ctr
l 10
.00±
2.08
4.50
±4.1
2 65
.25±
1.80
10
.73±
2.74
19
9.23
±50.
29
57.7
0±14
.42
115.
50±3
7.86
6.
13±2
.05
67.5
0±8.
10
4.55
±1.3
6
60w
k T.
Iron
T.C
hol
T.
Bili
A
ST
ALT
A
LP
D. B
ili
Cre
at
(µ
mol
/l)
(mm
ol/l)
(µm
ol/l)
(U
/l)
(U/l)
(U
/l)
(µm
ol/l)
(µ
mol
/l)
FB1/F
e 39
.05±
9.39
2.30
±0.3
0
1.14
±0.4
7 25
8.03
±58.
20
108.
80±4
9.05
10
6.13
±18.
00
0.85
±0.4
4 67
.38±
3.29
Fe
35.0
7±8.
762.
52±0
.49
1.
80±1
.05
255.
69±1
34.9
8 88
.79±
32.0
3 10
0.00
±15.
12
0.94
±0.4
7 69
.38±
6.63
FB1
22.1
7±4.
892.
11±0
.45
1.
19±0
.35
233.
34±8
7.06
10
4.13
±102
.63
127.
90±2
3.54
0.
62±0
.31
76.6
0±14
.67
Ctr
l 19
.87±
2.59
2.43
±0.3
7
1.21
±0.7
7 19
6.58
±44.
38
51.0
8±20
.77
101.
00±2
0.37
0.
58±0
.30
66.0
0±5.
12
Dat
a ar
e th
e m
eans
± s
tand
ard
devi
atio
n of
5 to
10
anim
als
per g
roup
; FB
1: fu
mon
isin
B1;
Fe: d
ieta
ry ir
on; C
trl: c
ontro
l; G
luc:
glu
cose
; GG
T: γ
-gl
utam
yltra
nsfe
rase
; T
Pro
t: to
tal
prot
ein;
T.
Bili
: to
tal
bilir
ubin
; A
ST:
asp
arta
te t
rans
amin
ase;
ALT
: al
anin
e tra
nsam
inas
e; A
LP:
alka
line
phos
phat
ase;
D. B
ili: d
irect
bili
rubi
n; C
reat
: cre
atin
ine;
T. I
ron:
ser
um ir
on; T
. Cho
l: to
tal c
hole
ster
ol.
APPENDIX
XI

APPENDIX
XII
Table A.IIIf. Summary of hepatic nodules seen histologically in H&E staining at 35 weeks.
Rat no. Treatment group No. of nodules (H&E) 3 FB1/Fe 1 (H) 4 FB1/Fe 7 (L/H) 5 FB1/Fe 14 (L/H) 11 FB1/Fe 4 (H) 12 FB1/Fe 7 (L/H) 17 Fe 0 29 Fe 0 32 Fe 0 34 Fe 0 35 Fe 0 38 FB1/AIN 40 FB1/AIN 3 (H) 41 FB1/AIN 2 (L) 48 FB1/AIN 49 FB1/AIN 2 (L/H) 57 Control 0 60 Control 0 61 Control 0 68 Control 0 70 Control 0
H = high-grade dysplasia; L= low-grade dysplasia

APPENDIX
XIII
Table A.IIIg. Summary of hepatic nodules seen histologically in H&E staining at 60 weeks.
Rat no. Treatment group No. of nodules (H&E) 1 FB1/Fe 9 (H) ±* 2 FB1/Fe 1 (H) 6 FB1/Fe 8 (L/H) ± 7 FB1/Fe 8 (L) ± 8 FB1/Fe 1 (H) 9 FB1/Fe 12 (L/H) ± 10 FB1/Fe 16 (L/H) ± 13 FB1/Fe 8 (L/H) ± 14 FB1/Fe 3 (H) 15 FB1/Fe 2 (L) 16 Fe 0 18 Fe 0 19 Fe 0 22 Fe 0 28 Fe 0 30 Fe 1 (H) 31 Fe 0 33 Fe 0 36 FB1/AIN 1 (L) 37 FB1/AIN 2 (H) ± 39 FB1/AIN 7 (L/H) ± 42 FB1/AIN 1 (L) 50 FB1/AIN 7 (L/H) ± 51 FB1/AIN 2 (L/H) 52 FB1/AIN 7 (L/H) ± 53 FB1/AIN 4 (L/H) ± 54 FB1/AIN 11 (L/H) ± 55 FB1/AIN 8 (L/H) ±

APPENDIX
XIV
Table A.IIIg. (cont.)
56 Control 0 58 Control 0 59 Control 0 62 Control 0 63 Control 0 64 Control 0 65 Control 0 66 Control 0 67 Control 0 69 Control 0
H = high-grade dysplasia; L = low-grade dysplasia *exact number of nodules not determined because of poorly defined borders.

Tabl
e A
.IIIh
. Sum
mar
y of
the
data
of G
STP+ c
ells
and
foci
/nod
ules
per
cm
2 in th
e lo
ng-te
rm s
tudy
at 3
5 an
d 60
wee
ks.
35w
ks
No.
of c
ells
nodu
le s
ize
si
ngle
ts
dupl
ets
<1um
1-
10um
10
-20u
m
20-5
0um
>5
0um
FB1/F
e 4.
38±3
.46
0.26
±0.2
0
0.
01±0
.03
0.72
±0.3
6 0.
28±0
.17
0.09
±0.0
8 0.
01±0
.02
Fe
2.05
±2.1
0 0.
35±0
.26
0.01
±0.0
2 0.
11±0
.13
0 0
0
FB1/A
IN
0.37
±0.6
0 0.
06±0
.08
0.06
±0.0
6 0.
47±0
.57
0.02
±0.0
4 0.
02±0
.04
0
Ctr
l 0.
19±0
.08
0.05
±0.0
4
0.
01±0
.02
0.06
±0.0
4 0
0 0
60w
ks
cell
#
nodu
le s
ize
si
ngle
ts
dupl
ets
trip
let
4-10
<1
um
1-10
um
10-2
0um
20
-50u
m
>50u
m
FB1/F
e 1.
62±1
.23
0.10
±0.1
0 0.
04±0
.05
0.10
±0.1
0 0.
02±0
.04
1.00
±0.3
2 0.
23±0
.16
0.14
±0.1
2 0.
03±0
.05
Fe
2.17
±2.0
7 0.
15±0
.12
0.06
±0.0
6 0.
12±0
.10
0.03
±0.0
6 0.
07±0
.06
0 0.
01±0
.02
0
FB1/A
IN
0.41
±0.2
9 0.
11±0
.11
0.08
±0.0
6 0.
11±0
.12
0.01
±0.0
2 0.
78±0
.65
0.07
±0.0
8 0.
09±0
.06
0.03
±0.0
5
Ctr
l 0.
32±0
.26
0.11
±0.0
8 0.
06±0
.07
0.23
±0.2
0 0.
08±0
.15
0.16
±0.1
7 0
0 0
Dat
a ar
e th
e m
eans
± s
tand
ard
devi
atio
n of
5 to
10
anim
als
per g
roup
; FB
1: fu
mon
isin
B1;
Fe: d
ieta
ry ir
on; A
IN: A
mer
ican
Inst
itute
of N
utrit
ion
pow
dere
d di
et-9
3M; C
trl: c
ontro
l; G
STP
: pla
cent
al fo
rm o
f glu
tath
ione
S-tr
ansf
eras
e.
APPENDIX
XV

ACKNOWLEDGEMENTS
XVI
Acknowledgements
Supervision Prof. Pauline Hall, for inviting me to come and providing me with all these
wonderful opportunities. Her enthusiasm is inspiring and it is amazing how
someone can be so untiring and forever encouraging. I greatly appreciate her
faith in my abilities and potential.
Prof. Dr. Wolfgang Schmahl for his patience, trust, and support of me in my
undertaking and giving me the opportunity to follow my dream of coming to
South Africa.
Special mention Dr. Wentzel Gelderblom for sacrificing immense time and effort for me. Without
his help, guiding hand, and friendship, this would never have been possible and
half as much a learning experience and fun as it was. I so much appreciate him
for ‘putting up’ with me and also for obliging my animal enrichment ideas.
Prof. WFO Marasas, as Director of the PROMEC Unit of the Medical Research
Council of South Africa, for welcoming me and so generously allowing me to
conduct my research project at their facilities.
The University of Cape Town, the Department of Anatomical Pathology and the
head of department Prof. Peter Cruse, for their support and facilities.
Technical Support Chemical Pathology Department (UCT), with Prof. J. Davidson, Dr. H. Vreede
and N. Roomanay, for setting up the Flinders University School of Medicine
method of hepatic iron determination in their department; Staff of Core
Laboratory (UCT), for histopathological processing and staining; C. Woodroof
(MRC), for great slides, D. van Schalkwyk (MRC), for even sending stats from
England; S. Swanevelder (MRC); S. Abel (MRC), H. Burger (MRC), J. Mokotary
(MRC), J. Rheeder (MRC), R. September (UCT); IBP Unit (MRC).

ACKNOWLEDGEMENTS
XVII
Financial The Hans Rudolf Stiftung (Munich, Germany) and the J.S. Scratchlet Trust
(UCT) for their financial support, for which I am deeply grateful.
Personal Frau Dr. med vet Beamtin Kathrin Sterr und der ‘nicht-so-boese’ Auslaender
Safet: without you guys, I don’t know where I’d end up. Thanks for the all the
help, personally and professionally, I cannot even begin to repay you. Luan
Webber and Nicolene Rodrigues- hey, what would I have done without you?
‘Work’ and ‘after-work’ wouldn’t have had half as many laughs. I’ll miss you
guys so much (and this goes for Jacques and Sergio too!). Use your ‘potential’
to the fullest!; Petra Snijman who also ‘belongs’ in the technical section for
sacrificing so much of her time and patience in isolating FB1 for me and helping
with my lab work, but I most appreciate her for her friendship and concern for
my wellbeing; Ntuthu Somdyala and Francoise Venter for welcoming into their
office/lab and making me feel soooo at home there; Sylvia Riedel for making the
Iate evenings endurable with her Cape Velvet ‘suggestions’; Lorraine Adonis,
one of the sweetest ladies on the floor!; to Donna and David le Roux, for helping
us with so much, when we really needed the support; to the rest of PROMEC;
also to my all my other friends for their friendship and support: Pamela, Silvie,
Carsten, Didi, Freddy, Christian, Christoph, Daniela, Marcus, meine
Softballer/Innen, Bettina, AWS, Daniel.
Jörg’s parents, Marianne and Willi Schnurr, for being so supportive of Jörg and
me through our stay overseas. We can always count on you, and I appreciate it
a lot.
And lastly and most importantly: my endless thanks to my parents for making
this all possible and always allowing me to be myself and follow my whims and
dreams; to my brother Mike, even though I never let him take Laila home with
him; and finally, especially to Jörg, who’s been there with me through the good
and bad and who will always be my better half, best friend, and most fun person
to be with. You deserve the title of co-doctor, for all the help you gave me!

CURRICULUM VITAE
XVIII
Curriculum vitae
Name: Denise Adeline Werner
Date of Birth: November 30th, 1971
Place of Birth: Spokane, Washington, USA
Parents: Wolfgang Klaus Werner
Verena Werner (maiden name: Jordi)
Education and Employment
1978-1984 “Elementary School” in Spokane (Grades 1-6)
1984-1986 “Junior High School” (Grades 7 and 8)
1986-1988 “Ferris High School” (Grades 9 and 10)
1988-1992 “Staatliches Eifel Gymnasium“ Neuerburg
(German High School and Boarding School, Grades 10-13)
1992-1994 Justus-Liebig-University in Giessen, Germany
-Veterinary Medicine
1994-1999 Ludwig-Maximilians-University in München, Germany
-Veterinary Medicine
June 1999 “Tierärztliche Approbation” (Graduation Diploma)
1999-2002 Completion of the doctoral thesis in question for the
Department of Pathology and Neuropathology at the LMU
Munich under the direction of Prof. Dr. W. Schmahl and
Prof. Dr. P. Hall of the Department of Anatomical Pathology
at the University of Cape Town, South Africa.
The practical work was completed at MRC/PROMEC
(Medical Research Council/ Programme on Mycotoxins and
Experimental Carcinogenesis), Tygerberg, South Africa.

CURRICULUM VITAE
XIX
08.1999-01.2002 Volunteer work at the Animal Welfare Society in Cape
Town, South Africa (1999-2002)
Sterilization program and other operational care
Sept. 1999 Microsurgery course at the University of Cape Town
10.1999-04.2002 Hans-Rudolf-Grant
01.2000-01.2002 Part-time position as research assistant in the Department
of Anatomical Pathology at the University of Cape Town,
South Africa
Presentations “The effect of different dietary iron levels in the rat”
Presented at the Medical Research Council, Tygerberg,
South Africa, June 9th, 2000
“The effect of iron overload on the long-term toxicological
effects of fumonisin B1 in rat liver”
Presented at
(i) The Medical Research Council, Tygerberg, South
Africa, December 13th, 2001
(ii) University of Cape Town, South Africa, January 17th,
2002