the effect of learning styles on course performancefranke.nau.edu/images/uploads/fcb/08-02.pdf ·...
TRANSCRIPT

The Effect of Learning Styles on Course Performance:
A Quantile Regression Analysis
Working Paper Series—08-02 | January 2008
Pin Ng, Ph.D.
Associate Professor
James Pinto, Ph.D. Professor
Susan K. Williams, Ph.D.
Associate Professor
All professors at:
Northern Arizona University The W. A. Franke College of Business
PO Box 15066 Flagstaff, AZ 86011.5066

1
The Effect of Learning Styles on Course Performance: A Quantile Regression Analysis
Introduction
Students have different learning styles. “They preferentially focus on different types of information, tend to operate on perceived information in different ways, and achieve understanding at different rates” (Felder, 1993, p. 286). In this study, we investigated the relationship between student performance and learning styles for students enrolled in a basic business statistics course. This course was recently redesigned in order to facilitate learning for students of all learning styles. A learner-centered approach that incorporated multiple teaching styles such as student responsibility via mastery and co-operative learning that used teams in several course components was adopted. In addition, the focus of the redesigned course was on interpretation and implications of statistical results instead of the mechanics of computation (Lockwood, Ng, & Pinto, 2007). To assess our success in designing a course that facilitates learning for all learning styles, we evaluated the impact of students’ learning style on their performance in the course. “Students whose learning styles are compatible with the teaching style of a course instructor tend to retain information longer, apply it more effectively, and have more positive post-course attitudes toward the subject than do their counterparts who experience learning/teaching style mismatches,” (Felder, 1993, p. 286). Thus, it is important to design a course that is not advantageous or disadvantageous to any learning style. If the results of this study had shown a relationship between the overall course score and a student’s learning style, then additional components would have been designed into the course or students would have been advised of how best to adapt to the teaching style that does or does not match their preferred learning style. To accomplish this analysis, we utilized quantile regression, a statistical technique from the economics literature developed by Koenker and Bassett (1978) that is an alternative to the classical ordinary least squares (OLS) regression. Quantile regression allowed investigation of a more complete picture of student performance over the entire population. For example, an OLS regression analysis for course score with learning styles as the independent variables determines a regression equation that will estimate the mean effect of the learning styles on course performance. Quantile regression, however, can provide information about the performance of, for example, the lower performing 25% of the class. The significant factors affecting performance for the lower 25% may be different from the significant factors affecting performance for the top performing 25% and can only be determined using quantile regression. Thus, quantile regression provided incremental information about the entire spectrum of students that OLS regression could not provide. Student course performance and learning style information were collected for the redesigned course. To determine their learning style, students accessed the free Feldman Index of Learning Styles assessment tool that is available on-line (Felder & Soloman, 2001). For each of the five dependent variables (course average, exam average, quiz average, project average, and pre/post-assessment difference), an OLS regression and a quantile regression were performed using attendance, pre-assessment score, post-assessment score and the various learning style indices as the independent variables to investigate their effects on the various components of a student’s learning in the course. Learning style was not significant in determining a student’s overall course score for the entire cohort of students. This added more evidence that the redesigned course did not favor students with any particular learning style. For small cohorts of students, learning styles were significant for exam average. That is, some students experienced either a disadvantage or advantage due to their learning style for the exam course component, as elaborated in more detail in the Results section. However, for the overall course performance, a student with a particular learning style was neither advantaged nor disadvantaged. Learning Styles
How do students learn? This question has been an area of interest for instructors and researchers for many years. Several learning styles models and several instruments for measuring learning styles have been developed in an attempt to answer this question. In 1991, Campbell reviewed 32 instruments for measuring learning style preferences (Campbell, 1991). Some of these instruments are free and some are not. Some can be self-administered, but trained personnel must administer others. Coffield, Moseley, Hall, & Ecclestone (2004) have extensively reviewed the learning styles literature, evaluated the major learning styles models and discussed the implications for practice. They identified 71 learning models and instruments and categorized 13 of these as major models.

2
Hawk and Shah (2007) reviewed and compared five of the more commonly and recently used learning style models and instruments: Kolb Learning Styles Indicator, Gregorc Style Delineator, Felder-Silverman Index of Learning Styles, VARK Questionnaire, and Dunn & Dunn Productivity Environment Preference Survey. Of these five models, Coffield et al. (2004) had identified four as major models. Hawk and Shah described each learning style model, reported on instrument validity, reliability, and student performance, and compared the five models to find commonalities and differences. We elected to use the Felder-Silverman model and Index of Learning Styles (Felder & Silverman, 1988) for this study because students can self-administer this questionnaire at no cost. In addition, the four learning style dimensions are numerically coded and easily quantified for analysis. Finally, the Index of Learning Styles has been validated (Zwyno, 2003), (Litzinger, Lee, Wise, & Felder, 2005), (Felder & Spurlin, 2005). Since researchers and educators do not agree even on the definition of learning style, the definitions and terminology put forth by Felder and Silverman were used in this study. Learning style is the way a student prefers to “receive and process information” (Felder & Silverman, 1988, p. 674). Felder and Silverman (1988) classified preferred learning styles into four dimensions based on the type of information that people preferentially perceive, the sensory channel by which people most effectively perceive information, the mental process by which perceived information is converted to knowledge, and the manner in which people understand and master the material. Table 1 lists the bi-polar preferences defined for each dimension.
Table 1. Felder-Silverman Learning Style Dimensions
Table 2 lists typical characteristics of students with strong preferences in each dimension direction (Felder & Silverman, 1988), (Felder & Spurlin, 2005). These are just preferences and students can frequently switch learning styles. The weaker the preference the more likely a student will switch based on the context and demands of the learning task. Felder also classifies teaching styles into four dimensions: (1) content can be concrete/abstract, (2) presentation can be visual/verbal, (3) student participation can be active/passive and (4) perspective can be sequential/global.

3
Table 2. Characteristics of students with strong learning style preferences
Sensing Intuitinglike facts, data, experimentation like principles and theorieslike solving problems by standard methods like innovation
are patient with detail like complicationsare careful and maybe slow good at grasping new conceptsgood at memorizing facts are quick and maybe carelessare slow at translating symbols including words more comfortable with symbols
dislike complications bored by detaildislike surprises dislike repetition
Visual Verballearn from seeing diagrams, pictures, etc like discussion most college-age and older people are visual
learn from hearing and saying, explaining to others
Active Reflective
work with information in physical world work with information introspectively
need to be active (as opposed to passive) need time to think
work well in groups work well by themselves or at most one other person
tend to be experimentalists tend to be theoreticiansSequential Global
learns material in sequence – step by step make intuitive leaps
linear learning process frequently unable to explain how they came up with an answer
can work with partially understood material
can’t work until totally understand
good at convergent thinking and analysis good at divergent thinking and synthesis
want a steady progression of complexity
Perception
Input
Understanding
Information processing
An Interpretative Business Statistics Course
The redesigned business statistics course used an interpretive and learner-centered approach. This redesign effort focused on how business students would actually use statistics in other higher-level business courses and in the business world. For a complete description of the course, see Lockwood et al. (2007). Teaching methods suggested by Felder (1993) that are designed to address all learning styles were added to the course. The major aspects of the redesigned course were: Emphasis was on interpretation and applications of results. The use of equations was only for understanding of
concepts. Hand calculations via formulae were not required of students. Students use PHStat®, an Excel add-in, for all statistical computations. This concrete teaching style on content was expected to help learners who prefer a sensory perception process. The use of pre-lecture, post-lecture, and lab quizzes was to encourage student responsibility through mastery.
Students may take the quizzes an unlimited number of times in WebCT®. This self-paced, self-guided mastery approach to learning was expected to enable students who were sensing, active and sequential learners to learn more effectively through drill exercises. The more challenging questions on abstract concepts and fundamental statistical understanding found in post-lecture quizzes were designed to stimulate and challenge intuitive, reflective and global learners.

4
Teams facilitated learning both inside and outside the classrooms and fostered cooperative learning. This active mode of student participation was expected to benefit both active and verbal learners. Student teams work on team projects that utilized real data from real problems, and they were required to present their findings in the form of a formal business report. The use of real data was incorporated to entice the sensing learners while the complicated and creative organization of the reports was expected to challenge the intuitive learners. The business reports allowed students with polarized learning styles to work together and contribute their respective comparative advantage to the team. The use of concrete real business data and problems in the lectures, labs, quizzes, exams and projects was
expected to help students with sensing and active disposition. In-class lectures that shifted from the traditional instructor-to-students interaction to incorporate student-to-
student interactions provided verbal learners opportunities to verbalize their learning in discussions. Student-to-student interaction was expected to help active learners, since they work well in groups. Heavy utilization of e-mail and discussion areas fostered student-to-student and instructor-to-student interaction
outside the classroom. The use of web technology allowed instructors to provide many of the materials traditionally delivered through
lectures. This enabled instructors to better use the contact time in lectures to emphasize concepts, illustrate interpretation of numerical results and demonstrate applications to business problems. In addition, multi-media learning resources with animations were delivered to students 24 hours a day, 7 days a week via WebCT. This multi-modal delivery system was aimed to facilitate different modes of learning for students with varied learning styles. Method
Data were collected from eight sections of the redesigned course taught by the first two authors. The data included grades for the course, exams, project, and quizzes. In addition, data were also recorded for attendance, pre/post-assessment scores, and learning style preference score on each of the four dimensions. After deleting missing data, the analysis included 289 student observations. Exam average was the weighted average of 2 mid-terms and one final with weights 15%, 15%, and 20%, respectively. The exam average was normalized to the 95th percentile. Thus, a grade of more than 100 on the exam average was possible. Quiz average was the average of 13 pre-lecture, 13 post-lecture and 11 lab quizzes. Project average was the individual average score of two team projects, which included the team report scores, individual quiz scores based on the project, and individual self-peer evaluation scores. Extra credit for attendance was part of the student’s grade added directly to the course average. For perfect attendance, 1.5% was recorded. If no more than two classes were missed, 1.25% was recorded, 1% was recorded for no more than 4 classes missed, 0.75% for no more than 5 classes missed, 0.5% for no more than 6 classes missed, and 0.25% for no more than seven. The course average was a weighted average of 30% quiz average, 20% project average, and 50% exam average with the attendance score added in last. Since exam average could exceed 100, and the attendance was added as an addition to the average of the 3 major components, a course average of more than 100 was possible. In order to assess learning gain, the same assessment was administered on the first day (pre-assessment) and last day (post-assessment) of the semester. The difference between these scores was used to assess learning gain. Students took a web-based learning styles survey at the beginning of the semester (Felder and Soloman, 2001). Scores on the four indices: sensing/intuitive (SEN/INT), active/reflective (ACT/REF), visual/verbal (VIS/VER), and sequential/global (SEQ/GLO) are coded on a scale from 11 to –11 in decrements of 2. A score between 9 and 11 on, for example, ACT/REF indicates a strong preference for active (ACT) learning style. A score between 5 and 7 indicates a moderate preference for ACT learning style. Finally, a score between 1 and 3 indicates a fairly well balanced disposition while a score in the negative range points to a preference for the opposite preference in that dimension (REF). The learning style data were re-coded based on recommendations by Felder & Spurlin (2005). If a student does not strongly prefer a learning style, according to Felder & Spurlin, the student will use the learning style that is to their advantage under the particular circumstances. A score greater than 4 in a dimension indicates that a student prefers
5
that learning style. From 4 to -4 is neutral on the dimension and less than -4 represented the opposite preference in the dimension. Results
Descriptive statistics are in Table 3 for the various components of the course. Students typically attended all or almost all classes. An average improvement on the learning gain assessment is 16.8 points out of 100. Thus, the results of the study have demonstrated that students have learned during the redesigned course. Quiz and project averages were high. For the quizzes, this was due to taking the quizzes multiple times to improve scores. The project was a team effort with individual components. Therefore, a high average score on the project reports despite the rigorous standards used for grading was expected. Table 4 contains descriptive statistics on learning styles. The median student learning style was neutral on three of the four dimensions. On the VIS/VER dimension, the median preference was moderately visual.
Table 3. Descriptive statistics for course component grades (289 students)
Attendance Pre-
AssessmentPost-
AssessmentExam
AverageQuiz
AverageProject
AverageCourse
AverageMin 0.0 5.0 20.0 34.1 38.6 42.8 41.7Max 1.5 85.0 100.0 109.5 100.0 98.2 109.8Median 1.5 50.0 70.0 74.1 94.4 89.1 81.7Average 1.3 50.5 67.3 73.6 90.5 88.0 81.6
Table 4. Learning styles descriptive statistics for 289 students
SEN/INT (+/-)
VIS/VER (+/-)
ACT/REF (+/-)
SEQ/GLO (+/-)
Min -11.0 -9.0 -9.0 -11.0Max 11.0 11.0 9.0 11.0Median 3.0 5.0 1.0 1.0Average 2.7 4.6 1.2 1.5
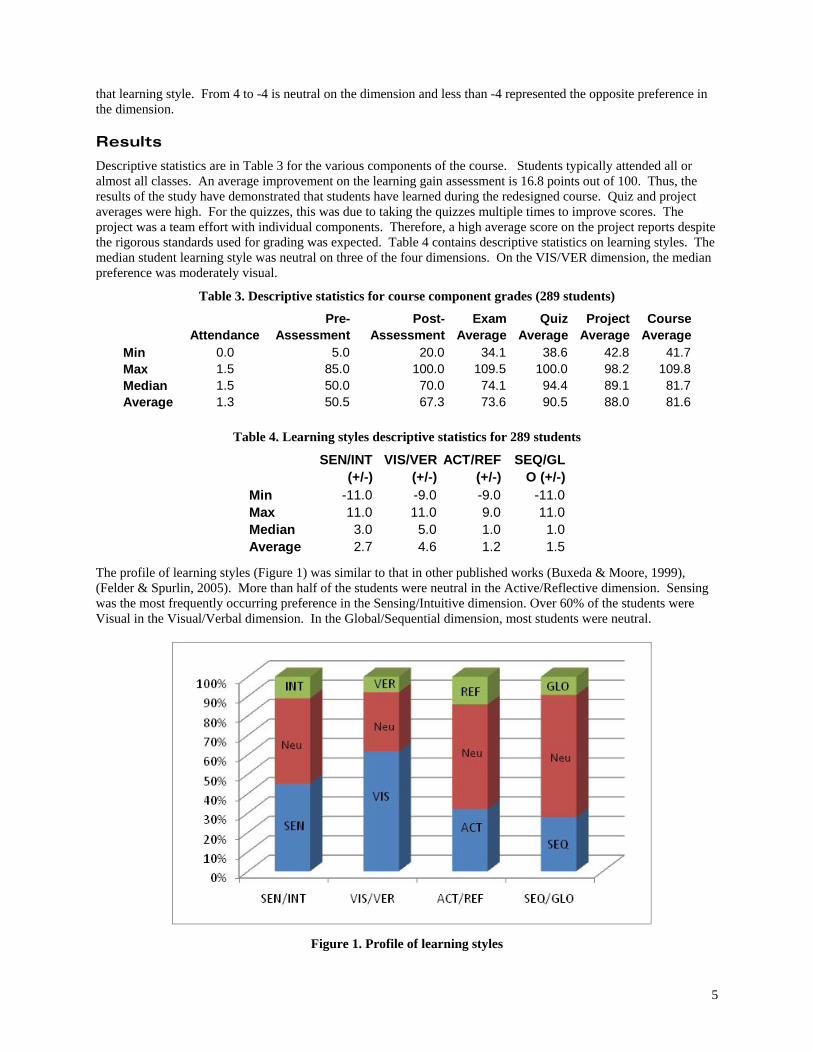
The profile of learning styles (Figure 1) was similar to that in other published works (Buxeda & Moore, 1999), (Felder & Spurlin, 2005). More than half of the students were neutral in the Active/Reflective dimension. Sensing was the most frequently occurring preference in the Sensing/Intuitive dimension. Over 60% of the students were Visual in the Visual/Verbal dimension. In the Global/Sequential dimension, most students were neutral.
Figure 1. Profile of learning styles

6
There are 81 possible combinations over the four dimensions. In this group of students only 54 of the possible combinations were present. Listed in Table 5 are the 10 most frequently occurring combinations that account for 57% of the students.
Table 5. Most frequently occurring learning style combinations
Rank SEN/INT VIS/VER ACT/REF SEQ/GLO Frequency Percent Cumulative percent1 N VIS N N 39 13.5% 13.5%2 SEN VIS N N 24 8.3% 21.8%3 SEN VIS N SEQ 19 6.6% 28.4%4 SEN N N N 14 4.8% 33.2%5 N N ACT N 14 4.8% 38.1%6 SEN VIS ACT N 13 4.5% 42.6%7 N N N N 11 3.8% 46.4%8 N VIS ACT N 11 3.8% 50.2%9 SEN VIS ACT SEQ 11 3.8% 54.0%10 N VIS N SEQ 10 3.5% 57.4%
Each of the five dependent variables (course average, exam average, quiz average, project average, and the average difference between pre/post assessment scores) were regressed on the independent variables attendance, pre-assessment score, post-assessment score and learning style. The model must represent three values for each of the four learning style dimensions. For example, the ACT/REF dimension could have the value ACT, REF, or ACT/REF Neutral. To achieve this, two binary variables represented each learning style. Table 6 lists the results for the five OLS regressions and the significant independent variables at the p-value = 0.05 level. The appendix contains the detailed statistical results for each dependent variable. Attendance was a significant factor for four dependent variables. None of the learning styles was significant for course average; thus, there was no significant difference in average student performance due to learning style. However, the exam average did show some performance differences based on learning styles. For exam average, REF had a positive average effect at the 0.05 level for reflective learners. These reflective learners process information introspectively, and they tend to do better on the exams in comparison to their active classmates.
Table 6. OLS Regression Summary
Course average Exam average Quiz Average Project Average Pre/post Difference AverageIntercept + + + + +Attendance + + + + ~Pre‐assessment ~ + ~ ~ N/APost‐assessment + + + ~ N/ALearning style ~ REF (+) ~ ~ SEQ/GLO Neutral (-)
~ ~ ~ ~ SEQ (-)
+ Significant at p = 0.05 Positive Coefficient‐ Significant at p = 0.05 Negative Coefficient
~ Not Significant at p = 0.05
Interestingly, GLO learners on average scored better than SEQ/GLO neutral or SEQ learners in the pre/post assessment difference. This was interesting, because Felder (1993) has pointed out that at least in engineering courses, material tends to be taught sequentially, and Zwyno & Waalen (2001) showed that GLO learners were over represented in the lower half of the class. However, perhaps, the design of the course – quizzes taken multiple times on the same material and project work has helped the GLO learners. The assessments also contained questions that address the more general concepts of statistics, which required a global understanding of the subject matters, instead of the specific mechanics of statistics. This aspect may have also favored the GLO learners. These learners tend to take in information randomly, synthesizing information intuitively. Quantile regression provided additional insight, which was described below with Figure 5.

7
In an attempt to obtain a more complete picture of the effect of learning styles on students’ performance, quantile regression analysis was performed. Koenker and Hallock (2001) have given an excellent non-technical introduction to quantile regression. The quantile regression estimates were obtained using algorithms based on Koenker and D’Orey (1987), and Portnoy and Koenker (1997) written for the R package quantreg available at http://www.r-project.org/. Results from the quantile regression for course average are in Figure 2. Each panel represents an independent variable and its relationship to the dependent variable, the course average. The quantile regression coefficients were plotted in each panel as a solid curve with a filled circle at each of the 19 distinct quantiles (5% to 95% at intervals of 5%). For each independent variable, these 19 point-estimates can be interpreted as the impact of a one-unit change of the independent variable on course average for that quantile holding the effect of the other independent variables fixed. The bands around the solid curve with filled circles are the 95% point-wise confidence bands for the estimated quantile regression effects. The horizontal dashed lines represent the least squares estimate of the conditional mean effect while the two dotted horizontal lines depict the 95% confidence interval for the least squares estimated coefficient.
Figure 2. Course Average Quantile Regression Results
The first panel, the intercept, can be interpreted as the estimated conditional quantile function of a student who receives a zero for attendance, scores a 0 on both the pre-assessment and post assessment, and is an INT, VIS/VER Neutral, ACT, and GLO learner. To interpret the panels, quantiles where the confidence band around the quantile regression coefficients does not contain 0 were examined. These quantiles represented statistically significant effects of the independent variables. For course average, note the following: - Attendance had a positive and uniform effect on course average across all quantiles except the bottom and top 10%. For these quantiles (15%-85%), approximately 5% points were added to the course average while the attendance score contribution to the course average alone was only 1.5% for students with perfect attendance. This confirmed the belief prevalent among faculty that attending class is beneficial for course grades. - Post assessment exhibited a positive relationship with course average though not large – at most 0.4 points for a one point increase in post-assessment score.

8
- None of the learning styles had a significant effect at any of the quantiles. This is consistent with the message obtained from the OLS results. Not only that learning style does not affect course performance of an average student, but does not affect any cohort of students over the whole spectrum of the population. This was evidence that the redesigned course has succeeded in not biasing against any student with a particular learning style. Figure 3 has the quantile regression results for exam average. - Attendance had a significant positive effect at only a few quantiles: 20-30% and 90% - Pre-assessment had a small positive effect at the upper quantiles. For one point higher on the pre-assessment, the upper quantiles scored 0.2 points higher on exams. Thus, a slight advantage on exam average was found for those students that come into the course better prepared. - Post-assessment had a positive and uniform relationship with exam score. For each additional post-assessment point, the exam score was 0.35 – 0.5 points higher. This illustrated a positive relationship between performance on post-assessment and exam scores, which was expected. - For quantiles 15-30%, ACT/REF Neutral learners scored 5 points higher than the ACT learners did. For quantiles 20-40%, REF learners scored about 10 points higher than ACT. This led to the not surprising conclusion that ACT learners did not perform as well as other learners on the exams. Exams typically do not allow for active information processing like experimenting. However, these two learning style dimensions do not affect the exam performance of the top 50% of students. - For quantiles 40-75%, VER learners scored about 8 points higher than VIS/VER Neutral learners did. One possible explanation is that the 40-75 percentile VER learners benefit more from learning the material outside classroom via discussion with their teammates and on discussion during class time. Hence, they may have benefited more on the exam than other type of learners. This is an indirect effect. Only 11% of the students are VER learners.
Figure 3. Exam Average Quantile Regression Results
Figure 4 displays the quantile regression results for quiz average. - Attendance had a significant positive effect of 8-10 points for quantiles 0-75%. However, upper quantiles (80-95%) did not benefit significantly. Those students who attended regularly in class throughout the semester were able to keep up with the activities that took place in the course and, hence, completed the quizzes on time. - Post assessment exhibited a positive relationship with quiz average for quantiles 20-75%. The relationship tapered off for the higher quantiles.

9
- SEQ learners at the lower quantiles (5-15%) scored 10 to 20 points higher than GLO learners did. This suggested that the very weak SEQ learners appeared to benefit more than their SEQ/GLO and GLO counterpart because quizzes were completed sequentially throughout the semester and, hence, cover the material in sequential manner.
Figure 4. Quiz Average Quantile Regression Results

10
Figure 5 has the quantile regression results for project average. - Post assessment was significant for quantiles 60-100%. There is a positive relationship between post assessment performance and project average. - None of the learning style dimensions was significant across the whole spectrum of the student population. This could be due to the fact that students work in teams and, hence, students with different learning styles have complemented each other’s strengths and weaknesses.
Figure 5. Project Average Quantile Regression Results
Figure 6 has the quantile regression results for pre/post-assessment difference. The difference in pre/post-assessment measured the learning gain from the course. We learned more about the significance of the factors SEQ/GLO Neutral and SEQ on the learning gain for an average student in the OLS regression. Figure 6 shows that SEQ/GLO Neutral learners had a disadvantage compared to the GLO learners, i.e., GLO learners were better than SEQ/GLO Neutral learners only for the top 10% of the performers. Likewise, only the bottom 10% of the cohort, GLO learners have a more than 10 points advantage over the SEQ learners. However, this advantage/disadvantage was for a small number of students. This advantage/disadvantage disappeared for the remaining 90% of the population cohort. None of the other independent variables had a significant relationship with the pre/post-assessment difference. The fact that none of the learning style dimensions had a significant effect on learning gain for most of the population cohort reinforced our finding that the course had been designed in a way that did not favor students with particular learning preferences.

11
Figure 6. Pre/post-assessment Difference Quantile Regression Results
Summary and Conclusions
We have demonstrated that the use of multi-modal teaching strategies created a learning environment in which a student’s learning style did not affect the student’s course grade. In addition, by using quantile regression, we captured a more complete picture. Instead of a picture of the ‘average’ student, the entire distribution of student performance was examined. We found out that not only did learning style not affect the performance of an average student, it did not affect the performance of the whole spectrum of the student population. A few course components were affected by learning style. Specifically, we learned that for quantiles 15-30%, ACT/REF Neutral learners scored higher on the exam than the ACT learners. This led to the not surprising conclusion that at least some ACT learners did not perform as well as other learners on the exams. We also learned that for the top 10% quantiles on the difference in pre/post assessments which measured learning gain, GLO learners had a slight advantage over their SEQ/GLO neutral counterpart. They also had a slight advantage over the SEQ learners at the bottom 10% end. But these advantages/disadvantages disappeared for the remaining 90% of the student populations. In addition, there was no effect of attendance on course score for the top and bottom 10% though it was significant for all other students. Interestingly, this might indicate that class time was geared for the center 80% students – neither teaching to the lowest quantile nor the highest quantile of students.

12
References
Buxeda, R. J., & Moore, D. A. (1999). Using learning-styles data to design a microbiology course. Journal of College Science Teaching, 29(3), 159-164.
Campbell, B. J. (1991). Planning for a student learning style. Journal of Education for Business, 66(6), 356-359.
Coffield, F., Moseley, D., Hall, E., & Ecclestone, K. (2004). Learning styles and pedagogy in post-16 learning: A systematic and critical review. London: Learning & Skills Research Centre.
Felder, R. M. (1993). Reaching the second tier: Learning and teaching styles in college science education. Journal of College Science Teaching, 23(5), 286-290.
Felder, R. M., & Silverman, L. K. (1988). Learning and teaching styles in engineering education. Journal of Engineering Education, 78(7), 674-681.
Felder, R. M., & Soloman, B. A. (2001). Index of Learning Styles Questionaire. North Carolina State University. Accessed September 29, 2007 at: http://www4.ncsu.edu/unity/lockers/users/f/felder/public/ILSpage.html.
Felder, R. M., & Spurlin, J. (2005). Applications, reliability, and validity of the index of learning styles. International Journal of Engineering Education, 21(1), 103-112.
Hawk, T. F., & Shah, A. J. (2007) Using learning style instruments to enhance student learning. Decision Sciences Journal of Innovative Education, 5(1), 1-20.
Koenker, R., & Bassett, G. (1978). Regression quantiles. Econometrica, 46, 33-50.
Koenker, R., & D’Orey, V. (1987). Computing regression quantiles. Applied Statistics, 36, 383-393.
Koenker, R., & Hallock, K. F. (2001). Quantile regression. Journal of Economic Perspecitives, 15, 143-156.
Litzinger, T. A., Lee, S. A., Wise, J. C., & Felder, R. M. (2005). A study of the reliability and validity of the felder-soloman index of learning styles. Proceedings of the 2005 American Society for Engineering Education Annual Conference and Exposition,
Lockwood, C., Ng, P., & Pinto, J. (2007). An interpretive business statistics course encompassing diverse teaching and learning styles. Academy of Educational Leadership Journal, 11(1), 11-23.
Portnoy, S., & Koenker, R. (1997). The gaussian hare and the laplacian tortoise: Computability of squared-error versus absolute-error estimators, with discussion. Statistical Science, 12, 279-300.
Zwyno, M. S. (2003). A contribution to validation of score meaning for felder-soloman's index of learning styles. Proceedings of the 2003 American Society for Engineering Education Conference and Exposition.
Zwyno, M. S., & Waalen, J. K. (2001). The effect of hypermedia instruction on achievement and attitudes of students with different learning styles. Proceedings of the 2001 American Society for Engineering Education Annual Conference and Exposition, 49-56.

13
Appendix
Estimate Standard Error t Stat P-valueIntercept 50.4148 3.8348 13.1470 <2.00E-16 ***Attendance 5.0194 1.1419 4.3960 1.58E-05 ***Pre.Assessment 0.0456 0.0448 1.0160 0.3107Post.Assessment 0.2951 0.0407 7.2460 4.27E-12 ***ACT/REF Neutral -0.1508 1.2452 -0.1210 0.9037REF 1.8089 1.7762 1.0180 0.3094SEN/INT Neutral 0.0113 1.9980 0.0060 0.9955SEN -1.0600 2.0384 -0.5200 0.6034VER 3.6732 2.2156 1.6580 0.0985 .VIS 0.4381 1.2187 0.3590 0.7195SEQ/GLO Neutral 2.5745 2.0961 1.2280 0.2204SEQ 2.5352 2.3088 1.0980 0.2731Residual standard error: 9.187 on 277 degrees of freedom *** significant at 0.001Multiple R-Squared: 0.2866, Adjusted R-squared: 0.2583 ** significant at 0.01F-statistic: 10.12 on 11 and 277 DF, p-value: 1.726e-15 * significant at 0.05
. significant at 0.1
Estimate Standard Error t Stat P-valueIntercept 29.6024 5.3978 5.4840 9.36E-08 ***Attendance 3.7268 1.6073 2.3190 0.0211 *Pre.Assessment 0.1577 0.0631 2.4980 0.0131 *Post.Assessment 0.3860 0.0573 6.7330 9.54E-11 ***ACT/REF Neutral 2.6681 1.7527 1.5220 0.1291REF 5.4480 2.5002 2.1790 0.0302 *SEN/INT Neutral -0.3404 2.8123 -0.1210 0.9038SEN -2.9688 2.8692 -1.0350 0.3017VER 5.7474 3.1186 1.8430 0.0664VIS 0.7770 1.7155 0.4530 0.6510SEQ/GLO Neutral 3.9300 2.9504 1.3320 0.1839SEQ 4.1598 3.2498 1.2800 0.2016Residual standard error: 12.93 on 277 degrees of freedom *** significant at 0.001Multiple R-Squared: 0.2826, Adjusted R-squared: 0.2541 ** significant at 0.01F-statistic: 9.92 on 11 and 277 DF, p-value: 3.509e-15 * significant at 0.05
. significant at 0.1
Estimate Standard Error t Stat P-valueIntercept 64.4361 3.9821 16.1810 <2e-16 ***Attendance 8.0864 1.1858 6.8200 5.72E-11 ***Pre.Assessment 0.0272 0.0466 0.5830 0.56014Post.Assessment 0.1216 0.0423 2.8750 0.00436 **ACT/REF Neutral -0.2108 1.2930 -0.1630 0.87059REF -1.0524 1.8445 -0.5710 0.56878SEN/INT Neutral 3.1364 2.0747 1.5120 0.13174SEN 1.8430 2.1167 0.8710 0.38466VER 1.2603 2.3007 0.5480 0.58426VIS 0.9852 1.2656 0.7780 0.43695SEQ/GLO Neutral 3.6733 2.1766 1.6880 0.09261 .SEQ 4.1421 2.3975 1.7280 0.08516 .Residual standard error: 9.54 on 277 degrees of freedom *** significant at 0.001Multiple R-Squared: 0.2188, Adjusted R-squared: 0.1878 ** significant at 0.01F-statistic: 7.055 on 11 and 277 DF, p-value: 1.522e-10 * significant at 0.05
. significant at 0.1
OLS Regression Results for Course Average
OLS Regression Results for Exam Average
OLS Regression Results for Quiz Average

14
Estimate Standard Error t Stat P-valueIntercept 79.1115 2.8491 27.7670 <2e-16 ***Attendance 1.8944 0.8484 2.2330 0.0263 *Pre.Assessment 0.0216 0.0333 0.6480 0.5175Post.Assessment 0.0514 0.0303 1.6990 0.0904ACT/REF Neutral 0.0724 0.9251 0.0780 0.9377REF 0.9296 1.3197 0.7040 0.4817SEN/INT Neutral 0.6132 1.4844 0.4130 0.6799SEN 1.1608 1.5144 0.7670 0.4440VER 1.1090 1.6461 0.6740 0.5011VIS 0.4508 0.9055 0.4980 0.6190SEQ/GLO Neutral 0.7296 1.5573 0.4680 0.6398SEQ 0.3628 1.7153 0.2120 0.8326Residual standard error: 6.825 on 277 degrees of freedom *** significant at 0.001Multiple R-Squared: 0.05004, Adjusted R-squared: 0.01231 ** significant at 0.01F-statistic: 1.326 on 11 and 277 DF, p-value: 0.2092 * significant at 0.05
. significant at 0.1
Estimate Standard Error t Stat P-valueIntercept 16.9245 4.7245 3.5820 0.0004 ***Attendance 2.5727 1.9352 1.3290 1.85E-01ACT/REF Neutral 2.2006 2.1121 1.0420 0.2984REF -5.1636 3.0026 -1.7200 0.0866SEN/INT Neutral 1.6639 3.4326 0.4850 0.6282SEN 2.9563 3.4987 0.8450 0.3988VER 5.7940 3.7857 1.5300 0.1270VIS 0.9348 2.0920 0.4470 0.6553SEQ/GLO Neutral -7.6886 3.5732 -2.1520 0.0323 *SEQ -7.7918 3.9250 -1.9850 0.0481 *Residual standard error: 15.79 on 279 degrees of freedom *** significant at 0.001Multiple R-Squared: 0.05298, Adjusted R-squared: 0.02243 ** significant at 0.01F-statistic: 1.734 on 9 and 279 DF, p-value: 0.0811 * significant at 0.05
. significant at 0.1
Estimate Standard Error t Stat P-valueIntercept 62.5373 4.2929 14.5680 <2.00E-16 ***Attendance 4.884 1.7584 2.7770 0.0059 **ACT/REF Neutral 5.0427 1.9191 2.6280 0.0091 **REF 2.4542 2.7283 0.9000 0.3691SEN/INT Neutral 0.4779 3.1190 0.1530 0.8784SEN 1.0083 3.1791 0.3170 0.7514VER 5.9835 3.4398 1.7390 0.0831 .VIS -0.5686 1.9009 -0.2990 0.7651SEQ/GLO Neutral -4.8026 3.2468 -1.4790 0.1402SEQ -8.6425 3.5665 -2.4230 0.0160 *Residual standard error: 14.35 on 279 degrees of freedom *** significant at 0.001Multiple R-Squared: 0.0823, Adjusted R-squared: 0.0527 ** significant at 0.01F-statistic: 2.78 on 9 and 279 DF, p-value: 0.003908 * significant at 0.05
. significant at 0.1
OLS Regression Results for Project Average
OLS Regression Results for Pre/Post Difference Average
OLS Regression Results for Post-Assessment Average