the effect of low-temperature blanching on the quality of...
TRANSCRIPT

1
The effect of low-temperature blanching on the quality of fresh and frozen/thawed mashed potatoes
Cristina Fernández,1 M. Dolores Alvarez
1* & Wenceslao Canet
1
1 Department of Plant Foods Science and Technology, Instituto del Frío-CSIC, José de Novaís nº 10, E-28040
Madrid, Spain
Running title
LTB effect on quality of mashed potatoes C. Fernández et al.
*Correspondent: Fax: +34 91 549 36 27;
e-mail: [email protected]
2
Summary The effect of low-temperature blanching (LTB) prior to cooking on colour, textural, firmness and
oscillatory parameters, sensory attributes and overall acceptability of either fresh or frozen/thawed mashed potatoes
was studied using Response Surface Methodology (RSM) to establish the optimum temperature and time for
blanching in both types of mashed potatoes. A central composite rotatable design was used to study the effects of
variation in levels of blanching temperature (57.93-72.07 °C) and time (15.86-44.14 min) on the quality parameters.
Stationary points showing maximum thickening had critical temperatures (approximately 67-69 °C) and times
(approximately 26-30 min) in the ranges of temperature and time used for each independent variable for both fresh
and frozen/thawed mashed potato. Results showed a high correlation between structural reinforcement and overall
acceptability under optimum experimental blanching conditions. This demonstrates the potential of this experimental
approach in terms of tailoring physical properties to predetermined levels in order to meet consumer preferences in
mashed potatoes, and of altering the changes that occur after freezing and thawing.
Keywords Preheating, potato puree, freezing, thawing, overall acceptability, response surface methodology,
cryoprotectants, pectin methylesterase enzyme.

3
Introduction
In the catering industry, mashed potato is prepared either directly from potatoes or by
reconstituting dehydrated potato granules and flakes. The two major factors that determine a
caterer’s choice of mashed potato are cost and consumer preference. Consumer preference is
influenced by a combination of flavour, texture and appearance (Canet et al., 2005a). Novais et al
(1982) reported that flavour and texture contributed significantly to overall preference (64-68 and
32-36 per cent, respectively) of five mashed potato products.
Pre-treatments can have a great effect, particularly on the texture of the final potato product.
The Add-Back process used in the manufacture of dehydrated instant mashed potato granules
includes an essential pre-preparation stage consisting of precooking the potato at 70 °C for 20
min and cooling in water prior to steam cooking (Moledina et al., 1978). This serves to render the
cell wall less degradable by cooking (Bartolome & Hoff, 1972), thereby enabling the potato cells
to withstand the forces generated by compression, mixing and rubbing during the continuous
mash-mixing stage. Another technique, a low-temperature blanching (LTB) process has been
reported by numerous authors, offering a promising approach to increasing firmness retention in
processed potato. The literature gives different optimum blanching conditions for different potato-
processing operations. Brown & Morales (1970), recommended 80 C for 15 min for low-
temperature blanching followed by 95 C for 1 min for the blanching of potatoes prior to frying.
Canet et al. (1982) compared blanching at 100 °C for 2 min of cylindrical potato specimens with
both one-step blanching at 80 C for 6 min and stepwise blanching at 50, 60, 70 C for 10 min,
followed by cooling and a second step at 100 °C for 2 min; they concluded that LTB at 60 and 70 C
for 10 min clearly improved the texture of frozen potatoes when cooked. It has recently been shown

4
that LTB of potatoes (cv. Kennebec), both without further processing and prior to cooking or
freezing and cooking, significantly increased firmness retention as measured from compression
parameters, demonstrating a high correlation between pectin methylesterase (PME) activity and
tissue firmness (Canet et al., 2005b).
The effect of freezing temperature (-80, -40, -24 °C) and thawing mode (microwave,
overnight at 4 °C) on quality parameters of mashed potato made from tubers (cv. Kennebec) and
potato flakes was examined by Alvarez et al. (2005). In freshly-made mashed potato, processing
resulted in a softer product than the fresh control according to texture profile analysis (TPA)
hardness and oscillatory parameters. In the same way, freezing reduced the storage modulus (G’),
loss modulus (G”) and complex viscosity (*) values of mashed potatoes made from dehydrated
flakes, measured at 20 °C, compared with freshly-made product. At this temperature, mashed
potatoes made from frozen/thawed flakes consisted of dilute dispersions of swollen and disrupted
intracellular starch granules (Alvarez & Canet, 1999a). Changes in the viscoelastic properties of
fruit and vegetable purees that have undergone freezing or freeze-thaw treatments are of practical
significance for acceptance and consumption. One way of minimising damage from freezing and
thawing is to incorporate cryoprotectants to alter crystal shapes. Recent studies have described
the effect of individual and mixed hydrocolloids on the quality of frozen and thawed cooked
potato purées (Downey, 2002, 2003).
Previous studies have shown that of various different potato varieties, Kennebec was the most
suitable for producing fresh mashed potatoes of consistent quality (Alvarez et al., 2004; Canet et
al., 2005a), and that freezing and thawing processes reduced most of the quality parameters
measured in the product. However, LTB of potatoes (cv. Kennebec) prior to freezing and cooking
significantly increased firmness retention (Canet et al., 2005b). The next step, and hence the

5
purpose of the present research, was to investigate how mashed potato quality is affected by low-
temperature blanching (LTB) applied prior to cooking without further processing, and prior to
cooking, followed by the freezing and thawing of the samples. A second objective, based on the
results, was, using response surface methodology (RSM), to find the optimum blanching
temperature and time to improve the quality and overall acceptability of fresh and frozen-and-
thawed mashed potato.
Material and methods
Test material
Data presented in this report were obtained using potato tubers (Solanum tuberosum, L., cv.
Kennebec) from Galicia (Spain). The material was stored in a chamber at 4 °C and 85% relative
humidity (Smith, 1987).
Low-temperature blanching (LTB)
Tubers were washed and peeled manually. Cylindrical specimens 12 mm in diameter and 10 mm
in height were cut from potato tubers using a stainless-steel cork borer and a mechanically guided
razor blade specially designed for this diameter (Gil, 1991). Cylindrical specimens were extracted
from the central region of each tuber approximately 10 mm below the skin of each slice to avoid
the large differences in texture reported to exist between the cortex and pith tissues due to the
different size and shape of the cells (Anzaldúa-Morales et al., 1992). Blanching was carried out at
6
the different combinations of temperature and time given by a central composite rotatable design
(Table 1), with blanching temperature ranging between 60 and 70 °C and blanching time ranging
between 20 and 40 min, by placing the potato cylinders in a Hetofrig CB60VS (Heto Lab
Equipment A/S, Birkerd, Denmark) waterbath (-30 to +110 °C) with a constant product
weight:water volume ratio of 1:20. Water and specimen temperatures were monitored by T-type
thermocouples (NiCr/NiAl; -200 °C to +1000 °C) using a hardware and software system
developed with the LabWindows/CVI package (National Instruments Spain S.L., Madrid, Spain)
for automation of the thermal process control (Rico et al., 1995). After blanching, specimens
were cooled in cold water for 10 min.
Preparation of mashed potatoes
After blanching, mashed potatoes were prepared in 650-g batches from 395 g of cylindrical
potato specimens, 150 mL of milk, 100 mL of water and 5 g salt using a thermal mixer TM 21
(Vorwerk España M.S.L., S.C., Madrid, Spain). The ingredients were cooked for 20 min at 100
°C (blade speed: 100 rpm), and the amount of liquid evaporated during boiling was determined
by weighing the ingredients before and after boiling. The evaporated liquid was then replaced by
to an equal weight of boiling water, and the ingredients were again cooked at 100 °C for 5 min.
The mash was immediately ground for 40 s (blade speed: 2000 rpm). The product was
immediately homogenised through a stainless steel sieve (diameter 1.5 mm). In this study, two
samples of mashed potato were used as controls. The first control was prepared directly as
indicated above but without prior blanching. The second control was likewise prepared without
blanching, but in this case modified waxy cornstarch C*Polar Tex 06716 (high amylopectin,

7
cross-linked, di-starch phosphate) (Cerestar Ibérica, S.L.), was diluted in the 250 mL of water and
milk and added to the rest of the ingredients before cooking. Range finding experiments were
performed to ascertain the maximum acceptable amount of starch that could be added to the
mashed potato without appreciable sensory changes in colour and taste. On this basis, the
maximum acceptable level of starch use was established at 0.5% (w/w).
Following preparation, half of each mashed potato sample was immediately analysed and the
other half was packed in polyethylene plastic, sealed under light vacuum (-0.05 MPa) on a
Multivac packing machine (Sepp Haggenmüller KG, Wolfertschwenden, Germany), and frozen
and thawed according to the freezing and thawing procedures indicated below. Large thin packs
were made so as to minimise the differences in freezing and thawing rates between mashed potato
at the surface and deep within the pack.
Freezing and thawing procedures
Mashed potato was frozen by forced convection with liquid nitrogen vapour in an Instron
programmable chamber (model 3119-05, -70C/+250C) at -60 C until their thermal centres
reached – 24 C (Alvarez et al., 1997). Air and product temperatures were monitored by T-type
thermocouples (NiCr/NiAl; -200 to +1000 °C) using the MMS3000 Multi Measurement
System (Mod. T4, Commtest Instruments, New Zealand). The software permitted real-time data
gathering and storage and also the calculation of the freezing rate (-2 0.10 °C min-1
). After
freezing, the samples were placed in a domestic freezer for storage at –24 °C and left there for 7d
before thawing. For the microwave thawing process, the frozen mashed samples were unpacked,
immediately placed in flat microwave trays and then thawed in a Samsung M1712N (Samsung
8
Electronics S.A., Madrid, Spain) microwave oven. In all cases the samples were placed in the
same position and irradiated for a total of 20 minutes with output power ratings of 600 W. The
power setting was 100%. Thawing was conducted in two steps. Initially, the samples were
irradiated for 15 minutes, then removed from the microwave and stirred gently (shear rate 10 s-
1) with a spoon for 1 min to equilibrate the sample temperature. Next, the samples were placed in
the microwave again and irradiated for an additional 5 min under the same conditions. After this
procedure, the temperature reached by the thermal centre of the product was measured in all cases
(+50 5 °C) (Alvarez et al., 2005).
Heating of samples
All the fresh and frozen/thawed samples were allowed to reach 55 °C by placing them in the
Hetofrig CB60VS (Heto Lab Equipment A/S, Birkerd, Denmark) waterbath, where again water
and product temperatures were monitored by T-type thermocouples using the hardware and
software system described above (Rico et al., 1995). The selected sample testing temperature
was 55 °C, since results from different analyses showed that this is the preferred temperature for
consumption of mashed potato (Alvarez et al., 2004; Canet et al., 2005a).
Colour
The colour of the mashed potato samples in the pots was measured using a HunterLab model D25
(Reston, Virginia, USA) colour difference meter fitted with a 5 cm diameter aperture fitted with a
5 cm diameter aperture. Measurements were performed in triplicate and the results averaged.

9
Results were expressed in L*a*b* scale, where L* indicates the lightness, a* represents the
green-red colour axis and b* the blue-yellow axis, recommended by the International
Commission on Illumination (CIE, 1978). Colour was also expressed as L*/b*, i.e. the
white/yellow ratio (O’Leary et al., 2000; Redmond et al., 2002).
Dry matter
Determinations were made by drying in an oven at 75 °C for 18 h. Samples were weighed using a
Mettler AJ 100 (Mettler Instruments AG, Zurich, Switzerland) analytical scales, accurate to
0.00001 g. The initial weight of each sample was approximately 10 g. Measurements were
performed in triplicate and the results averaged.
Instrumental objective texture measurements
Texture profile analysis and firmness tests were carried out with a TA.HDi Texture Analyser
(Stable Micro Systems Ltd, Godalming, UK) using a 250 N load cell and the application program
provided with the apparatus (Texture Expert for WindowsTM
, version 2. 61). During the tests, the
mashed potato samples were maintained at 55 °C by means of a Temperature Controlled Peltier
Cabinet (XT/PC) coupled to a separate heat exchanger and PID control unit (Canet et al., 2005a).
For TPA tests, a flat 35-mm diameter aluminium plunger (SMS P/35) was used to move within a
60-mm diameter stainless steel cylinder containing 50 1 g of mashed potatoes. The Texture
Analyser was programmed so that the downward movement began at a point 8 mm above the
surface of the sample. The following experimental conditions were selected for each TPA test:

10
deformation rate (180 mm min-1
), compression level (33.3 %), with a rest period of 5 s between
cycles. There were four replicates for each experimental unit. The program software (Texture
Expert for Windows, version 1.0; Stable Micro Systems, Surrey, England) automatically
calculates the textural parameters from the curve generated by such a test, as follows: hardness
(N) is given as the first force peak if there are only two peaks on the TPA curve, or the second
peak if there are three peaks. Adhesiveness (N s) is the negative area between the point at which
the first curve reaches a zero force value after the first compression and the start of the second
curve. Springiness is calculated as the ratio of the distance or time from the start of the second
area up to the second probe reversal vs. the distance or time between the start of the first area and
the first probe reversal. Cohesiveness is calculated as the ratio of the positive force area during
the second compression portion to the positive force area during the first compression.
Gumminess (N) is calculated as hardness x cohesiveness. For performing the firmness tests, a
spreadability rig was used, consisting of a 45 ° conical perspex probe (P/45 C) that penetrated a
conical sample holder containing 7 0.1 g of mashed potato. Tests were done at a deformation rate
of 180 mm min-1
. There were four replicates for each experimental unit. The force time curve was
used to calculate the firmness (N), the area under the force/time curve (N s), the firmness per
gram of product (N g-1
), the area under the curve per displaced volume (N s mm-3
) and the
average force (N).
Oscillatory rheological measurements
A Bohlin (Bohlin Instruments Ltd, Gloucestershire, UK) CVR 50 controlled stress rheometer was
used to conduct small amplitude oscillatory shear experiments (SAOS) and steady shear using a

11
plate-plate sensor system with a 2 mm gap (PP40, 40 mm) and a solvent trap to minimise
moisture loss during tests. Samples were allowed to relax for 5 min before rheological
measurements were made, such as equilibration time for recovery and development of sample
structure after loading the same on the sensor system. Temperature control at 55 °C was achieved
with a Peltier Plate system (-40 to +180 °C) (Bohlin Instruments Ltd, Gloucestershire, UK).
Dynamic shear data were obtained over the range 0.1-100 rads-1
at very low strains. The applied
strains were dependent on product types but were mostly below 10-3
. The linear viscoelastic
domain was determined for each sample from stress sweeps at 1 rads-1
. In preliminary
experiments, the effects of three frequencies, 0.1, 1, and 10 rads-1
, on the linear viscoelastic
domain were investigated; there was little apparent difference in the domains obtained at these
three frequencies. Bohlin software was used to obtain experimental data and to calculate the
phase angle (), the complex modulus (G*), the storage modulus (G’), the loss modulus (G”) and
the complex viscosity (*) at each test frequency (Alvarez et al., 2004).
Sensory analysis
Sensory TPA was done by a five-member panel trained specifically in sensory analysis of mashed
potato. The Texture Profile system (UNE 87025, 1996) was modified to evaluate frozen mashed
vegetables (Canet et al., 2005a). Scores for sensory attributes were based on a 9-point descriptive
intensity scale converted to a 1-9 numerical scale for statistical analysis, with 1 = not detectable
and 9 = extremely intense. Profile attributes are classified in four groups: attributes perceived
before putting the sample in the mouth (granularity and moisture); attributes perceived at the time
of putting the sample in the mouth (adhesiveness, denseness, homogeneity, moisture and

12
firmness); attributes perceived at the time of preparing the sample in the mouth for swallowing
(cohesiveness, adhesiveness, fibrousness); attributes perceived during final and residual phases of
mastication (ease of swallowing, palate coating and fibrousness). Mashed potato samples were
also subjected to an overall acceptability test based on all sensory attributes (texture, colour,
taste), on a 9-point hedonic scale (9 = like extremely, 1 = dislike extremely).
Experimental design and data analysis
The effect of the temperature and time of LTB on the quality of both fresh and frozen/thawed
mashed potato was studied using Response Surface Methodology (RSM), which made it possible
to establish optimum LTB temperature and time conditions so as to produce mashed potato with
different optimum quality parameters. The upper and lower levels of the two factors LTB
temperature and LTB time were initially based on published information from potatoes
(Moledina et al., 1978; Alvarez & Canet, 1999b; Canet et al., 2005b). A first series of
experiments was conducted following the central composite rotatable experimental design, with
blanching temperature ranging between 55 and 65 °C and blanching time ranging between 50 and
80 min as independent variables, based on previous findings (Canet et al., 2005b), although the
results have been omitted for the sake of brevity. Statgraphics
software version 5.0 (STSC Inc.,
Rockville, MD, USA) was used to provide the experimental designs, calculate equations, do
statistical evaluation and print out data. A central composite rotatable experimental design was
used with blanching temperature ranging between 60 and 70 °C and blanching time ranging
between 20 and 40 min as independent variables (Table 1). In the design, coded variables are
related to uncoded ones by equations: X1=(1-a)/b and X2=(2-c)/d, where X1, X2, 1 and 2 are

13
temperature and time variables in coded and uncoded mode respectively; a, c are the central
points of the uncoded temperature and time ranges studies (65 °C and 30 min, respectively); b, d
are calculated as the difference between the mentioned central points and the upper and lower
conditions of the uncoded temperature and time ranges studies (5 °C and 10 min, respectively).
The design required 13 variable combinations that were performed in random order, including 5
replicates of the centre region to generate a quadratic response surface (Myers & Montgomery,
1995; Alvarez & Canet, 1999b; Alvarez et al., 1999). In both fresh and frozen/thawed mashed
potato, each treatment combination was repeated twice and all the results averaged. Range
finding experiments were performed at the outset of this work in order to ascertain what
blanching temperature and time ranges could be applied to the mashed potatoes so that the
product would be acceptable to consumers on the basis of sensory attributes (texture, colour, and
taste).
The following dependent variables (responses) were analysed by RSM: TPA, firmness,
oscillatory parameters, L*/b* ratio from colour measurements and overall acceptability. Data
were analysed for coefficient of determination (R2) value, probability, lack-of-fit test, and
regression coefficients (b0, b1, b2, b11, b22 and b12). The relationship between the dependent and
independent variables was expressed in terms of a second order polynomial equation having the
form:
Y = b0 + b1X1 + b2X2 + b11 X12 + b22 X2
2 + b12 X1 X2
where Y = response, X1 = temperature of blanching (°C), X2 = time of blanching (min) and b0, b1,
b2, b12, b2
2, b12 = coefficients (constants) which measure linear, quadratic and interaction effects
(Sim et al., 2004). The optimum ranges for the two factors tested (temperature and time of
blanching) were interpreted from response surfaces. The stationary points of X1 and X2

14
respectively, which give the optimum response, were calculated, as well as the value of the
estimated response at this stationary point (Myers & Montgomery, 1995). For both fresh and
frozen/thawed mashed potato, the differences in instrumental and sensory parameters for the
different blanching temperature/time conditions of the central composite design and controls were
studied prior to optimisation by means of one-way analysis of variance, using the least significant
difference tests with a 99% confidence interval for comparison of instrumental parameters and
with a 95% confidence interval for comparison of sensory attributes.
Results and discussion
Instrumental parameters
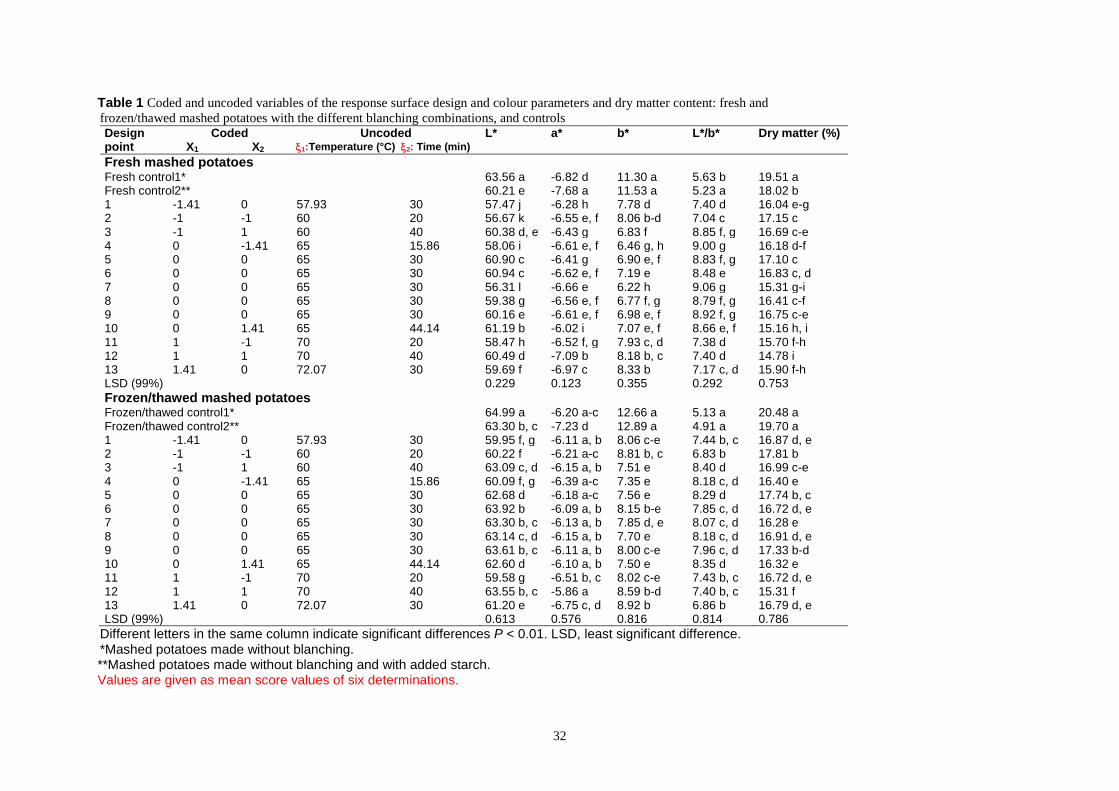
Data were compiled for low-temperature blanching (LTB) combinations and mean values of the
corresponding colour parameters and dry matter content of the fresh and frozen/thawed-mashed
potato are shown in the Table 1. Unblanched samples and unblanched samples with added starch
were treated as controls. LTB conditions significantly affected all the measured parameters
(P<0.001) in both the fresh and the frozen/thawed-mashed potatoes. In general, in fresh mashed
potato most of the blanching temperature and time conditions reduced the L* (lightness), a*
(redness) and b* (yellowness) values but increased the L*/b* ratio of the samples with respect to
the controls. Thus, LTB prior to cooking produced a lighter-coloured mashed potato (higher
L*/b* ratio) than cooking alone; this was to be expected given that LTB causes sizeable losses of
colour related to (Pala, 1983). Colour is often the first parameter by which a consumer judges a
food product before purchase (Faulks & Griffths, 1983). However, this lightening should not be
15
of major importance, since anyone presented with a blanched mashed potato is unlikely to have
an unblanched fresh sample to compare it against. In frozen-thawed mashed potato (Table 1),
blanching also significantly increased the L*/b* ratio of the product with respect to frozen-
thawed controls, but the ratios in the blanched fresh and blanched frozen/thawed samples were
quite similar. In natural and commercial mashed potato, L*/b* values were lower than in the fresh
controls after freezing and thawing of the samples, so that frozen-thawed were darker than fresh
products (Alvarez et al., 2005). Also, frozen mashed potato made from reconstituted potato flakes
was darker than non-frozen mashed potato (O’Leary et al., 2000). The results indicate that
blanching prior to cooking had a positive effect in that it reduced the differences in brightness
between fresh and frozen-thawed unblanched mashed potato. Addition of starch to fresh
unblanched mashed potato caused samples to darken (lower L*/b* ratio), although differences
were not detected after freezing and thawing.
In both fresh and frozen/thawed mashed potato, dry matter percentages were lower in the
blanched samples than in the corresponding controls. Blanching is known to increase the
permeability of cytoplasmic membranes, allowing the blanch water to penetrate cells and
intercellular spaces, driving out gases and other volatile compounds (Canet & Hill, 1987),
causing losses of soluble substances such as vitamins, salts and sugars, and increasing the
moisture content of the samples. In general terms, dry matter contents were lower in the fresh
than in their counterpart frozen/thawed mashed potatoes in both the blanched and the control
samples, confirming previous findings (Downey, 2003; Alvarez et al., 2005). Ice crystal growth
leads to contraction and disruption of starch granules, while cell wall disruption leads to a
redistribution of amylose and amylopectin leading to local concentration differences. The locally
concentrated amylopectin is prone to molecular aggregation leading to shrinkage and water

16
expulsion (Kim & Eliasson, 1993). Addition of starch to fresh control increased moisture content,
which could be explained simply in terms of starch’s ability to immobilize free water, but after
freezing and thawing, the differences in the dry matter percentages between both controls were
non-significant.
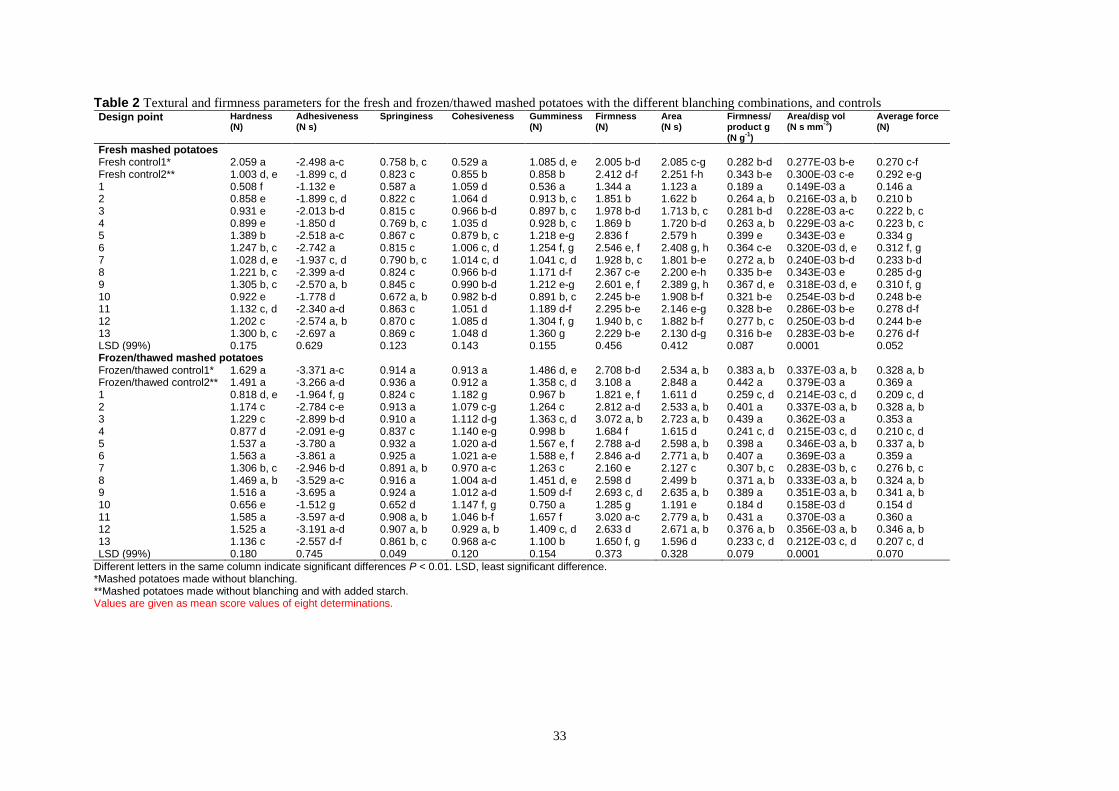
In both fresh and frozen/thawed mashed potatoes, blanching temperature and time
significantly (P<0.001) affected all the TPA and firmness parameters (Table 2). For the fresh and
frozen/thawed blanched mashed potato, high TPA and firmness parameters were recorded at the
replicated centre points (65 °C, 30 min), as well as at the design points 11, 12 and 13, for which
the blanching temperature was >65 °C. Note, as in both fresh and frozen/thawed blanched
mashed potato most of the parameter values at the replicated design point 7 were lower than at
the other replicated points. When blanching temperature was <65 °C, the parameter values were
lower than those obtained in the unblanched controls, showing that blanching under certain
conditions caused softening of the mashed potato. In contrast, for both fresh and frozen/thawed
blanched mashed potato, TPA (except hardness) and firmness parameters recorded at four of the
replicated centre points were higher than in the controls: thus, blanching at 65 °C for 30 min had
the effect of thickening mashed potatoes. The results indicate that in mashed potato prepared
directly, after blanching under certain conditions the cell walls were stronger than those of the
cooked cells without the pre-treatment, where solubilisation was more complete; moreover, this
effect was detected even after freezing and thawing of the samples. In any case, the differences
between blanched and control samples were not statistically significant for most of the parameters
in the frozen/thawed-mashed potato, which means that subsequent freezing and thawing of the
samples masked differences between blanched and unblanched mashed potatoes. Comparison of
the two unblanched controls shows that the addition of starch to fresh product significantly
17
reduced hardness and gumminess values, and increased all other parameters, although the only
parameter that differed significantly between the controls was. Also, addition of carrageenan to
fresh potato purées increased maximum resistance values i.e. thickened the purée (Downey,
2002). After freezing and thawing of the unblanched samples, all the firmness parameters in the
samples with starch added were again higher, although the controls only differed significantly in
firmness parameters. Also, parameter values were higher in the frozen/thawed control with added
starch than in its fresh counterpart. On the other hand, addition of different cryoprotectants (whey
protein concentrate, sodium caseinate, guar and xanthan) to fresh mashed potato reduced the
maximum resistance after freezing by two different methods (Downey, 2002); this could have
been due to the higher freezing rate used in this study. Finally, in both controls and in all the
blanched samples, TPA (except hardness) and firmness parameters were higher in the
frozen/thawed mashed potatoes than in their fresh counterparts.
In both fresh and frozen/thawed mashed potatoes, blanching temperature and time
significantly (P<0.001) affected all the oscillatory parameters (Table 3). For the fresh and
frozen/thawed blanched mashed potato, the lowest phase angle and the highest modulus and
complex viscosity values were recorded in the blanched samples at the replicated centre points
(65 °C, 30 min) and in the blanched samples at temperature >65 °C. Dynamic measurements also
revealed the thickening effect produced by blanching at 65 °C for 30 min, chiefly in many of the
repeated replicates (design points 5 and 9). Mechanistic models for this phenomenon have often
centred on the activation of the PME enzyme. What the enzyme does is to demethylate the
carboxymethyl groups of pectic polysaccharide chains. The decrease in the degree of methylation
may in turn trigger different processes related to texture and firmness, such as crosslinking by
Ca2+
ions, increased hydration at the demethylated sites, reduced susceptibility for heat induced
18
-degradation of pectins and enhanced shielding and repulsion forces by the electric charges
within the biopolymer matrix of the cell walls. Recently, Canet et al., (2005b) found a high
correlation between increased PME activity and firmness retention in the optimisation of low-
temperature blanching applied prior to freezing and cooking of potato tissues (cv. Kennebec),
proving that the enzyme was one of the main contributors to firmness of frozen potatoes. Based on
these findings, it appears obvious that the reinforcement detected by the instrumental parameters
and caused in the cell walls of the potato cells by blanching at 65 °C for 30 min could be ascribed
to PME enzyme activation rendering the cell binding less degradable.
A comparison of the two unblanched controls (Table 3) shows that in both fresh and
frozen/thawed mashed potato, the addition of starch significantly reduced the moduli and the
complex viscosity of the samples. However, in all the blanched and unblanched samples,
oscillatory parameters were higher in the fresh mashed potatoes than in their frozen/thawed
counterparts. However, as noted earlier, all the other TPA and firmness parameters were higher in
the frozen/thawed than in the fresh samples, and it therefore seems obvious that different
parameters are detecting different compositional and structural changes caused by processing
during the manufacture of mashed potato. While the texture of edible tissue is usually conferred
by the cell wall and its middle lamella, and is affected by changes in cell adhesion and pectin
degradation, in macerates the apparent viscosity is affected by cell friction rather than cell
adhesion (Shomer et al., 1993). While firmness parameters, together with adhesiveness,
springiness, cohesiveness and gumminess from texture profile analysis, seem to measure cell
adhesion in the mashed potatoes, oscillatory parameters and hardness could measure the
intercellular friction, which was less after freezing even at a very rapid rate, in spite of blanching
prior to cooking.

19
Sensory analysis
Tables 4 and 5 show the effect of blanching temperature and time on the panellists’ average
scores for sensory attributes from texture profile analysis and overall acceptability in comparison
with fresh and frozen/thawed controls. LTB conditions significantly affected all the sensory
attributes scored (P<0.01), either in fresh or in frozen/thawed-mashed potato. For fresh product,
practically no significant differences were found for granularity and moistness scores between
controls and blanched samples at the replicated centre points (65 °C, 30 min). For frozen/thawed
product, granularity increased significantly and moisture decreased significantly with respect to
unblanched control after blanching at 65 °C for 30 min. Panellists also detected lower granularity
and higher moisture in fresh mashed potato; this confirmed the results from dry matter data and
indicated a negative effect caused by freezing and thawing which rendered granularity more
appreciable and dried the samples. For fresh mashed potato, again there were practically no
significant differences in the scores between controls and pre-treated samples (65 °C, 30 min) for
sensory attributes perceived at the time of putting the sample in the mouth. For frozen/thawed
mashed potato, moisture decreased significantly, again corroborating results from dry matter
sample contents, and firmness increased significantly with respect to unblanched control after
blanching at 65 °C for 30 min. In both fresh and frozen/thawed mashed potato, some significant
differences were observed between scores given to controls and pre-treated samples (65 °C, 30
min) for sensory attributes perceived at the time of preparing the sample for swallowing. The
chief point of note is that the score for cohesiveness and adhesiveness was higher in the
frozen/thawed samples, which was consistent with values obtained for instrumental parameters
under the same conditions. For fresh product, there were significant differences in the scores for
20
fibrousness assigned to controls and to samples pre-treated at 65 °C for 30 min (Table 5), with
higher attribute scores going to the latter. For frozen/thawed mashed potato, differences in the
scores for ease of swallowing and palate coating were significant, the samples blanched at 65 °C
for 30 min scoring lower for ease of swallowing and higher for palate coating than the
unblanched control.
Finally, for fresh mashed potato the panellists scored the samples blanched at 65 °C, 30-min
significantly lower for overall acceptability than the unblanched controls. Of the blanched
samples, panellists scored the samples blanched at 70 °C, 20-min (design point 11) highest for
overall acceptability; this was not significantly different from the scores of the control samples.
For frozen/thawed mashed potato, of the blanched samples panellists scored the samples blanched
at 70 °C, 20-min and 72 °C, 30-min (design points 11 and 13) highest for overall acceptability;
again, this score was not significantly different from the score of the unblanched frozen/thawed
control 1 without added starch. Panellists scored the frozen/thawed samples blanched at 65 °C,
30-min significantly lower for overall acceptability than the unblanched control 1 (except for one
of the replicated points), although scores were not significantly different from the control 2 with
added starch. Interestingly, scores for overall acceptability were higher in the frozen/thawed
blanched mashed potatoes than in their fresh counterparts, highlighting the potential of pre-
cooking blanching to improve the quality of mashed potato that is subjected to freezing and
thawing.
Optimisation of blanching conditions
21
Based on the results of the first statistical analysis, RSM was used to find the optimum
temperature and time of blanching prior to cooking for L*/b* ratio, TPA, firmness, oscillatory
parameters and overall acceptability in the fresh and frozen/thawed mashed potato. Regression
coefficients of each response model fitted were tested for significance and are presented in Table
6, together with their coefficients of determination, R2, F-Ratios and P-values and lack-of-fit
tests. Response models of instrumental parameters which gave R2-values < 0.750 have been
omitted, since these models showed very low percentages of explained variability, indicating a
significant lack of fit (Henika, 1982). In both fresh and frozen/thawed mashed potatoes, L*/b*
ratio models had significant linear and quadratic terms for temperature (b1 and b11 respectively), a
significant linear term for time (b2), and the interaction was significant in both models (b12). For
this colour parameter, R2-values were good (> 0.750), but the L*/b* model fitted for the fresh
product had a significant lack-of-fit test. In fresh mashed potato for TPA parameters, independent
variables had approximately the same effect on hardness and gumminess, with a significant linear
term for temperature (b1) and significant quadratic terms for temperature and time (b11 and b22
respectively). R2-values were good (> 0.750) for both TPA parameters, with no significant lack-
of-fit tests. For firmness parameters, independent variables also had the same effect on the area,
area per displaced volume and average force measured in the fresh product, with only slightly
significant linear and quadratic terms for temperature, similar quite low R2-values (approximately
0.750), but non-significant lack-of-fit tests. In fresh mashed potato, oscillatory parameters were
linearly affected by variations in blanching temperature and quadratically affected by variations
in both independent variables. Loss modulus (G”) was also linearly affected by variations in
blanching time. The R2-values are good for all the oscillatory parameters (> 0.750) with no
significant lack-of-fit test for the rheological parameters. Of all the TPA and firmness parameters

22
in the frozen/thawed mashed potato, only the response model fitted for cohesiveness is shown,
with a significant linear term for temperature, significant quadratic terms for temperature and
time and significant interaction of the two factors. Response models for the rest of the TPA
parameters and all the firmness parameters gave R2-values < 0.750, and therefore have been
omitted from the Table 6. The R2-value for cohesiveness model was good (> 0.750), but the lack-
of-fit test for this response was significant. As found for fresh mashed potato, independent
variables more significantly affected oscillatory parameters, which were linearly affected by
variations in blanching temperature and quadratically affected by variations in both independent
variables. Except for loss modulus (G”), all the other oscillatory parameters were also slightly
and linearly affected by variations in time. Again, the R2-values are good for all the oscillatory
parameters (> 0.750), with no significant lack-of-fit test for the rheological parameters.
Finally, in fresh mashed potato, overall acceptability was linearly affected by variations in
blanching temperature and time and quadratically affected by variations in both independent
variables. The R2-value was very good (> 0.850), but there was a significant lack-of-fit test.
Models with high R2-values and significant lack-of-fit tests indicate that higher-order models are
probably required to describe the effects of the independent variables and would be used only for
trends analysis (Henika, 1982; Alvarez et al., 1999b). In frozen/thawed mashed potato, overall
acceptability was linearly affected by variations in blanching temperature and time and
quadratically affected by variations in blanching time. For overall acceptability of the
frozen/thawed product, the R2-value was the highest (> 0.980), with no significant lack-of-fit test.
Only models with high percentages of explained variability (R2
> 0.850) and non-significant lack-
of-fit tests would be considered sufficiently accurate to make predictions (Henika, 1982).
Between models fitted in this study, only L*/b* ratio and overall acceptability models in the

23
frozen/thawed product definitely fulfil both conditions. Most of models fitted had R2-values in the
range (0.750 < R2
< 0.850). Among the common causes of poor modelling are a skewed response
distribution, curvature in the relationship between a response variable and a design factor, large
between-replicate variation and outlying experiments (Downey, 2003). Examination of the
standardised residuals produced by the models showed no outlying experimental points, while
ANOVA demonstrated the significance of the fitted regression models. The large between-
replicate variation is the most likely cause of the poor modelling found, since all the parameter
values were lower at design point 7 than at the rest of the replicated points. Stepwise regression
analysis was performed for the dependent variables. This analysis eliminates the insignificant
coefficients on the basis of P-values, then the models can be reduced. However, reduced models
did not present higher R2-values and, therefore the full models fitted were used for further
analysis in order to be able to obtain stationary points. The fact that blanching temperature and
time had a quadratic effect on most of the parameters indicated the existence of an optimum
region for both independent variables, and the aim was to test the closeness or distance of the
optimum responses obtained from the different dependent variables. In this way, the best fitted
models were used in both fresh and frozen/thawed mashed potato to generate surface responses to
identify the main effects of blanching temperature and time (Figs 1-3). In LTB for fresh mashed
potato, L*/b* ratio (Fig. 1a), gumminess (Fig. 1b), average force (Fig. 1c), complex viscosity
(Fig. 1d) and overall acceptability (Fig. 3a), and in LTB for frozen/thawed mashed potato
cohesiveness (Fig. 2b), loss modulus (Fig. 2c) and complex viscosity (Fig. 2d), all increased with
temperature and time up to certain levels beyond which both variables decreased, thus defining an
optimum region. For the frozen/thawed product, response surface L*/b* ratio (Fig. 2a) presents a
saddle-effect, thus identifying a set of blanching temperature and time values which will produce

24
the maximum lightening. From the shape of the plots (Fig. 3a, b) it seems reasonable to assume a
relationship between increase in overall acceptability and firmer texture and structure in the
mashed potato, indicating that a firmer product represents a quality gain and is a desired goal.
This finding contradicts previous studies, where a reduction in maximum resistance values in
potato purée represented a product with a softer mouth-feel and was reported by sensory
panellists as desirable (Downey, 2002).
Values (stationary points) which give optimum combinations for each quality parameter were
calculated (Table 7). In fresh mashed potato, the critical values of average force showing
maximum firmness, complex viscosity showing maximum thickening and overall acceptability
showing maximum preference for the product lay in the region delimited by the ranges studied;
they were close to 70 °C and 30 min for average force and complex viscosity and close to 70 °C
and 20 min for overall acceptability. In frozen/thawed mashed potato also, the critical values of
stationary points for L*/b* showing the lightest product and for loss modulus and complex
viscosity showing maximum thickening were close to 70 °C and 30 min. One or both critical
values were outside the region delimited by the range studied, for L*/b* ratio and gumminess in
the fresh product and for cohesiveness and overall acceptability in the frozen/thawed product, and
therefore the response given by these models at stationary points was not estimated. Blanching at
70 °C for 25 min further tested the accuracy of the models for the quality parameters (Table 8),
arriving at a compromise solution between stationary points for textural and rheological
parameters and overall acceptability. Predicted values for the models were closer to experimental
values for the fresh mashed potatoes than for the frozen/thawed-mashed potatoes. In any event it
should be stressed that the predictive ability of the models developed for most of the parameters is
poor, and therefore they should not be used for predictive purposes. In both fresh and

25
frozen/thawed mashed potatoes, models fitted for complex viscosity (*) presented high R2, non-
significant lack-of-fit tests and a small gap between experimental and predicted values; this may
therefore be considered the most suitable parameter for representing the rheological behaviour of
fresh and frozen/thawed mashed potato subjected to LTB prior to cooking.
Conclusions
LTB prior to cooking produced a lighter fresh or frozen/thawed mashed potato than cooking
alone, but reduced differences in brightness between fresh and frozen/thawed mashed potato.
Addition of starch to fresh mashed potato caused darkening of the samples and increased their
moisture content, although differences were not significant after freezing and thawing. Dry matter
contents were lower in the fresh than in their counterpart frozen/thawed mashed potatoes in both
blanched and control samples. Results of the different instrumental parameters indicated that in
both fresh and frozen/thawed-mashed potato, blanching at < 65 °C produced a softening of the
product with respect to the unblanched controls, while blanching at 65 °C for 30 min had the
effect of thickening the mashed potatoes, which could be the result of PME enzyme activation
rendering the cell binding less degradable. Scores for overall acceptability were higher in the
frozen/thawed blanched mashed potatoes than in their fresh counterparts, highlighting the
potential of blanching to improve the quality of mashed potatoes that are subjected to freezing
and thawing. Stationary points for instrumental parameters showing maximum thickening had
critical temperatures (approximately 67-69 °C) and times (approximately 26-30 min) in the ranges
used for each independent variable for both fresh and frozen/thawed mashed potato. The results
showed a very high correlation between structural reinforcement and overall acceptability in

26
optimum experimental blanching conditions. For fresh and frozen/thawed mashed potato the
panellists scored the samples blanched at 65 °C, 30-min significantly lower for overall
acceptability than the unblanched controls, possible due to excessive thickening. From our point
of view, it would be a quality gain and a desirable goal to make mashed potatoes which, after
freezing and thawing and even after a long term in frozen storage, scored as well as fresh control
for overall acceptability. It is clearly important to obtain information on the effects of blanching
prior to cooking, whether applied alone or in combination with cryoprotectant treatments, in
mashed potatoes frozen/thawed by different methods. This approach (LTB prior to cooking) may
have potential for designing mashed potatoes with specified colour and texture depending on their
following treatment.

27
Acknowledgements The authors wish to thank to the Ministerio de Educación y Ciencia for financial support
(AGL2004-01780)

28
References
Alvarez, M.D., Canet, W. & Tortosa, M.E. (1997). Effect of freezing rate and programmed freezing on rheological
parameters and tissue structure of potato (cv. Monalisa). Lebensmittel-Untersuchung und-Forschung A, 204, 356-
364.
Alvarez, M.D. & Canet, W. (1999a). Rheological properties of mashed potatoes made from dehydrated flakes: effect
of ingredients and freezing. European Food Research and Technology, 209, 335-342.
Alvarez , M.D. & Canet, W. (1999b). Optimization of stepwise blanching of frozen-thawed potato tissues (cv.
Monalisa). European Food Research and Technology, 210, 102-108.
Alvarez, M.D., Morillo M.J. & Canet, W. (1999). Optimisation of freezing process with pressure steaming of potato
tissues (cv. Monalisa). Journal of the Science of Food and Agriculture, 79, 1237-1248.
Alvarez, M.D., Fernández, C. & Canet, W. (2004). Rheological behaviour of fresh and frozen potato puree in steady
and dynamic shear at different temperatures. European Food Research and Technology, 218, 544-553.
Alvarez, M.D., Canet, W. & Fernández, C. (2005). Effect of freezing/thawing conditions and long-term frozen
storage on the quality of mashed potatoes. Journal of the Science of Food and Agriculture (in press).
Anzaldúa-Morales, A., Bourne, M.C. & Shomer, I. (1992). Cultivar, specific-gravity and location in tuber affect
puncture force of raw potatoes. Journal of Food Science, 57, 1353-1356.
Bartolome, L.G. & Hoff, J.E. (1972). Firming of potatoes: biochemical effect of preheating. Journal of Agricultural
and Food Chemistry, 20, 266-270.
Brown, A.M. & Morales, J.A.W. (1970). Determination of blanching conditions for frozen parfried potatoes.
American Potato Journal, 47, 321-325.
Canet, W., Espinosa, J. & Ruiz Altisent, M. (1982). Effects of stepwise blanching on the texture of frozen potatoes
measured by mechanical tests. In Refrigeration Science and Technology (edited by International Institute of
Refrigeration). Vol. 4, Pp 284-289, Sofia, Bulgaria.
Canet, W. & Hill, M. (1987). A comparison of several blanching methods on the texture and ascorbic acid content of
frozen potatoes. International Journal of Food Science and Technology, 22, 273-277.

29
Canet, W., Alvarez, M.D., Fernández, C. & Tortosa M.E. (2005a). The effect of sample temperature on instrumental
and sensory properties of mashed potato products. International Journal of Food Science and Technology, 40,
481-493.
Canet, W., Alvarez, M.D. & Fernández, C. (2005b). Optimization of low-temperature blanching for retention of
potato firmness: effect of previous storage on compression properties. European Food Research and
Technology, 221, 423-433.
CIE. (1978). Recommendations on uniform colour spaces-colour difference equations, psychometric colour terms.
Supplement No. 2 to CIE Publication No. 15(E-1-3.1) 1971/(TC-1-3). CIE, Paris.
Downey, G. (2002). Quality changes in frozen and thawed, cooked puréed vegetables containing hydrocolloids,
gums and dairy powders. International Journal of Food Science and Technology, 37, 869-877.
Downey, G. (2003). Effects of cryoprotectant mixtures on physical properties of frozen and thawed puréed cooked
potatoes: some introductory studies. International Journal of Food Science and Technology, 38, 857-868.
Faulks, R.M. & Griffths, N.M. (1983). Influence of variety, site and storage on the physical, sensory and compositional
aspects of mashed potato. Journal of the Science of Food and Agriculture, 34, 979-986.
Gil, M.J. (1991). Estudio del efecto de la fricción, dimensión de las muestras y velocidades de deformación en
ensayos de compresión uniaxial de alimentos sólidos. PhD Thesis, Universidad Politécnica de Madrid
Henika, R.G. (1982). Use of response surface methodology in sensory evaluation. Food Technology, 36, 96.
Kim, H.R. & Eliasson, A.-C. (1993). Changes in rheological properties of hydroxypropyl potato starch paste during
freeze-thaw treatments. II. Effect of molar substitution and cross-linking and thermal (DSC) properties. Journal
of Texture Studies, 24, 199-213.
Moledina, K.H., Fedec, P., Hadziyev, D. & Ooraikul, B. (1978). Ultrastructural changes in potato during potato
granule process as viewed by SEM. Starch/Stärke, 30, 191-199.
Myers, R.H. & Montgomery, D.C. (1995). Response surface methodology. John Wiley & Sons, Inc., New York
Novais, A., Hanson, S.W. & Ryley, J. (1982). The texture of mashed potatoes in catering I. The background. The
contribution of hedonic texture to overall preference. Lebensmittel-Wissenschaft und-Technologie, 15, 295-302.
O’Leary, E., Gormley, T.R., Butler, F. & Shilton, N. (2000). The effect of freeze-chilling on the quality of ready-
meal components. Lebensmittel-Wissenschaft und-Technologie, 33, 217-224.

30
Pala, M. (1983). Stepwise blanching and its importance in freezing of vegetables. In Refrigeration in the service of
man. XVIth International Congress of Refrigeration. Paris. Vol. 3, pp 631-638.
Redmond, G.A., Butler, F. & Gormley, T.R. (2002). The effect of freezing conditions on the quality of freeze-chilled
reconstituted mashed potato. Lebensmittel-Wissenschaft und-Technologie, 35, 201-204.
Rico, R., Alvarez, M.D. & Canet, W. (1995). Sistema de adquisición y análisis de datos. Eurofach Electrónica, 18, 60-
65.
Shomer, I.,Rao, M.A., Bourne, M.C. & Levy, D. (1993). Impact of temperature and cellulose treatments on
rheological behavior of potato tuber cell suspensions. Journal of the Science of Food and Agriculture, 63,
245-250.
Sim, C.W., Muhammad, K., Yusof, S., Bakar, J. & Hashim, D.M. (2004). The optimization of conditions for the
production of acid-hydrolysed winged bean and soybean proteins with reduction of 3-monochloropropane-1,2-
diol (3-MCPD). International Journal of Food Science and Technology, 39, 947-958.
Smith, O. (1987). Transport and storage of potatoes. In: Potato processing (edited by W. F. Talburt & O. Smith). Pp
203-285. New York: Van Nostrand Reinhold.
UNE 87025 (1996). Manual de análisis sensorial. Tomo I – Alimentación. Pp. 167-186. Madrid: Aenor.

31
Figure legends
Figure 1 Instrumental parameter response surfaces as functions of blanching temperature and time for fresh mashed
potato: (a) L*/b* ratio from colour measurement; (b) gumminess from TPA test; (c) average force from firmness test;
(d) complex viscosity from oscillatory rheological test.
Figure 2 Instrumental parameter response surfaces as functions of blanching temperature and time for frozen/thawed
mashed potato: (a) L*/b* ratio from colour measurement; (b) cohesiveness from TPA test; (c) loss modulus from
oscillatory rheological test; (d) complex viscosity from oscillatory rheological test.
Figure 3 Overall acceptability response surfaces as functions of blanching temperature and time: (a) for fresh
mashed potato; (b) for frozen/thawed mashed potato.
32
Table 1 Coded and uncoded variables of the response surface design and colour parameters and dry matter content: fresh and
frozen/thawed mashed potatoes with the different blanching combinations, and controls Design point
Coded X1 X2
Uncoded 1:Temperature (°C) 2: Time (min)
L* a* b* L*/b* Dry matter (%)
Fresh mashed potatoes
Fresh control1* 63.56 a -6.82 d 11.30 a 5.63 b 19.51 a Fresh control2** 60.21 e -7.68 a 11.53 a 5.23 a 18.02 b 1 -1.41 0 57.93 30 57.47 j -6.28 h 7.78 d 7.40 d 16.04 e-g 2 -1 -1 60 20 56.67 k -6.55 e, f 8.06 b-d 7.04 c 17.15 c 3 -1 1 60 40 60.38 d, e -6.43 g 6.83 f 8.85 f, g 16.69 c-e 4 0 -1.41 65 15.86 58.06 i -6.61 e, f 6.46 g, h 9.00 g 16.18 d-f 5 0 0 65 30 60.90 c -6.41 g 6.90 e, f 8.83 f, g 17.10 c 6 0 0 65 30 60.94 c -6.62 e, f 7.19 e 8.48 e 16.83 c, d 7 0 0 65 30 56.31 l -6.66 e 6.22 h 9.06 g 15.31 g-i 8 0 0 65 30 59.38 g -6.56 e, f 6.77 f, g 8.79 f, g 16.41 c-f 9 0 0 65 30 60.16 e -6.61 e, f 6.98 e, f 8.92 f, g 16.75 c-e 10 0 1.41 65 44.14 61.19 b -6.02 i 7.07 e, f 8.66 e, f 15.16 h, i 11 1 -1 70 20 58.47 h -6.52 f, g 7.93 c, d 7.38 d 15.70 f-h 12 1 1 70 40 60.49 d -7.09 b 8.18 b, c 7.40 d 14.78 i 13 1.41 0 72.07 30 59.69 f -6.97 c 8.33 b 7.17 c, d 15.90 f-h LSD (99%) 0.229 0.123 0.355 0.292 0.753
Frozen/thawed mashed potatoes
Frozen/thawed control1* 64.99 a -6.20 a-c 12.66 a 5.13 a 20.48 a Frozen/thawed control2** 63.30 b, c -7.23 d 12.89 a 4.91 a 19.70 a 1 -1.41 0 57.93 30 59.95 f, g -6.11 a, b 8.06 c-e 7.44 b, c 16.87 d, e 2 -1 -1 60 20 60.22 f -6.21 a-c 8.81 b, c 6.83 b 17.81 b 3 -1 1 60 40 63.09 c, d -6.15 a, b 7.51 e 8.40 d 16.99 c-e 4 0 -1.41 65 15.86 60.09 f, g -6.39 a-c 7.35 e 8.18 c, d 16.40 e 5 0 0 65 30 62.68 d -6.18 a-c 7.56 e 8.29 d 17.74 b, c 6 0 0 65 30 63.92 b -6.09 a, b 8.15 b-e 7.85 c, d 16.72 d, e 7 0 0 65 30 63.30 b, c -6.13 a, b 7.85 d, e 8.07 c, d 16.28 e 8 0 0 65 30 63.14 c, d -6.15 a, b 7.70 e 8.18 c, d 16.91 d, e 9 0 0 65 30 63.61 b, c -6.11 a, b 8.00 c-e 7.96 c, d 17.33 b-d 10 0 1.41 65 44.14 62.60 d -6.10 a, b 7.50 e 8.35 d 16.32 e 11 1 -1 70 20 59.58 g -6.51 b, c 8.02 c-e 7.43 b, c 16.72 d, e 12 1 1 70 40 63.55 b, c -5.86 a 8.59 b-d 7.40 b, c 15.31 f 13 1.41 0 72.07 30 61.20 e -6.75 c, d 8.92 b 6.86 b 16.79 d, e LSD (99%) 0.613 0.576 0.816 0.814 0.786
Different letters in the same column indicate significant differences P < 0.01. LSD, least significant difference. *Mashed potatoes made without blanching.
**Mashed potatoes made without blanching and with added starch. Values are given as mean score values of six determinations.
33
Table 2 Textural and firmness parameters for the fresh and frozen/thawed mashed potatoes with the different blanching combinations, and controls Design point Hardness
(N) Adhesiveness (N s)
Springiness Cohesiveness Gumminess (N)
Firmness (N)
Area (N s)
Firmness/ product g (N g
-1)
Area/disp vol (N s mm
-3)
Average force (N)
Fresh mashed potatoes Fresh control1* 2.059 a -2.498 a-c 0.758 b, c 0.529 a 1.085 d, e 2.005 b-d 2.085 c-g 0.282 b-d 0.277E-03 b-e 0.270 c-f Fresh control2** 1.003 d, e -1.899 c, d 0.823 c 0.855 b 0.858 b 2.412 d-f 2.251 f-h 0.343 b-e 0.300E-03 c-e 0.292 e-g 1 0.508 f -1.132 e 0.587 a 1.059 d 0.536 a 1.344 a 1.123 a 0.189 a 0.149E-03 a 0.146 a 2 0.858 e -1.899 c, d 0.822 c 1.064 d 0.913 b, c 1.851 b 1.622 b 0.264 a, b 0.216E-03 a, b 0.210 b 3 0.931 e -2.013 b-d 0.815 c 0.966 b-d 0.897 b, c 1.978 b-d 1.713 b, c 0.281 b-d 0.228E-03 a-c 0.222 b, c 4 0.899 e -1.850 d 0.769 b, c 1.035 d 0.928 b, c 1.869 b 1.720 b-d 0.263 a, b 0.229E-03 a-c 0.223 b, c 5 1.389 b -2.518 a-c 0.867 c 0.879 b, c 1.218 e-g 2.836 f 2.579 h 0.399 e 0.343E-03 e 0.334 g 6 1.247 b, c -2.742 a 0.815 c 1.006 c, d 1.254 f, g 2.546 e, f 2.408 g, h 0.364 c-e 0.320E-03 d, e 0.312 f, g 7 1.028 d, e -1.937 c, d 0.790 b, c 1.014 c, d 1.041 c, d 1.928 b, c 1.801 b-e 0.272 a, b 0.240E-03 b-d 0.233 b-d 8 1.221 b, c -2.399 a-d 0.824 c 0.966 b-d 1.171 d-f 2.367 c-e 2.200 e-h 0.335 b-e 0.343E-03 e 0.285 d-g 9 1.305 b, c -2.570 a, b 0.845 c 0.990 b-d 1.212 e-g 2.601 e, f 2.389 g, h 0.367 d, e 0.318E-03 d, e 0.310 f, g 10 0.922 e -1.778 d 0.672 a, b 0.982 b-d 0.891 b, c 2.245 b-e 1.908 b-f 0.321 b-e 0.254E-03 b-d 0.248 b-e 11 1.132 c, d -2.340 a-d 0.863 c 1.051 d 1.189 d-f 2.295 b-e 2.146 e-g 0.328 b-e 0.286E-03 b-e 0.278 d-f 12 1.202 c -2.574 a, b 0.870 c 1.085 d 1.304 f, g 1.940 b, c 1.882 b-f 0.277 b, c 0.250E-03 b-d 0.244 b-e 13 1.300 b, c -2.697 a 0.869 c 1.048 d 1.360 g 2.229 b-e 2.130 d-g 0.316 b-e 0.283E-03 b-e 0.276 d-f LSD (99%) 0.175 0.629 0.123 0.143 0.155 0.456 0.412 0.087 0.0001 0.052 Frozen/thawed mashed potatoes Frozen/thawed control1* 1.629 a -3.371 a-c 0.914 a 0.913 a 1.486 d, e 2.708 b-d 2.534 a, b 0.383 a, b 0.337E-03 a, b 0.328 a, b Frozen/thawed control2** 1.491 a -3.266 a-d 0.936 a 0.912 a 1.358 c, d 3.108 a 2.848 a 0.442 a 0.379E-03 a 0.369 a 1 0.818 d, e -1.964 f, g 0.824 c 1.182 g 0.967 b 1.821 e, f 1.611 d 0.259 c, d 0.214E-03 c, d 0.209 c, d 2 1.174 c -2.784 c-e 0.913 a 1.079 c-g 1.264 c 2.812 a-d 2.533 a, b 0.401 a 0.337E-03 a, b 0.328 a, b 3 1.229 c -2.899 b-d 0.910 a 1.112 d-g 1.363 c, d 3.072 a, b 2.723 a, b 0.439 a 0.362E-03 a 0.353 a 4 0.877 d -2.091 e-g 0.837 c 1.140 e-g 0.998 b 1.684 f 1.615 d 0.241 c, d 0.215E-03 c, d 0.210 c, d 5 1.537 a -3.780 a 0.932 a 1.020 a-d 1.567 e, f 2.788 a-d 2.598 a, b 0.398 a 0.346E-03 a, b 0.337 a, b 6 1.563 a -3.861 a 0.925 a 1.021 a-e 1.588 e, f 2.846 a-d 2.771 a, b 0.407 a 0.369E-03 a 0.359 a 7 1.306 b, c -2.946 b-d 0.891 a, b 0.970 a-c 1.263 c 2.160 e 2.127 c 0.307 b, c 0.283E-03 b, c 0.276 b, c 8 1.469 a, b -3.529 a-c 0.916 a 1.004 a-d 1.451 d, e 2.598 d 2.499 b 0.371 a, b 0.333E-03 a, b 0.324 a, b 9 1.516 a -3.695 a 0.924 a 1.012 a-d 1.509 d-f 2.693 c, d 2.635 a, b 0.389 a 0.351E-03 a, b 0.341 a, b 10 0.656 e -1.512 g 0.652 d 1.147 f, g 0.750 a 1.285 g 1.191 e 0.184 d 0.158E-03 d 0.154 d 11 1.585 a -3.597 a-d 0.908 a, b 1.046 b-f 1.657 f 3.020 a-c 2.779 a, b 0.431 a 0.370E-03 a 0.360 a 12 1.525 a -3.191 a-d 0.907 a, b 0.929 a, b 1.409 c, d 2.633 d 2.671 a, b 0.376 a, b 0.356E-03 a, b 0.346 a, b 13 1.136 c -2.557 d-f 0.861 b, c 0.968 a-c 1.100 b 1.650 f, g 1.596 d 0.233 c, d 0.212E-03 c, d 0.207 c, d LSD (99%) 0.180 0.745 0.049 0.120 0.154 0.373 0.328 0.079 0.0001 0.070
Different letters in the same column indicate significant differences P < 0.01. LSD, least significant difference. *Mashed potatoes made without blanching. **Mashed potatoes made without blanching and with added starch. Values are given as mean score values of eight determinations.

34
Table 3 Oscillatory parameters for the fresh and frozen/thawed mashed potatoes with the different blanching combinations, and controls Design point Phase angle
(°)
Complex modulus G* (Pa)
Storage modulus G' (Pa)
Loss modulus G'' (Pa)
Complex viscosity
* (Pas)
Fresh mashed potatoes Fresh control1* 11.567 a, b 4856.900 f, g 4758.567 f, g 972.273 c-e 4576.533 f-h Fresh control2** 14.033 b, c 3092.500 c 3000.233 c 749.160 b 2918.067 c, d 1 23.833 e 976.543 a 891.690 a 396.257 a 919.997 a 2 15.500 c, d 3089.100 c 2975.733 c 827.947 b, c 2902.633 c, d 3 15.467 c, d 2750.633 c 2650.933 c 733.567 b 2594.333 c 4 13.500 a-c 3675.267 d 3573.100 d 855.710 b-d 3474.467 d, e 5 13.233 a-c 4244.133 e 4130.233 e 967.990 c-e 4010.200 e, f 6 10.700 a 5746.700 h 5647.067 h 1064.733 e 5417.867 i 7 12.133 a, b 4525.233 e, f 4424.733 e, f 946.053 c-e 4279.633 f, g 8 12.022 a, b 4838.688 f, g 4734.011 f, g 992.925 d, e 4569.233 f-h 9 12.627 a-c 5292.694 g, h 5190.539 g, h 1028.829 e 4993.550 h, i 10 17.400 d 1631.800 b 1558.067 b 480.537 a 1546.500 b 11 12.133 a, b 4736.800 f 4631.100 f 994.423 d, e 4470.933 f-h 12 11.400 a, b 4912.833 f, g 4815.867 f, g 970.700 c-e 4638.767 g, h 13 12.333 a, b 4920.167 f, g 4806.700 f, g 1049.163 e 4643.667 g, h LSD (99%) 3.114 473.045 473.616 162.269 574.966 Frozen/thawed mashed potatoes
Frozen/thawed control1* 12.900 b, c 3900.667 b-d 3801.133 b-d 872.353 a 3678.000 b-d Frozen/thawed control2** 12.900 b, c 2785.867 f 2715.600 f 621.657 c 2622.000 e 1 15.000 a 1436.133 h 1387.300 h 371.303 e 1351.867 g 2 11.933 c, d 2805.333 f 2744.467 f 580.950 c, d 2645.033 e 3 11.800 c-e 2696.033 f 2638.700 f 551.487 c, d 2541.867 e 4 10.600 d-g 3116.433 e, f 3063.467 e, f 571.660 c, d 2935.633 e 5 11.633 c-f 4368.200 a, b 4278.533 a, b 879.900 a 4113.633 a, b 6 10.400 e-g 4629.067 a 4552.633 a 837.503 a 4355.933 a 7 10.333 f, g 3682.800 d 3622.700 c, d 660.673 b, c 3475.167 d 8 10.789 d-g 4226.689 a, b 4151.289 a-c 792.692 a, b 3981.578 a-c 9 10.561 d-g 4427.878 a, b 4351.961 a 836.296 a 4168.755 a 10 14.000 a, b 2012.333 g 1952.400 g 487.203 d, e 1899.367 f 11 11.433 d-f 4432.767 a, b 4344.833 a 878.447 a 4178.533 a 12 9.767 g 3769.867 c, d 3715.133 c, d 639.957 c 3569.000 c, d 13 10.733 d-g 3647.100 d, e 3583.300 d, e 677.923 b, c 3440.100 d LSD (99%) 1.426 541.577 532.172 132.399 461.332
Different letters in the same column indicate significant differences P < 0.01. LSD, least significant difference. *Mashed potatoes made without blanching. **Mashed potatoes made without blanching and with added starch. Values are given as mean score values of six determinations.

35
Table 4 Sensory attributes perceived before and at the time of putting the sample in the mouth, and at the time of preparing the sample for swallowing, for fresh and frozen/thawed mashed potatoes with the different blanching combinations, and controls Sensory attributes Perceived before putting
the sample in the mouth Perceived at the time of putting the sample in the mouth Perceived at the time of preparing the sample
for swallowing
Design point Granularity Moisture Adhesiveness Denseness Homogeneity Moisture Firmness Cohesiveness Adhesiveness Fibrousness
Fresh mashed potatoes Fresh Control1* 1.62 a 5.52 b 5.05 b, c 6.37 d, e 9.00 a 5.22 b-d 6.67 c-f 5.85 b-d 5.47 b-e 1.37 a Fresh control2** 1.70 a, b 5.02 b-d 6.22 d, e 6.00 c, d 8.65 a, b 5.32 b, c 6.15 c, d 5.35 b, c 4.60 b 1.35 a 1 1.70 a, b 7.97 a 3.10 a 2.92 a 7.77 b 7.87 a 2.65 a 2.90 a 3.17 a 2.52 c, d 2 2.27 a-c 4.97 b-d 7.42 f, g 4.67 b 8.15 a, b 4.55 d-f 5.05 b 6.35 c-e 8.32 h 2.20 a-d 3 2.85 c, d 5.52 b 6.62 d-f 5.92 c, d 8.15 a, b 4.75 c-e 6.70 d-f 5.67 b, c 6.97 f, g 3.02 c 4 2.17 a-c 5.47 b 5.70 b-d 5.75 c 8.62 a, b 5.32 b, c 6.12 c, d 5.42 b, c 5.90 c-f 2.25 a-d 5 2.32 b, c 3.80 e 6.90 e-g 7.85 f 8.47 a, b 3.87 f, g 7.72 f, g 7.35 e 6.97 f, g 2.60 c, d 6 2.15 a, b 5.55 b 5.87 c, d 7.17 e, f 8.57 a, b 5.37 b, c 7.82 g 5.70 b, c 6.12 c-f 2.32 a-d 7 1.82 a, b 5.32 b 4.82 b 5.62 b, c 8.20 a, b 5.67 b 6.60 c-e 6.07 b-d 5.10 b, c 2.10 a-c 8 2.10 a, b 4.89 b-d 5.82 c, d 6.88 d-f 8.41 a, b 4.97 b-e 7.38 e-g 6.37 c-e 6.06 c-f 2.33 b-d 9 2.21 a-c 4.34 c-e 6.38 d, e 7.36 e, f 8.45 a, b 4.42 e-g 7.55 e-g 6.86 d, e 6.52 e-g 2.47 b-d 10 3.52 d 5.35 b 6.25 d, e 5.67 b, c 6.57 c 2.90 h 5.62 b, c 5.55 b, c 5.40 b-d 3.97 d 11 2.00 a, b 5.42 b 6.35 d, e 5.82 c, d 8.57 a, b 5.30 b, c 7.07 d-g 6.90 d, e 6.42 d-g 1.65 a, b 12 2.27 a-c 4.05 d, e 7.60 g 7.47 f 8.27 a, b 3.75 g 7.82 g 7.37 e 7.27 g, h 2.32 a-d 13 1.77 a, b 5.15 b, c 5.80 c, d 6.00 c, d 8.92 a, b 5.15 b-e 6.27 c, d 5.00 b 4.57 b 1.82 a-c LSD (95%) 0.69 0.98 0.93 1.06 0.92 0.74 1.07 1.14 1.12 0.87 Frozen/thawed mashed potatoes
Frozen/thawed control1* 1.52 a 6.42 b 7.35 a-d 7.77 a-c 8.60 a, b 6.22 b 7.80 b-e 6.22 b, c 6.22 c-e 1.60 a, b Frozen/thawed control2** 1.85 a 2.37 f 8.07 a 8.15 a, b 8.22 a, b 2.50 f, g 8.32 a-c 7.77 a 7.37 a-c 1.80 a, b 1 3.25 b, c 3.37 e, f 6.77 b-d 6.97 c 8.17 a, b 4.07 d, e 7.25 d-f 6.37 a-c 6.50 c, d 2.30 a-c 2 3.27 b, c 3.00 e, f 8.55 a 7.52 a-c 8.05 b 3.15 e, f 7.95 a-d 7.12 a-c 7.77 a, b 2.27 a-c 3 6.32 f 2.60 f 7.92 a, b 7.45 b, c 5.72 c 1.87 g 7.47 c-e 7.32 a, b 7.42 a-c 2.90 c, d 4 2.57 a, b 4.82 c, d 5.30 e, f 5.65 d 8.32 a, b 4.10 d, e 6.55 f, g 6.55 a-c 6.90 b-d 2.27 a-c 5 5.40 e, f 2.70 f 8.40 a 8.52 a 8.50 a, b 3.15 e, f 8.72 a 7.60 a, b 8.42 a 2.10 a-c 6 4.77 d, e 3.37 e, f 7.82 a, b 7.80 a-c 8.87 a, b 3.60 e, f 8.05 a-d 6.92 a-c 6.65 b-d 2.20 a-c 7 4.02 c, d 4.02 d, e 6.07 d-f 7.57 a-c 8.95 a, b 3.67 e 7.60 b-e 6.67 a-c 6.85 b-d 2.90 c, d 8 4.75 d, e 3.37 e, f 7.45 a-c 7.95 a-c 8.77 a, b 3.47 e, f 8.12 a-d 7.00 a-c 7.87 a, b 2.40 b, c 9 4.37 c-e 3.00 e, f 7.90 a, b 7.87 a-c 8.65 a, b 3.30 e, f 8.42 a, b 7.30 a, b 7.30 a-c 2.25 a-c 10 4.15 c, d 7.90 a 4.00 g 3.72 e 5.57 c 8.10 a 4.05 h 3.35 d 4.17 g 3.45 d 11 1.75 a 4.05 d, e 6.40 c-e 7.75 a-c 9.00 a 4.80 c, d 7.77 b-e 6.70 a-c 5.75 d-f 1.55 a, b 12 2.22 a, b 4.75 c, d 4.80 f, g 5.77 d 8.35 a, b 5.35 b, c 6.92 e, f 6.72 a-c 4.67 f, g 2.27 a-c 13 1.60 a 5.32 b, c 4.97 f, g 5.55 d 9.00 a 5.40 b, c 5.92 g 5.65 c 5.22 e-g 1.37 a LSD (95%) 1.14 1.23 1.28 1.01 0.86 1.02 0.92 1.53 1.27 0.97
Different letters in the same column indicate significant differences P < 0.05. LSD, least significant difference. *Mashed potatoes made without blanching. **Mashed potatoes made without blanching and with added starch. Values are given as mean score values of ten determinations.

36
Table 5 Sensory attributes perceived during the final and residual phases of mastication and overall acceptability
for the fresh and frozen/thawed mashed potatoes with the different blanching combinations, and controls
Sensory attributes Perceived during the final and residual phases of mastication Overall acceptability Design point Ease of swallowing Palate coating Fibrousness
Fresh mashed potatoes Fresh Control1* 8.77 a 2.42 a-d 1.32 a 9.00 a Fresh control2** 8.60 a, b 2.05 a-c 1.35 a, b 8.32 a, b 1 4.12 e 3.05 d 2.15 b-d 3.47 h 2 7.85 a-c 2.00 a, b 1.90 a-d 7.35 c-e 3 7.22 c, d 5.47 e 3.12 e 4.45 g 4 8.35 a, b 2.80 b-d 2.25 c, d 7.37 c-e 5 8.20 a, b 2.65 a-d 2.40 d, e 6.95 e, f 6 8.25 a, b 2.52 a-d 2.27 c, d 7.25 d, e 7 8.42 a, b 2.75 a-d 2.60 d, e 7.47 b-e 8 8.29 a, b 2.64 a-d 2.42 d, e 7.22 d, e 9 8.24 a, b 2.64 a-d 2.41 d, e 7.35 c-e 10 6.70 d 4.90 e 4.15 f 4.27 g, h 11 8.62 a, b 1.90 a 1.40 a, b 8.25 a-c 12 7.72 b, c 2.87 c, d 2.10 a-d 6.10 f 13 8.20 a, b 1.90 a 1.52 a-c 7.97 b-d LSD (95%) 0.94 0.87 0.81 0.92 Frozen/thawed mashed potatoes
Frozen/thawed control1* 9.00 a 1.65 a 1.37 a 8.95 a Frozen/thawed control2** 8.02 a-d 2.32 a 2.15 b 7.50 c-e 1 8.00 a-d 2.20 a 1.97 a, b 7.25 c-e 2 8.15 a-c 4.97 b, c 2.00 a, b 7.02 d-f 3 4.70 f 6.22 d, e 2.97 c 4.32 g 4 7.92 a-d 4.40 b 2.10 a, b 6.77 e, f 5 6.75 d, e 5.30 b-d 2.00 a, b 7.50 c-e 6 8.37 a, b 6.85 e 1.90 a, b 8.00 b, c 7 6.97 c-e 4.82 b, c 1.80 a, b 8.12 a-c 8 7.35 b-d 5.67 c-e 1.90 a, b 7.87 b-d 9 7.86 a-d 5.25 b-d 1.95 a, b 8.00 b, c 10 6.02 e 4.65 b, c 3.15 c 3.37 h 11 8.77 a 2.02 a 1.37 a 8.62 a, b 12 7.35 b-d 2.42 a 2.05 a, b 6.32 f 13 8.72 a 1.90 a 1.37 a 8.62 a, b LSD (95%) 1.32 1.19 0.74 0.91
Different letters in the same column indicate significant differences P < 0.05. LSD, least significant difference. *Mashed potatoes made without blanching. **Mashed potatoes made without blanching and with added starch. Values are given as mean score values of ten determinations.

37
Table 6 Regression coefficients, coefficient of determination (R2) and analysis of variance of the quadratic models for colour, TPA, firmness, oscillatory parameters and overall acceptability
of fresh and frozen/thawed mashed potatoes at the design response surface Coefficient
L*/b* ratio
Hardness (N)
Cohesiveness Gumminess (N)
Area (N s)
Area/disp vol (N s mm
-3)
Average force (N)
Complex modulus G* (Pa)
Storage modulus G’ (Pa)
Loss modulus G” (Pa)
Complex viscosity
* (Pa s)
Overall accept-ability
Fresh mashed potatoes b0 8.816 1.238 - 1.179 2.275 3.128E-4 0.295 4929.490 4825.320 1000.110 4654.100 7.248 b1 -0.179* 0.208** - 0.231*** 0.265* 3.519E-5* 0.034* 1173.380*** 1169.320*** 165.870*** 1109.850*** 1.114*** b2 0.169* 0.022 - 5.834E-3 0.012 1.419E-6 1.669E-3 -381.542 -373.715 -81.085*** -358.378 -1.180*** b11 -0.863*** -0.136* - -0.079* -0.294* -4.434E-5* -0.038* -722.718** -722.806** -92.137*** -684.755** -0.572** b22 -0.090 -0.133* - -0.098** -0.201 -3.159E-5 -0.026 -870.129** -864.612** -119.43*** -820.429** -0.522** b12 -0.447** -7.500E-4 - 0.033 -0.089 -1.200E-5 -0.011 128.625 127.392 17.664 119.034 0.187 R
2 0.840 0.798 - 0.838 0.745 0.755 0.744 0.799 0.800 0.757 0.801 0.886
F-Ratio 7.348 5.528 - 7.231 4.086 4.321 4.065 5.575 5.591 4.351 5.644 10.887 P-value 0.010 0.022 - 0.011 0.047 0.041 0.047 0.022 0.022 0.040 0.021 0.003
Lack of fit 0.040** 0.374 - 0.121 0.730 0.762 0.736 0.137 0.144 0.138 0.135 0.004**
Frozen/thawed mashed potatoes b0 8.136 - 1.005 - - - - 4266.930 4191.420 801.413 4019.010 7.898 b1 -0.152* - -0.065*** - - - - 728.506*** 722.801*** 102.449** 689.230*** 0.693** b2 0.230** - -9.263E-3 - - - - -291.704* -288.344* -48.424 -272.275* -1.226*** b11 -0.541*** - 0.018* - - - - -644.405*** -637.020*** -104.478** -604.798*** 0.036 b22 0.016 - 0.052*** - - - - -633.032*** -625.703*** -102.069** -594.040*** -1.397*** b12 -0.385** - -0.037** - - - - -138.400 -130.983 -52.257 -126.592 0.100 R
2 0.877 - 0.821 - - - - 0.824 0.824 0.782 0.824 0.981
F-Ratio 9.962 - 6.440 - - - - 6.574 6.569 5.011 6.545 70.923 P-value 0.004 - 0.015 - - - - 0.014 0.014 0.029 0.014 0.000 Lack of fit 0.144 - 0.033** - - - - 0.198 0.194 0.277 0.193 0.244
Subscripts: 1 = temperature; 2 = time. Significant level: *0.10; **0.05; ***0.01.

38
Table 7 Stationary point and nature of the quality parameters at the design response surface
Quality parameter Temperature
(C)
Time (min)
Estimated response at stationary point
Nature of the optimum
Fresh mashed potatoes L*/b* ratio 60.187 11.204 - - Gumminess (N) 72.620 32.841 - - Average force (N) 67.300 29.299 0.303 Maximum
Complex viscosity, * (Pa s) 68.982 28.394 5124.844 Maximum
Overall acceptability 69.074 20.166 8.281 Maximum Frozen/thawed mashed potatoes L*/b* ratio 68.002 27.069 7.805 Maximum Cohesiveness 80.330 41.920 - - Loss modulus, G” (Pa) 67.760 28.296 840.875 Maximum
Complex viscosity, * (Pa s) 67.934 26.125 4256.236 Maximum
Overall acceptability 21.386 22.490 - -

39
Table 8 Experimental values and values predicted by models at 70 °C and 25 min
Response
variable
Experimental
value
Predicted
value
Residual
percentage
Fresh mashed potatoes
Average force (N) 0.297 0.289 +2.768
Complex viscosity, * (Pa s) 4899.564 4993.756 -1.886
Overall acceptability 8.360 8.155 +2.514
Frozen/thawed mashed potatoes L*/b* ratio 8.020 7.524 +6.592 Loss modulus, G” (Pa) 848.903 824.207 +2.977
Complex viscosity, * (Pa s) 3958.751 4154.368 -4.709

Figure 1
55 60 65 70 75 Temperature (°C)
15 25
35 45
Time (min) 0.09 0.13 0.17 0.21 0.25 0.29 0.33
AAvveerraaggee ffoorrccee cc
55 60 65 70 75 Temperature (°C)
15 25
35 45
Time (min) -700
300 1300 2300 3300 4300 5300
CCoommpplleexx vviissccoossiittyy dd
55 60 65 70 75 Temperature (°C)
15 25
35 45
Time (min) 5.9 6.9 7.9 8.9 9.9
LL**//bb** rraattiioo aa
55 60 65 70 75 Temperature (°C)
15 25
35 45
Time (min) 44 64 84
104 124 144
(X 0.01)
GGuummmmiinneessss
bb

Figure 2
55 60 65 70 75 Temperature (°C)
15 25
35 45
Time (min) 0 1 2 3 4 5
(X 1000)
CCoommpplleexx vviissccoossiittyy
dd
55 60 65 70 75 Temperature (°C)
15 25
35 45
Time (min) 0
200 400 600 800
1000
LLoossss mmoodduulluuss
cc
aa
55 60 65 70 75 Temperature (°C)
15 25
35 45
Time (min) 6.2 6.8
8.0 8.6 9.2
LL**//bb** rraattiioo
7.4
bb
55 60 65 70 75 Temperature (°C)
15 25
35 45
54 71 88 105 122 139 156
CCoohheessiivveenneessss
(X 0.01)
Time (min)

Figure 3
Temperature (°C)
55 60 65 70 75 15
25 35
45
Time (min) 0 2 4 6 8
10
OOvveerraallll aacccceeppttaabbiilliittyy aa
55 60 65 70 75 Temperature (°C)
15 25
35 45
Time (min) 0 2 4 6 8
10
OOvveerraallll aacccceeppttaabbiilliittyy bb