the effect of milling frequency on a mechanochemical ... · the effect of milling frequency on a...
TRANSCRIPT
2160
The effect of milling frequency on a mechanochemical organicreaction monitored by in situ Raman spectroscopyPatrick A. Julien1, Ivani Malvestiti1,2 and Tomislav Friščić*1
Full Research Paper Open Access
Address:1Department of Chemistry, McGill University, Montreal, QC, Canadaand 2Departamento de Química Fundamental, Universidade Federalde Pernambuco, PE, Brazil
Email:Tomislav Friščić* - [email protected]
* Corresponding author
Keywords:green chemistry; mechanism; mechanochemistry; milling; monitoring;Raman spectroscopy
Beilstein J. Org. Chem. 2017, 13, 2160–2168.doi:10.3762/bjoc.13.216
Received: 13 June 2017Accepted: 18 September 2017Published: 18 October 2017
This article is part of the Thematic Series "Mechanochemistry".
Guest Editor: J. G. Hernández
© 2017 Julien et al.; licensee Beilstein-Institut.License and terms: see end of document.
AbstractWe provide the first in situ and real-time study of the effect of milling frequency on the course of a mechanochemical organic reac-
tion conducted using a vibratory shaker (mixer) ball mill. The use of in situ Raman spectroscopy for real-time monitoring of the
mechanochemical synthesis of a 2,3-diphenylquinoxaline derivative revealed a pronounced dependence of chemical reactivity on
small variations in milling frequency. In particular, in situ measurements revealed the establishment of two different regimes of
reaction kinetics at different frequencies, providing tentative insight into processes of mechanical activation in organic mechano-
chemical synthesis.
2160
IntroductionOver the past decade, mechanochemical reactions [1-4], i.e.,
chemical transformations induced or sustained through the ap-
plication of mechanical force in the form of grinding, milling
and shearing, have emerged as a highly versatile and general
route to conduct chemical reactions in the absence of bulk sol-
vents [2]. Indeed, the demonstrated versatility in organic [5-8],
organometallic [9,10], pharmaceutical [11,12], supramolecular
[13], metal-organic [14,15], and materials synthesis [16] has
rendered mechanochemical reactions by ball milling or grinding
as viable, highly environmentally-friendly alternatives to solu-
tion-based chemistry. Importantly, mechanochemistry provides
not only a means to conduct chemical transformations of poorly
soluble reagents [17], but also enables access to reactions that
are difficult or even impossible to achieve in solution [18-20],
and allows the synthesis of molecular targets that have so far
been considered impossible to synthesize [21] or isolate [22].
However, in contrast to rapid expansion of applications of
mechanochemistry, the mechanistic understanding of the under-
lying physicochemical process remains poor. It was only
recently that significant effort was invested in understanding
how fundamental environmental parameters, such as tempera-
ture, milling frequency, or sample-to-volume ratio [23-26]
affect the course of organic mechanochemical reactions. A sig-
nificant recent advance in mechanistic studies of mechano-
chemical reaction mechanisms was the introduction of tech-
Beilstein J. Org. Chem. 2017, 13, 2160–2168.
2161
Scheme 1: Milling synthesis of 2,3-diphenylquinoxaline from benziland ortho-phenylenediamine [40].
niques for in situ, real-time monitoring of ball milling pro-
cesses [27], first through synchrotron X-ray powder diffraction
(XRPD) [28,29], and later by Raman spectroscopy [30] or by a
tandem technique combining these two techniques [31]. Where-
as valuable mechanistic information on the course of a milling
reaction can be obtained through stepwise, ex situ monitoring
[32] based on periodically interrupting the milling process fol-
lowed by sample extraction and analysis [33,34] such tech-
niques can also lead to misleading results due to the sample
either relaxing rapidly after milling [35] or reacting with sur-
rounding atmosphere during preparation for analysis [36]. Such
problems are additionally exacerbated in mechanochemistry of
organic or metal-organic materials, readily activated through
milling into transient, reactive amorphous phases. In contrast,
real-time monitoring provides the opportunity to investigate the
reaction course with time resolution in seconds, and without
disrupting the milling process [31]. So far, the majority of real-
time monitoring studies have focused on reactions of inorganic
substances converting into metal-organic frameworks (MOFs)
[17,28,37] or supramolecular reactions of cocrystallisation [38].
Real-time monitoring of an organic mechanochemical reaction
was only recently reported by Tireli and co-workers, who
utilized Raman spectroscopy to investigate how the choice of
base influences the course of a base-catalysed nucleophilic sub-
stitution reaction [39].
Raman spectroscopy is particularly well-suited for monitoring
and tracking organic reactions. It is a generally accessible and
inexpensive, with an output based on changes to molecular
structure rather than its crystallinity, offering a powerful tool for
in situ studies of mechanochemical organic reactions that often
proceed through amorphous or eutectic intermediates. We now
report a Raman spectroscopy study of the effect of ball milling
frequency on the course of a model organic transformation, the
previously reported mechanochemical condensation of a di-
ketone and a diamine to form an N-heteroacene [40]. We have
utilized an in-house built setup for real-time Raman spectrosco-
py monitoring of the synthesis of 2,3-diphenylquinoxaline from
benzil and o-phenylenediamine (Scheme 1). As the Raman
signals of both reactants and the quinoxaline product can
readily be distinguished, and the product can be obtained in
high yield and purity by brief milling (less than an hour), we
found this model system to be particularly appealing for mecha-
nistic studies.
The milling frequency is one of the fundamental parameters of
mechanochemical reactions conducted by ball milling, and for a
vibratory shaker (mixer) ball mill it represents the number of
full oscillations of the milling vessel (milling jar) per unit time
along a curved path (Scheme 2). It is often used as a simple, pri-
mary assessment of the intensity of the milling process, and it
affects the overall impact force, number and rate of impacts of
milling media, as well as associated frictional heating.
Scheme 2: Movement of the milling jar and sample holder undermilling conditions.
Raman spectroscopy was recently utilized for a stepwise, ex situ
assessment of the effect of milling frequency on the mechano-
chemical synthesis of a MOF from ZnO and imidazole in the
presence of a small amount of N,N-dimethylformamide [41].
This study revealed reaction kinetics consistent with a 2nd order
reaction rate law, rationalized through a “pseudo-fluid” reac-
tion model in which the rate-determining factor is the frequen-
cy of reactive encounters between the particles. In contrast, ex
situ gas chromatography studies of the Knoevenagel condensa-
tion between vanillin and barbituric acid in a planetary mill
revealed a sigmoidal dependence of reaction yield with time
[22]. Similarly, sigmoidal dynamics were detected by in situ
XRPD monitoring of the formation of glycinium oxalate salts
from γ-glycine and oxalic acid dihydrate [42]. Other examples
of explorations of the effect of milling frequency on mechano-
chemical reactivity include aromatic substitution reactions [43]
and the synthesis of nitrogen-doped titania [44], which have all
revealed a non-linear relationship between milling frequency
and reaction conversion.
Results and DiscussionIn situ monitoring of the model condensationreactionA preliminary investigation of the model condensation reaction
was conducted by milling of o-phenylenediamine (108 mg,
1.0 mmol) with benzil (210 mg, 1.0 mmol) using a Retsch
MM400 mixer mill operating at 30 Hz. The reaction
Beilstein J. Org. Chem. 2017, 13, 2160–2168.
2162
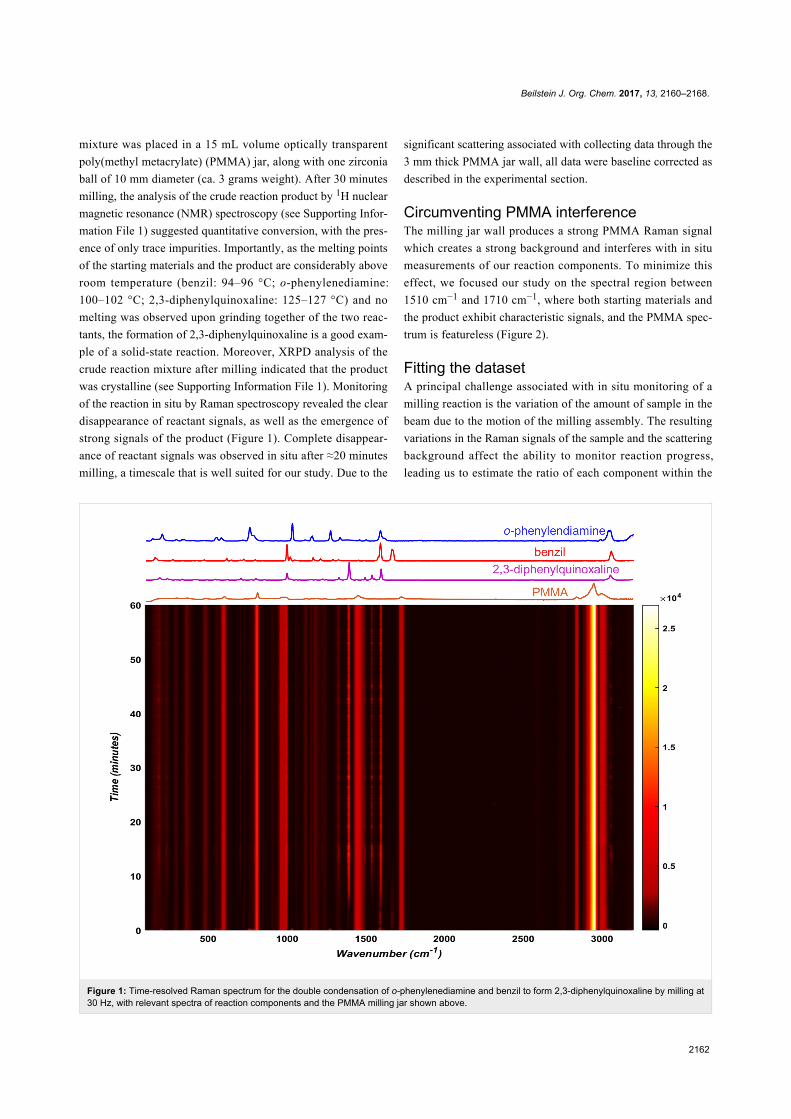
Figure 1: Time-resolved Raman spectrum for the double condensation of o-phenylenediamine and benzil to form 2,3-diphenylquinoxaline by milling at30 Hz, with relevant spectra of reaction components and the PMMA milling jar shown above.
mixture was placed in a 15 mL volume optically transparent
poly(methyl metacrylate) (PMMA) jar, along with one zirconia
ball of 10 mm diameter (ca. 3 grams weight). After 30 minutes
milling, the analysis of the crude reaction product by 1H nuclear
magnetic resonance (NMR) spectroscopy (see Supporting Infor-
mation File 1) suggested quantitative conversion, with the pres-
ence of only trace impurities. Importantly, as the melting points
of the starting materials and the product are considerably above
room temperature (benzil: 94–96 °C; o-phenylenediamine:
100–102 °C; 2,3-diphenylquinoxaline: 125–127 °C) and no
melting was observed upon grinding together of the two reac-
tants, the formation of 2,3-diphenylquinoxaline is a good exam-
ple of a solid-state reaction. Moreover, XRPD analysis of the
crude reaction mixture after milling indicated that the product
was crystalline (see Supporting Information File 1). Monitoring
of the reaction in situ by Raman spectroscopy revealed the clear
disappearance of reactant signals, as well as the emergence of
strong signals of the product (Figure 1). Complete disappear-
ance of reactant signals was observed in situ after ≈20 minutes
milling, a timescale that is well suited for our study. Due to the
significant scattering associated with collecting data through the
3 mm thick PMMA jar wall, all data were baseline corrected as
described in the experimental section.
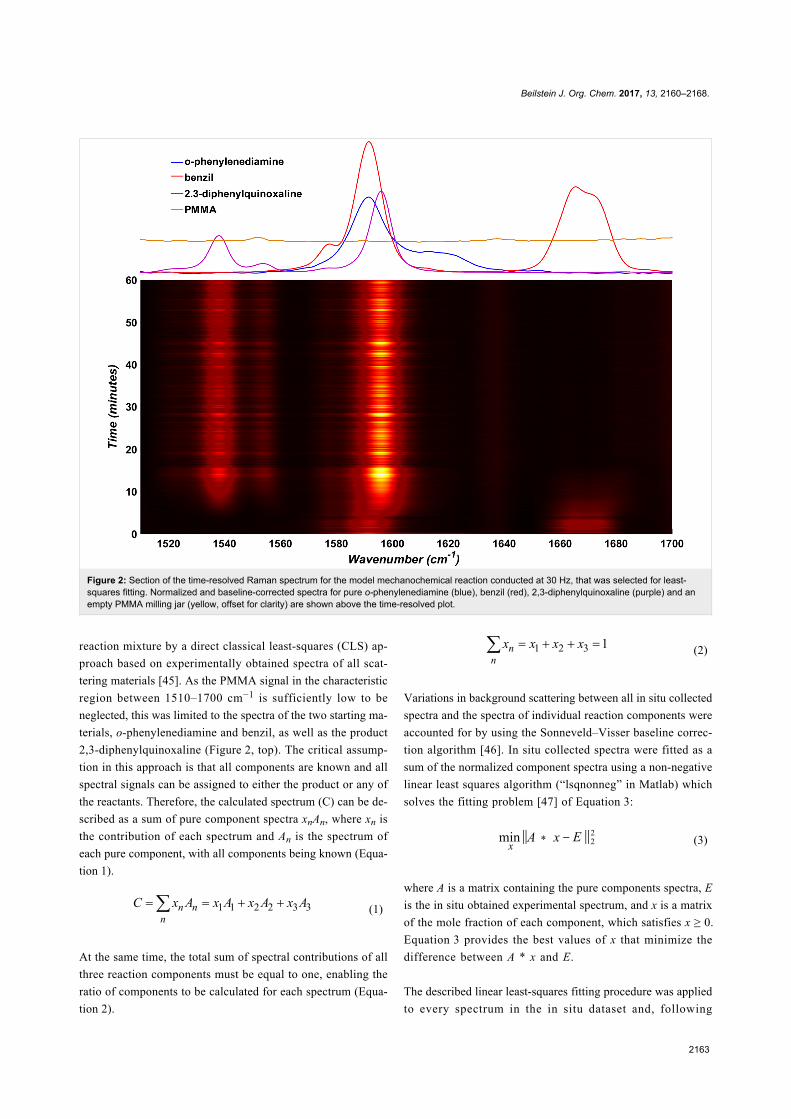
Circumventing PMMA interferenceThe milling jar wall produces a strong PMMA Raman signal
which creates a strong background and interferes with in situ
measurements of our reaction components. To minimize this
effect, we focused our study on the spectral region between
1510 cm−1 and 1710 cm−1, where both starting materials and
the product exhibit characteristic signals, and the PMMA spec-
trum is featureless (Figure 2).
Fitting the datasetA principal challenge associated with in situ monitoring of a
milling reaction is the variation of the amount of sample in the
beam due to the motion of the milling assembly. The resulting
variations in the Raman signals of the sample and the scattering
background affect the ability to monitor reaction progress,
leading us to estimate the ratio of each component within the
Beilstein J. Org. Chem. 2017, 13, 2160–2168.
2163
Figure 2: Section of the time-resolved Raman spectrum for the model mechanochemical reaction conducted at 30 Hz, that was selected for least-squares fitting. Normalized and baseline-corrected spectra for pure o-phenylenediamine (blue), benzil (red), 2,3-diphenylquinoxaline (purple) and anempty PMMA milling jar (yellow, offset for clarity) are shown above the time-resolved plot.
reaction mixture by a direct classical least-squares (CLS) ap-
proach based on experimentally obtained spectra of all scat-
tering materials [45]. As the PMMA signal in the characteristic
region between 1510–1700 cm−1 is sufficiently low to be
neglected, this was limited to the spectra of the two starting ma-
terials, o-phenylenediamine and benzil, as well as the product
2,3-diphenylquinoxaline (Figure 2, top). The critical assump-
tion in this approach is that all components are known and all
spectral signals can be assigned to either the product or any of
the reactants. Therefore, the calculated spectrum (C) can be de-
scribed as a sum of pure component spectra xnAn, where xn is
the contribution of each spectrum and An is the spectrum of
each pure component, with all components being known (Equa-
tion 1).
(1)
At the same time, the total sum of spectral contributions of all
three reaction components must be equal to one, enabling the
ratio of components to be calculated for each spectrum (Equa-
tion 2).
(2)
Variations in background scattering between all in situ collected
spectra and the spectra of individual reaction components were
accounted for by using the Sonneveld–Visser baseline correc-
tion algorithm [46]. In situ collected spectra were fitted as a
sum of the normalized component spectra using a non-negative
linear least squares algorithm (“lsqnonneg” in Matlab) which
solves the fitting problem [47] of Equation 3:
(3)
where A is a matrix containing the pure components spectra, E
is the in situ obtained experimental spectrum, and x is a matrix
of the mole fraction of each component, which satisfies x ≥ 0.
Equation 3 provides the best values of x that minimize the
difference between A * x and E.
The described linear least-squares fitting procedure was applied
to every spectrum in the in situ dataset and, following
Beilstein J. Org. Chem. 2017, 13, 2160–2168.
2164
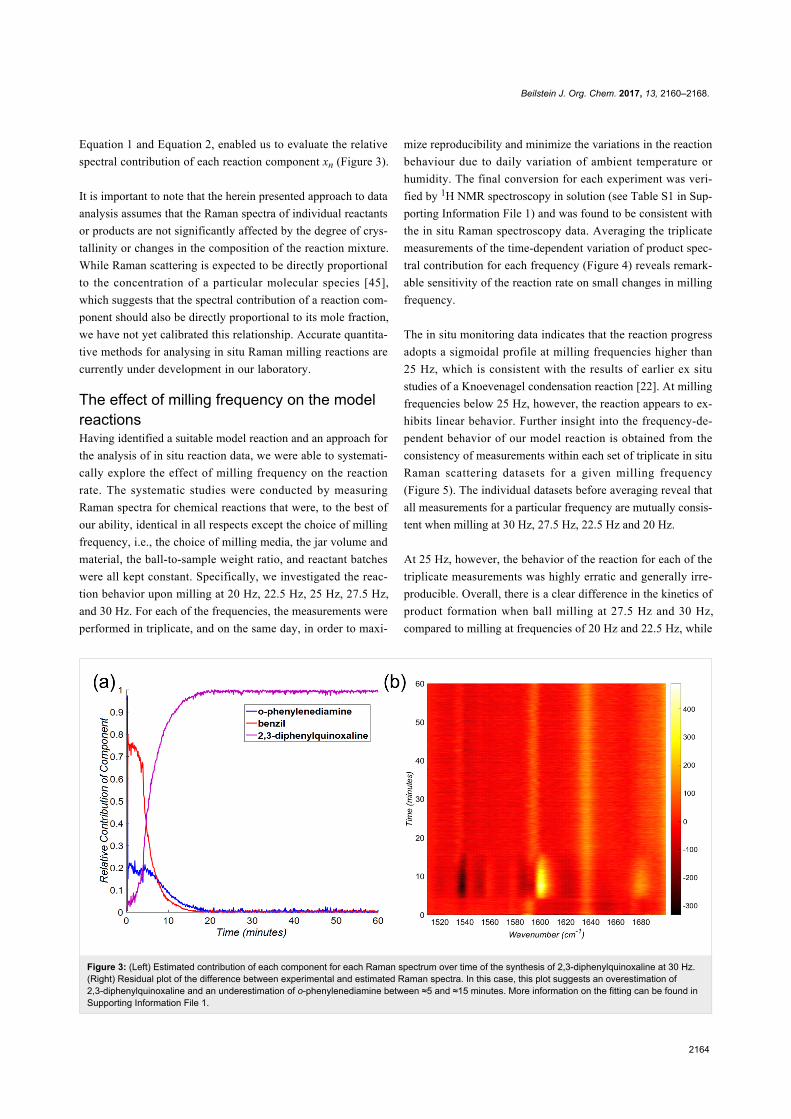
Figure 3: (Left) Estimated contribution of each component for each Raman spectrum over time of the synthesis of 2,3-diphenylquinoxaline at 30 Hz.(Right) Residual plot of the difference between experimental and estimated Raman spectra. In this case, this plot suggests an overestimation of2,3-diphenylquinoxaline and an underestimation of o-phenylenediamine between ≈5 and ≈15 minutes. More information on the fitting can be found inSupporting Information File 1.
Equation 1 and Equation 2, enabled us to evaluate the relative
spectral contribution of each reaction component xn (Figure 3).
It is important to note that the herein presented approach to data
analysis assumes that the Raman spectra of individual reactants
or products are not significantly affected by the degree of crys-
tallinity or changes in the composition of the reaction mixture.
While Raman scattering is expected to be directly proportional
to the concentration of a particular molecular species [45],
which suggests that the spectral contribution of a reaction com-
ponent should also be directly proportional to its mole fraction,
we have not yet calibrated this relationship. Accurate quantita-
tive methods for analysing in situ Raman milling reactions are
currently under development in our laboratory.
The effect of milling frequency on the modelreactionsHaving identified a suitable model reaction and an approach for
the analysis of in situ reaction data, we were able to systemati-
cally explore the effect of milling frequency on the reaction
rate. The systematic studies were conducted by measuring
Raman spectra for chemical reactions that were, to the best of
our ability, identical in all respects except the choice of milling
frequency, i.e., the choice of milling media, the jar volume and
material, the ball-to-sample weight ratio, and reactant batches
were all kept constant. Specifically, we investigated the reac-
tion behavior upon milling at 20 Hz, 22.5 Hz, 25 Hz, 27.5 Hz,
and 30 Hz. For each of the frequencies, the measurements were
performed in triplicate, and on the same day, in order to maxi-
mize reproducibility and minimize the variations in the reaction
behaviour due to daily variation of ambient temperature or
humidity. The final conversion for each experiment was veri-
fied by 1H NMR spectroscopy in solution (see Table S1 in Sup-
porting Information File 1) and was found to be consistent with
the in situ Raman spectroscopy data. Averaging the triplicate
measurements of the time-dependent variation of product spec-
tral contribution for each frequency (Figure 4) reveals remark-
able sensitivity of the reaction rate on small changes in milling
frequency.
The in situ monitoring data indicates that the reaction progress
adopts a sigmoidal profile at milling frequencies higher than
25 Hz, which is consistent with the results of earlier ex situ
studies of a Knoevenagel condensation reaction [22]. At milling
frequencies below 25 Hz, however, the reaction appears to ex-
hibits linear behavior. Further insight into the frequency-de-
pendent behavior of our model reaction is obtained from the
consistency of measurements within each set of triplicate in situ
Raman scattering datasets for a given milling frequency
(Figure 5). The individual datasets before averaging reveal that
all measurements for a particular frequency are mutually consis-
tent when milling at 30 Hz, 27.5 Hz, 22.5 Hz and 20 Hz.
At 25 Hz, however, the behavior of the reaction for each of the
triplicate measurements was highly erratic and generally irre-
producible. Overall, there is a clear difference in the kinetics of
product formation when ball milling at 27.5 Hz and 30 Hz,
compared to milling at frequencies of 20 Hz and 22.5 Hz, while

Beilstein J. Org. Chem. 2017, 13, 2160–2168.
2165
Figure 4: The effect of milling frequency on the milling condensation of benzil and o-phenylenediamine to form 2,3-diphenylquinoxaline, with data foreach milling frequency averaged from a set of triplicate measurements. Variation close to the onset of milling may be due to poor initial homogeneityof the sample.
Figure 5: The reproducibility of varying milling frequency on the neat mechanochemical condensation of benzil and o-phenylenediamine, asmeasured by triplicate experiments.
Beilstein J. Org. Chem. 2017, 13, 2160–2168.
2166
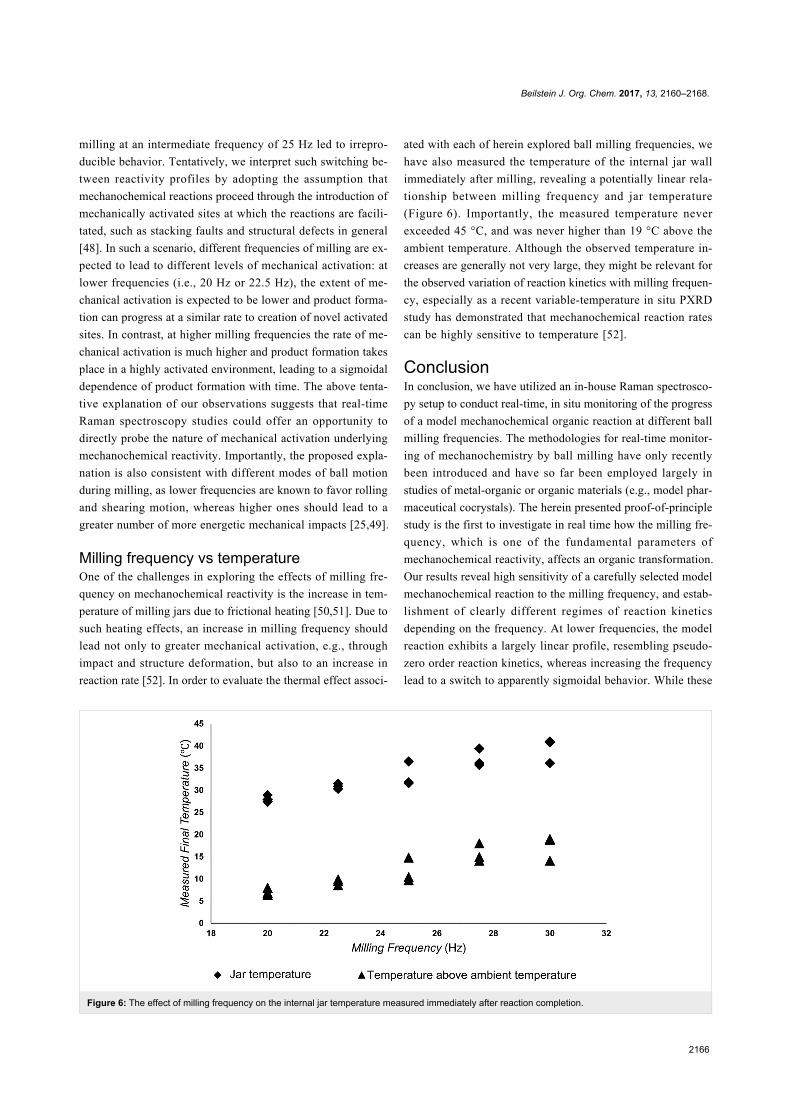
Figure 6: The effect of milling frequency on the internal jar temperature measured immediately after reaction completion.
milling at an intermediate frequency of 25 Hz led to irrepro-
ducible behavior. Tentatively, we interpret such switching be-
tween reactivity profiles by adopting the assumption that
mechanochemical reactions proceed through the introduction of
mechanically activated sites at which the reactions are facili-
tated, such as stacking faults and structural defects in general
[48]. In such a scenario, different frequencies of milling are ex-
pected to lead to different levels of mechanical activation: at
lower frequencies (i.e., 20 Hz or 22.5 Hz), the extent of me-
chanical activation is expected to be lower and product forma-
tion can progress at a similar rate to creation of novel activated
sites. In contrast, at higher milling frequencies the rate of me-
chanical activation is much higher and product formation takes
place in a highly activated environment, leading to a sigmoidal
dependence of product formation with time. The above tenta-
tive explanation of our observations suggests that real-time
Raman spectroscopy studies could offer an opportunity to
directly probe the nature of mechanical activation underlying
mechanochemical reactivity. Importantly, the proposed expla-
nation is also consistent with different modes of ball motion
during milling, as lower frequencies are known to favor rolling
and shearing motion, whereas higher ones should lead to a
greater number of more energetic mechanical impacts [25,49].
Milling frequency vs temperatureOne of the challenges in exploring the effects of milling fre-
quency on mechanochemical reactivity is the increase in tem-
perature of milling jars due to frictional heating [50,51]. Due to
such heating effects, an increase in milling frequency should
lead not only to greater mechanical activation, e.g., through
impact and structure deformation, but also to an increase in
reaction rate [52]. In order to evaluate the thermal effect associ-
ated with each of herein explored ball milling frequencies, we
have also measured the temperature of the internal jar wall
immediately after milling, revealing a potentially linear rela-
tionship between milling frequency and jar temperature
(Figure 6). Importantly, the measured temperature never
exceeded 45 °C, and was never higher than 19 °C above the
ambient temperature. Although the observed temperature in-
creases are generally not very large, they might be relevant for
the observed variation of reaction kinetics with milling frequen-
cy, especially as a recent variable-temperature in situ PXRD
study has demonstrated that mechanochemical reaction rates
can be highly sensitive to temperature [52].
ConclusionIn conclusion, we have utilized an in-house Raman spectrosco-
py setup to conduct real-time, in situ monitoring of the progress
of a model mechanochemical organic reaction at different ball
milling frequencies. The methodologies for real-time monitor-
ing of mechanochemistry by ball milling have only recently
been introduced and have so far been employed largely in
studies of metal-organic or organic materials (e.g., model phar-
maceutical cocrystals). The herein presented proof-of-principle
study is the first to investigate in real time how the milling fre-
quency, which is one of the fundamental parameters of
mechanochemical reactivity, affects an organic transformation.
Our results reveal high sensitivity of a carefully selected model
mechanochemical reaction to the milling frequency, and estab-
lishment of clearly different regimes of reaction kinetics
depending on the frequency. At lower frequencies, the model
reaction exhibits a largely linear profile, resembling pseudo-
zero order reaction kinetics, whereas increasing the frequency
lead to a switch to apparently sigmoidal behavior. While these

Beilstein J. Org. Chem. 2017, 13, 2160–2168.
2167
observations can tentatively be rationalized by different levels
of mechanical activation of the reaction mixture at different
frequencies, validating such an explanation requires further and
quantitative studies. Nevertheless, we believe that the apparent
ability of a mechanochemical reaction to switch between differ-
ent regimes of chemical kinetics in response to minor changes
in milling frequency is an important observation not only in the
context of organic mechanochemistry, and may even be of
importance in reconciling differences in recently reported
in situ and ex situ studies of mechanochemical reactivity
[22,41,42,53].
ExperimentalChemicalsBenzil (98%) was purchased from Aldrich Chemical.
o-Phenylenediamine (98%) was purchased from Alfa Aesar.
Both were used without further purification.
Milling reactions and characterizationThe double condensation was conducted by milling 210 mg of
benzil (1.0 mmol) and 108 mg of o-phenylenediamine
(1.0 mmol) with a single zirconia ball of 10 mm diameter
(ca. 3 grams weight) in a 15 mL poly(methyl methacrylate)
(PMMA) optically transparent milling jar, using a Retsch®
MM400 mixer mill. For all real-time reaction monitoring, reac-
tions were monitored using a RamanRxn1™ analyzer by Kaiser
Optical Systems Inc. every 5 seconds using a 785 nm laser.
Spectra were dark and intensity corrected using the Holograms®
software package before being processed. The products of these
reactions were analyzed without purification. The identity of the
final product was confirmed through 1H and 13C NMR in
CDCl3 using a 500 MHz AVIIIHD 500 Bruker spectrometer.
Infrared spectra were collected on a Bruker Vertex 70 FT-IR
Platinum ATR, while X-ray powder diffraction patterns were
collected on a Proto Manufacturing AXRD Benchtop Powder
Diffractometer using Ni-filtered Cu Kα radiation. The conver-
sion for each solid-state reaction was evaluated after milling
using 1H NMR spectroscopy conducted in CDCl3 on a
300 MHz Varian Mercury spectrometer. The ambient tempera-
ture was measured using a digital thermometer by VWR and the
internal jar temperature was acquired immediately after milling
finished using a Mastercraft Temperature Reader with Digital
Display and Laser Pointer (accuracy ±2 °C).
Supporting InformationSupporting Information File 1Experimental part.
[http://www.beilstein-journals.org/bjoc/content/
supplementary/1860-5397-13-216-S1.pdf]
AcknowledgementsWe would like to thank Prof. B. A. Arndtsen for use of the
Raman system and Dr. S. L. Sewall for advice. We acknowl-
edge the financial support of the NSERC PGS-D program
(P.A.J.), the NSERC Discovery Grant program (grant RGPIN
418592-12) and NSERC E. W. R. Steacie Memorial Fellow-
ship (T.F.), and CNPq for the Post-Doctoral fellowship
(201474/2015-8) (I.M.).
References1. Hernández, J. G.; Friščić, T. Tetrahedron Lett. 2015, 56, 4253–4265.
doi:10.1016/j.tetlet.2015.03.1352. James, S. L.; Adams, C. J.; Bolm, C.; Braga, D.; Collier, P.; Friščić, T.;
Grepioni, F.; Harris, K. D. M.; Hyett, G.; Jones, W.; Krebs, A.; Mack, J.;Maini, L.; Orpen, A. G.; Parkin, I. P.; Shearouse, W. C.; Steed, J. W.;Waddell, D. C. Chem. Soc. Rev. 2012, 41, 413–447.doi:10.1039/C1CS15171A
3. Ostwald, W. The fundamental principles of chemistry: an introduction toall text-books of chemistry; Longmans, Green, and Company: NewYork, 1909.
4. Takacs, L. Chem. Soc. Rev. 2013, 42, 7649–7659.doi:10.1039/c2cs35442j
5. Wang, G.-W. Chem. Soc. Rev. 2013, 42, 7668–7700.doi:10.1039/c3cs35526h
6. Stolle, A.; Szuppa, T.; Leonhardt, S. E. S.; Ondruschka, B.Chem. Soc. Rev. 2011, 40, 2317–2329. doi:10.1039/c0cs00195c
7. Rodríguez, B.; Bruckmann, A.; Rantanen, T.; Bolm, C.Adv. Synth. Catal. 2007, 349, 2213–2233.doi:10.1002/adsc.200700252
8. Stolle, A.; Ondruschka, B. Pure Appl. Chem. 2011, 83, 1343–1349.doi:10.1351/PAC-CON-10-09-26
9. Juribašić, M.; Užarević, K.; Gracin, D.; Ćurić, M. Chem. Commun.2014, 50, 10287–10290. doi:10.1039/C4CC04423A
10. Rightmire, N. R.; Hanusa, T. P. Dalton Trans. 2016, 45, 2352–2362.doi:10.1039/C5DT03866A
11. Tan, D.; Loots, L.; Friščić, T. Chem. Commun. 2016, 52, 7760–7781.doi:10.1039/C6CC02015A
12. Delori, A.; Friščić, T.; Jones, W. CrystEngComm 2012, 14, 2350–2362.doi:10.1039/c2ce06582g
13. Friščić, T. Chem. Soc. Rev. 2012, 41, 3493–3510.doi:10.1039/c2cs15332g
14. Friščić, T. J. Mater. Chem. 2010, 20, 7599–7605.doi:10.1039/c0jm00872a
15. Braga, D.; Giaffreda, S. L.; Grepioni, F.; Pettersen, A.; Maini, L.;Curzi, M.; Polito, M. Dalton Trans. 2006, 1249–1263.doi:10.1039/b516165g
16. Ralphs, K.; Hardacre, C.; James, S. L. Chem. Soc. Rev. 2013, 42,7701–7718. doi:10.1039/c3cs60066a
17. Julien, P. A.; Užarević, K.; Katsenis, A. D.; Kimber, S. A. J.; Wang, T.;Farha, O. K.; Zhang, Y.; Casaban, J.; Germann, L. S.; Etter, M.;Dinnebier, R. E.; James, S. L.; Halasz, I.; Friščić, T. J. Am. Chem. Soc.2016, 138, 2929–2932. doi:10.1021/jacs.5b13038
18. Tan, D.; Mottillo, C.; Katsenis, A. D.; Štrukil, V.; Friščić, T.Angew. Chem., Int. Ed. 2014, 53, 9321–9324.doi:10.1002/anie.201404120
19. Wang, G.-W.; Komatsu, K.; Murata, Y.; Shiro, M. Nature 1997, 387,583–586. doi:10.1038/42439
Beilstein J. Org. Chem. 2017, 13, 2160–2168.
2168
20. Hernández, J. G.; Bolm, C. J. Org. Chem. 2017, 82, 4007–4019.doi:10.1021/acs.joc.6b02887
21. Shi, Y. X.; Xu, K.; Clegg, J. K.; Ganguly, R.; Hirao, H.; Friščić, T.;García, F. Angew. Chem., Int. Ed. 2016, 55, 12736–12740.doi:10.1002/anie.201605936
22. Štrukil, V.; Gracin, D.; Magdysyuk, O. V.; Dinnebier, R. E.; Friščić, T.Angew. Chem., Int. Ed. 2015, 54, 8440–8443.doi:10.1002/anie.201502026
23. Stolle, A.; Schmidt, R.; Jacob, K. Faraday Discuss. 2014, 170,267–286. doi:10.1039/C3FD00144J
24. Schmidt, R.; Burmeister, C. F.; Baláž, M.; Kwade, A.; Stolle, A.Org. Process Res. Dev. 2015, 19, 427–436. doi:10.1021/op5003787
25. McKissic, K. S.; Caruso, J. T.; Blair, R. G.; Mack, J. Green Chem.2014, 16, 1628–1632. doi:10.1039/c3gc41496e
26. Michalchuk, A. A. L.; Tumanov, I. A.; Drebushchak, V. A.;Boldyreva, E. V. Faraday Discuss. 2014, 170, 311–335.doi:10.1039/C3FD00150D
27. Užarević, K.; Halasz, I.; Friščić, T. J. Phys. Chem. Lett. 2015, 6,4129–4140. doi:10.1021/acs.jpclett.5b01837
28. Halasz, I.; Kimber, S. A. J.; Beldon, P. J.; Belenguer, A. M.; Adams, F.;Honkimäki, V.; Nightingale, R. C.; Dinnebier, R. E.; Friščić, T.Nat. Protoc. 2013, 8, 1718–1729. doi:10.1038/nprot.2013.100
29. Friščić, T.; Halasz, I.; Beldon, P. J.; Belenguer, A. M.; Adams, F.;Kimber, S. A. J.; Honkimäki, V.; Dinnebier, R. E. Nat. Chem. 2013, 5,66–73. doi:10.1038/nchem.1505
30. Gracin, D.; Štrukil, V.; Friščić, T.; Halasz, I.; Užarević, K.Angew. Chem., Int. Ed. 2014, 53, 6193–6197.doi:10.1002/anie.201402334
31. Batzdorf, L.; Fischer, F.; Wilke, M.; Wenzel, K.-J.; Emmerling, F.Angew. Chem., Int. Ed. 2015, 54, 1799–1802.doi:10.1002/anie.201409834
32. Tumanov, I. A.; Achkasov, A. F.; Boldyreva, E. V.; Boldyrev, V. V.CrystEngComm 2011, 13, 2213–2216. doi:10.1039/c0ce00869a
33. Cinčić, D.; Friščić, T.; Jones, W. J. Am. Chem. Soc. 2008, 130,7524–7525. doi:10.1021/ja801164v
34. Karki, S.; Friščić, T.; Jones, W. CrystEngComm 2009, 11, 470–481.doi:10.1039/B812531G
35. Štrukil, V.; Fábián, L.; Reid, D. G.; Duer, M. J.; Jackson, G. J.;Eckert-Maksić, M.; Friščić, T. Chem. Commun. 2010, 46, 9191–9193.doi:10.1039/c0cc03822a
36. Braga, D.; Giaffreda, S. L.; Grepioni, F.; Polito, M. CrystEngComm2004, 6, 459–462. doi:10.1039/B406375A
37. Katsenis, A. D.; Puškarić, A.; Štrukil, V.; Mottillo, C.; Julien, P. A.;Užarević, K.; Pham, M.-H.; Do, T.-O.; Kimber, S. A. J.; Lazić, P.;Magdysyuk, O.; Dinnebier, R. E.; Halasz, I.; Friščić, T. Nat. Commun.2015, 6, No. 6662. doi:10.1038/ncomms7662
38. Halasz, I.; Puškarić, A.; Kimber, S. A. J.; Beldon, P. J.;Belenguer, A. M.; Adams, F.; Honkimäki, V.; Dinnebier, R. E.; Patel, B.;Jones, W.; Štrukil, V.; Friščić, T. Angew. Chem., Int. Ed. 2013, 52,11538–11541. doi:10.1002/anie.201305928
39. Tireli, M.; Juribašić Kulcsar, M.; Cindro, N.; Gracin, D.; Biliškov, N.;Borovina, M.; Ćurić, M.; Halasz, I.; Užarević, K. Chem. Commun. 2015,51, 8058–8061. doi:10.1039/C5CC01915J
40. Sahoo, P. K.; Giri, C.; Haldar, T. S.; Puttreddy, R.; Rissanen, K.;Mal, P. Eur. J. Org. Chem. 2016, 1283–1291.doi:10.1002/ejoc.201600005
41. Ma, X.; Yuan, W.; Bell, S. E. J.; James, S. L. Chem. Commun. 2014,50, 1585–1587. doi:10.1039/c3cc47898j
42. Michalchuk, A. A. L.; Tumanov, I. A.; Konar, S.; Kimber, S. A. J.;Pulham, C. R.; Boldyreva, E. V. Adv. Sci. 2017, 4, 1700132.doi:10.1002/advs.201700132
43. Schmidt, R.; Stolle, A.; Ondruschka, B. Green Chem. 2012, 14,1673–1679. doi:10.1039/c2gc16508b
44. Yin, S.; Yamaki, H.; Komatsu, M.; Zhang, Q.; Wang, J.; Tang, Q.;Saito, F.; Sato, T. J. Mater. Chem. 2003, 13, 2996–3001.doi:10.1039/b309217h
45. Strachan, C. J.; Rades, T.; Gordon, K. C.; Rantanen, J.J. Pharm. Pharmacol. 2007, 59, 179–192. doi:10.1211/jpp.59.2.0005
46. Sonneveld, E. J.; Visser, J. W. J. Appl. Crystallogr. 1975, 8, 1–7.doi:10.1107/S0021889875009417
47. Lawson, C.; Hanson, R. Solving Least Squares Problems;Prentice-Hall: Upper Saddle River, New Jersey, 1974; pp 161 ff.
48. Baláž, P.; Achimovičová, M.; Baláž, M.; Billik, P.;Cherkezova-Zheleva, Z.; Criado, J. M.; Delogu, F.; Dutková, E.;Gaffet, E.; Gotor, F. J.; Kumar, R.; Mitov, I.; Rojac, T.; Senna, M.;Streletskii, A.; Wieczorek-Ciurowa, K. Chem. Soc. Rev. 2013, 42,7571–7637. doi:10.1039/c3cs35468g
49. Michalchuk, A. A. L.; Tumanov, I. A.; Boldyreva, E. V. CrystEngComm2013, 15, 6403–6412. doi:10.1039/c3ce40907d
50. Kulla, H.; Wilke, M.; Fischer, F.; Röllig, M.; Maierhofer, C.;Emmerling, F. Chem. Commun. 2017, 53, 1664–1667.doi:10.1039/C6CC08950J
51. Fang, Y.; Salamé, N.; Woo, S.; Bohle, D. S.; Friščić, T.; Cuccia, L. A.CrystEngComm 2014, 16, 7180–7185. doi:10.1039/C4CE00328D
52. Užarević, K.; Štrukil, V.; Mottillo, C.; Julien, P. A.; Puškarić, A.;Friščić, T.; Halasz, I. Cryst. Growth Des. 2016, 16, 2342–2347.doi:10.1021/acs.cgd.6b00137
53. Halasz, I.; Friščić, T.; Kimber, S. A. J.; Užarević, K.; Puškarić, A.;Mottillo, C.; Julien, P.; Štrukil, V.; Honkimäki, V.; Dinnebier, R. E.Faraday Discuss. 2014, 170, 203–221. doi:10.1039/C4FD00013G
License and TermsThis is an Open Access article under the terms of the
Creative Commons Attribution License
(http://creativecommons.org/licenses/by/4.0), which
permits unrestricted use, distribution, and reproduction in
any medium, provided the original work is properly cited.
The license is subject to the Beilstein Journal of Organic
Chemistry terms and conditions:
(http://www.beilstein-journals.org/bjoc)
The definitive version of this article is the electronic one
which can be found at:
doi:10.3762/bjoc.13.216