the effect of multi-trophic aquaculture on nutrient loading in … · 2014-10-23 · the effect of...
TRANSCRIPT

The Effect of Multi-trophic Aquaculture on Nutrient Loading in Fish and
Shrimp Ponds, Karawang, Indonesia
Mark L. Wells 1, Mitsutaku Makino 2, Suhendar I. Sachoemar 3 and Masahito Hirota 2!
!1 University of Maine, Orono, USA. E-mail: [email protected] 2 Fisheries Research Agency, Yokohama, Japan 3 Agency for The Assessment and Application of Technology (BPPT), Jakarta, Indonesia

Karawang Pond Experiment #1Purpose: To investigate the effect of integrated multitrophic
aquaculture (IMTA) on: 1) the economic return of pond operation, and 2) the water quality stability of the ponds. (Defined in
terms of the (macro)nutrient concentrations of nitrate/nitrite, ammonia, and phosphate, in addition to other parameters; oxygen, phytoplankton, bacteria, etc.).
!Hypothesis: The addition of bivalves (Anadara) and seaweed
(Gracillaria) into the aquaculture ponds of tilapia or shrimp will allow successful growth of all species, and decrease macronutrient concentrations (nitrite/nitrate, ammonia, phosphate).

Traditional Pond Aquaculture• Traditional pond aquaculture is practiced by local
communities, and is distinguished from larger scale commercial operations by their simplicity.
• To reduce electricity costs, there is no mixing of the pond waters by water wheel or other means, which means there is greater susceptibility to organic matter overloading and hypoxia.
• These ponds therefore use low intensity aquaculture methods, meaning lower density of aquacultures organisms • In our case, it is ~ 15 shrimp/m2 vs. >300 shrimp/m2 in
high intensity aquaculture ponds (same level of differences for Tilapia ponds)

Experimental Design• The experiment will use 4 x 4000 m2 ponds, all at the
National Center for Brackishwater Aquaculture, Karawang. Pond 1) Shrimp only (15/m2) Pond 2) Shrimp + Gracilaria + Anadara, Pond 3) Tilapia only (15/m2) Pond 4) Tilapia + Gracilaria + Anadara.
• All ponds were prepared for mid August start (delayed to allow them to dry out sufficiently before adding the brackish water.
• Water is drawn from a tidal canal, mixed with river water to establish a low salinity (~17-25 mg/Kg).
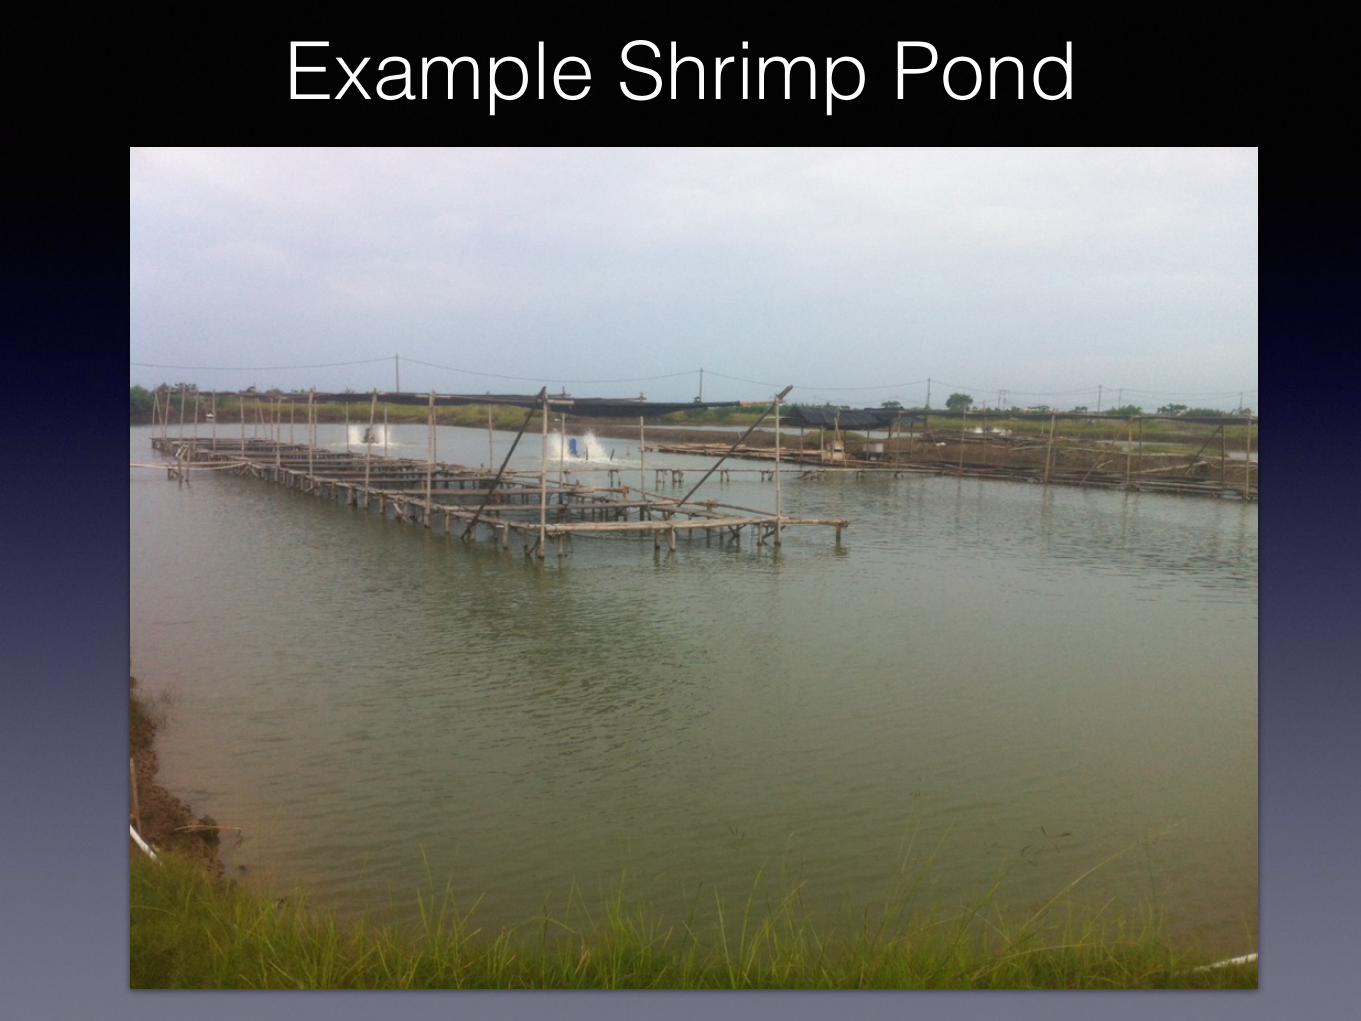
Example Shrimp Pond

Pond Layout SchematicGracilaria
Anadara

Growth of Shrimp and Tilapia
0"
20"
40"
60"
80"
MonoCulture" Mixed"Culure"
Weight'(g)'
Product'Yield'
Shrimp"
Tilapia"
Macronutrients
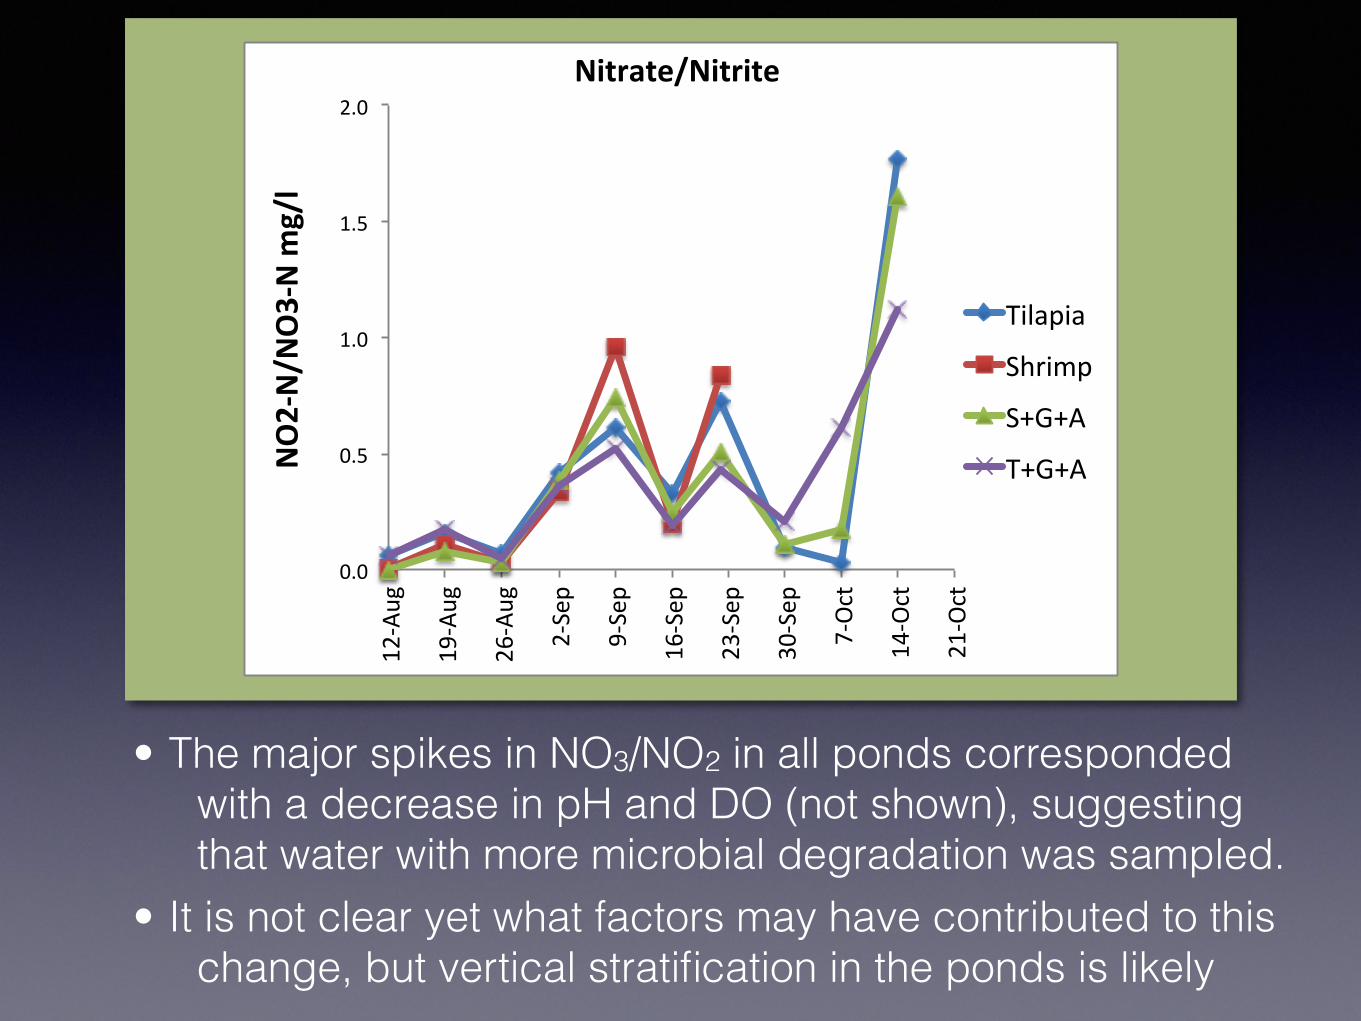
• The major spikes in NO3/NO2 in all ponds corresponded with a decrease in pH and DO (not shown), suggesting that water with more microbial degradation was sampled.
• It is not clear yet what factors may have contributed to this change, but vertical stratification in the ponds is likely
0.0#
0.5#
1.0#
1.5#
2.0#
12'Aug#
19'Aug#
26'Aug#
2'Sep#
9'Sep#
16'Sep
#
23'Sep
#
30'Sep
#
7'Oct#
14'Oct#
21'Oct#
NO2$N/N
O3$N'm
g/l'
Nitrate/Nitrite'
Tilapia#
Shrimp#
S+G+A#
T+G+A#

0.0#
0.1#
0.2#
0.3#
12'Aug#
19'Aug#
26'Aug#
2'Sep#
9'Sep#
16'Sep
#
23'Sep
#
30'Sep
#
7'Oct#
14'Oct#
21'Oct#
PO4$P%mg/l%
Phosphate% Tilapia#
Shrimp#
Shrimp#+#Gracillaria#+#Anadara#Tilapia#+#Gracillaria#+#Anadara#
• For phosphate, there is less coherence among the ponds, with elevated spikes in concentrations.
• There is no apparent pattern in the phytoplankton species counts that seem to correlate with this difference.

Macronutrients
• Silicate concentrations (appear) higher in the tilapia and mixed tilapia ponds than in the shrimp ponds.
• If this is biologically driven, we’d expect to find more diatoms in the shrimp ponds, and there is this trend.
• But the magnitude of the silicate difference is too large. We need to check for matrix effects in the silicate analysis for the shrimp ponds.
0.0#
2.0#
4.0#
6.0#
8.0#
12)Aug#
19)Aug#
26)Aug#
2)Sep#
9)Sep#
16)Sep
#
23)Sep
#
30)Sep
#
7)Oct#
14)Oct#
21)Oct#
Silicate((m
g/L)(
Silicate(
Tilapia#
Shrimp#
S#+#G#+#A#
T#+#G#+#A#
Macronutrients
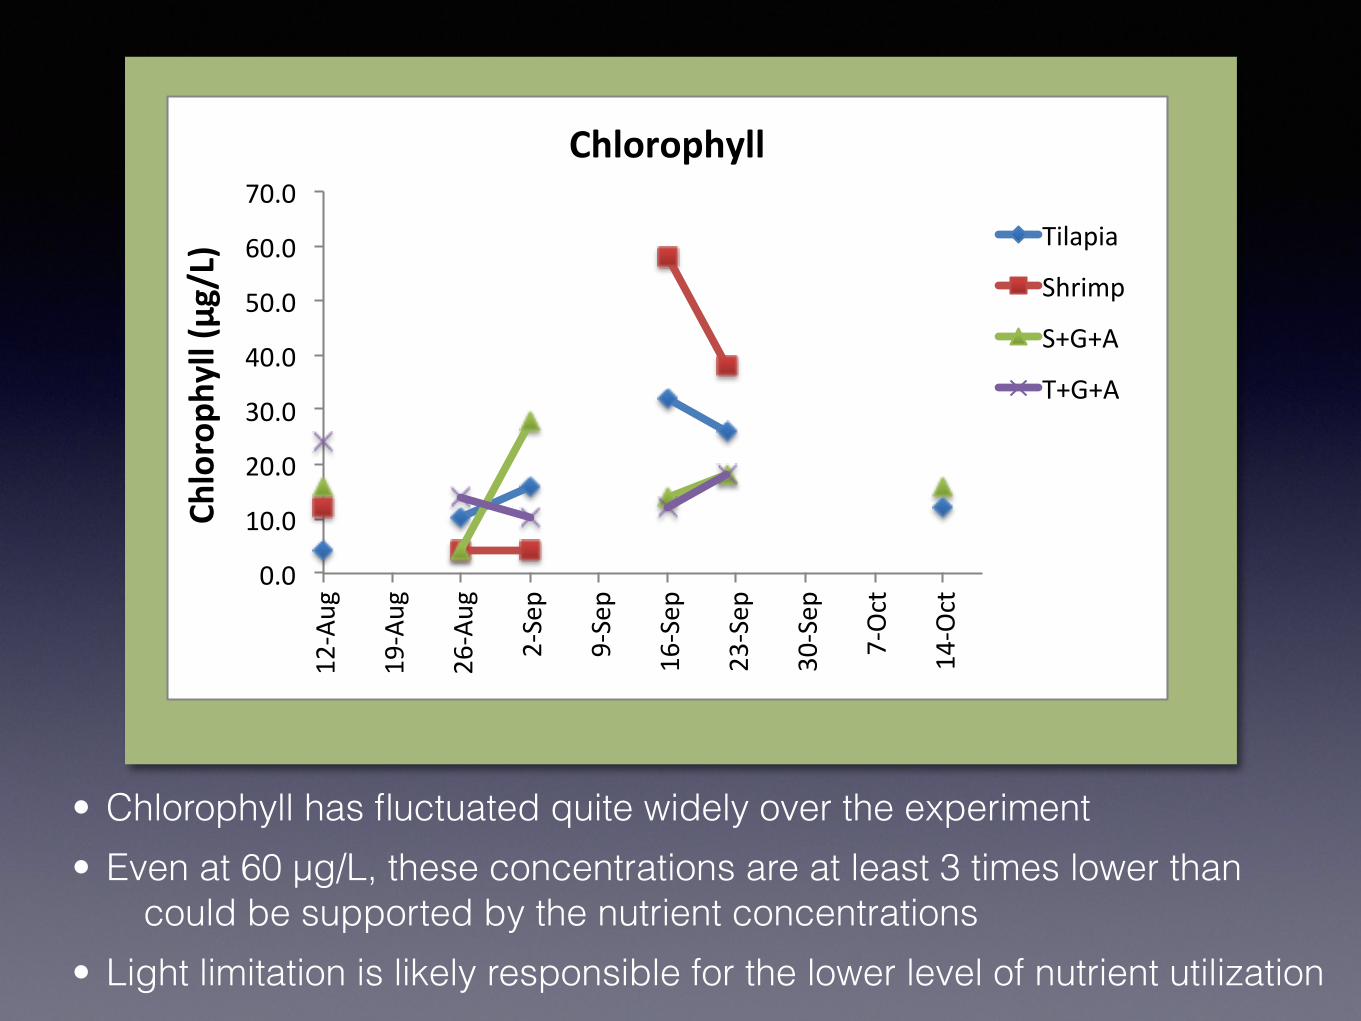
• Chlorophyll has fluctuated quite widely over the experiment • Even at 60 µg/L, these concentrations are at least 3 times lower than
could be supported by the nutrient concentrations • Light limitation is likely responsible for the lower level of nutrient utilization
0.0#
10.0#
20.0#
30.0#
40.0#
50.0#
60.0#
70.0#
12+Aug#
19+Aug#
26+Aug#
2+Sep#
9+Sep#
16+Sep
#
23+Sep
#
30+Sep
#
7+Oct#
14+Oct#
Chloroph
yll((µg
/L)(
Chlorophyll(
Tilapia#
Shrimp#
S+G+A#
T+G+A#

Early Findings1. There appears to be no negative effect on the Shrimp or
Tilapia weight gain in the ponds with the Gracillaria and Anadara.
2. Dissolved nutrient concentrations remain about 3x higher than found in highly productive natural coastal waters
3. Nutrient concentrations in all ponds seem to track each other reasonably well (particularly NO3/NO2). All samples were collected from 60 cm depth, so it is likely that vertical gradients have formed within the 1 m deep ponds. There also may be variation from site to site within the pond as the water circulates.
4. The next phase of the experiments will explore the effects of lowering nutrient additions on the performance of the ponds, with the key factor being to limit light reaching the pond floor.