the effect of profit shifting on the corporate tax base in the united states and beyond
DESCRIPTION
The Effect of Profit Shifting on the Corporate Tax Base in the United States and Beyond by Kimberly A. ClausingTRANSCRIPT
Electronic copy available at: http://ssrn.com/abstract=2685442
The Effect of Profit Shifting on the Corporate Tax Base in the United States and Beyond
November 2015
Kimberly A. Clausing Thormund A. Miller and Walter Mintz Professor of Economics Reed College 3203 SE Woodstock Blvd. Portland, OR 97202-8199 USA email: [email protected]
Abstract: This paper estimates the effect of profit shifting on corporate tax base erosion for the United States. Using Bureau of Economic Analysis survey data on U.S. multinational corporations over the period 1983 to 2012, the analysis estimates the sensitivity of foreign incomes to tax burdens for major foreign direct investment destinations. Controlling for a host of other variables as well as country fixed effects, I find that taxable income is very sensitive to corporate tax rates. Estimates of tax sensitivity are used together with data on reported foreign income to calculate how much “extra” income is booked in low-tax countries due to profit shifting; I then estimate what the tax base would be in the United States without profit shifting. I find that profit shifting is likely costing the U.S. government between $77 and $111 billion in corporate tax revenue by 2012, and these revenue losses have increased substantially in recent years. These findings are consistent with the stylized facts about large quantities of income booked in tax havens. I also undertake a speculative extension of this analysis to other countries, finding that corporate tax base erosion is likely a large problem in countries that do not have low tax rates. The paper concludes with a discussion of suggested reforms.

Electronic copy available at: http://ssrn.com/abstract=2685442
1
I. Introduction Corporate tax base erosion due to profit shifting is a large and consequential problem. It is a matter of simple mathematics that reduced revenue from the corporate tax base must result in lower government spending, higher tax revenues from other sources, or increased budget deficits; each possibility is likely unattractive. Beyond revenue consequences, corporate tax base erosion and profit shifting also affects the larger integrity of the tax system. National (or subnational) governments set tax policies, yet in an increasingly global world economy, the effects of these policy actions stretch beyond borders. Multinational firms adroitly respond to differential tax treatment, changing the geographic location of both economic activity and profits. Governments, realizing the mobility of global business, set tax policies that explicitly (or often, less transparently) lower tax rates on global firms. Such tax competition pressures are discussed elsewhere, but they suggest that international tax system design needs updating in the face of globalization.1 Further, corporate tax base erosion has consequences for the distributional burden of the tax system as a whole, consequences that are noteworthy due to the large documented increases in income inequality in recent decades. Most relevant evidence suggests that the corporate tax falls largely on capital or shareholders, but even if one assigns a fraction of the burden of the corporate tax to workers, it is still a more progressive tax instrument than other major sources of revenue, including the individual income tax, the payroll tax, and the VAT. Further, much capital income goes untaxed at the individual level, since a majority of such income is held in non-taxable form.2 Thus, the corporate tax has an essential role in taxing capital income, which is far more concentrated than labor income. In this context, it is important to estimate the size of the problem at hand. Almost all observers, both in the press and in academic research, describe corporate tax base erosion and profit shifting as an increasing problem. Indeed, the analysis below suggests that base erosion and profit shifting is a larger problem today than even before. I find that the revenue cost to the U.S. government from profit shifting has been increasing steadily over the previous decades, and that it is likely between $77 billion and $111 billion by 2012. For the world as a whole, including the United States, revenue losses may be in excess of $280 billion in 2012.3 The results here are broadly consistent with prior published findings in the literature discussed in Section II below. (See, e.g., Dowd, Landefeld and Moore (2014), OECD (2015), Crivelli et al (2015), de Mooij and Ederveen (2008) and de Mooij (2005).) 1 See, e.g., Clausing (2015) and other contributions to Dietsch and Rixen, eds. (forthcoming). 2Gravelle and Hungerford (2011) note that over 50% of individual passive income in the United States is held in tax-exempt form through pensions, retirement accounts, life insurance annuities, and non-profits. More recent analysis suggests that the share of U.S. equities that are held in taxable accounts is below 30%. 3The following analysis is limited to the other countries of the world that act as headquarters to major multinational firms.
2
Though there is some work using financial statement data, particularly from Europe, that suggests that the profit shifting problem may be shrinking, this work is based on incomplete data.4 The paper proceeds as follows. In Section II, I briefly review current knowledge on base erosion and profit shifting. In Section III, I present estimates of the size of the problem for the United States, and in Section IV, I extend those estimates for a speculative estimate of base erosion consequences for other countries. Finally, Section V discusses policy implications. II. Prior Work There is a large body of work on international profit shifting, indicating that the corporate tax base is quite sensitive to tax rate differences across countries. An early review of literature in this area is provided by Hines (1999) and subsequent reviews by de Mooij and co-authors (see de Mooij and Ederveen (2003), de Mooij (2005), and de Mooij and Ederveen (2008)) have confirmed a large and increasing problem of income shifting. My own prior work has provided a great deal of evidence of the tax sensitivity of transfer prices (see Clausing (2001, 2003, 2006)) as well as the large consequences of profit shifting behavior for U.S. government revenues (see Clausing (2009, 2011)). This work provides a preface to more recent estimates of the base erosion and profit shifting problem, including those found by the OECD. The OECD (2015) finds that the annual net tax revenue loss from tax planning is about $100 to $240 billion, and compares their estimates with those of the IMF, the JCT, and others; see OECD (2015, p.104-5). Three IMF economists (Crivelli, Keen, and de Mooij (2015)) finds that base erosion problems are quite large in developing countries, and likely to be more important (as a share of GDP) in this group of countries then in OECD countries. Their illustrative calculations indicate large revenue losses from base erosion due to profit shifting. Short run estimates are quite comparable to those found here; OECD countries lose $207 billion in revenue (0.23% of GDP) and developing countries lose $105 billion in revenue (0.84% of GDP). Long-run estimates are $509 billion for OECD countries, 0.6% of their GDP, and $213 billion for developing countries, 1.7% of their GDP. Keightly and Stupak (2015) describe the large and increasing problem of base erosion and profit shifting in the United States and elsewhere. Using several data sources including BEA survey data as well as international data on foreign direct investment from the IMF and the UN Conference on Trade and Development, they view the problem through several different lenses, all of which are consistent with a large magnitude of profit shifting. 4 Often this research uses the Orbis data, which has extremely limited data on tax haven countries. Even when observations exist, key data fields are often missing. Analysis using these data excludes the observations that are driving most of the income shifting behavior.
3
Indeed, the stylized facts are overwhelming in their confirmation of the scale of the profit shifting problem. (Some of these facts are discussed in Section III below.) For U.S. multinational firms, the share of income reported in foreign countries has been steadily increasing, and income booked in low-tax countries is implausibly high by any reasonable metric. As reported by Gravelle (2015), U.S. affiliate firm profits were 645% of Bermuda’s GDP and 547% of the Cayman Islands GDP in 2004.5 As absurd as these numbers are, they increased by 2010, to 1614% for Bermuda and 2,065% for the Caymans. Further, estimates indicate that U.S. multinational firms have accumulated over $2 trillion in permanently reinvested earnings in low-tax locations, over $1 trillion of which is held in cash.6 Due to the large amounts of income booked in low-tax countries and havens, the estimated costs of deferral has been increasing in recent years, and the JCT now estimates this tax expenditure at $83.4 billion for 2014. OMB estimates are somewhat lower, at $61.7 billion in 2014.7 Zucman (2014, 2015) uses balance of payments data to conclude that profit-shifting to low-tax jurisdictions is reducing U.S. corporate taxes by about 20%, or about $130 billion annually. Further, there is no question that this issue extends beyond U.S. multinational corporations. Americans are clearly not the only tax planners. In fact, analyses using Orbis data on disproportionately European firms, even when it can not examine tax haven affiliate observations in detail, still finds substantial magnitudes of income shifting, as shown by OECD (2015) and others. Of course, one of the difficulties in estimating the scale of the profit shifting problem is the limited data that are available, as well as the difficulty associated with establishing the counterfactual levels of profit in each country absent profit shifting incentives. In the OECD (2015) report on Measuring and Monitoring BEPS, they describe this problem in detail, noting that existing data sources are far from ideal. For example, the report highlights the difficulties associated with using financial reporting data to make inferences regarding profit shifting behavior. 5 Similar stylized facts regarding the scale of the problem are reported by many sources, including Keightly (2013) and OSPIRG/Citizens for Tax Justice (2015). 6 See, e.g., Kleinbard, Edward D., “Why Corporate Tax Reform Can Happen”, March 23, 2015, and Wall St. J., CFO Journal, Indefinitely Reinvested Foreign Earnings on the Rise, May 7, 2013. These funds are often held in US financial institutions, and are thus available to US capital markets, but US multinational corporations are constrained in their use of these funds. These funds are assets of the firm that increase the firm’s credit worthiness; however, firms cannot return the cash to shareholders as dividends or share repurchases without incurring US corporate tax liabilities upon repatriation. 7This represents the estimated revenue cost associated with allowing deferral of the U.S. tax on foreign income until it is repatriated. See Joint Committee on Taxation, Estimates of Federal Tax Expenditures for FY 2014-2018, available at https://www.jct.gov/publications.html?func=startdown&id=4663 and Office of Management and Budget, FY2016 Analytical Perspectives of the U.S. Government. Available at https://www.whitehouse.gov/sites/default/files/omb/budget/fy2016/assets/spec.pdf.

4
What is striking is that when one looks into the micro-data available, much of this newly revealed information does not appear to be visible – either because certain affiliates are not included or, where they are included, the financial information is missing. This reveals a clear disconnect between the information revealed through targeted public enquiries of some MNEs and the limited available tax information for those same MNEs from consolidated financial statements. (p.30-31)
In short, much of the relevant information is missing from financial statement data due to missing country coverage or missing information. Importantly, data are particularly likely to be missing for tax haven countries, and there are few if any observations of affiliate firms in havens that include the relevant data fields.8 Since tax havens are the destination for much profit shifting activity, making inferences on the scale of profit shifting from data that exclude such observations can be problematic. As an example, my estimates below suggest that 82% of profit shifting by U.S. multinational firms is destined for just seven tax haven locations. OECD (2015, p.33-4) also discusses other sources of information on base erosion and profit shifting activity. They highlight both U.S. BEA data, the data used in the present analysis, and tax return data as examples of best practices in data collection for analyzing base erosion and profit shifting.
In one example of nearly ideal data, Dowd, Landefeld, and Moore (2014) provide a very careful and persuasive study on the scale of profit shifting using U.S. tax return data from 2002-2010. Interestingly, and plausibly, they find a nonlinear tax response, with far more responsiveness at lower tax rates than at higher ones. Findings indicate tax semi-elasticities of -4.7 at corporate tax rates of 5% and -0.6 at tax rates of 30%. Yet others have smaller estimates of the profit shifting problem. Heckemeyer and Overesch (2013) provide a meta-analysis of income shifting studies in their working paper. From this analysis, they conclude that their best prediction of the tax semi-elasticity of corporate profits is -0.8, much smaller than what the above estimates and literature indicate. However, their meta-analysis relies on 25 studies, and the vast majority of the estimated elasticities use financial data, which are not well-suited to studying the question at hand for reasons just discussed. Dharmapala (2014) also argues that the income shifting problem is likely diminishing relative to the findings of earlier studies, basing his conclusion in part on the Heckemeyer
8 Cobham and Loretz (2014) document that data coverage in these financial data sets, and in particular Orbis, can be particularly weak or nonexistent where tax havens and less developed countries are concerned. Dowd, Landefeld, and Moore (2014, p.3) note an important weakness of studies relying on financial reporting data: “It can be difficult to get information on subsidiaries incorporated in some tax havens, such as Bermuda and the Cayman Islands, and therefore studies using this data leave out some of the major locations for income shifting.” My own discussions with several researchers that use these data have confirmed that this is a large problem.

5
and Overesch survey.9 While he acknowledges that Orbis data are (perhaps solely) responsible for the lower estimates in the recent literature, as well as the sense that the problem itself may be shrinking over time, he views the strengths of the data positively without focusing on the drawbacks associated with relying on these data.10 While he acknowledges the inconsistency between these findings and the stylized facts regarding income shifting activity, he does not provide compelling explanations for this puzzle, nor does he address the problem of missing data from tax haven affiliates, the likely culprit. My estimates below confirm the large scale of the profit shifting problem, alongside the work of OECD (2015), Crivelli et al (2015), Keightley and Stupak (2015), Dowd, Landefeld, and Moore (2014), Zucman (2014, 2015) and many earlier studies reviewed in de Mooij and Ederveen (2008). The estimates below rely on U.S. BEA survey data; these data are more suited to capturing the profit shifting problem than many data sources.
III. The Magnitude of Income Shifting The U.S. Bureau of Economic Analysis (BEA) does annual surveys of U.S. based multinational firms and their affiliated firms abroad. These data indicate a large discrepancy between the physical operations of U.S. multinational firm affiliates abroad and the locations in which they report their income. For example, Figure 1 shows the top ten locations of U.S. multinational firm affiliate gross profits in 2012; gross profits are net income with foreign income tax payments added.11 Of the top ten locations, seven of them are tax havens with effective tax rates less than 5%: Netherlands, Ireland, Luxembourg, Bermuda, Switzerland, Singapore, and the UK Caribbean Islands (including the Caymans). Effective tax rates are calculated as foreign income taxes paid by all affiliates in a given country relative to their income (net income plus foreign tax payments). These countries alone account for 50% of all foreign income earned by affiliates of U.S. multinational firms, but they only account for 5% of all foreign employment of such firms. Further, the economic size of these countries is quite small relative to this disproportionate profit; their combined population is less than that of Spain, or California. 9 Dharmapala (and others) have noted that corporate tax revenues are a small share of revenue for most developed countries, and that revenues have been relatively stable despite claims of increasing base erosion and profit shifting. Yet, as pointed out by Zucman (2014, p.133), it is important to remember that corporate profits have been increasing in recent years. “How can we reconcile the sharp decline in the effective corporate tax rate with the widely noted fact that corporate tax revenues have not declined as a share of US national income over the last 30 years…? The answer is that corporate profits have risen as a share of national income over time, from about 9 percent in the 1980s ... to about 14 percent in 2010-2013.” 10 Dharmapala places a large emphasis on the importance of controlling for firm-specific fixed effects. Still, due to the heterogeneity of the firms themselves, as well as the difficulty of capturing income shifting incentives based on changing firm tax treatments over time, it is likely that estimates using firm-level fixed effects may be a lower bound on income shifting behavior, even ignoring the substantial flaws and limitations of the Orbis data. 11 2012 is used since it is the most recent year with publicly available (albeit preliminary) data. Other recent years display similar patterns.
6
Some have critiqued this particular data series. The data include “income from equity investments”, some of which are counted more than once if there are tiers of ownership within the same country. Unfortunately, with existing data, it is not possible to account for this double-counting accurately. Still, one can use an alternative data series, also from the Bureau of Economic Analysis, on direct investment earnings. This data series excludes all income from equity investments.12 While eliminating the possibility of double counting, this series is also incomplete, since income from investments is excluded. Firm decisions regarding where such income is earned are no doubt influenced by tax incentives; these data would not show such income. Figure 2 shows top countries in terms of this direct investment earnings series, and it shows a similar pattern as Figure 1. The same seven countries with low effective tax rates are in the top ten countries: Netherlands, Ireland, Bermuda, Luxembourg, Singapore, the Cayman Islands, and Switzerland. Together, they account for 52% of all foreign direct investment earnings, a slightly higher fraction of the total than shown in Figure 1. In contrast, as shown in Figure 3, the top employment countries are all large economies with big markets. Effective tax rates are not particularly low for this set of countries. None of the top ten employment countries have effective tax rates below 12%. Regression analyses confirm these patterns. Tables 1 and 2 present an econometric analysis of the location of U.S. multinational firms’ employment, sales, property plant and equipment, assets, gross income, and direct investment earnings. The data employed are from U.S. Bureau of Economic Analysis (BEA) surveys of U.S. multinational corporations over the period 1983 to 2012. The analysis in Table 1 models the scale of economic activity (employment, sales, plant/property/equipment, assets, and income) as depending on the size of the economy (measured by GDP), the average income of the population (measured by GDP per-capita), the distance between the country and the United States, and the effective tax rate paid by U.S. affiliates. In Table 1, employment and PPE (plant, property and equipment) do not show a statistically significant relationship with the effective tax rate, but sales, assets and – especially – income and earnings, are negatively related to effective tax rates. Table 2 also includes country-specific fixed effects. Country fixed effects may be important, since country-specific influences are surely essential determinants of multinational firm activity, and econometric tests indicate that their inclusion is warranted. However, in these specifications, the relationships between effective tax rates and the dependent variables (which measure multinational activities) are estimated based solely on variation in tax rates within countries over time, since between country variation in tax rates (and other matters) are captured by the country-specific fixed effects. In these specifications, assets, income, and direct investment earnings continue to show large and statistically significant negative tax effects. For example, a one percentage point increase in the effective tax rate reduces gross income by 1.9%. 12Also, direct investment earning data cover non majority-owned affiliates, the data are pro-rated by the ownership share of U.S. parents, and the data are after-tax. In addition to these differences, there are other technical differences between the series.
7
The evidence in both tables is consistent with a long literature in the field of public finance that has emphasized a hierarchy of behavioral response to taxation, whereby timing and financial decisions are more tax-sensitive then real decisions about levels of economic activity.13 While some measures of economic activity are not particularly tax sensitive, profits are very sensitive to tax rate differences across countries, as shown in Tables 1 and 2. Estimating the Revenue Consequences of Income Shifting Behavior This section will use regression analysis and simple computations to estimate how U.S. government revenues are likely impacted by profit shifting activity. The analysis begins with regressions that relate affiliate profits to tax rates. The results from the regressions are used to calculate how the distribution of profits would differ absent tax rate differences among countries. Then some fraction of the lower foreign profits is attributed to the United States tax base. The first step is a regression analysis to generate semi-elasticities between profits and tax rates of foreign countries. As always, there are some judgment calls involved in selecting the ideal elasticity for these calculations. Tables 3 and 4 present eight options for the reader to consider. These options come with tradeoffs; Table 3 reports pooled specifications and Table 4 reports fixed effects specifications. As discussed above, country fixed effects are valuable since they allow investigators to control for unique country characteristics that may affect affiliate profitability. However, such specifications also limit the analysis to consider only variation in tax rates within countries over time, not employing the variation between countries in tax rates. Similarly, different specifications in columns (1) to (4) include different control variables: column (2) includes macroeconomic controls, column (3) includes controls that relate to the capital and labor use of affiliates in each country, and column (4) includes both types of controls. While it may seem ideal to include as many control variables as possible, it is also possible that income shifting itself can affect the scale of employment and investment in plant, property, and equipment in each country, or even in the case of havens, affect GDP measurements. For instance, some real economic operations may be required in order to shift income, and the ability to shift income to low-tax destinations increases the attractiveness of such destinations as bases for real activity. Also, GDP figures for tax havens are likely to be distorted by profit shifting activity. Thus, including these controls may underestimate the tax-sensitivity of profits, if some of that sensitivity is captured by the control variables.
13 Saez, Slemrod and Giertz (2012), Slemrod and Bakija (2008) and Auerbach and Slemrod (1997) summarize a vast body of research on taxation that suggests this hierarchy of behavioral response.

8
Nonetheless, the estimates of Tables 3 and 4 all indicate large, negative, and statistically significant relationship between gross profits and effective tax rates.14 The semi-elasticities range from -1.85 to -4.61, with an average estimate of -2.92. Estimated elasticities are quite similar if one instead uses data on the BEA direct investment earnings series. This average is in line with much of the prior literature on tax base elasticities, and it is similar to those found in the meta-analyses of de Mooij and Ederveen (2003, 2008) and de Mooij (2005). As noted above, Dowd, Landefeld, and Moore (2015) have argued that elasticities are likely to be non-linear. Using the best possible data available, US tax return data at the firm level, they find tax semi-elasticities of -4.7 at corporate tax rates of 5% and -0.6 at tax rates of 30%. Following Dowd, Landefeld, and Moore, I also ran specifications that allowed for a non-linear tax response, and I too found results that indicated higher elasticities at lower tax rates. Replacing the calculations below with calculations using nonlinear tax elasticities always raises the magnitude of my estimates of profit shifting. This is not surprising, since the majority of income is booked in countries with very low effective tax rates. Nonetheless, to err on the side of caution, I used the linear elasticities here. However, this consideration strengthens the case for using a higher benchmark elasticity. As previously discussed, some studies using financial/Orbis data have found smaller elasticities, but one should also note that these studies are using data that neglects the very observations that are driving the profit shifting phenomenon, affiliates operating in tax havens. There is very little information on such operations in the financial databases. This elasticity is then used to calculate what profits would be in the countries of operation of U.S. affiliates absent differences in tax rates between foreign countries and the United States. The United States has a statutory tax rate of 35%, though in this analysis, I assume that the U.S. effective tax rate would be lower (30%) and that this lower tax rate would apply to any increased income in the U.S. tax base. Table 5 shows the major locations where income is shifted. In cases of high-tax rate countries with effective tax rates above my assumed U.S. rate (e.g., in 2012, Denmark, Argentina, Chile, Peru, India, Italy, Japan, and others), foreign profits would be higher in the counterfactual, but in many other cases, foreign profits would be lower. In 2012, it is estimated that profits in high-tax countries were “too low” (due to income shifting incentives) by $26 billion, profits in medium-tax (15-30%) countries were “too high” by $36 billion, and profits in the lowest tax countries (with effective tax rates less than 15%) were too high (due to tax incentives) by $595 billion. As these numbers quickly indicate, most of the profit shifting is done with respect to the lowest-tax countries, and this finding corresponds with the stylized facts above.
14 Effective tax rate differences between the foreign and US country could also be used as an independent variable. If the US effective tax rate is not changing over time, this will lead to identical estimates as those presented here.
9
Indeed, the estimates of excess income booked in just the seven important tax havens highlighted in Figures 1 and 2 account for 82% of all of the total. Of the income booked in the Caymans ($41b), the Netherlands ($172b), Switzerland ($58b), Luxembourg ($96b) and Bermuda ($80b), this method suggests that profits absent income shifting incentives would instead be $9b in the Caymans, $33b in the Netherlands, $15b in Switzerland, $15b in Luxembourg, and $10b in Bermuda. As a comparison, profits booked in France and Germany are presently $13b and $17b, respectively. Once these profit adjustments are made, a fraction (38.7% in 2012) of the hypothetically lower foreign profits (on aggregate) are attributed to the U.S. tax base. The assigned fraction is based on the share of intrafirm transactions that occur between affiliates abroad and the parent firm in the United States, relative to all intrafirm transactions undertaken by affiliates abroad (with both the parent and affiliates in other foreign countries). Thus, in 2012, foreign affiliates of U.S. parent multinational firms undertook 38.7% of their affiliated transactions with the United States; the remaining 61.3% were with other affiliated firms abroad. Of course, this fraction itself is just a plausible benchmark. Finally, this number is scaled up, under the assumption that foreign multinational firms also engage in income shifting out of the United States. While the data do not allow a separate estimate of their profit shifting behavior, I assume that it would increase the revenue costs of income shifting by a factor that is based on the ratio of the sales of affiliates of foreign-based multinational firms in the United States (a proxy for the ability of foreign multinational firms to shift income away from the United States) to the sales of affiliates of U.S. based multinational firms abroad (a proxy for the ability of U.S. multinational firms to shift income away from the United States). Sources of underestimation and overestimation are discussed below. Table 6 summarizes these estimates, including the main estimate using the BEA income series (net income plus foreign taxes paid) as well as an alternative estimate using the BEA direct investment earnings series. Column 2 shows the total income earned abroad by foreign affiliates of U.S. firms. Column 3 shows the estimated U.S. tax base increase if income shifting incentives were eliminated. Column 4 shows the reduction in U.S. corporate income tax revenues due to income shifting, assuming that marginal revenues are taxed at 30%; revenue estimates would of course be higher if one assumed that marginal additional profits would be taxed at the statutory rate. Column 5 shows actual corporate tax revenues in the corresponding year, as a comparison. By 2012, the revenue cost of income shifting behavior is estimated at $111 billion. The alternative estimate uses the BEA direct investment earnings series. This series avoids double-counting, but also eliminates some types of income shifting. Column 2 indicates total direct investment earnings abroad over the period 2004-2012; data from the BEA are adjusted to include foreign taxes paid and to reverse the BEA’s adjustment of the data by the US parent equity ownership percentage. Column 3 shows the estimated increase in the U.S. tax base, again employing the methodology used for the main estimates. Using this series, the resulting revenue reduction estimates are lower, due to

10
the combined effects of the elimination of double-counting and the omission of some types of income. Unfortunately, with available data, one can not separate these two effects. Figures 4 and 5 illustrate the changes in these estimates of revenue loss due to profit shifting over the period of the study, 1983 to 2012. The strong upward trend is not a reflection of increasing tax responsiveness in terms of the elasticity of the tax base with respect to a given tax rate difference, since that is assumed to be constant over this period. Instead, it is due to two factors. First, and most important, the total amount of foreign profits is increasing dramatically over this period. Income of all foreign affiliates was $525 billion in 2004, and it grew to $1.2 trillion by 2012; direct investment earnings increased by similar magnitudes, more than doubling in eight years. Second, the average foreign effective tax rate has continued to fall over this time period, also contributing to income shifting incentives. Sources of Uncertainty There are several assumptions required for this analysis that generate uncertainty surrounding these estimates. Below, I enumerate the sources of uncertainty and discuss their possible effects on the estimates. 1. The analysis begins with a regression of gross profits (net income plus foreign taxes)
on effective tax rates. While eight specifications are presented, all yield large semi-elasticities, between -1.85 and -4.61. I have chosen to present estimates based on a semi-elasticity of -2.92, the average of estimates presented in tables 3 and 4. This elasticity is also consistent with studies reviewed in de Mooij and Ederveen (2003, 2008) and de Mooij (2005). Allowing for non-linear responses, as suggested by the work of Dowd, Landefeld, and Moore (2014), would generate even larger estimates of profit shifting, due to larger elasticities applying to the bulk of the foreign income.
2. The analysis assumes that, absent income shifting incentives, lower foreign profits would be earned, and a fraction of those profits would be earned instead in the United States. That fraction is calculated each year as the ratio of foreign affiliate sales to parent firms in the United States relative to foreign affiliate sales to both parents and affiliated firms in other countries. In 2012, this fraction is 38.7%. There is no particularly good reason to think that exactly this fraction of the excess income would be earned in the United States. However, in considering the potential to shift income, the terms and nature of intrafirm transactions provide one essential method for shifting income. Thus, the assumption here is that income would be shifted across destinations in proportion to these intrafirm transactions.
3. The final estimate is scaled up to account for the income shifting of foreign multinational firms. This is based on the ratio of the sales of affiliates of foreign based multinational firms in the United States to the sales of affiliates of U.S. based multinational firms abroad. This is an arbitrary scaling that is based on a rough proxy

11
for the ability of each type of multinational firm to shift income out of the U.S. tax base: in particular, the degree of their affiliated firm sales.15
4. There is some double-counting in the BEA gross income data of Table 6. The data include “income from equity investments”, some of which are counted more than once if there are tiers of ownership within the same country. Unfortunately, with existing data, it is not possible to account for this double-counting accurately. Still, one can use an alternative data series, also from the Bureau of Economic Analysis, on direct investment earnings. This data series excludes all income from equity investments. Unfortunately, this series is also incomplete, since income from investments is left out. Nonetheless, Table 6 reports alternative estimates that are based on this series. The alternate estimates may understate the size of the profit-shifting problem due to some omitted income, but the first estimates may overstate the size of the problem due to some double-counting.
5. This analysis assumes the U.S. corporate tax rate that would apply to any increased tax base is 30%; likewise, it uses the 30% rate when calculating the tax rate difference between the U.S. rate and the foreign effective tax rate. If the statutory rate were used instead, the calculated revenue losses would be higher. If a lower effective tax rate were used for the United States, the revenue losses would be lower. The analysis assumes that there will be little residual tax collected by the United States on foreign income earned in lightly-tax jurisdictions; this assumption is consistent with the evidence on this question.16
6. This analysis would not capture methods of tax avoidance that might reduce worldwide taxable income. For example, Mintz and Weichenrieder (2010) demonstrate how indirect financing structures avoid taxation by maximizing interest deductions. Conduit affiliated entities operating in low-tax countries can loan money to operating affiliates in third countries, that deduct their interest payments to the conduit affiliates. A second interest deduction can be taken if the parent finances the investment in the conduit affiliate with debt. The interested reader is referred to Mintz and Weichenrieder (2010) for more detailed information on indirect financing structures. Kleinbard (2011) also discusses the importance of stateless income, whereby firms create income that is not taxed in any jurisdiction. It is unclear how much of this income would appear in the BEA data.
15 For example, in 2012, affiliates of foreign-based multinational firms in the United States had $4.09 trillion in sales, and foreign affiliates of U.S. parents had $6.98 trillion in sales. So for 2012, that would suggest scaling up by 58.5%. This implies that affiliates of foreign-parent firms operating in the United States are generating a bit over a third of the total income shifting out of the U.S. tax base. 16 As Altshuler and Grubert (2013, p.31) report, using 2006 data, only $32b is collected on all foreign source income, amounting to less than 4% of foreign income. “But the amount raised from dividends represents only a very small portion of this revenue. Indeed if dividends are removed from taxable foreign income, total U.S. tax revenue increases by about one billion. The dividends taxable on the margin after credits are more than offset by the credits originating with dividends that currently spill over to other income.” (The quote is from a draft version of the paper.)
12
In summary, item 1 is addressed by providing an average estimate based on different elasticities, but it generates a lower overall tax responsiveness than one would find allowing for non-linear responses to low-tax rate jurisdictions. Items 2, 3, and 5 have no clear direction of bias. Item 6 suggests that the estimates of Table 6 may be underestimates of the true size of the revenue costs of income shifting. Item 4 suggests that the first set of estimates of Table 6 may be an overestimate of the revenue costs of income shifting. However, an alternative estimate is also provided in this table, using a data series that likely provides an underestimate since it does not include all sources of income. IV. A Speculative Extension to the World As noted above, these estimates pertain only to the behavior of U.S. multinational firms. Nonetheless, the overall scale of the problem for the world at large can be approximated by relating these estimates to larger aggregates. While the precise magnitudes of the problem are likely unknowable, one can nonetheless get a sense of the scale of corporate base erosion and profit shifting for major countries. Of course, a serious hurdle in scaling up the estimates for the United States is the absence of comparable publicly-available survey data for most countries. However, one can utilize data from the Forbes Global 2000 list of the world’s largest corporations; these data indicate the location of corporate headquarters and the overall level of worldwide profits for the world’s biggest corporations. Still, the present extension is limited by data constraints to the major countries that headquarter large multinational firms. Data on less developed countries is sparse. Table 7 summarizes the major countries that headquarter the world’s largest firms. 62 countries are home to the world’s largest 2000 firms, but this fact masks even greater concentration, since 25 countries are home to 95% of the profits earned by this group of firms. Table 7 shows these countries, alongside their share of the global 2000 firm profits in 2012. Figure 6 shows the distribution of the profits of Global 2000 firms, organized by headquarters country. Note that this does not show where profits are booked for tax purposes, merely the headquarters locations of the world’s most profitable firms. The headquarters of 72% of the world’s profits are in OECD countries, and 92% are headquartered in OECD countries and the other big economies that include Brazil, China, India, Indonesia, Russia, Saudi Arabia, and South Africa. Another 4% of world profits are headquartered in six major haven destinations: Bermuda, Caymans, Channel Islands, Cyprus, Hong Kong, Singapore, although Singapore and Hong Kong could also be classified as big economies in their own right. Less than 4% of headquarters are in the other countries of the world. I use this collection of countries to estimate the global scale of corporate tax base erosion. This estimation, while speculative and only indicative of approximate magnitudes, proceeds in several steps.
13
1. Since we do not have detailed data on the location of affiliates of worldwide
multinational firms, I proceed from the assumption that all multinational firms have affiliates in two types of countries: low-tax countries and high-tax countries. For example, for the United States in 2012, multinational firms report 1.2 billion in income abroad, of which $800 billion is booked in 17 low-tax countries. These are the countries that I consider destinations for artificial income shifting abroad. Not all of these countries are havens, but all have effective tax rates that are less than 15%, which is the arbitrary cut-off that I use for low-tax countries.17 As shown in Table 5, these countries are the destinations for 98% of the estimated profit shifting for United States multinational firms.
2. For countries that are headquarters to Global 2000 firms, but that are not low-tax countries, I assume that their share of income booked in low-tax countries is proportionate to the share of U.S. multinational firm foreign income that is booked in low-tax countries. For example, since the United States headquarters 33.3% of the global profits of Global 2000 firms, and Germany headquarters about 3.3% of the global profits of Global 2000 firms, I assume that German multinational firms have about 10% of the U.S. level of profits in low-tax countries, or about $80 billion.18
3. I assume that foreign country effective tax rates on foreign income are five percentage points less than their statutory rates (inclusive of sub-federal taxation). For example, in the Japanese case, the statutory tax rate (including subfederal taxation) is 39.5% in 2012, so I assume an effective tax rate of 34.5% on corporate profits, allowing for some degree of tax base narrowing.19
4. Then, I model profit shifting between the higher-tax headquarters countries and the low-tax countries identified in step one, which on average have an effective tax rate of 6.6%. I use this average tax rate to calculate the tax difference between the headquarters country and the low-tax countries, apply a semi-elasticity of 2.92 (as used above) with respect to tax rate differences, and then calculate the likely magnitude of profit shifting to low tax countries. While this elasticity is based on the U.S. estimates above, it is a reasonable benchmark, since the focus here is solely on
17 It is assumed here that Forbes Global 2000 firms are likely operating throughout the world, and have some operations in tax havens. This population of firms is used to estimate where major multinational firms are headquartered. Income shifting is then assumed to take place, away from higher-income countries and towards those with tax rates under 15%. 18 This assumption is most reasonable if foreign headquartered multinational firms are similarly tax-responsive as their U.S. counterparts. However, there are some reasons to doubt that this will be the case in every instance. First, some countries have tax cultures that are more compliant than the U.S. tax culture. As an example, Japanese multinational firms are thought to be more dutiful in their attitude toward tax. Second, some countries have tougher CFC laws than those in the United States, and this may reduce the incentive for multinational firms headquartered in such countries to shift profits abroad. 19Clearly, this assumption is arbitrary, and depends a great deal on provisions of particular country tax codes that create divergences between statutory and effective tax rates. Many observers have noted that foreign tax bases are defined more broadly than the U.S. counterpart, but this varies by country.

14
the subset of countries with very low tax rates, and tax elasticities with respect to foreign country tax rates are likely non-linear.20
5. Estimates from step 4 are used to create a global estimate of how much excess income is booked in low tax countries. In the United States case, this method suggests that, of the $800 billion booked in the 17 low-tax countries, about $545 billion would not be booked in such countries absent the tax rate difference. For the group of big headquarters countries that are not low-tax countries, including the United States, the total is $1,079 billion.
6. The excess $1,079 billion is assigned to the tax bases of higher-tax headquarters countries based on their share of GDP for this higher-tax group of countries. For example, Germany has 6.3% of the higher-tax headquarters countries’ total GDP, so they are assumed to recoup 6.3% of the $1,079 billion that is artificially in low-tax countries, as a higher German corporate tax base. The assumed German revenue gain is then the German effective tax rate multiplied by this additional tax base, or $17 billion.21
Under these calculations, the United States recoups 29% of the excess $1,079 booked in low tax countries, which assuming a 30% effective tax rate, generates a revenue loss due to profit shifting of $94 billion. Note that the United States result is different from those in Table 6, since it employs a different assumption about how excess income in low-tax countries would be booked in the counterfactual (that is based on GDP shares rather than affiliate transaction shares). The present analysis also employs a more aggregated estimate of income shifting, based on shifting between the home country and a group of 17 low-tax countries, whereas the analysis in Section III considered bilateral shifting incentives instead. Yet the estimate here is similar to those of Table 6, falling between the two estimates of $77 billion and $111 billion. Table 8 shows the results of these calculations for other countries. While this analysis is far more broad-brush than the analysis for the United States, it does give a back-of-the-envelope estimate of the likely magnitude of this problem for other countries that do not have low tax rates. Overall, revenue losses total $280 billion for this group of countries, 20.4% of their total corporate tax revenues. This estimate is in line with the short run estimates of Crivelli et al (2015). 20The non-linear elasticities suggested by Dowd, Landefeld, and Moore (2014) would suggest using a higher elasticity, since the average tax rate of the low-tax countries here is 6.6%, suggesting a semi-elasticity in excess of 4. If one instead employs a smaller elasticity of 2, one finds the total excess income in low tax countries would be $739 billion, generating a revenue loss for the group of $192 billion. This can be compared with results in Table 8. 21 In the analysis for the United States in Section III, I was able to assign a fraction of the excess income in havens to the United States based on the share of affiliate transactions that occur between the affiliate and the United States, relative to affiliates throughout the world. Here, since there are no comparable data for other countries, I simply assume that higher-tax countries would recoup lost tax base in proportion to their share of higher-tax country GDP. While this is an arbitrary assumption, it may be reasonable since corporate income may be proportionate to the size of the underlying economies that generate the income. That said, some of this excess income may belong in countries outside the sample, including less developed countries.

15
Of course, the sources of uncertainty are larger here than they are for the United States analysis, so these estimates should be viewed as merely indicative. Regarding the assumptions above, some are simpler than others. Key sources of uncertainty are discussed in footnotes accompanying each step. I also provide an alternative estimate that uses a smaller tax elasticity in footnote 20. To the extent that foreign multinational firms have a more compliant tax culture or more effective corporate tax base erosion protections, the alternative estimate may be more appropriate.22 Still, the Dowd, Landefeld, and Moore (2014) analysis suggests that higher tax elasticities may apply, since the income shifting is occurring with respect to very low-tax countries. V. Policy Options The OECD/G20 BEPS Process Both the prior literature, and the present analysis, indicate that profit shifting is likely eroding the corporate tax base in many countries. In response to pressing concerns about income shifting, evidenced by priority in recent G-8 and G-20 meetings, the OECD undertook the BEPS project, where BEPS stands for base erosion and profit shifting. The OECD has made a Herculean effort to develop concrete action plan recommendations to help countries address the problems of corporate profit shifting. The final BEPS project reports were issued in October 2015, totaling nearly 2000 pages. These attempts to better connect taxable profits to economic activity are helpful, and the suggested measures are likely to incrementally curb profit shifting activity. The OECD/G20 process is commendable for pushing forward efforts toward international cooperation in this area. However, there are many reasons to suspect that profit shifting problems are not over. For one thing, country adoption of the proposals is likely to be uneven and incomplete, since the OECD recommendations are not binding. Also, fundamental problems will likely continue to vex policy-makers in years ahead. An essential difficulty lies in the problem of establishing the source of income for firms that are truly globally integrated. The very existence of multinational firms is testament to the fact that the global integration of business generates profit above and beyond what would be generated if domestic businesses merely interacted at arms’ length. Since multinational firms earn more than their component parts would have earned alone, it is an arbitrary exercise to figure out where the additional profit should reside. Modern notions of economic value also impede this exercise, as firms often generate value that is based on ideas and innovations that are truly intangible. The intangible nature of much intellectual property makes it even more difficult to establish the source of economic value.23 22 Clausing (2015) reviews evidence on the comparative strength of foreign CFC laws and also discusses the possibility that the Japanese tax culture may be unusually compliant. 23 A particularly colorful description of this problem is found in O’Keefe and Jones (2015), “How Uber plays the tax shell game”, Fortune, 22 October 2015.

16
These conundrums are compounded by the fact that multinational firms have every incentive to redirect profits to low-tax locations through clever financial and accounting arrangements. The tax departments of major multinational firms are widely thought of as profit centers, and there are armies of accountants and lawyers working to develop innovative tax minimization strategies, often several steps ahead of government treasuries. Thus, while there are many helpful parts of the OECD recommendations, including the steps toward country by country reporting, one wonders if the requisite political will can be mustered to close the loopholes that enable pervasive profit shifting. And, even as changes are made, tax planners may remain several steps ahead of policy-makers. It remains to be seen whether these efforts will be sufficient to reduce the problem substantially. More Fundamental Reforms: 1. Worldwide Consolidation Under worldwide consolidation, discussed in Joint Committee on Taxation (JCT) (2011), and favored by Kleinbard (2011b) and Avi-Yonah (2013), a multinational firm would be required to consolidate the income earned across the parent firm and its affiliates, and all income would be taxed currently, allowing a credit for foreign taxes. JCT (2011, p.100-101) summarizes the approach, applied to the United States:
The U.S. group would include on its return the foreign corporation’s items of income, gain, deduction and loss, the character of such items would be preserved, and the foreign tax credit would be retained…. under the consolidation approach, losses of foreign subsidiaries would be included on the U.S. return.... the consolidation regime would apply only to U.S. corporate shareholders of foreign subsidiaries.
One pragmatic issue concerns the degree of ownership that would act as a threshold for the required consolidation: options discussed by JCT include 80%, 50%, and 10%. A worldwide consolidation approach has several benefits relative to the current system: there would be less tax-motivated shifting of economic activity or book income to low-tax locations, since such shifting would be less likely to affect a multinational firm’s overall tax burden.24 There would thus be fewer concerns about inefficient capital allocation or corporate tax base erosion. Also, there would be no “trapped cash” problem since income would be taxed currently. However, depending in part on the corporate tax rate that would accompany this change, the proposal may raise competitiveness concerns for high-tax countries if firms would 24 For firms with excess tax credits, there would still be an incentive to avoid earning income in high-tax countries and to earn income in low-tax countries. Excess tax credits are only likely if the average effective foreign income tax rate exceeds the residence country tax rate.
17
face rising foreign tax burdens under consolidation. Some also worry that this proposal would put stress on the definition of residence. Although some (e.g., Shaviro (2011)) have argued that residence is increasingly elective, others argue that relatively simple legislation would make it difficult to change residence for tax purposes. Governments could require that corporate residence indicate the true location of the “mind and management” of the firm; a similar U.K. definition of residence is deemed effective by both Avi-Yonah (2013) and Kleinbard (2011b). It is also feasible to develop anti-inversion measures along the lines of those suggested by Clausing (2014), Kleinbard (2014), or Shay (2014). Finally, while there is little real-world experience with such a system, it still falls within international norms, since double taxation is prevented through foreign tax credits. The proposal could be implemented without disadvantaging major trading partners, and it could be adopted unilaterally, though Avi-Yonah (2013) recommends that countries take a multilateral approach. 2. Formulary Apportionment Under formulary apportionment, worldwide income would be assigned to individual countries based on a formula that reflects their real economic activities. Often, a three-factor formula is suggested (based on sales, assets, and payroll), but others, including Avi-Yonah and Clausing (2008), have suggested a single-factor formula based on the destination of sales.25 The essential advantage of the formulary approach is that it provides a concrete way for determining the source of international income that is not sensitive to arbitrary features of corporate behavior such as a firm’s declared state of residence, their organizational structure, or their transfer pricing decisions. If a multinational firm changes these variables, it would not affect their tax burden under formulary apportionment.26 Importantly, the factors in the formula are real economic activities, not financial determinations. Saez, Slemrod and Giertz (2012), Slemrod and Bakija (2008) and Auerbach and Slemrod (1997) summarize a vast body of research on taxation that suggests this hierarchy of behavioral response: real economic decisions concerning employment or investment are far less responsive to taxation than are financial or accounting decisions. For multinational firms, this same pattern is clearly shown in the data analyzed in Tables 1 and 2. There is no doubt that disproportionate amounts of income (compared to investment, sales, or employment) are booked in low-tax countries.
25 As an example, if a multinational company earned $1 billion worldwide, and had 30% of their payroll and assets in the United States, but 60% of their sales in the United States, their U.S. tax base would be $400 million under an equal weighted formula (((.3+.3+.6)/3) * $1 billion), and $600 million under a single sales formula ((.6) * $1 billion). 26 This assumes that the multinational firm has a taxable presence (i.e., nexus) in the locations where it has employment, assets, and sales.
18
With a formulary approach, firms have no incentive to shift paper profits or to change their tax residence, since their tax liabilities are based on their real activities. However, concerns about efficient capital allocation may remain. Under a three-factor formula, there is still an incentive to locate real economic activity in low-tax countries, which raises concerns regarding efficient capital allocation. This is somewhat less of a concern under a sales based formula, since firms will still have an incentive to sell to customers in high-tax countries regardless.27 Also, prior experience in the United States, which uses formulary apportionment to determine the corporate tax base of U.S. states, has indicated that formula factors (payroll, assets, and sales) are not particularly tax-sensitive.28 If all countries were to adopt formulary apportionment, there would be few concerns about competitiveness. Multinational firms would be taxed based on their real economic activities (in terms of production and sales) in each country, so firms would be on an even-footing with other firms (based in different countries) that had similar local operations. If only some countries adopt formulary apportionment, competitive effects depend on the circumstances of particular firms.29 Ideally, formulary apportionment would be adopted on a multilateral basis. However, if some countries adopt, there are mechanisms that would encourage other countries to follow early adopters.30 Another related approach is to utilize a formulary profit-split method. The tax base would be calculated as a normal rate of return on expenses, with residual profits allocated by a sales-based formula. With careful implementation, such an approach might lessen concerns regarding tax competition under a formulary approach. Elsewhere, I provide more detail on the advantages and disadvantages of formulary approaches.31 VI. Conclusion This paper undertakes a comprehensive analysis of the corporate tax base erosion problem, estimating the revenue costs of profit shifting activity for the U.S. government. Using survey data from the Bureau of Economic Analysis, I find that profit shifting is likely to cost the U.S. government between $77 and $111 billion annually by 2012. The scale of the revenue loss is commensurate with several stylized facts about the size of the problem, including the large magnitudes of income booked in tax havens. In 2012, for 27 This is particularly the case for final goods. For intermediate goods, this is more problematic. 28 See Clausing (2014) for an in-depth analysis of this question. Whether this tax-insensitivity would hold at higher corporate tax rates is an empirical question. Still, the forces of tax competition (mobility of production, competitive pricing, etc.) are likely stronger between U.S. states than between foreign countries. 29 This also generates the potential for double-taxation or double non-taxation, although that is also a problem under the present system. 30 There is a natural incentive for countries to follow suit, as discussed in Avi-Yonah and Clausing (2008). In particular, once some countries adopt formulary apportionment, remaining separate accounting (SA) countries would lose tax base to formulary apportionment (FA) countries, since income can be shifted away from SA countries to FA countries without affecting tax burdens in FA locations (since they are based on a formula). 31 This work includes Avi-Yonah and Clausing (2008), and Avi-Yonah, Clausing, and Durst (2009).
19
example, foreign affiliates of U.S. multinational firms booked $800 billion of income in countries with effective tax rates less than 15%; the average effective tax rate for these countries was 6.6%. I also find that estimates of the revenue cost of income shifting are increasing over time. This trend reflects the increasing magnitude of profits booked in low-tax countries as well as continued corporate tax rate reductions abroad. These estimates have the advantage of using comprehensive survey data that includes operations in many tax haven countries, unlike many studies that rely on financial data. While all such estimates entail numerous assumptions, I have attempted to err on the side of caution in my assumptions, and I also provide alternative estimates. In addition, using data on the Forbes Global 2000 list of the world’s largest corporations, I provide a speculative extension of the estimates to other countries. I assume that multinational firms based in other countries also shift income to low-tax destinations in proportion to the tax rate difference between the home market and the low-tax country group. I find that profit shifting to low-tax countries may be costing headquarters countries without low tax rates approximately $280 billion annually, including revenue losses to the United States. These estimates entail several assumptions that are likely more speculative than those in the analysis for the United States. If foreign multinational firms are based in countries with tough tax base protections, or if these firms are simply less responsive to tax rate differences, that could lower these estimates. Still, the world is larger than the set of countries that act as headquarters to major multinational firms, and other countries are ignored in this analysis, understating the scope of the profit shifting problem. Crivelli et al (2015) discuss how profit shifting problems are likely to be especially pressing in less developed countries, relative to the size and affluence of their economies. Further, less developed countries are likely to have insufficient institutional capacity to handle the myriad enforcement difficulties associated with profit shifting behavior. These concerns highlight the importance of policy action to address the problems associated with tax competition and corporate tax base erosion. The OECD/G20 BEPS process has promising elements, and it is a useful step forward. Still, we face essential difficulties in establishing the source of income in an increasingly global world economy. More fundamental reforms, such as worldwide consolidation or formulary apportionment, are likely to be more successful at stemming corporate tax base erosion in an era of globally integrated business and agile taxpayers.

References Altshuler, Rosanne, and Harry Grubert. 2013. “Fixing the System: An Analysis of
Alternative Proposals for the Reform of International Tax.” Rutgers University Department of Economics Working Paper.
Auerbach, Alan J., and Joel Slemrod. 1997. “The Economic Effects of the Tax Reform Act of 1986.” Journal of Economic Literature 35 (June): 589–632.
Avi-Yonah, Reuven S. 2013. “Hanging Together: A Multilateral Approach to Taxing Multinationals.” U of Michigan Public Law Research Paper No. 364. Ann Arbor.
Avi-Yonah, Reuven S., and Kimberly A. Clausing. 2008. “Reforming Corporate Taxation in a Global Economy: A Proposal To Adopt Formulary Apportionment.” In Path to Prosperity: Hamilton Project Ideas on Income Security, Education, and Taxes, edited by Furman and Bordoff, 319–44. Washington: Brookings Institution Press.
Avi-Yonah, Reuven S., Kimberly A. Clausing, and Michael C. Durst. 2009. “Allocating Business Profits for Tax Purposes: A Proposal to Adopt a Formulary Profit Split.” Florida Tax Review 9: 497–553.
Clausing, Kimberly A. forthcoming. “The Nature and Practice of Capital Tax Competition.” In Global Tax Governance, edited by Peter Dietsch and Thomas Rixen. ECPR Press.
———. 2001. “The Impact of Transfer Pricing on Intrafirm Trade.” In International Taxation and Multinational Activity, edited by Jr. James R. Hines, 173–94. Chicago: University of Chicago Press.
———. 2003. “Tax-motivated Transfer Pricing and US Intrafirm Trade Prices.” Journal of Public Economics 87 (September): 2207–23.
———. 2006. “International Tax Avoidance and U.S. International Trade.” National Tax Journal 59 (June): 269–87.
———. 2009. “Multinational Tax Avoidance and Tax Policy.” National Tax Journal 57 (December): 703–25.
———. 2010. “Should Tax Policy Target Multinational Firm Headquarters?”.” National Tax Journal 63 (4): 741–63.
———. 2011. “The Revenue Effects of Multinational Firm Income Shifting.” Tax Notes, March, 1580–86.
———. 2014. “Lessons for International Tax Reform from the U.S. State Experience Under Formulary Apportionment”, June.
———. 2015. “Beyond Territorial and Worldwide Systems of Taxation.” Journal of International Finance and Economics 15 (2): 43–58.
Cobham, Alex, and Simon Loretz. 2014. “International Distribution of the Corporate Tax Base”. ICTD Working Paper 27.
Crivelli, Ernesto, Michael Keen, and Ruud A. de Mooij. 2015. “Base Erosion, Profit-Shifting, and Developing Countries”. WP 15/09. Oxford University Centre for Business Taxation Working Papers.
De Mooij, Ruud A. 2005. “Will Corporate Income Taxation Survive?” De Economist 153 (September): 277–301.
De Mooij, Ruud A., and Sjef Ederveen. 2003. “Taxation and Foreign Direct Investment: A Synthesis of Empirical Research.” International Tax and Public Finance 10 (November): 673–93.

———. 2008. “Corporate Tax Elasticities: A Reader’s Guide to Empirical Findings.” Oxford Review of Economic Policy 24: 680–97.
Dharmapala, Dhammika. 2014. “What Do We Know About Base Erosion and Profit Shifting? A Review of the Empirical Literature.” Fiscal Studies 35 (4): 421–48.
Dietsch, Peter, and Thomas Rixen. forthcoming. Global Tax Governance. Dowd, Tim, Paul Landefeld, and Anne Moore. 2014. “Profit Shifting of U.S.
Multinationals.” Joint Committee On Taxation Working Paper. Economist Magazine. 2015. “Corporate Taxation: New Rules, Old Paradigm”, October
10. Gravelle, Jane. 2015. “Tax Havens: International Tax Avoidance and Evasion.” CRS
Report for Congress. Washington DC: Congressional Research Service. Gravelle, Jane G., and Thomas L. Hungerford. 2011. “Corporate Tax Reform: Issues for
Congress.” CRS Report for Congress. Heckemeyer, Jost, and Michael Overesch. 2013. “Multinationals’ Profit Response to Tax
Differentials: Effect Size and Shifting Channels”. 13-045. ZEW-Centre for European Economic Research Discussion Paper.
Hines, James R. 1999. “Lessons from Behavioral Responses to International Taxation.” National Tax Journal 52 (June): 305–22.
Joint Committee on Taxation. 2011. “Present Law and Issues in U.S. Taxation of Cross-Border Income”. JCX-42-11. Washington DC.
Keightley, Mark P. 2013. “An Analysis of Where American Companies Report Profits: Indications of Profit Shifting”. Washington DC: Congressional Research Service.
Keightley, Mark P., and Jeffrey M. Stupak. 2015. “Corporate Tax Base Erosion and Profit Shifting (BEPS): An Examination of the Data.” CRS Report. Congressional Research Service.
Kleinbard, Edward D. 2011a. “Stateless Income.” Florida Tax Review 11 (9): 699–773. ———. 2011b. “The Lessons of Stateless Income.” Tax Law Review 65 (1): 99–171. ———. 2014. “Competitiveness Has Nothing to Do With It.” Tax Notes 144
(September). Mintz, Jack, and Alfons Weichenrieder. 2010. The Indirect Side of Direct Investment:
Multinational Company Finance and Taxation. MIT Press. OECD. 2015. “Measuring and Monitoring BEPS: Action 11 Final Report”. Paris: OECD. OSPIRG Foundation, and Citizens for Tax Justice. 2015. “Offshore Shell Games 2015.” Saez, Emmanuel, Joel Slemrod, and Seth H. Giertz. 2012. Journal of Economic
Literature 50 (1): 3–50. Shaviro, Daniel. 2011. “The Rising Tax-Electivity of US Corporate Residence.” Tax Law
Review 64 (3): 377–430. Shay, Stephen. 2014. “Mr. Secretary, Take the Tax Juice Out of Corporate
Expatriations.” Tax Notes, July. Slemrod, Joel, and Jon Bakija. 2008. Taxing Ourselves. Cambridge: MIT Press. Zucman, Gabriel. 2014. “Taxing Across Borders: Tracking Personal Wealth and
Corporate Profits.” Journal of Economic Perspectives 28 (4): 121–48. ———. 2015. The Hidden Wealth of Nations. Chicago: U of Chicago Press.

Figure 1: Top Gross Income Countries, Affiliates of U.S. Multinational Firms, 2012 (Shown as Share of Total Income.)
Note: Gross income is net income with foreign tax payments added. Seven of the top ten countries have effective tax rates under 5% in 2012: Netherlands, Ireland, Luxembourg, Bermuda, Switzerland, Singapore, and UK Islands. Together, these seven countries account for 50.1% of all foreign profits. Figure 2: Top Direct Investment Earnings Countries, Affiliates of U.S. Multinational Firms, 2012 (Share of Total Direct Investment Earnings)
Note: Seven of the top ten countries have effective tax rates under 5% in 2012: Netherlands, Ireland, Luxembourg, Bermuda, Switzerland, Singapore, and UK Islands. Together, these seven countries account for 52.3% of all direct investment earnings.
0.0% 2.0% 4.0% 6.0% 8.0% 10.0% 12.0% 14.0% 16.0%
0.0% 2.0% 4.0% 6.0% 8.0% 10.0% 12.0% 14.0% 16.0% 18.0%

Figure 3: Top Employment Countries, Affiliates of U.S. Multinational Firms, 2012 (Share of Total Employment)
Note: None of the top ten countries have effective tax rates under 12% in 2012.
0.0%
2.0%
4.0%
6.0%
8.0%
10.0%
12.0%
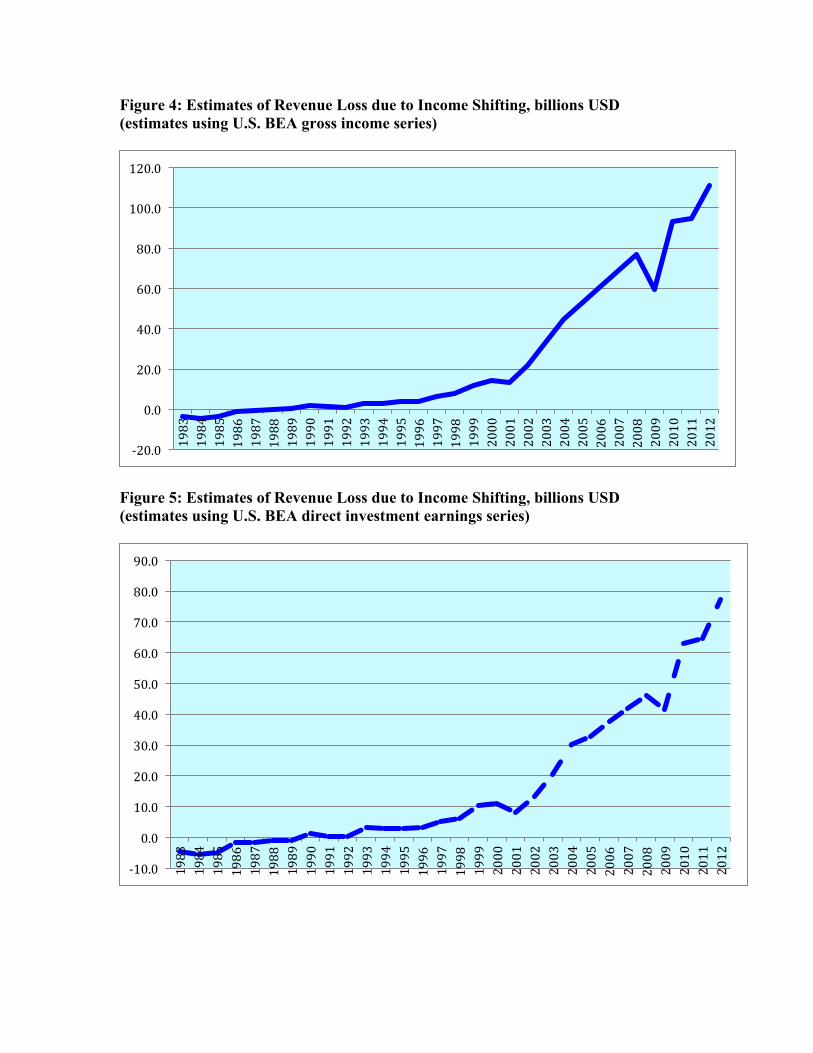
Figure 4: Estimates of Revenue Loss due to Income Shifting, billions USD (estimates using U.S. BEA gross income series)
Figure 5: Estimates of Revenue Loss due to Income Shifting, billions USD (estimates using U.S. BEA direct investment earnings series)
-‐20.0
0.0
20.0
40.0
60.0
80.0
100.0
120.0 1983
1984
1985
1986
1987
1988
1989
1990
1991
1992
1993
1994
1995
1996
1997
1998
1999
2000
2001
2002
2003
2004
2005
2006
2007
2008
2009
2010
2011
2012
-‐10.0
0.0
10.0
20.0
30.0
40.0
50.0
60.0
70.0
80.0
90.0
1983
1984
1985
1986
1987
1988
1989
1990
1991
1992
1993
1994
1995
1996
1997
1998
1999
2000
2001
2002
2003
2004
2005
2006
2007
2008
2009
2010
2011
2012
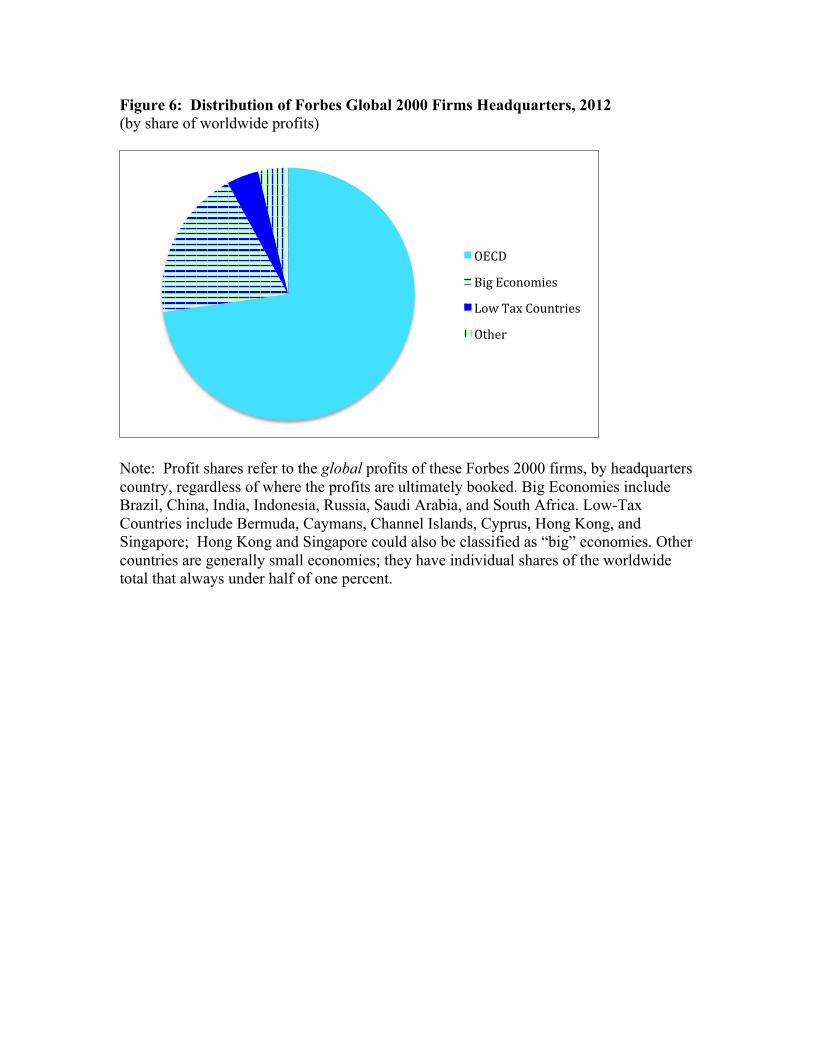
Figure 6: Distribution of Forbes Global 2000 Firms Headquarters, 2012 (by share of worldwide profits)
Note: Profit shares refer to the global profits of these Forbes 2000 firms, by headquarters country, regardless of where the profits are ultimately booked. Big Economies include Brazil, China, India, Indonesia, Russia, Saudi Arabia, and South Africa. Low-Tax Countries include Bermuda, Caymans, Channel Islands, Cyprus, Hong Kong, and Singapore; Hong Kong and Singapore could also be classified as “big” economies. Other countries are generally small economies; they have individual shares of the worldwide total that always under half of one percent.
OECD
Big Economies
Low Tax Countries
Other
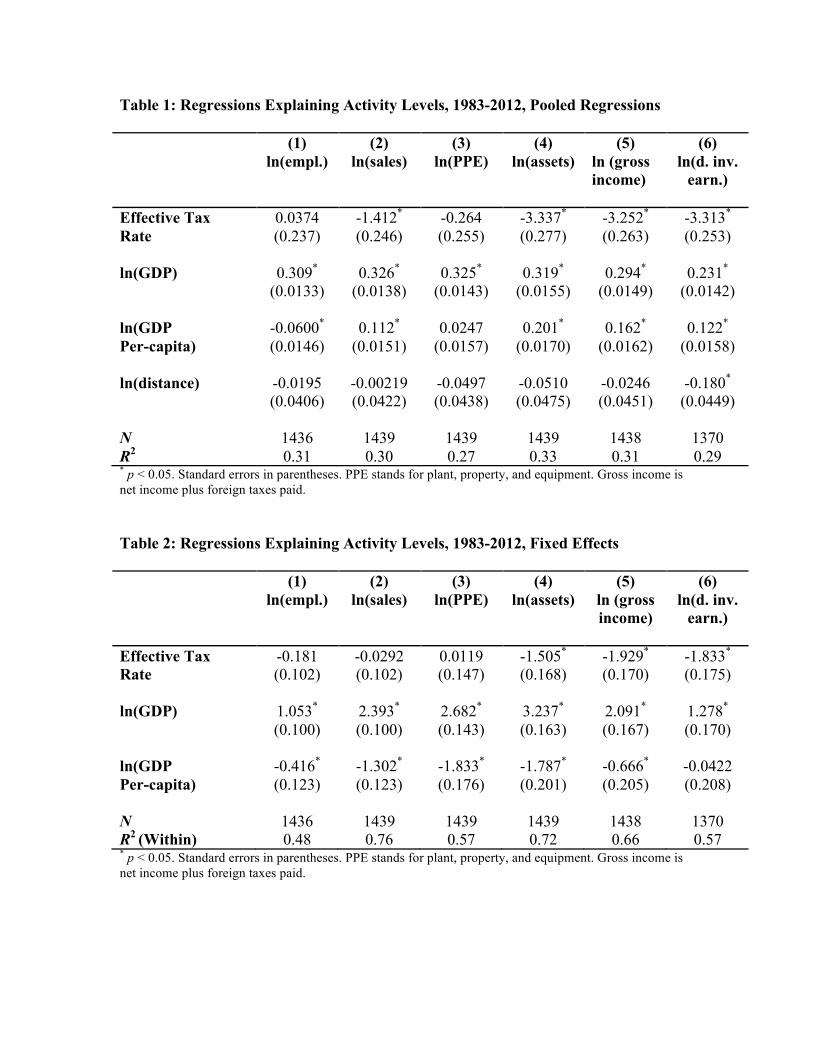
Table 1: Regressions Explaining Activity Levels, 1983-2012, Pooled Regressions (1)
ln(empl.) (2)
ln(sales) (3)
ln(PPE) (4)
ln(assets) (5)
ln (gross income)
(6) ln(d. inv.
earn.)
Effective Tax 0.0374 -1.412* -0.264 -3.337* -3.252* -3.313* Rate (0.237) (0.246) (0.255) (0.277) (0.263) (0.253)
ln(GDP) 0.309* 0.326* 0.325* 0.319* 0.294* 0.231* (0.0133) (0.0138) (0.0143) (0.0155) (0.0149) (0.0142) ln(GDP -0.0600* 0.112* 0.0247 0.201* 0.162* 0.122* Per-capita) (0.0146) (0.0151) (0.0157) (0.0170) (0.0162) (0.0158)
ln(distance) -0.0195 -0.00219 -0.0497 -0.0510 -0.0246 -0.180* (0.0406) (0.0422) (0.0438) (0.0475) (0.0451) (0.0449) N 1436 1439 1439 1439 1438 1370 R2 0.31 0.30 0.27 0.33 0.31 0.29 * p < 0.05. Standard errors in parentheses. PPE stands for plant, property, and equipment. Gross income is net income plus foreign taxes paid. Table 2: Regressions Explaining Activity Levels, 1983-2012, Fixed Effects (1)
ln(empl.) (2)
ln(sales) (3)
ln(PPE) (4)
ln(assets) (5)
ln (gross income)
(6) ln(d. inv.
earn.)
Effective Tax -0.181 -0.0292 0.0119 -1.505* -1.929* -1.833* Rate (0.102) (0.102) (0.147) (0.168) (0.170) (0.175) ln(GDP) 1.053* 2.393* 2.682* 3.237* 2.091* 1.278* (0.100) (0.100) (0.143) (0.163) (0.167) (0.170)
ln(GDP -0.416* -1.302* -1.833* -1.787* -0.666* -0.0422 Per-capita) (0.123) (0.123) (0.176) (0.201) (0.205) (0.208) N 1436 1439 1439 1439 1438 1370 R2 (Within) 0.48 0.76 0.57 0.72 0.66 0.57 * p < 0.05. Standard errors in parentheses. PPE stands for plant, property, and equipment. Gross income is net income plus foreign taxes paid.
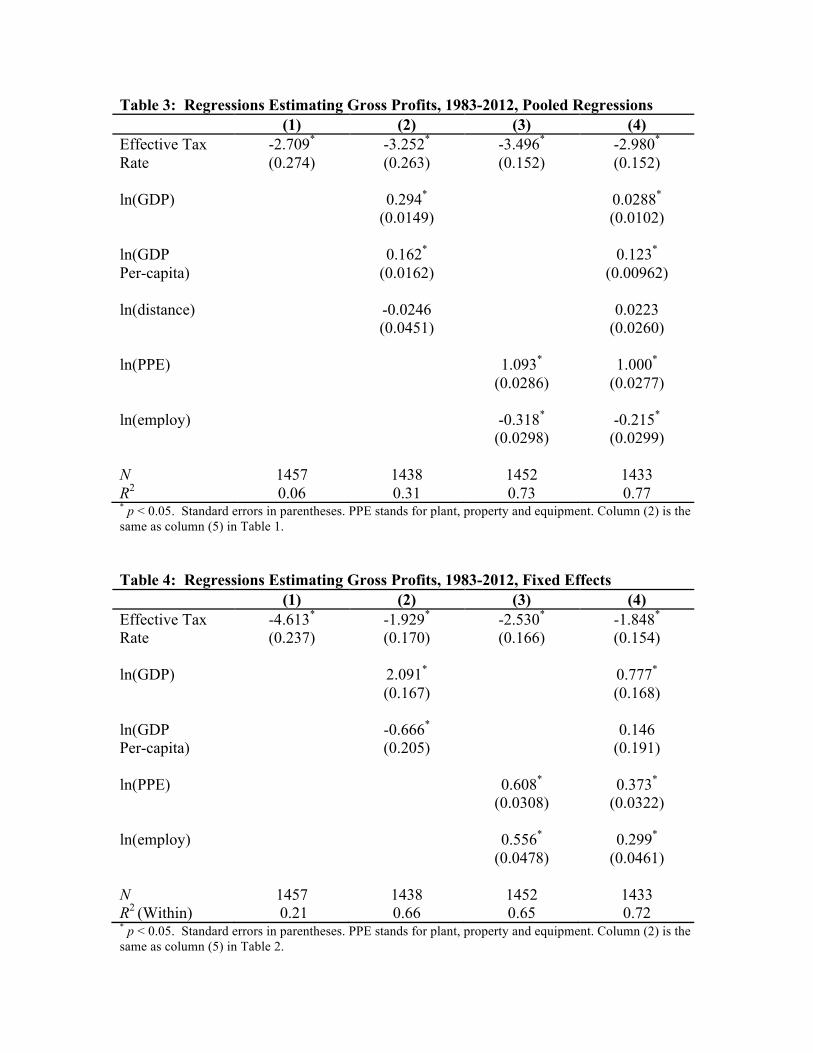
Table 3: Regressions Estimating Gross Profits, 1983-2012, Pooled Regressions (1) (2) (3) (4) Effective Tax -2.709* -3.252* -3.496* -2.980* Rate (0.274) (0.263) (0.152) (0.152)
ln(GDP) 0.294* 0.0288* (0.0149) (0.0102)
ln(GDP 0.162* 0.123* Per-capita) (0.0162) (0.00962)
ln(distance) -0.0246 0.0223 (0.0451) (0.0260)
ln(PPE) 1.093* 1.000* (0.0286) (0.0277)
ln(employ) -0.318* -0.215* (0.0298) (0.0299)
N 1457 1438 1452 1433 R2 0.06 0.31 0.73 0.77 * p < 0.05. Standard errors in parentheses. PPE stands for plant, property and equipment. Column (2) is the same as column (5) in Table 1. Table 4: Regressions Estimating Gross Profits, 1983-2012, Fixed Effects (1) (2) (3) (4) Effective Tax -4.613* -1.929* -2.530* -1.848* Rate (0.237) (0.170) (0.166) (0.154)
ln(GDP) 2.091* 0.777* (0.167) (0.168)
ln(GDP -0.666* 0.146 Per-capita) (0.205) (0.191)
ln(PPE) 0.608* 0.373* (0.0308) (0.0322)
ln(employ) 0.556* 0.299* (0.0478) (0.0461)
N 1457 1438 1452 1433 R2 (Within) 0.21 0.66 0.65 0.72 * p < 0.05. Standard errors in parentheses. PPE stands for plant, property and equipment. Column (2) is the same as column (5) in Table 2.
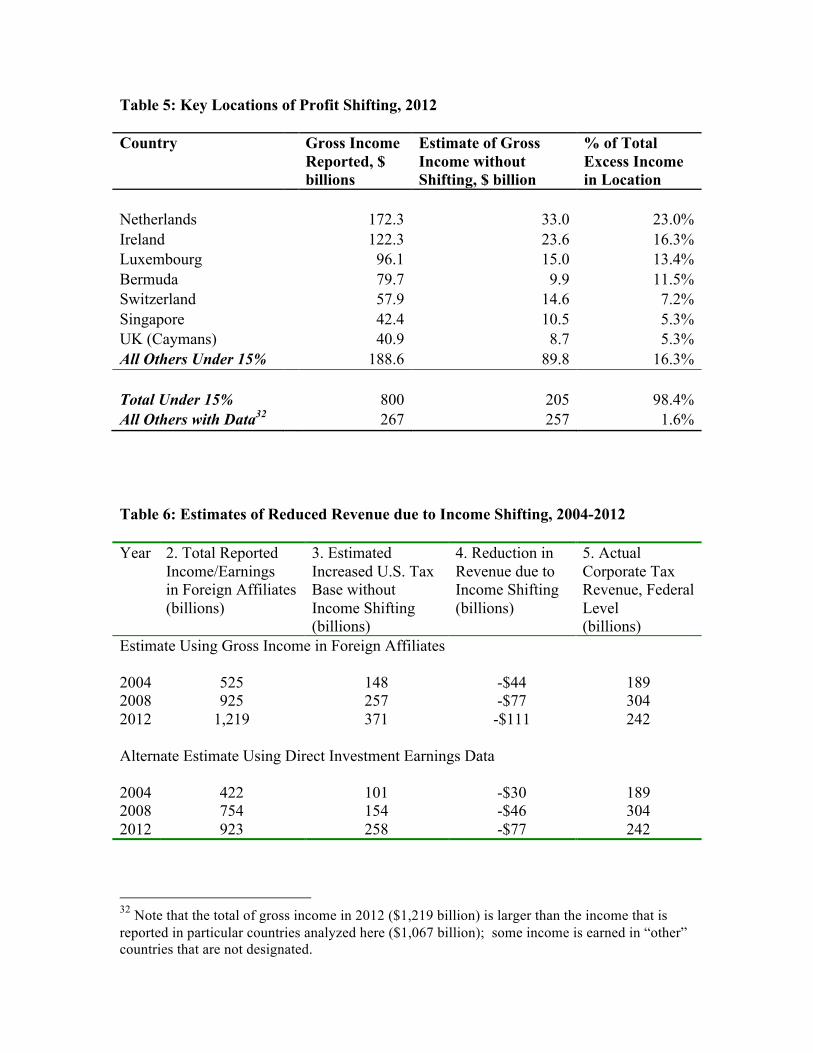
Table 5: Key Locations of Profit Shifting, 2012 Country Gross Income
Reported, $ billions
Estimate of Gross Income without Shifting, $ billion
% of Total Excess Income in Location
Netherlands 172.3 33.0 23.0% Ireland 122.3 23.6 16.3% Luxembourg 96.1 15.0 13.4% Bermuda 79.7 9.9 11.5% Switzerland 57.9 14.6 7.2% Singapore 42.4 10.5 5.3% UK (Caymans) 40.9 8.7 5.3% All Others Under 15% 188.6 89.8 16.3% Total Under 15% 800 205 98.4% All Others with Data32 267 257 1.6% Table 6: Estimates of Reduced Revenue due to Income Shifting, 2004-2012 Year 2. Total Reported
Income/Earnings in Foreign Affiliates (billions)
3. Estimated Increased U.S. Tax Base without Income Shifting (billions)
4. Reduction in Revenue due to Income Shifting (billions)
5. Actual Corporate Tax Revenue, Federal Level (billions)
Estimate Using Gross Income in Foreign Affiliates 2004 525 148 -$44 189 2008 925 257 -$77 304 2012 1,219 371 -$111 242
Alternate Estimate Using Direct Investment Earnings Data
2004 422 101 -$30 189 2008 754 154 -$46 304 2012 923 258 -$77 242
32 Note that the total of gross income in 2012 ($1,219 billion) is larger than the income that is reported in particular countries analyzed here ($1,067 billion); some income is earned in “other” countries that are not designated.

Table 7: Major Countries with Forbes Global 2000 Firms, 2012 Data Country Profit Share (of global 2000 total) Australia 2.82% Brazil 2.96% Canada 2.97% China 8.52% France 3.77% Germany 3.35% Hong Kong 3.22% India 2.29% Italy 1.29% Japan 5.41% Malaysia 0.50% Mexico 0.60% Netherlands 2.29% Norway 0.80% Russia 3.61% Saudi Arabia 0.77% Singapore 0.74% S Africa 0.90% S. Korea 2.37% Spain 1.38% Sweden 1.04% Switzerland 2.51% Taiwan 0.94% U.K. 6.37% U.S. 33.33%
25 Countries with Share > 0.5% 94.75%

Table 8: Speculative Estimates of Corporate Tax Base Erosion, 2012
Estimated Profits in 17 low-tax Countries, $ billion
Effective Tax Rate (Combined Statutory Rate - 5%)
Excess Income Booked in Low-tax Countries, $ billion
Revenue Loss (effective tax rate * share of group GDP * $1,079b), in $ billion
Share of all Corporate Revenue, including subfederal
Australia 67.7 25% 36.3 7.4 9% Brazil 71.1 29% 46.4 13.5 17% Chile 4.3 15% 1.1 0.8 China 204.5 20% 79.7 32.7 11% Czech R. 1.9 14% 0.4 0.6 8% Denmark 7.2 20% 2.8 1.3 13% Finland 5.3 20% 2.0 1.0 18% France 90.5 29% 60.2 15.3 23% Germany 80.4 25% 43.5 17.2 28% Greece 2.2 15% 0.5 0.7 26% India 55.0 27% 33.3 9.7 14% Indonesia 7.4 20% 2.9 3.6 8% Italy 31.0 23% 14.3 9.0 16% Japan 129.9 35% 105.7 39.8 18% Mexico 14.4 25% 7.7 5.7 Norway 19.2 23% 9.2 2.3 4% Poland 8.4 14% 1.8 1.3 13% Portugal 8.2 27% 4.7 1.1 19% Russia 86.7 15% 21.1 5.8 7% S. Arabia 18.5 15% 4.5 2.1 S Africa 21.6 30% 14.4 2.3 58% S. Korea 56.9 19% 20.8 4.5 10% Spain 33.1 25% 17.7 6.6 24% Turkey 10.6 15% 2.6 2.3 14% U.S. 800.2 30% 545.3 93.8 26% Total 1,836 1,079 280 20.4% Note: For countries other than the United States, the tax rate is the combined rate of federal and subfederal rates (when countries have sub-federal taxation); for the United States, I use the same assumption as the above analysis. Corporate tax revenue data are not available for all countries.