the effect of solutes on defect distributions in ion
TRANSCRIPT

"The submitted manuscript has been authored by acontractor of the U. S. Government under contract No.DE-AC05-96OR22464. Accordingly, the U.S.Government retains a nonexclusive, royalty-free licenseto publish or reproduce the published form of thiscontribution, or allow others to do so, for U.S.Government purposes."
The Effect Of Solutes on Defect Distributions in Ion-Irradiated ModelLWR Pressure Vessel Steels
Philip M. Rice and Roger E. Stoller
Metals and Ceramics Division, Oak Ridge National Laboratory,
P.O. Box 2008, Oak Ridge , TN 37831-6376 u<-7 7 0
o$TiAbstract
A series of nine model LWR pressure vessel steels were ion irradiated at ~300°C
using 2.5 MeV He ions, to a dose of 1.4 x 10¹⁷ ion/cm2, which corresponds to -0.1
dpa at a depth of 2(1 m and -3.5 dpa at the peak damage region which occurs at
about 4|LLm deep. The resultant changes in hardness as a function of depth were
measured using a Nanoindenter®. TEM was used to investigate the defect
distributions. The effect of various solutes, Cu and N in particular, but Mn and Ti
as well, on the change of hardness and the defect distribution due to the ion
irradiation are discussed.
1. Introduction
Embrittlement of light water reactor (LWR) pressure vessels depends on
alloy composition in a complex manner making reliable estimates of their
lifetimes difficult to determine.[l] To gain insights into the effect of different
solutes on embrittlement, a series of model ferritic alloys with varying solute
contents and combinations were chosen and characterized. Defects were
introduced by ion irradiation. The specimens were then prepared in cross-
section to allow microstructural and mechanical property changes to be studied
as a function of depth below the irradiated surface. The general technique of
using transmission electron microscopy (TEM) to study the microstructural
properties, and nano indentation to study the mechanical properties of the ion-
DJSTRtBUTION OF THIS DOCUMENT IS UNLIMITED.

irradiated alloys has been reported previously for specimens irradiated with Fe
ions.[2] This paper reports the results obtained from irradiations with He ions.
2. Experimental
2.1 Irradiation
The alloy designations and their compositions are summarized in Table I.
The alloys were obtained from the University of California, Santa Barbara, where
they are being used in a series of neutron irradiation experiments.[3] The
specimens were irradiated in the as-received condition: solution treated at 775°C
for 17 hours, quenched in a salt bath to 450°C and held for 3 minutes, and
subsequently air cooled. The quenching treatment was intended to maintain a
copper supersaturation and the short temper was intended to permit carbide
precipitation in the carbon containing alloys. The specimens were irradiated as
TEM discs in the ORNL Triple Ion Facility using 2.5 MeV He ions to a dose of 1.4
x 1017 ion/cm2 at a temperature of ~300°C. The accelerator is capable of
irradiating nine TEM discs at a time. Each target included three discs of three
different alloys. The first target held three discs of each of the alloys 348, 390,
and 399. The second target held three discs each of alloys 349, 360, and 373.
The third target held three discs each of the alloys 350, 397, and 387. The
targets where first heated to approximately 150°C and then the ion beam, at a
current of -0.6 | iA/cm 2 , was used to heat the specimens to ~300°C. The
temperature of the specimens was measured with a thermocouple spot welded
to the front of one of the target specimens. Each target was irradiated for a total
of -11 hrs over two days.

DISCLAIMER
This report was prepared as an account of work sponsored by an agency of theUnited States Government Neither the United States Government nor any agencythereof, nor any of their employees, makes any warranty, express or implied, orassumes any legal liability or responsibility for the accuracy, completeness, or use-fulness of any information, apparatus, product, or process disclosed, or representsthat its use would not infringe privately owned rights. Reference herein to any spe-cific commercial product, process, or service by trade name, trademark, manufac-turer, or otherwise does not necessarily constitute or imply its endorsement, recom-mendation, or favoring by the United States Government or any agency thereof.The views and opinions of authors expressed herein do not necessarily state orreflect those of the United States Government or any agency thereof.
DISCLAIMER
Portions of this document may be illegiblein electronic image products. Images areproduced from the best available originaldocument.

The results from TRIM calculations for the specified irradiation conditions
are shown in Figure 1. The solid line goes with the left axis and shows the
damage in dpa (displacements per atom) as a function of depth in the specimen.
At 2jlm depth the dose is -0.1 dpa; the peak dose of -3.5 dpa occurs just beyond
4|lm. The dashed line goes with the right axis and shows the implanted He
concentration [He] in appm (atomic parts per million) as a function of depth. At
the 2(1 m position [He] = 10 appm, with the peak occurring at 60,000 appm (6at%)
just beyond 4jlm. Thus, both dose and helium content are varying. The region
around 2|Ltm depth has a [He]/dpa = 100 which is of interest for those studying a
spallation neutron environment. The dose variations discussed below correspond
to measurements made at different depths.
2.2 Hardness Measurements
The technique developed to prepare cross section specimens from ion
irradiated discs has been described in detail in a previous paper and so will not
discussed here.[2] The change in hardness caused by the irradiation was
measured as a function of depth (i.e., distance below the irradiated surface) by
using a low load hardness measuring device called the Nanoindenter®.[4] The
actual method used for these experiments has also been described previously. [2]
Briefly, a row of approximately 100 indents is made at a very shallow angle to
the original irradiated surface, starting a few microns beyond the irradiated
region and ending in the electroplated layer of Fe at the specimen surface, as
shown in Figure 2(a). Figure 2(a) is an SEM image of a row of indents in the Cu-
free, high-N alloy showing the large grained alloy on top and the fine-grained
electroplate on the bottom. The dark band which the indents cross marks the
end of range of the He ions and is visible due to grooving (i.e., preferential

polishing during the electrochemical polishing process) caused by the high
concentration of He bubbles in the region. The broken white line is the oxide that
grew on the original irradiated surface. Figure 2(b) is a higher magnification SEM
image of the same set of indents as they cross the original irradiated surface and
enter the electroplate. Images like this one were used to measure the indent's
position with respect to the original irradiated surface, which will be referred to
as the "depth" in the remainder of the paper.
Figure 3 shows a set of nano hardness measurements from the Cu-free,
low-N alloy 348 taken with indents having contact depths of ~ 50nm. The
indents were done at this contact depth to ensure that a constant and reasonable
volume of material was sampled. The hardness measured from indents beyond
the irradiated region (> 5jim) were averaged (shown as the horizontal line) and
the change in hardness, AH, was measured with respect to this value. Note that
the values at the peak (shown as open circles) are not reliable due to the
grooving that occurred in the region. The grooving resulted in the surface not
being flat; the area functions of the diamond indentor used to determine the
hardness thus have large and unknown errors resulting in unacceptably large
uncertainties in the hardness values taken within ±.25 Jim of the peak.
2.3 TEM Imaging
The cross-sectional specimens were ground to approximately lOOjl
thickness and then electrochemically polished to perforation with a twin jet
polisher using a perchloric acid based electrolyte cooled to -60°C. All TEM
imaging was done with a 300kV Philips CM30 microscope, using g = {330}
imaging conditions so that the background intensity was weak and the
dislocation loops appeared as sharp black spots.

3. Results and Discussion
3.1 Hardness Measurements
The alloys selected for this set of ion irradiation experiments allowed a broad
range of solute effects to be investigated. Figure 4 is a plot of the change in
hardness, AH, as a function of wt% Cu for the low-N alloys at various doses. The
solid data points are from the He irradiated specimens while the open points
represent data from the earlier Fe irradiation.[2] At a dose of 0.07dpa the Cu-
free alloy shows the least hardening due to the delay (threshold) in the onset of
hardening (see below), while at 0.20dpa it shows the greatest change, due to He
bubble formation. At the middle dose of O.ldpa the relationship appears as
linear, perhaps fortuitously. The Cu-free alloy shows no tendency to saturate in
this dose range while the Cu-containing alloys clearly show saturation. The
change in hardness measured for the Cu-containing alloys irradiated with Fe ions
are almost double those observed for He irradiation to similar doses.
The most significant result of the hardness measurements can be seen by
separating the alloys into two categories, Cu-free alloys and Cu-containing alloys.
A plot of the change in hardness as a function of dose for the Cu-free alloys is
displayed in Figure 5. The indent contact depths were ~50nm, and each point on
the graph represents the average of four or five measurements made within
0.25jlm of the specific depths 1, 2, 3, and 3.5|lm. The values at the end of range
(-4.1 jim) of the He ions are not shown here due to their large, unknown errors.
A single nearly linear line has been drawn representing the average
change of hardening for the Fe-N binary alloys because of the large scatter
which seemed independent of the nitrogen content. One of the possible reasons

for the weakness of "the observed effect is the fact that a significant portion of
the nitrogen was observed to have precipitated out in all the high-N alloys in the
as-received condition with the exception of the titanium-containing alloy, 373, as
reported earlier.[5] However, the effect observed here in the He irradiated
samples was that the addition of nitrogen had little or no effect on the hardening
which is in contrast to the effect observed for the Fe irradiated samples in which
the addition of nitrogen reduced the change in hardness.
When the data is plotted as a function of the square root of dose, and a
linear fit to the points is plotted, the above alloys all show a threshold, or a delay
in the onset of the hardening. This is in marked contrast to the Cu-containing
alloys for which the change of hardness is shown in Figure 6. For the Cu-
containing alloys there is a rapid hardening with low dose. When the data for
these alloys is plotted as a function of the square root of dose, a linear fit of the
data extrapolated back to zero dose show a common positive intercept for all the
Cu-containing alloys with no indication of a threshold dose.
Comparing alloys 390 and 397 shows that an increase in copper increases
the change in hardness at all doses. However, of potentially greater interest is
the fact that the two low-nitrogen, Cu-containing alloys 390 and 397 seemed to
be unaffected by the high He concentrations. The change in hardness for both
alloys remained linear even out to the peak dose/end of range ([He] = 60,000
appm) and neither alloy showed any tendency to groove when polished.
The effect of adding a higher nitrogen concentration to the 0.5% Cu alloy
can be seen by comparing alloys 390 and 399. The high nitrogen alloy showed a
slightly increased AH in the low He region (i.e., < 2.5 \i), but a very large AH in
the high He region, with the groove forming at the end of range during the
polishing procedure.

Comparing alloys 360 with 397 shows that the addition of lwt% Mn to the
Fe matrix, in conjunction with the 0.9% Cu, doubles the change in hardness due
to the irradiation at all doses. The 360 alloy was also observed to groove at the
end of range during the polishing process.
3.2 TEM Results
3.2.1 Dislocation loop formation
The defect microstructure in each of the irradiated alloys was investigated
in cross section using conventional TEM imaging techniques. Figure 7 shows a
survey of the cross-sectional, low magnification micrographs of the irradiated
region for each of the alloys. The alloy numbers and their compositions are listed
at the base of each micrograph and the depth scale is shown on the right-hand
side of the figure. All the alloys that showed grooving when polished for nano
indentation show an extremely high defect density at the end of range of the He
ions, at and beyond 4|im. The two low-N, Cu-containing alloys, 390 and 397,
show no such peak damage region.
Higher magnification micrographs of the defect structures at the 2j_Lm
depth region (i.e., 0.1 dpa and [He] = 10 appm) are shown in Figures 8 and 9.
Note that as yet the thicknesses of the imaged specimen regions have not been
determined and thus the reader is cautioned against drawing any conclusions
about the density of the defects shown in the figures, but may look at defect
sizes only. Comparing alloys 348 and 350 shows that the increase in nitrogen
content seems to have slightly decreased the average size of the dislocation loops
from d348 ~10nm to d35o ~ 8nm. Comparing alloys 390 and 397 with 348 shows
that the addition of Cu (while maintaining low N) seems to have resulted in a
complete lack of visible defects being formed (i.e., dislocation loops, if present,
must be less than 2nm in diameter). A comparison of alloy 399 with 390 shows
that when sufficient nitrogen is added to the FeCu alloy, irradiation causes
dislocation loops large enough to be visible (d > 2nm) to form.
A comparison of alloy 360 with 397 shows that the addition of Mn to the
matrix also results in visible dislocation loops. Although they are just barely
visible (d < 2nm) there is definitely a higher density of them than in any of the
other alloys. This high density of very small dislocation loops correlates well
with alloy 360 showing the greatest change in hardness in the low dose,
relatively low He region (<2.5(0.m).
A comparison of alloy 373 with 350 shows that the addition of 0.3% Ti to
the matrix resulted in a suppression of dislocation loop formation but apparently
led to precipitation in the irradiated zone. This result is interesting since alloy
373 was the only high-N alloy to retain nitrogen in solution in the as received
state, and it showed the least hardening of all the alloys in the low dose,
relatively low He region (<2.5|im). An attempt will be made to identify the
apparent precipitates.
3.2.2 He Bubbles
All the alloys with the exception of the low-N, Cu-containing 390 and 397,
show extensive He bubble formation in the region beyond 3.75u.m (i.e., [He] >
3000 appm). All the bubbles showed a tight size distribution centered at d~2nm.
Even at the highest He concentration of -60,000 appm, the bubble density
increased but the size of the bubbles remained similar. A close investigation of
the He bubbles as a function of depth in the 348 (Fe + low-N) alloy revealed that
while there were a few bubbles formed at 2)0.m ([He] = lOappm) significant
formation did not occur until beyond 3jlm ([He] = 120 appm). Figure 10 shows
the He bubbles in the 348 alloy at a depth of 3.5{Im (dose = .5 dpa, and [He] =
660 appm) using Fresnel fringe contrast. In the underfocused condition the
bubbles appear as bright in the center with a dark outer fringe, while in the
overfocused condition they appear dark with a bright outer fringe.
It is of significant interest that alloys 390 and 397 showed no bubble
formation even at the end of range where [He] = 60,000appm. Since these two
alloys were irradiated in separate targets, but with other alloys (390 with 348
and 399, and 397 with 350 and 387) it is clear that the apparent absence of
bubbles is due to the effect of chemical composition, not to differences in
irradiation conditions. Both alloys showed an increase in hardness as a function
of depth and no tendency to groove. To demonstrate that the helium is present a
post irradiation anneal was performed on a 397 specimen at 600°C for 24hrs
and it resulted in extensive bubble/void formation at the end of range depth.
Evidently, copper diminishes the availability of vacancies during irradiation. This
surprisingly strong Cu-vacancy interaction is consistent with a postulated high
copper-vacancy binding energy but may be much greater in a clean Fe-Cu
binary alloy.[6-8] This ability of the copper to suppress He bubble formation
appears to be negated by either the addition of a substitutional solute like Mn
(see alloy 360), or an interstitial solute like N (see alloy 399).
4. Conclusions
1) The experimental technique developed to correlate changes in hardness with
changes in the defect microstructure has proved successful.

2) The Cu-free alloys show a delayed onset of hardening with dose while the Cu-
containing alloys all showed a rapid (supralinear) increase in hardening with the
initial dose.
3) The Cu-containing, low-N alloys 390 and 397, which developed no observable
defects (i.e., no defects > 2nm) showed greater hardening in the low He region
(<2.5|lm) and significantly less hardening in the high He region (> 2.5(Im), than
the corresponding regions in the Cu-free alloys. This result suggests that the Cu-
vacancy interaction is much stronger than previously expected. Manganese
seems to reduce this interaction.
4) Nitrogen is important for encouragement of loops and bubbles. Its effects are
diminished by copper.
Acknowledgments
This research was performed at the ORNL ShaRE User Facility and was sponsored
by the Division of Materials Sciences, U.S. Dept. of Energy and the Office of
Nuclear Regulatory Research, U.S. Nuclear Regulatory Commission under
interagency agreement DOE 1886-8109-8L with the U.S. Dept. of Energy under
contract DE-AC05-960R22464 with Lockheed Martin Energy Research Corp., and
by an appointment of P.M. Rice to the ORNL Postdoctoral Research Associates
Program administered jointly by ORNL and Oak Ridge Institute for Science and
Education.
References

[1] G.R. Odette, and G.E. Lucas, in Radiation Embrittlement of Nuclear Reactor
Pressure Vessel Steels: An International Review (second Volume), ASTM STP
909, L.E. Steele, Ed., American Society for Testing and Materials, Philadelphia,
pg. 206, 1986.
[2] P.M. Rice, R.E. Stoller, B.N. Lucas, and W.C. Oliver, in Microstructures of
Irradiated Materials, Mater. Res. Soc. Proc, 373, I. M. Robertson, L. E. Rehn, S.
J. Zinkle, and W. J. Phythian, Eds., pg. 149, 1995.
[3] G.R. Odette, et. al., in Effects of Radiation on Materials: 17th International
Symposium, ASTM STP 1271, D. S. Gelles, R. K. Nanstad, A. S. Kumar, and E. A.
Little, Eds., American Society for Testing and Materials, Philadelphia, pg. 547,
1995.
[4] W.C. Oliver, and G.M. Pharr, J. Mater. Res., 7(6), pg. 1564, 1992.
[5] P.M. Rice, and R.E. Stoller, NUREG/CR-6332 (ORNL/TM-12980), Martin
Marietta Energy Systems Inc., Oak Ridge National Laboratory, 1996.
[6] G. Salje, and M. Feller-Kniepmeier, J. of Appl. Phys., 48(5), pg. 1833, 1977.
[7] G.R. Odette, and C.K. Sheeks, in Phase Stability During Irradiation, J.R Holland,
L.K. Mansur, and D.I. Potter, Eds., The Metallurgical Society of AIME,
Warrendale, Pa., pg. 416, 1981.
[8] A. Moslang, E. Albert, E. Recknagel, A. Weildinger, and P. Moser, Hyperfine
Interactions 15/16, pg. 409, 1983.
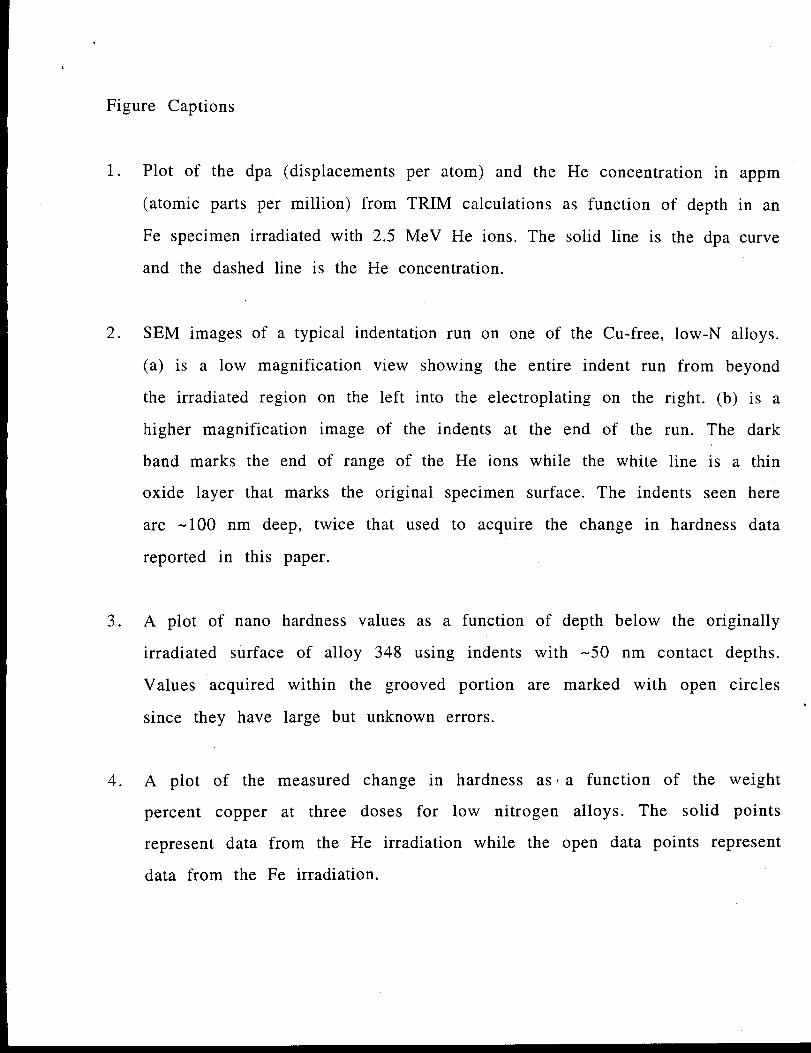
Figure Captions
1. Plot of the dpa (displacements per atom) and the He concentration in appm
(atomic parts per million) from TRIM calculations as function of depth in an
Fe specimen irradiated with 2.5 MeV He ions. The solid line is the dpa curve
and the dashed line is the He concentration.
2. SEM images of a typical indentation run on one of the Cu-free, low-N alloys,
(a) is a low magnification view showing the entire indent run from beyond
the irradiated region on the left into the electroplating on the right, (b) is a
higher magnification image of the indents at the end of the run. The dark
band marks the end of range of the He ions while the white line is a thin
oxide layer that marks the original specimen surface. The indents seen here
are -100 nm deep, twice that used to acquire the change in hardness data
reported in this paper.
3. A plot of nano hardness values as a function of depth below the originally
irradiated surface of alloy 348 using indents with -50 nm contact depths.
Values acquired within the grooved portion are marked with open circles
since they have large but unknown errors.
4. A plot of the measured change in hardness as a function of the weight
percent copper at three doses for low nitrogen alloys. The solid points
represent data from the He irradiation while the open data points represent
data from the Fe irradiation.

5. A plot of the change in hardness as a function of the dose for the copper-
free alloys. The top line represent the average of the Fe-N binary alloys,
while the bottom line is for the Ti-containing alloy 373.
6. A plot of the change in hardness as a function of the dose for the copper-
containing alloys. All alloys show a similar supralinear onset of hardening
followed by composition dependent levels of saturation.
7. A survey of the low magnification cross-sectional TEM micrographs showing
the entire irradiated region of the major alloys. The scale is on the left and
the alloy contents are listed below each image. Note that alloys 390 and 397
show no obvious irradiation damage even at the end of range of the He ions.
8. TEM micrographs of several of the alloys taken at approximately 2 microns
depth (0.1 dpa). Comparing left-to-right shows the effect of nitrogen on the
defect distribution. Comparing top-to-bottom shows the effect of 0.5%
copper on the defect distribution.
9. TEM micrographs of several of the alloys taken at approximately 2 microns
depth (0.1 dpa). Comparing left-to-right shows the effect of Mn (top row)
and Ti (bottom row) on the defect distribution.
10. TEM micrographs of the He bubble formation in alloy 348 due to a dose of
0.5 dpa and a He concentration of 660 appm. The left image was taken in
the underfocused condition in which bubbles appear bright with a dark
outer fringe. The right image was taken in the overfocused condition in
which the bubbles appear dark with a bright outer fringe.

Table I : List of Alloys and Their Compositions
AlloyNumber
VM 348VM 349VM 350VM 360VM 373VM 387VM 390VM 397VM 399
N (appm)
80120
10100
102020
120
Composition (wt-%)
Cu Mn C Ti———0.89
<0.010.510.510.910.51
———1.030.010.050.06
<0.010.01
———
<0.003<0.003
0.17<0.005<0.01<0.01
————0.3
0.0030.002<0.01<0.01

[He] (appm)O
11 I I I I I I
CO
0)CM Q
edp


-
o
" Z
) ap
pm
- +oLL• •
I I
I I 34
8
or\
, , ,
i i i
o•
, , ,
• <
, , ,
1 ' ^$
••t
•
|
•
1 1
1 1
(I
II
1 1
f 1
-
1 1
1 1
1 1
1 1
CO
Q.
QCM
CM CO CM
OUBN

COCLO
Ecoin
1.5
1
0.5
Low-N iAIIoys
0.2 0.4 0.6
.07dpa (He)•—.1dpa (He)• — .2dpa (He)e— .2dpa (Fe)
0.8 1
w%Cu

CO
oEcoLO
4
3.5
3
2.5
1.5
1
0.5
0
[He] (appm)10 120
0.1 0.2 0.3 0.4
Dose (dpa)
660
0.5
! 1
I I
I I
I I
I
-
-
-
-
..
..
1 1 1 I I I I I I I 1 I I I I I I I I I I
• 348: Fe + 5appm No 349: Fe + 80 appm N• 350: Fe + 120 appm NT 373: Fe + .3%Ti + 100 appm N
% -?
x ' ,. j | T I
1y
i i i t i i i i
i
1 >
_ , ~ "
, . i , _
• /
-
-
• . , • "
0.6

(0Q.CD
Eco
4
3.5
3
2.5
1.5
1
0.5
0
[He] (appm)10 120 660
-
—
• . . , | , . . . j i i i i j . . i i | . i . i j . i
• 390: Fe + .5%Cu + 20 appm ND 399: Fe + .5%Cu + 120 appm N• 397: Fe + .9%Cu + 20 appm No 360: Fe + .9%Cu + 1%Mn + 10 appm N
-
-
- I
-1/
i- i i i
Sr
r-
^r~r^^_ \
Y~ •
1 i 1 t
il.ln - ^ * "
I , —.
1
. . . .
^ - — '
_
. . . .
. 4
•
1
—
-
-
-
1
•
-
-
. . . . '
0.1 0.2 0.3 0.4 0.5 0.6
Dose (dpa)


cP

