the effect of tetanic stimulation on functional connectivityessay.utwente.nl/69668/1/msc. report...
TRANSCRIPT
REPORT
THE EFFECT OF TETANIC
STIMULATION ON
FUNCTIONAL
CONNECTIVITY
Tim Witteveen
FACULTY OF ELECTRICAL ENGINEERING, MATHEMATICS AND COMPUTER SCIENCE BIOMEDICAL SIGNALS AND SYSTEMS EXAMINATION COMMITTEE
Dr.ir.Joost le Feber Dr.ir. Jan Stegenga
DOCUMENT NUMBER
BSS - 11-09
23-03-2011

The effect of Tetanic stimulation on functional connectivity
1
The effect of Tetanic stimulation on functional connectivity
2
Introduction It is generally believed that cognitive processes like
learning and memory highly depend on synaptic
connections between neurons. These synaptic
connections are plastic, meaning that connections
between neurons are continuously altered, new
connections are formed and others disappear. The
communication between neurons takes place at
the synapse, at this synapse the membranes of
neurons approach each other closely and are able
to communicate with each other using either an
electrical current or by the release of
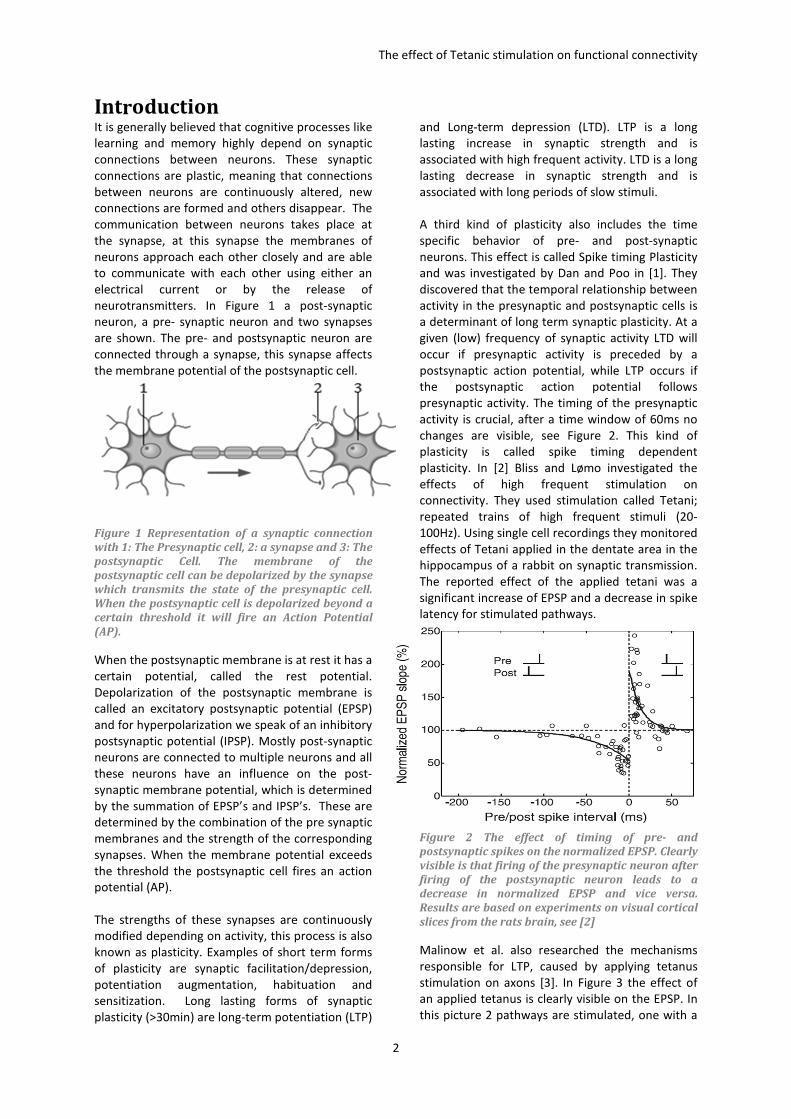
neurotransmitters. In Figure 1 a post-synaptic
neuron, a pre- synaptic neuron and two synapses
are shown. The pre- and postsynaptic neuron are
connected through a synapse, this synapse affects
the membrane potential of the postsynaptic cell.
Figure 1 Representation of a synaptic connection
with 1: The Presynaptic cell, 2: a synapse and 3: The
postsynaptic Cell. The membrane of the
postsynaptic cell can be depolarized by the synapse
which transmits the state of the presynaptic cell.
When the postsynaptic cell is depolarized beyond a
certain threshold it will fire an Action Potential
(AP).
When the postsynaptic membrane is at rest it has a
certain potential, called the rest potential.
Depolarization of the postsynaptic membrane is
called an excitatory postsynaptic potential (EPSP)
and for hyperpolarization we speak of an inhibitory
postsynaptic potential (IPSP). Mostly post-synaptic
neurons are connected to multiple neurons and all
these neurons have an influence on the post-
synaptic membrane potential, which is determined
by the summation of EPSP’s and IPSP’s. These are
determined by the combination of the pre synaptic
membranes and the strength of the corresponding
synapses. When the membrane potential exceeds
the threshold the postsynaptic cell fires an action
potential (AP).
The strengths of these synapses are continuously
modified depending on activity, this process is also
known as plasticity. Examples of short term forms
of plasticity are synaptic facilitation/depression,
potentiation augmentation, habituation and
sensitization. Long lasting forms of synaptic
plasticity (>30min) are long-term potentiation (LTP)
and Long-term depression (LTD). LTP is a long
lasting increase in synaptic strength and is
associated with high frequent activity. LTD is a long
lasting decrease in synaptic strength and is
associated with long periods of slow stimuli.
A third kind of plasticity also includes the time
specific behavior of pre- and post-synaptic
neurons. This effect is called Spike timing Plasticity
and was investigated by Dan and Poo in [1]. They
discovered that the temporal relationship between
activity in the presynaptic and postsynaptic cells is
a determinant of long term synaptic plasticity. At a
given (low) frequency of synaptic activity LTD will
occur if presynaptic activity is preceded by a
postsynaptic action potential, while LTP occurs if
the postsynaptic action potential follows
presynaptic activity. The timing of the presynaptic
activity is crucial, after a time window of 60ms no
changes are visible, see Figure 2. This kind of
plasticity is called spike timing dependent
plasticity. In [2] Bliss and Lømo investigated the
effects of high frequent stimulation on
connectivity. They used stimulation called Tetani;
repeated trains of high frequent stimuli (20-
100Hz). Using single cell recordings they monitored
effects of Tetani applied in the dentate area in the
hippocampus of a rabbit on synaptic transmission.
The reported effect of the applied tetani was a
significant increase of EPSP and a decrease in spike
latency for stimulated pathways.
Figure 2 The effect of timing of pre- and
postsynaptic spikes on the normalized EPSP. Clearly
visible is that firing of the presynaptic neuron after
firing of the postsynaptic neuron leads to a
decrease in normalized EPSP and vice versa.
Results are based on experiments on visual cortical
slices from the rats brain, see [2]
Malinow et al. also researched the mechanisms
responsible for LTP, caused by applying tetanus
stimulation on axons [3]. In Figure 3 the effect of
an applied tetanus is clearly visible on the EPSP. In
this picture 2 pathways are stimulated, one with a

The effect of Tetanic stimulation on functional connectivity
3
tetanus and the other without a form of high
frequency stimulation. Pathway 1 (with tetanus) is
clearly affected and pathway 2 (control) remains
unchanged.
Figure 3 Long-term potentiation of Schaffer
collateral-CAl synapses. (A) Setup for recording
synaptic transmission, two pathways each
connected with an individual stimulation electrode
(1 and 2). Pathway 1 represents the test pathway
and pathway 2 is for control (B) Synaptic responses
to test stimuli for the tetanized pathway and the
control pathway. In the left figure the effect of
tetanic stimulation is clearly visible (significant
increase of the EPSP) whereas the control pathway
has not significantly changed. (C) The change in
amplitude of the EPSP slightly decreases over time
but for a timescale of 1h the change of EPSP clearly
deviates from the control pathway. (Pictures from
neuroscience 4th edition p189)
In this project however we are interested in global
connectivity changes of a network of neurons
caused by tetanic stimulation. A popular method to
study cellular and network properties in-vitro is by
using cultured neuronal networks. Electrical
activity of these cultured neural networks can be
measured using a multi electrode array (MEA).
Studying these electrical signals provides us a way
to study processes, similar to those occurring in
our cortex. The MEA’s used in this project
contained 60 electrodes (8 by 8 grid, without
corner electrodes). These electrodes can both be
used for measuring AP’s of nearby neurons and for
stimulation of these neurons. Dimensions of these
electrodes are small enough (10µm-30µm) for
measuring single cell AP’s. Measurement of these
AP’s can be used to determine relationships
between electrode pairs, therefore providing a way
to study connectivity of a network. This kind of
network connectivity is called functional
connectivity. Functional connectivity describes the
behavioral relation between electrodes and
neurons at these electrodes. Although functional
relations between measured neurons are known,
nothing can be said about the actual anatomical
connection between those neurons. These may
consist of multiple pathways between neurons,
some examples are shown in Figure 4. These
examples suggest a relation between synaptic
connectivity and functional connectivity. Recent
studies suggest that functional connectivity is
directly related to synaptic connectivity. Thus
changes in synaptic connections should lead to
changes in functional relationships between the
recorded neurons.
Figure 4 Functional connections exists between
neurons A & B. Figure A illustrates a causal
pathway between the presynaptic neuron A and the
postsynaptic neuron B. Figure B represents an
unwanted case, here the neurons A and B share a
common input which can result in a false positive
functional relation between A and B. Figure C
illustrates a complex set of connections, between
neuron A and B. This functional connection is based
on several pathways which are typically unknown,
but still a functional connection between A and B
might be measured.
Because functional connectivity and synaptic
connectivity are related the reported effects of
tetanic stimulation should also have an effect on
functional connectivity. This is investigated by
Jimbo et al., who did observe changes in functional
connections, see [4]. They observed two distinctive
changes caused by tetanic stimulation: The first
was an increase in the number of AP’s in each
network burst and also an increase in sensitivity to
externally applied test stimuli (higher percentage
A)
B)
C)
The effect of Tetanic stimulation on functional connectivity
4
of network bursts after test stimuli). The second
change Jimbo et al. observed was a decrease of the
latency (250.4ms � 225ms) of the response and a
reduction of the spread of the latencies (SD 20.2
ms � SD 3.1ms). A much more interesting
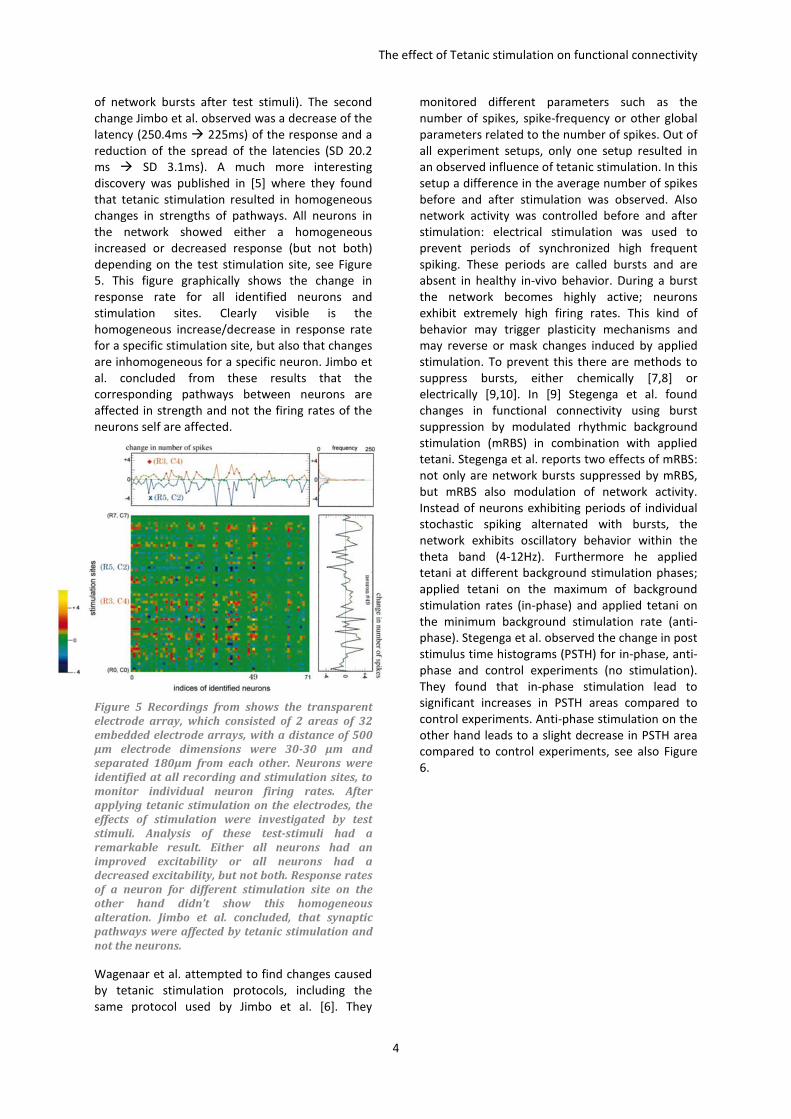
discovery was published in [5] where they found
that tetanic stimulation resulted in homogeneous
changes in strengths of pathways. All neurons in
the network showed either a homogeneous
increased or decreased response (but not both)
depending on the test stimulation site, see Figure
5. This figure graphically shows the change in
response rate for all identified neurons and
stimulation sites. Clearly visible is the
homogeneous increase/decrease in response rate
for a specific stimulation site, but also that changes
are inhomogeneous for a specific neuron. Jimbo et
al. concluded from these results that the
corresponding pathways between neurons are
affected in strength and not the firing rates of the
neurons self are affected.
Figure 5 Recordings from shows the transparent
electrode array, which consisted of 2 areas of 32
embedded electrode arrays, with a distance of 500
μm electrode dimensions were 30-30 μm and
separated 180μm from each other. Neurons were
identified at all recording and stimulation sites, to
monitor individual neuron firing rates. After
applying tetanic stimulation on the electrodes, the
effects of stimulation were investigated by test
stimuli. Analysis of these test-stimuli had a
remarkable result. Either all neurons had an
improved excitability or all neurons had a
decreased excitability, but not both. Response rates
of a neuron for different stimulation site on the
other hand didn’t show this homogeneous
alteration. Jimbo et al. concluded, that synaptic
pathways were affected by tetanic stimulation and
not the neurons.
Wagenaar et al. attempted to find changes caused
by tetanic stimulation protocols, including the
same protocol used by Jimbo et al. [6]. They
monitored different parameters such as the
number of spikes, spike-frequency or other global
parameters related to the number of spikes. Out of
all experiment setups, only one setup resulted in
an observed influence of tetanic stimulation. In this
setup a difference in the average number of spikes
before and after stimulation was observed. Also
network activity was controlled before and after
stimulation: electrical stimulation was used to
prevent periods of synchronized high frequent
spiking. These periods are called bursts and are
absent in healthy in-vivo behavior. During a burst
the network becomes highly active; neurons
exhibit extremely high firing rates. This kind of
behavior may trigger plasticity mechanisms and
may reverse or mask changes induced by applied
stimulation. To prevent this there are methods to
suppress bursts, either chemically [7,8] or
electrically [9,10]. In [9] Stegenga et al. found
changes in functional connectivity using burst
suppression by modulated rhythmic background
stimulation (mRBS) in combination with applied
tetani. Stegenga et al. reports two effects of mRBS:
not only are network bursts suppressed by mRBS,
but mRBS also modulation of network activity.
Instead of neurons exhibiting periods of individual
stochastic spiking alternated with bursts, the
network exhibits oscillatory behavior within the
theta band (4-12Hz). Furthermore he applied
tetani at different background stimulation phases;
applied tetani on the maximum of background
stimulation rates (in-phase) and applied tetani on
the minimum background stimulation rate (anti-
phase). Stegenga et al. observed the change in post
stimulus time histograms (PSTH) for in-phase, anti-
phase and control experiments (no stimulation).
They found that in-phase stimulation lead to
significant increases in PSTH areas compared to
control experiments. Anti-phase stimulation on the
other hand leads to a slight decrease in PSTH area
compared to control experiments, see also Figure
6.
The effect of Tetanic stimulation on functional connectivity
5
Figure 6 Collected results for tetanic stimulation at
different background stimulation phases. This
figure contains changes in mean PSTH areas of
experiments where tetani were applied at
minimum (anti-phase) and maximum (in-phase)
background stimulation phases. For comparison
the result for experiments without applied tetani
(control) are also shown. Visible is a significant
increase in PSTH area for in-phase stimulation
compared to control experiments. Also visible is a
slight decrease for anti-phase stimulation
compared to control experiments. (Adapted from
[9])
Methods
A. Cultured Networks This research project uses cultured networks
consisting out of cortical cells obtained from the
cortex of rats. Activity of these cultures was
measured using multiple electrode arrays (MEA).
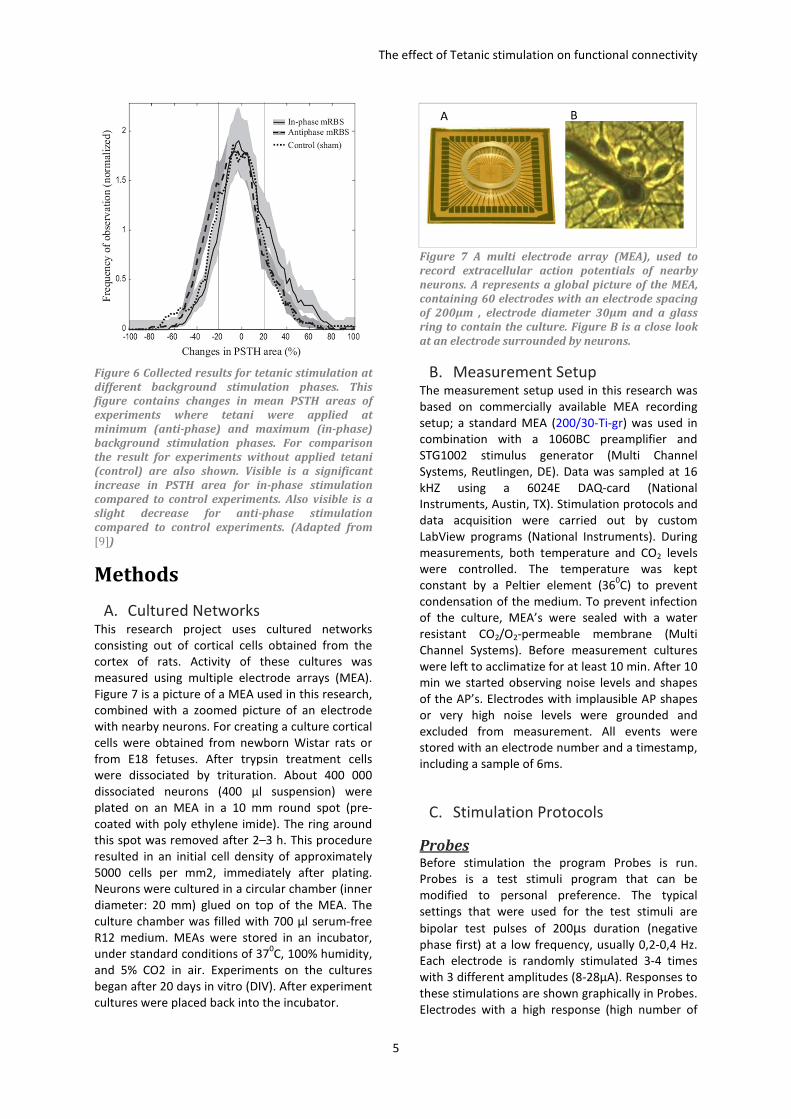
Figure 7 is a picture of a MEA used in this research,
combined with a zoomed picture of an electrode
with nearby neurons. For creating a culture cortical
cells were obtained from newborn Wistar rats or
from E18 fetuses. After trypsin treatment cells
were dissociated by trituration. About 400 000
dissociated neurons (400 μl suspension) were
plated on an MEA in a 10 mm round spot (pre-
coated with poly ethylene imide). The ring around
this spot was removed after 2–3 h. This procedure
resulted in an initial cell density of approximately
5000 cells per mm2, immediately after plating.
Neurons were cultured in a circular chamber (inner
diameter: 20 mm) glued on top of the MEA. The
culture chamber was filled with 700 μl serum-free
R12 medium. MEAs were stored in an incubator,
under standard conditions of 370C, 100% humidity,
and 5% CO2 in air. Experiments on the cultures
began after 20 days in vitro (DIV). After experiment
cultures were placed back into the incubator.
Figure 7 A multi electrode array (MEA), used to
record extracellular action potentials of nearby
neurons. A represents a global picture of the MEA,
containing 60 electrodes with an electrode spacing
of 200μm , electrode diameter 30μm and a glass
ring to contain the culture. Figure B is a close look
at an electrode surrounded by neurons.
B. Measurement Setup The measurement setup used in this research was
based on commercially available MEA recording
setup; a standard MEA (200/30-Ti-gr) was used in
combination with a 1060BC preamplifier and
STG1002 stimulus generator (Multi Channel
Systems, Reutlingen, DE). Data was sampled at 16
kHZ using a 6024E DAQ-card (National
Instruments, Austin, TX). Stimulation protocols and
data acquisition were carried out by custom
LabView programs (National Instruments). During
measurements, both temperature and CO2 levels
were controlled. The temperature was kept
constant by a Peltier element (360C) to prevent
condensation of the medium. To prevent infection
of the culture, MEA’s were sealed with a water
resistant CO2/O2-permeable membrane (Multi
Channel Systems). Before measurement cultures
were left to acclimatize for at least 10 min. After 10
min we started observing noise levels and shapes
of the AP’s. Electrodes with implausible AP shapes
or very high noise levels were grounded and
excluded from measurement. All events were
stored with an electrode number and a timestamp,
including a sample of 6ms.
C. Stimulation Protocols
Probes Before stimulation the program Probes is run.
Probes is a test stimuli program that can be
modified to personal preference. The typical
settings that were used for the test stimuli are
bipolar test pulses of 200µs duration (negative
phase first) at a low frequency, usually 0,2-0,4 Hz.
Each electrode is randomly stimulated 3-4 times
with 3 different amplitudes (8-28μA). Responses to
these stimulations are shown graphically in Probes.
Electrodes with a high response (high number of
A B
The effect of Tetanic stimulation on functional connectivity
6
activated electrodes) and natural action potential
shapes are considered to be suitable candidates for
stimulation.
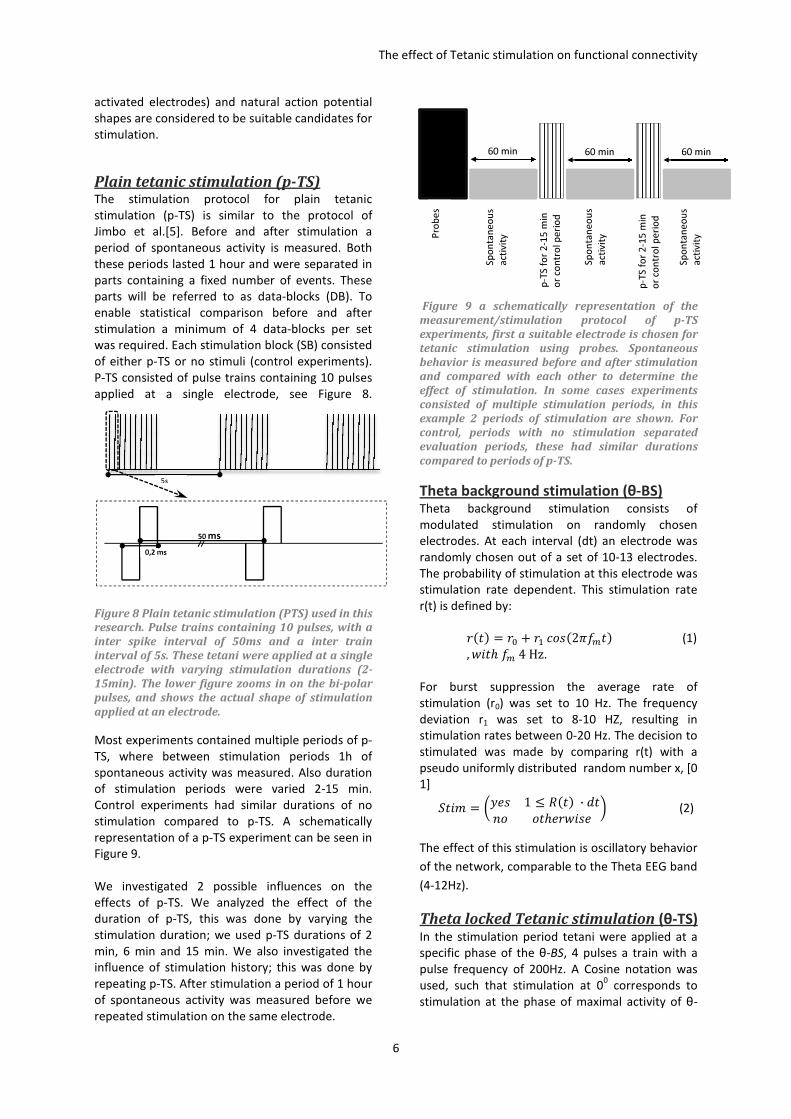
Plain tetanic stimulation (p-TS) The stimulation protocol for plain tetanic
stimulation (p-TS) is similar to the protocol of
Jimbo et al.[5]. Before and after stimulation a
period of spontaneous activity is measured. Both
these periods lasted 1 hour and were separated in
parts containing a fixed number of events. These
parts will be referred to as data-blocks (DB). To
enable statistical comparison before and after
stimulation a minimum of 4 data-blocks per set
was required. Each stimulation block (SB) consisted
of either p-TS or no stimuli (control experiments).
P-TS consisted of pulse trains containing 10 pulses
applied at a single electrode, see Figure 8.
Figure 8 Plain tetanic stimulation (PTS) used in this
research. Pulse trains containing 10 pulses, with a
inter spike interval of 50ms and a inter train
interval of 5s. These tetani were applied at a single
electrode with varying stimulation durations (2-
15min). The lower figure zooms in on the bi-polar
pulses, and shows the actual shape of stimulation
applied at an electrode.
Most experiments contained multiple periods of p-
TS, where between stimulation periods 1h of
spontaneous activity was measured. Also duration
of stimulation periods were varied 2-15 min.
Control experiments had similar durations of no
stimulation compared to p-TS. A schematically
representation of a p-TS experiment can be seen in
Figure 9.
We investigated 2 possible influences on the
effects of p-TS. We analyzed the effect of the
duration of p-TS, this was done by varying the
stimulation duration; we used p-TS durations of 2
min, 6 min and 15 min. We also investigated the
influence of stimulation history; this was done by
repeating p-TS. After stimulation a period of 1 hour
of spontaneous activity was measured before we
repeated stimulation on the same electrode.
Figure 9 a schematically representation of the
measurement/stimulation protocol of p-TS
experiments, first a suitable electrode is chosen for
tetanic stimulation using probes. Spontaneous
behavior is measured before and after stimulation
and compared with each other to determine the
effect of stimulation. In some cases experiments
consisted of multiple stimulation periods, in this
example 2 periods of stimulation are shown. For
control, periods with no stimulation separated
evaluation periods, these had similar durations
compared to periods of p-TS.
Theta background stimulation (θ-BS) Theta background stimulation consists of
modulated stimulation on randomly chosen
electrodes. At each interval (dt) an electrode was
randomly chosen out of a set of 10-13 electrodes.
The probability of stimulation at this electrode was
stimulation rate dependent. This stimulation rate
r(t) is defined by:
���� � �� � �� ���2����� (1)
, ���� �� 4 Hz.
For burst suppression the average rate of
stimulation (r0) was set to 10 Hz. The frequency
deviation r1 was set to 8-10 HZ, resulting in
stimulation rates between 0-20 Hz. The decision to
stimulated was made by comparing r(t) with a
pseudo uniformly distributed random number x, [0
1]
���� � ��� 1 � ���� · ���� �������� (2)
The effect of this stimulation is oscillatory behavior
of the network, comparable to the Theta EEG band
(4-12Hz).
Theta locked Tetanic stimulation (θ-TS) In the stimulation period tetani were applied at a
specific phase of the θ-BS, 4 pulses a train with a
pulse frequency of 200Hz. A Cosine notation was
used, such that stimulation at 00 corresponds to
stimulation at the phase of maximal activity of θ-
5s
50 ms
0,2 ms
60 min 60 min 60 min
Pro
be
s
Sp
on
tan
eo
us
act
ivit
y
p-T
S f
or
2-1
5 m
in
or
con
tro
l p
eri
od
Sp
on
tan
eo
us
act
ivit
y
Sp
on
tan
eo
us
act
ivit
y
p-T
S f
or
2-1
5 m
in
or
con
tro
l p
eri
od
The effect of Tetanic stimulation on functional connectivity
7
BS, this is denoted as θ0-TS. Applying tetani at the
phase of minimal activity was denoted as θ180-TS.
The protocol for tetanic stimulation at different
background stimulation rates (θ-TS) differed from
the plain tetanic stimulation (p-TS) protocol.
Before measurement 10-13 electrodes were
chosen using probes where θ-BS with fixed
amplitude for every electrode was applied. Similar
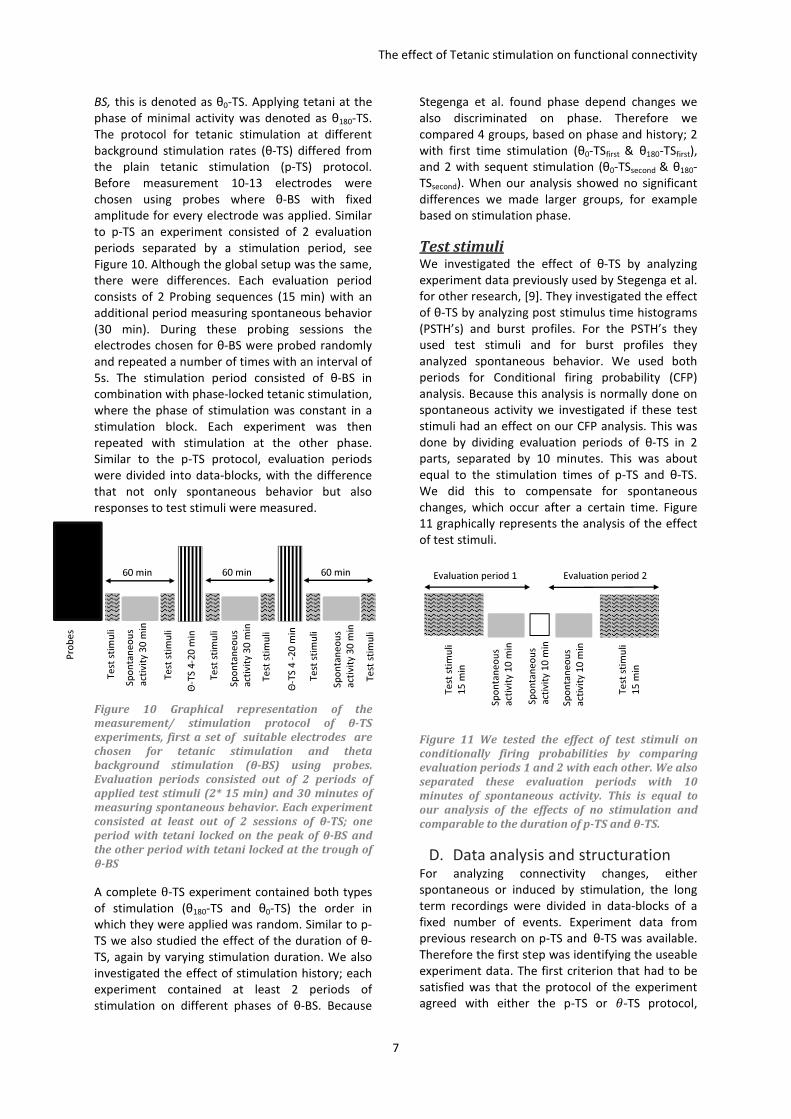
to p-TS an experiment consisted of 2 evaluation
periods separated by a stimulation period, see
Figure 10. Although the global setup was the same,
there were differences. Each evaluation period
consists of 2 Probing sequences (15 min) with an
additional period measuring spontaneous behavior
(30 min). During these probing sessions the
electrodes chosen for θ-BS were probed randomly
and repeated a number of times with an interval of
5s. The stimulation period consisted of θ-BS in
combination with phase-locked tetanic stimulation,
where the phase of stimulation was constant in a
stimulation block. Each experiment was then
repeated with stimulation at the other phase.
Similar to the p-TS protocol, evaluation periods
were divided into data-blocks, with the difference
that not only spontaneous behavior but also
responses to test stimuli were measured.
Figure 10 Graphical representation of the
measurement/ stimulation protocol of θ-TS
experiments, first a set of suitable electrodes are
chosen for tetanic stimulation and theta
background stimulation (θ-BS) using probes.
Evaluation periods consisted out of 2 periods of
applied test stimuli (2* 15 min) and 30 minutes of
measuring spontaneous behavior. Each experiment
consisted at least out of 2 sessions of θ-TS; one
period with tetani locked on the peak of θ-BS and
the other period with tetani locked at the trough of
θ-BS
A complete θ-TS experiment contained both types
of stimulation (θ180-TS and θ0-TS) the order in
which they were applied was random. Similar to p-
TS we also studied the effect of the duration of θ-
TS, again by varying stimulation duration. We also
investigated the effect of stimulation history; each
experiment contained at least 2 periods of
stimulation on different phases of θ-BS. Because
Stegenga et al. found phase depend changes we
also discriminated on phase. Therefore we
compared 4 groups, based on phase and history; 2
with first time stimulation (θ0-TSfirst & θ180-TSfirst),
and 2 with sequent stimulation (θ0-TSsecond & θ180-
TSsecond). When our analysis showed no significant
differences we made larger groups, for example
based on stimulation phase.
Test stimuli We investigated the effect of θ-TS by analyzing
experiment data previously used by Stegenga et al.
for other research, [9]. They investigated the effect
of θ-TS by analyzing post stimulus time histograms
(PSTH’s) and burst profiles. For the PSTH’s they
used test stimuli and for burst profiles they
analyzed spontaneous behavior. We used both
periods for Conditional firing probability (CFP)
analysis. Because this analysis is normally done on
spontaneous activity we investigated if these test
stimuli had an effect on our CFP analysis. This was
done by dividing evaluation periods of θ-TS in 2
parts, separated by 10 minutes. This was about
equal to the stimulation times of p-TS and θ-TS.
We did this to compensate for spontaneous
changes, which occur after a certain time. Figure
11 graphically represents the analysis of the effect
of test stimuli.
Figure 11 We tested the effect of test stimuli on
conditionally firing probabilities by comparing
evaluation periods 1 and 2 with each other. We also
separated these evaluation periods with 10
minutes of spontaneous activity. This is equal to
our analysis of the effects of no stimulation and
comparable to the duration of p-TS and θ-TS.
D. Data analysis and structuration For analyzing connectivity changes, either
spontaneous or induced by stimulation, the long
term recordings were divided in data-blocks of a
fixed number of events. Experiment data from
previous research on p-TS and θ-TS was available.
Therefore the first step was identifying the useable
experiment data. The first criterion that had to be
satisfied was that the protocol of the experiment
agreed with either the p-TS or !-TS protocol,
Sp
on
tan
eo
us
act
ivit
y 1
0 m
in
Sp
on
tan
eo
us
act
ivit
y 1
0 m
in
Te
st s
tim
uli
15
min
Te
st s
tim
uli
15
min
Sp
on
tan
eo
us
act
ivit
y 1
0 m
in
Evaluation period 1 Evaluation period 2
Te
st s
tim
uli
60 min 60 min 60 min
Pro
be
s
Sp
on
tan
eo
us
act
ivit
y 3
0 m
in
Θ-T
S 4
-20
min
Sp
on
tan
eo
us
act
ivit
y 3
0 m
in
Sp
on
tan
eo
us
act
ivit
y 3
0 m
in
Te
st s
tim
uli
Te
st s
tim
uli
Te
st s
tim
uli
Θ-T
S 4
-2
0 m
in
Te
st s
tim
uli
Te
st s
tim
uli
The effect of Tetanic stimulation on functional connectivity
8
described previously. Secondly the evaluation
periods had to comprise a minimum of 215
(~33000) events. The reason for this is that we
wanted to have 4 separate data-blocks of at least
213
events for analysis.
Conditional firing probabilities Evaluation periods before and after stimulation
were divided in fixed periods of events called data-
blocks. Each data-block was then analyzed by using
conditional firing probability analysis [11]. This
analysis started by finding the active electrodes, an
electrode was active if it contained more than 250
action potentials in a data-block. This number of
AP’s was necessary for fitting Equation (6), which
describes the conditional firing probability of an
electrode pair. This was done by placing all AP’s at
an electrode i in an array Xi[t], containing times at
all sample moments n.
"�#�$ � %1 ��� &� '( 0 �������� * (3)
With t the times at all sample moments. This was
done for all active electrodes (i + #0,59$). The
times of recorded spikes were binned in intervals
of 0,5ms. The number of the events on electrode i
followed by events on electrode j in intervals of
0,5ms, within a period of 500ms, are calculated by
equation (4).
.�������,#/$ � ∑ "�#�$ ·� "#� � /$ (4)
���� 0 � / � 500�
This was done for all possible electrode pairs i,j.
The conditional firing probability (CFP) of an
electrode pair was then found by dividing Nfollow by
the number of events at electrode i.
12(�,#/$ � ∑ ���� � �������
∑ ���� � (5)
���� 0 � / � 500�
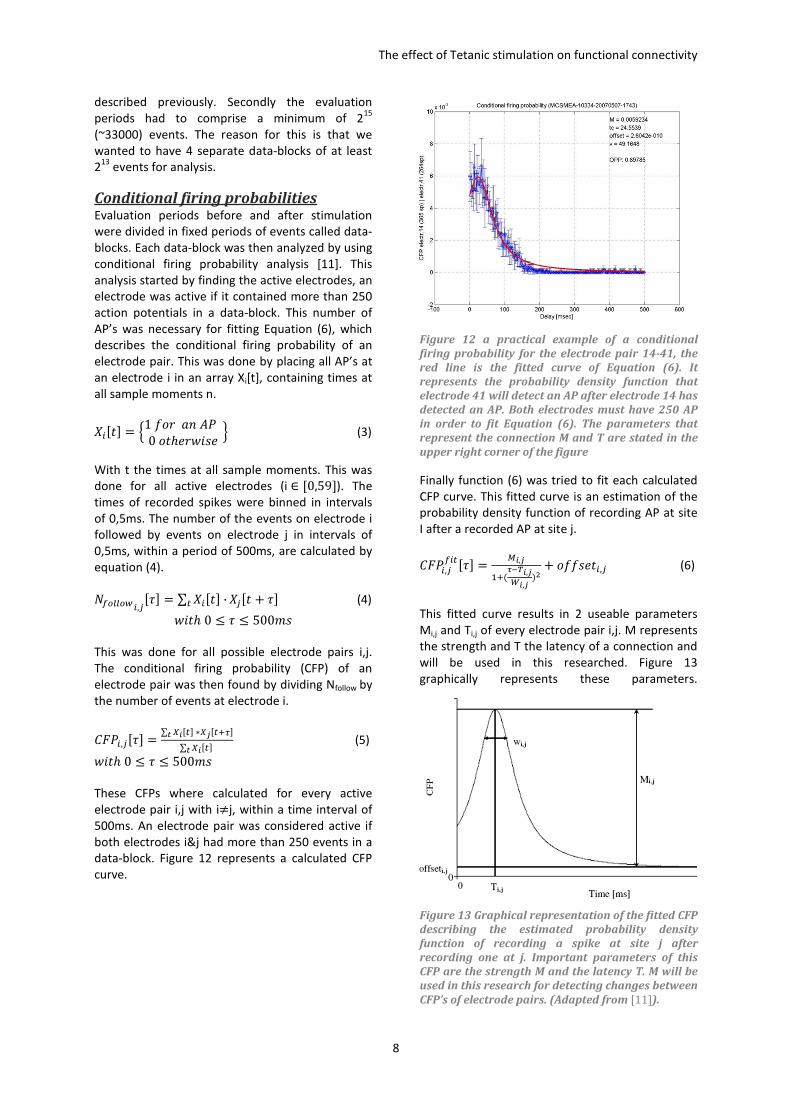
These CFPs where calculated for every active
electrode pair i,j with i3j, within a time interval of
500ms. An electrode pair was considered active if
both electrodes i&j had more than 250 events in a
data-block. Figure 12 represents a calculated CFP
curve.
Figure 1 Figure B is a practical example of a
conditional firing probability for the electrode pair
14-41, the red line is the fitted curve of equation
(6). It represents the probability density function
that electrode 41 will detect an AP after electrode
14 has detected an AP. Both electrodes must have
250 AP in order to fit equation (6). The parameters
that represent the connection M and T are stated in
the upper right corner of the figure
Figure 12 a practical example of a conditional
firing probability for the electrode pair 14-41, the
red line is the fitted curve of Equation (6). It
represents the probability density function that
electrode 41 will detect an AP after electrode 14 has
detected an AP. Both electrodes must have 250 AP
in order to fit Equation (6). The parameters that
represent the connection M and T are stated in the
upper right corner of the figure
Finally function (6) was tried to fit each calculated
CFP curve. This fitted curve is an estimation of the
probability density function of recording AP at site
I after a recorded AP at site j.
12(�,���#/$ � ��,�
�������,�
��,��
� ������, (6)
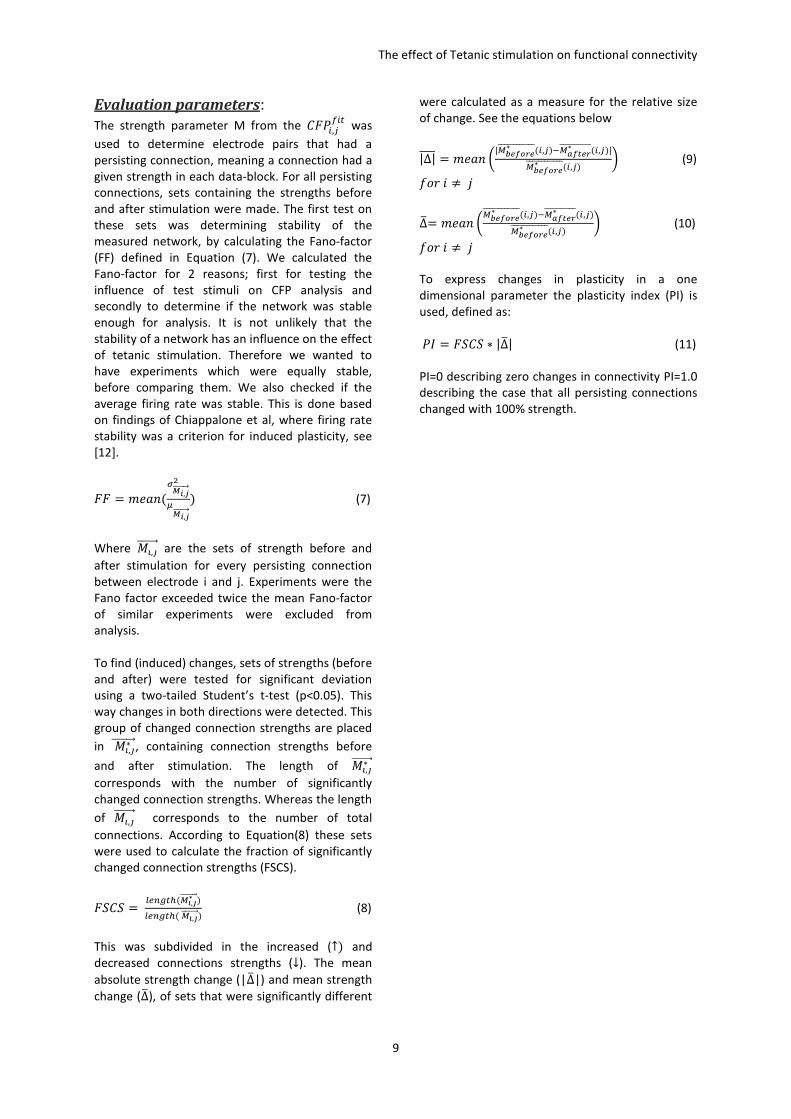
This fitted curve results in 2 useable parameters
Mi,j and Ti,j of every electrode pair i,j. M represents
the strength and T the latency of a connection and
will be used in this researched. Figure 13
graphically represents these parameters.
Figure 13 Graphical representation of the fitted CFP
describing the estimated probability density
function of recording a spike at site j after
recording one at j. Important parameters of this
CFP are the strength M and the latency T. M will be
used in this research for detecting changes between
CFP’s of electrode pairs. (Adapted from [11]).
The effect of Tetanic stimulation on functional connectivity
9
Evaluation parameters:
The strength parameter M from the 12(�,���
was
used to determine electrode pairs that had a
persisting connection, meaning a connection had a
given strength in each data-block. For all persisting
connections, sets containing the strengths before
and after stimulation were made. The first test on
these sets was determining stability of the
measured network, by calculating the Fano-factor
(FF) defined in Equation (7). We calculated the
Fano-factor for 2 reasons; first for testing the
influence of test stimuli on CFP analysis and
secondly to determine if the network was stable
enough for analysis. It is not unlikely that the
stability of a network has an influence on the effect
of tetanic stimulation. Therefore we wanted to
have experiments which were equally stable,
before comparing them. We also checked if the
average firing rate was stable. This is done based
on findings of Chiappalone et al, where firing rate
stability was a criterion for induced plasticity, see
[12].
22 = ��&�(
��,����
��,����
) (7)
Where 4�,�55555556 are the sets of strength before and
after stimulation for every persisting connection
between electrode i and j. Experiments were the
Fano factor exceeded twice the mean Fano-factor
of similar experiments were excluded from
analysis.
To find (induced) changes, sets of strengths (before
and after) were tested for significant deviation
using a two-tailed Student’s t-test (p<0.05). This
way changes in both directions were detected. This
group of changed connection strengths are placed
in 4�,�∗555555556, containing connection strengths before
and after stimulation. The length of 4�,�∗55555556
corresponds with the number of significantly
changed connection strengths. Whereas the length
of 4�,�55555556 corresponds to the number of total
connections. According to Equation(8) these sets
were used to calculate the fraction of significantly
changed connection strengths (FSCS).
2�1� = ������(��,�
∗���������)
������( ��,����������) (8)
This was subdivided in the increased (↑) and
decreased connections strengths (↓). The mean
absolute strength change (|∆7|) and mean strength
change (∆7), of sets that were significantly different
were calculated as a measure for the relative size
of change. See the equations below
|∆|7777 = ��&� �|�������∗ (�,)!������
∗ (�,)|
�������∗ (�,)
(9)
��� � ≠ 9
∆7= ��&� ��������∗ (�,)!������
∗ (�,)
�������∗ (�,)
(10)
��� � ≠ 9
To express changes in plasticity in a one
dimensional parameter the plasticity index (PI) is
used, defined as:
(: = 2�1� ∗ |∆7| (11)
PI=0 describing zero changes in connectivity PI=1.0
describing the case that all persisting connections
changed with 100% strength.
The effect of Tetanic stimulation on functional connectivity
10
Results
A. Experiments suitable for study Using the criteria preciously described, sets of
experiments that are suitable for study were
selected. This resulted in 18 (p-TS) and 22 (θ-TS)
useable experiments. The cultures stimulated
according to p-TS protocol usually had a lower
activity. To use these experiments for analysis the
data-block size was set to 213
events, this was
considered the absolute minimum size that still
had enough data for statistical analysis. Cultures
where θ-TS stimulation was applied were usually
more active, therefore the data-block size was
adjusted to 214
events. For both the p-TS
experiments and the θ-TS experiments the
evaluation period before and after stimulation
lasted around 30 min. (28 ± 14 min for !-TS and 33
± 6 min for p-TS). Meaning on average we only
used half of the evaluation periods. This is caused
by our decision to keep the number of data-blocks
used for analysis constant. We rejected three
experiments; one p-TS and two θ-TS experiments,
based on criterion of stability. These experiments
exceeded the threshold (FF > 2 x mean), see (7).
Which gave us 17 p-TS and 20 !-TS experiments
that where further analyzed.
B. Development of connections with
time To investigate the effect of stimulation on possible
induced plasticity the strength parameter of the
CFPfit was used, see Methods. To check the stability
of the strength parameter we plotted sets of
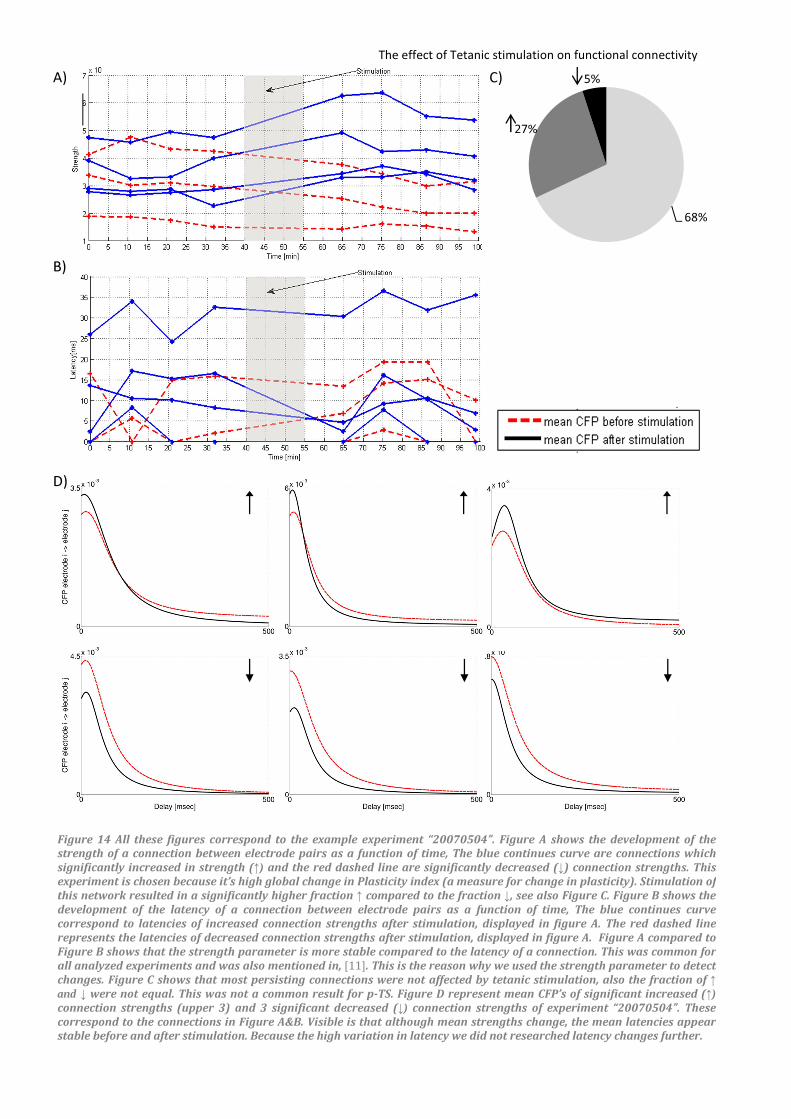
connection strengths versus time. Figure 14A is an
example of the development of the strength of a
connection as a function of time. This particular
experiment had a larger fraction of strengthened
connections (27%) than weakened (5%), which was
not common for p-TS experiments, see Figure 14C.
All these decreased connection strengths are
shown in the figure together with the first four
strengthened connections. Figure 14B is a plot of
the latency of these connections as a function of
time. This plot supports our choice for using M to
detect changes; not only are the latencies of a
connection sometimes zero, which makes analysis
more difficult, also the stability of the latency of
these connections is much lower than that of
strengths. We included Figure 14D to show the
difference in conditional firing probability (CFP)
between connections which weakened and
strengthened after stimulation. This figure is a plot
of the mean conditional firing probability (12(777777) of
individual connections before and after
stimulation. These 12(′77777777 correspond to the same
connections plotted in Figure 14A&B. Comparing
12(777777’s before and after stimulation, for
strengthened and weakened connections, lead to
an interesting observation for mean latencies. All
connections that were significantly affected in
strength after stimulation showed low or negligible
differences in mean latencies. Because of the great
variation in the latency of connections, we could
not determine a significant correlation between
changes in strength and latency of a connection.
C. Stability of Strengths The evaluation periods of the p-TS experiments
existed of measuring spontaneous behavior. Θ-TS
experiments on the other hand contained 2
periods with responses to test stimuli (2 * 15min)
and a period of spontaneous activity (30 min). The
stability of sets of connection strengths before and
after stimulation was assessed by the Fano-factor
(FF), see equation (7). The results can be found in
Table 1. We found that FF’s for p-TS and θ-TS were
significantly different (2-tailed t-test p<0,001).
These differences were also present between
control protocols, with and without test stimuli
(p<0,0015). Visible in Table 1 is that θ -TS
experiments had almost a double FF compared to
p-TS.
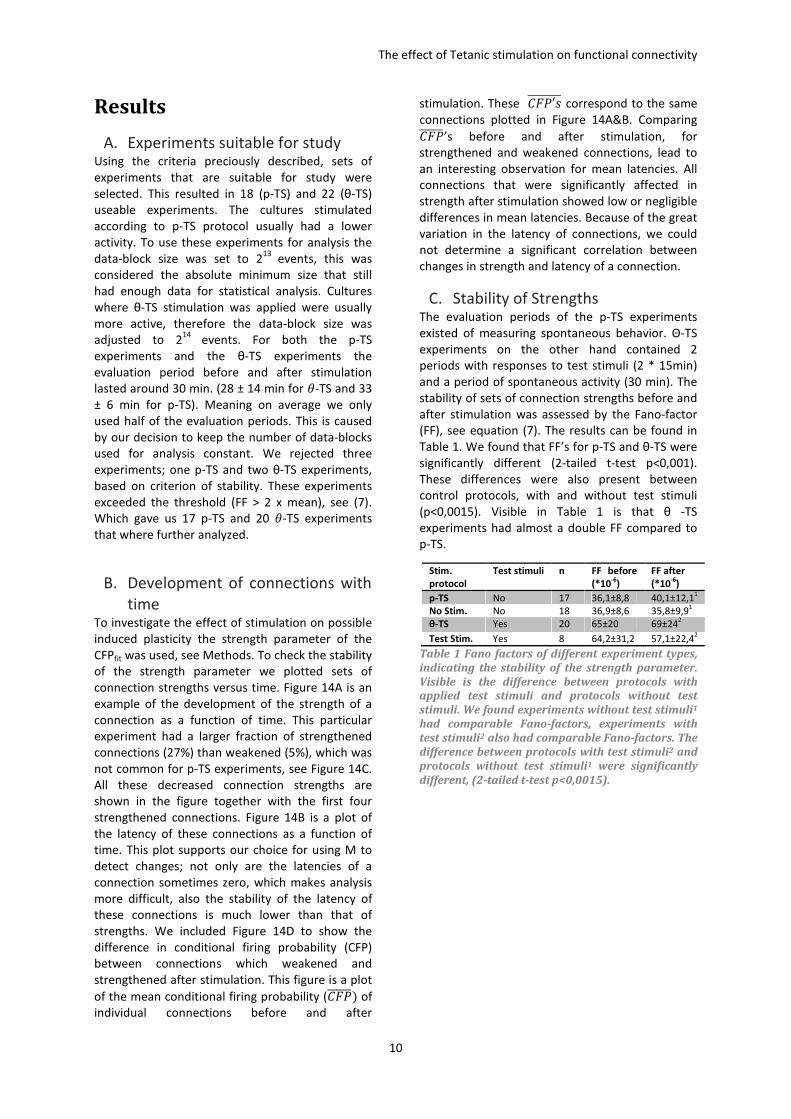
Table 1 Fano factors of different experiment types,
indicating the stability of the strength parameter.
Visible is the difference between protocols with
applied test stimuli and protocols without test
stimuli. We found experiments without test stimuli1
had comparable Fano-factors, experiments with
test stimuli2 also had comparable Fano-factors. The
difference between protocols with test stimuli2 and
protocols without test stimuli1 were significantly
different, (2-tailed t-test p<0,0015).
Stim.
protocol
Test stimuli n FF before
(*10-6
)
FF after
(*10-6
)
p-TS No 17 36,1±8,8 40,1±12,11
No Stim. No 18 36,9±8,6 35,8±9,91
θ-TS Yes 20 65±20 69±242
Test Stim. Yes 8 64,2±31,2 57,1±22,42
The effect of Tetanic stimulation on functional connectivity
11
68%
27%
5%A)
B)
C)
D)
Figure 14 All these figures correspond to the example experiment “20070504”. Figure A shows the development of the strength of a connection between electrode pairs as a function of time, The blue continues curve are connections which
significantly increased in strength (↑) and the red dashed line are significantly decreased (↓) connection strengths. This
experiment is chosen because it’s high global change in Plasticity index (a measure for change in plasticity). Stimulation of
this network resulted in a significantly higher fraction ↑ compared to the fraction ↓, see also Figure C. Figure B shows the
development of the latency of a connection between electrode pairs as a function of time, The blue continues curve
correspond to latencies of increased connection strengths after stimulation, displayed in figure A. The red dashed line
represents the latencies of decreased connection strengths after stimulation, displayed in figure A. Figure A compared to
Figure B shows that the strength parameter is more stable compared to the latency of a connection. This was common for
all analyzed experiments and was also mentioned in, [11]. This is the reason why we used the strength parameter to detect
changes. Figure C shows that most persisting connections were not affected by tetanic stimulation, also the fraction of ↑ and ↓ were not equal. This was not a common result for p-TS. Figure D represent mean CFP’s of significant increased (↑)connection strengths (upper 3) and 3 significant decreased (↓) connection strengths of experiment “20070504”. These
correspond to the connections in Figure A&B. Visible is that although mean strengths change, the mean latencies appear stable before and after stimulation. Because the high variation in latency we did not researched latency changes further.
The effect of Tetanic stimulation on functional connectivity
12
D. Effects of plain tetanic stimulation
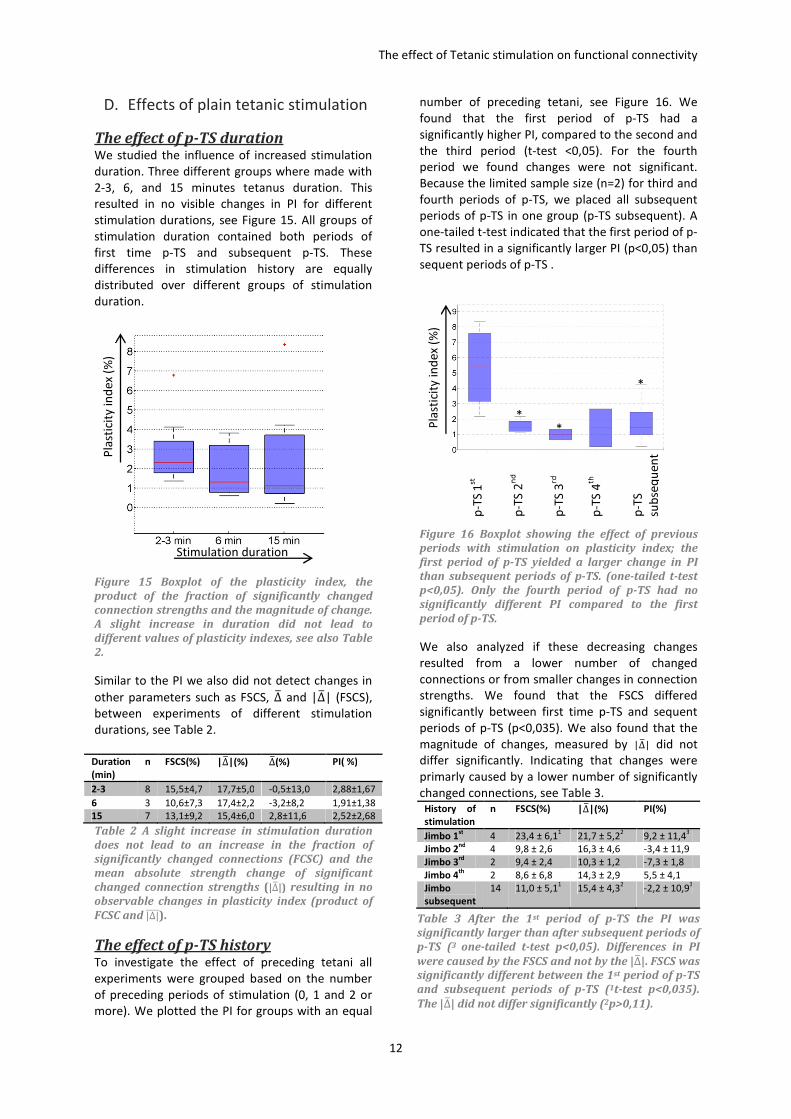
The effect of p-TS duration We studied the influence of increased stimulation
duration. Three different groups where made with
2-3, 6, and 15 minutes tetanus duration. This
resulted in no visible changes in PI for different
stimulation durations, see Figure 15. All groups of
stimulation duration contained both periods of
first time p-TS and subsequent p-TS. These
differences in stimulation history are equally
distributed over different groups of stimulation
duration.
Figure 15 Boxplot of the plasticity index, the
product of the fraction of significantly changed
connection strengths and the magnitude of change.
A slight increase in duration did not lead to
different values of plasticity indexes, see also Table
2.
Similar to the PI we also did not detect changes in
other parameters such as FSCS, ∆7 and |∆7| (FSCS),
between experiments of different stimulation
durations, see Table 2.
Duration
(min)
n FSCS(%) |∆�|(%) ∆�(%) PI( %)
2-3 8 15,5±4,7 17,7±5,0 -0,5±13,0 2,88±1,67
6 3 10,6±7,3 17,4±2,2 -3,2±8,2 1,91±1,38
15 7 13,1±9,2 15,4±6,0 2,8±11,6 2,52±2,68
Table 2 A slight increase in stimulation duration
does not lead to an increase in the fraction of
significantly changed connections (FCSC) and the
mean absolute strength change of significant
changed connection strengths (|∆�|) resulting in no
observable changes in plasticity index (product of
FCSC and |∆|����).
The effect of p-TS history To investigate the effect of preceding tetani all
experiments were grouped based on the number
of preceding periods of stimulation (0, 1 and 2 or
more). We plotted the PI for groups with an equal
number of preceding tetani, see Figure 16. We
found that the first period of p-TS had a
significantly higher PI, compared to the second and
the third period (t-test <0,05). For the fourth
period we found changes were not significant.
Because the limited sample size (n=2) for third and
fourth periods of p-TS, we placed all subsequent
periods of p-TS in one group (p-TS subsequent). A
one-tailed t-test indicated that the first period of p-
TS resulted in a significantly larger PI (p<0,05) than
sequent periods of p-TS .
Figure 16 Boxplot showing the effect of previous
periods with stimulation on plasticity index; the
first period of p-TS yielded a larger change in PI
than subsequent periods of p-TS. (one-tailed t-test
p<0,05). Only the fourth period of p-TS had no
significantly different PI compared to the first
period of p-TS.
We also analyzed if these decreasing changes
resulted from a lower number of changed
connections or from smaller changes in connection
strengths. We found that the FSCS differed
significantly between first time p-TS and sequent
periods of p-TS (p<0,035). We also found that the
magnitude of changes, measured by |∆�| did not
differ significantly. Indicating that changes were
primarly caused by a lower number of significantly
changed connections, see Table 3.
History of
stimulation
n FSCS(%) |∆�|(%) PI(%)
Jimbo 1st
4 23,4 ± 6,11 21,7 ± 5,2
2 9,2 ± 11,4
3
Jimbo 2nd
4 9,8 ± 2,6 16,3 ± 4,6 -3,4 ± 11,9
Jimbo 3rd
2 9,4 ± 2,4 10,3 ± 1,2 -7,3 ± 1,8
Jimbo 4th
2 8,6 ± 6,8
14,3 ± 2,9
5,5 ± 4,1
Jimbo
subsequent
14 11,0 ± 5,11
15,4 ± 4,32 -2,2 ± 10,9
3
Table 3 After the 1st period of p-TS the PI was
significantly larger than after subsequent periods of
p-TS (3 one-tailed t-test p<0,05). Differences in PI
were caused by the FSCS and not by the |∆�|. FSCS was
significantly different between the 1st period of p-TS
and subsequent periods of p-TS (1t-test p<0,035).
The |∆�| did not differ significantly (2p>0,11).
Stimulation duration
Pla
stic
ity in
de
x (%
)
p-T
S 1
st
p-T
S 2
nd
p-T
S 3
rd
p-T
S 4
th
p-T
S
sub
seq
ue
nt
Pla
stic
ity in
de
x (%
) *
*
*
The effect of Tetanic stimulation on functional connectivity
13
Because FSCS between was different between the
first period of p-TS and subsequent periods of p-TS,
we investigated if connections affected in the first
period of stimulation were affected in the same
direction in subsequent period of stimulation. For
example if a connection strengthened in the first
period also strengthened in the second period. The
number of experiments that had connections that
either further strenthened(1 out of 14) or further
weakened(2 out of 14) was small. More common
was that connections strengthened in the first
period of p-TS and weakened in the second period
of p-TS or vice versa, see Table 4.
Reproducibility of
induced changes
↑ (%)
Sequent period
↓ (%)
Sequent period
First period ↑ 1,02 ± 3,68 10,0 ± 14,3
First period ↓ 6,46 ± 13,58 3,81 ± 9,66
Table 4 Reproducibility of alterations in connection
strengths; we found a small fraction of connections
affected in the first period were also affected in the
sequent period. Even smaller was the fraction of
connections that significantly changed in the same
direction. For example connections which increased
(↑) in the first period and also increased in a
sequent period. The fraction of connections
affected in the opposite way was also small. Most
changed connections in a sequent period were
different connections than those affected in a
preceding period.
The effect of p-TS on Fractions of ↑ & ↓ On average p-TS tended to yield a more
strengthened connections (↑) than weakened
ones (↓), see Figure 18. However, this difference
was not significant (t-test, p>0,22). It was most
common that electrodes showed connections with
increased connection strength, as well as
connections with decreased strength with other
electrodes. In other words we did not find that an
electrode had either exclusively increased or
decreased connections.
E. Effects of θ-TS stimulation
The effect of θ-TS duration. For tetanic stimulation with theta background
stimulation (θ-TS), the duration of the stimulation
was mostly constant (4-6min), although 6
experiments had stimulation durations of > 15 min.
Plasticity parameters of these experiments with
increased stimulation durations did not
significantly differ from experiments with a normal
stimulation duration(t-test, p>0,38). Therefore we
did not make a distinction between durations in
further analysis.
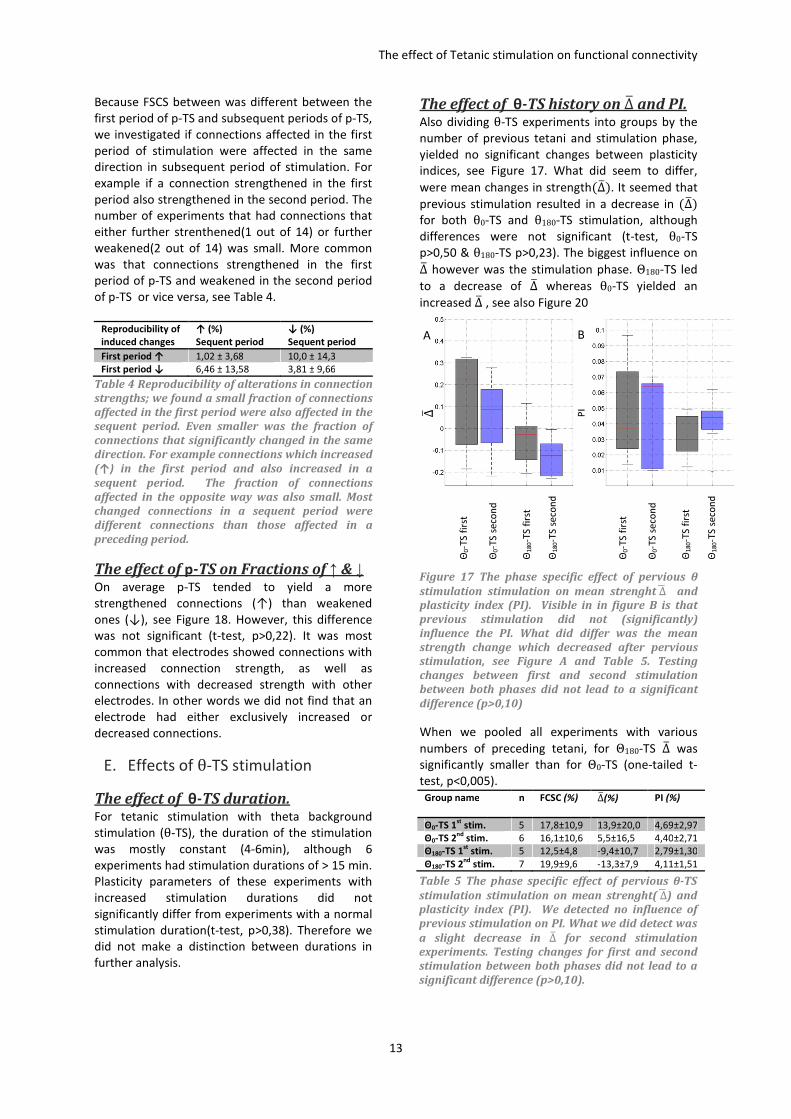
The effect of θ-TS history on ∆� and PI. Also dividing θ-TS experiments into groups by the
number of previous tetani and stimulation phase,
yielded no significant changes between plasticity
indices, see Figure 17. What did seem to differ,
were mean changes in strength�∆7�. It seemed that
previous stimulation resulted in a decrease in �∆7�
for both θ0-TS and θ180-TS stimulation, although
differences were not significant (t-test, θ0-TS
p>0,50 & θ180-TS p>0,23). The biggest influence on
∆7 however was the stimulation phase. Θ180-TS led
to a decrease of ∆7 whereas θ0-TS yielded an
increased ∆7 , see also Figure 20
Figure 17 The phase specific effect of pervious θ
stimulation stimulation on mean strenght ∆� and
plasticity index (PI). Visible in in figure B is that
previous stimulation did not (significantly)
influence the PI. What did differ was the mean
strength change which decreased after pervious
stimulation, see Figure A and Table 5. Testing
changes between first and second stimulation
between both phases did not lead to a significant
difference (p>0,10)
When we pooled all experiments with various
numbers of preceding tetani, for Θ180-TS ∆7 was
significantly smaller than for Θ0-TS (one-tailed t-
test, p<0,005).
Table 5 The phase specific effect of pervious θ-TS
stimulation stimulation on mean strenght( ∆� ) and
plasticity index (PI). We detected no influence of
previous stimulation on PI. What we did detect was
a slight decrease in ∆� for second stimulation
experiments. Testing changes for first and second
stimulation between both phases did not lead to a
significant difference (p>0,10).
Group name n FCSC (%) ∆�(%) PI (%)
Θ0-TS 1st
stim. 5 17,8±10,9 13,9±20,0 4,69±2,97
Θ0-TS 2nd
stim. 6 16,1±10,6 5,5±16,5 4,40±2,71
Θ180-TS 1st
stim. 5 12,5±4,8 -9,4±10,7 2,79±1,30
Θ180-TS 2nd
stim. 7 19,9±9,6 -13,3±7,9 4,11±1,51
Θ1
80-T
S s
eco
nd
Θ1
80-T
S f
irst
Θ0-T
S s
eco
nd
Θ0-T
S f
irst
Θ1
80-T
S s
eco
nd
Θ1
80-T
S f
irst
Θ0-T
S s
eco
nd
Θ0-T
S f
irst
∆�
PI
A B
The effect of Tetanic stimulation on functional connectivity
14
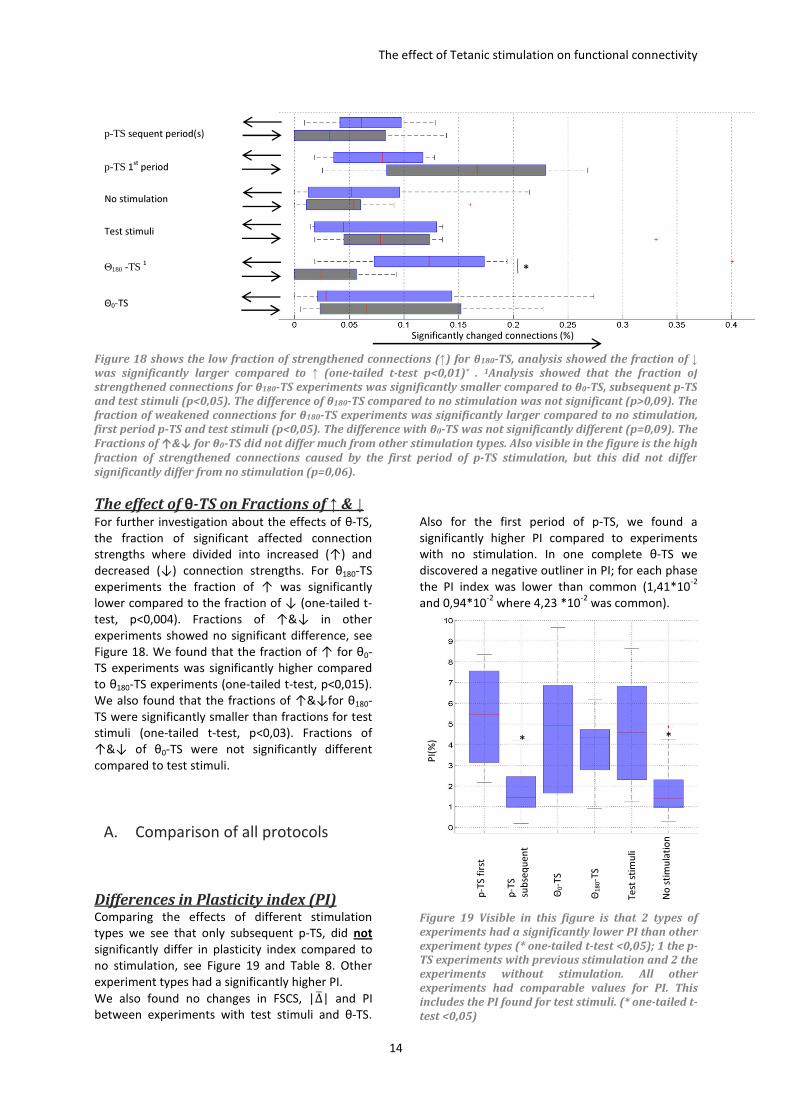
The effect of θ-TS on Fractions of ↑ & ↓ For further investigation about the effects of θ-TS,
the fraction of significant affected connection
strengths where divided into increased (↑) and
decreased (↓) connection strengths. For θ180-TS
experiments the fraction of ↑ was significantly
lower compared to the fraction of ↓ (one-tailed t-
test, p<0,004). Fractions of ↑&↓ in other
experiments showed no significant difference, see
Figure 18. We found that the fraction of ↑ for θ0-
TS experiments was significantly higher compared
to θ180-TS experiments (one-tailed t-test, p<0,015).
We also found that the fractions of ↑&↓for θ180-
TS were significantly smaller than fractions for test
stimuli (one-tailed t-test, p<0,03). Fractions of
↑&↓ of θ0-TS were not significantly different
compared to test stimuli.
A. Comparison of all protocols
Differences in Plasticity index (PI) Comparing the effects of different stimulation
types we see that only subsequent p-TS, did not
significantly differ in plasticity index compared to
no stimulation, see Figure 19 and Table 8. Other
experiment types had a significantly higher PI.
We also found no changes in FSCS, |∆7| and PI
between experiments with test stimuli and θ-TS.
Compared with no stimulation both test stimuli
and θ-TS had a significantly higher PI , see table 6.
Also for the first period of p-TS, we found a
significantly higher PI compared to experiments
with no stimulation. In one complete θ-TS we
discovered a negative outliner in PI; for each phase
the PI index was lower than common (1,41*10-2
and 0,94*10-2
where 4,23 *10-2
was common).
Figure 19 Visible in this figure is that 2 types of
experiments had a significantly lower PI than other
experiment types (* one-tailed t-test <0,05); 1 the p-
TS experiments with previous stimulation and 2 the
experiments without stimulation. All other
experiments had comparable values for PI. This
includes the PI found for test stimuli. (* one-tailed t-
test <0,05)
Decreased
Increased
p-TS sequent period(s)
p-TS 1st period
No stimulation
Test stimuli
Θ180 -TS 1
Θ0-TS
Figure 18 shows the low fraction of strengthened connections (↑) for θ180-TS, analysis showed the fraction of ↓
was significantly larger compared to ↑ (one-tailed t-test p<0,01)* . 1Analysis showed that the fraction of
strengthened connections for θ180-TS experiments was significantly smaller compared to θ0-TS, subsequent p-TS
and test stimuli (p<0,05). The difference of θ180-TS compared to no stimulation was not significant (p>0,09). The
fraction of weakened connections for θ180-TS experiments was significantly larger compared to no stimulation,
first period p-TS and test stimuli (p<0,05). The difference with θ0-TS was not significantly different (p=0,09). The
Fractions of ↑&↓ for θ0-TS did not differ much from other stimulation types. Also visible in the figure is the high
fraction of strengthened connections caused by the first period of p-TS stimulation, but this did not differ
significantly differ from no stimulation (p=0,06).
Significantly changed connections (%)
PI(
%)
p-T
S
sub
seq
ue
nt
p-T
S f
irst
Θ1
80-T
S
Θ0-T
S
No
sti
mu
lati
on
Te
st s
tim
uli
* *
*
The effect of Tetanic stimulation on functional connectivity
15
Compared PI of experiment types p-value
p-TS 1st period No stim. 0,04
p-TS subsequent No stim. 0,48
Theta 0 No stim. 0,01
Theta 180 No stim. <0,01
p-TS 1st period p-TS subsequent 0,04
Theta 0 Theta 180 0,21
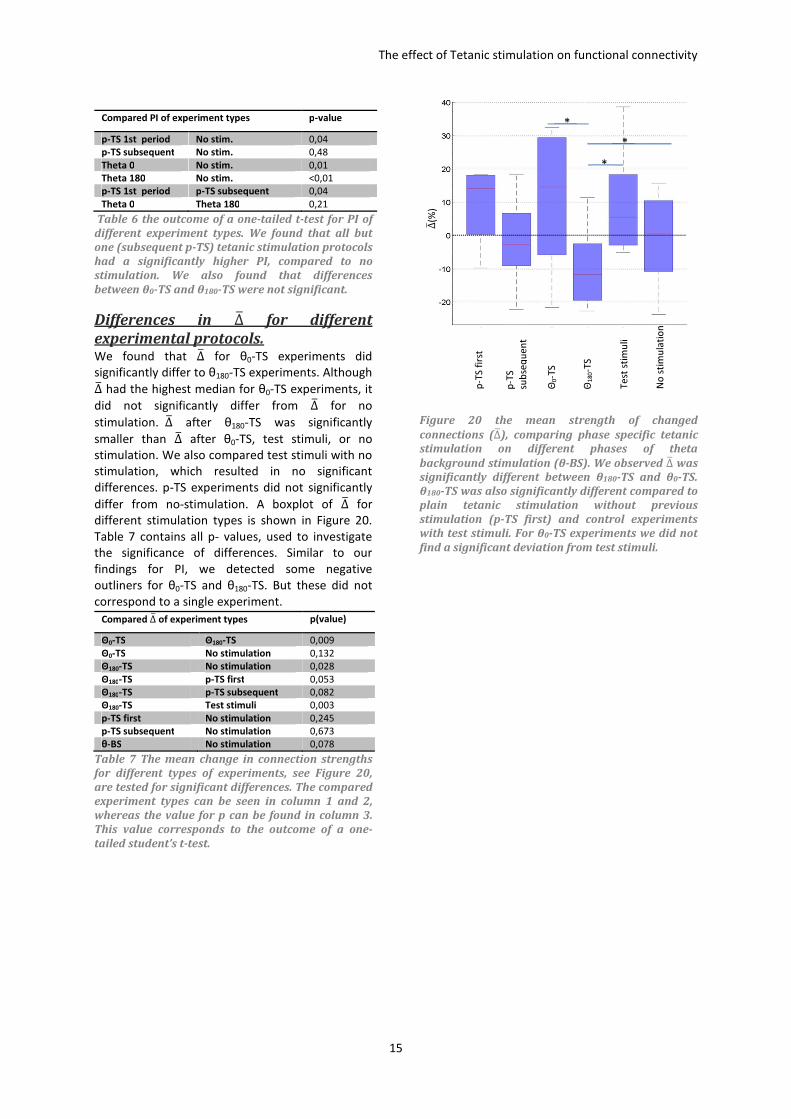
Table 6 the outcome of a one-tailed t-test for PI of
different experiment types. We found that all but
one (subsequent p-TS) tetanic stimulation protocols
had a significantly higher PI, compared to no
stimulation. We also found that differences
between θ0-TS and θ180-TS were not significant.
Differences in ∆� for different
experimental protocols. We found that ∆7 for θ0-TS experiments did
significantly differ to θ180-TS experiments. Although
∆7 had the highest median for θ0-TS experiments, it
did not significantly differ from ∆7 for no
stimulation. ∆7 after θ180-TS was significantly
smaller than ∆7 after θ0-TS, test stimuli, or no
stimulation. We also compared test stimuli with no
stimulation, which resulted in no significant
differences. p-TS experiments did not significantly
differ from no-stimulation. A boxplot of ∆7 for
different stimulation types is shown in Figure 20.
Table 7 contains all p- values, used to investigate
the significance of differences. Similar to our
findings for PI, we detected some negative
outliners for θ0-TS and θ180-TS. But these did not
correspond to a single experiment.
Table 7 The mean change in connection strengths
for different types of experiments, see Figure 20,
are tested for significant differences. The compared
experiment types can be seen in column 1 and 2,
whereas the value for p can be found in column 3.
This value corresponds to the outcome of a one-
tailed student’s t-test.
Figure 20 the mean strength of changed
connections (∆�), comparing phase specific tetanic
stimulation on different phases of theta
background stimulation (θ-BS). We observed ∆� was
significantly different between θ180-TS and θ0-TS.
θ180-TS was also significantly different compared to
plain tetanic stimulation without previous
stimulation (p-TS first) and control experiments
with test stimuli. For θ0-TS experiments we did not
find a significant deviation from test stimuli.
Compared ∆� of experiment types p(value)
Θ0-TS Θ180-TS 0,009
Θ0-TS No stimulation 0,132
Θ180-TS No stimulation 0,028
Θ180-TS p-TS first 0,053
Θ180-TS p-TS subsequent 0,082
Θ180-TS Test stimuli 0,003
p-TS first No stimulation 0,245
p-TS subsequent No stimulation 0,673
θ-BS No stimulation 0,078
p-T
S
sub
seq
ue
nt
p-T
S f
irst
Θ1
80-T
S
Θ0-T
S
No
sti
mu
lati
on
Te
st s
tim
uli
∆�(%
)
*
*
*
The effect of Tetanic stimulation on functional connectivity
16
Discussion We investigated connectivity changes of a cultured
neuronal network by applying two stimulation
protocols of tetanic stimulation; p-TS and θ-TS. For
both protocols we investigated the effect of the
duration and history of stimulation. We compared
conditional firing probabilities of pre- and post-
stimulation periods to spontaneously occurring
changes. To quantify the observed changes in
functional connectivity, we calculated the fraction
of significantly changed connections (FSCS) and the
size of absolute changes (|∆7|). To express these
changes in connectivity in a one dimensional
parameter we calculated the plasticity index (PI).
We found that both p-TS and θ-TS had a significant
influence on functional connectivity. Furthermore
for θ-TS we found phase specific changes. We also
found that test stimuli used for PSTH’s analysis
resulted in significant changes in CFP’s. We will
start the discussion for our results with p-TS.
A. The limited effect of P-TS We found that applying tetanic stimuli on a single
electrode has a limited effect on functional
connectivity. Increasing the stimulation duration of
the tetanic stimulus did not lead to an increase of
both size and number of significantly affected
connections. A recent study reported higher values
for PI, after increasing the stimulation duration of
various stimulation protocols [13]. In their set of
stimulation protocols tetanic stimulation was
absent, but for no stimulation and random
electrode stimulation the PI showed the tendency
to increase when the stimulation duration
increased. This differs from our findings for tetanic
stimulation; a possible reason for this difference is
the range of their stimulation duration (1-5h),
which is much larger than the range in our
experiments (2-15 min). This could indicate that
tetanic stimulation duration may have an
influence, but our range of stimulation duration is
too small to detect these changes. We also found
that subsequent periods of tetanic stimulation on
the same electrode yielded significantly smaller
PIs. Subsequent p-TS resulted in PIs comparable to
PIs corresponding to spontaneous occurring
changes. Furthermore we found that most
connections, affected in the first period of p-TS,
were not affected again in subsequent periods of
stimulation. This makes it plausible that
connections were still affected by the previous
stimulation and adapted to p-TS. Another
possibility is that tetanic stimulation was not the
cause of change in the connection strengths in the
first place. This is unlikely, because of the
significantly higher PI after the 1st
period of p-TS,
compared to spontaneous occurring changes,
which indicated that tetanic stimulation had an
effect on network connectivity. Therefore it’s likely
that changes induced by our tetanic stimulation
lasted for periods > 1 hour, which support the
theory that long lasting forms of plasticity such as
LTP and LTD took place. In [14], [15] and [2]
intracellular experiments were used and these all
concluded that tetanic stimulation lead to LTP in
the post-synaptic neuron.
We did not found p-TS led to a significant
alteration in a mean change of connection
strengths. This indicates that changes in
connection strengths are balanced, some
connections strengthen others weaken but on
average they remain constant. Thus p-TS does not
lead to a potentiation of the entire network. This
was also found by Jimbo et al. [5]. They found
tetanic stimulation did not lead to a global increase
of neuron firing rates. Instead they found test
stimulation site specific changes after stimulation;
to some sites the network had an increased
response to others a decreased response. Their
conclusion was tetanic stimulation led to
simultaneous pathway specific potentiation and
depression. This is supported by our results;
tetanic stimulation induces significant changes in
functional connectivity, causing both strengthened
and weakened connections.
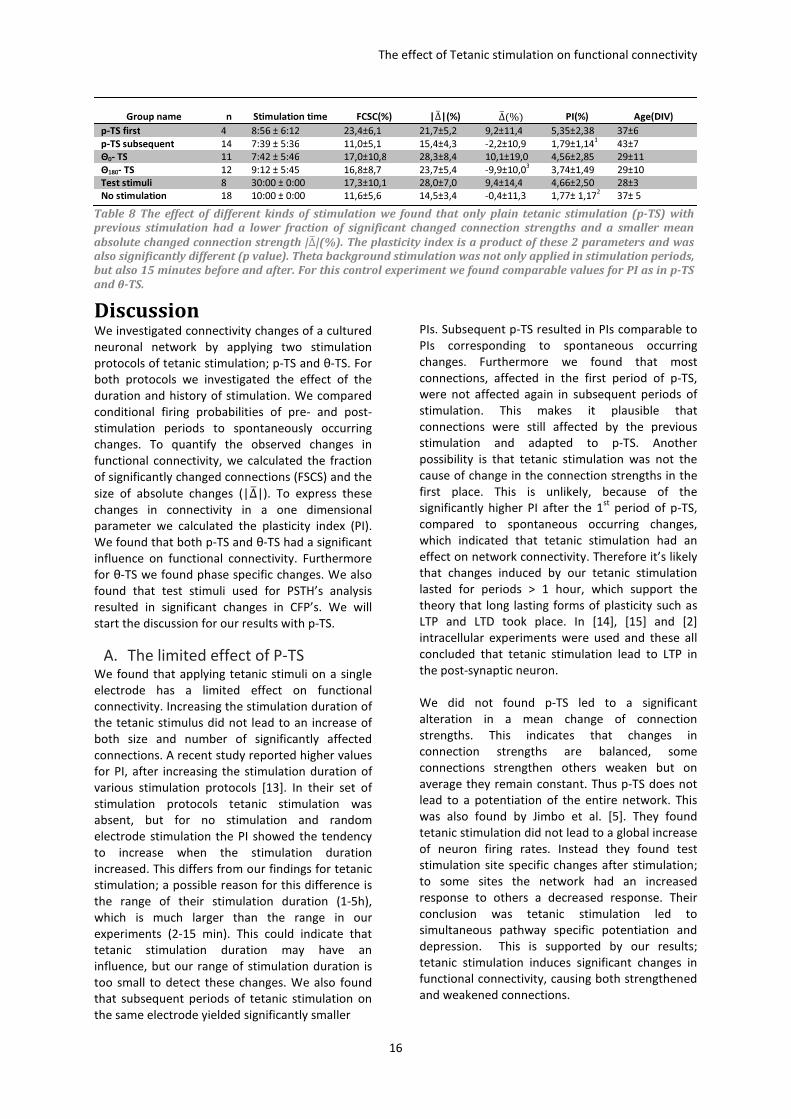
Group name n Stimulation time FCSC(%) |∆�|(%) ∆�(%) PI(%) Age(DIV)
p-TS first 4 8:56 ± 6:12 23,4±6,1 21,7±5,2 9,2±11,4 5,35±2,38 37±6
p-TS subsequent 14 7:39 ± 5:36 11,0±5,1 15,4±4,3 -2,2±10,9 1,79±1,141
43±7
Θ0- TS 11 7:42 ± 5:46 17,0±10,8 28,3±8,4 10,1±19,0 4,56±2,85 29±11
Θ180- TS 12 9:12 ± 5:45 16,8±8,7 23,7±5,4 -9,9±10,03
3,74±1,49 29±10
Test stimuli 8 30:00 ± 0:00 17,3±10,1 28,0±7,0 9,4±14,4 4,66±2,50 28±3
No stimulation 18 10:00 ± 0:00 11,6±5,6 14,5±3,4 -0,4±11,3 1,77± 1,172
37± 5
Table 8 The effect of different kinds of stimulation we found that only plain tetanic stimulation (p-TS) with
previous stimulation had a lower fraction of significant changed connection strengths and a smaller mean
absolute changed connection strength |∆�|(%). The plasticity index is a product of these 2 parameters and was also significantly different (p value). Theta background stimulation was not only applied in stimulation periods,
but also 15 minutes before and after. For this control experiment we found comparable values for PI as in p-TS
and θ-TS.
The effect of Tetanic stimulation on functional connectivity
17
Ruaro et al. also reported a significant effect of
tetanic stimulation on the average firing rate of
recording sites in [16]. They used a significantly
higher stimulation frequency (250Hz) during a
period of ~2min and compared responses of 2
different groups of stimulated electrodes. They
could discriminate between these responses, for at
least 1 hour. This indicates that long lasting forms
of plasticity are present. This found memory for
specific stimulation sites could be related to the
low PI we found for subsequent stimulations,
indicating an adaption of the network to the
tetanic stimulation. Therefore our hypothesis is
that the network adapted to p-TS. A period of 2-3
min of p-TS could be enough to trigger this
adaption. This hypothesis is further supported by
our observation that longer tetani did not further
change network connectivity. More research has to
be done to prove this hypothesis.
B. Test stimuli affected PI For plain tetanic stimulation p-TS, we found that
subsequent tetani had much less effect. For tetanic
stimulation applied at different theta background
stimulation phases (θ-BS) we did not observe an
influence of previous stimulations. This was tested
by a period of applying tetani in-phase (θ0-TS) and
anti-phase (θ180-TS) with theta background
stimulation (θ-BS). These periods are separated by
an evaluation period existing out of test stimuli and
spontaneous behavior. Also the stimulation
durations varied, but similar to p-TS we found no
influence of stimulation duration. This may have
had several reasons; the first is that test stimuli
have a significant influence on functional
connectivity, masking induced changes.
Another reason could be that the effect of tetanic
stimulation is limited; longer tetanic stimulation on
the same electrode may not result in more
changes. We tested the effect of these test stimuli
and found a significant influence on connection
strengths; test stimuli showed a similar PI as θ0-TS
and θ180-TS, which was significantly larger than PI
after no stimulation. Also subsequent stimulation
showed a similar PI compared to stimulation in the
previous period, which is different compared to p-
TS experiments. This could be caused by θ-BS or
test stimuli, notice that the duration of applying
test stimuli is significantly larger then than the
period of tetanic stimulation. This supports the
idea that test stimuli either influences functional
connectivity or influences the outcome of CFP
analysis.
C. Phase dependent changes caused
by θ-TS To find changes we took a closer look at the CFP’s
and separated connections that weakened and
strengthened. When we divided the fraction of
significantly changed connections (FSCS) we found
θ180-TS resulted in a significantly higher fraction of
connections which decreased in strength (↓)
compared to connections that increased in
strength (↑). Furthermore the mean change in
connection strength (∆)777 was significantly smaller
than zero. A decrease in ∆7 would indicate a global
weakening of network connections. This supports
the findings by Stegenga et al. [9] who found that
θ180-TS had a tendency to cause a decrease in post
stimulus time histogram (PSTH) area. These PSTH’s,
are histograms of the network response to test
stimuli. A decrease in PSTH area indicates a
possible global weakening of network connections.
They also found that θ0-TS lead to a significant
increase in PSTH areas after simulation. We found
for θ0-TS that the fraction of ↑ and ↓ were almost
equal, however ∆7 had a tendency to be positive,
the median value was the highest of all protocols
tested (see Figure 20). Unlike for θ180-TS this
change in ∆7 was not significant; this was probably
caused by 2 experiments which clearly deviated
from the rest of the set (ntotal=11). What was
interesting is difference in mean and median of the
fraction of ↓ found for θ0-TS. The median was
significantly lower than the mean, indicating that
for most experiments the fraction of ↓ was low.
This is similar to the median of ∆7 which was higher
than then the mean. This indicates that for most
experiments θ0-TS results in an increase of ∆7 and a
higher fraction of ↑ compared to the fraction of
↓. This agrees with the results of Stegenga et al.
D. θ-TS could have more effect
compared to p-TS Another reason why we did not find significant
changes for θ0-TS could be the presence of test
stimuli; these could mask possibly induced
changes. We measured that these test stimuli had
a significant effect on connection strengths. A
reason could be that these test stimuli affect our
CFP analysis resulting in larger fluctuations in the
connection strengths found across subsequent
data blocks. This theory is supported by our results
for the variation in connection strengths; this
variation was significantly higher for evaluation
periods with test stimuli compared to evaluation
periods without test stimuli. This higher variation
would probably result in less significantly changed
connections, because changes have to be larger to
The effect of Tetanic stimulation on functional connectivity
18
become significant. This could indicate θ-TS had
more influence on functional connectivity than p-
TS, because results for θ-TS had to exceed a larger
threshold to be noted as significant.
Although the possible interference of test stimuli
we found that ∆7 was significantly different
between tetani on different theta background
phases. This may indicate that θ-BS modulates the
excitability of the network, which was also
concluded in [9,17,18]. Making it more likely that
LTP occurs during stimulation at the peak of θ-BS
and making LTD more likely to occur at the trough
of θ-BS. Other research also showed that the effect
of tetanic stimulation depends on additionally
applied stimulation; Chiappalone et al. found in
[12] that applying tetanus (20Hz) simultaneously
with a low frequency (i.e. 1Hz) train of pulses
resulted in an increase of average PSTH area
(~40%). Statistical analysis showed this protocol
(AT-IN) never resulted in a decreased evoked
response and mostly resulted in an increased
evoked response (60,68%). They also found that
applying a train of pulses between 2 tetani resulted
in varying alterations of PSTH area depending on
the stimulation site used. This further proves that
the effects of tetanic stimulation depend on other
stimulation that is applied.
In summary, we showed that tetanic stimulation
does affect functional connectivity. We showed
that this effect wears off after repeated
stimulation, and that prolonged tetani did not have
a larger effect on connectivity. We also showed
tetanic stimulation induces both strengthening and
weakening of connections. These observations
support the hypothesis that tetani may induce LTP
or LTD within very short periods of stimulation. In
all p-TS experiments the number of strengthened
connections was in equilibrium with the number of
weakened connections. Application of theta
background stimulation changed this balance.
Tetani locked at the phase of maximum
background stimulation tended to increase the
average strength of connections, whereas the
average strength decreased when tetani were
applied at the phase of minimum background
stimulation.
Acknowledgement I would like to thank dr. ir. Jan Stegenga, for
sharing his measurement data and Matlab scripts,
which made this research project possible. I would
especially like to thank dr. ir. Joost Le Feber for
sharing his CFP analysis and mostly for his guidance
throughout the entire research project.
References
[1] Y. Dan and M.-ming Poo, “Spike Timing-
Dependent Plasticity : From Synapse to
Perception,” Physiological Reviews, 2006,
pp. 1033-1048.
[2] T.V.P. Bliss and T. Lømo, “Long-lasting
potentiation of synaptic transmission in the
dentate area of the anaesthetized rabbit
following stimulation of the perforant
path,” The Journal of physiology, vol. 232,
1973, p. 331.
[3] R. Malinow, H. Schulman, and R.W. Tsien,
“Inhibition of postsynaptic PKC or CaMKII
blocks induction but not expression of
LTP.,” Science (New York, N.Y.), vol. 245,
Aug. 1989, pp. 862-6.
[4] Y. Jimbo, H.P. Robinson, and a Kawana,
“Strengthening of synchronized activity by
tetanic stimulation in cortical cultures:
application of planar electrode arrays.,”
IEEE transactions on bio-medical
engineering, vol. 45, Nov. 1998, pp. 1297-
304.
[5] Y. Jimbo, “Simultaneous Induction of
Pathway-Specific Potentiation and
Depression in Networks of Cortical
Neurons,” Biophysical Journal, vol. 76, Feb.
1999, pp. 670-678.
[6] D. a Wagenaar, J. Pine, and S.M. Potter,
“Searching for plasticity in dissociated
cortical cultures on multi-electrode
arrays.,” Journal of negative results in
biomedicine, vol. 5, Jan. 2006, p. 16.
[7] G.W. Gross, B.K. Rhoades, D.L. Reust, and
F.U. Schwalm, “Stimulation of monolayer
networks in culture through thin-film
indium-tin oxide recording electrodes.,”
Journal of neuroscience methods, vol. 50,
Nov. 1993, pp. 131-43.
[8] G.W. Gross, B.K. Rhoades, H.M. Azzazy, and
M.C. Wu, “The use of neuronal networks
on multielectrode arrays as biosensors.,”
Biosensors & bioelectronics, vol. 10, Jan.
1995, pp. 553-67.
The effect of Tetanic stimulation on functional connectivity
19
[9] J. Stegenga, J. le Feber, E. Marani, and
W.L.C. Rutten, “Phase-dependent effects of
stimuli locked to oscillatory activity in
cultured cortical networks.,” Biophysical
journal, vol. 98, Jun. 2010, pp. 2452-8.
[10] D. a Wagenaar, R. Madhavan, J. Pine, and
S.M. Potter, “Controlling bursting in
cortical cultures with closed-loop multi-
electrode stimulation.,” The Journal of
neuroscience : the official journal of the
Society for Neuroscience, vol. 25, Jan. 2005,
pp. 680-8.
[11] J. le Feber, W.L.C. Rutten, J. Stegenga, P.S.
Wolters, G.J. a Ramakers, and J. van Pelt,
“Conditional firing probabilities in cultured
neuronal networks: a stable underlying
structure in widely varying spontaneous
activity patterns.,” Journal of neural
engineering, vol. 4, Jun. 2007, pp. 54-67.
[12] M. Chiappalone, P. Massobrio, and S.
Martinoia, “Network plasticity in cortical
assemblies.,” The European journal of
neuroscience, vol. 28, Jul. 2008, pp. 221-37.
[13] J. le Feber, J. Stegenga, and W.L.C. Rutten,
“The effect of slow electrical stimuli to
achieve learning in cultured networks of
rat cortical neurons.,” PloS one, vol. 5, Jan.
2010, p. e8871.
[14] G. Barrionuevo and T.H. Brown,
“Associative long-term potentiation in
hippocampal slices,” Proceedings of the
National Academy of Sciences of the United
States of America, vol. 80, 1983, p. 7347.
[15] Y. Ouyang, D. Kantor, K.M. Harris, E.M.
Schuman, and M.B. Kennedy, “Visualization
of the distribution of autophosphorylated
calcium/calmodulin-dependent protein
kinase II after tetanic stimulation in the
CA1 area of the hippocampus.,” The
Journal of neuroscience : the official journal
of the Society for Neuroscience, vol. 17, Jul.
1997, pp. 5416-27.
[16] M.E. Ruaro, P. Bonifazi, and V. Torre,
“Toward the neurocomputer: image
processing and pattern recognition with
neuronal cultures.,” IEEE transactions on
bio-medical engineering, vol. 52, Mar.
2005, pp. 371-83.
[17] P.T. Huerta, “Low-frequency stimulation at
the troughs of theta-oscillation induces
long-term depression of previously
potentiated CA1 synapses,” Journal of
neurophysiology, vol. 75, 1996, p. 877.
[18] J.M. Hyman, B.P. Wyble, V. Goyal, C. a
Rossi, and M.E. Hasselmo, “Stimulation in
hippocampal region CA1 in behaving rats
yields long-term potentiation when
delivered to the peak of theta and long-
term depression when delivered to the
trough.,” The Journal of neuroscience : the
official journal of the Society for
Neuroscience, vol. 23, Dec. 2003, pp.
11725-31.