the effect of the financial crisis on older households in
TRANSCRIPT

The effect of the financial crisis on older households in England James Banks, Rowena Crawford, Thomas F Crossley and Carl Emmerson
Funding from the Economic and Social Research Council (ESRC grant numbers RES 000-224032 and RES 5444-28-5001) and the IFS Retirement Savings Consortium
15th Annual DNB Research Conference, 25-26th October 2012

Introduction
• Recent financial crisis associated with large asset prices falls
• In the UK in 2008–09
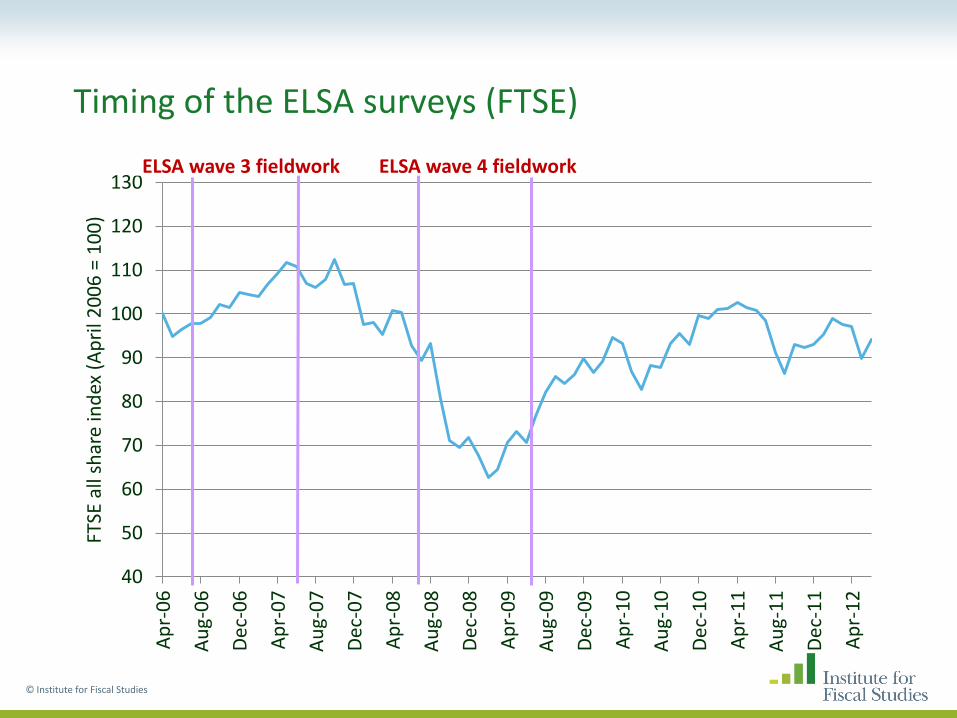
– FTSE All-Share Index fell by one-third
– Nationwide House Price Index fell by one-fifth
• Will have caused substantial, largely unanticipated, drops in household wealth
• Aims of this paper:
– Document the scale and distribution of falls in wealth
– Investigate the impact of wealth shocks on consumption and expectations
© Institute for Fiscal Studies

Data: English Longitudinal Study of Ageing (ELSA)
• Representative of household population aged 50 and over in England
• Biennial panel: [2002/03], [2004/05], [2006/07], [2008/09], [2010/11]
• Information on financial wealth, debt and housing in every wave
– Detailed information on the amount held in different asset types
• Full pension details in every wave
– Sufficient to reasonably estimate pension income/wealth
• Information on some components of expenditure in every wave
– Food consumed in the home, food consumed out of the home, clothes, household fuel
• Quantitative measures of expectations of the future
© Institute for Fiscal Studies
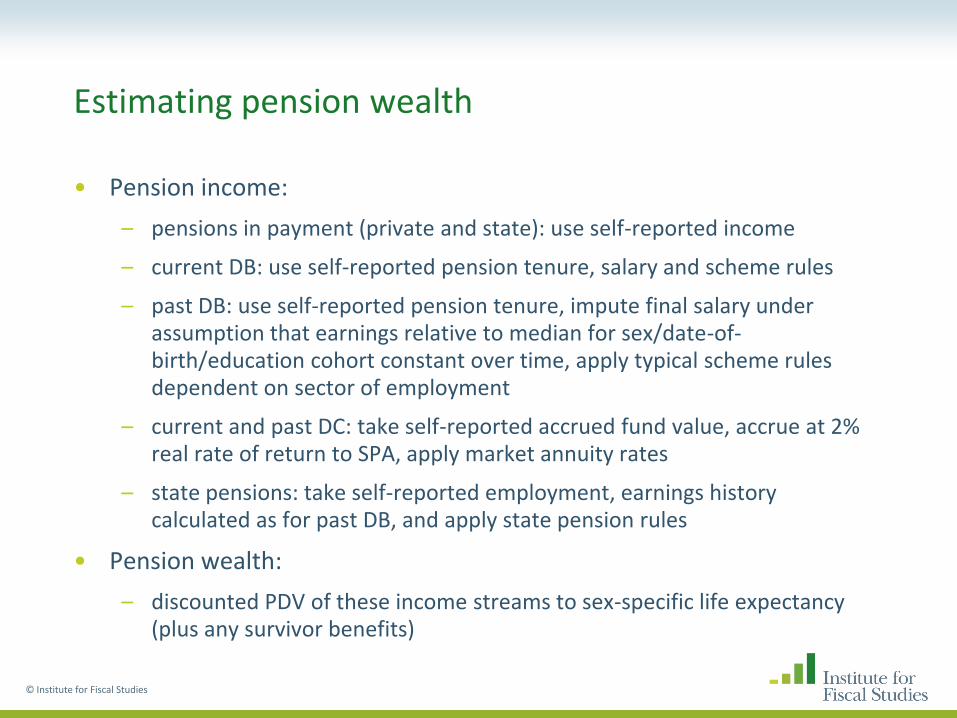
Estimating pension wealth
• Pension income:
– pensions in payment (private and state): use self-reported income
– current DB: use self-reported pension tenure, salary and scheme rules
– past DB: use self-reported pension tenure, impute final salary under assumption that earnings relative to median for sex/date-of-birth/education cohort constant over time, apply typical scheme rules dependent on sector of employment
– current and past DC: take self-reported accrued fund value, accrue at 2% real rate of return to SPA, apply market annuity rates
– state pensions: take self-reported employment, earnings history calculated as for past DB, and apply state pension rules
• Pension wealth:
– discounted PDV of these income streams to sex-specific life expectancy (plus any survivor benefits)
© Institute for Fiscal Studies
40
50
60
70
80
90
100
110
120
130 A
pr-
06
Au
g-0
6
Dec
-06
Ap
r-0
7
Au
g-0
7
Dec
-07
Ap
r-0
8
Au
g-0
8
Dec
-08
Ap
r-0
9
Au
g-0
9
Dec
-09
Ap
r-1
0
Au
g-1
0
Dec
-10
Ap
r-1
1
Au
g-1
1
Dec
-11
Ap
r-1
2
FTSE
all
shar
e in
dex
(A
pri
l 20
06
= 1
00
) Timing of the ELSA surveys (FTSE)
© Institute for Fiscal Studies
ELSA wave 3 fieldwork ELSA wave 4 fieldwork
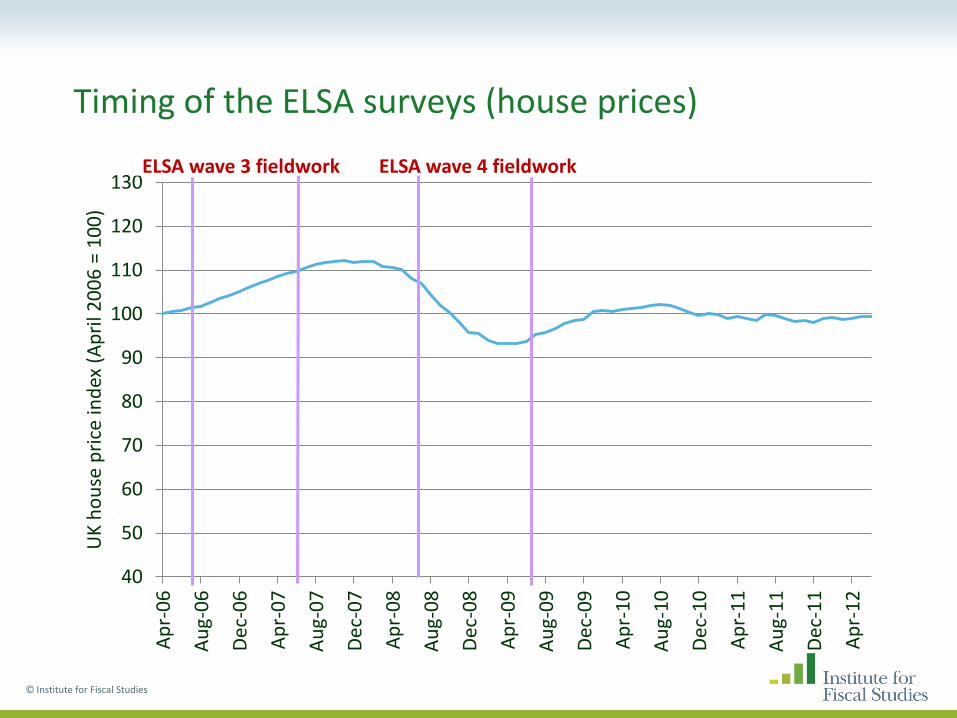
Timing of the ELSA surveys (house prices)
40
50
60
70
80
90
100
110
120
130 A
pr-
06
Au
g-0
6
Dec
-06
Ap
r-0
7
Au
g-0
7
Dec
-07
Ap
r-0
8
Au
g-0
8
Dec
-08
Ap
r-0
9
Au
g-0
9
Dec
-09
Ap
r-1
0
Au
g-1
0
Dec
-10
Ap
r-1
1
Au
g-1
1
Dec
-11
Ap
r-1
2
UK
ho
use
pri
ce in
dex
(A
pri
l 20
06
= 1
00
)
© Institute for Fiscal Studies
ELSA wave 3 fieldwork ELSA wave 4 fieldwork
Calculating predicted wealth changes
• Exposure of wealth to financial crisis measured using pre-crisis (wave 3) holdings of different types of assets
• Predicted losses (or gains) computed using pre-crisis wealth holdings and change in asset price indices between month of interview in wave 3 and wave 4
© Institute for Fiscal Studies
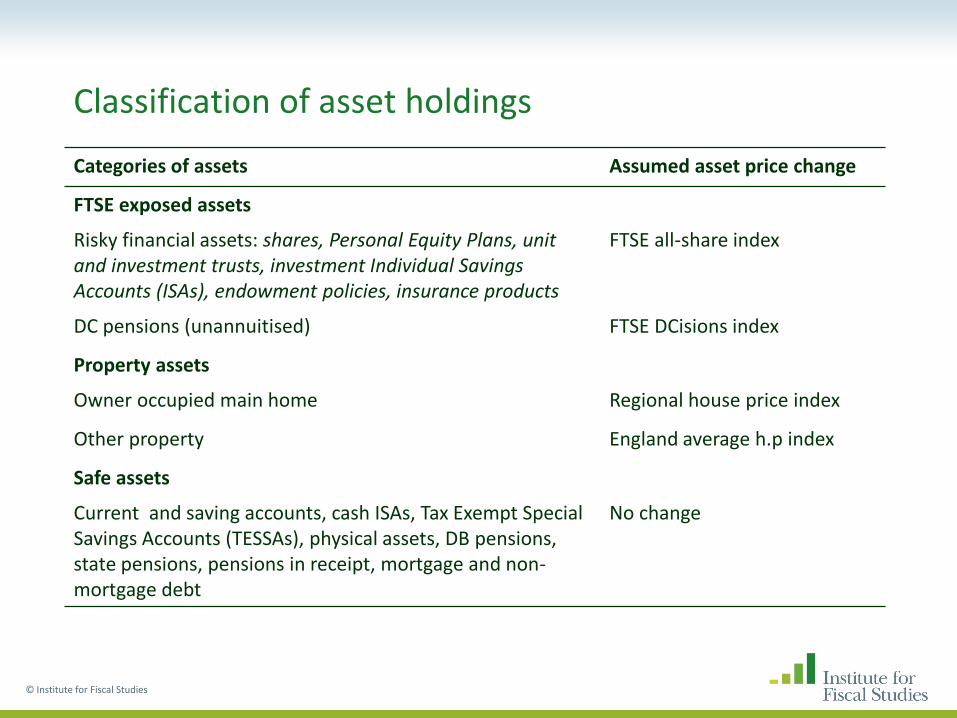
Classification of asset holdings
Categories of assets Assumed asset price change
FTSE exposed assets
Risky financial assets: shares, Personal Equity Plans, unit and investment trusts, investment Individual Savings Accounts (ISAs), endowment policies, insurance products
FTSE all-share index
DC pensions (unannuitised) FTSE DCisions index
Property assets
Owner occupied main home Regional house price index
Other property England average h.p index
Safe assets
Current and saving accounts, cash ISAs, Tax Exempt Special Savings Accounts (TESSAs), physical assets, DB pensions, state pensions, pensions in receipt, mortgage and non-mortgage debt
No change
© Institute for Fiscal Studies

Mean portfolio composition in Wave 3 (2006/07)
6.6% 3.8%
40.3%
19.5%
19.5%
10.3%
Proportion of total gross wealth held in:
Risky financial assets
DC pension funds
Housing wealth
State pension wealth
Private pension wealth
Other 'safe' wealth

Distribution of index changes ELSA wave 3 to wave 4 (2006–07 to 2008–09)
0
0.01
0.02
0.03
0.04
0.05
0.06
0.07
0.08
-50 -40 -30 -20 -10 0 10 20 30
Den
sity
% change in index value between wave 3 and wave 4 interview
FTSE all-share index
Regional house price index
FTSE DCisions index

Distribution of simulated wealth changes ELSA wave 3 to wave 4 (2006–07 to 2008–09)
0%
10%
20%
30%
40%
50%
60%
70%
80%
90%
100%
-20% -15% -10% -5% 0% 5% 10%
Cu
mu
lati
ve p
erce
nta
ge o
f in
div
idu
als
Simulated % change in total gross household wealth, between wave 3 and wave 4 interview
FTSE exposed wealth
Property wealth
Total wealth
© Institute for Fiscal Studies

Predicted wealth changes
• Median simulated wealth change: loss of 1% of gross wealth
• 6% of individuals: simulated loss > 10% of gross wealth
• 29% of individuals: simulated increase in gross wealth
© Institute for Fiscal Studies
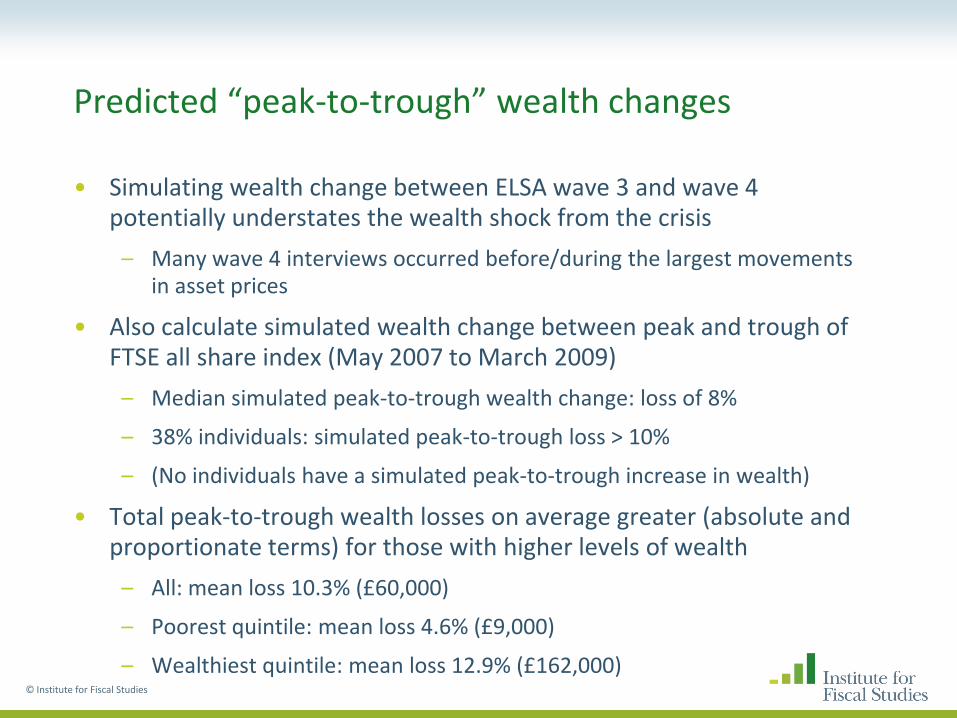
Predicted “peak-to-trough” wealth changes
• Simulating wealth change between ELSA wave 3 and wave 4 potentially understates the wealth shock from the crisis
– Many wave 4 interviews occurred before/during the largest movements in asset prices
• Also calculate simulated wealth change between peak and trough of FTSE all share index (May 2007 to March 2009)
– Median simulated peak-to-trough wealth change: loss of 8%
– 38% individuals: simulated peak-to-trough loss > 10%
– (No individuals have a simulated peak-to-trough increase in wealth)
• Total peak-to-trough wealth losses on average greater (absolute and proportionate terms) for those with higher levels of wealth
– All: mean loss 10.3% (£60,000)
– Poorest quintile: mean loss 4.6% (£9,000)
– Wealthiest quintile: mean loss 12.9% (£162,000) © Institute for Fiscal Studies

Reported wealth changes
• Reported wealth change
= reported post-crisis (wave 4) wealth – pre-crisis (wave 3) wealth
• Reported wealth changes will differ from simulated wealth changes
– Anticipated active (dis-) saving
– Behavioural responses to financial crisis
– Measurement error
• Return heterogeneity
• Imputation and response error
© Institute for Fiscal Studies

Comparing reported and simulated changes: total wealth ELSA wave 3 to wave 4 (2006–07 to 2008–09)
© Institute for Fiscal Studies

Inter-temporal budget constraint
Wealth + discounted future earnings
=
Current consumption + discounted future consumption + discounted bequest
Thus, possible responses to wealth shocks:
• Consume less now
• Consume less in the future
• Leave a smaller bequest
• Work more
© Institute for Fiscal Studies

Expenditure
• We have data on 4 areas of household spending:
– amount spent on food consumed in the home
– amount spent on food consumed out of the home
– amount spent on fuel in the home
– amount spent on clothes
• We also have total spending on these 4 areas
– accounts for about 30% of non-housing spending for over 50 households pre-crisis
© Institute for Fiscal Studies

Empirical specification (expenditure)
• Basic specification:
∆Expenditurew3w4 = α + β∆Wealthw3w4 + γ%∆Pricew3w4 + δZ + ε
∆Expenditurew3w4 is change in real expenditure between 2006–07 and 2008–09
∆Wealthw3w4 is change in real wealth between 2006–07 and 2008–09
%∆Pricew3w4 is percent change in specific price index between 2006–07 and 2008–09
Z is individual and household characteristics: age (10 year bands), education, change in number of people in the household, change in number of earners in the household
• ∆Wealthw3w4 is potentially endogeneous
– Instrument for the actual change in wealth using predicted wealth changes
– (use wave 2 asset holdings to help deal with bias from measurement error)
• Also test for
– separate effect of changes in different components of wealth
– different effects by whether below or above age 70
© Institute for Fiscal Studies
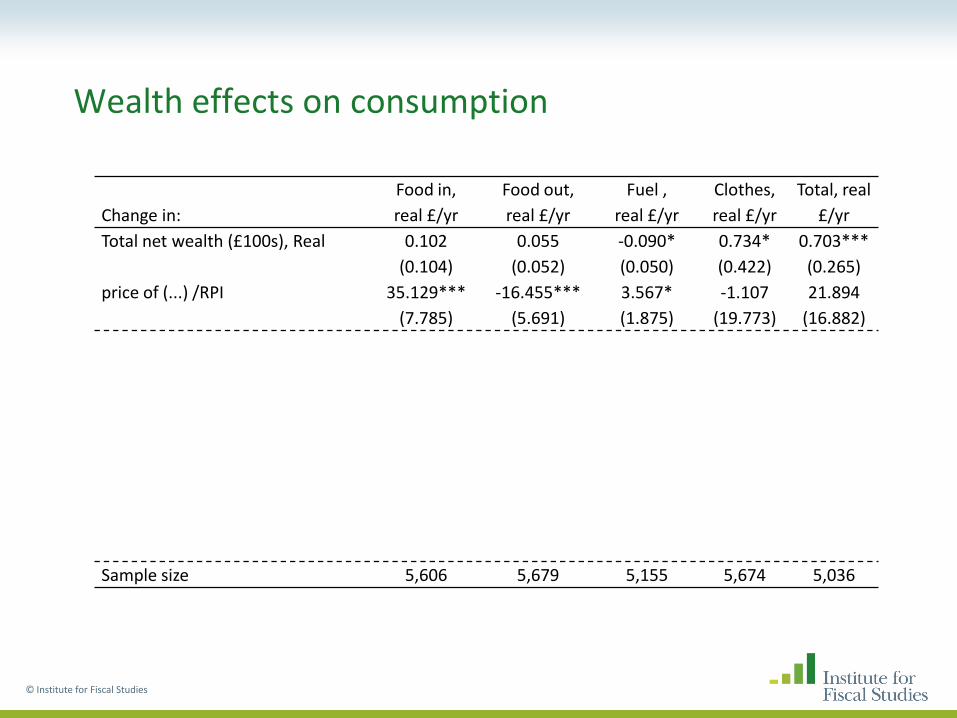
Wealth effects on consumption
© Institute for Fiscal Studies
Change in:
Food in,
real £/yr
Food out,
real £/yr
Fuel ,
real £/yr
Clothes,
real £/yr
Total, real
£/yr
Total net wealth (£100s), Real 0.102 0.055 -0.090* 0.734* 0.703***
(0.104) (0.052) (0.050) (0.422) (0.265)
price of (...) /RPI 35.129*** -16.455*** 3.567* -1.107 21.894
(7.785) (5.691) (1.875) (19.773) (16.882)
Net housing wealth (£100s), Real 0.029 0.001 -0.025 0.218 0.125
(0.049) (0.021) (0.023) (0.206) (0.123)
Pension wealth (£100s), Real 0.314 0.153 -0.082 0.536 1.883
(0.304) (0.157) (0.145) (0.626) (1.149)
Net non-pension non-housing
wealth (£100s) , Real
0.031 -0.013 -0.089 1.174 0.504
(0.216) (0.095) (0.092) (1.075) (0.622)
price of (...) /RPI 32.011*** -19.245*** 4.047** -4.532 -0.329
(9.024) (6.845) (1.858) (21.885) (23.473)
Sample size 5,606 5,679 5,155 5,674 5,036

Empirical specification (expectations)
• Consider 2 questions:
– “[Including property and other valuables that you might own] what are the chances that you will leave an inheritance totalling £150,000 or more?”
• 2006/7 median expectation = 80%
– “What are the chances that at some point in the future you will not have enough financial resources to meet your needs?”
• 2006/7 median expectation = 30%
• Use broadly same specification as for consumption
∆Expectationw3w4 = α + β∆Wealthw3w4 + ε
∆Expectationw3w4 is change in reported % chance between 2006–07 and 2008–09
∆Wealthw3w4 is change in [nominal/real] wealth between 2006–07 and 2008–09
(Test sensitivity to inclusion of Z vector – makes little difference)
© Institute for Fiscal Studies
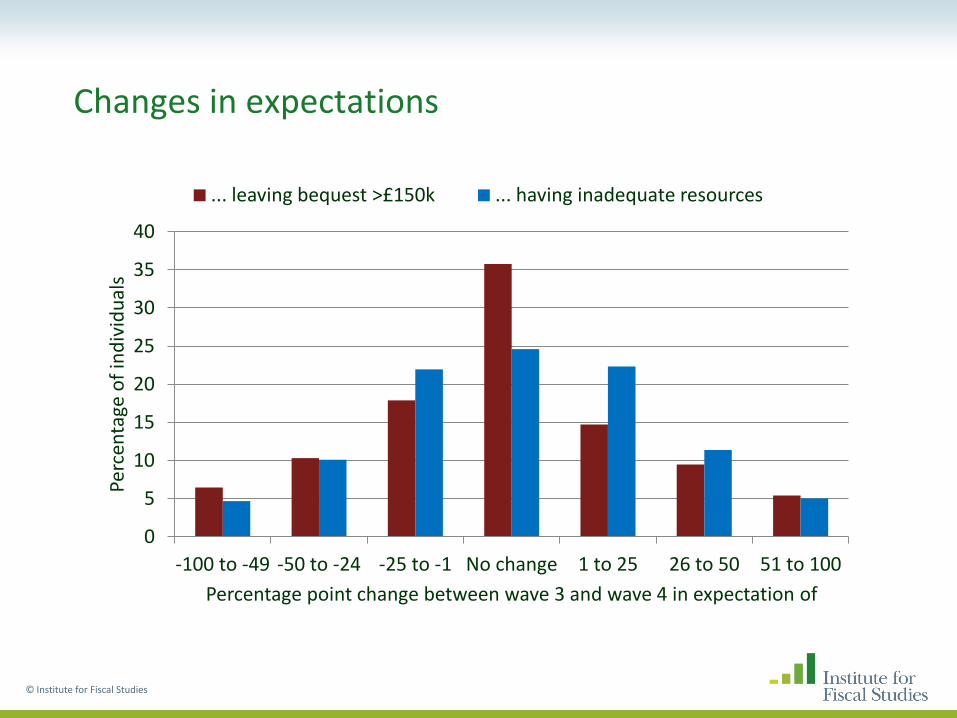
Changes in expectations
© Institute for Fiscal Studies
0
5
10
15
20
25
30
35
40
-100 to -49 -50 to -24 -25 to -1 No change 1 to 25 26 to 50 51 to 100
Perc
enta
ge o
f in
div
idu
als
Percentage point change between wave 3 and wave 4 in expectation of
... leaving bequest >£150k ... having inadequate resources

Wealth effects on expectations - bequests
Nominal change in (£10,000s): All Aged 50-69 Aged 70+
Total net wealth 0.439** 0.296 0.780*
(0.205) (0.192) (0.456)
Net housing wealth 0.226*** 0.143* 0.387**
(0.075) (0.078) (0.158)
Pension wealth 0.931 0.754* -0.757
(0.501) (0.455) (1.480)
Net non-pension non-housing wealth 0.109 -0.109 0.352
(0.245) (0.307) (0.424)
Sample size 4,511 2,982 1,529
© Institute for Fiscal Studies
• Effect of changes in wealth on the expected chance of leaving a bequest of greater than £150,000

Wealth effects on expectations – future inadequacy
© Institute for Fiscal Studies
Real change in (£10,000s): All Aged 50-69 Aged 70+
Total net wealth -0.143 -0.046 -0.324
(0.152) (0.142) (0.466)
Net housing wealth -0.016 0.047 -0.642
(0.067) (0.093) (1.949)
Pension wealth -0.465 -0.514 -14.533
(0.463) (0.402) (59.09)
Net non-pension non-housing wealth 0.177 0.417 -1.502
(0.270) (0.462) (5.18)
Sample 5,569 3,515 2,054
• Effect of changes in wealth on the expected chance of having inadequate resources at some point in the future
Conclusions and future directions
Wealth losses:
• Individuals are simulated to have experienced significant wealth shocks due to the financial crisis and resulting asset price changes
• Wealth losses greater among those with higher wealth
– Typically have greater proportion of wealth held in exposed assets
Responses:
• Results suggest a marginal propensity to consume out of wealth shocks towards the low end of the range suggested by theory and past literature
• Small effect of wealth shocks on probability of leaving a moderately large bequest - arising largely from housing wealth shocks
• No evidence of an effect on perceived ‘adequacy’ of future resources
© Institute for Fiscal Studies
Conclusions and future directions
Potential explanations for small effects:
• Marginal propensity to consume out of wealth shocks greater for other luxuries?
• Cut off for expected bequests of £150,000 not that relevant?
– mean 2006/07 net housing wealth ~ £200,000. Mean peak-to-trough loss of housing wealth £33,000 and w3 to w4 losses smaller.
• Individuals believing the asset price shocks are not permanent (Christelis et al., 2011)?
Next work on:
• Health and wellbeing effects
• Incorporating wave 5 to track through on-going economic slowdown
© Institute for Fiscal Studies
The effect of the financial crisis on older households in England James Banks, Rowena Crawford, Thomas F Crossley and Carl Emmerson
Funding from the Economic and Social Research Council (ESRC grant numbers RES 000-224032 and RES 5444-28-5001) and the IFS Retirement Savings Consortium
15th Annual DNB Research Conference, 25-26th October 2012