the effect of tio2 surface on the electron injection
TRANSCRIPT

This journal is© the Owner Societies 2015 Phys. Chem. Chem. Phys.
Cite this:DOI: 10.1039/c4cp04976d
The effect of TiO2 surface on the electroninjection efficiency in PbS quantum dot solarcells: a first-principles study†
Jon M. Azpiroz,*ab Jesus M. Ugalde,a Lioz Etgar,c Ivan Infantead andFilippo De Angelisb
We present a density functional theory (DFT) study aimed at understanding the injection and recombination
processes that occur at the interface between PbS QDs and TiO2 oxide nanoparticles with different
morphologies. The calculated injection rates fall in the picosecond timescale in good agreement with the
experiments. In addition, our simulations show that the (101) facet of TiO2 more favourably accommodates
the QD, resulting in stronger electronic couplings and faster electron injections than the (001) surfaces.
Despite this, the (101) slab is also more prone to faster electron recombination with the valence band of
the QD, which can lead to overall lower injection efficiencies than the (001) surface.
Introduction
In the past few decades, solar energy has emerged as an environ-mentally clean, efficient, cost-effective, renewable, and sustainablealternative to solid fuels. In this context, dye sensitized solar cells(DSSC) are embodying a significant leap forward to efficient lightconversion at low cost.1 DSSCs consist of a mesoporous wide gapoxide layer, usually TiO2 or ZnO, grafted with a monolayer ofsensitizing dye, which absorbs the solar radiation and injects thephotogenerated electrons into the manifold of unoccupied states(conduction band or CB) of the oxide.2 These electrons are thencollected on an external load, while holes on the dyes arescavenged by an electrolyte/polymer and transported to thecathode where they close the circuit.
More recently, semiconductor quantum dots (QDs) have gaineda lot of attention as efficient light harvesters due to their attractiveproperties.3,4 QDs present high extinction coefficients and largedipole moments, and their absorption spectrum can be tuned bychanging their size and morphology. In addition, QDs provide the
opportunity to increase solar cell photocurrent by either extract-ing hot carriers or taking advantage of the multiple excitongeneration (MEG) phenomenon, which can potentially overcomethe Shockley–Queisser limit of 33% power conversion efficiency(PCE).5 Along with these outstanding optoelectronic properties,QD nanocrystals are characterized by versatile and low-costsynthetic routes, and unmatched photostability that make themamenable for photovoltaic applications.
PbS QD nanocrystals, which belong to the IV–VI group, areamong the most popular semiconductor QDs. They present arelatively large Bohr radius (18 nm) that allows tuning of theirband-gap in the 0.5 to 5.5 eV range (i.e. in the NIR and visiblerange), covering most of the solar emission spectrum.6–11 PbSnanocrystals also present a large absorption cross section(B10�15 cm�2), long excitonic lifetime (B200–800 ns), exceptionallyhigh quantum efficiency (80%), and MEG.12–14
In view of their technological potential, several PbS quantumdot solar cell (QDSC) architectures have been engineered, rangingfrom sensitized solar cells that have reached a PCE of 5.6%,15 tothin films assemblies of QDs, which attained a certified recordof 8.5%.16 Despite these promising results, PbS QDSCs, how-ever, have performed quite disappointingly if we compare themto their dye sensitized counterparts holding a record PCE of12.3%17 and the more recent perovskite solar cells with a PCE of19.3%.18 The reasons why QDSCs still present low efficiencieshave been thoroughly investigated and following facts could beinferred: (a) QDs display localized surface states (trap states)that block the flow of charge carriers into the circuit;19,20 (b) theinterfacial electron injection from the QD to the metal oxidecompetes with several deleterious fast recombination pathways;21–24
(c) the polysulphide electrolyte couple employed in sensitized
a Kimika Fakultatea, Euskal Herriko Unibertsitatea (UPV/EHU), and Donostia
International Physics Center (DIPC), P. K. 1072, 20080 Donostia, Euskadi, Spain.
E-mail: [email protected] Computational Laboratory for Hybrid/Organic Photovoltaics (CLHYO),
Istituto CNR di Scienze e Tecnologie Molecolari (ISTM-CNR), Via Elce di Sotto 8,
06123, Perugia, Italyc Institute of Chemistry, The Hebrew University of Jerusalem,
Casali Center for Applied Chemistry, 91904, Jerusalem, Israeld Department of Theoretical Chemistry, Faculty of Sciences, Vrije Universiteit
Amsterdam, De Bolelaan 1081, 1083 HV, Amsterdam, The Netherlands
† Electronic supplementary information (ESI) available. See DOI: 10.1039/c4cp04976d
Received 29th October 2014,Accepted 13th January 2015
DOI: 10.1039/c4cp04976d
www.rsc.org/pccp
PCCP
PAPER
Publ
ishe
d on
13
Janu
ary
2015
. Dow
nloa
ded
by H
ebre
w U
nive
rsity
of
Jeru
sale
m o
n 08
/02/
2015
14:
20:5
5.
View Article OnlineView Journal

Phys. Chem. Chem. Phys. This journal is© the Owner Societies 2015
QDSCs present a high redox potential that lower the open-circuit voltage and therefore the overall PCE.25
In a recent work by Etgar et al. on PbS–TiO2 heterojunctionsolar cells, the surface of the oxide has been shown to play a crucialrole on the performance of the device.13 In particular, anatase TiO2
nanosheets exposing a majority of (001) surfaces have been foundto generate a higher PCE when compared to standard TiO2
nanoparticles exposing (101) facets. By attaching PbS QDs of thesame size (3.6 nm) on these TiO2 surfaces with organic linkers, thecorresponding solar cells present roughly the same open-circuitvoltage, but a significantly different photocurrent: 20.5 mA cm�2
for the (001) facets and 16.3 mA cm�2 for the (101) facets. Theauthors briefly suggested that the better photovoltaic performanceof the (001) nanosheets might be related to a better adsorption ofthe PbS QDs on the (001) facets.
Computational modeling provides the opportunity to shedlight on these aspects of QDSCs, which are hardly accessibleexperimentally. However, because modeling QDSCs requiresextended systems and poses important challenges, theoreticalstudies in this type of systems are still scarce.26,27
In the present work, we report on the atomistic simulations ofPbS QD sensitized TiO2 solar cells, with the QDs directly adsorbedon the oxide surface.25 We anticipate that these simulations donot attempt to reproduce exactly Etgar’s experiments due to somelimitations of our theoretical model. Colloidal QDs are indeedtypically metal-rich and the off-stoichiometry is compensated byanionic ligands that dynamically adhere to the QD surface andprovide charge neutrality to the entire system. However, thesimulation of the ligand-capped PbS QDs, as the ones employedexperimentally, represent a serious computational challenge, andonly few works have tried to simulate non-stoichiometric systems.A further complication is to model the attachment of metal-richQDs on TiO2 with organic linkers. As a consequence of these facts,we decided to model the direct absorption of stoichiometric QDs(without ligands) on the oxide surfaces, paying particular atten-tion to the role of the TiO2 surface on the electron injection/recombination processes. The model presented in this studycan be, however, considered a good approximation to QDs synthe-sized on metal oxide substrates with in situ approaches, such as inSILAR or CBD synthesis, because stoichiometric clusters representa fair approximation to what is grown on the substrate.
In particular, we demonstrate that the (001) oxide surface bindsless strongly with the PbS QD than the (101) facet. In the latter case,the electron injection from the photoexcited QD is faster than intothe (001) facet; however, a very fast electron recombination couldreduce the overall injection efficiency compared to the (001) surface.Thus, a fast electron injection into the oxide substrate does notalways correspond to an efficient electron injection because otherrecombination pathways should also be taken into account.
MethodologyQD models
Stoichiometric models have been cleaved from the underlyingrock-salt structure of bulk PbS. The origin of each model has
been set at the center of a (PbS)4 unit and spherical clusters havebeen sliced out, similar to those obtained by in situ approaches.The newly generated models expose non-stoichiometric (111)and stoichiometric (100) facets. Fig. 1 displays the optimizedstructures of the nanoclusters studied. Some of the models havealready been reported in the literature for PbS and PbSe.26,28–33
TiO2 models
TiO2 slab exposing the (101) facet has been built from bulk TiO2.It is stoichiometric and composed of 82 TiO2 units; denoted as(TiO2)82 or TiO2(101) hereafter. The TiO2 slab exposing the (001)facet is non-stoichiometric and we have added 24 OH� groups tocompensate for the Ti excess of the pristine slab; denoted as(Ti143O274)(OH)24 or TiO2(001) hereafter. We opted for clustermodels for the TiO2 surfaces because they allow hybrid DFTcalculations and inclusion of solvent effects, mandatory for aproper description of the band edge states of the oxide.2 Due tothe limited size of the oxide slabs, border effects might playa role on the interaction energies. However, the interactinggeometries (and therefore the QD–TiO2 coupling) are less sensitiveto these effects. Therefore, the alignment of the electronic levelsand the electronic coupling between the solar cell components,which are the key ingredients for the calculation of the injec-tion and recombination rates central to this work, should notbe affected.
Computational approach
All the models have been fully optimized without any symmetryconstraint with the dispersion corrected (D)34 Perdew–Burke–Ernzerhof (PBE)35 xc functional within the Kohn–Sham frame-work of density functional theory (KS-DFT), as implemented inthe ADF 2012.01 software package.36 For simplicity, geometryoptimizations have been carried out in vacuo because implicitsolvent is shown to play a minor role on the structure of thesystems studied (see Fig. S1–S3, ESI†). PbS QDs were relaxeduntil the maximum norm of the Cartesian gradients was smallerthan 1 � 10�3 Hartree Å�1. For the QD@TiO2 nanocomposites,
Fig. 1 Optimized geometries of PbS QDs (top) and TiO2 slab (bottom) modelsused in this work. Binding energies (red) and size (black) are expressedin kcal mol�1 and nm, respectively. Brown = Pb, yellow = S, pink = Ti, andred = O atoms.
Paper PCCP
Publ
ishe
d on
13
Janu
ary
2015
. Dow
nloa
ded
by H
ebre
w U
nive
rsity
of
Jeru
sale
m o
n 08
/02/
2015
14:
20:5
5.
View Article Online

This journal is© the Owner Societies 2015 Phys. Chem. Chem. Phys.
a looser convergence criterion of 5 � 10�3 Hartree Å�1 has beenchosen. To take account for relativistic effects, we employed thezero-order regular approximation (ZORA).37 The choice of thePBE functional to optimize geometries has been followed becauseit efficiently reproduces the geometry of semiconductor nano-structures at a fraction of the computational cost required by thehybrid functionals.38–40
The clusters studied in this work comprise up to 600 atoms;therefore, for some elements the size of the basis-set has beenreduced. A double-zeta basis-set (DZ) of Slater-type orbitals(STO) have been added for Pb, S, O, and H atoms, while asingle-zeta set (SZ) has been chosen for Ti. In addition, innerlying atomic orbitals (core) have been frozen for all atoms. Forsome of the PbS models we validated the choice of this basis-setby showing that it fairly reproduces the results obtained withthe larger TZP basis-set (see Fig. S4 and S5 in ESI†). We indeednoticed that for the smallest (PbS)4 cluster, increasing thebasis-set size from DZ to TZP provoked a shortening of thePb–S bond distance by about 0.1 Å, while for the larger clusters,the Pb–S bond distance did not augment significantly.
Despite being useful for geometry optimizations and energetics,the PBE, and more in general the GGA functionals, severelyunderestimate the band-gap of semiconductor nanostructures.41
Therefore, we decided to use the B3LYP42 functional in conjunc-tion with the LANL2DZ (Pb and S atoms) and 3-21G* (Ti, O, and Hatoms) basis sets, to perform ground and excited state (TD)DFTcalculations on the PBE optimized structures. The choice of thisfunctional/basis-set combination has been followed because itreproduces correctly the CB offsets of both TiO2 and PbS clusters.These calculations have been carried with the Gaussian09 pack-age.43 To properly describe the electronic structure of the systemsstudied (see Fig. S2, S3 and S6, ESI†), solvent effects have beenincluded using the conductor-like polarizable continuum model(CPCM) with the water dielectric constants.44–46
Radial distribution functions have been calculated using thevirtual molecular dynamics (VMD) software.47 TheoreticalUV-Vis curves were obtained using the GAUSSSUM 2.2 pro-gram.48 Charge transfer integrals were computed with a locallydeveloped program.
Results and discussion1. Bare PbS QDs
Energetics and structure. The binding energy Eb(n)49 of eachQD is given as follows:
Eb(n) = nE(1) � E(n) (1)
where E(n) is the total energy of the composed structure madeof n formula units and E(1) is the energy of the smallest unit,i.e. (PbS)1. From Fig. 1, all the QD studied here are stable, asshown by the positive binding energies (in red). Moreover, thestability increases with the size of the QD. Our results are inaccordance with previous works on II–VI semiconductor nano-structures and predict the crystal growth to be thermodynamicallyfavorable.49 This process is driven by the minimization of the
surface-to-volume ratio with the increasing size of the nano-structure. In this sense, surface ligands, solvent molecules, andthe environment play a pivotal role in lowering the surfaceenergy and stabilizing the nanostructure.40,49–51
As one may notice from Fig. 1, the optimized PbS QDs pre-serve the bulk-like structure. However, our models experience asignificant distortion upon relaxation (Fig. S3, ESI†). In contrastto II–VI cluster models, where the atomic reconstruction ismainly concentrated on the surface,39,52 the optimization alsoaffects the core.
To better characterize the optimized models, the Pb–S,Pb–Pb and S–S radial distribution functions (RDF) have beencalculated for each QD (see Fig. S7, ESI†). The relaxed modelsdisplay a broad distribution of Pb–S distances in the range of2.75–3.75 Å. However, two features are recognizable: (a) anarrow distribution of Pb–S distances corresponding to shortenedPb–S bond lengths, and (b) a wider profile at elongated Pb–S bonddistances. Regardless of a particular atomic rearrangement, Pb–Sbonds shorten when moving away from the center of the QD (seeFig. S9, ESI†). A lower coordination number on the surface atomsappears to be the driving force for the shrinkage of the bonds inthe outer region.39,52 Concerning Pb–Pb and S–S RDFs, a widedistribution of distances has been found for each model, and thetrend is again bimodal. Interestingly, the nearest S–S pairs arecloser than the corresponding Pb–Pb pairs. This finding is incontrast with previous works on II–VI QDs, where metal atomsform short M–M contacts.30,39,40 The Pauli repulsion betweenthe 6s2 lone pair in adjacent metal atoms appears to prevent theformation of short Pb–Pb distances.53
Electronic structure. Fig. 2 shows the energy of the band edgestates for the bare PbS QDs, along with their correspondingdensity of states (DOS). All the QDs studied display HOMO–LUMO gaps with no mid-gap states, and both HOMO and LUMOare delocalized over each system. QD1 shows the largest band-gap (4.02 eV), which shrinks monotonically with the size of theQD model (2.27 eV in QD5) mainly due to the downward shift ofthe CB states.
Moving from QD1 to QD5, the DOS becomes denser, as it isevident from the increased curvature at the top of the valenceband (VB) and also in the CB. Overall, PbS QDs display a higherdensity of unoccupied states as compared to II–VI QDs, wherethe top of the VB is much denser than the bottom of theCB.39,50,52 As known from the literature and evident here, PbSpresent a more symmetric DOS, although far from being‘‘mirror-like’’, with a VB denser than the CB, in agreement withthe recent calculations on PbSe QDs.32
To get a deeper insight into the electronic structure of PbSQDs, we focused on the QD5 model (B1.7 nm), which closelyresembles experimental PbS QDs. As expected, the VB edgespreads ca. 4 eV below the HOMO and mainly consists of S 3porbitals, with a sizeable contribution of Pb 6s and 6p orbitals(Fig. 3a). The CB edge is comprised primarily of Pb 6p states.Localized surface states could act as trap states for the photo-generated electrons and hinder the electron injection to theTiO2. To unveil the spatial localization of the band edge states,we analyzed the composition of the frontier molecular orbitals.
PCCP Paper
Publ
ishe
d on
13
Janu
ary
2015
. Dow
nloa
ded
by H
ebre
w U
nive
rsity
of
Jeru
sale
m o
n 08
/02/
2015
14:
20:5
5.
View Article Online

Phys. Chem. Chem. Phys. This journal is© the Owner Societies 2015
We found that each atom contributes not more than 7%.Interestingly, as one may notice from Fig. 3b, the high-lyingoccupied orbitals are mostly spread over the surface, whereasthe LUMOs are primarily concentrated on the core, in agree-ment with results reported for PbSe QDs.32
Optical properties. Even if the ground state DFT molecularorbitals deliver fair energy values of the HOMO–LUMO gap, theaccurate description of the electronic excitations in these QDsis attained within the more accurate time-dependent TDDFTframework. As shown in Fig. 2, for the smallest QD1 the com-puted band-gap is 4.02 eV, which has to be compared with themore reasonable TDDFT value of 3.15 eV. This same trendholds for the rest of the models, but with a discrepancy thatlowers with the size of the model.
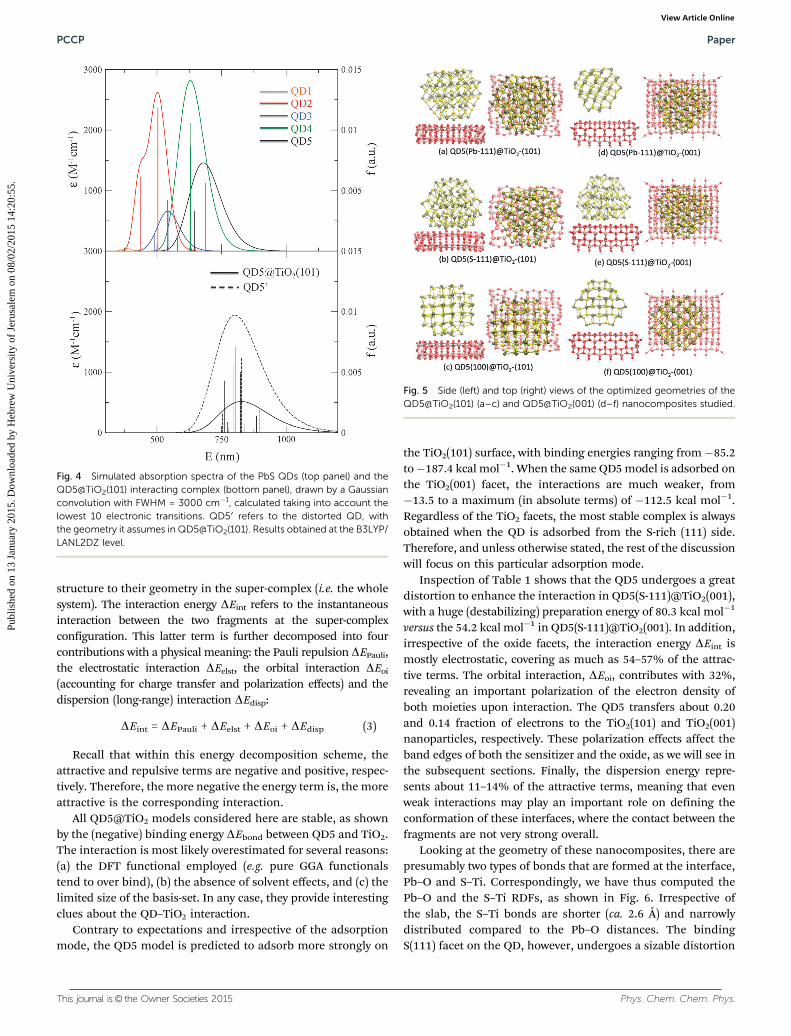
Fig. 4 displays the simulated absorption spectra of the PbSQDs, drawn by a Gaussian convolution of the 10 lowest singlet–singlet TDDFT excitations. With the increasing size of the QD, asignificant redshift of the optical spectrum is observed. How-ever, the intensity of the transitions does not appear to follow aclear trend. QD2 displays two strong absorption features, at2.46 and 2.85 eV. The absorption bands of QD3, QD4, and QD5appear to be more symmetric and locate at 2.29, 1.97, and 1.82eV, respectively. This however can be ascribed to the limitednumber of excited states that we compute.
In our previous work on II–VI QDs, the LUMO was calculated tolie considerably separated from the rest of the CB states such that thelowest electronic excitations were composed from high-lying occu-pied orbitals to the LUMO. For the PbS models studied here, where agreater number of unoccupied orbitals is available in the excitationwindow explored, we have found LUMO + n (n = 1–3) to participate(see Table S1, ESI†). Moreover, the lowest-lying TDDFT transitionsimply an important mixing of monoelectronic excitations.
2. QD@TiO2 complexes
To properly simulate PbS QDSC devices, models of realistic size haveto be chosen. For this reason, we considered the QD5@TiO2(101)
and QD5@TiO2(001) molecular systems. The QD5 moiety presentsa calculated first excited state (TDDFT) at 1.79 eV, which is in goodagreement with the first experimental band at 1.7 eV.54,55 TheTiO2(001) and TiO2(101) slabs have a calculated band-gap (TDDFT)of 3.42 and 3.15 eV, respectively, which match well with theexperimental value of 3.2–3.3 eV for standard TiO2 nano-particles.56,57 These benchmark results ensure a fair analysis ofthe interface between a PbS QD and the metal oxide substrate.
Energetics and structure. The QD5 model exposes Pb-rich(111), S-rich (111), and stoichiometric (100) facets. Consequently,three interaction modes can be envisioned where each of theQD planes faces the TiO2 slab (see Fig. 5). They are denoted asQD5(Pb-111)@TiO2, QD5(S-111)@TiO2, and QD5(100)@TiO2.In Table 1, the bond energies of the interacting compoundsare summarized. To get a deeper insight into the interaction, thebonding energy has been broken down into several terms usingthe Ziegler and Rauk decomposition scheme.58–61
In this framework, the binding energy between two moieties(in our case QD5 and TiO2) is expressed as follows:
DEbond = DEprep + DEint (2)
The preparation energy DEprep accounts for the energy requiredto deform the separated fragments from their isolated equilibrium
Fig. 2 Energy diagram of the band edge orbitals, along with their corre-sponding DOS, obtained by a Gaussian convolution of s = 0.2 eV of theindividual orbitals. DOS have been normalized to fit the scale. For each QD,the Kohn–Sham band-gap is provided (in normal style), along with the firstTDDFT electronic transition (in bold). Numbers in blue refer to the numberof nearly degenerated molecular states at the band edges. Results obtainedat the B3LYP/LANL2DZ level.
Fig. 3 DOS of the QD5 model, obtained by a Gaussian convolution ofs = 0.2 eV of the individual orbitals, along with the projection into theatomic orbitals (a) and into the core/surface atoms (b). Results obtained atthe B3LYP/LANL2DZ level.
Paper PCCP
Publ
ishe
d on
13
Janu
ary
2015
. Dow
nloa
ded
by H
ebre
w U
nive
rsity
of
Jeru
sale
m o
n 08
/02/
2015
14:
20:5
5.
View Article Online
This journal is© the Owner Societies 2015 Phys. Chem. Chem. Phys.
structure to their geometry in the super-complex (i.e. the wholesystem). The interaction energy DEint refers to the instantaneousinteraction between the two fragments at the super-complexconfiguration. This latter term is further decomposed into fourcontributions with a physical meaning: the Pauli repulsion DEPauli,the electrostatic interaction DEelst, the orbital interaction DEoi
(accounting for charge transfer and polarization effects) and thedispersion (long-range) interaction DEdisp:
DEint = DEPauli + DEelst + DEoi + DEdisp (3)
Recall that within this energy decomposition scheme, theattractive and repulsive terms are negative and positive, respec-tively. Therefore, the more negative the energy term is, the moreattractive is the corresponding interaction.
All QD5@TiO2 models considered here are stable, as shownby the (negative) binding energy DEbond between QD5 and TiO2.The interaction is most likely overestimated for several reasons:(a) the DFT functional employed (e.g. pure GGA functionalstend to over bind), (b) the absence of solvent effects, and (c) thelimited size of the basis-set. In any case, they provide interestingclues about the QD–TiO2 interaction.
Contrary to expectations and irrespective of the adsorptionmode, the QD5 model is predicted to adsorb more strongly on
the TiO2(101) surface, with binding energies ranging from �85.2to�187.4 kcal mol�1. When the same QD5 model is adsorbed onthe TiO2(001) facet, the interactions are much weaker, from�13.5 to a maximum (in absolute terms) of �112.5 kcal mol�1.Regardless of the TiO2 facets, the most stable complex is alwaysobtained when the QD is adsorbed from the S-rich (111) side.Therefore, and unless otherwise stated, the rest of the discussionwill focus on this particular adsorption mode.
Inspection of Table 1 shows that the QD5 undergoes a greatdistortion to enhance the interaction in QD5(S-111)@TiO2(001),with a huge (destabilizing) preparation energy of 80.3 kcal mol�1
versus the 54.2 kcal mol�1 in QD5(S-111)@TiO2(001). In addition,irrespective of the oxide facets, the interaction energy DEint ismostly electrostatic, covering as much as 54–57% of the attrac-tive terms. The orbital interaction, DEoi, contributes with 32%,revealing an important polarization of the electron density ofboth moieties upon interaction. The QD5 transfers about 0.20and 0.14 fraction of electrons to the TiO2(101) and TiO2(001)nanoparticles, respectively. These polarization effects affect theband edges of both the sensitizer and the oxide, as we will see inthe subsequent sections. Finally, the dispersion energy repre-sents about 11–14% of the attractive terms, meaning that evenweak interactions may play an important role on defining theconformation of these interfaces, where the contact between thefragments are not very strong overall.
Looking at the geometry of these nanocomposites, there arepresumably two types of bonds that are formed at the interface,Pb–O and S–Ti. Correspondingly, we have thus computed thePb–O and the S–Ti RDFs, as shown in Fig. 6. Irrespective ofthe slab, the S–Ti bonds are shorter (ca. 2.6 Å) and narrowlydistributed compared to the Pb–O distances. The bindingS(111) facet on the QD, however, undergoes a sizable distortion
Fig. 4 Simulated absorption spectra of the PbS QDs (top panel) and theQD5@TiO2(101) interacting complex (bottom panel), drawn by a Gaussianconvolution with FWHM = 3000 cm�1, calculated taking into account thelowest 10 electronic transitions. QD50 refers to the distorted QD, withthe geometry it assumes in QD5@TiO2(101). Results obtained at the B3LYP/LANL2DZ level.
Fig. 5 Side (left) and top (right) views of the optimized geometries of theQD5@TiO2(101) (a–c) and QD5@TiO2(001) (d–f) nanocomposites studied.
PCCP Paper
Publ
ishe
d on
13
Janu
ary
2015
. Dow
nloa
ded
by H
ebre
w U
nive
rsity
of
Jeru
sale
m o
n 08
/02/
2015
14:
20:5
5.
View Article Online

Phys. Chem. Chem. Phys. This journal is© the Owner Societies 2015
upon complexation. It adopts a planar configuration, and theinner Pb atoms move towards the oxide surface driven byattractive O–Pb interactions (either electrostatic or orbital).Pb and O atoms are closer in the QD5(S-111)@TiO2(101) nano-composite (2.62 Å) than in the QD5(S-111)@TiO2(001) (2.90 Å),suggesting that the TiO2(101) surface indeed better accom-modates the QD. The S–Ti bonds are also shorter in theQD5(S-111)@TiO2(101) complex, even though in this case thedifference is rather subtle (2.55 vs. 2.57 Å). Consistent with thisfindings, the integrated Pb–O and S–Ti RDFs reveal a highercoordination between the QD5 and the TiO2(101) surface.
Electronic structure. Fig. 7 displays the DOS of the QD5(S-111)@TiO2(101) and QD5(S-111)@TiO2(001) systems.
Both models show a similar pattern. In brief, the VB of theQD5 isolated fragment, i.e., the high-lying occupied states ofthe QD, are located about 2.5 eV above the top of the VB of theTiO2 slab, whereas the unoccupied orbitals are ca. 0.3 eV higherin energy than the CB edge of the oxide substrate. This type ofstaggered alignment, where the unoccupied orbitals of the QD5are immersed in the manifold of the conduction states of theTiO2, favors the injection of the photoexcited electron from theQD5 to the oxide. Upon complexation, the QD and the TiO2 slabundergo a sizeable structural distortion, which affects theposition of their band edge states. In particular, the VB edgeof QD5 experiences an upward shift and its band-gap reducesby about 0.2–0.3 eV.
Table 1 Energy decomposition analysis of the QD5@TiO2(101) and QD5@TiO2(001) complexes, calculated at the D-PBE/SZ(Ti)DZ(H,O,Pb,S). Energieswritten in kcal mol�1. Values in parentheses give the percentage of each attractive term with respect to the sum of the attractive terms. Q(QD5), given inelectrons, indicates the charge developed by the PbS QD5 upon interaction, computed using the Hirshfeld scheme
QD5(Pb-111)@TiO2(101) QD5(S-111)@TiO2(101) QD5(100)@TiO2(101)
DEbond �85.2 �187.4 �71.9
DEprep 15.0 150.8 53.7QD5 5.9 80.3 34.1TiO2 9.1 70.5 19.6
DEint �100.2 �338.2 �125.6
DEPauli 200.0 722.1 265.5DEelst �142.5 (47%) �605.2 (57%) �204.3 (52%)DEoi �96.7 (32%) �342.9 (32%) �127.1 (32%)DEdisp 61.0 (20%) �112.2 (11%) �59.7 (15%)
Q(QD5) 0.0 0.2 �0.1
QD5(Pb-111)@TiO2(001) QD5(S-111)@TiO2(001) QD5(100)@TiO2(001)
DEbond �13.5 �112.5 �52.0
DEprep 5.1 128.0 16.7QD5 5.1 53.8 11.0TiO2 0.0 74.1 5.7
DEint �18.7 �240.5 �68.7
DEPauli 1.2 463.4 75.8DEelst �3.4 �379.1 �67.0DEoi �2.7 �223.4 �31.3DEdisp �13.7 �101.4 �46.3
Q(QD5) 0.0 0.1 �0.2
Fig. 6 O–Pb (top panel) and Ti–S (bottom panel) RDF (left axes) of theoptimized QD5(S-111)@TiO2(101) (black) and QD5(S-111)@TiO2(001) (red)nanocomposites, along with the corresponding integrated RDF (right axes).Geometries obtained at the D-PBE/SZ(Ti)DZ(H,O,Pb,S) level.
Paper PCCP
Publ
ishe
d on
13
Janu
ary
2015
. Dow
nloa
ded
by H
ebre
w U
nive
rsity
of
Jeru
sale
m o
n 08
/02/
2015
14:
20:5
5.
View Article Online

This journal is© the Owner Societies 2015 Phys. Chem. Chem. Phys.
The central panel of Fig. 7 depicts the DOS of the interactingcomplexes, along with the projection into the QD5 and the TiO2
clusters. The VB and the CB edges of the super-system belong tothe QD5 and the TiO2 slab, respectively. The PDOS essentiallyagrees with the DOS of the isolated fragments, with a smallupward shift of the CB edge of TiO2 and a downward shift(0.1 eV) of the VB edge of the (distorted) QD.
Finally, in the bottom panel of Fig. 7, we sketched the contri-bution of the interacting fragments to the super-complex MOs.The high-lying occupied MOs are (almost) pure QD states (redsticks). Deeper in the VB, a notable mixing between QD5 andTiO2 states is observed. The contribution of QD5 decreasesuntil �8.5 eV, where the MOs are finally localized on theTiO2 slab. The CB edge belongs mainly to the TiO2 moiety(blue sticks), but the QD5 states start to appear just abovethe edge. However, little hybridization between the TiO2 andthe QD states is observed. For example, the LUMO + 5 of thesuper-complex is fully localized on QD5. The orbital mixingbetween the nanocrystal and the oxide is crucial in definingthe kinetics of electron injection/recombination, as we willsee later.
Optical properties. TDDFT calculations have been performedto simulate the optical absorption of the QD5(S-111)@TiO2(101)model, as seen in Fig. 4 (bottom panel). Compared to the bareQD50 (i.e. QD5 at the geometry of the QD5–TiO2 complex), theabsorption band is red-shifted by ca. 0.3 eV (Fig. 9), in agreementwith the DOS presented in Fig. 7. Such a spectral displacement,already reported experimentally, has been previously attributedto the redistribution of the electronic density in the interactingcomplex.54 Note, however, that the absorption spectra of QD50 isalready red-shifted with respect to QD5, suggesting that thegeometrical distortion could also contribute to the experi-mental bathochromic shift. However, structural effects might
not be present in a larger QD, where the reorganization energyis negligible. Overall, the impact of the QD–TiO2 interaction onthe absorption spectrum of the QD is small, suggesting a weakcoupling between the QD and the TiO2 band edge states.
Electron injection and recombination. The main chargetransfer process in PbS QDSCs is the electron injection fromthe photoexcited QD to the CB of the metal oxide semiconductor(Fig. 8).
To shed light on this electron transfer process, we decided tosimulate the heterogeneous electron transfer from a single state,d, of the QD to a manifold of acceptor states, k, of the oxidesemiconductor. In the weak coupling limit, the rate constant canbe expressed according to the Fermi golden rule:
kd ¼2p�h
Xk
Vdkj j2r edð Þ (4)
where �h is the Planck’s constant, Vdk is the electronic couplingbetween donor and acceptor states, and r(ed) is the densityof states of the oxide substrate evaluated at the donor energy.This approximation is valid as long as the donor state is definedby a single electronic state. At low temperatures, Tisdale et al.showed the possibility of hot electron injections from high-lyingdonor states of PbS QDs.62,63 At room temperatures, however, theelectrons thermally relax to the band edge and inject from theLUMO state. Because PbS QDSCs operate at ambient conditions,we can assume that the donor state is indeed the LUMO of theQD. The electronic coupling elements Vdk have been computedby evaluating the off-diagonal elements of the super-systemHamiltonian H projected on the donor (PbS), jd, and acceptor(TiO2) states, jk, of the individual monomers:
hjd|H|jki (5)
Fig. 7 Top panel: DOS of the PbS QD5 (red) and the TiO2 (blue) modelscalculated at their equilibrium geometries (solid lines) and at the structurethey have in the interacting complex (dashed lines). Middle panel: DOS ofthe interacting complex, along with the projection into the QD5 and theTiO2 fragments. Bottom panel: molecular orbitals of the interacting complexwith contributions from the QD5 (red) and the TiO2 (blue) fragments.The height of the stick represents the % of the orbital localized in eachcorresponding fragment. Results are obtained at the B3LYP/LANL2DZ levelof theory.
Fig. 8 Scheme of the injection and recombination processes inQD5@TiO2(101) (left) and QD5@TiO2(001) (right). For each model, the DOSof the TiO2 states (blue, left) and the injection function Ginj(e) (red curve, right)are shown, along with the electronic couplings Vdk between the d donor stateand the manifold of the TiO2 k acceptor states (black sticks, right). For sake ofclarity, the Vdk elements have been reduced by a factor of 5. DG, calculated asthe energy difference between the TiO2 LUMO and the QD HOMO, representsthe driving force for the recombination process.
PCCP Paper
Publ
ishe
d on
13
Janu
ary
2015
. Dow
nloa
ded
by H
ebre
w U
nive
rsity
of
Jeru
sale
m o
n 08
/02/
2015
14:
20:5
5.
View Article Online

Phys. Chem. Chem. Phys. This journal is© the Owner Societies 2015
More details on the approach that we have followed can befound in the literature.64 The injection rate constant can bealternatively written as follows:
kd ¼Ginj edð Þ
�h(6)
where Ginj(ed) is the gamma (or injection) function, whichprovides a visual interpretation of the coupling between thedonor and acceptor states as a function of the energy. Evaluationof this term at the donor energy ed delivers the rate constant,as shown above in eqn (6). In Fig. 8, we depict the electroniccouplings between the QD LUMO and the manifold of TiO2
virtual states, along with the injection function G(e). In the energyrange considered, and irrespective of the oxide model, theinjection function displays two maxima. The first one appearsclose to the CB edge of the oxide, where the distribution of theunoccupied TiO2 states is denser. The second one is centered inthe region where the DOS decreases but the coupling of the QDLUMO with the oxide states is stronger.
In Table 2, we have summarized the kinetic parameters ofelectron injection. The LUMOs of the isolated QDs at the geometrythey have in the super-complexes are located at�3.13 and�3.15 eVfor the (101) and (001) TiO2 models, respectively. After interactingwith the slab, these energy levels are shifted slightly by 0.02 eV, withvalues of �3.15 and �3.17 eV, respectively. Although minimal,these new (site) energies will provide a better estimation of theinterfacial rate constant.
Comparing the two TiO2 models, the QD LUMO couples morefavorably with the oxide and exposes the (101) facet. This is inagreement with the stronger adsorption interaction of the QD5on the same surface. The computed injection rates are 1.3 and2.8 ps for the (101) and (001) oxide slabs, respectively. Thesevalues are in qualitative agreement with the recent experimentsby Plass and others that pinpoint to interfacial electron transferfrom PbS to TiO2 in the picosecond time scale.65
At this point, we can finally discuss the expected perfor-mance of PbS QDSCs depending on the exposed surface of theoxide slab. The injection efficiency is expressed as follows:
Zeff ¼kinj
kinj þ krec þ krad(7)
where kinj is the rate constant for electron injection, krec is therate of electron–hole recombination from the injected electronon the surface of TiO2 back to the hole (HOMO) left on thephotoexcited QD, and krad is the rate constant for radiativeemission. The latter occurs in the ns time scale, considerablylonger than the time scale of injection and recombination, andtherefore it can be safely neglected in the abovementionedexpression. The rate of recombination from a manifold of statesk (i.e. the TiO2 oxide) to a single acceptor state d (the HOMO ofthe PbS QD) can be computed as follows:
krec ¼2p�h
Xk
f EF; ekð Þ � Vdkj j2�r edð Þ � FC l;DG; ekð Þ (8)
where f (EF,ek) refers to the Fermi–Dirac distribution, whichdescribes the probability of a given TiO2 state lying above thequasi-Fermi level (EF) to be occupied, and FC is the Franck–Condon term that in the high temperature limit and harmonicnuclear modes assumes the following form:
FC l;DG; ekð Þ ¼ 1ffiffiffiffiffiffiffiffiffiffiffiffiffiffiffiffiffi4plkBTp exp
� ek þ DGþ lð Þ2
4lkBT
" #(9)
where l is the reorganization energy, T is the temperature, kB isthe Boltzmann constant and DG is the energy difference betweenthe donor state k and the acceptor state d. To obtain a qualitativeestimate of the krec, we made some assumptions because someof the variables that are present in these expressions criticallydepend on the experimental conditions.
(a) The quasi-Fermi level in TiO2 lies below the CB, but theactual position is unknown and depends on several factors suchas the pH of the solution, the electrolyte concentration, and thedensity of trap states that are on the surface of the oxide. Forsimplicity and because we would like to provide a qualitativeupper limit to the kinetic of charge recombination, we assumethat the electron is injected from the CB edge of the TiO2 (i.e.the LUMO). The krec is then expressed simply by the Marcusformula:
krec ¼2p�h
Vdkj j2 1ffiffiffiffiffiffiffiffiffiffiffiffiffiffiffiffiffi4plkBTp exp
�ðDGþ lÞ2
4lkBT
" #
¼ Grec
�h� FCðl;DGÞ
(10)
(b) The reorganization energy is the energy required by donorand acceptor (and the solvent that surrounds them) to rearrangetheir geometries upon electron transfer. Usually, this value canbe estimated from calculations; however, the cluster models ofthe QDs in this work are rather small and present strongquantum confinement effects. These QDs lead to unrealisticallylarge reorganization energies (40.5 eV) that experimentallyare estimated to be around 0.1 eV or even smaller.63 Therefore,
Table 2 Parameters of the injection and recombination processes inQD5@TiO2(101) and QD5@TiO2(001): adiabatic and diabatic (site) energiesof the frontier orbitals (E and Esite, in eV); injection and recombinationfunctions (Ginj and Grec, in eV); injection and recombination rate constants(kinj and krec, in s�1), injection and recombination rates (tinj and trec, in fs);Franck–Condon factors for the recombination process (FC); and electroninjection efficiencies (Zeff, in %). All recombination parameters are calcu-lated at DG = 0.2 and l = 0.1 eV
QD5@TiO2(101) QD5@TiO2(001)
E(HOMO TiO2) �6.85 �7.29E(LUMO TiO2) �3.47 �3.54Esite(HOMO PbS) �5.52 �5.56Esite(LUMO PbS) �3.15 �3.17
Ginj(Esite(LUMO PbS)) 4.90 � 10�4 2.36 � 10�4
kinj (s�1) 7.44 � 1011 3.59 � 1011
tinj (fs) 1343 2789
Grec 2.02 � 10�2 1.44 � 10�4
FC(DG = 0.2; l = 0.1) 2.10 2.10krec (s�1) 6.45 � 1013 4.59 � 1011
trec (fs) 16 2178
Zeff 1 44
Paper PCCP
Publ
ishe
d on
13
Janu
ary
2015
. Dow
nloa
ded
by H
ebre
w U
nive
rsity
of
Jeru
sale
m o
n 08
/02/
2015
14:
20:5
5.
View Article Online

This journal is© the Owner Societies 2015 Phys. Chem. Chem. Phys.
we decided to vary this term parametrically between 0.01 and0.50 eV and look at its effect on the injection efficiency.
(c) DG is the energy difference between the donor state k andthe acceptor state d. Just considering the simple energy differenceLUMO(TiO2)–HOMO(PbS), the DG is about 1.4 eV, which is con-siderably larger than the reorganization energy. According to theMarcus theory, the kinetics of electron transfer would then fall inthe inverted regime and the electron–hole recombination would bevirtually forbidden. In reality, TiO2 presents defect states that couldpromote the back electron transfer to the QD by decreasing theenergy gap with the sensitizer HOMO. This justification hasalready been proposed to explain the fast recombination rates inDSSCs, which would otherwise be unaccountable. The situation iseven more involved for QD sensitizers because they also developlocalized states on their surface, which could act as traps for thephoto-generated holes. For simplicity, we employ non-defectiveclusters to reproduce both the sensitizer and the oxide substrate.However, to model the role of the surface effects on the recombi-nation mechanism, we decided to tune the DG term parametricallyand see how this would affect the electron injection efficiency.
Regarding points (b) and (c) above, we must point out thatboth TiO2 slabs present practically the same DOS for the metaloxide and the same structure and energetics of the QD absorbedon the surface. This leads to same DG and l values for both oxidesurfaces, and thus the same FC factors. This is important becausethe difference between the rates of recombination with the (101)and (001) slabs lie only on the electronic coupling, or Grec, whichwe can evaluate directly from the calculations.
In Fig. 9, we present the electron injection efficiency computedwith formula (7), by changing parametrically krec(l,DG). As it isimmediately clear, in general, the injection efficiency increaseswith DG because for DG 4 l, the recombination process enters inthe inverted Marcus region, and it is therefore slowed down.l = 0.5 eV represents an exception to the rule, but as stated earlier,experimental reorganization energies lie considerably below sucha large value. Importantly, and irrespective of l, the (001) facetdelivers higher injection efficiencies. The inspection of Table 2provides more details on why (001) is more efficient. The injection
rate kinj from the PbS to the (101) facets is about twice as large asthe (001) because of a larger Ginj. At the same time, the recombi-nation rate krec from the (101) is about 100 times faster, as aconsequence of a very efficient electronic coupling of the LUMO ofTiO2(101) with the HOMO of the QD. Therefore, the gain obtainedby injecting the photoexcited electron faster in (101) is inhibitedby a very fast electron–hole recombination, which drasticallyreduces the overall efficiency. On the other hand, the (001) slabslowly injects the electrons but the less favorable couplingfor the electron recombination provides overall larger injectionefficiencies.
Future perspectives and conclusion
In this work, we provide atomistic simulations based on DFT toexplain the physico-chemical processes occurring at the inter-face between PbS QDs and oxide semiconductors of differentmorphologies. We show that a bare QD model injects photo-excited electrons more efficiently into the TiO2 slabs exposing(001) facets. This result is in qualitative agreement with theexperimental measurement carried out by Etgar et al. However, wemust warn that this agreement might be unintentional becausethe PbS QDs employed in the experiments are linked to thesurface of the oxide nanoparticles with mercaptopropionic acidligands that are not included in our model. The effect of theseligands on different surfaces is unpredictable at this time andmight be crucial for a correct interpretation of the experimentaldata. We are currently working to address this issue.
On the other hand, our model could be used as a litmus testto analyze the effect of QDs directly grown on the oxide inter-face, as it is done in the SILAR process.25 Here, the QD directlyis synthesized on the surface with a layer-by-layer depositionand without the help of linkers. Because our model shows abetter adsorption from the side of sulfur atoms, we expect thatour calculations could provide reasonable results in the case thatthe nucleation of the QD begins by dipping the TiO2 nano-particles in a solution of sulfur precursors.
Acknowledgements
This research was funded by Eusko Jaurlaritza/Basque Govern-ment (IT588-13 and S-PC12UN003) and the Spanish Office forScientific Research (CTQ2012-38496-C05-01). The SGI/IZO-SGIkerUPV/EHU is gratefully acknowledged for the generous alloca-tion of computational resources. JMA would like to thank theSpanish Ministry of Education for funding through a FPUfellowship (AP2009-1514). FDA thanks FP7-ENERGY-2010 pro-ject ‘‘ESCORT’’(261920) and CNR-EFOR for financial support.
Notes and references
1 B. O’Regan and M. Gratzel, Nature, 1991, 353, 737–740.2 M. Pastore, S. Fantacci and F. De Angelis, J. Phys. Chem. C,
2013, 117, 3685–3700.3 A. P. Alivisatos, J. Phys. Chem., 1996, 100, 13226–13239.
Fig. 9 Electron injection efficiency for the QD5@TiO2(101) (solid curves)and QD5@TiO2(001) (dashed curve) as a function of DG, calculated forvarious l.
PCCP Paper
Publ
ishe
d on
13
Janu
ary
2015
. Dow
nloa
ded
by H
ebre
w U
nive
rsity
of
Jeru
sale
m o
n 08
/02/
2015
14:
20:5
5.
View Article Online

Phys. Chem. Chem. Phys. This journal is© the Owner Societies 2015
4 A. P. Alivisatos, Science, 1996, 271, 933–937.5 W. Shockley and H. J. Queisser, J. Appl. Phys., 1961, 32,
510–519.6 R. Reiche, R. Thielsch, S. Oswald and K. Wetzig, J. Electron
Spectrosc. Relat. Phenom., 1999, 104, 131–149.7 Z. Zeng, S. Wang and S. Yang, Chem. Mater., 1999, 11,
3365–3369.8 K. K. Nanda and S. N. Sahu, Adv. Mater., 2001, 13, 280–283.9 M. Kowshik, W. Vogel, J. Urban, S. K. Kulkarni and
K. M. Paknikar, Adv. Mater., 2002, 14, 815–818.10 Y. Zhou, H. Itoh, T. Uemura, K. Naka and Y. Chujo, Langmuir,
2002, 18, 5287–5292.11 S. Wu, H. Zeng and Z. A. Schelly, Langmuir, 2005, 21,
686–691.12 L. Etgar, J. Park, C. Barolo, M. K. Nazeeruddin, G. Viscardi and
M. Graetzel, ACS Appl. Mater. Interfaces, 2011, 3, 3264–3267.13 L. Etgar, W. Zhang, S. Gabriel, S. G. Hickey, M. K. Nazeeruddin,
A. Eychmuller, B. Liu and M. Gratzel, Adv. Mater., 2012, 24,2202–2206.
14 L. Etgar, T. Moehl, S. Gabriel, S. G. Hickey, A. Eychmullerand M. Gratzel, ACS Nano, 2012, 6, 3092–3099.
15 J.-W. Lee, D.-Y. Son, T. K. Ahn, H.-W. Shin, I. Y. Kim, S.-J.Hwang, M. J. Ko, S. Sul, H. Han and N.-G. Park, Sci. Rep.,2013, 3, 1050.
16 C.-H. M. Chuang, P. R. Brown, V. Bulovic and M. G. Bawendi,Nat. Mater., 2014, 13, 796–801.
17 A. Yella, H.-W. Lee, H. N. Tsao, C. Yi, A. K. Chandiran,M. K. Nazeeruddin, E. W.-G. Diau, C.-Y. Yeh, S. M. Zakeeruddinand M. Gratzel, Science, 2011, 334, 629–634.
18 H. Zhou, Q. Chen, G. Li, S. Luo, T.-b. Song, H.-S. Duan,Z. Hong, J. You, Y. Liu and Y. Yang, Science, 2014, 345,542–546.
19 O. Voznyy, S. M. Thon, A. H. Ip and E. H. Sargent, J. Phys.Chem. Lett., 2013, 4, 987–992.
20 O. Voznyy, D. Zhitomirsky, P. Stadler, Z. Ning, S. Hooglandand E. H. Sargent, ACS Nano, 2012, 6, 8448–8455.
21 I. Hod, V. Gonz, Z. Tachan, F. Fabregat-santiago, J. Bisquertand A. Zaban, J. Phys. Chem. Lett., 2011, 2, 3032–3035.
22 I. Mora-Sero, D. Gross, T. Mittereder, A. a. Lutich,A. S. Susha, T. Dittrich, A. Belaidi, R. Caballero, F. Langa,J. Bisquert and A. L. Rogach, Small, 2010, 6, 221–225.
23 H. Choi, M. Kuno, G. V. Hartland and P. V. Kamat, J. Mater.Chem. A, 2013, 1, 5487–5491.
24 M. Planells, L. X. Reynolds, U. Bansode, S. Chhatre, S. Ogale,N. Robertson and S. A. Haque, Phys. Chem. Chem. Phys.,2013, 15, 7679–7684.
25 H. Lee, H. C. Leventis, S.-J. Moon, P. Chen, S. Ito, S. A.Haque, T. Torres, F. Nuesch, T. Geiger, S. M. Zakeeruddin,M. Gratzel and M. K. Nazeeruddin, Adv. Funct. Mater., 2009,19, 2735–2742.
26 R. Long and O. V. Prezhdo, J. Am. Chem. Soc., 2011, 133,19240–19249.
27 D. N. Tafen, R. Long and O. V. Prezhdo, Nano Lett., 2014, 14,1790–1796.
28 J. He, C. Liu, F. Li, R. Sa and K. Wu, Chem. Phys. Lett., 2008,457, 163–168.
29 P. Koirala, B. Kiran, A. K. Kandalam, C. A. Fancher, H. L.de Clercq, X. Li and K. H. Bowen, J. Chem. Phys., 2011,135, 134311.
30 H. Zeng, Z. A. Schelly, K. Ueno-Noto and D. S. Marynick,J. Phys. Chem. A, 2005, 109, 1616–1620.
31 S. V. Kilina, C. F. Craig, D. S. Kilin and O. V. Prezhdo, J. Phys.Chem. C, 2007, 111, 4871–4878.
32 A. Franceschetti, Phys. Rev. B: Condens. Matter Mater. Phys.,2008, 78, 075418.
33 S. V. Kilina, D. S. Kilin and O. V. Prezhdo, ACS Nano, 2009, 3,93–99.
34 S. Grimme, J. Antony, S. Ehrlich and H. Krieg, J. Chem. Phys.,2010, 132, 154104.
35 J. P. Perdew, K. Burke and M. Ernzerhof, Phys. Rev. Lett.,1996, 77, 3865–3868.
36 G. te Velde, F. M. Bickelhaupt, E. J. Baerends, C. F. Guerra,S. J. A. van Gisbergen, J. G. Snijders and T. Ziegler, J. Comput.Chem., 2001, 22, 931–967.
37 E. van Lenthe, A. Ehlers and E.-J. Baerends, J. Chem. Phys.,1999, 110, 8943–8953.
38 F. De Angelis and L. Armelao, Phys. Chem. Chem. Phys.,2011, 13, 467–475.
39 J. M. Azpiroz, E. Mosconi and F. D. Angelis, J. Phys. Chem. C,2011, 115, 25219–25226.
40 J. M. Azpiroz, X. Lopez, J. M. Ugalde and I. Infante, J. Phys.Chem. C, 2012, 116, 2740–2750.
41 J. M. Azpiroz, J. M. Ugalde and I. Infante, J. Chem. TheoryComput., 2014, 10, 76–89.
42 A. D. Becke, J. Chem. Phys., 1993, 98, 1372–1377.43 M. J. Frisch, G. W. Trucks, H. B. Schlegel, G. E. Scuseria,
M. A. Robb, J. R. Cheeseman, G. Scalmani, V. Barone,B. Mennucci, G. A. Petersson, H. Nakatsuji, M. Caricato,X. Li, H. P. Hratchian, A. F. Izmaylov, J. Bloino, G. Zheng,J. L. Sonnenberg, M. Hada, M. Ehara, K. Toyota, R. Fukuda,J. Hasegawa, M. Ishida, T. Nakajima, Y. Honda, O. Kitao,H. Nakai, T. Vreven, J. A. Montgomery Jr., J. E. Peralta,F. Ogliaro, M. Bearpark, J. J. Heyd, E. Brothers, K. N. Kudin,V. N. Staroverov, R. Kobayashi, J. Normand, K. Raghavachari,A. Rendell, J. C. Burant, S. S. Iyengar, J. Tomasi, M. Cossi,N. Rega, J. M. Millam, M. Klene, J. E. Knox, J. B. Cross,V. Bakken, C. Adamo, J. Jaramillo, R. Gomperts, R. E.Stratmann, O. Yazyev, A. J. Austin, R. Cammi, C. Pomelli,J. W. Ochterski, R. L. Martin, K. Morokuma, V. G. Zakrzewski,G. A. Voth, P. Salvador, J. J. Dannenberg, S. Dapprich, A. D.Daniels, O. Farkas, J. B. Foresman, J. V. Ortiz, J. Cioslowski andD. J. Fox, Gaussian 09 Revision B.01, 2009.
44 M. Cossi and V. Barone, J. Phys. Chem. A, 2000, 104,10614–10622.
45 M. Cossi and V. Barone, J. Chem. Phys., 2001, 115,4708–4717.
46 M. Cossi, N. Rega, G. Scalmani and V. Barone, J. Comput.Chem., 2003, 24, 669–681.
47 W. Humphrey, A. Dalke and K. Schulten, J. Mol. Graphics,1996, 14, 33–38.
48 N. M. O’Boyle, A. L. Tenderholt and K. M. Langner,J. Comput. Chem., 2007, 29, 839–845.
Paper PCCP
Publ
ishe
d on
13
Janu
ary
2015
. Dow
nloa
ded
by H
ebre
w U
nive
rsity
of
Jeru
sale
m o
n 08
/02/
2015
14:
20:5
5.
View Article Online

This journal is© the Owner Societies 2015 Phys. Chem. Chem. Phys.
49 C. R. A. Catlow, S. T. Bromley, S. Hamad, M. Mora-Fonz,A. A. Sokol and S. M. Woodley, Phys. Chem. Chem. Phys.,2010, 12, 786–811.
50 J. M. Azpiroz, J. M. Matxain, I. Infante, X. Lopez and J. M.Ugalde, Phys. Chem. Chem. Phys., 2013, 15, 10996–11005.
51 J. M. Azpiroz, E. Mosconi, J. M. Ugalde and F. D. Angelis,J. Phys. Chem. C, 2014, 118, 3274–3284.
52 J. M. Azpiroz, I. Infante, X. Lopez, J. M. Ugalde andF. De Angelis, J. Mater. Chem., 2012, 22, 21453–21465.
53 C. S. S. Sandeep, J. M. Azpiroz, W. H. Evers, S. C. Boehme,I. Moreels, S. Kinge, L. D. A. Siebbeles, I. Infante andA. J. Houtepen, ACS Nano, 2014, 8, 11499–11511.
54 B.-r. Hyun, Y.-w. Zhong, A. C. Bartnik, L. Sun, H. D. Abrun,F. W. Wise, J. D. Goodreau, J. R. Matthews, T. M. Leslie andN. F. Borrelli, ACS Nano, 2008, 2, 2206–2212.
55 A. H. Khan, U. Thupakula, A. Dalui, S. Maji, A. Debangshiand S. Acharya, J. Phys. Chem. C, 2013, 117, 7934–7939.
56 M. Khoudiakov, A. R. Parise and B. S. Brunschwig, J. Am.Chem. Soc., 2003, 125, 4637–4642.
57 Y.-X. Weng, Y.-Q. Wang, J. B. Asbury, H. N. Ghosh andT. Lian, J. Phys. Chem. B, 2000, 104, 93–104.
58 T. Ziegler and A. Rauk, Theor. Chim. Acta, 1977, 46, 1–10.59 T. Ziegler and A. Rauk, Inorg. Chem., 1979, 18, 1558–1565.60 T. Ziegler and A. Rauk, Inorg. Chem., 1979, 18, 1755–1759.61 K. Kitaura and K. Morokuma, Int. J. Quantum Chem., 1976,
10, 325–340.62 W. A. Tisdale, K. J. Williams, B. A. Timp, D. J. Norris,
E. S. Aydil and X.-Y. Zhu, Science, 2010, 328, 1543–1547.63 W. A. Tisdale and X.-Y. Zhu, Proc. Natl. Acad. Sci. U. S. A.,
2011, 108, 965–970.64 E. Ronca, G. Marotta, M. Pastore and F. De Angelis, J. Phys.
Chem. C, 2014, 118, 16927–16940.65 R. Plass, S. Pelet, J. Krueger and M. Gra, J. Phys. Chem. B,
2002, 106, 7578–7580.
PCCP Paper
Publ
ishe
d on
13
Janu
ary
2015
. Dow
nloa
ded
by H
ebre
w U
nive
rsity
of
Jeru
sale
m o
n 08
/02/
2015
14:
20:5
5.
View Article Online